World Energy Outlook 2011 - International Energy Agency
666
2 0 1 1 WORLD ENERGY OUTLOOK Please note that this PDF is subject to specific restrictions that limit its use and distribution. The terms and conditions are available online at www.iea.org/Textbase/about /copyright.asp
Transcript of World Energy Outlook 2011 - International Energy Agency

2011
WORLDENERGY
OUTLOOK
Please note that this PDF is subject to specific restrictions that limit its use and distribution.
The terms and conditions are available online at www.iea.org/Textbase/about/copyright.asp

World Energy Outlook 2011 brings together the latest data, policy developments, and the experience of another year to provide robust analysis and insight into global energy markets, today and for the next 25 years. This edition of the IEA’s flagship WEO publication gives the latest energy demand and supply projections for different future scenarios, broken down by country, fuel and sector. It also gives special focus to such topical energy sector issues as:
� Russia’s energy prospects and their implications for global markets.
� The role of coal in driving economic growth in an emissions-constrained world.
� The implications of a possible delay in oil and gas sector investment in the Middle East and North Africa.
� How high-carbon infrastructure “lock-in” is making the 2°C climate change goal more challenging and expensive to meet.
� The scale of fossil fuel subsidies and support for renewable energy and their impact on energy, economic and environmental trends.
� A “Low Nuclear Case” to investigate what a rapid slowdown in the use of nuclear power would mean for the global energy landscape.
� The scale and type of investment needed to provide modern energy to the billions of the world’s poor that do not have it.
€150 (61 2011 24 1P1)ISBN: 978 92 64 12413 4
WORLD ENERGY OUTLOOK
2 0 1 1
www.worldenergyoutlook.org

2011
WORLDENERGY
OUTLOOK

INTERNATIONAL ENERGY AGENCY
The International Energy Agency (IEA), an autonomous agency, was established in November 1974.Its primary mandate was – and is – two-fold: to promote energy security amongst its membercountries through collective response to physical disruptions in oil supply, and provide authoritativeresearch and analysis on ways to ensure reliable, affordable and clean energy for its 28 membercountries and beyond. The IEA carries out a comprehensive programmeof energy co-operation amongitsmember countries, each ofwhich is obliged to hold oil stocks equivalent to 90 days of its net imports.The Agency’s aims include the following objectives:
! Secure member countries’ access to reliable and ample supplies of all forms of energy; in particular,through maintaining effective emergency response capabilities in case of oil supply disruptions.
! Promote sustainable energy policies that spur economic growth and environmental protectionin a global context – particularly in terms of reducing greenhouse-gas emissions that contributeto climate change.
! Improve transparency of international markets through collection and analysis ofenergy data.
! Support global collaboration on energy technology to secure future energy suppliesand mitigate their environmental impact, including through improved energy
efficiency and development and deployment of low-carbon technologies.
! Find solutions to global energy challenges through engagement anddialogue with non-member countries, industry, international
organisations and other stakeholders.IEA member countries:
AustraliaAustria
BelgiumCanada
Czech RepublicDenmark
FinlandFrance
GermanyGreece
HungaryIreland
ItalyJapanKorea (Republic of)LuxembourgNetherlandsNew ZealandNorwayPolandPortugalSlovak RepublicSpainSwedenSwitzerlandTurkeyUnited KingdomUnited States
The European Commissionalso participates inthe work of the IEA.
Please note that this publicationis subject to specific restrictionsthat limit its use and distribution.
The terms and conditions are availableonline at www.iea.org/about/copyright.asp
© OECD/IEA, 2011International Energy Agency
9 rue de la Fédération75739 Paris Cedex 15, France
www.iea.org
Foreword 3
FOREWORD
It is the job of governments to take the decisions that will deliver a secure and sustainableenergy future. They can make wise decisions only if they are well-informed and advised.That is the job of bodies such as the International Energy Agency (IEA), which it has beenmyprivilege to lead since September 2011.
The World Energy Outlook (WEO) team, under the Agency’s Chief Economist, Fatih Birol,has again done an outstanding job inWEO-2011 to underpin sound energy decisionmaking.With the invaluable help of many global experts inside and outside the Agency, the teamhas given us awealth of current energy information, analysis and perspectives on the future.
For example, we find:
! what it will cost to bring modern energy to every citizen of the world by 2030 and howto finance it;
! that, provided governments honour their existing intentions, renewable energy is set toprovide half the new power generating capacity required between now and 2035;
! that, by virtue of their size and distribution, natural gas resources contributeencouragingly to future energy security, casting a golden glow over the outlook fornatural gas;
! how oil markets will be shaped by increasing demand for mobility and rising upstreamcosts – and the consequences of any shortfall of investment in the Middle East andNorth Africa;
! what would have to be done (and whether that is realistic) if the nuclear componentof future energy supply were to be halved, or if the availability of carbon capture andstorage technology slipped by ten years;
! the extent of the overwhelming dominance of China in global energy in 25 years time andthe global significance of the choices China makes to meet its needs; and
! how much energy Russia can save simply by matching the energy efficiency standardsof OECD countries and how that would serve both Russia’s national objectives and theinterests of global energy supply.
As a former minister, my background is that of a politician. My mission at the IEA is tobridge the divide between analysts and politicians so that the right energy policy decisionsare made by governments across the world, both members and non-members of the IEAalike. The Agency will not aspire to determine those decisions which lie outside its area ofexecutive responsibility for itsmembers’ energy security. But I will push the remit to identifythe decisionswhich others need, orwhichwould bewise, to adopt. TheWEO is an invaluabletool to this end.
© O
EC
D/IE
A, 2
011
4 World Energy Outlook 2011
The starkest decisions are those which must be taken without delay. I end by highlightingone area squarely in this category: the energy decisions necessary to contain the rise inthe average global temperature to 2° Celsius. We read here of the way carbon emissionsare already “locked-in” because of the nature of the plant and equipment which wecontinue to build. If we do not change course, by 2015 over 90% of the permissible energysector emissions to 2035 will already be locked in. By 2017, 100%. We can still act in timeto preserve a plausible path to a sustainable energy future; but each year the necessarymeasures get progressively tougher and viciously more expensive. So, let’s not wait anylonger!
Maria van der HoevenExecutive Director
This publication has been produced under the authority of the Executive Director of theInternational Energy Agency. The views expressed do not necessarily reflect the views orpolicies of individual IEA member countries
© O
EC
D/IE
A, 2
011

Foreword 5Acknowledgements
ACKNOWLEDGEMENTS
This study was prepared by the Office of the Chief Economist (OCE) of the InternationalEnergy Agency in co-operation with other offices of the Agency. It was designed anddirected by Fatih Birol, Chief Economist of the IEA. Laura Cozzi co-ordinated the analysisof climate policy and modelling; Amos Bromhead co-ordinated the analysis of subsidiesand nuclear; John Corben co-ordinated the analysis of oil and natural gas; Marco Baronico-ordinated the power-generation analysis; Tim Gould co-ordinated the Russia analysis;Paweł Olejarnik co-ordinated the coal analysis; Dan Dorner contributed to the analysis ofglobal trends and co-ordinated the focus on energy access. Other colleagues in the Office ofthe Chief Economist contributed tomultiple aspects of the analysis andwere instrumental indelivering the study: Prasoon Agarwal (transport and buildings),Maria Argiri (natural gas),Christian Besson (oil and Russia), Alessandro Blasi (Russia), Raffaella Centurelli (energyaccess and buildings), Michel D’Ausilio (power and renewables), Dafydd Elis (power andclimate analysis), Matthew Frank (natural gas and subsidies), Timur Gül (transport andclimate analysis), Shinichi Kihara (nuclear), Kate Kumaria (climate analysis), Jung Woo Lee(subsidies and nuclear), Katrin Schaber (power and renewables), Tatsuya Tomie (coal andpower), Timur Topalgoekceli (oil and natural gas), Brent Wanner (power and subsidies),David Wilkinson (power, climate analysis and nuclear), Peter Wood (oil and natural gas),Akira Yanagisawa (subsidies, industry and natural gas) and Tatiana Zhitenko (Russia).SandraMooney provided essential support.
Robert Priddle carried editorial responsibility.
The study benefitted from input provided by numerous IEA experts in the Energy StatisticsDivision, the Energy Markets and Security Directorate, the Directorate of Global EnergyDialogue, and the Energy Policy and Technology Directorate. The Communication andInformation Office was instrumental in bringing the book to completion. In particular,Christina Hood, Carlos Fernandez Alvarez, Isabel Murray, Moritz Paulus, Johannes Truby,Nathalie Trudeau and Dennis Volk provided valuable contributions. Experts from severaldirectorates of the OECD and the Nuclear Energy Agency also contributed to the report,particularly Ron Cameron, Rob Dellink, Bertrand Magné, Helen Mountford, Ron Steenblikand Robert Vance. Thanks also go to Debra Justus for proofreading the text.
Ian Cronshaw and Trevor Morgan provided valuable input to the analysis. The followingexperts also contributed: Igor Bashmakov, Jan-Hein Jesse, TatianaMitrova and Liu Qiang.
The work could not have been achieved without the substantial support and co-operationprovided by many government bodies, international organisations and energy companiesworldwide, notably:
The Department of Energy and Climate Change, United Kingdom; Department of State,United States; Edison; Electric Power Development Co. Ltd, Japan; Enel; Energy ForecastingAgency (APBE), Russia; Energy Studies Institute, Singapore; Eni; Foreign and CommonwealthOffice, United Kingdom; Fortum Corporation; IEA Coal Industry Advisory Board (CIAB);
© O
EC
D/IE
A, 2
011

6 World Energy Outlook 2011
Institute of Energy Economics at the University of Cologne, Germany; International Institutefor Applied Systems Analysis, Austria; Intergovernmental Panel on Climate Change (IPCC);Ministère de l’écologie, du développement durable, des transports et du logement, France;Ministry of Economic Affairs, The Netherlands; Ministry of Energy, Russian Federation;Ministry of Petroleumand Energy, Norway; NorwegianAgency for Development Cooperation(NORAD); RoyalMinistry of Foreign Affairs, Norway; Peabody Energy;Ministry of KnowledgeEconomy, Korea; Japan Gas Association, Japan; Schlumberger; Shell; Shenhua Group; Statoil;ToyotaMotor Corporation; UnitedNations Development Programme (UNDP) and theUnitedNations Industrial Development Organization (UNIDO).
Many international experts provided input, commented on the underlying analytical workand reviewed early drafts of each chapter. Their comments and suggestions were of greatvalue. They include:
Saleh Abdurrahman National Energy Council of Indonesia
Ali Aissaoui APICORP
Marco Arcelli Enel
Gabriela Elizondo Azuela World Bank
Pepukaye Bardouille International Finance Corporation, United States
Andrew Barfour Institution of Engineers, Ghana
Andrew Barnett The Policy Practice, United Kingdom
Yuriy Baron Ministry of Energy, Russian Federation
Paul Baruya IEA Clean Coal Centre, United Kingdom
Igor Bashmakov Centre for Energy Efficiency, Russian Federation
Nicolas Bauer Potsdam Institute for Climate Impact Research, Germany
Georg Bäuml Volkswagen
Johannes Baur European Commission
Nazim Bayraktar EnergyMarket Regulatory Agency, EPDK, Turkey
Chris Beaton International Institute for Sustainable Development,Switzerland
Carmen Becerril Acciona Energia
Rachid Bencherif OPEC Fund for International Development
Kamel Bennaceur Schlumberger
Bruno Bensasson GDF Suez
Mikul Bhatia World Bank
Sankar Bhattacharya Monash University, Australia
© O
EC
D/IE
A, 2
011

7Acknowledgements
Alexey Biteryakov GazpromExport
Roberto Bocca World Economic Forum
Jean-Paul Bouttes EdF
Albert Bressand Columbia School of International and Public Affairs,United States
Nigel Bruce World Health Organization, Switzerland
Peter Brun Vestas
Michael Buffier Xstrata Coal
David Cachot Trafigura Beheer B.V.
Guy Caruso Center for Strategic and International Studies,United States
Milton Catelin World Coal Association
Sharat Chand The Energy and Resources Institute, India
Chris Charles International Institute for Sustainable Development,Switzerland
Hela Cheikhrouhou African Development Bank
Elisabeth Clemens Norwegian Agency for Development Cooperation
Ben Clements International Monetary Fund
Janusz Cofala International Institute for Applied SystemsAnalysis, Austria
Dean Cooper United Nations Environment Programme
Alan Copeland Bureau of Resources and Energy Economics, Australia
Hans Daniels Alpha Natural Resources, United States
Christian De Gromard Agence Française de Developpement
Michel Deelen Ministry of Foreign Affairs, The Netherlands
Jos Delbeke European Commission
Carmine Difiglio Department of Energy, United States
Mark Dominik
Gina Downes Eskom
Józef Dubinski Central Mining Institute, Poland
Mohamed El-Ashry UN Foundation
Kari Espegren Institute for Energy Technology, Norway
© O
EC
D/IE
A, 2
011

8 World Energy Outlook 2011
Donald Ewart Marston
Vladimir Feygin Institute of Energy and Finance, Russian Federation
Christiana Figueres UN Framework Convention on Climate Change
Peter Fraser Ontario Energy Board, Canada
Irene Freudenschuss-Reichl Ambassador, Austria
Hari Kumar Gadde World Bank
Dario Garofalo Enel
Francesco Gattei Eni
Dolf Gielen International Renewable Energy Agency
Duleep Gopalakrishnan ICF International
Rainer Görgen Federal Ministry of Economics and Technology, Germany
Michael Grubb University of Cambridge, United Kingdom
Howard Gruenspecht Energy Information Administration, United States
Antoine Halff Department of Energy, United States
Ian Hall Anglo American
Wenke Han Energy Research Institute, China
Brian Heath Coal Industry Advisory Board, International EnergyAgency
Sigurd Heiberg Statoil
James Henderson Oxford Institute for Energy Studies, United Kingdom
Antonio Hernández Garcia Ministry of Industry, Tourism and Trade, Spain
James Hewlett Department of Energy, United States
Masazumi Hirono The Japan Gas Association
Neil Hirst Grantham Institute on Climate Change, United Kingdom
Takashi Hongo Japan Bank for International Cooperation
Trevor Houser Peterson Institute for International Economics
Tom Howes European Commission
Steve Hulton WoodMackenzie
Esa Hyvärinen Fortum Corporation
Catherine Inglehearn Foreign and Commonwealth Office, United Kingdom
Fumiaki Ishida New Energy and Industrial Technology DevelopmentOrganization, Japan
© O
EC
D/IE
A, 2
011

9Acknowledgements
James Jensen Jensen Associates
Jan-Hein Jesse JOSCO Energy Finance & Strategy Advisors
Marianne Kah ConocoPhillips
Bob Kamandanu Indonesian Coal Mining Association
Shaanti Kapila Asian Development Bank
Ryan Katofsky Navigant Consulting
Marlin Kees GIZ, Germany
Hisham Khatib Honorary Vice Chairman, World Energy Council;and formerMinister of Energy, Jordan
Lucy Kitson International Institute for Sustainable Development,Switzerland
Mikhail Klubnichkin PricewaterhouseCoopers Russia B.V.
David Knapp Energy Intelligence
Oliver Knight World Bank
Kenji Kobayashi Asia Pacific Energy Research Centre, Japan
Masami Kojima World Bank
Hans-Jorgen Koch Ministry of Transportation and Energy, Denmark
Doug Koplow Earth Track, Inc.
Ken Koyama The Institute of Energy Economics, Japan
Igor Kozhukovsky Energy Forecasting Agency, Russian Federation
Natalia Kulichenko-Lotz World Bank
Rakesh Kumar PTC India
Takayuki Kusajima ToyotaMotor Corporation
Sarah Ladislaw Center for Strategic and International Studies, United States
Georgette Lalis European Commission
Kerryn Lang International Institute for Sustainable Development,Switzerland
Richard Lavergne Ministry of Economy, Finance and Industry, France
Rima Le Gocuic Agence Française de Developpement
Man-ki Lee Korea Atomic Energy Research Institute
Christian Lelong BHP Billiton Energy Coal
© O
EC
D/IE
A, 2
011
10 World Energy Outlook 2011
Steve Lennon Eskom
Michael Liebreich Bloomberg New Energy Finance
Qiang Liu Energy Research Institute, China
Massimo Lombardini European Commission
Philip Lowe European Commission
Matthew Lynch World Business Council for Sustainable Development,Switzerland
JoanMacNaughton Alstom Power Systems
TeresaMalyshev UNDP
ClaudeMandil Former IEA Executive Director
SamanthaMcCulloch Australian Coal Association
Michael Mellish Energy Information Administration, United States
LawrenceMetzroth Arch Coal
RyoMinami Ministry of Economy, Trade and Industry, Japan
TatianaMitrova Skolkovo Energy Centre, Russian Federation
Klaus Mohn Statoil
Lucio Monari World Bank
Koji Morita The Institute of Energy Economics, Japan
Yuji Morita The Institute of Energy Economics, Japan
EdMorse CitiGroup
RichardMorse Stanford University, United States
Dong-Woo Noh Korea Energy Economics Institute
Petter Nore Norwegian Agency for Development Cooperation
Martin Oettinger Global CCS Institute
Patrick Oliva Michelin
Simon-Erik Ollus Fortum Corporation
Ayse YaseminÖrücü Ministry of Energy and Natural Resources, Turkey
Shonali Pachauri International Institute for Applied SystemsAnalysis, Austria
Jay Paidipati Navigant Consulting
Binu Parthan Renewable Energy&Energy Efficiency Partnership, Austria
Christian Pichat AREVA
© O
EC
D/IE
A, 2
011

11Acknowledgements
Jeff Piper European Commission
Oleg Pluzhnikov Ministry of Economic Development, Russian Federation
Roberto Potì Edison
Ireneusz Pyc Siemens
Maggi Rademacher E.ON
Gustav Resch Vienna University of Technology, Austria
Brian Ricketts Euracoal
Hans-Holger Rogner International Atomic Energy Agency
David Rolfe Department of Energy andClimateChange,UnitedKingdom
Bert Roukens Ministry of Foreign Affairs, The Netherlands
Assaad Saab EdF
Bernard Saincy GDF Suez
Alain Sanglerat GDF Suez
Steve Sawyer Global Wind Energy Council, Belgium
Wendy Schallom Arch Coal
Hans-Wilhelm Schiffer RWE
Sandro Schmidt Federal Institute for Geosciences and Natural Resources,Germany
Philippe Schulz Renault
Adnan Shihab-Eldin Arabdar Consultants
P.R. Shukla Indian Institute of Management
Maria Sicilia Salvatores Iberdrola
Adam Sieminski Deutsche Bank
Laura Solanko Bank of Finland
Benjamin Sporton World Coal Association
Robert Stavins Harvard University, United States
James Steele Department of State, United States
Jonathan Stern Oxford Institute for Energy Studies, United Kingdom
Michael Stoppard IHS CERA
Ulrik Stridbaek Dong Energy
Greg Stringham Canadian Association of Petroleum Producers
© O
EC
D/IE
A, 2
011

12 World Energy Outlook 2011
Supriatna Suhala Indonesian Coal Mining Association
Cartan Sumner Peabody Energy
Philip Swanson Energy consultant
Minoru Takada United Nations
Kuniharu Takemata Electric Power Development Co., Ltd. (J-POWER)
Nobuo Tanaka The Institute of Energy Economics, Japan
Bernard Terlinden GDF Suez
Sven Teske Greenpeace International
Wim Thomas Shell
Elspeth Thomson Energy Studies Institute, Singapore
Simon Trace Practical Action, United Kingdom
Samuel Tumiwa Asian Development Bank
Jo Tyndall Ministry of Foreign Affairs and Trade, New Zealand
Oras Tynkkynen Member of Parliament, Finland
Maria Vagliasindi World Bank
Coby Van der Linde Clingendael Institute, The Netherlands
Noe van Hulst International Energy Forum, Saudi Arabia
Wim J. Van Nes SNV Netherland Development Organisation
Adnan Vatansever Carnegie Endowment for International Peace,United States
Umberto Vergine Eni
Stefan Vergote European Commission
Frank Verrastro Center for Strategic and International Studies,United States
Heike Volkmer GIZ, Germany
GrahamWeale RWE
Peter Wells Cardiff Business School, United Kingdom
LiuWenge China Coal Information Institute
JacobWilliams Peabody Energy
StevenWinberg CONSOL Energy
Peter Wooders International Institute for Sustainable Development,Switzerland
© O
EC
D/IE
A, 2
011

13Acknowledgements
Liu Xiaoli Energy Research Institute of NDRC
Vitaly Yermakov IHS CERA
Shigehiro Yoshino Nippon Export and Investment Insurance, Japan
Alex Zapantis Rio Tinto
The individuals and organisations that contributed to this study are not responsible forany opinions or judgements contained in this study. All errors and omissions are solely theresponsibility of the IEA.
WORKSHOPS
A number of workshops and meetings were held to gather essential input to this study.The workshop participants have contributed valuable new insights, feedback and data forthis analysis.
Outlook for Coal Industry andMarkets, Beijing: 14 April 2011
Russia Energy Outlook, Moscow: 20 April 2011
Energy for All: Financing Access for the Poor, Paris: 13May 2011
© O
EC
D/IE
A, 2
011

TABLE
OF
CONTENTS
ANNEXES
PART COUTLOOK FORCOAL MARKETS
PART AGLOBALENERGY TRENDS
PART DSPECIAL TOPICS
PART BOUTLOOKFOR RUSSIANENERGY
© O
EC
D/IE
A, 2
011

ANNEXES
COAL SUPPLY AND INVESTMENT PROSPECTS 11
COAL DEMAND PROSPECTS 10
IMPLICATIONS OF RUSSIA’S ENERGY DEVELOPMENT 9
RUSSIAN RESOURCES AND SUPPLY POTENTIAL 8
RUSSIAN DOMESTIC ENERGY PROSPECTS 7
CONTEXT AND ANALYTICAL FRAMEWORK 1
ENERGY PROJECTIONS TO 2035 2
OIL MARKET OUTLOOK 3
POWER AND RENEWABLES OUTLOOK 5
NATURAL GAS MARKET OUTLOOK 4
CLIMATE CHANGE AND THE 450 SCENARIO 6
THE IMPLICATIONS OF LESS NUCLEAR POWER 12
ENERGY FOR ALL 13
DEVELOPMENTS IN ENERGY SUBSIDIES 14
© O
EC
D/IE
A, 2
011

16 World Energy Outlook 2011
Foreword 3Acknowledgements 5List of figures 21List of tables 31List of boxes 34List of spotlights 36Executive summary 39
Part A: GLOBAL ENERGY TRENDS 47
Context and analytical framework 49Highlights 49Introduction 50Defining the scenarios 51Main non-policy assumptions 55
Economic growth 55Population 58Energy prices 61CO2 prices 65Technology 67
Energy projections to 2035 69Highlights 69Overview of energy trends by scenario 70Energy trends in the New Policies Scenario 74
Primary energy mix 74Regional trends 80Sectoral trends 85Energy production and trade 88Investment in energy-supply infrastructure 96Energy-related emissions 99
Oil market outlook 103Highlights 103Demand 104
Primary oil demand trends 104Regional trends 106Sectoral trends 108Focus on the transport sector 109
Supply 119Resources and reserves 119Production prospects 122
1
2
3
© O
EC
D/IE
A, 2
011

Table of contents 17
Trade 136Trends in oil and gas production costs 138Oil and gas investment 141
Impact of deferred upstream investment in theMiddle East and North Africa 145A time of great uncertainty 145The Deferred Investment Case 146Results of the Deferred Investment Case 147
Natural gas market outlook 155Highlights 155Demand 156
Primary gas demand trends 156Regional and sectoral trends 158
Supply 161Resources and reserves 161Production prospects 162
Inter-regional trade 167Investment 169Are we entering a Golden Age of Gas? 170
Power and renewables outlook 175Highlights 175Electricity demand 176Electricity supply 177
Coal 180Natural gas 182Nuclear power 183Renewables 184CO2 emissions 186New capacity additions and retirements 187Investment 193
Focus on T&D infrastructure 195Grid expansion 195T&D investment needs 197
Climate change and the 450 Scenario 205Highlights 205Introduction 206Recent developments 207Overview of trends in the 450 Scenario 210
Primary energy demand in the 450 Scenario 212Energy-related emissions and abatement 213Investment in the 450 Scenario 224Other spending in the 450 Scenario: fuel costs and subsidies 225Benefits of the 450 Scenario 226
4
5
6
© O
EC
D/IE
A, 2
011

18 World Energy Outlook 2011
Implications of delayed action 229Lock-in in the energy sector 229The cost of lock-in 235What if CCS does not deliver? 236
Part B: OUTLOOK FOR RUSSIAN ENERGY 243
Russian domestic energy prospects 245Highlights 245Introduction 246
Trends in energy demand and supply 247Trends in policies and governance 251
Key assumptions for the Russian energy outlook 251GDP and population 251Energy and climate policies 253Energy pricing 255Energy savings potential 257
Russian domestic energy outlook 261Overview 261Energy savings 262Domestic energy trends by fuel 264Domestic energy trends by sector 267
Russian resources and supply potential 283Highlights 283Overview 284Oil 288
Resources 288Production 292Investment and costs 300Exports 301
Natural gas 303Resources 303Production 304Investment and costs 310Flaring 311Transportation and storage 312Prospects for natural gas export flows 312
Unconventional resources 315Coal 318Nuclear 320Hydropower and other renewables 323
Hydropower 324Other renewables 325
7
8
© O
EC
D/IE
A, 2
011

Table of contents 19
Implications of Russia’s energy development 329Highlights 329Energy and national economic development 330
Investment 334Revenues 335
Eurasian and global energy security 336Regional energy relationships and oil and gas transit 337Russia in global oil markets 339Russia in global gas markets 341Russia in global coal markets 346
Environment and climate change 346Comparing this Outlookwith Russian scenarios and objectives 349
Part C: OUTLOOK FOR COAL MARKETS 351
Coal demand prospects 353Highlights 353Overview 354Understanding the drivers of coal demand 358
Economic activity 359Coal prices and inter-fuel competition 361Energy and environmental policies 373Technological innovation 376
Regional Analysis 380China 382India 387United States 390Other non-OECD Asia 392Eastern Europe/Eurasia 392OECD Asia Oceania 393OECD Europe 394Africa 395Rest of the world 395
Coal supply and investment prospects 397Highlights 397Overview of projections 398Understanding the drivers of coal supply 401
Resources and reserves 402Cost trends and technology 404Government policies 413
Coal market and industry structure 416International markets 416Industry concentration 417
10
11
9
© O
EC
D/IE
A, 2
011

20 World Energy Outlook 2011
Current investment trends 418Focus on the New Policies Scenario 420
Production prospects 420Trade prospects 421Investment outlook 423
Regional analysis 424China 424United States 430India 431Indonesia 434Australia 436South Africa 439Russia 441Rest of the world 441
Part D: SPECIAL TOPICS 445
The implications of less nuclear power 447Highlights 447Why the Low Nuclear Case? 448The role of nuclear energy today 449What might cause expansion of nuclear capacity to slow? 451
Possible changes in policy concerning nuclear power 451Possible changes to the economics of nuclear power 455
Implications of the Low Nuclear Case for the global energy landscape 458Power sector 458International fuel markets 461CO2 emissions 462
Meeting the global climate goal with less nuclear power generation 464The Low Nuclear 450 Case 465
Energy for all 469Highlights 469Introduction 470Current status of modern energy access 472
Current status of investment in modern energy access 474Outlook for energy access and investment in the New Policies Scenario 476
Access to electricity 477Access to clean cooking facilities 480
Investment needed to achieve modern energy access for all 481Investment in electricity access 482Investment in access to clean cooking facilities 485
Broader implications of achieving modern energy access for all 487Financing to achieve modern energy access for all 489
12
13
© O
EC
D/IE
A, 2
011

Table of contents 21
Electricity access – financing on-grid electrification 491Electricity access – financing mini-grid electrification 493Electricity access – financing off-grid electrification 494Clean cooking facilities – financing LPG stoves 495Clean cooking facilities – financing biogas systems 496Clean cooking facilities – financing advanced cookstoves 497
Sources of financing and barriers to scaling up 498Multilateral and bilateral development sources 499Developing country government sources 501Private sector sources 503
Implications for policy 505
Developments in energy subsidies 507Highlights 507Overview of energy subsidies 508Fossil-fuel subsidies 510
Measuring fossil-fuel consumption subsidies 512Fossil-fuel subsidies and the poor 518Implications of phasing out fossil-fuel consumption subsidies 520Implementing fossil-fuel subsidy reform 522Recent developments in fossil-fuel subsidies 526
Renewable-energy subsidies 527Measuring renewable-energy subsidies 529Implications for CO2 emissions and import bills 536Impact of renewable-energy subsidies on end-user electricity prices 538Recent developments in renewable-energy subsidies 539
ANNEXES 541
Annex A. Tables for scenario projections 543Annex B. Policies andmeasures by scenario 617Annex C. Units, definitions, regional and country groupings, abbreviations and acronyms 629Annex D. References 645
List of figures
Part A: GLOBAL ENERGY TRENDS
Chapter 1: Context and analytical framework1.1 Average IEA crude oil import price 621.2 Ratio of average natural gas and coal import prices to crude oil prices in the
New Policies Scenario 651.3 Typical lifetime of energy-related capital stock 68
Chapter 2: Energy projections to 20352.1 World primary energy demand by scenario 70
14
© O
EC
D/IE
A, 2
011

22 World Energy Outlook 2011
2.2 World primary energy demand by fuel and scenario, 2009 and 2035 722.3 Shares of energy sources in world primary demand by scenario, 2035 722.4 World energy-related CO2 emissions by scenario 732.5 Average annual percentage change in global primary energy intensity by
scenario and region 732.6 World primary energy demand by fuel in the New Policies Scenario 762.7 Shares of energy sources in world primary energy demand in the New
Policies Scenario 792.8 World primary energy demand by region in the New Policies Scenario 802.9 Energy intensity in selected countries and regions in the New Policies
Scenario, 1990-2035 822.10 Energymix in selectedcountries and regions in theNewPolicies Scenario, 2035 842.11 Worldprimary energydemandby fuel and sector in theNewPolicies Scenario,
2035 852.12 Incremental energy demand by sector and region in the New Policies
Scenario, 2009-2035 872.13 Number of PLDVs per thousand people by region, 2009 and 2035, and the
change in oil demand in road-transport 882.14 Incremental world energy supply by fuel in the New Policies Scenario,
2009-2035 892.15 Oil production in selected regions in theNewPolicies Scenario, 2010 and 2035 902.16 Largest producers of electricity from renewables in theNewPolicies Scenario,
2035 912.17 Oil demand and the share of imports by region in the New Policies Scenario,
2010 and 2035 922.18 Natural gas demand and the share of imports by region in the New Policies
Scenario, 2009 and 2035 932.19 Expenditure on net imports of oil and gas as a share of real GDP by region
in the New Policies Scenario, 1980-2035 962.20 Cumulative investment in energy-supply infrastructure by fuel in the New
Policies Scenario, 2011-2035 972.21 Cumulative investment in energy-supply infrastructure by region in the New
Policies Scenario, 2011-2035 982.22 Energy-related CO2 emissions in theNewPolicies Scenario by fuel, 1980-2035 992.23 Cumulative energy-related CO2 emissions in selected countries and regions,
1900-2035 1002.24 Energy-related CO2 emissions by region in 2035 in the New Policies Scenario
and the change from 2010 101
Chapter 3: Oil market outlook3.1 World primary oil demand and oil price by scenario 1043.2 Primary oil intensity by region in the New Policies Scenario 1063.3 Change in primary oil demand by sector and region in the New Policies
Scenario, 2010-2035 1083.4 World transportation oil demand by mode in the New Policies Scenario 109
© O
EC
D/IE
A, 2
011

23Table of contents
3.5 Average annual change in transport oil demand and GDP by region andtransport mode in the New Policies Scenario, 2010-2035 110
3.6 World non-oil-based fuel use by transportmode in theNewPolicies Scenario 1113.7 World PLDV oil demand in the New Policies Scenario 1133.8 Change in road vehicle travel in relation to changes inGDPper capita andoil
price in theUnited States, 1985-2010 1143.9 PLDV sales in selected markets, 2000-2010 1143.10 PLDV ownership in selected markets in the New Policies Scenario 1153.11 PLDV sales and stocks in the New Policies Scenario 1163.12 Oil savings through electric vehicle sales: country targets, industry plans
and in the New Policies Scenario 1183.13 Liquid fuel schematic 1203.14 Recoverable oil resources and production by region and type in the New
Policies Scenario 1213.15 World oil production in the New Policies Scenario, 2010 and 2035 1233.16 World liquids supply by type in the New Policies Scenario 1233.17 Major changes in liquids supply in the New Policies Scenario, 2010-2035 1243.18 Light tight oil production potential from selected plays 1293.19 Regional oil demand and net trade in the New Policies Scenario 1373.20 IEA upstream investment cost index, oil price index and drilling activity 1383.21 Breakeven costs, budget breakeven and commercially attractive prices for
current oil production for selected producers, mid-2011 1403.22 Oil and gas production and breakeven costs in the New Policies Scenario 1413.23 Worldwide upstream oil and gas investment and capital efficiency by
company type 1433.24 Average IEA crude oil import price in theNewPolicies Scenario andDeferred
Investment Case 1483.25 Change in average IEA crude oil import price after initial fall in investment
in the Deferred Investment Case, compared to past price shocks 1483.26 World primary oil demand in the New Policies Scenario and the Deferred
Investment Case 1493.27 Reduction in global oil demand in the transport sector by source in the
Deferred Investment Case relative to the New Policies Scenario 1503.28 Changes in global oil production and demand in the Deferred Investment
Case relative to the New Policies Scenario 1513.29 Profile of oil production recovery after disruption in Deferred Investment
Case and past events 1523.30 Oil and gas export cash flows and import costs by region in the New Policies
Scenario and Deferred Investment Case, 2011-2035 153
Chapter 4: Natural gas market outlook4.1 World primary natural gas demand by scenario 1574.2 Natural gas demand by selected region in the New Policies Scenario, 2009
and 2035 158
© O
EC
D/IE
A, 2
011

24 World Energy Outlook 2011
4.3 Incremental primary natural gas demand by region and sector in the NewPolicies Scenario, 2009-2035 160
4.4 Primary natural gas demandby sector in theNewPolicies Scenario, 2009 and2035 161
4.5 Recoverable gas resources and production by region and type, end-2010 1624.6 Change in annual natural gas production in selected countries in the New
Policies Scenario 1664.7 Net gas trade by major region in the New Policies Scenario 1684.8 Cumulative investment in natural gas supply infrastructure by region and
activity in the New Policies Scenario, 2011-2035 1704.9 Comparison of average annual natural gas demand growth between theNew
Policies Scenario and the GAS Scenario, 2009-2035 172
Chapter 5: Power and renewables outlook5.1 World electricity supply and demand by sector in the New Policies Scenario 1775.2 Share of world electricity generation by fuel in the New Policies Scenario 1795.3 Typical levelised cost by plant type and carbon price in the OECD in the New
Policies Scenario, 2020 1805.4 Incremental global coal-fired electricity generation relative to 2009 by region
in the New Policies Scenario 1815.5 World coal-fired electricity generation by plant type in the New Policies
Scenario 1815.6 Gas-fired electricity generation in selected countries and regions in the New
Policies Scenario 1825.7 Additions and retirements of nuclear power capacity by region in the New
Policies Scenario 1845.8 Incremental global renewables-based electricity generation relative to 2009
by technology in the New Policies Scenario 1845.9 Solar PV and wind power capacity by region in the New Policies Scenario 1855.10 Global CO2 emission savings in power generation relative to the 2009 fuel
mix in the New Policies Scenario 1865.11 Global installed power generation capacity and additions by technology in
the New Policies Scenario 1875.12 Capacity of wind and solar PV and their system effects for the United States
and OECD Europe, 2035 1925.13 Investment in new power plants and infrastructure in the New Policies
Scenario 1935.14 Expansion of T&D grids 1970-2009, and regional shares of global grid
investment in 2009 1965.15 Share of T&D infrastructure in place in 2009 reaching 40 years of age 1965.16 T&D grid length and per-capita generation for selected regions in the New
Policies Scenario 1975.17 Annual average investment in T&D infrastructure in theNewPolicies Scenario 1985.18 T&D infrastructure costs as a share of residential end-user price in the New
Policies Scenario, 2035 200
© O
EC
D/IE
A, 2
011

Table of contents 25
5.19 Renewables grid integration costs as a share of global T&D investment costsin the New Policies Scenario by integration cost, 2011-2035 202
5.20 Effect of a super-grid on the capacity credit for wind and solar PV for theUnited States and OECD Europe, 2035 203
Chapter 6: Climate change and the 450 Scenario6.1 Energy-related CO2 emissions by country, 2008-2010 2086.2 World energy-related CO2 emissions by scenario 2106.3 World energy-related CO2 emissions by fossil fuel in the 450 Scenario 2136.4 World energy-related CO2 emissions abatement in the 450 Scenario relative
to the New Policies Scenario 2146.5 Emissions of major air pollutants by region in the 450 Scenario 2166.6 Energy-related CO2 emissions in the 450 Scenario and abatement relative
to the New Policies Scenario by region, 2009 and 2035 2176.7 Energy-related CO2 emissions per capita in the 450 Scenario by region 2186.8 World energy-related CO2 abatement by sector in the 450 Scenario compared
with the New Policies Scenario 2206.9 Change in world energy-related CO2 emissions from the power generation
sector in the 450 Scenario compared with the New Policies Scenario 2216.10 Cumulative energy sector investment by scenario, 2011-2035 2256.11 Oil-import bills in selected regions by scenario 2286.12 World energy-related CO2 emissions from locked-in infrastructure in 2010
and room for manoeuvre to achieve the 450 Scenario 2306.13 World energy-related CO2 emissions in the 450 Scenario and from locked-in
infrastructure in 2010 andwith delay 2316.14 World energy-related CO2 emissions in the 450 Scenario and from locked-in
infrastructure in 2010 and with delay to 2015 in the power sector 2326.15 World energy-related CO2 emissions in the 450 Scenario and from locked-in
infrastructure in 2010 and with delay to 2015 in industry 2336.16 Change in investment in power generation by technology in the Delayed
450 Case, relative to the 450 Scenario 2366.17 Potential CO2 emissions from remaining fossil-fuel reserves and in the
450 Scenario, compared with the emissions budget to achieve 2°C 2376.18 Cumulative share of abatement relative to the New Policies Scenario in the
450 Scenario, Delayed CCS 450 Case and Low Nuclear 450 Case 2396.19 Change inglobal energydemandby fuel in theDelayedCCS450Case compared
with the 450 Scenario 2416.20 Additional investment in the Delayed CCS 450 Case 241
Part B: OUTLOOK FOR RUSSIAN ENERGY
Chapter 7: Russian domestic energy prospects7.1 Primary energy demand in Russia by fuel and GDP, 1990-2009 2477.2 Energy production in Russia by fuel, 1990-2009 249
© O
EC
D/IE
A, 2
011

26 World Energy Outlook 2011
7.3 Share of Russia’s population, energy consumption and fossil-fuel productionby federal district, 2009 250
7.4 Total energy costs as a percentage of GDP 2577.5 Primary energy savings potential in Russia based on comparable OECD
efficiencies, 2008 2587.6 Energy savings potential in Russia by sector, 2008 2597.7 Natural gas savings potential in Russia, 2008 2607.8 Total primary energy demand by scenario 2617.9 Primary energy savings potential in Russia based on comparable OECD
efficiencies in the New Policies Scenario, 2008 and 2035 2637.10 Primary energy intensity in Russia and other selected regions in the New
Policies Scenario 2647.11 Primary energy demand in Russia by fuel in the New Policies Scenario 2657.12 Incremental energy demand by sector and fuel in the New Policies Scenario,
2009-2035 2677.13 Breakdown of installed electricity and CHP capacity in Russia, 2009 2697.14 Electricity generation by fuel in Russia in the New Policies Scenario,
1990-2035 2707.15 Age profile of installed thermal and nuclear capacity in Russia, comparison
with selected countries and regions, 2010 2717.16 Cumulative power sector investment in Russia by type in the New Policies
Scenario, 2011-2035 2727.17 District heat supply by sector in the New Policies Scenario, 1990-2035 2737.18 Industry energy demand by fuel in Russia in the New Policies Scenario,
2000-2035 2767.19 Energy consumption in the transport sector by type in the New Policies
Scenario, 2000-2035 2777.20 Efficiency of energy consumption for space heating in the residential sector,
2009-2035 281
Chapter 8: Russian resources and supply potential8.1 Russian share in global resources, production and export of fossil fuels, 2010 2848.2 Russian oil balance in the New Policies Scenario 2858.3 Russian gas balance in the New Policies Scenario 2858.4 Russian coal balance in the New Policies Scenario 2858.5 Russian nuclear and renewables output in the New Policies Scenario 2868.6 Estimated Russian oil and gas production by type of company, 2010 2878.7 Oil and gas basins in Russia 2908.8 Recent evolution of Russian oil production by region 2938.9 Major oil fields and supply infrastructure in Russia 2978.10 Changes in Russian oil production by region in the New Policies Scenario 2988.11 Russian oil production by type in the New Policies Scenario 3008.12 Recent gas production trends by region 305
© O
EC
D/IE
A, 2
011

Table of contents 27
8.13 Changes in Russian natural gas production by region in the New PoliciesScenario 309
8.14 Production of associated gas, expressed in volumes and as a ratio to oilproduction, 2002-2010 311
8.15 Major gas fields and supply infrastructure in Russia 3138.16 Russian coal production and exports 3198.17 Installed nuclear capacity and share of electricity generation in the New
Policies Scenario 3218.18 Shareof renewable energy inRussian total primary energydemand, electricity
andheat production, 2009 3248.19 Shareof renewables in power generation inRussia in theNewPolicies Scenario 326
Chapter 9: Implications of Russia’s energy development9.1 Structure of Russian exports by value, 2009 3319.2 Estimated share of oil and gas in Russian GDP in the New Policies Scenario 3329.3 Cumulative investment requirement in coal, oil, gas and power supply in the
New Policies Scenario, 2011-2035 3349.4 Sources of revenue from fossil fuel export sales, 2010 and 2035 3369.5 Estimated share of Russian gas sales revenue fromdomestic and international
gas sales in the New Policies Scenario 3369.6 Projected gas flows fromRussia to Europe andpotential growth in gas-export
pipeline capacity 3389.7 Oil production in Russia and selected countries in the New Policies Scenario 3409.8 Gas production in selected countries in the New Policies Scenario, 2009
and 2035 3429.9 Russian share of natural gas imports and consumption in the EuropeanUnion
and China in the New Policies Scenario 3439.10 Energy-relatedCO2emissionsabatement inRussiaby source in the450Scenario
compared with the New Policies Scenario 348
Part C: OUTLOOK FOR COAL MARKETS
Chapter 10: Coal demand prospects10.1 Incremental world primary energy demand by fuel, 2000-2010 35410.2 World primary coal demand by region and scenario 35610.3 Incremental world primary coal demand by region and scenario 35710.4 Primary coal intensity by region as a percentage of 2009 world average in
the New Policies Scenario 36010.5 World crude steel production, and iron and steel coal use versus GDP in the
New Policies Scenario 36110.6 Average OECD steam coal import price by scenario 36310.7 Ratio of average OECD steam coal import price to average regional natural
gas and IEA crude oil import prices in the New Policies Scenario 36310.8 World coal-fired generating capacity by type andmajor region 366
© O
EC
D/IE
A, 2
011

28 World Energy Outlook 2011
10.9 New additions of coal-fired electricity generating capacity by technology andregion in the New Policies Scenario 366
10.10 Levelised electricity generating costs by component for selected technologiesand countries in the New Policies Scenario, 2020 370
10.11 World iron and steel sector energy consumption by type in the New PoliciesScenario 371
10.12 Coal-to-liquids inputs by country in the New Policies Scenario 37310.13 Reduction in world primary coal demand by sector and scenario 37410.14 World primary coal demand by region and scenario 37510.15 Coal consumption subsidies for selected countries, 2010 37610.16 Coal-fired generating capacity equipped with CCS by scenario, 2035 37910.17 Incremental primary coal demand by region in the New Policies Scenario 38110.18 Coal demand in China by sector in the New Policies Scenario 38210.19 Breakevenpriceof coal versus natural gas for power generation inChina, 2020 38410.20 New additions of power-generating capacity in China by type in
the New Policies Scenario 38510.21 Electricity generation in China by type in the New Policies Scenario 38510.22 Non-power generation coal demand in China by sector in the New Policies
Scenario 38610.23 Coal demand in India by sector in the New Policies Scenario 38810.24 Coal-fired generating capacity in India by type in the New Policies Scenario 38910.25 Coal demand in the United States by sector in the New Policies Scenario 39010.26 Electricity generation in theUnited States by type in theNewPolicies Scenario 39210.27 Electricity generation in Russia by type in the New Policies Scenario 393
Chapter 11: Coal supply and investment prospects11.1 Incremental coal production by scenario and region, 2009-2035 40011.2 China’s coal trade balance, 2000-2011 40111.3 Coal reserves by country and type, end-2009 40411.4 Change in average FOB supply cash costs relative to 2005 for internationally
traded steam coal by selected country and component 40511.5 Average FOB supply cash costs and prices for internationally traded steam
coal, 2010 40611.6 Average FOB supply cash costs and prices for internationally traded coking
coal, 2010 40711.7 Share of key input factors in coal mining costs by technique, 2009 40911.8 Coal mining productivity in Australia and the United States, 2004-2008 41011.9 Coal export port utilisation rates for selected countries 41111.10 Steamcoal supply cash costs tonorthwest Europebycomponent for selected
exporters, 2007 and 2009 41311.11 Dry bulk carrier market evolution, 2011-2015 41311.12 World inter-regional hard coal net trade bymajor region in the New Policies
Scenario 42211.13 Major hard coal importers in the New Policies Scenario 423
© O
EC
D/IE
A, 2
011

Table of contents 29
11.14 Cumulative coal-supply investment by region in the New Policies Scenario,2011-2035 424
11.15 Average coal production costs of major state-owned enterprises in Shanxiprovince, 2000-2009 425
11.16 Major coal production centres and transport routes in China, 2009 42711.17 China’s steamcoal import volumes from selected countries 42811.18 Cumulative coal production in China by period and type in the New Policies
Scenario 42911.19 China’s hard coal net trade by type in the New Policies Scenario 42911.20 Coal production in the United States in the New Policies Scenario 43111.21 Coal production in India by type in the New Policies Scenario 43311.22 Hard coal net imports in India by type in the New Policies Scenario 43411.23 Coal production in Indonesia in the New Policies Scenario 43611.24 Coal production in Australia in the New Policies Scenario 43911.25 Coal production in South Africa in the New Policies Scenario 44111.26 Hard coal net exports from selected smaller exporters in the New Policies
Scenario 443
Part D: SPECIAL TOPICS
Chapter 12: The implications of less nuclear power12.1 Nuclear reactor construction starts, 1951-2011 45012.2 Sensitivityof long-runmarginal costofnuclear generation tovariousparameters 45712.3 Nuclear power capacity in the Low Nuclear Case 45912.4 Power generation by fuel in the New Policies Scenario and LowNuclear Case 46112.5 Global primary coal and gas demand and annual spending on imports in the
Low Nuclear Case 46212.6 Energy-related CO2 emissions from the power sector in the New Policies
Scenario and the Low Nuclear Case 46312.7 World energy-related CO2 emissions abatement in the Low Nuclear 450
Case relative to the New Policies Scenario 46512.8 Share of world power generation by source in the 450 Scenario and Low
Nuclear 450 Case 46612.9 Incremental energy-related investment in the LowNuclear 450 Case relative
to the 450 Scenario 467
Chapter 13: Energy for all13.1 Oil-import bills in net-importing less developed countries 47013.2 Financing modern energy access 47213.3 Investment in energy access by source, 2009 47613.4 Average annual investment in modern energy access by scenario 48213.5 Average annual investment in access to electricity by type and number
of people connected in the Energy for All Case 48413.6 Average annual investment in access to clean cooking facilities by type
and region, 2010-2030 485
© O
EC
D/IE
A, 2
011

30 World Energy Outlook 2011
13.7 Average annual investment required by region and technology in the Energyfor All Case, 2010-2030 486
13.8 Additional electricity generation by grid solution and fuel in the Energy forAll Case compared with the New Policies Scenario, 2030 487
13.9 Additional global energy demand andCO2 emissions in the Energy for All Casecompared with the New Policies Scenario, 2030 488
13.10 Premature annual deaths fromhousehold air pollution and selected diseasesin the New Policies Scenario 489
13.11 Average annual investment inmodern energy access by source of financingand scenario 490
13.12 Fossil-fuel subsidies in selected countries, 2010 502
Chapter 14: Developments in energy subsidies14.1 Illustration of the price-gapmethodology: average reference and retail prices
of oil products 51214.2 Global economic cost of fossil-fuel consumption subsidies by fuel 51314.3 Economic cost of fossil-fuel consumption subsidies by fuel for top twenty-five
economies, 2010 51514.4 Fossil-fuel consumption subsidies per capita and as a percentage of total GDP
in selected economies, 2010 51614.5 Rates of subsidisation for fossil-fuel consumption subsidies, 2010 51714.6 Fossil-fuel consumption subsidies by net oil and gas importer and exporter,
2007-2010 51814.7 Share of fossil-fuel subsidies received by the lowest 20% income group in
selected economies, 2010 51914.8 Share of fossil-fuel subsidies received by the lowest 20% incomegroupby fuel
in surveyed economies, 2010 52014.9 Impact of fossil-fuel consumption subsidy phase-out on global fossil-energy
demand and CO2 emissions 52114.10 Summary of common barriers to fossil-fuel subsidy reform and strategies for
successful implementation 52414.11 Illustration of the drivers of unit subsidy costs for renewable energy 52914.12 Global subsidies to renewables-based electricity and biofuels by technology
and fuel in the New Policies Scenario 53114.13 Global subsidies to renewables-based electricity and biofuels by region in
the New Policies Scenario 53114.14 Renewable electricity production cost relative towholesale prices for selected
technologies and regions in the New Policies Scenario 53414.15 Indicative biofuels production costs and spot oil product prices 53614.16 CO2 emissions and import bill savings due to renewables subsidies in 2035
in the 450 Scenario relative to the New Policies Scenario 53714.17 Cost of renewables-based electricity subsidies as a percentage of average
end-user electricity price in the New Policies Scenario 538
© O
EC
D/IE
A, 2
011

Table of contents 31
List of tables
Part A: GLOBAL ENERGY TRENDS
Chapter 1: Context and analytical framework1.1 Selected key policy assumptions by scenario and region 521.2 Real GDP assumptions by region 581.3 Population and urbanisation assumptions by region 591.4 Fossil-fuel import price assumptions by scenario 641.5 CO2 price assumptions in selected regions by scenario 66
Chapter 2: Energy projections to 20352.1 World primary energy demand by fuel and scenario 712.2 World primary energy demand by fuel in the New Policies Scenario 742.3 World primary energy demand by region in the New Policies Scenario 812.4 Cumulative investment in energy-supply infrastructure by fuel and region
in the New Policies Scenario, 2011-2035 98
Chapter 3: Oil market outlook3.1 Primary oil demand by region and scenario 1053.2 Primary oil demand by region in the New Policies Scenario 1073.3 Factors affecting fuel choices for future road transport technologies 1123.4 Oil production and supply by source and scenario 1223.5 Non-OPEC oil production in the New Policies Scenario 1263.6 OPEC oil production in the New Policies Scenario 1343.7 Oil production, indicative development activity and investment in theUnited
States, Russia and Saudi Arabia, 2010 1393.8 Oil and gas industry investment by company 1423.9 Cumulative investment in oil and gas supply infrastructure by region in the
New Policies Scenario, 2011-2035 1443.10 The role ofMENA in global oil and gas production in theNewPolicies Scenario 146
Chapter 4: Natural gas market outlook4.1 Primary natural gas demand by region and scenario 1564.2 Primary natural gas demand by region in the New Policies Scenario 1594.3 Primary natural gas production by region, type and scenario 1634.4 Primary natural gas production by region in the New Policies Scenario 165
Chapter 5: Power and renewables outlook5.1 Electricity demand by region and scenario 1765.2 Electricity generation by plant type and scenario 1785.3 Cumulative capacity retirements by region and source in the New Policies
Scenario, 2011-2035 1885.4 Cumulative gross capacity additions by region and source in the New Policies
Scenario, 2011-2035 189
© O
EC
D/IE
A, 2
011

32 World Energy Outlook 2011
5.5 Investment in new power plants in the New Policies Scenario, 2011-2035 1945.6 Investment in T&D infrastructure in the New Policies Scenario, 2011-2035 199
Chapter 6: Climate change and the 450 Scenario6.1 World anthropogenic greenhouse-gas emissions by scenario 2116.2 World primary energy demand by fuel in the 450 Scenario 2126.3 Top ten sources of abatement in the 450 Scenario relative to theNewPolicies
Scenario by policy area 2226.4 Fossil-fuel import prices in the 450 Scenario 2276.5 Cost of pollution control by region and scenario 2286.6 Consumption, capacity and stock of selected technologies by scenario 240
Part B: OUTLOOK FOR RUSSIAN ENERGY
Chapter 7: Russian domestic energy prospects7.1 Key energy-related indicators for Russia 2467.2 Indicators and assumptions for population and GDP in Russia 2527.3 Main assumptions for Russia by scenario 2547.4 Passenger light-duty vehicle ownership in selected countries in the New
Policies Scenario 278
Chapter 8: Russian resources and supply potential8.1 Conventional oil resources in various Russian regions, end-2010 2898.2 Conventional hydrocarbon resources in various Russian regions, end-2009,
according to the Russian system of classification 2928.3 Projections for oil production by main basins 2958.4 Conventional gas resources in various Russian regions, end-2010 3038.5 Projections for gas production by main basins 3068.6 Coal production in Russia by type in the New Policies Scenario 319
Chapter 9: Implications of Russia’s energy development9.1 Main gas trade flows fromRussia and the Caspian region in the New Policies
Scenario 3439.2 Energy-related CO2 emissions in Russia by scenario 3479.3 Emissions of major air pollutants in Russia by scenario 3489.4 WEO-2011 projections (in 2030) comparedwith selected forecasts from the
Russian Energy Strategy to 2030 349
Part C: OUTLOOK FOR COAL MARKETS
Chapter 10: Coal demand prospects10.1 Coal demand by region and scenario 35710.2 World coal demand by sector and scenario 35810.3 Summary of the main drivers of coal demand by sector 35910.4 Levelised electricity generating cost assumptions in theNewPolicies Scenario,
2020 369
© O
EC
D/IE
A, 2
011

Table of contents 33
10.5 CO2 emissions from coal combustion by region and scenario 37410.6 Coal demand by region in the New Policies Scenario 381
Chapter 11: Coal supply and investment prospects11.1 Coal production by type and scenario 39911.2 World inter-regional hard coal trade by type and scenario 40111.3 Coal resources and reserves by region and type, end-2009 40211.4 Coal export port capacities for selected countries 41211.5 Government support to coal production in OECD countries 41511.6 Key figures for the 30 leading coal companies 41911.7 Coal production by region in the New Policies Scenario 42011.8 Inter-regional hard coal net trade by country in the New Policies Scenario 42111.9 Major railway-to-port coal routes in China 426
Part D: SPECIAL TOPICS
Chapter 12: The implications of less nuclear power12.1 Key nuclear power statistics by region, end-2010 45112.2 Recent announcements by selected countries regarding nuclear power 45212.3 Key projections for nuclear power in the New Policies Scenario and the Low
Nuclear Case 458
Chapter 13: Energy for all13.1 People without access to modern energy services by region, 2009 47313.2 People without access to electricity by region in the New Policies Scenario 47813.3 Major programmes and targets for improving access to electricity in selected
countries 47913.4 Peoplewithout clean cooking facilities by region in theNewPolicies Scenario 48013.5 Additional investment required to achieve universal access to electricity in
the Energy for All Case compared with the New Policies Scenario 48313.6 Additional energy demand in the Energy for All Case comparedwith theNew
Policies Scenario, 2020 and 2030 48813.7 Additional financing for electricity access in the Energy for All Case compared
with the New Policies Scenario, 2010-2030 49213.8 Additional financing for clean cooking facilities in the Energy for All Case
compared with the New Policies Scenario, 2010-2030 49513.9 Sources of financing and the financing instruments they provide 498
Chapter 14: Developments in energy subsidies14.1 Estimated energy subsidies, 2007-2010 50814.2 Recent developments in fossil-fuel consumption subsidy policies in selected
economies 52614.3 Commonmechanisms for subsidising renewable energy 52814.4 Recent developments in renewable-energy subsidies in selected economies 539
© O
EC
D/IE
A, 2
011

34 World Energy Outlook 2011
List of boxes
Part A: GLOBAL ENERGY TRENDS
Chapter 1: Context and analytical framework1.1 How does the IEAmodel long-term energy trends? 60
Chapter 2: Energy projections to 20352.1 The impact of lower near-term economic growth on energy demand 752.2 China’s 12th Five-Year Plan (2011-2015) 78
Chapter 3: Oil market outlook3.1 The future of car making 1173.2 Definitions of different types of liquid fuels 1203.3 The long-term implications of the Deepwater Horizon disaster 1303.4 Prospects for increased oil production in Iraq 1323.5 Assumptions andmethodology of the Deferred Investment Case 147
Chapter 4: Natural gas market outlook4.1 Environmental impact of unconventional gas 1644.2 North America: net gas importer or exporter? 169
Chapter 5: Power and renewables outlook5.1 Costs of integrating variable renewables into the electricity system 191
Chapter 6: Climate change and the 450 Scenario6.1 What is special about 2°C? 2076.2 Updates to the 450 Scenario policy framework 2116.3 Reaping abatement through efficiency in the 450 Scenario 2146.4 The implications of less nuclear power for the 450 Scenario 238
Part B: OUTLOOK FOR RUSSIAN ENERGY
Chapter 7: Russian domestic energy prospects7.1 Policy making and regulation in the Russian energy sector 2487.2 Counting the benefit of increased energy efficiency 2627.3 Higher gas prices, efficiency and fuel switching 2667.4 Keeping Russia cool: heat waves and demand for air-conditioning 2717.5 As efficient as... Moscow? 280
Chapter 8: Russian resources and supply potential8.1 Russian reserves system versus the Petroleum Resources Management
System 2918.2 A balancing act of tax and economics 2948.3 What’s in a bcm? 3048.4 The curious case of the missing natural gas liquids… 309
© O
EC
D/IE
A, 2
011
Table of contents 35
8.5 The “Northern Route” to market 3158.6 Methane hydrates and climate risks 318
Chapter 9: Implications of Russia’s energy development9.1 Oil and gas in the Russian economy 3309.2 The Russian route to market for Caspian oil 3399.3 Russian role in co-operation among oil and gas producers 3419.4 Europe versus Asia: competing for Russian gas? 344
Part C: OUTLOOK FOR COAL MARKETS
Chapter 10: Coal demand prospects10.1 A decade of booming coal use 35510.2 The shift to Asia 35610.3 Coal-fired power generating technologies 365
Chapter 11: Coal supply and investment prospects11.1 Classification and definition of coal types 39811.2 WEO-2011 coal supply modelling enhancements 40011.3 Coal resources and reserves definitions 40311.4 Coal mining techniques 408
Part D: SPECIAL TOPICS
Chapter 12: The implications of less nuclear power12.1 The Fukushima Daiichi nuclear power station 44912.2 Human capital and the nuclear industry 463
Chapter 13: Energy for all13.1 Defining modern energy access 47313.2 Measuring investment in modern energy access 47513.3 What is the role of hydropower in increasing energy access? 48413.4 International Energy and Climate Partnership – Energy+ 500
Chapter 14: Developments in energy subsidies14.1 What is an energy subsidy? 50914.2 Support to fossil-fuel production in OECD countries 51114.3 Recent experiences implementing subsidy reform 52514.4 Why is our estimate of renewables-based electricity subsidies higher in
this year’sOutlook? 533
© O
EC
D/IE
A, 2
011

36 World Energy Outlook 2011
List of spotlights
Part A: GLOBAL ENERGY TRENDS
Chapter 2: Energy projections to 2035What are the economic impacts of high oil prices? 77China’s role in traded coal markets – the ultimate uncertainty? 94
Chapter 3: Oil market outlookThe new American revolution: light tight oil 127
Chapter 4: Natural gas market outlookDo all roads lead to a Golden Age of Gas? 173
Chapter 6: Climate change and the 450 ScenarioThe International Year of Sustainable Energy for All: can universal access be achievedwithout increasing CO2 emissions? 219
Part B: OUTLOOK FOR RUSSIAN ENERGY
Chapter 7: Russian domestic energy prospectsWhat future for district heating in Russia? 274
Chapter 8: Russian resources and supply potentialThe last of the mega-projects? 307
Chapter 9: Implications of Russia’s energy developmentWhat would higher GDP growth imply for the energy sector? 333
Part C: OUTLOOK FOR COAL MARKETS
Chapter 10: Coal demand prospectsWhat is impeding the deployment of more efficient coal-fired generation? 367
Part D: SPECIAL TOPICS
Chapter 12: The implications of less nuclear powerHow did Fukushima Daiichi impact Japanese and global energy markets? 453Will Fukushima Daiichi affect the industry as severely as ThreeMile Islandand Chernobyl? 460
Chapter 14: Developments in energy subsidiesAre the G-20 and APEC commitments being met? 523
© O
EC
D/IE
A, 2
011

Comments and questions are welcome and should beaddressed to:
Dr. Fatih BirolChief EconomistDirector, Office of the Chief EconomistInternational Energy Agency9, rue de la Fédération75739 Paris Cedex 15France
Telephone: (33-1) 4057 6670Fax: (33-1) 4057 6509Email: [email protected]
More information about theWorld Energy Outlook is available atwww.worldenergyoutlook.org.
© O
EC
D/IE
A, 2
011

© O
EC
D/IE
A, 2
011

Executive summary 39
EXECUTIVE SUMMARY
“If we don’t change direction soon, we’ll end up wherewe’re heading”
There are few signs that the urgently needed change in direction in global energy trends isunderway. Although the recovery in the world economy since 2009 has been uneven, andfuture economic prospects remain uncertain, global primary energy demand rebounded bya remarkable 5% in 2010, pushing CO2 emissions to a new high. Subsidies that encouragewasteful consumption of fossil fuels jumped to over $400 billion. The number of peoplewithout access to electricity remained unacceptably high at 1.3 billion, around 20% of theworld’s population. Despite the priority in many countries to increase energy efficiency,global energy intensity worsened for the second straight year. Against this unpromisingbackground, events such as those at the Fukushima Daiichi nuclear power plant and theturmoil in parts of the Middle East and North Africa (MENA) have cast doubts on thereliability of energy supply, while concerns about sovereign financial integrity have shiftedthe focus of government attention away from energy policy and limited their means ofpolicy intervention, boding ill for agreed global climate change objectives.
ThisOutlook assesses the threats and opportunities facing the global energy systembasedon a rigorous quantitative analysis of energy and climate trends. The analysis includesthree global scenarios andmultiple case studies. The central scenario for this Outlook is theNew Policies Scenario, in which recent government policy commitments are assumed to beimplemented in a cautious manner – even if they are not yet backed up by firm measures.Comparisonwith the results of the Current Policies Scenario, which assumes no newpoliciesare added to those in place as of mid-2011, illustrates the value of these commitments andplans. From another angle, comparison is also instructive with the 450 Scenario, whichworks back from the international goal of limiting the long-term increase in the globalmean temperature to two degrees Celsius (2°C) above pre-industrial levels, in order totrace a plausible pathway to that goal. The wide difference in outcomes between thesethree scenarios underlines the critical role of governments to define the objectives andimplement the policies necessary to shape our energy future.
Short-term uncertainty does little to alter the longer-term picture
Despite uncertainty over the prospects for short-term economic growth, demand forenergy in the New Policies Scenario grows strongly, increasing by one-third from 2010to 2035. The assumptions of a global population that increases by 1.7 billion people and3.5% annual average growth in the global economy generate ever-higher demand for energyservices and mobility. A lower rate of global GDP growth in the short-term than assumed inthisOutlookwould make only a marginal difference to longer-term trends.
The dynamics of energy markets are increasingly determined by countries outside theOECD. Non-OECD countries account for 90% of population growth, 70% of the increase ineconomic output and 90% of energy demand growth over the period from 2010 to 2035.
© O
EC
D/IE
A, 2
011

40 World Energy Outlook 2011
China consolidates its position as the world’s largest energy consumer: in 2035 it consumesnearly 70%more energy than the United States, the second-largest consumer, even though,by then, per-capita energy consumption in China is still less than half the level in the UnitedStates. The rates of growth in energy consumption in India, Indonesia, Brazil and theMiddleEast are even faster than in China.
Global investment in energy supply infrastructure of $38 trillion (in year-2010 dollars)is required over the period 2011 to 2035. Almost two-thirds of the total investment is incountries outside of the OECD. Oil and gas collectively account for almost $20 trillion, asboth the need for upstream investment and the associated cost rise in the medium andlong term. The power sector claims most of the remainder, with over 40% of this being fortransmission and distribution networks.
The age of fossil fuels is far from over, but their dominance declines. Demand for all fuelsrises, but the share of fossil fuels in global primary energy consumption falls slightly from81% in 2010 to 75% in 2035; natural gas is the only fossil fuel to increase its share in theglobal mix over the period to 2035. In the power sector, renewable energy technologies,led by hydropower andwind, account for half of the new capacity installed tomeet growingdemand.
Steps in the right direction, but the door to 2°C is closing
We cannot afford to delay further action to tackle climate change if the long-term target oflimiting the global average temperature increase to 2°C, as analysed in the 450 Scenario, isto be achieved at reasonable cost. In the New Policies Scenario, the world is on a trajectorythat results in a level of emissions consistentwith a long-term average temperature increaseof more than 3.5°C. Without these new policies, we are on an even more dangerous track,for a temperature increase of 6°C or more.
Four-fifths of the total energy-related CO2 emissions permissible by 2035 in the450 Scenario are already “locked-in” by our existing capital stock (power plants,buildings, factories, etc.). If stringent new action is not forthcoming by 2017, theenergy-related infrastructure then in place will generate all the CO2 emissions allowedin the 450 Scenario up to 2035, leaving no room for additional power plants, factoriesand other infrastructure unless they are zero-carbon, which would be extremely costly.Delaying action is a false economy: for every $1 of investment avoided in the power sectorbefore 2020 an additional $4.3 would need to be spent after 2020 to compensate for theincreased emissions.
New energy efficiency measures make a difference, but much more is required. Energyefficiency improves in the New Policies Scenario at a rate twice as high as that seen over thelast two-and-a-half decades, stimulated by tighter standards across all sectors and a partialphase-out of subsidies to fossil fuels. In the 450 Scenario, we need to achieve an even higherpace of change, with efficiency improvements accounting for half of the additional reductionin emissions. Themost important contribution to reaching energy security and climate goalscomes from the energy that we do not consume.
© O
EC
D/IE
A, 2
011

Executive summary 41
Rising transport demand and upstream costs reconfirmthe end of cheap oil
Short-term pressures on oil markets may be eased by slower economic growth and by theexpectedreturnofLibyanoil to themarket,but trendsonboth theoildemandandsupply sidesmaintain pressure on prices.We assume that the average IEA crude oil import price remainshigh, approaching$120/barrel (in year-2010dollars) in2035 (over$210/barrel innominal terms)in theNewPolicies Scenario although, in practice, price volatility is likely to remain.
All of the net increase in oil demand comes from the transport sector in emergingeconomies, as economic growth pushes up demand for personal mobility and freight. Oildemand (excluding biofuels) rises from 87million barrels per day (mb/d) in 2010 to 99 mb/din 2035. The total number of passenger cars doubles to almost 1.7 billion in 2035. Salesin non-OECD markets exceed those in the OECD by 2020, with the centre of gravity of carmanufacturing shifting to non-OECD countries before 2015. The rise in oil use comes despitesome impressive gains in fuel economy in many regions, notably for passenger vehicles inEurope and for heavy freight in the United States. Alternative vehicle technologies emergethat use oil much more efficiently or not at all, such as electric vehicles, but it takes timefor them to become commercially viable and penetrate markets. With limited potential forsubstitution for oil as a transportation fuel, the concentration of oil demand in the transportsector makes demand less responsive to changes in the oil price (especially where oilproducts are subsidised).
The cost of bringing oil to market rises as oil companies are forced to turn to moredifficult and costly sources to replace lost capacity and meet rising demand. Productionof conventional crude oil – the largest single component of oil supply – remains at currentlevels before declining slightly to around 68 mb/d by 2035. To compensate for decliningcrude oil production at existing fields, 47 mb/d of gross capacity additions are required,twice the current total oil production of all OPEC countries in the Middle East. A growingshare of output comes from natural gas liquids (over 18 mb/d in 2035) and unconventionalsources (10 mb/d). The largest increase in oil production comes from Iraq, followed bySaudi Arabia, Brazil, Kazakhstan and Canada. Biofuels supply triples to the equivalent of morethan 4mb/d, bolstered by $1.4 trillion in subsidies over the projection period.
Oil imports to the United States, currently the world’s biggest importer, drop asefficiency gains reduce demand and new supplies such as light tight oil are developed,but increasing reliance on oil imports elsewhere heightens concerns about the cost ofimports and supply security. Four-fifths of oil consumed in non-OECD Asia comes fromimports in 2035, compared with just over half in 2010. Globally, reliance grows on arelatively small number of producers, mainly in the MENA region, with oil shipped alongvulnerable supply routes. In aggregate, the increase in production from this region isover 90% of the required growth in world oil output, pushing the share of OPEC in globalproduction above 50% in 2035.
A shortfall in upstream investment in the MENA region could have far-reachingconsequences for global energy markets. Such a shortfall could result from a variety of
© O
EC
D/IE
A, 2
011

42 World Energy Outlook 2011
factors, including higher perceived investment risks, deliberate government policies todevelop production capacity more slowly or constraints on upstream domestic capitalflows because priority is given to spending on other public programmes. If, between 2011and 2015, investment in the MENA region runs one-third lower than the $100 billion peryear required in the New Policies Scenario, consumers could face a substantial near-termrise in the oil price to $150/barrel (in year-2010 dollars).
Golden prospects for natural gas
There is much less uncertainty over the outlook for natural gas: factors both on thesupply and demand sides point to a bright future, even a golden age, for natural gas. OurOutlook reinforces the main conclusions of aWEO special report released in June 2011: gasconsumption rises in all three scenarios, underlining how gas does well under a wide rangeof future policy directions. In the New Policies Scenario, demand for gas all but reaches thatfor coal, with 80% of the additional demand coming from non-OECD countries. Policiespromoting fuel diversification support a major expansion of gas use in China; this is metthrough higher domestic production and through an increasing share of LNG trade andEurasian pipeline imports. Global trade doubles andmore than one-third of the increase goesto China. Russia remains the largest gas producer in 2035 andmakes the largest contributionto global supply growth, followed by China, Qatar, the United States and Australia.
Unconventional gas nowaccounts for half of the estimatednatural gas resource base and itismorewidely dispersed than conventional resources, a fact that has positive implicationsfor gas security. The share of unconventional gas rises to one-fifth of total gas productionby 2035, although the pace of this development varies considerably by region. The growthin output will also depend on the gas industry dealing successfully with the environmentalchallenges: a golden age of gas will require golden standards for production. Natural gas isthe cleanest of the fossil fuels, but increased use of gas in itself (without carbon capture andstorage) will not be enough to put us on a carbon emissions path consistent with limiting therise in average global temperatures to 2°C.
Renewables are pushed towards centre stage
The share of non-hydro renewables in power generation increases from 3% in 2009 to15% in 2035, underpinned by annual subsidies to renewables that rise almost five-timesto $180 billion. China and the European Union drive this expansion, providing nearly halfof the growth. Even though the subsidy cost per unit of output is expected to decline, mostrenewable-energy sources need continued support throughout the projection period in ordertocompete inelectricitymarkets.While thiswill becostly, it is expected tobring lastingbenefitsin terms of energy security and environmental protection. Accommodating more electricityfrom renewable sources, sometimes in remote locations, will require additional investmentin transmission networks amounting to 10% of total transmission investment: in theEuropeanUnion, 25%of the investment in transmission networks is needed for this purpose.The contribution of hydropower to global power generation remains at around 15%, withChina, India and Brazil accounting for almost half of the 680 gigawatts of new capacity.
© O
EC
D/IE
A, 2
011

Executive summary 43
Treading water or full steam ahead for coal?
Coal has met almost half of the increase in global energy demand over the last decade.Whether this trend alters and how quickly is among themost important questions for thefuture of the global energy economy.Maintaining current policies would see coal use riseby a further 65% by 2035, overtaking oil as the largest fuel in the global energy mix. In theNewPolicies Scenario, global coal use rises for the next ten years, but then levels off to finish25% above the levels of 2009. Realisation of the 450 Scenario requires coal consumptionto peak well before 2020 and then decline. The range of projections for coal demand in2035 across the three scenarios is nearly as large as total world coal demand in 2009. Theimplications of policy and technology choices for the global climate are huge.
China’s consumption of coal is almost half of global demand and its Five-Year Plan for2011 to 2015, which aims to reduce the energy and carbon intensity of the economy,will be a determining factor for world coal markets. China’s emergence as a net coalimporter in 2009 led to rising prices and new investment in exporting countries, includingAustralia, Indonesia, Russia and Mongolia. In the New Policies Scenario, the main marketfor traded coal continues to shift from the Atlantic to the Pacific, but the scale and directionof international trade flows are highly uncertain, particularly after 2020. It would take onlya relatively small shift in domestic demand or supply for China to become a net-exporteragain, competing for markets against the countries that are now investing to supply itsneeds. India’s coal use doubles in the New Policies Scenario, so that India displaces theUnited States as the world’s second-largest coal consumer and becomes the largest coalimporter in the 2020s.
Widespread deployment of more efficient coal-fired power plants and carbon captureand storage (CCS) technology could boost the long-term prospects for coal, but there arestill considerable hurdles. If the average efficiency of all coal-fired power plants were to befive percentage points higher than in the New Policies Scenario in 2035, such an acceleratedmove away from the least efficient combustion technologies would lower CO2 emissionsfrom the power sector by 8% and reduce local air pollution. Opting for more efficienttechnology for new coal power plants would require relatively small additional investments,but improving efficiency levels at existing plants would come at a much higher cost. Inthe New Policies Scenario, CCS plays a role only towards the end of the projection period.Nonetheless, CCS is a key abatement option in the 450 Scenario, accounting for almostone-fifth of the additional reductions in emissions that are required. If CCS is notwidely deployed in the 2020s, an extraordinary burden would rest on other low-carbontechnologies to deliver lower emissions in line with global climate objectives.
Second thoughts on nuclear would have far-reachingconsequences
Events at FukushimaDaiichi have raised questions about the future role of nuclear power,although it has not changed policies in countries such as China, India, Russia and Koreathat are driving its expansion. In the New Policies Scenario, nuclear output rises by morethan 70% over the period to 2035, only slightly less than projected last year. However, we
© O
EC
D/IE
A, 2
011

44 World Energy Outlook 2011
also examine the possible implications of a more substantial shift away from nuclear powerin a Low Nuclear Case, which assumes that no new OECD reactors are built, that non-OECDcountries build only half of the additions projected in our New Policies Scenario and that theoperating lifespan of existing nuclear plants is shortened. While creating opportunities forrenewables, such a low-nuclear futurewould also boost demand for fossil fuels: the increasein global coal demand is equal to twice the level of Australia’s current steam coal exports andthe rise in gas demand is equivalent to two-thirds of Russia’s current natural gas exports.The net result would be to put additional upward pressure on energy prices, raise additionalconcerns about energy security and make it harder and more expensive to combat climatechange. The consequences would be particularly severe for those countries with limitedindigenous energy resources which have been planning to rely relatively heavily on nuclearpower. It would also make it considerably more challenging for emerging economies tosatisfy their rapidly growing demand for electricity.
The world needs Russian energy, while Russia needs to use less
Russia’s large energy resources underpin its continuing role as a cornerstone of the globalenergy economy over the coming decades. High prospective demand and internationalprices for fossil fuels might appear to guarantee a positive outlook for Russia, but thechallenges facing Russia are, in many ways, no less impressive than the size of its resources.Russia’s core oil and gas fields in Western Siberia will decline and a new generation ofhigher-cost fields need to be developed, both in the traditional production areas ofWestern Siberia and in the new frontiers of Eastern Siberia and the Arctic. A responsiveRussian fiscal regime will be needed to provide sufficient incentives for investment. Oilproduction plateaus around 10.5 mb/d before starting a slight decline to 9.7 mb/d in 2035;gas production increases by 35% to 860 billion cubic metres (bcm) in 2035, with the Yamalpeninsula becoming the new anchor of Russian supply.
As the geography of Russian oil and gas production changes, so does the geography ofexport. The majority of Russia’s exports continue to go westwards to traditional markets inEurope, but a shift towards Asianmarkets gathersmomentum. Russia gains greater diversityof export revenues as a result: the share of China in Russia’s total fossil-fuel export earningsrises from 2% in 2010 to 20% in 2035, while the share of the European Union falls from 61%to 48%.
Russia aims to create a more efficient economy, less dependent on oil and gas, but needsto pick up the pace of change. If Russia increased its energy efficiency in each sector to thelevels of comparable OECD countries, it could save almost one-third of its annual primaryenergy use, an amount similar to the energy used in one year by the United Kingdom.Potential savings of natural gas alone, at 180 bcm, are close to Russia’s net exports in 2010.New energy efficiency policies and continued price reforms for gas and electricity bringsome improvements but, in our analysis, do not unlock more than a part of Russia’sefficiency potential. Faster implementation of efficiency improvements and energy marketreformswould accelerate themodernisation of the Russian economy and thereby loosen itsdependency onmovements in international commodity prices.
© O
EC
D/IE
A, 2
011

Executive summary 45
Achieving energy for all will not cost the earth
We estimate that, in 2009, around $9 billion was invested globally to provide first accesstomodern energy, butmore than five-times this amount, $48 billion, needs to be investedeach year if universal access is to be achieved by 2030. Providing energy access for all by2030 is a key goal announced by the UN Secretary-General. Today, 1.3 billion people do nothave electricity and 2.7 billion people still rely on the traditional use of biomass for cooking.The investment required is equivalent to around 3% of total energy investment to 2030.Without this increase, the global picture in 2030 is projected to change little from today andin sub-Saharan Africa it gets worse. Some existing policies designed to help the poorestmisstheir mark. Only 8% of the subsidies to fossil-fuel consumption in 2010 reached the poorest20% of the population.
International concern about the issue of energy access is growing. The United Nations hasdeclared 2012 to be the “International Year of Sustainable Energy for All” and the Rio+20Summit represents an important opportunity for action. More finance, frommany sourcesand in many forms, is needed to provide modern energy for all, with solutions matchedto the particular challenges, risks and returns of each category of project. Private sectorinvestment needs to grow the most, but this will not happen unless national governmentsadopt strong governance and regulatory frameworks and invest in capacity building. Thepublic sector, including donors, needs to use its tools to leverage greater private sectorinvestment where the commercial case would otherwise be marginal. Universal accessby 2030 would increase global demand for fossil fuels and related CO2 emissions by lessthan 1%, a trivial amount in relation to the contribution made to human developmentand welfare.
© O
EC
D/IE
A, 2
011

© O
EC
D/IE
A, 2
011

PREFACE
Part A of thisWEO (Chapters 1 to 6) presents a comprehensive overview of our energyprojections to 2035, in a fuel-by-fuel format which will be familiar to regular readers.
As last year, we present the results of modelling three scenarios: the Current PoliciesScenario, the New Policies Scenario and the 450 Scenario (a title derived from theobjective of limiting the concentration of greenhouse gases in the atmosphere to nomore than 450 parts per million).
We also examine a number of plausible variations on these central scenarios: a LowGDP Case, a Deferred Investment Case (deferred investment in oil in the Middle Eastand North Africa), a Golden Age of Gas (a more optimistic scenario for natural gas,summarised and updated from a separate publication in theWEO series in June 2011),a Delayed Carbon Capture and Storage Case, and a Low Nuclear Case (see Part D,Chapter 12).
Chapter 1 describes the methodological framework and the assumptions that underpinthe scenarios, commenting on changes sinceWEO-2010. Chapter 2 surveys global trendsin the demand and supply of all fuels in all scenarios, but with a special emphasis on theNew Policies Scenario. The results are given fuel-by-fuel, sector-by-sector and region-by-region. Production prospects, investment in the energy supply infrastructure, changes ininter-regional trade and the outlook for energy-related emissions are all covered.
Chapters 3 to 6 deal in detail with oil, natural gas, electricity and renewables and climatechange (with special emphasis in Chapter 6 on the 450 Scenario). This year coal has beengiven special attention in its own right (see Part C).
PART AGLOBAL ENERGY TRENDS
© O
EC
D/IE
A, 2
011

© O
EC
D/IE
A, 2
011

Chapter 1 - Context and analytical framework 49
CHAPTER 1
H I G H L I G H T S
CONTEXT AND ANALYTICAL FRAMEWORK
What’s driving energy markets?
! WEO-2011 assesses the implications for global energy markets to 2035 of alternativeassumptions about energy and climate policy. The New Policies Scenario – the centralscenario in this Outlook – takes into account recently announced commitments andplans, even if they are yet to be formally adopted and implemented. The Current PoliciesScenario takes account only of those policies that had been enacted by mid-2011. The450Scenario, sets out an illustrative energypathway that is consistentwith a50%chanceofmeeting the goal of limiting the increase in average global temperature to 2°C.
! The rate of growth inworld GDP – a fundamental driver of energy demand – is assumedto average 3.6% per year over the period 2009 to 2035 in all scenarios. Non-OECDcountries account for over 70% of the increase in global economic output, pushing theirshare of global GDP from almost 45% today to over 60% in 2035. China alone makes up31%of the increase in global GDP to 2035 and India a further 15%.
! Population growth will continue to underpin rising energy demand. The world’spopulation is assumed to increase by 26%, from 6.8 billion in 2009 to 8.6 billion in 2035,with over 90% of the increase in non-OECD regions. The annual increase in the world’spopulation slows progressively, from78million in 2010 to 56million in 2035.
! Energypriceswill continue tohaveamajor impacton futuredemandandsupplypatterns.In the New Policies Scenario, the IEA crude oil import price is assumed to approach$120/barrel (in year-2010 dollars) in 2035. The price rises more rapidly in the CurrentPolicies Scenario and more slowly in the 450 Scenario. Natural gas prices broadly followthe trend inoil prices, butonanenergy-equivalentbasis their ratio remains lower than thehistorical average. Coal prices risemuch less than oil and gas prices. In the 450 Scenario, itis assumedthat retail prices foroil-based transport fuels, despite lowerglobaldemand,areheld by government action at levels similar to the Current Policies Scenario.
! Some countries have already imposed a price on CO2 emissions and certain others areassumed to follow suit (through taxation, cap-and-trade schemes or some equivalent).TheCO2prices in2035areassumed to range from$30 to$45/tonne (in year-2010dollars)in theNewPolicies Scenario, and from$95 to $120/tonne in the 450 Scenario.
! Rates of technological development and deployment, and their impact on energyefficiency, vary across the three scenarios. For example, carbon capture and storagetechnologies andelectric vehicles aredeployedonavery limited scale in theNewPoliciesScenario, but both play more significant roles in the 450 Scenario. No completely newtechnologies are assumed to be deployed at substantial levels.
© O
EC
D/IE
A, 2
011

50 World Energy Outlook 2011 - GLOBAL ENERGY TRENDS
IntroductionAlthough the years 2008 to 2010 were considered to be a turbulent period in global energymarkets, new uncertainties have arisen from events in 2011. The “Arab Spring” – an outbreakof civil unrest and protests that started in Tunisia in December 2010 and quickly spread acrossparts of the Middle East and North Africa – had major implications throughout the region andinternationally, including by leading to an almost complete halt to the supply of oil from Libya,prompting International EnergyAgency (IEA)member countries to releaseemergency stocks foronly the third time in the organisation’s history. In addition to their tragic human consequences,the devastating earthquake and tsunami in Japan inMarch accentuated the tightening of globalenergy markets that was already underway and raised new questions about the longer-termprospects for nuclear power in Japan and in other parts of the world. Energy prices remainedpersistently high throughout the first half of 2011, before falling in late August at the prospectof Libyan crude oil returning to the market and growing doubts about the state of the globaleconomic recovery. And, in the midst of global irresolution about the scale and urgency of thechallengeweface inmanaging the risks fromclimatechange,databecameavailable that indicatethat carbon-dioxide (CO2) emissions are rising at the quickest rate in history.
Incorporating these and other developments, WEO-2011 provides a full update ofenergy demand and supply projections to 2035. The first part (Part A) analyses thepossible evolution of energy markets to 2035 under three different scenarios. Consistentwith past editions of the Outlook, the core scenarios rest on common assumptionsabout macroeconomic conditions and population growth, while their assumptions aboutgovernment policy differ –which in turn affects energy prices and technology deployment.For each of the scenarios, detailed projections are presented of trends in energy demandand supply, as well as energy infrastructure investment, by fuel, region and sector.1 Wealso investigate the implications of these trends for CO2 emissions and local pollution, andanalyse issues surrounding high-carbon infrastructure “lock-in”, including the cost thatwould be incurred if it became necessary to retire early, or retrofit, energy-related capitalwith long lifetimes in order to meet climate imperatives. The results of this analysis areintended to provide a sound quantitative framework for assessing and comparing possiblefuture trends in energy markets and the cost-effectiveness of new policies to tackle energysecurity and environmental concerns.
The uncertainty facing the world today makes it wise to consider how unexpected eventsmight change the energy landscape. Therefore, in addition to the three full scenarios,Part A (Chapters 1 to 6), also includes numerous sensitivity cases analysing the effects ofpossible high-impact events that could dramatically change the future course of energymarkets. For example, in Chapter 2, we analyse the impact of slower economic growth inthe period to 2015, to illustrate the possible consequences for the energy sector of anothereconomic downturn. In Chapter 3, we present a Deferred Investment Case, which, in thewake of a number of developments including the Arab Spring, looks at the implications of apossible shortfall over the next few years in upstream oil and gas investment in the Middle
1. Since the last Outlook, regional disaggrega"on has been updated to enable account to be taken of the accession ofChile, Estonia, Israel and Slovenia to the OECD; see Annex C for full details of the new groupings.
© O
EC
D/IE
A, 2
011

Chapter 1 - Context and analytical framework 51
1East and North Africa, a region that is expected to deliver a growing share of the world’shydrocarbons in the coming decades. In Chapter 4we consider the implications of a “GoldenAge of Gas” alongside more conservative projections. And in Chapters 6 and 12 we analysethe implications for achieving ambitious climate goals if certain key energy technologies,including carbon capture and storage (CCS) and nuclear power, are developed and deployedmore slowly.
Consistent with past practice, we offer in Part B of this year’s Outlook an in-depth analysisof the prospects for energy supply and use in a single country, this time Russia, whichis the one of the world’s largest energy producers. This includes an assessment of thecountry’s domestic energy needs and the outlook for the production and export of oil andgas, investment needs and constraints and the implications of energy developments in thecountry for global energy security and environmental sustainability. In amanner comparableto the analysis of renewables in 2010, natural gas in 2009 and oil in 2008, Part C providesan expanded assessment of the prospects for a particular fuel, this time coal. We look atglobal demand and supply issues, the evolution of traded coal markets and the adequacy ofinvestment through the production and delivery chain.Manywould argue that this focus oncoal is long overdue: in 2000 to 2010, the increase in global coal demand was almost equalto that of all other forms of energy combined.
Part D of the report takes a detailed look at three special topics which are of high currentrelevance. First, in Chapter 12, we present a Low Nuclear Case, which investigates theimplications for global energy balances of a possible collapse in the expansion of nuclearpower capacity worldwide, following the accident at the Fukushima Daiichi nuclear plant inJapan. Second, in Chapter 13, we intensify the establishedWEO practice of highlighting thekey strategic challenge of energy poverty, this time by identifying possible means of raisingand administering the finance required to deliver energy to those who would otherwisehave no access to it. This analysis was first released as a special input to a high-level meetinghosted by the government of Norway, in Oslo on 10 October 2011, that brought togetherHeads of State, international institutions and other key stakeholders to consider how toaccelerate progress towards universal energy access as part of a broader push to achievehealth and development goals. In Chapter 14, we provide an update of the IEA’s continuingwork on subsidies to both fossil fuels and renewables. This chapter is aimed at encouragingaction to reform fossil-fuel subsidies globally, while highlighting the important role thatwell-designed incentives can play in developing and deploying cleaner and more efficienttechnologies in order to reduce greenhouse-gas emissions and pollution, and to diversifythe energy mix.
Defining the scenariosThree scenarios are presented in this year’sOutlook: the New Policies Scenario, the CurrentPolicies Scenario and the 450 Scenario. In each case, what is offered is a set of internallyconsistent projections: none should be considered as a forecast. The projection period runsto 2035. The starting year is 2010, as historical market data for all countries were availableat the time of writing only up to 2009 (although preliminary data for 2010 were available
© O
EC
D/IE
A, 2
011

52
World
EnergyO
utlook2011
-GLO
BALEN
ERGY
TREND
S
Table 1.1 ! Selected key policy assumptions by scenario and region*
Current Policies Scenario New Policies Scenario 450 Scenario
OECD Staggered introduction of CO2 prices in all countries;$100 billion annual financing provided to non-OECDcountries by 2020; on-road PLDV emissions average65 g/km in 2035.
United States New appliance standards; state-level support schemesfor renewables; enhanced CAFE standards; tax credits forrenewable energy sources.
Shadow price of carbon adopted from 2015, affectinginvestment decisions in power generation; new HDVstandards for each model year from 2014 to 2018; EPAregulations on mercury and other pollutants in the powersector.
A 17% reduction in CO2 emissions compared with 2005 by2020; CO2 pricing implemented from 2020.
Japan Long-Term Outlook on Energy Supply and Demand (2009),including reforms in steel manufacturing, support forrenewables generation and improved fuel efficiency forvehicles.
Implementation of Strategic Energy Plan**; shadowprice of carbon implemented from 2015, affecting newinvestment in power generation.
A 25% reduction in emissions compared with 1990 by2020; CO2 pricing implemented from 2020.
European Union ETS, covering power, industry and (from 2012) aviation;Energy Performance of Buildings directive; emissionsstandards for PLDVs. A 20% reduction in emissionscompared with 1990 by 2020; renewables to reach 20%share in energy demand in 2020.
ETS, covering power, industry and (from 2012) aviation;new LCV standards; more stringent PLDV standards.
A 30% reduction in emissions compared with 1990 by2020; ETS strengthened in line with the 2050 roadmap.
Australia,New Zealand
New Zealand: Domestic ETS from 2010. Australia: A 5% reduction in emissions compared with2000 by 2020; carbon tax from mid-2012 and domesticemissions trading from 2015. New Zealand: A 10% cut inemissions compared with 1990 by 2020.
Australia: A 25% reduction in emissions compared with2000 by 2020; New Zealand: A 20% reduction in emissionscompared with 1990 by 2020.
Korea A 30% reduction in emissions compared with business-as-usual by 2020; CO2 pricing from 2015.
A 30% reduction in emissions compared with business-as-usual by 2020; higher CO2 pricing.
*See Annex B for more details of the policy assump"ons across the three scenarios. **Following the Great East Japan Earthquake, Japan is undertaking a full review of its Strategic Energy Planwith results expected in 2012.
© OECD/IEA, 2011

Chapter1-Contextand
analyticalframew
ork5
3
1Table 1.1 ! Selected key policy assumptions by scenario and region (continued)
Current Policies Scenario New Policies Scenario 450 Scenario
Non-OECD Fossil-fuel subsidies are phased out in countries thatalready have policies in place to do so.
Fossil-fuel subsidies are phased out in all net-importingregions by 2020 (at the latest) and in net-exporting regionswhere specific policies have already been announced.
Receipt of finance to support domesticmitigation action;on-road PLDV emissions average 100 g/km in 2035.International sectoral agreements for iron and steel, andcement. Fossil-fuel subsidies are phased out in net-importingregions by 2020 and in net-exporting regions by 2035.***
China Implementation of measures in 12th Five-Year Plan,including 17% cut in CO2 intensity by 2015; solar additionsof 5 GW by 2015; wind additions of 70 GW by 2015 andstart construction of 120 GW of hydropower by 2015.
A 40% reduction in carbon intensity compared with 2005by 2020; CO2 pricing from 2020; a 15% share of non-fossilenergy in total energy supply by 2020; 70 to 80 GW ofnuclear power by 2020; 12th Five-Year Plan renewablestargets exceeded. PLDV fuel economy targets by 2015.
A 45% reduction in carbon intensity compared with2005 by 2020; higher CO2 pricing; enhanced support forrenewables.
India Trading of renewable energy certificates; measures undernational solar mission and national mission on enhancedenergy efficiency (Perform Achieve and Trade [PAT]scheme for industry).
A 20% reduction in CO2 intensity compared with 2005 by2020; proposed auto fuel-efficiency standards; 20 GW ofsolar energy production capacity by 2022.
A 25% reduction in CO2 intensity compared with 2005 by2020; expanded feed-in tariffs for renewables.
Brazil Solar incentives; ethanol targets in road transport(20% to 25%).
A 36% reduction in emissions compared with business-as-usual by 2020; increase of electricity generation fromrenewable sources.
A 39% reduction in emissions compared with business-as-usual by 2020; increased generation from renewablesources; CO2 pricing from 2020.
Russia(see alsoChapter 7)
Gradual real increases in residential gas and electricityprices (1% per year) and average gas price paid byindustry (1.5%); implementation of 2009 energy efficiencylegislation.
A 2% per year real increase in residential gasand electricity prices; industrial gas prices reachthe equivalent of export prices (minus taxes andtransportation) in 2020; implementation of measuresincluded in the 2010 energy efficiency state programme.
Faster liberalisation of residential gas and electricityprices; CO2 pricing from 2020; full implementation ofmeasures included in the 2010 energy efficiency stateprogramme; stronger support for nuclear power andrenewables.
***Except theMiddle East where subsidisation rates are assumed to decline to a maximum of 20% by 2035.Notes: Pricing of CO2 emissions is either by an emissions trading scheme (ETS) or carbon taxes. PLDV = Passenger light-duty vehicle; LCV= Light commercial vehicle;HDV = Heavy-duty vehicle; and CAFE = Corporate Average Fuel Economy.
© OECD/IEA, 2011
54 World Energy Outlook 2011 - GLOBAL ENERGY TRENDS
in many cases and have been incorporated).2 Assumptions about government policies arecritical to the three scenarios and over 3 000 policies and measures in OECD and non-OECDcountries have been considered during their preparation.3 A summary of some of the keypolicy targets andmeasures, by scenario, is set out in Table 1.1; more detailed assumptionscan be found in Annex B.
The New Policies Scenario – the central scenario of this Outlook – incorporates the broadpolicy commitments and plans that have been announced by countries around the worldto tackle energy insecurity, climate change and local pollution, and other pressing energy-related challenges, even where the specific measures to implement these commitmentshave yet to be announced. Those commitments include renewable energy and energy-efficiency targets and support, programmes relating to nuclear phase-out or additions,national pledges to reduce greenhouse-gas emissions communicated officially under theCancun Agreements and the initiatives taken by G-20 and APEC economies to phase outinefficient fossil-fuel subsidies that encouragewasteful consumption. This scenario providesa benchmark to assess the achievements and limitations of recent developments in climateand energy policy. Asmany of the formal commitments that have beenmodelled in theNewPolicies Scenario relate to the period to 2020, we have assumed that additional unspecifiedmeasures are introduced that maintain through to 2035 a similar trajectory of globaldecline in carbon intensity – measured as emissions per dollar of gross domestic product.International sectoral agreements are assumed to be implemented across several industries,including cement and light-duty vehicles.
As only limited details are available formany of the initiatives considered in the NewPoliciesScenario, the extent to which they will actually be implemented is uncertain. Some targetsare conditional on financial transfers from Annex I to non-Annex I countries or commitmentto comparable emissions reductions by a set of countries, while other commitmentsinvolve a range. Some pledges relate to energy or carbon intensity, rather than absolutereductions in emissions. As a result, it is far from certain what these commitments willmean for emissions, even if they are met fully. Similarly, following the G-20 and APECcommitments on fossil-fuel subsidies, many countries have started to implement, or haveproposed, reforms to bring their domestic energy prices into line with the levels that wouldprevail in a less distorted market, but the success of these reforms is very uncertain, in theface of steep economic, political and social hurdles. Furthermore, it is uncertain what newaction governments may decide to take in the coming years (particularly post-2020) asperceptions of risk and threat change, and what implications these policies might have forgreenhouse-gas emissions. To allow for all these uncertainties, the New Policies Scenarioadopts a pragmatic approach by assuming cautious implementation of recently announcedcommitments and plans. In countries where uncertainty over climate policy is very high, it isassumed that the policies adopted are insufficient to reach their target.
2. As a result of the 2008/2009 economic crisis, world primary energy consump"on fell by 1.1% in 2009, the first declineof any significance since 1981. Although the economic recovery is s"ll rather sluggish, preliminary data suggest thatglobal energy demand rebounded by a remarkable 5% in 2010.3. TheWEO Policy Database is available at www.iea.org/textbase/pm/?mode=weo .
© O
EC
D/IE
A, 2
011

Chapter 1 - Context and analytical framework 55
1The New Policies Scenario should not be read as a forecast. Even though it is likely that manygovernments around theworldwill take firmpolicy action to tackle increasing energy insecurity,local pollution, climate change and other energy-related problems, the policies that are actuallyput in place in the coming years will certainly differ from those assumed in this scenario. Onthe one hand, governments may decide to take stronger action to implement their currentcommitments than assumed in this scenario and/or may adopt even more stringent targets.On the other hand, it is quite possible that some governmentswill fail to implement the policiesrequired tomeet even their current pledges.WEO-2011 also presents updated projections for the Current Policies Scenario (called theReference Scenario prior toWEO-2010) to show how the future might look on the basis of theperpetuation,without change, of the government policies andmeasures that hadbeenenactedor adopted by mid-2011. A number of the policy commitments and plans that were includedin the New Policies Scenario in WEO-2010 (IEA, 2010a) have since been enacted so are nowincluded in the Current Policies Scenario in this Outlook. These include, for example, China’s12th Five-Year Plan for the period 2011 to 2015; a new scheme in India that enables trading ofrenewableenergycertificatesandanewprogrammeof support foralternative fuel vehicles;newEU directives covering the energy performance of buildings and emissions standards for light-commercial vehicles; and newappliance standards in theUnited States.
The Outlook presents, in Chapter 6, updated projections for the 450 Scenario, which sets out anenergy pathway that is consistent with a 50% chance of meeting the goal of limiting the increasein average global temperature to two degrees Celsius (2°C), compared with pre-industriallevels. According to climate experts, to meet this goal it will be necessary to limit the long-termconcentration of greenhouse gases in the atmosphere to around 450 parts permillion of carbon-dioxideequivalent (ppmCO2-eq). For theperiod to2020, the450Scenarioassumesmorevigorouspolicy action to implement fully the Cancun Agreements than is assumed in the New PoliciesScenario (which assumes cautious implementation). After 2020, OECD countries and othermajor economies are assumed to set economy-wide emissions targets for 2035 and beyond thatcollectively ensure an emissions trajectory consistent with stabilisation of the greenhouse-gasconcentrationat450ppm.
Themost significant change in the450Scenario comparedwithWEO-2010 relates to the startingpoint for emissions: after adip in2009, causedby theglobal financial crisis, emissions climbedbya record 5.3% in 2010, reaching 30.4 gigatonnes (Gt). This higher starting pointmeans that evenbigger emissions reductions will be needed in the future in order to limit the global increase intemperature to 2°C. Furthermore, with another year passing, the difficulty and cost of meetingambitiousclimategoalshasbeen increasedasongoing investmentshave“locked in”high-carboninfrastructure. The 450 Scenario is nowmore demanding than itwas just twelvemonths ago.
Main non-policy assumptions
Economic growth
Today, four years on from the start of the global financial crisis, there remain persistentdoubts about the sustainability of the global economic recovery. Projections from the
© O
EC
D/IE
A, 2
011

56 World Energy Outlook 2011 - GLOBAL ENERGY TRENDS
International Monetary Fund (IMF), at the time of writing, show global gross domesticproduct (GDP) growing by around 4.0% in 2011 and 2012 fromover 5.0% in 2010 (IMF, 2011).These aggregate numbers mask considerable divergence in expected performance acrossregions: the advanced economies (essentially those of the OECD) are projected to grow byjust 1.5% in 2011, compared with 6.0% in the emerging economies. Moreover, it appearsthat the risks are to the downside, and it is quite possible that the IMF and other forecastingbodies will revise down their projections for GDP growth for 2011 and 2012 (see Box 2.1 inChapter 2).
The economic outlook has been clouded primarily by worries in OECD countries aboutsovereign and private-sector indebtedness, the effect on the banking sector of possiblesovereign debt defaults and how plans to reduce deficits and debts will affect futureeconomic growth. In many advanced economies, fiscal adjustment in the wake of theglobal financial crisis is underway, reducing budget deficits and stemming the rise ofgovernment debt to GDP ratios; but some countries are continuing to struggle to put theirfinances in order. Recent economic concerns have focused particularly on weaker thanexpected economic activity in the United States and related uncertainty over plans for fiscalconsolidation, and the fiscal challenges facing a number of countries in Europe. Economicrisks are also evident in some emerging and developing economies, with signs of potentialoverheating.
The rise in oil prices since September 2010 has fed concerns about near-term economicprospects. Oil prices dropped somewhat from early August 2011, following weaker economicdata fromUnited States andEurope andonpromising signs of a resumptionof oil exports fromLibya, but they remain high by historical standards. Were the average IEA crude oil importprices of $100per barrel over the first half of the year to persist through to the endof the year,spending on imports by the OECD –which is set to import almost 60% of its oil needs in 2011– would amount to 2.2% of its GDP. The share of GDP spent on oil imports is generally evenhigher in oil-importing developing countries, because their economies are typically more oilintensive. Higher oil prices have weighed on growth in oil-importing countries by consuminga greater proportion of household and business expenditure. They have also put upwardpressure on inflation, both directly, through increases in fuel prices, and indirectly, as pricesof other goods have risen to reflect the higher input costs. The recent growth in productionof biofuels that compete with food use, like corn-based ethanol, has arguably strengthenedthese links. Inflationary impacts have been most pronounced in the emerging economies,particularly in Asia, energy weighs relatively heavily in domestic consumer price indices.Globally, the net economic loss engendered by higher prices has been only partly offset by theoil-producing countries “recycling” some of their surplus export revenues back into the globaleconomy in the form of increased imports of goods and services.
The civil unrest that has swept through some parts of the Middle East and North Africa(MENA) region, which is responsible for around 35% and 20% of the world’s oil and naturalgas output respectively, since December 2010 has contributed to higher energy prices andany worsening of the unrest or its spread to major exporting countries in the region couldlead to a surge in prices sufficient to tip the global economy back into recession. The unresthas led a number of Gulf States to boost significantly public spending, including spending
© O
EC
D/IE
A, 2
011

Chapter 1 - Context and analytical framework 57
1on welfare programmes. While this is likely to lead to greater demand for importedgoods (which will reduce the global economic impact of high prices) it also means that oilproducers may need yet higher oil prices in the future in order to keep their budgets inbalance. InmanyOPEC countries, the current budget breakeven oil price is typically between$70/barrel and $90/barrel (see Chapter 3).
In this Outlook, world GDP (expressed in real purchasing power parity, or PPP, terms4) isassumed to grow by an average of 3.6% per year over the period 2009 to 2035, comparedwith 3.1% from 1990 to 2009 (Table 1.2). Assumed growth is somewhat higher than inlast year’s Outlook, in part due to the lower 2009 base. The medium-term GDP growthassumptions are based primarily on IMF projections, with some adjustments to reflectmore recent information available for the OECD (OECD, 2011) and other countries fromnational and other sources. Longer-term GDP assumptions are derived from an assessmentof historical growth rates and expectations for the growth in labour supply and the speedat which labour productivity improves. The risk of slower GDP growth in the near term isexamined in a sensitivity analysis, the results of which are set out in Chapter 2.
Consistent with the pattern of recent decades, the non-OECD countries are assumed toremain the main engine of global economic growth, lifting their share of world GDP from44% in 2010 to 61% in 2035 (compared with 33% in 1985). China and India are expectedto continue to grow faster than countries in other regions, followed by the Middle Eastcountries. China’s growth rate slows from 8.1% per year in the period 2009 to 2020 to4.3% per year in 2020 to 2035, less than half the rate at which it has been growing in recentyears. India displaces China in the early 2020s as the fastest-growing country, the resultof demographic factors and its earlier stage of economic development. India’s growthnonetheless slows from 7.7% per year in 2009 to 2020 to 5.8% per year in 2020 to 2035.Among the OECD regions, OECD Americas continues to grow fastest, at 2.4% per year onaverage over the projection period, buoyed by more rapid growth in its population andlabour force. Europe and Asia Oceania are expected to see the lowest GDP growth of any ofthe major regions.
The energy projections in the Outlook are highly sensitive to these underlying assumptionsabout GDP growth. Historically, energy demand has tended to rise broadly in line with GDPand economic downturns have been linkedwith a flattening or reduction of growth in energyusage. The so-called income elasticity of energy – the increase in energy demand relativeto GDP – has gradually declined over time and has actually reversed in some developedcountries. In most cases, it tends to be higher for countries at an early stage of economicdevelopment than for more mature economies. This can be explained by differences inthe structure of economic output and the curtailing of income-driven increases in demandthrough efficiency improvements and saturation effects.
4. Purchasing power pari"es (PPPs) measure the amount of a given currency needed to buy the same basket of goodsand services, traded and non-traded, as one unit of the reference currency, in this report, the US dollar. By adjus"ng fordifferences in price levels, PPPs, in principle, can provide a more reliable indicator than market exchange rates of thetrue level of economic ac"vity globally or regionally and, thus, help in analysing the main drivers of energy demand andcomparing energy intensi"es across countries and regions.
© O
EC
D/IE
A, 2
011

58 World Energy Outlook 2011 - GLOBAL ENERGY TRENDS
Table 1.2 ! Real GDP assumptions by region ($2010 trillion)
2009 2015 2020 2035 2009-2020* 2009-2035*
OECD 39.9 46.5 51.8 69.4 2.4% 2.2%
Americas 17.3 20.5 23.2 32.4 2.7% 2.4%
United States 14.3 16.8 18.9 26.2 2.6% 2.4%
Europe 16.1 18.3 20.3 26.7 2.1% 2.0%
Asia Oceania 6.5 7.6 8.4 10.3 2.3% 1.8%
Japan 4.1 4.7 5.0 5.9 1.7% 1.4%
Non-OECD 30.9 45.5 59.4 106.8 6.1% 4.9%
E. Europe/Eurasia 3.7 4.8 5.8 9.3 4.1% 3.6%
Russia 2.1 2.8 3.3 5.4 4.1% 3.6%
Asia 17.6 28.2 38.5 73.6 7.4% 5.7%
China 9.4 15.9 22.3 41.6 8.1% 5.9%
India 3.7 6.0 8.3 19.4 7.7% 6.6%
Middle East 2.4 3.1 3.8 6.6 4.3% 4.0%
Africa 2.9 3.9 4.7 7.3 4.6% 3.7%
Latin America 4.3 5.6 6.6 10.0 4.0% 3.3%
Brazil 2.0 2.7 3.2 5.1 4.3% 3.6%
World 70.8 92.0 111.2 176.2 4.2% 3.6%
European Union 14.9 16.8 18.5 24.3 2.0% 1.9%
*Compound average annual growth rate.Notes: Calculated based on GDP expressed in year-2010 dollars at constant purchasing power parity. The assumedrates of economic growth for 2009 to 2035 are the same for all three scenarios presented in thisOutlook.Sources: IMF, OECD andWorld Bank databases; IEA databases and analysis.
Assumptions about GDP growth are the same in each of the three scenarios modelled inWEO-2011. In reality, the fundamental energy system transformation that takes place inthe 450 Scenario or the higher energy prices in the Current Policies Scenario could haveat least temporary adverse impacts on GDP growth. In the case of the 450 Scenario, thehigher economic cost associated with the shift in investment to low-carbon technologiescould depress GDP growth, though the economic benefits that would accrue from reducedenvironmental damage could offset or perhaps even outweigh these direct GDP losses.For reasons such as this and to facilitate comparison between scenarios, the simplifyingassumption has been adopted that GDP growth rates remain unchanged.
Population
Population growth is a key driver of future energy trends as the level of population hasa direct effect on the size and composition of energy demand and an indirect effect byinfluencing economic growth and development. Based on the latest United Nationsprojections, in each of the three scenarios world population grows from an estimated
© O
EC
D/IE
A, 2
011

Chapter 1 - Context and analytical framework 59
16.8 billion in 2009 to around 8.6 billion in 2035, an average rate of increase of 0.9% per year(Table 1.3) (UNPD, 2011). In line with the long-term historical trend, the population growthrate slows progressively over the projection period, from 1.1% per year in 2009 to 2020 to0.8% in 2020 to 2035. However, this means that by 2035, the annual increase in populationis still 56 million, compared with 78 million in 2010.
Table 1.3 ! Population and urbanisation assumptions by region
Population growth* Population (million) Urbanisation rate (%)
2009-2020 2020-2035 2009-2035 2009 2035 2009 2035
OECD 0.5% 0.3% 0.4% 1 229 1 373 77% 84%
Americas 0.9% 0.7% 0.8% 470 571 81% 87%
United States 0.8% 0.7% 0.7% 312 377 82% 88%
Europe 0.4% 0.2% 0.3% 557 599 74% 82%
Asia Oceania 0.2% -0.1% 0.0% 203 203 73% 81%
Japan -0.1% -0.4% -0.3% 127 118 67% 75%
Non-OECD 1.2% 0.9% 1.0% 5 536 7 183 44% 57%
E. Europe/Eurasia 0.1% -0.1% 0.0% 335 331 63% 70%
Russia -0.1% -0.4% -0.3% 142 133 73% 78%
Asia 0.9% 0.6% 0.7% 3 546 4 271 38% 53%
China 0.4% 0.0% 0.1% 1 338 1 387 46% 65%
India 1.3% 0.9% 1.0% 1 155 1 511 30% 43%
Middle East 1.9% 1.4% 1.6% 195 293 66% 74%
Africa 2.3% 2.0% 2.1% 1 009 1 730 39% 53%
Latin America 1.0% 0.7% 0.8% 451 558 79% 86%
Brazil 0.8% 0.4% 0.6% 194 224 86% 92%
World 1.1% 0.8% 0.9% 6 765 8 556 50% 61%
European Union 0.3% 0.1% 0.2% 501 521 74% 81%
*Compound average annual growth rates.Note: The assumed rates of popula"on growth for 2009 to 2035 are the same for all three scenarios presented in thisOutlook.Sources: UNPD andWorld Bank databases; IEA analysis.
The increase in global population is expected to occur overwhelmingly in non-OECDcountries, mainly in Asia and Africa, pushing the OECD’s share of global population downfrom 18% today to just 16% in 2035. Both India (1.5 billion people) and China (1.4 billionpeople) will have larger populations than the entire OECD by 2035. The population of Russiafalls marginally through the Outlook period. The population of the OECD increases, but byonly 0.4% per year on average over 2009 to 2035. Most of the increase in the OECD occursin the OECD Americas. Slower growth in population contributes to slower projected rates ofincrease in energy demand in the OECD than in the rest of the world.
© O
EC
D/IE
A, 2
011

60 World Energy Outlook 2011 - GLOBAL ENERGY TRENDS
The number of people living in urban areas worldwide is projected to grow by 1.9 billion,from 3.4 billion in 2009 to 5.3 billion in 2035. Rates of urbanisation remain an importantdeterminant of energy demand, as energy use is related to income, and city and towndwellers in the developing world tend to have higher incomes and better access to energyservices. The income effect usually outweighs any efficiency gains that come from higherdensity settlements in urban areas. Because of the rapid growth of cities and towns in thedeveloping world, the pattern of energy use in towns will increasingly shape global energyuse, though the rural/urban differential is expected to diminish somewhat. By contrast, cityand rural residents in developed countries tend to enjoy similar levels of energy service.
Box 1.1 ! How does the IEA model long-term energy trends?
The projections for all three scenarios presented in WEO-2011 are derived from theIEA’s World Energy Model (WEM) – a partial equilibrium model designed to replicatehow energy markets function over the medium and longer term. Developed over manyyears, the WEM consists of six main modules: (i) final energy demand (with sub-modelscovering residential, services, agriculture, industry, transport and non-energy use);(ii) power generation and heat; (iii) refining/petrochemicals and other transformation;(iv) oil, natural gas, coal, and biofuels supply; (v) CO2 emissions; and (vi) investment.
TheWEM is designed to analyse:! Global energy prospects: These include trends in demand, supply availability
and constraints, international trade and energy balances by sector and by fuel(currently through to 2035).
! Environmental effects of energy use: CO2 emissions from fuel combustion arederived from the detailed projections of energy consumption.
! Effects of policy actions and technological changes: Scenarios and cases are usedto analyse the impact of policy actions and technological developments on energydemand, supply, trade, investment and emissions.
! Investment in the energy sector: Themodel evaluates the investment requirementsin the fuel-supply chain needed to satisfy projected energy demand. It alsoevaluates demand-side investment requirements.
Since the last Outlook, regional disaggregation of the WEM has been enhanced totake account of the accession of Chile, Estonia, Israel and Slovenia to the OECD. Themodel now produces energy-demand projections for eleven specific countries and afurther fourteen regional groupings. On the supply side, projections for oil, gas, coaland biofuels are derived for all major producers.
Assumptions based on analysis of the latest developments in energy markets, thebroader economy and energy and climate policy, are used as inputs to the WEM,together with huge quantities of historical data on economic and energy variables.Much of the data is obtained from the IEA’s own databases of energy and economicstatistics (www.iea.org/statistics). Additional data from a wide range of externalsources is also used. These sources are indicated in the relevant sections of this report.
© O
EC
D/IE
A, 2
011

Chapter 1 - Context and analytical framework 61
1Energy prices
The evolution of energy prices is a key determinant of energy trends, as the actual pricespaid by energy consumers affect how much of each fuel they wish to consume and howmuch it is worth investing in improving the efficiency of a particular technology used toprovide an energy service. International energy prices are an exogenous (i.e. external)determinant of energy demand and supply in the World Energy Model, the model usedto derive the WEO-2011 projections (Box 1.1). However, the model is run in an iterativemanner, adjusting prices so as to ensure demand and supply are in balance in each year ofthe projection period.
The assumed energy price paths should not be interpreted as forecasts. Rather, they reflectour judgement of the prices that would be needed to encourage sufficient investment insupply to meet projected demand over theOutlook period. Although the price paths followsmooth trends, this should not be taken as a prediction of stable energymarkets. Prices will,in reality, deviate from these assumed trends, widely at times, in response to short-termfluctuations in demand and supply and to geopolitical events. The price assumptions differacross the three scenarios, reflecting the impact policy-driven reductions in demand wouldbe likely to have.
TheWEO-2011 projections are based on the average retail prices of each fuel used in end-use, power generation and other transformation sectors. These prices are derived fromassumptions about the international prices of fossil fuels and take into account domesticsupply and demand conditions (as these continue to set prices in many cases, such as, forexample, natural gas in the United States and coal in parts of China). End-user prices takeaccount of any taxes, excise duties and carbon-dioxide emissions pricing, as well as anysubsidies. In all scenarios, the rates of value-added taxes and excise duties on fuels areassumed to remain unchanged throughout the Outlook period. End-user electricity pricesare based on the costs of generation, the costs of transmission and distribution and the costsassociatedwith operating the electricity system and supplying customers (such as billing andmetering). In addition, electricity prices in each region are increased or reduced to reflecttaxes and subsidies for end-users and, in some cases, the inclusion in prices of a contributiontowards renewables subsidies.
Oil prices
Oil prices have remained extremely volatile over the past year. By late September 2011,prices for benchmark Brent and West Texas Intermediate (WTI) futures were trading ataround $110/barrel and $86/barrel respectively. Prices rose strongly over the second half of2010 and through to April 2011, driven by tightening supply and demand fundamentals (inpart, due to the loss of most production in Libya) and fears that the turmoil in parts of theMiddle East and North Africa could spread to other major producers.
In this Outlook, oil prices are assumed to rise steadily to 2035 in all but the 450 Scenario,as rising global demand requires the development of increasingly expensive sources of oil(see Chapter 3). The level of prices needed to match oil supply and demand varies with
© O
EC
D/IE
A, 2
011

62 World Energy Outlook 2011 - GLOBAL ENERGY TRENDS
the degree of policy effort made to curb demand growth (Figure 1.1). In the New PoliciesScenario, the average IEA crude oil import price – a proxy for international oil prices –reaches $109/barrel (in real 2010 dollars) in 2020 and $120/barrel in 2035 (Table 1.4).5, 6 Innominal terms, the price essentially doubles compared with current levels, to $212/barrelin 2035. In our Deferred Investment Case presented in Chapter 3, in which we assumethat MENA upstream investment is one-third below the level called for in the New PoliciesScenario over the period 2011 to 2020, real prices jump to $150/barrel, before falling backas production recovers. In the Current Policies Scenario, substantially higher oil prices thanthose in the New Policies Scenario are needed to balance supply with the higher level ofdemand. The crude oil price rises briskly, especially after 2020, reaching $118/barrel in 2020and $140/barrel in 2035. In the 450 Scenario, by contrast, lower oil demandmeans there isless need to produce oil from costly fields higher up the supply curve in non-OPEC countries(see Chapter 6 for details of the drivers of oil demand in this scenario). As a result, the oilprice is assumed to level off at about $97/barrel by 2015 and tomaintain that level throughto 2035. Importantly, in the 450 Scenario, administrative arrangements are assumed to beput in place to keep end-user prices for oil-based transport fuels at a level similar to theCurrent Policies Scenario. This assumption ensures that the lower international prices thatresult from policy action over and above that assumed in the Current Policies Scenario donot lead to a rebound in transport demand through lower end-user prices.
Figure 1.1 ! Average IEA crude oil import price
0
30
60
90
120
150
1980 1990 2000 2010 2020 2030 2035
Dollarspe
rbarrel(2
010) Current Policies
Scenario
New PoliciesScenario
450 Scenario
5. In 2010, the average IEA crude oil import price was $1.50/barrel lower than first-month WTI and $2.20/barrel lowerthan Brent.6. The price assump"ons u"lised in WEO-2011 differ from those in the IEA’s Medium-Term Oil and Gas Markets 2011(MTOGM) (IEA, 2011). The main reason is that theMTOGM assumes prices in line with those prevailing on the futurescurve out to 2016 at the "me the projec"ons are made, in order to iden"fy what this price trajectory (together withother assump"ons, notably about GDP) would mean for market balances. So the projec"ons are not intended to reflecta market equilibrium. By contrast, markets are assumed to balance in the WEO-2011 projec"ons. For this reason, theWEO andMTOMR projec"ons are not strictly comparable.
© O
EC
D/IE
A, 2
011

Chapter 1 - Context and analytical framework 63
1Natural gas prices
Historically, natural gas prices in OECD countries have been closely correlated to oilprices through indexation clauses in long-term supply contracts or indirectly throughcompetition between gas and oil products in power generation and end-use markets. InEurope, some two-thirds of the continent’s gas is supplied under long-term contracts,whereby the gas price is indexed to oil prices, with a lag of several months (although adegree of indexation to spot gas prices has been introduced in some contracts). Prices inAsia are also predominately set under long-term contracts that are indexed to crude oil.However, in a growing number of markets, gas prices are set freely in a competitive gasmarket, an approach known as gas-to-gas competition. Prices are set in this way in NorthAmerica, the United Kingdom and Australia and, increasingly, in continental Europe,accounting for some three-quarters of total OECD gas use.
Differences in pricing mechanisms inevitably lead to differences in the actual level ofprices. When oil prices are high, as they are today, oil-indexed gas prices tend to be high.The level of gas prices under gas-to-gas competition depends on the supply/demandbalance in each regional market, including the prices of all competing fuels. In the pasttwo to three years, gas prices set this way have been significantly lower than oil-indexedprices both in the United States and in continental Europe. Nonetheless, differentialshave narrowed in Europe as spot prices have risen, with the rebound in demand, andthe price of alternative fuels (especially coal) has risen. Over the past few years,US natural gas prices have fallen relative to oil prices, because of a glut of gas causedby the boom in unconventional gas. We assume that North American gas pricesrecover slightly, relative to oil prices, over the projection period, largely reflecting ourexpectation that gas production costs there will tend to rise as production shifts to morecostly basins. The growing share of liquefied natural gas (LNG) in global gas supply andincreasing opportunities for short-term trading of LNG are expected to contribute toa degree of convergence in regional prices over the projection period, but significantprice differentials between the United States, Europe and Japan are expected to remain,reflecting the relative isolation of these markets from one another and the cost oftransport between regions.
In this year’s Outlook, we have revised down our natural gas price assumptions in thethree main scenarios compared with WEO-2010, because of improved prospects for thecommercial production of unconventional gas. Although gas prices broadly follow thetrend in oil prices, the ratio of gas to oil prices on an energy-equivalent basis remainsbelow historical averages in all regions, particularly in North America (Figure 1.2).Gas prices are assumed to vary across the three scenarios in line with the degree ofpolicy effort to curb growth in energy demand. In the New Policies Scenario, prices reach$12 per million British thermal units (MBtu) in Europe, $14/MBtu in the Pacific and$9/MBtu in North America by 2035 (in real 2010 dollars). In the Golden Age of GasScenario (GAS Scenario) presented in Chapter 4, prices are assumed to be up to$1.50/MBtu lower than in the New Policies Scenario, largely because of the scenario’smore optimistic assumptions about future gas supply.
© O
EC
D/IE
A, 2
011

64
World
EnergyO
utlook2011
-GLO
BALEN
ERGY
TREND
S
Table 1.4 ! Fossil-fuel import price assumptions by scenario (dollars per unit)
New Policies Scenario Current Policies Scenario 450 Scenario
Unit 2010 2015 2020 2025 2030 2035 2015 2020 2025 2030 2035 2015 2020 2025 2030 2035
Real terms (2010 prices)
IEA crude oil imports barrel 78.1 102.0 108.6 113.6 117.3 120.0 106.3 118.1 127.3 134.5 140.0 97.0 97.0 97.0 97.0 97.0
Natural gas imports
United States MBtu 4.4 6.0 6.7 7.3 7.9 8.6 6.1 7.0 7.7 8.4 9.0 5.9 6.5 8.0 8.4 7.8
Europe MBtu 7.5 9.6 10.4 11.1 11.7 12.1 9.8 11.0 11.9 12.6 13.0 9.4 9.8 9.8 9.7 9.4
Japan MBtu 11.0 12.2 12.9 13.4 13.9 14.3 12.7 13.5 14.2 14.8 15.2 11.9 12.0 12.0 12.1 12.1
OECD steam coal imports tonne 99.2 103.7 106.3 108.1 109.3 110.0 104.6 109.0 112.8 115.9 118.4 100.3 93.3 83.2 73.7 67.7
Nominal terms
IEA crude oil imports barrel 78.1 114.3 136.4 159.8 184.9 211.9 119.1 148.2 179.1 211.9 247.2 108.7 121.8 136.4 152.9 171.3
Natural gas imports
United States MBtu 4.4 6.8 8.4 10.3 12.5 15.1 6.9 8.7 10.9 13.2 16.0 6.6 8.2 11.2 13.3 13.8
Europe MBtu 7.5 10.8 13.0 15.6 18.4 21.3 10.9 13.8 16.8 19.9 23.0 10.5 12.3 13.8 15.3 16.6
Japan MBtu 11.0 13.7 16.2 18.9 21.9 25.2 14.2 17.0 20.0 23.4 26.8 13.4 15.1 16.9 19.1 21.4
OECD steam coal imports tonne 99.2 116.2 133.5 152.0 172.2 194.2 117.2 136.8 158.6 182.6 209.0 112.4 117.2 117.0 116.1 119.5
Notes: Gas prices are weighted averages expressed on a gross calorific-value basis. All prices are for bulk supplies exclusive of tax. The US natural gas import price is used as aproxy for prices prevailing on the domes"c market. Nominal prices assume infla"on of 2.3% per year from 2010.
© OECD/IEA, 2011

Chapter 1 - Context and analytical framework 65
1Figure 1.2 ! Ratio of average natural gas and coal import prices to crude oil
prices in the New Policies Scenario
0
0.2
0.4
0.6
0.8
1.0
1.2
1.4
1990 2000 2010 2020 2030 2035
Fuelprice
divide
dbyo
ilprice Gas: Japan
Gas: Europe
Gas: United States
Coal: OECD
Note: Calculated on an energy-equivalent basis.
Steam coal prices
Historically, seaborne traded steam coal prices have broadly tended to follow oil and gasprices, reflecting the dynamics of inter-fuel competition and the importance of oil in thecost of transporting and mining coal, particularly in opencast mines. By contrast, pricesfor land-based traded steam coal do not always have a close link to oil and gas prices. Coalprices weakened relative to both oil and gas prices in the decade to 2010, partly as a resultof differences in market conditions among the different fuels and growing environmentalconstraints on coal use in OECD countries. However, coal prices have recently rebounded,with surging demand in China and other emerging economies.
Our international steam-coal price assumptions (which drive our assumptions aboutcoking coal and other coal qualities) vary markedly across the three scenarios presented inWEO-2011. Prices averaged $99 per tonne in 2010. In the New Policies Scenario, they areassumed to rise gradually throughout the projection period, reaching $110/tonne (in year-2010 dollars) by 2035. The increase is much less in percentage terms than that for oil or gaspartly because coal production costs are expected to remain low and because coal demandflattens out by 2020. Prices are higher in the Current Policies Scenario, reaching $118/tonneby 2035. By contrast, they are significantly lower in the 450 Scenario, dropping to $93/tonnein 2020 and $68/tonne in 2035, as a result of a widespread and large-scale shift away fromcoal to cleaner fuels.
CO2 prices
The pricing of CO2 emissions (either through cap-and-trade schemes or carbon taxes) affectsinvestment decisions in the energy sector by altering the relative costs of competing fuels.A number of countries have implemented emissions trading schemes to set prices for CO2,while many others have schemes under development, with some being in an advancedstage of design. Other countries have introduced carbon taxes (taxes on fuels linked to theiremissions) or are considering doing so.
© O
EC
D/IE
A, 2
011

66 World Energy Outlook 2011 - GLOBAL ENERGY TRENDS
In the Current Policies Scenario, carbon pricing through cap-and-trade is limited to theexisting EU Emission Trading System, which covers the 27 member states of the EuropeanUnion, and the New Zealand Emissions Trading Scheme. The price of CO2 under the EUEmission Trading System is assumed to reach $30/tonne in 2020 (in year-2010 dollars) and$45/tonne in 2035 (Table 1.5). In the New Policies Scenario, it is assumed that measures toput a price on CO2 are also established in Australia from 2012, Korea from 2015 and Chinafrom2020,with the breadth of sectoral coverage varying from country to country.7Althoughneither the United States nor Canada introduces carbon pricing at the federal level in theNew Policies Scenario, we have assumed that from 2015 onwards all investment decisionsin the power sector in these countries factor in an implicit or “shadow” price for carbon; ashadow price is also assumed in Japan’s power sector from 2015. In the countries that areassumed to adopt shadow pricing for carbon emissions, power projects are approved onlyif they remain profitable under the assumption that a carbon price is introduced. Given theuncertainty that surrounds future climate policy,many companies around theworld alreadyuse such an approach as ameans of ensuring they arewell prepared against the contingencyof the introduction of a carbon tax or a cap-and-trade programme.
Table 1.5 ! CO2 price assumptions in selected regions by scenario($2010 per tonne)
Region Sectors 2020 2030 2035
Current Policies Scenario European Union Power, industry andaviation 30 40 45
New Policies Scenario European Union Power, industry andaviation 30 40 45
Korea Power and industry 18 36 45
Australia,New Zealand All 30 40 45
China All 10 23 30
450 Scenario United States, Canada Power and industry 20 87 120
European Union Power, industry andaviation 45 95 120
Japan, Korea,Australia,New Zealand
Power and industry * 35 90 120
China, Russia, Brazil,South Africa Power and industry** 10 65 95
*All sectors in Australia and New Zealand. **All sectors in China.Note: In the New Policies Scenario, the United States, Canada and Japan are assumed to adopt a shadow price for CO2 inthe power sector as of 2015; it starts at $15/tonne, rising to $35/tonne in 2035.
7. China has announced plans to introduce city and provincial level pilot carbon emission trading schemes in the nearfuture and to develop an economy-wide scheme within the current decade.
© O
EC
D/IE
A, 2
011

Chapter 1 - Context and analytical framework 67
1In the 450 Scenario, we assume that pricing of CO2 emissions (either through cap-and-tradeschemes or carbon taxes) is eventually established in all OECD countries and that CO2 prices inthesemarkets begin to converge from2025, reaching $120/tonne in 2035. A growing numberof key non-OECD countries are also assumed to put a price on CO2 emissions. Although weassume no direct link between these systems before the end of the projection period, allsystems have access to offsets, which is likely to lead to convergence of carbon prices to somedegree. The CO2 price in China is assumed to rise from $10/tonne in 2020 to $95/tonne in2035. Similar CO2 price levels are reached in 2035 in Russia, South Africa and Brazil.
Technology
TheWEO projections of energy demand are sensitive to assumptions about improvementsin the efficiency of current energy technologies and the adoption of new ones. Whileno completely new energy technologies, beyond those known today, are assumed tobe deployed before the end of the projection period, it is assumed that existing end-usetechnologies become steadily more energy efficient. The pace of efficiency gains varies foreach fuel and each sector, depending on our assessment of the potential for improvementsand the stage reached in technology development and commercialisation. Similarly,technological advances are also assumed to improve the efficiency of producing andsupplying energy. In most cases they are expected to lower the cost of energy supply andlead to new and cleaner ways of producing and delivering energy services.
The energy sector has a relatively slow rate of capital replacement in general, due to thelong lifetime of many of the capital assets used for producing, delivering and using energy(Figure 1.3). As a result, it can take many years for more efficient technologies to becomewidely used, which limits the speedwithwhich technological progress can lower the amountof energy needed to provide a particular energy service. Most cars and trucks, heating andcooling systems and industrial boilers will be replaced well before 2035. On the other hand,most existing buildings, roads, railways and airports, as well as many power stations andrefineries, will still be in use then. This can have significant implications for efforts to combatclimate change, as emissions that will come frommuch of the infrastructure that is currentlyin place or under construction can be thought of as “locked-in”. In other words, it would beinordinately expensive to retire early or to retrofit that infrastructure, or allow it to standidle. This does not mean that such emissions are unavoidable, but rather that a very strongpolicy intervention would be required – and require justification – before it would makeeconomic sense to replace or modify that capacity (see Chapter 6).
Our assumptions for technology development and deployment vary by scenario, as bothare heavily influenced by government policies and energy prices (IEA, 2010b). Technologicalchange is fastest in the 450 Scenario, thanks to the effect of various types of governmentsupport, including economic instruments (such as carbon pricing, energy taxes and subsidies),regulatory measures (such as standards and mandates) and direct public-sector investment.Technological change is slowest in the Current Policies Scenario, because no newpublic policyactions are assumed. Yet, even in this scenario, significant technological improvements dooccur, aided by higher energy prices. The extent towhich energy assets are retired before theend of their normal lives (or the stock is modernised to reduce energy needs) is limited in the
© O
EC
D/IE
A, 2
011

68 World Energy Outlook 2011 - GLOBAL ENERGY TRENDS
Current Policies Scenario; it is greatest in the 450 Scenario. The reason for this, as indicated,is that retiring these assets before the end of their normal lives is very costly and would onlyoccur as a result of very strong government policy incentives or regulations.
Figure 1.3 ! Typical lifetime of energy-related capital stock
0 20 40 60 80 100 120 140 160
Light bulbs (incandescent)Office equipment
Light bulbs (fluorescent)Consumer electronics
Residen\al water hea\ngHousehold appliances
Passenger carsCommercial hea\ng and cooling
Residen\al space hea\ng and coolingManufacturing equipment
Aircra[Petrochemical plant
Steel plantCement plant
Refueling sta\onsOil refineries
PipelinesTransmission and distribu\on networks
Solar photovoltaicsOnshore wind turbinesOffshore wind turbines
Combined-cycle gas turbine plantCoal-fired power plantNuclear power plant
Large hydropower plantBuilding stock
Urban infrastructure (e.g. roads)
Years
Final consump\on
Transforma\on,transportand distribu\on
Power genera\on
Land useand housing
Note: The solid bars show average life"mes while the range lines show typical varia"ons.
Although no completely new technologies are assumed to be deployed in any of thethree scenarios, some that are currently approaching the commercialisation phase areassumed to become available and to be deployed to some degree before the end of theprojection period. For example, carbon capture and storage technology is expected to bedeployed, on a very limited scale in the New Policies Scenario, but muchmore widely in the450 Scenario (stimulated by stronger CO2 price signals). Advanced biofuels, including thosefrom ligno-cellulosic feedstock, are assumed to reach commercialisation, by around 2015in the 450 Scenario and by 2025 in the Current Policies Scenario. Hydrogen fuel cells basedon natural gas are expected to start to become economically attractive after 2020 in somesmall-scale power generation applications and, to a much lesser extent, in the transportsector. Exploration and production techniques for oil and gas are also expected to improve,lowering the unit production costs and opening up new opportunities for development.
© O
EC
D/IE
A, 2
011

Chapter 2 - Energy projections to 2035 69
CHAPTER 2
H I G H L I G H T S
ENERGY PROJECTIONS TO 2035
Re-energising the global economy?
! In the New Policies Scenario, our central scenario, global energy demand increasesby 40% between 2009 and 2035. Demand grows for all energy sources. Oil demandincreases by 18% and is driven by transport. Coal demand, dictated largely bynon-OECD countries, increases for around the next ten years but then stabilises,ending around 25%higher than 2009. Absolute growth in natural gas demand is nearlyequal to that of oil and coal combined. Nuclear power generation grows bymore than70%, led by China, Korea and India. Modern renewables grow faster than any otherenergy form in relative terms, but in absolute terms total demand is still not close tothe level of any single fossil fuel in 2035.
! The focus of growth in both energy demand and supply switches away from theOECD. Nearly 90% of global energy demand growth is in non-OECD countries. OPECoil production reaches more than half of the world total in 2035. Non-OECD countriesaccount for more than 70% of global gas production in 2035, focused in the largestexistinggasproducers, suchasRussia, theCaspianandQatar. China consumesnearly70%more energy than theUnited States in 2035, is the largest oil consumer and oil importer,and continues to consume nearly half of world coal production. Despite this, China’sper-capita energy consumption is less than half the level of theUnited States in 2035.
! Inter-regional trade in oil increases by around 30% and is equivalent tomore than halfof world oil consumption in 2035. Trade in natural gas nearly doubles, with gas fromRussia and the Caspian region going increasingly to Asia. India becomes the largestcoal importer by around 2020, but China remains the determining factor in global coalmarkets. The OECD share of inter-regional fossil fuel trade declines from 42% in 2009to 29% in 2035 and becomes more focused on natural gas and oil.
! Global investment in the energy supply infrastructure of $38 trillion is required overthe period 2011 to 2035. Two-thirds of this is needed in non-OECD countries. Thepower sector claims nearly $17 trillion of the total investment. Oil and gas combinedrequire nearly $20 trillion, increasing to reflect higher costs and a need for upstreaminvestment to rise in the medium and long term. Coal and biofuels account for theremaining investment.
! In the New Policies Scenario, global energy-related CO2 emissions increase by 20%,following a trajectory consistent with a long-term rise in the average globaltemperature in excess of 3.5°C. Around 45% of the emissions in 2035 are alreadylocked-in, coming from capital stock which either exists now or is under constructionand will still be operating in 2035.
© O
EC
D/IE
A, 2
011

70 World Energy Outlook 2011 - GLOBAL ENERGY TRENDS
Overview of energy trends by scenario
Nothing is as certain as change, and the energy landscape has changed significantly over thelast year: turmoil in theMiddle East and North Africa, the tsunami in Japan and consequentdamage to the Fukushima Daiichi nuclear power plant, the release of China’s 12th Five-YearPlan (2011 to 2015), new moratoria on shale-gas drilling and, despite some progress, thefailure to achieve a legally binding agreement to limit global greenhouse-gas emissions.There is also the critical issue of the fragile health of the global economy and its uncertainfuture prognosis. But what impact has all of this change had on the outlook for our energyfuture?
WEO-2011 considers three scenarios, based on differing assumptions (see Chapter 1), withthe results varying significantly, but all contributing their ownmessages to policymakers andanalysts. The New Policies Scenario is our central scenario; it takes account of both existinggovernment policies and declared policy intentions. The Current Policies Scenario looks ata future in which the government policies and measures enacted or adopted by mid-2011remain unchanged. In contrast to the other scenarios, the 450 Scenario is an outcome-drivenscenario, illustrating a global energy pathway with a 50% chance of limiting the increasein the average global temperature to 2°C. This would require the long-term concentrationof greenhouse gases in the atmosphere to be limited to around 450 parts per million ofcarbon-dioxide equivalent (ppm CO2-eq).
In the New Policies Scenario, world primary energy demand is projected to increase from12 150 million tonnes of oil equivalent (Mtoe) in 2009 to 16 950 Mtoe in 2035, an increaseof 40%, or 1.3% growth per year (Figure 2.1).1Global energy demand increasesmore quicklyin the Current Policies Scenario, reaching 18 300 Mtoe in 2035, 51% higher than 2009, andrepresenting average growth of 1.6% per year.
Figure 2.1 ! World primary energy demand by scenario
6 000
8 000
10 000
12 000
14 000
16 000
18 000
20 000
1980 1990 2000 2010 2020 2030 2035
Mtoe Current Policies Scenario
New Policies Scenario
450 Scenario
1. Compound average annual growth rate.
© O
EC
D/IE
A, 2
011

Chapter 2 - Energy projections to 2035 71
2
In the 450 Scenario, global energy demand still increases between 2009 and 2035, reaching14 850 Mtoe in 2035, an increase of 23% or 0.8% per year. In 2035, energy demand in the450 Scenario is 19% lower than in the Current Policies Scenario and more than 12% lowerthan in the New Policies Scenario, due mainly to the differing extent to which policies areimplemented to improve energy efficiency.
In all scenarios, fossil fuels (oil, coal and natural gas) remain the dominant sources of energyin 2035 (Table 2.1), but their share of the energymix varies: the share of fossil fuels decreasesfrom 81% of world primary energy supply in 2009 to 80% in 2035 in the Current PoliciesScenario, 75% in the New Policies Scenario and 62% in the 450 Scenario.
Table 2.1 ! World primary energy demand by fuel and scenario (Mtoe)
New PoliciesScenario
Current PoliciesScenario
450Scenario
1980 2009 2020 2035 2020 2035 2020 2035
Coal 1 792 3 294 4 083 4 101 4 416 5 419 3 716 2 316
Oil 3 097 3 987 4 384 4 645 4 482 4 992 4 182 3 671
Gas 1 234 2 539 3 214 3 928 3 247 4 206 3 030 3 208
Nuclear 186 703 929 1 212 908 1 054 973 1 664
Hydro 148 280 377 475 366 442 391 520
Biomass and waste* 749 1 230 1 495 1 911 1 449 1 707 1 554 2 329
Other renewables 12 99 287 690 256 481 339 1 161
Total 7 219 12 132 14 769 16 961 15 124 18 302 14 185 14 870
* Includes traditional andmodern uses.
The outlook for each fuel differs across the scenarios, in some cases markedly (Figure 2.2).Compared with 2009, demand in 2035 for all forms of energy increases in the New PoliciesScenario and the Current Policies Scenario, but the extent differs. In the New PoliciesScenario, absolute growth in demand for natural gas is the strongest of all fuels. Global gasdemand nearly reaches the level of coal demand by the end of the Outlook period. In theCurrent Policies Scenario, coal demand grows the most in absolute terms and overtakesoil to capture the largest single share of the energy mix before 2035. In the 450 Scenario,demand for coal and oil declines, compared with 2009, while the outlook is generally morepositive for natural gas, nuclear power and renewables.
The make-up of global energy demand in 2035 across the different scenarios is illustratedin Figure 2.3. The strength with which energy and environmental policies are implementedin the different scenarios has a particularly strong impact on the outlook for coal andrenewables, but in opposite directions. In the Current Policies Scenario, coal representsnearly 30% of the energy mix and renewables 14% in 2035. In the 450 Scenario, the shareof coal in total energy demand declines to less than 16% in 2035, while that of renewablesincreases to 27%.
© O
EC
D/IE
A, 2
011

72 World Energy Outlook 2011 - GLOBAL ENERGY TRENDS
Figure 2.2 ! World primary energy demand by fuel and scenario, 2009 and2035 (Mtoe)
0
1 000
2 000
3 000
4 000
5 000
6 000
Coal Oil Gas Nuclear Hydro Biomassand waste
Otherrenewables
Mtoe
Addidonal to 2035:New Policies Scenario
2035: Current PoliciesScenario
2035: 450 Scenario
2009 demand
In 2010, global energy-related emissions of carbon dioxide (CO2), the main component ofthe energy-related greenhouse gases contributing to climate change, were 30.4 gigatonnes(Gt), more than 5% higher than in 2009. The three scenarios have a dramatically differentimpact on the future level of world energy-related CO2 emissions (Figure 2.4). By 2035,global energy-related CO2 emissions are projected to increase to 36.4 Gt in the NewPolicies Scenario and 43.3 Gt in the Current Policies Scenario, but decrease to 21.6 Gt in the450 Scenario (see Chapter 6 for more on climate change and the 450 Scenario). In termsof CO2 emissions, cautious implementation of announced policies, as in the New PoliciesScenario, achieves only one-third of the cumulative change required over the Outlookperiod to achieve a trajectory consistent with limiting the average global temperaturerise to 2°C.
Figure 2.3 ! Shares of energy sources in world primary demand by scenario,2035
0% 25% 50% 75% 100%
450 Scenario
New Policies Scenario
Current Policies Scenario
Coal
Oil
Gas
Nuclear
Renewables
© O
EC
D/IE
A, 2
011

Chapter 2 - Energy projections to 2035 73
2
Figure 2.4 ! World energy-related CO2 emissions by scenario
0
5
10
15
20
25
30
35
40
45
1990 2000 2010 2020 2030 2035
Gt
141 Gt
71 Gt
Current Policies Scenario
New Policies Scenario
450 Scenario
CumulaEve reducEonin emissions 2010 to 2035:
Current Policies toNew Policies Scenarios
New Policies to450 Scenarios
Global energy intensity – the amount of fuel needed to generate each unit of grossdomestic product (GDP) – is projected to decline across all WEO-2011 scenarios overthe Outlook period, and in all cases by more than the average level observed from 1985to 2009 (Figure 2.5). In 2035, global energy intensity is projected to have decreased by36% in the New Policies Scenario, 31% in the Current Policies Scenario and 44% in the450 Scenario. The main change across scenarios is the extent to which energy intensityreduces in non-OECD countries, particularly China and, to a lesser extent, India and Russia.Despite being interrupted three times in the last decade, the decline in energy intensity isa longstanding trend, driven primarily by improved energy efficiency and structural changesin the global economy.
Figure 2.5 ! Average annual percentage change in global primary energyintensity by scenario (2009-2035) and region
-3.5%
-3.0%
-2.5%
-2.0%
-1.5%
-1.0%
-0.5%
0%1985-2009 Current Policies Scenario New Policies Scenario 450 Scenario
OECD
Non-OECD
Note: Calculated based on GDP expressed in year-2010 dollars at market exchange rates.
© O
EC
D/IE
A, 2
011

74 World Energy Outlook 2011 - GLOBAL ENERGY TRENDS
Energy trends in the New Policies ScenarioThis section concentrates on the results of the New Policies Scenario, our central scenario.2In doing so, it details the impact of existing and planned policies, when implementedcautiously, on the key energy trends in demand, supply, trade, investment and emissions inthe period up to 2035.
Primary energy mix
Major events of the last year have had an impact on short andmedium termenergy trends, buthave done little to quench the world’s increasing thirst for energy in the long-term. Based onpreliminary data, total primary energy demand is estimated to have increased by 4.7% in 2010,easily recouping the 1.1% decline of 2009 and representing a very large rebound in demandby historical standards. Short-term economic uncertainty plays a prominent role in the near-term outlook for energy demand. However, while slower economic growth than assumed (seeChapter1) in thenext coupleof yearswoulddampendemandgrowth temporarily, itwouldhavelittle impacton longer-termtrends, especially if thedownturnwere tobe followedbyaperiodofaccelerated growth (Box 2.1).
In the New Policies Scenario, total primary energy demand increases by 40% over theOutlook period to reachmore than 16 950Mtoe in 2035 (Table 2.2).While demand increasesconsistently throughout the Outlook period, the growth rate slows from an average of1.8% per year in the period to 2020 to 0.9% per year from 2020 to 2035. This shift isattributed largely to a tempering in global economic and population growth, and improvedlevels of energy efficiency.Many largeOECDeconomies, such as theUnited States and Japan,see very modest energy demand growth, averaging 0.2% and 0.05% per year respectively.This contrasts with many large non-OECD economies: China and India experience energydemand growth of 2% and 3.1% per year respectively.
Table 2.2 ! World primary energy demand by fuel in the New PoliciesScenario (Mtoe)
1980 2009 2015 2020 2030 2035 2009-2035*
Coal 1 792 3 294 3 944 4 083 4 099 4 101 0.8%
Oil 3 097 3 987 4 322 4 384 4 546 4 645 0.6%
Gas 1 234 2 539 2 945 3 214 3 698 3 928 1.7%
Nuclear 186 703 796 929 1 128 1 212 2.1%
Hydro 148 280 334 377 450 475 2.1%
Biomass and waste 749 1 230 1 375 1 495 1 761 1 911 1.7%
Other renewables 12 99 197 287 524 690 7.8%
Total 7 219 12 132 13 913 14 769 16 206 16 961 1.3%
* Compound average annual growth rate.
2. Annex A provides detailed projec!ons of energy demand by fuel, sector and region for all three scenarios.
© O
EC
D/IE
A, 2
011
Chapter 2 - Energy projections to 2035 75
2
Box 2.1 ! The impact of lower near-term economic growth onenergy demand
At the time of writing, the latest data and forecasts reveal an increasingly pessimisticassessment of global economic activity. They point towards a slowdown in globalgrowth, attributed largely to those advanced economies that are facing fiscal andfinancial sector balance-sheet problems. This worsening outlook means that thereis a risk of weaker growth in GDP than assumed in the New Policies Scenario – overthe next couple of years at least. This would inevitably affect the outlook for globalenergy demand and, in the light of this uncertainty, we have prepared a Low GDPCase to test the sensitivity of global energy demand to weaker economic growthin the period to 2015. This deliberately takes a more negative view of near-termeconomic growth than the New Policies Scenario, but is in line with the latest revisionof economic forecasts by international organisations.
In the Low GDP Case, global GDP is assumed to grow by 3.8% in 2011 (against 4.3%in the New Policies Scenario), 4.1% in 2012 (4.4%) and then gradually to return tothe same level as the New Policies Scenario after 2015 – following the path for thatscenario for the remainder of the Outlook period. This results in global GDP being0.8% lower than in the New Policies Scenario in 2015, and 0.7% lower in 2035. Mostof the slowdown occurs in OECD countries. All other assumptions made in the NewPolicies Scenario, including energy prices, are unchanged in the Low GDP Case, inorder to isolate the effects.
Unsurprisingly, in the Low GDP Case world primary energy demand grows moreslowly than in the New Policies Scenario, reaching 13 860 Mtoe in 2015 – 50 Mtoe,or 0.4%, lower. By 2035, primary energy demand in the Low GDP Case is 60 Mtoe,also 0.4%, lower. The proportional impact on energy demand is greatest in OECDeconomies, with the United States experiencing the largest reduction. However, therelatively less energy-intensive nature of the OECD economies mitigates the overallimpact of this Low GDP Case on global energy demand. Furthermore, the fact thatprojected energy demand growth in the New Policies Scenario is expected to bedriven strongly by non-OECD economies means that a slowdown in the near-termeconomic prospects of the OECD economies does not have a large impact on theglobal picture, particularly when looking out to 2035.
In reality, the longer term impact on global energy demand of such a slowdown couldbe expected to be even lower than estimated here. This is because, if the constraintthat other assumptions do not change is relaxed, the weaker economic growth inthe Low GDP Case would be expected to put downward pressure on energy pricesand somitigate, in part, the reduction in energy demand projected here. In addition,an economic slowdown might well be followed by a period of more rapid economicgrowth. This is not allowed for in the Low GDP Case, but has often been observed inthe past.
© O
EC
D/IE
A, 2
011

76 World Energy Outlook 2011 - GLOBAL ENERGY TRENDS
The global recession and high prices have had only a relatively small impact on demand for oiland it is likely tobe temporary (Spotlight considers theeconomic impactsofhighoil prices). In theNewPolicies Scenario, demand increases for all energy sources over theOutlookperiod, but thepaceand trendvaries. Fossil fuels account for 59%of the increase inglobal energydemand from2009 to 2035, or an additional 2 850Mtoe. This growth in demand comes in spite of increasingfuel prices and additional policy measures, such as energy efficiency measures in Brazil, China,India and Russia. In the New Policies Scenario, global demand for oil increases from 84 millionbarrels per day (mb/d) in 2009 (almost 87 mb/d in 2010) to 99 mb/d in 2035 (Figure 2.6).Notwithstanding, this growth, its share in theprimaryenergymixactuallydecreases from33% in2009 to 27% in 2035. Significantly higher average oil prices and switching away from oil in thepowergenerationand industrial sectorsdonotoffset increasingdemand in the transport sector,wheredemand is relativelyprice inelasticandsubstitutionpossibilitiesare limited (seeChapter3).All of thenet growth inglobal oil demand in theNewPolicies Scenario comes fromthe transportsector in the non-OECD countries, growth being particularly strong in India, China and theMiddle East. In short, despite energy security and climate concerns, oil demand continues togrowand the global economy relies onoilmore thanon any other fuel (see Chapter 3 for the oilmarket outlook).
Figure 2.6 ! World primary energy demand by fuel in the NewPolicies Scenario
0
2 000
4 000
6 000
8 000
10 000
12 000
14 000
16 000
18 000
1980 1990 2000 2010 2020 2030
Mtoe Other renewables
Biomass and waste
Hydro
Nuclear
Gas
Coal
Oil
2035
Global coal demand increased, on average, by slightly more than 1% per year from 1980 to2000, but then grew by over 4% per year from 2000 to 2009. This acceleration in demandgrowth over the last decade was driven overwhelmingly by China and, to a lesser extent,India and other emerging economies. In the New Policies Scenario, demand for coalincreases by 25%, to reach 5 860 million tonnes of coal equivalent (Mtce)3 in 2035, but thepace of this growth differs markedly over time. In the period to 2020, global coal demandexperiences strong growth but it then slows rapidly, with the level of global demandremaining broadly flat for much of the rest of the Outlook period, before then flirtingtentativelywith decline as 2035 approaches. The share of coal in the global energymix peaksat 28% early in theOutlook period, but then declines to 24% by 2035.
3. 1 Mtce is equal to 0.7 Mtoe.
© O
EC
D/IE
A, 2
011

Chapter 2 - Energy projections to 2035 77
2
S P O T L I G H T
What are the economic impacts of high oil prices?
The economic impacts of high oil prices differ depending on the nature of the priceincrease, the oil intensity and import dependence of an economy, economic conditionsat the time, and the government and consumer response. In the past, high oil priceshave often been associated with economic recession, as at the time of the oil shocksof the 1970s, but this association has weakened in more recent times. While there aremany reasons for this, probably the most important is that the oil intensity of the globaleconomy has fallen significantly.Higher oil prices increase production costs for many goods and services, and therebyput pressure on price levels generally. Price inflation is manifest both directly throughincreased fuel prices (including natural gas, if gas contracts are linked to oil prices) andindirectly as the prices of other goods rise to reflect higher input costs. The inflationaryimpact ismore pronounced in relatively energy-intensive economies, typically developingcountries. Higher costs and inflation, and lower profit margins, can damage demand andemployment and put upward pressure on wages. Such changes in economic activity inturn influence financial markets, interest rates and exchange rates. Depending on thespeed, scale and expected duration of the oil price increases, consumer and producerconfidence can be impairedmaterially.While oil-import bills of key consuming countries are at high levels, net oil exportersare benefitting from a redistribution of income. The majority of oil exporting nationsrun balance of payments current account surpluses that grow as oil revenues rise,unless they are recycled through increased imports. For every country experiencinga rising current account surplus, there will be others with widening current accountdeficits or declining surpluses. The propensity to spend has historically beenmuch lowerin net oil-exporting countries compared with oil-importing countries. This means thatoverall global demand is likely to decline as a result of this redistribution, even thoughmany oil-exporting countries have increased public spending in the light of higher oilrevenues. The sharp increase in public expenditure means that the oil price required tobalance their budgets has risen and a sudden drop significantly below this level couldresult in abrupt action to cut spending (see Chapter 3).Sound economic policies may not eliminate the adverse impacts of high oil prices on netoil-importing economies, but they can moderate them. Inflationary pressures derivedfromhigh oil prices emphasise the need to adopt a coherentmonetary policy that anchorsprice expectations effectively. But consumers and businesses can also be tempted to try toride the effects of higher oil prices, by reducing short-term saving or increasing the use ofcredit, and governmentsmay do so through anoffsetting tax cut or by subsidising the priceof oil and other energy products. However, the ability of governments to act in this waydepends critically on their fiscal starting point and such actions quickly become costly anddifficult to undo. TheG-20, APEC and other countries recognised the shortcomings of suchaction by committing to phase out inefficient fossil fuel subsidies that promote wastefulconsumption. Themost obvious action that oil-importing countries can take to reduce theimpact of high prices on their economies is to reduce their reliance on oil.
© O
EC
D/IE
A, 2
011

78 World Energy Outlook 2011 - GLOBAL ENERGY TRENDS
China will be pivotal in determining the evolution of global coal markets (the Spotlightlater in this chapter considers China’s role in traded coal markets). While its demand forcoal increases apace during the period covered by its 12th Five-Year Plan (Box 2.2), thereorientation of the energy mix set in train by the Five-Year Plan provides the groundworkfor the slowdown in coal demand growth around 2020. Later in the Outlook period,interventions by governments, such as carbon pricing, have an impact on coal demand, asdoes the increasing preference in many countries for natural gas in industrial uses and thepower sector (see Part C for the coal market outlook).
Box 2.2 ! China’s 12th Five-Year Plan (2011-2015)
China’s 12th Five-Year Plan (the Plan) covers the period 2011 to 2015 and, whilefocused on China’s domestic energy landscape, it has profound implications for theglobal energy picture. It concentrates on energy efficiency and the use of cleanerenergy sources to mitigate the effects of rapidly rising energy demand, which wouldotherwise increase China’s dependence on imports and exacerbate local pollution.Reducing energy and carbon intensity are two key goals of the Plan. Targets are set tocut energy consumption per unit of GDP by 16% by 2015 and to cut CO2 emissions perunit of GDP by 17%. The CO2 intensity target, included for the first time, is in line withChina’s Copenhagen pledge to achieve 40% to 45% reductions below 2005 levels by2020. The Plan also establishes new targets intended to diversify the primary energymix. The proportion of non-fossil fuels in primary energy consumption is targetedto reach 11.4% by 2015, up from 8.3% in 2010. Natural gas, nuclear and renewablesare expected to be aggressively promoted. The Plan also includes targets to reduceemissions ofmajor pollutants by between 8% and 10%.Many of the policies reflectedin the 12th Five-Year Plan are expected to be taken forward through other detailedplans and targets. In some cases, WEO-2011 anticipates such targets, based oncredible reports at the time of writing, to provide further depth to the analysis.
Compared with the previous year, global gas demand decreased by 2% in 2009, but it isestimated to have rebounded strongly in 2010, increasing by nearly 7%. Absolute growth innatural gas demand continues to exceed that of all other fuels, and is nearly equal to that ofoil and coal combined over the Outlook period, increasing by 54% to reach 4 750 billion cubicmetres (bcm) in 2035. The flexibility of natural gas as a fuel, together with its environmentaland energy security attributes,makes it an attractive fuel in a number of countries and sectors.For example, in the United States, where unconventional gas supply is increasingly abundant,demand grows in power generation. In Asia, demand increases across a range of sectors,including industry and residential, and in theMiddle East power generation and gas-to-liquids(GTL) see notable demand growth. The strong growth in demand for natural gas is supportedby relatively low prices, policy support in China and substitution for nuclear capacity in somecases. The share of natural gas in the global energy mix increases from 21% in 2009 to 23%in 2035. Demand for natural gas rises close to the level of coal demand over theOutlook periodand is near to overtaking it, to become the second most important fuel in the primary energymix, by 2035 (Figure 2.7) (see Chapter 4 for the natural gas market outlook).
© O
EC
D/IE
A, 2
011

Chapter 2 - Energy projections to 2035 79
2
Figure 2.7 ! Shares of energy sources in world primary energy demandin the New Policies Scenario
0%
10%
20%
30%
40%
50% Oil
Coal
Gas
Biomass and waste
Nuclear
Other renewables
Hydro
1980 1990 2000 2010 2020 2030 2035
Attitudes toward nuclear power have evolved over the last year, though it is as yet farfrom certain exactly how energy policies and plans will change. While many countries arereassessing the future role of nuclear power, expectations over the Outlook period havediminished only slightly. In the New Policies Scenario, nuclear power generation increasesby 73% over the Outlook period, growing from 2 700 terawatt-hours (TWh) in 2009 to4 660 TWh in 2035, only 5% lower than projected inWEO-2010.Non-OECD countries are responsible for nearly 80%of the global increase in installed nuclearpower generating capacity over the Outlook period. Building over 110 gigawatts (GW),China alone accounts for nearly half of the global increase in nuclear capacity to 2035, aprojection that has increased in response to the 12th Five-Year Plan. Nuclear capacity in theOECD is expected to increase by 53 GW, reaching 380 GWby the end of theOutlook period.This projection is 23 GW lower than last year, for a number of reasons, including reducednuclear competitiveness, fewer than expected capacity additions and some plant delays.Nuclear plant retirements in Germany also now occur significantly earlier in the Outlookperiod. The share of nuclear power in total primary energy demand increases slightly overthe projection period, from 6% in 2009 to 7% in 2035, lower than the 8% projected inWEO-2010 (see Chapter 5 for the power sector outlook and Chapter 12 for the implicationsof less nuclear power).
Demand for modern renewable energy – including wind, solar, geothermal, marine,modern biomass and hydro – grows from 860 Mtoe in 2009 to 2 365 Mtoe in 2035. Theshare of modern renewable energy in the primary energy mix increases from 7% in 2009to 14% in 2035. Despite this strong growth, global demand for all sources of renewableenergy collectively will still not be close to that for any single fossil fuel in 2035. Demand forrenewable energy increases substantially in all regions, but different types achieve greateror lesser penetration in different locations. For example, hydropower accounts for morethan 60% of electricity generation in Latin America in 2035, while wind power accounts fornearly 20%of generation in the EuropeanUnion. In 2035, the share of renewables (includingtraditional biomass use) in total primary energy demand is 23% in the European Union,20% in India, 16% in the United States and 13% in China.
© O
EC
D/IE
A, 2
011

80 World Energy Outlook 2011 - GLOBAL ENERGY TRENDS
Regional trends
Primary energy demand in non-OECD countries grows from 6 600 Mtoe in 2009 to10 800 Mtoe in 2035, representing nearly 90% of all energy demand growth over theOutlook period (Figure 2.8). Non-OECD countries represent 54% of global energy demand in2009 and this grows to 64% in 2035.While average annual growth in energy demand in non-OECD countries is 1.9% over the Outlook period, growth slows from 2.7% per year to 2020,to 1.4% per year from 2020 to 2035. Higher energy demand growth in non-OECD countriesrelative to the OECD is consistent with the faster rates of growth of population, economicactivity and urbanisation expected over the Outlook period. For example, non-OECDcountries are expected to represent 84% of the global population in 2035 (up from 82% in2009), and the proportion of people residing in urban areas in these countries increasesfrom 44% to 57% (see Chapter 1 for population assumptions). While non-OECD countriesaccount for all of the global growth in coal and oil demand over theOutlook period, they alsoaccount for 73% of the global increase in nuclear power, 55% of the increase in non-hydrorenewable energy and 88% of the increase in hydropower generation.
Figure 2.8 ! World primary energy demand by region in the NewPolicies Scenario
0
2 000
4 000
6 000
8 000
10 000
12 000
14 000
16 000
18 000
1990 2000 2010 2020 2030 2035
Mtoe Other OECD
European Union
United States
Other non-OECD
Middle East
India
China
Inter-regional(bunkers)
China has consolidated its position as theworld’s largest energy consumer (Table 2.3). Fromconsuming less than half as much energy as the United States in 2000, it now consumesslightly more and is projected to consume nearly 70% more than the United Statesin 2035. In the New Policies Scenario, China accounts for more than 30% of global growthin energy demand from 2009 to 2035. Its share of global energy demand, having increasedfrom 11% in 2000 to 19% in 2009, is projected to be 23% in 2035. China’s per-capita energyconsumption overtakes theworld average early in theOutlook period, but is still at less thanhalf the level of the United States in 2035.
China overtakes theUnited States in terms of oil imports shortly after 2020 and becomes thelargest oil consumer in the world around 2030, consuming 15 mb/d by 2035, nearly doublethe level of 2009. While the share of coal in China’s primary energy mix declines to one-half
© O
EC
D/IE
A, 2
011

Chapter 2 - Energy projections to 2035 81
2
of the total in 2035, the absolute amount of coal consumed, at 2 800 Mtce, is still nearlytwo-and-a-half times more than that of the OECD. Even with the signalled policy shift awayfrom coal, China accounts for 48% of cumulative world coal consumption over the Outlookperiod, or around 74 300 Mtce. China also leads the world by some margin in the supply ofrenewable energy in 2035.
Table 2.3 ! World primary energy demand by region in the New PoliciesScenario (Mtoe)
1980 2000 2009 2015 2020 2030 2035 2009-2035*
OECD 4 067 5 292 5 236 5 549 5 575 5 640 5 681 0.3%
Americas 2 102 2 695 2 620 2 780 2 787 2 835 2 864 0.3%
United States 1 802 2 270 2 160 2 285 2 264 2 262 2 265 0.2%
Europe 1 501 1 765 1 766 1 863 1 876 1 890 1 904 0.3%
Asia Oceania 464 832 850 906 912 914 912 0.3%
Japan 345 519 472 498 490 481 478 0.0%
Non-OECD 2 981 4 475 6 567 8 013 8 818 10 141 10 826 1.9%
E. Europe/Eurasia 1 242 1 001 1 051 1 163 1 211 1 314 1 371 1.0%
Russia n.a. 620 648 719 744 799 833 1.0%
Asia 1 066 2 172 3 724 4 761 5 341 6 226 6 711 2.3%
China 603 1 108 2 271 3 002 3 345 3 687 3 835 2.0%
India 208 460 669 810 945 1 256 1 464 3.1%
Middle East 114 364 589 705 775 936 1 000 2.1%
Africa 274 505 665 739 790 878 915 1.2%
Latin America 284 432 538 644 700 787 829 1.7%
Brazil 114 185 237 300 336 393 421 2.2%
World** 7 219 10 034 12 132 13 913 14 769 16 206 16 961 1.3%
European Union n.a. 1 683 1 654 1 731 1 734 1 724 1 731 0.2%
*Compound average annual growth rate.**World includes international marine and aviation bunkers (not included in regional totals).
Energy demand in India was higher than that of Russia in 2009, making it the third-largestenergy consumer in the world. Despite this, many millions of people in the country stillhave no access to modern energy services (see Chapter 13). India’s energy demand morethan doubles between 2009 to 2035, rising from less than 700Mtoe to nearly 1 500 Mtoe,accounting for 16% of the increase in global energy demand over the Outlook period.At an average of 3.1% per year, India’s rate of energy demand growth is very high overthe Outlook period. The increase in energy demand is primarily driven by rapid economicgrowth and population growth. Coal continues to dominate the energy picture in India,representing around 42% of total energy demand in 2035, practically the same shareas 2009. Demand for natural gas trebles, but it still plays a relatively modest role in theoverall energy mix, at around 10% in 2035. The total number of passenger light-duty
© O
EC
D/IE
A, 2
011

82 World Energy Outlook 2011 - GLOBAL ENERGY TRENDS
vehicles (PLDVs) per 1 000 people increases from 10 in 2009 to over 100 in 2035, driving afour-times increase in demand for oil in the transport sector, which reaches more than190 Mtoe (3.9 mb/d) – slightly more than half of total primary oil demand in 2035(7.4 mb/d). Electricity demand per capita nearly trebles over the Outlook period, drivingincreased energy demand for power generation.
Primary energy demand in Russia decreased by 6% in 2009, but preliminary data suggestit has regained most of this ground in 2010. In the New Policies Scenario, energy demandin Russia increases by 28% over the Outlook period (estimated increase of 21% from 2010to 2035), to reach around 830 Mtoe in 2035. The rise in energy demand is constrainedby a slight decline in population, and by energy efficiency and pricing policies that beginto tap into Russia’s large potential for energy saving. While Russia’s energy intensity isprojected to decline by 49% over theOutlook period (based on GDP in year-2010 dollars atmarket exchange rates), it is still nearly three-times the average level in the OECD in 2035(Figure 2.9). Natural gas continues to dominate Russia’s energy mix, representing 52% oftotal primary energy demand in 2035. While there is a large relative increase in the use ofrenewables in Russia, they still only represent 7% of its primary energy mix in 2035, muchlower than the 18% share in global primary energy demand (see Part B for the energyoutlook for Russia).
Figure 2.9 ! Energy intensity in selected countries and regionsin the New Policies Scenario, 1990-2035
0
0.2
0.4
0.6
0.8
1.0
1990 2000 2010 2020 2030 2035
Russia
Middle East
India
China
World
OECD
toep
erthou
sand
dollars
ofGD
P($2010,MER
)
Primary energy demand in the Middle East increases by 70%, to reach 1 000 Mtoe in 2035.Oil demand in the Middle East grows by an average of 1.3% per year to reach 9.2 mb/d in2035, driven largely by the road-transport sector. TheMiddle East accounts for 17%ofworldoil demand growth from 2009 to 2035. Despite this demand growth, the share of oil in theenergy mix diminishes from 51% in 2009 to 43% by 2035, relinquishing share primarily tonatural gas. Demand for natural gas overtakes that of oil before 2025. Increases in demandfor natural gas are highest in power generation, desalinisation and in use as a feedstock forpetrochemicals. Nuclear power also emerges gradually over theOutlook period.
© O
EC
D/IE
A, 2
011

Chapter 2 - Energy projections to 2035 83
2
In Latin America, primary energy demand is projected to grow on average by 1.7% per yearand to reach 830 Mtoe by 2035. Demand for renewables in the power generation sectorin Latin America doubles over the Outlook period, to reach nearly 140 Mtoe in 2035, andrepresents over 60% of total demand in this sector. Biofuels use in road transport increasesby more than 4% per year, to reach 1 mb/d by 2035, representing around 25% of fuelconsumption in the sector. Primary energy demand in Brazil grows to 420 Mtoe in 2035,representing more than half of the regional total. Consumption of natural gas in Brazilincreases by nearly 6% per year, to reach around 90 bcm in 2035, stimulated by greaterlevels of domestic gas supply. Over theOutlook period, the share of natural gas in the powersector in Brazil grows from 5% to 20% and its share in industry grows from 10% to 19%.
In Africa, the population is projected to grow by 71% from 2009 to 2035 but there is onlya 38% increase in energy demand over the same period. This means that, while Africa’sshare of the global population increases from 15% in 2009 to 20% in 2035, its share ofglobal energy demand declines fractionally to 5.4% over the same timeframe. Furthermore,one-third of total energy demand in Africa in 2035 takes the form of traditional biomass usein the residential sector. A large share of the population in countries such as Nigeria, Ethiopiaand Tanzania continue to live without access to electricity and clean cooking facilities (seeChapter 13 on energy access).
In the New Policies Scenario, primary energy demand in OECD countries grows from around5 200Mtoe in 2009 to nearly 5 700Mtoe in 2035, an increase of 8%. Oil demand declines by0.6% per year on average, going from42mb/d in 2009 to 36mb/d in 2035,mainly as a resultof fuel economy policies and saturating vehicle markets. Many OECD countries see coaldemand decline significantly as policies to reduce carbon emissions take effect, particularlyafter 2020. By 2035, OECD countries consume 22% less coal than in 2009. Natural gas is animportant fuel for power generation in the OECD in 2035 and also plays a prominent role inthe industrial, service and residential sectors. Nuclear power use in the OECD increases by23% over theOutlook period.
While the United States remains the second-largest energy consumer in the world, its totalenergy demand, at around 2 270 Mtoe in 2035, is only slightly higher than in 2009. Oildemand declines, mainly as a result of improved fuel economy in the road-transport sector,but is still projected to be 14.5 mb/d in 2035 – slightly less than 15% of global oil demand.Coal demand in the United States also declines over the Outlook period, but by less thanexpected in WEO-2010. The absence of a carbon price means that there is less incentiveto move away from coal-powered plants in power generation, but the prospect of such apolicy being introduced in the future means that a shadow price of carbon (see Chapter 1)does affect new investment decisions over the Outlook period. Thanks to improving supplyprospects and lower expected prices, natural gas demand increases over theOutlook period,albeit at a modest pace. The outlook for nuclear power, which has declined slightly fromWEO-2010, continues to be influenced significantly by the availability of policy support.Consumption of renewable energy increases by 4% per year over the Outlook period andrepresents 16% of the energy mix in 2035.
Total primary energy demand in the European Union increases by less than 5% from 2009levels by 2035, with all of the growth happening before 2020. Demand for coal decreases
© O
EC
D/IE
A, 2
011

84 World Energy Outlook 2011 - GLOBAL ENERGY TRENDS
by nearly 50% over the Outlook period and its share in the energy mix declines from16% in 2009 to 8% in 2035 (Figure 2.10). In contrast, natural gas demand increases by24% over the Outlook period, largely in the power sector but also in industry and heatingin buildings. The share of natural gas in the primary energy mix increases from 25% in 2009to 30% in 2035. Energy efficiency policies play an important role in the decline in demandfor oil in the transport sector. However, oil still dominates energy consumption in thetransport sector in 2035, accounting for 83% of the total. In the European Union, attitudestowards nuclear power have seen a negative shift over the past year. This shift results inseveral nuclear plant retirements occurring earlier in the Outlook period than projected inWEO-2010, principally in Germany in the period 2020 to 2025. Installed nuclear capacity isestimated to be 129 GW in 2035, around 8 GW (6%) lower than projected in WEO-2010,with the gap being filled largely by natural gas and renewables. Consumption of renewableenergy sees strong growth of around 3.5% per year over the Outlook period. The share ofrenewables in the energy mix increases from 10% in 2009 to 23% in 2035, with wind powerand, to a lesser extent, solar photovoltaic (PV) becoming prominent.
Figure 2.10 ! Energy mix in selected countries and regions in theNew Policies Scenario, 2035
0% 20% 40% 60% 80% 100%
Oil Coal Gas Nuclear Renewables
Ladn America
European Union
India
United States
China
Russia
Middle East
830Mtoe
1 730Mtoe
1 460Mtoe
2 270Mtoe
3 840Mtoe
830Mtoe
1 000Mtoe
The energy outlook for Japan has been impacted by a number of factors over the lastyear, many derived from the earthquakes and tsunami that struck the country and theresultant damage to the Fukushima Daiichi nuclear power plant. Total energy demand isexpected to continue to recover in the short term, before resuming a longer-term decliningtrend, and reaches almost 480 Mtoe in 2035. An upward revision to population estimatesand a less certain outlook for climate-related policies contribute to total energy demandbeing 2% higher in 2035 than inWEO-2010. The share of fossil fuels in Japan’s energy mixdeclines from 81% in 2009 to 70% in 2035 but, within this, demand for coal and oil dropssignificantly, while demand for natural gas increases. Demand for oil declines by more thanone-quarter, underpinned by a 31% decline in energy demand in the transport sector. Thisresults from market saturation in road transport, improved fuel efficiency and increased
© O
EC
D/IE
A, 2
011
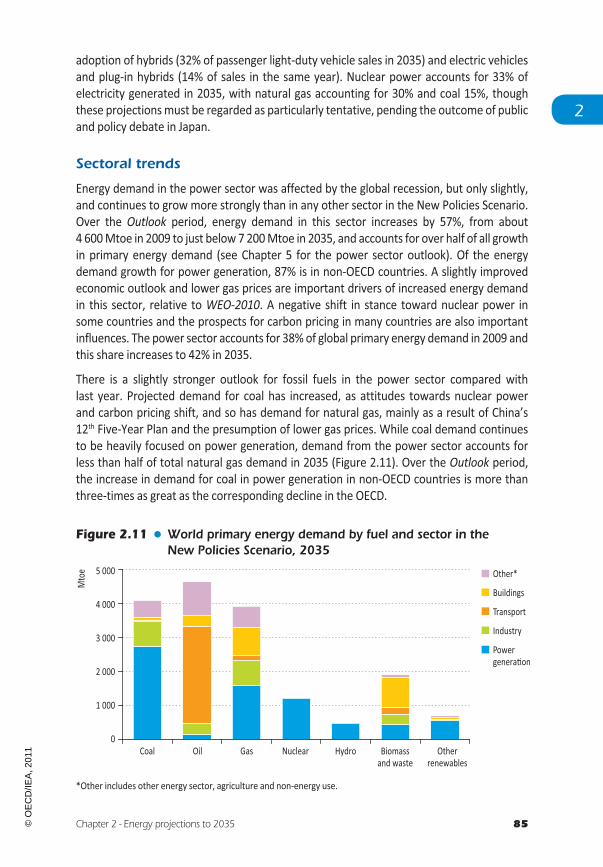
Chapter 2 - Energy projections to 2035 85
2
adoption of hybrids (32% of passenger light-duty vehicle sales in 2035) and electric vehiclesand plug-in hybrids (14% of sales in the same year). Nuclear power accounts for 33% ofelectricity generated in 2035, with natural gas accounting for 30% and coal 15%, thoughthese projectionsmust be regarded as particularly tentative, pending the outcome of publicand policy debate in Japan.
Sectoral trends
Energy demand in the power sector was affected by the global recession, but only slightly,and continues to grow more strongly than in any other sector in the New Policies Scenario.Over the Outlook period, energy demand in this sector increases by 57%, from about4 600Mtoe in 2009 to just below7 200Mtoe in 2035, and accounts for over half of all growthin primary energy demand (see Chapter 5 for the power sector outlook). Of the energydemand growth for power generation, 87% is in non-OECD countries. A slightly improvedeconomic outlook and lower gas prices are important drivers of increased energy demandin this sector, relative to WEO-2010. A negative shift in stance toward nuclear power insome countries and the prospects for carbon pricing in many countries are also importantinfluences. The power sector accounts for 38%of global primary energy demand in 2009 andthis share increases to 42% in 2035.
There is a slightly stronger outlook for fossil fuels in the power sector compared withlast year. Projected demand for coal has increased, as attitudes towards nuclear powerand carbon pricing shift, and so has demand for natural gas, mainly as a result of China’s12th Five-Year Plan and the presumption of lower gas prices. While coal demand continuesto be heavily focused on power generation, demand from the power sector accounts forless than half of total natural gas demand in 2035 (Figure 2.11). Over the Outlook period,the increase in demand for coal in power generation in non-OECD countries is more thanthree-times as great as the corresponding decline in the OECD.
Figure 2.11 ! World primary energy demand by fuel and sector in theNew Policies Scenario, 2035
0
1 000
2 000
3 000
4 000
5 000
Coal Oil Gas Nuclear Hydro Biomassand waste
Otherrenewables
Mtoe Other*
Buildings
Transport
Industry
Powergeneradon
*Other includes other energy sector, agriculture and non-energy use.
© O
EC
D/IE
A, 2
011

86 World Energy Outlook 2011 - GLOBAL ENERGY TRENDS
The outlook for nuclear power has been affected by the Fukushima Daiichi accident and thesubsequent policy response to it in a number of countries. Global use of nuclear power is5% lower than projected inWEO-2010, though it still increases, to 4 660 TWh, in 2035. Thereduction in theOECD is driven by changes in Japan, Europe and theUnited States. However,the outlook in non-OECD countries has been impactedmuch less, with existing plans delayedrather than discarded. The increase in the use of nuclear power in non-OECD countries ismore than two-and-a-half times that of the increase in the OECD over the Outlook period.In 2035, total installed nuclear capacity in non-OECD countries reaches more than 250 GW,compared with 380 GW in the OECD.
Total electricity generation from renewable sources increases from 3 900 TWh in 2009 to11 100 TWh in 2035, its share of total generation growing from 19% to 31%. Throughoutthe Outlook period, hydropower is the largest renewable source of electricity generation.Electricity generated from wind power increases by nearly ten-times over the Outlookperiod, reaching 2 700 TWh in 2035. China’s consumption of electricity generated fromwindpower surpasses that of the European Union soon after 2030. Solar generated electricity(solar PV and concentrating solar power [CSP]) sees strong growth globally, particularly inthe second half of the Outlook period, and reaches 1 050 TWh in 2035. Global electricitygenerating capacity using renewable sources increases from 1 250 GW in 2009 to 3 600 GWin 2035.
Total final consumption4 by end-users is projected to grow by 1.3% per year, reachingabout 11 600 Mtoe by 2035. Global demand in the industry sector grows by 49% over theOutlook period (Figure 2.12), increasing its share of total final consumptionmarginally, from27% in 2009 to 29% in 2035. Non-OECD countries dominate demand growth in this sector,with China alone accounting for 36% of global growth and India a further 17%. OECDindustrial energy demand increases through to 2020, before dropping back slightly to justunder 890 Mtoe in 2035. Natural gas, electricity and renewables experience the strongestgrowth in this sector, all averaging growth per year of 2% or more, whereas coal seesmore modest demand growth of 0.7% per year and oil is 0.1% per year. Coal continuesto dominate energy input to iron and steel production. In the chemicals sector, use ofelectricity increases significantly from 2009 to 2035.
Energy demand in the transport sector increases by 43% to reach 3 260 Mtoe in 2035.Demand in non-OECD countries increases by 2.9% per year on average and, together withinter-regional transport, accounts for all of the net energy demand growth in the transportsector. China alone accounts for more than one-third of global demand growth in thetransport sector. India sees demand increase progressively over theOutlook period, with theaverage annual rate of growth going from around 3.5% up to 2020 to more than 7% from2020 to 2035. In contrast, the OECD sees a slight decline in demand over theOutlook period,with a notable reduction in Japan.
4. Total final consump!on (TFC) is the sum of consump!on by the various end-use sectors. TFC is broken down intoenergy demand in the following sectors: industry, transport, buildings (including residen!al and services) and other(including agriculture and non-energy use). It excludes interna!onal marine and avia!on bunkers, except at world levelwhere it is included in the transport sector.
© O
EC
D/IE
A, 2
011

Chapter 2 - Energy projections to 2035 87
2
Figure 2.12 ! Incremental energy demand by sector and region in theNew Policies Scenario, 2009-2035
-500 0 500 1 000 1 500 2 000 2 500 3 000
Other*
Buildings
Transport
Industry
Other energy sectors
Power generadon
Mtoe
OECD
China
India
Othernon-OECD
Inter-regional(bunkers)
Finalconsum
pdon
* Includes agriculture and non-energy use.
Road transport demand continues to dominate in the transport sector, representing 75% ofdemand in 2035. Oil demand in the road transport sector increases by 32%over theOutlookperiod, from 35mb/d in 2009 to 45mb/d in 2035. While many countries have adopted fuelefficiency standards, the growth in demand in non-OECD countries more than offsets theeffect of these improvements. The global stock of road transport vehicles nearly doublesbetween 2009 and 2035, but the adoption of stronger efficiency standards, a shift inmarketfocus toward non-OECD countries with lower average vehicle usage levels and, to someextent, the increased use of alternative vehicle technologies, means that the increase inenergy demand is only around 42%.While the picture improves, the penetration of electricvehicles remains relatively small globally in 2035.
In 2009, an average of around 40 in every 1 000 people in non-OECD countries own apassenger light-duty vehicle (PLDV). In the OECD, the average approached 500 PLDVsper 1 000 people. In the New Policies Scenario, annual PLDV sales in non-OECD countriesare projected to overtake those in OECD countries by around 2020 and reach more than100million by 2035. Both China and India see a huge increase in the average level of vehicleownership from 2009 to 2035. The PLDV stock in non-OECD countries overtakes that ofthe OECD in the early 2030s. However, vehicle ownership levels in non-OECD countries, atabout 125 PLDVs per 1 000 people in 2035, remain well below the OECD levels of almost550 per 1 000 people in 2035 (Figure 2.13).
In the buildings sector, global energy demand increases by 34%, driven largely by new-buildin non-OECD countries, but the sector’s share of total final consumption declinesmarginally.Electricity consumption grows on average by 2.2% a year in this sector, benefitting fromincreased competitiveness and greater appliance penetration in non-OECD countries. Policyintervention facilitates the growth of renewables in this sector (largely solar thermal) bothin the OECD and non-OECD countries.
© O
EC
D/IE
A, 2
011

88 World Energy Outlook 2011 - GLOBAL ENERGY TRENDS
Global demand for electricity is projected to increase by nearly 85% over the Outlookperiod, reaching over 31 700 TWh in 2035 (see Chapter 5). More than four-fifths of thegrowth in global electricity demand arises in non-OECD countries, as a result of greateruse of household appliances and of electrical equipment in the industry and servicessectors, as access to electricity increases and prosperity rises (see Chapter 13). Despitethis growth, average electricity demand per capita in non-OECD countries in 2035 is stillonly 31% that of the OECD. Developing Asia sees its share of global electricity consumptionincrease from 28% in 2009 to 44% in 2035. China alone accounts for almost 30% of theworld’s total electricity consumption by the end of the Outlook period. In the OECD, theslower growth in electricity demand stems from lower rates of economic and populationexpansion, greater energy efficiency improvements and the adoption of measures suchas carbon pricing.
Figure 2.13 ! Number of PLDVs per thousand people by region, 2009 and2035, and the change in oil demand in road transport
-4
-2
0
2
4
6
8
0
200
400
600
800
UnitedStates
EuropeanUnion
Japan China India Russia Brazil
mb/d Addidonal PLDVs
in 2035 over 2009
PLDVs in 2009
Numbe
rofveh
icles
pertho
usandp
eople
Change in oildemand:2009-2035(right axis)
Energy production and trade
The events of the past year, while casting shadows over future energy supply prospects atleast asmenacing as those obscuring the pattern of future demand, do not call into questionone thing: the world’s endowment of economically exploitable energy resources is morethan sufficient to satisfy the projected level of global consumption over the Outlook periodand well beyond. The global pattern of production will change, with non-OECD countriesaccounting for all of the net global increase in oil and coal production between 2009and 2035 in the New Policies Scenario and most of the increase in natural gas production(Figure 2.14). The details are examined, fuel-by-fuel and sector-by-sector, in subsequentchapters. This section briefly surveys the production prospects, setting the scene forthe subsequent focus, in the concluding sections of the chapter, on four issues closelyrelated to the future pattern of production: the changing profile of inter-regional energytrade; spending on imports; the scale and adequacy of investment in the energy-supplyinfrastructure; and energy-related emissions, notably of CO2.
© O
EC
D/IE
A, 2
011

Chapter 2 - Energy projections to 2035 89
2
Figure 2.14 ! Incremental world energy supply by fuel in the New PoliciesScenario, 2009-2035
-400
0
400
800
1 200
1 600
Oil Gas Coal Nuclear Biomassand waste
Otherrenewables
Hydro
Mtoe OECD
Non-OECD
Resources and produc!on prospectsTotal world oil production, excluding processing gains and biofuels, was nearly 84 mb/d in2010 and is slightly more than 96 mb/d by 2035 in the New Policies Scenario, an increaseof 15%. A growing share of this production comes from unconventional sources, includingoil sands and extra-heavy oil (see Chapter 3). Proven reserves of oil increased to 1.47 trillionbarrels at the end of 2010 according to the Oil and Gas Journal (O&GJ, 2010) or 48 years ofproduction at existing levels. Remaining recoverable resources are estimated to be muchlarger and could reach nearly 5.5 trillion barrels. Total non-OPEC oil production is projectedto peak at 51mb/d shortly after 2015 and then fall to less than 48mb/d in 2035. Productiondeclines in most non-OPEC countries, with Brazil, Canada and Kazakhstan being notableexceptions. In contrast, OPEC oil production continues to grow over the Outlook period,reaching nearly 49 mb/d in 2035, pushing its share of world production from 42% in 2010to 51% in 2035.5 The Middle East region is expected to increase oil production by around12 mb/d, reaching a total of 37 mb/d by the end of the Outlook period (Figure 2.15). WhileSaudi Arabia continues to be the largest oil producer in the region, Iraq experiences thelargest growth in production over the Outlook period. Though its potential to increase oilproduction from existing levels is large, in the short term, production growth in Iraq will beconstrained by the need for infrastructure investment. Heightened geopolitical tension intheMiddle East and North Africa continues to provide a more challenging backdrop againstwhich to make long-term investment decisions. The fundamental concern is being able tojudge the implications of these developments on short-term oil supply, and whether theymight serve to defer investment essential to provide supply in the medium to long term(Chapter 3 analyses the implications of a Deferred Investment Case).
Global coal production is projected to rise by 19% between 2009 and 2035, with most ofthe growth occurring before 2020, reaching 5 860 Mtce by the end of the Outlook period.
5. OPEC is the Organiza!on of the Petroleum Expor!ng Countries. As of mid-2011, its member countries includedAlgeria, Angola, Ecuador, Iran, Iraq, Kuwait, Libya, Nigeria, Qatar, Saudi Arabia, United Arab Emirates and Venezuela. Forpurposes of comparison,WEO-2011 assumes that this membership remains unchanged throughout the Outlook period.
© O
EC
D/IE
A, 2
011

90 World Energy Outlook 2011 - GLOBAL ENERGY TRENDS
Nearly all of the production growth comes from non-OECD countries and, at more than1 000 Mtce, the total increase in non-OECD countries is more than five-times the size ofthe offsetting net decrease in the OECD. The share of global coal production in non-OECDcountries increases from72% in 2009 to almost 80% in 2035. China sees the biggest increasein absolute terms with output growing by around 540 Mtce, although the rate of increasein production is higher in India and Indonesia. Until 2020, production of steam coal growsat around the same rate as that of coking (or metallurgical)6 coal, reflecting similar trends inthe growth in coal-fired power generation capacity and steel demand. Coal is estimated tobe theworld’smost abundant fossil fuel. Proven reserves of coal are estimated to be around1 trillion tonnes, equivalent to 150 years ofworld production in 2009 (BGR, 2010). Remainingresources are estimated to be over 21 trillion tonnes.
Figure 2.15 ! Oil production in selected regions in the New PoliciesScenario, 2010 and 2035
0
10
20
30
40
Middle East North America E. Europe/Eurasia Africa Ladn America
mb/d
2010
Incrementalproducdonin 2035over 2010
In the New Policies Scenario, global natural gas production increases by 56% from 2009, toreach 4 750 bcm in 2035. Non-OECD countries account for 91% of the projected increase,most of it coming from the largest existing gas producers. The Middle East, with the largestreserves and lowest production costs, sees the biggest increase in absolute terms, thoughRussia and the Caspian also see a significant increase. Chinamore than triples its productionof natural gas over the Outlook period. In the OECD, the United States and Australia arethe main areas of gas production growth, mainly in the form of unconventional gas. Theglobal production of unconventional gas increases by about two-and-a-half times, toexceed 1 000 bcm before 2035. Unconventional gas represents 39% of the growth in gasproduction over the Outlook period – its share of total gas production increases from13% in 2009 to 22% in 2035.
Proven natural gas reserves are estimated to stand at 190 trillion cubic metres (tcm)(Cedigaz, 2010), around twice the amount of gas produced to date (see Chapter 4).Total recoverable global natural gas resources are estimated to be equivalent to around265 years of the consumption level in 2009. Further exploration, development and
6. Strictly speaking,metallurgical coal includes all types of coal used in themetals sectors. Although coking coal accountsfor most of this, it also includes small quan!!es of high-quality steam coal.
© O
EC
D/IE
A, 2
011

Chapter 2 - Energy projections to 2035 91
2
production continue to clarify the scale of unconventional gas resources worldwide andthe prospects for their exploitation. Unconventional gas resources are now estimated tobe of comparable size to conventional resources. However, the use of hydraulic fracturingin unconventional gas production has raised environmental concerns and is challenging theadequacy of existing regulatory regimes.
The estimated resource base of uranium, the raw material for nuclear fuel, remainssufficient to fuel the world’s nuclear reactors at current consumption rates well beyond theOutlook period (NEA and IAEA, 2010).
In resource terms, significant potential remains for expanding energy production fromrenewables, but the impact of the global recession has tested the readiness and abilityof some governments to maintain levels of support. In the New Policies Scenario, totalelectricity generation from renewables increases by more than 180% over the Outlookperiod, with wind power, hydropower and biomass being the largest sources of growth.While the amount of electricity generated from solar PV, CSP, geothermal and marine alsogrows significantly over the Outlook period, their starting point is low and their collectivecontribution to satisfying global electricity demand remains relatively small in 2035. In theOECD, the share of total electricity generation coming from renewables increases from18% in 2009 to 33% in 2035. This compares to an increase from21% to 29%across non-OECDcountries, on average. Globally, China is the largest producer of electricity from renewablesin 2035, with its output fromhydropower alone surpassing the electricity generated from allforms of renewables collectively in any other single country (Figure 2.16).
Figure 2.16 ! Largest producers of electricity from renewables in theNew Policies Scenario, 2035
0
500
1 000
1 500
2 000
2 500
3 000
China EuropeanUnion
UnitedStates
India Brazil
TWh Marine
Geothermal
Concentradngsolar power
Solar PV
Biomass and waste
Wind
Hydro
Inter-regional trade
Inter-regional energy trade plays an understated, but vital, role in the broader energy systemand depends on the provision of adequate energy transport and storage infrastructure.Increased inter-connectivity provides the energy system with flexibility and redundancy,but it also means that sudden changes in one part may have a broad impact. While verydifferent in their nature, sudden, unexpected events, such as those at Fukushima and in
© O
EC
D/IE
A, 2
011

92 World Energy Outlook 2011 - GLOBAL ENERGY TRENDS
Libya, demonstrated both the capacity of the global energy system to react to changingglobal supply-demand patterns and also some of its limitations.
Three-quarters of all energy is consumedwithin the country or region inwhich it is produced.However, the proportion of energy traded across regions, the patterns of trade and thestructure of the market differ significantly by fuel. In the New Policies Scenario, the OECDshare of total inter-regional energy trade declines from 42% in 2009 to 29% in 2035 andbecomes increasingly concentrated on natural gas and oil, to the detriment of coal. Outside ofthe OECD, Asia accounts for an increasing proportion of global energy trade in all fossil fuels.
The amount of oil traded between major regions increases by about 30% to 53 mb/d in2035, the share in total global consumption growing to 54%. Net imports of oil into theOECDdecline consistently across the Outlook period, from 24 mb/d in 2010 to 17 mb/d in 2035.Net imports into the United States decrease significantly over the Outlook period, due bothto decreasing demand and a slight increase in domestic supply (Figure 2.17). Oil imports intothe EuropeanUnion remain steady at 9.8mb/duntil around2020, before declining gradually,to reach 8.8 mb/d in 2035. China’s oil imports increase by more than two-and-a-half timesover the Outlook period to reach 12.6 mb/d in 2035, nearly twice the level of Russia’s oilexports, or around one-third of OPEC exports, in the same year. China overtakes the UnitedStates to become the world’s largest oil importer shortly after 2020. Its import dependenceincreases from 54% in 2010 to 84% in 2035. India’s oil imports increase by more than4%per year over theOutlookperiod to reach6.8mb/d, its relianceon imports increasing from73% in 2010 to 92% in 2035. Such increased reliance on oil imports in many countries(particularly non-OECD countries) is likely to lead to attention being given to the issue ofsecurity of supply. Over theOutlook period, OPEC oil exports increase by 42% to 38.4mb/d.Russia’s net oil exports decline from 7.5 mb/d in 2010 to 6.4 mb/d in 2035, driven primarilyby decreasing levels of production.
Figure 2.17 ! Oil demand and the share of imports by region in the NewPolicies Scenario, 2010 and 2035
0
3
6
9
12
15
18
mb/d Imports
Domesdcproducdon
2010 2035 2010 2035 2010 2035 2010 20352010 2035 2010 2035United States Japan European Union Other AsiaChina India
In the New Policies Scenario, most coal is consumed domestically, meaning that global coaltrade remains small relative to overall demand. Nonetheless, trade in hard coal betweenmajor regions is projected to increase from 750 Mtce in 2009, growing rapidly to 2020 but
© O
EC
D/IE
A, 2
011

Chapter 2 - Energy projections to 2035 93
2
stabilising thereafter, to settle around 1 000Mtce in 2035 – around 18% of world hard coalproduction. The pattern of trade will continue to shift towards Asia and away from AtlanticBasin markets. The OECD as a whole ceases to be an importer of hard coal, becoming a netexporter around 2030. Japan, the largest coal importer in 2009, sees its import requirementpeak early in the Outlook period and then decline gradually, to reach 115 Mtce in 2035.A coal exporter until recently, China sees its import requirement exceed that of Japanaround 2015, peak at nearly 200 Mtce shortly after 2015 and then decline to around80 Mtce in 2035. However, the scale of China’s coal appetite is so huge, relative to others,that even quite a small shift in its domestic demand-supply balance can have majorimplications for the global picture (Spotlight on the role of China in traded coal markets).India’s hard coal imports increase by more than 6% per year over the Outlook period,becoming the world’s largest importer soon after 2020 and importing nearly 300 Mtce in2035, nearly five-times the level of 2009. India is expected to look first to Indonesia, Australiaand South Africa to satisfy its import needs. Australia sees its hard coal exports peak before2020 and then gradually decline to around 300 Mtce in 2035, still 18% higher than 2009.Indonesia sees its hard coal exports increase from 190 Mtce in 2009 to around 280 Mtce in2035, but are on a declining path later in the Outlook period.Inter-regional trade in natural gas nearly doubles over the Outlook period, increasing from590 bcm in 2009 to around 1 150 bcm in 2035. The expansion occurs in both pipeline gas andliquefied natural gas (LNG). The proportion of gas that is traded across regions increases from19% in 2009 to 25% in 2035. The market for natural gas becomes more globalised over theOutlook period, but only gradually. The need for natural gas imports into the EuropeanUniongrows from 310 bcm in 2009 to 540 bcm in 2035 and its dependence on imports increasesfrom61% to 86% (Figure 2.18). Reflecting the growing availability of domestic unconventionalgas, natural gas imports into the United States decline from early in the Outlook period andremain relatively small throughout. Developing Asiamoves frombeing amarginal exporter ofnatural gas in 2009 to importing nearly 300 bcm in 2035. China accounts for around 210 bcmof these imports in 2035 and its share of imports increases from 8% to 42%.
Figure 2.18 ! Natural gas demand and the share of imports by region in theNew Policies Scenario, 2009 and 2035
0
100
200
300
400
500
600
700
800 Imports
Domesdcproducdon
2009 2035 2009 2035 2009 2035 2009 20352009 2035 2009 2035United States Japan European Union Other AsiaChina India
bcm
Note: Other Asia had net natural gas exports of 56 bcm in 2009.
© O
EC
D/IE
A, 2
011

94 World Energy Outlook 2011 - GLOBAL ENERGY TRENDS
Natural gas exports from Russia more than double over theOutlook period, reaching around330 bcm by 2035. Exports from the Caspian region more than treble, to reach around135 bcm in 2035. Gas supplies from both Russia and the Caspian are increasingly pulledeastwards, mainly to satisfy the rapidly growing demand of China. Natural gas exports fromAfrica increase bymore than 4% per year, reaching 280 bcm in 2035, and go both by pipelineto Europe and further afield as LNG.With the benefit of the giant Gorgon project and others,Australia becomes an increasingly important gas exporter. LNG exports from Australiaincrease from 14 bcm in 2009 to 85 bcm in 2020 and 115 bcm in 2035. Led by Qatar, naturalgas exports from theMiddle East increase significantly. In 2035, the Middle East is exportingaround 150 bcm of natural gas, through a mix of pipelines and LNG, to Europe and Asia.
S P O T L I G H T
China’s role in traded coal markets – the ultimate uncertainty?
China has long been a net exporter of coal, but became a net importer in 2009 – adevelopment foreseen inWEO-2007 (IEA, 2007). China’s net coal imports surged byaround 45% in 2010 to an estimated 126 Mtce, making it the world’s second largestimporter after Japan. Based on preliminary data, net imports may fall back in 2011,but they are still likely to stay above 100 Mtce. As China is by far the world’s biggestcoal producer and has massive resources, China as a coal importer could be seen insomeways as analogous to Saudi Arabia as an oil importer. The speed andmagnitudeof this abrupt turnaround has had a major impact on traded coal markets.
China’s coal imports have been driven primarily by price. In late 2008, world coalprices and freight rates fell sharply, as the financial crisis took hold. Delivered pricesfor China’s domestic coal also fell, but to a lesser extent as a result of transportbottlenecks and supply constraints. This made imported coal cheaper than domesticgrades in some locations. For example, by October 2009, steam coal delivered to theeast coast of China from Indonesia was up to 40% cheaper than domestic coal on aquality-adjusted basis. Imports were also necessary to meet the need for high-qualityhard coking coal for steel making. The surge in imports has created opportunitiesfor coal exporters within reasonable reach of China, including Indonesia, Australia,Mongolia, Russia, the United States and Canada. Many exporters are now increasingproduction in the expectation of future Chinese demand growth, but this strategyis not without risk. Despite the massive scale of China’s imports – estimated to be15% of globally traded coal in 2010 – they met just 5% of its demand. Therefore,very slight changes in China’s domestic coal demand or supply could push it back tobecoming a net exporter, competing against the countries that are now investing tosupply its needs. For example, net imports would fall to zero by 2015 (compared withour projection of around 185 Mtce) if China’s output were just 1.2% per year abovethe level in the New Policies Scenario. Many people are asking: is China’s status as anet importer temporary or a new structural feature of the market?
© O
EC
D/IE
A, 2
011

Chapter 2 - Energy projections to 2035 95
2
The answer will depend on China’s ability to meet rising demand from domesticproduction and how that affects the spread between domestic and internationalprices. At present, the competitiveness of China’s coal production is hindered byinsufficient rail infrastructure between producing regions in the north and west ofthe country and demand centres in the east and south. In some locations, coal hasto be transported by road at a higher cost. But some of these pressures look set toease. Transport capacity is set to expand under China’s 12th Five-Year Plan and large“coal power bases” are to be built to convert coal to electricity close to where itis mined for transmission to demand centres. There are also plans for furthercoal-to-liquids projects. The consolidation of China’s coal sector is also expected toimprove its productivity and competitiveness. On the other hand, mining in China ismoving further west, as Inner Mongolia overtakes Shanxi as the major coal area, andis going deeper and exploiting poorer quality seams.Most analysts agree that China will remain a net importer over the medium term, atleast, as it is unlikely to expand itsmining and transport infrastructure quickly enough.But the exact level of imports is uncertain, even more so post-2020 and particularlysteam coal. What is certain is that developments in China’s coal market will remainone of themost important factors in determining global coal prices and trade patterns.
Spending on imports
A combination of increasing reliance on energy imports and relatively high energy priceshas seen the energy import bill weigh more heavily on many national accounts in recentyears. Global annual expenditure on oil and gas imports is expected to move sharplyhigher in 2011 than 2010, driven primarily by oil prices (Chapter 1 details oil and naturalgas price assumptions). If oil prices (IEA import price) average $100 per barrel over 2011,it is likely to be the first year in which collective OPEC net oil revenues exceed $1 trillion.
Annual global expenditure on oil and gas imports more than doubles over the Outlookperiod, reaching nearly $2.9 trillion in 2035 under our assumptions. The share of naturalgas within total spending also increases over time. Even with the measures that areassumed to be introduced to restrain growth in energy demand, the New Policies Scenarioimplies a persistently high level of spending on oil and gas imports by many countries. Asa proportion of GDP (at market exchange rates), India’s projected spending on energyis highest and it remains above 4% in 2035 (Figure 2.19). In absolute terms, India seesits oil and gas- import bill overtake that of Japan before 2030 and overtake that of theUnited States by the end of the Outlook period, standing at around $330 billion in 2035(Figure 6.11 in Chapter 6 shows oil-import bills in absolute terms in selected countriesby scenario). China sees its oil and gas-import bill increase from under $100 billion in2009 to $660 billion in 2035 (in 2010 dollars), overtaking the European Union soon after2030. China’s import bill remains around 3% of GDP. In the United States, the increasingprominence of domestic supplies in meeting demand means that expenditure on oil andgas imports declines in absolute terms, to around $275 billion in 2035, and also as a shareof GDP.
© O
EC
D/IE
A, 2
011
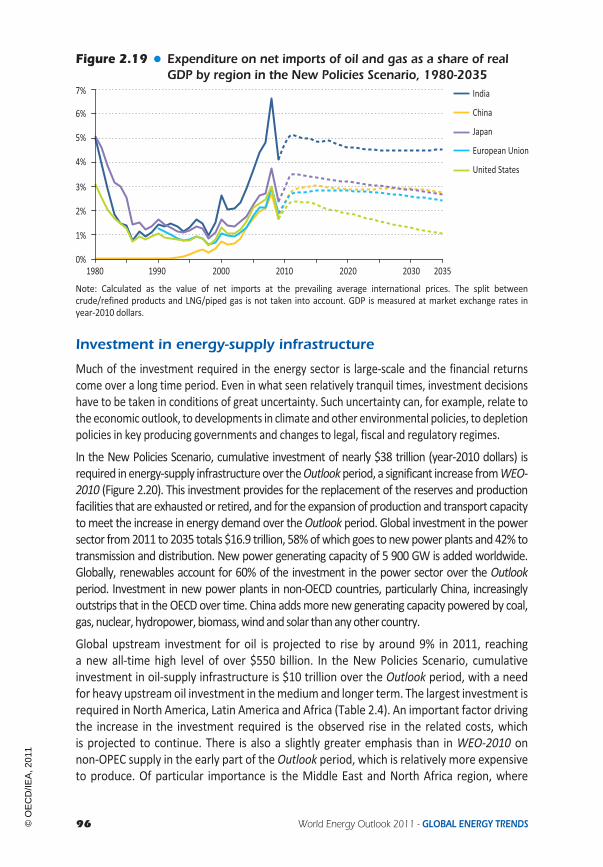
96 World Energy Outlook 2011 - GLOBAL ENERGY TRENDS
Figure 2.19 ! Expenditure on net imports of oil and gas as a share of realGDP by region in the New Policies Scenario, 1980-2035
0%
1%
2%
3%
4%
5%
6%
7%
1980 1990 2000 2010 2020 2030 2035
India
China
Japan
European Union
United States
Note: Calculated as the value of net imports at the prevailing average international prices. The split betweencrude/refined products and LNG/piped gas is not taken into account. GDP is measured at market exchange rates inyear-2010 dollars.
Investment in energy-supply infrastructure
Much of the investment required in the energy sector is large-scale and the financial returnscome over a long time period. Even in what seen relatively tranquil times, investment decisionshave to be taken in conditions of great uncertainty. Such uncertainty can, for example, relate tothe economic outlook, to developments in climate and other environmental policies, to depletionpolicies in key producing governments and changes to legal, fiscal and regulatory regimes.In the New Policies Scenario, cumulative investment of nearly $38 trillion (year-2010 dollars) isrequired inenergy-supply infrastructureover theOutlookperiod, a significant increase fromWEO-2010 (Figure 2.20). This investment provides for the replacement of the reserves and productionfacilities that are exhausted or retired, and for the expansion of production and transport capacitytomeet the increase in energy demand over theOutlook period. Global investment in the powersector from2011 to 2035 totals $16.9 trillion, 58%ofwhich goes to newpower plants and 42% totransmission and distribution. New power generating capacity of 5 900 GW is added worldwide.Globally, renewables account for 60% of the investment in the power sector over the Outlookperiod. Investment in new power plants in non-OECD countries, particularly China, increasinglyoutstrips that in theOECD over time. China addsmore new generating capacity powered by coal,gas, nuclear, hydropower, biomass,windandsolar thananyother country.Global upstream investment for oil is projected to rise by around 9% in 2011, reachinga new all-time high level of over $550 billion. In the New Policies Scenario, cumulativeinvestment in oil-supply infrastructure is $10 trillion over the Outlook period, with a needfor heavy upstreamoil investment in themedium and longer term. The largest investment isrequired in North America, Latin America and Africa (Table 2.4). An important factor drivingthe increase in the investment required is the observed rise in the related costs, whichis projected to continue. There is also a slightly greater emphasis than in WEO-2010 onnon-OPEC supply in the early part of the Outlook period, which is relatively more expensiveto produce. Of particular importance is the Middle East and North Africa region, where
© O
EC
D/IE
A, 2
011

Chapter 2 - Energy projections to 2035 97
2
investment needs are not as high, but required production increases are substantial: it iscrucial that these investments are made in a timely manner (see the Deferred InvestmentCase in Chapter 3). Upstream investment in conventional oil is more than ten-times greaterthan investment in unconventional oil over the Outlook period. The largest investments inrefining are expected to take place in China, India, theMiddle East and the United States.
Figure 2.20 ! Cumulative investment in energy-supply infrastructure by fuelin the New Policies Scenario, 2011-2035 (in year-2010 dollars)
0 5 10 15 20 25 30 35 40Trillion dollars (2010)
Power
Oil
Gas
Coal
Biofuels
Power: $16.9 trillion Oil: $10.0 trillion
Gas: $9.5 trillion Coal: $1.2 trillion
Total investment: $37.9 trillion
71%
6%
23% Upstream
LNG chain
Transmission anddistribudon
87%
10%3%
Upstream
Refining
Transport58%
11%
31% Generadon
Transmission
Distribudon
94%
6%
Mining
Shipping andports
Total cumulative investment requirements in the coal industry are nearly $1.2 trillion overthe Outlook period, or $47 billion per year. Around 94% of this sum is for mining, whichincludes both opening newmines and developing existing mines. China’s investment needsare much greater than those of any other single country and this investment must besustained throughout the Outlook period, even after domestic demand has peaked. In theOECD, Australia requires the largest investment in coal, followed by the United States.
Cumulative investment in the natural gas supply chain is projected to be $9.5 trillion.Exploration and development of gas fields, including bringing new fields on stream andsustaining output at existing fields,will absorb 71%of total gas investment,while transmissionand distribution absorbs the rest. One-quarter of total upstream investment goes tounconventional gas, the remainder funding development and production of conventional gas.
The OECD accounts for around 36% of the cumulative investment required in energy supplyover the Outlook period. The relatively high level of investment required in the OECD
© O
EC
D/IE
A, 2
011

98 World Energy Outlook 2011 - GLOBAL ENERGY TRENDS
countries, compared with the OECD share of energy demand growth, is attributable to theneed to retire and replace more ageing energy infrastructure, the relatively more capital-intensive energy mix and the higher average cost of its capacity additions in each category.The United States accounts for 14% of global cumulative energy supply investment over theOutlook period. China accounts for around 15%of global cumulative investment, amountingto $5.8 trillion and is heavily focused on the power sector (Figure 2.21). Latin America, AfricatheMiddle East and Russia all require significant levels of investment, particularly in oil andgas, over theOutlook period.
Table 2.4 ! Cumulative investment in energy-supply infrastructure by fueland region in the New Policies Scenario, 2011-2035(billion in year-2010 dollars)
Coal Oil Gas Power Biofuels Total
OECD 175 2 703 3 756 6 897 216 13 746Americas 78 2 100 2 172 3 009 142 7 501
Europe 7 511 1 019 2 892 72 4 501
Asia Oceania 90 91 565 996 2 1 745
Non-OECD 934 7 027 5 661 9 986 136 23 744E. Europe/Eurasia 38 1 398 1 562 1 029 6 4 033
Russia 24 787 1 077 614 0 2 502Asia 812 963 1 664 7 018 60 10 518
China 647 510 638 3 968 31 5 794India 87 203 266 1 631 16 2 203
Middle East 0 1 137 510 583 0 2 230
Africa 52 1 557 1 316 638 3 3 564
Latin America 32 1 971 609 718 68 3 399
Inter-regional transport 55 268 80 - 4 407World 1 164 9 997 9 497 16 883 356 37 897
Figure 2.21 ! Cumulative investment in energy-supply infrastructure byregion in the New Policies Scenario, 2011-2035
0 1 2 3 4 5 6 7 8
OECDAmericasChina
OECD EuropeAfrica
Ladn AmericaOther Asia
RussiaMiddle East
IndiaOECDAsia Oceania
Other E. Europe/Eurasia
Trillion dollars (2010)
Power
Oil
Gas
Coal
Biofuels
© O
EC
D/IE
A, 2
011

Chapter 2 - Energy projections to 2035 99
2
Energy-related emissions
Greenhouse gases
The decline in energy-related CO2 emissions caused by the global economic recessionhas been short-lived, erased by an increase in 2010 of more than 5%, to 30.4 Gt. In theNew Policies Scenario, energy-related CO2 emissions continue to increase, rising bynearly 20%, to 36.4 Gt in 2035 (Figure 2.22). This leads to an emissions trajectory consistentwith a long-term global temperature increase of more than 3.5°C. The energy sector wasresponsible for 65% of all greenhouse-gas emissions globally in 2010 and is expected to seeits share increase to 72% in 2035.
Energy consumed in power plants, factories, buildings and other energy-using equipmentexisting or under construction in 2010 account for 70%, or 23.9 Gt, of global CO2 emissions in2020. This share declines to 44% in 2035. These figures illustrate the long lifetimes associatedwith energy-using equipment and infrastructure, the power generation and industry sectorsexhibiting the largest “lock-in” of emissions. Unless there is widespread retrofitting withcarbon capture and storage, in these sectors in particular, or early retirement of the capitalstock, these emissions represent large-scale immoveable inertia that is felt to 2035 andbeyond (see Chapter 6 for analysis on the lock-in of CO2 emissions in the energy sector).
Figure 2.22 ! Energy-related CO2 emissions in the New Policies Scenarioby fuel, 1980-2035
0
5
10
15
20
25
30
35
40
1980 1990 2000 2010 2020 2030 2035
Gt Gas
Oil
Coal
Energy-related CO2 emissions from coal increase from 13.3 Gt in 2010 to 14.9 Gt in 2035,having actually peaked at around 15.5 Gt before 2020 and then declined graduallythereafter. This is due to the induced switching to natural gas in many applications andto sustained support for renewables in the power sector. CO2 emissions from oil increasethroughout the Outlook period, going from 10.9 Gt in 2010 to 12.6 Gt in 2035, but therate of growth is slower after 2020. While natural gas emits the least CO2 of all fossil fuelswhen combusted, relatively strong demand growth throughout the Outlook period resultsin CO2 emissions from natural gas increasing by an average of 1.5% per year, rising from6.1 Gt in 2010 to 8.9 Gt in 2035.
© O
EC
D/IE
A, 2
011

100 World Energy Outlook 2011 - GLOBAL ENERGY TRENDS
In the New Policies Scenario, cumulative energy-related global emissions over thenext 25 years are projected to be three-quarters of the total amount emitted over thepast 110 years. While the majority of historical energy-related emissions came fromOECD countries (Figure 2.23), non-OECD countries account for all the projected growth inemissions over the Outlook period. OECD energy-related emissions are expected to peakearly in the Outlook period at nearly 12.5 Gt and then decline steadily to 10.5 Gt in 2035.This trend is higher than that projected inWEO-2010, mainly reflecting a loss inmomentumin the implementation of climate-related policies, the rebound in 2010 emissions and lowerreliance on nuclear in countries such as Germany and Japan.
Figure 2.23 ! Cumulative energy-related CO2 emissions in selected countriesand regions, 1900-2035
0
100
200
300
400
500
United States China European Union India Japan
Gt 2010-2035
1900-2009
In non-OECD countries, China alone will see its CO2 emissions increase from 7.5 Gt in 2010to 10.3 Gt in 2035 (Figure 2.24). However, the growth in China’s emissions is expected toslow significantly over time. On a per-capita basis, China’s rising emissions are expectedto converge with average OECD per-capita emissions, which follow a declining trend. Bothapproach around 7.5 tonnes per capita in 2035. Despite convergence in some cases, largediscrepancies will continue to persist in others. For example, the average citizen in theUnited States is expected to be responsible for around 12 tonnes of CO2 emissions in 2035,while a citizen in India is expected to be responsible for less than one-fifth of this level.
Energy-related CO2 emissions are expected to rise in all sectors over theOutlook period, butthe largest increase is expected in power generation, where emissions increase by 2.3 Gt,and transport, where emissions increase by 2.1 Gt. These two sectors combined account foralmost 75% of the increase in energy-related emissions.
Local pollutants
Emissions of other pollutants follow heterogeneous regional paths. Sulphur dioxide (SO2)emissions, the main cause of acid rain, are expected to fall in almost all major countries, asemissionsstandardsbecomestricterandcoaluseeitherpeaksordeclines. India isanexception,as regulation is expected to be delayed and coal use is rising steadily. Nitrogen oxides (NOx)
© O
EC
D/IE
A, 2
011

Chapter2-Energy
projectionsto
20351
01
2
Figure 2.24 ! Energy-related CO2 emissions by region in 2035 in the New Policies Scenario and the change from 2010
China10.3 Gt CO2
37%
European Union2.8 Gt CO2
-22%
Japan0.9 Gt CO2
India3.5 Gt CO2
118%
Brazil0.5 Gt CO2
46%
Russia1.8 Gt CO2
11%
Australia/New Zealand0.4 Gt CO2
-16%
Korea0.4 Gt CO2
World total emissions
2035 CO emissions2
Change in CO emissions from 2010 to 20352
InternadonalbunkersOECD
Non-OECD0
5
10
15
20
25
30
35
40
2010 2035
Gt
30.4 Gt CO2
36.4 Gt CO2
47%
Middle East2.3 Gt CO2
Africa1.2 Gt CO2
22%
United States4.5 Gt CO2
-15%
-21%
-30%
This map is for illustrative purposes and is without prejudice to the status of or sovereignty over any territory covered by this map.
Notes: The circles reflect the relative volume of energy-related CO2 emissions from selected countries and regions in 2035. The arrows indicate the change in these emissions from 2010 to 2035.The bar chart shows world energy-related CO2 emissions and the split between the OECD, non-OECD countries and international bunkers.
© OECD/IEA, 2011

102 World Energy Outlook 2011 - GLOBAL ENERGY TRENDS
are expected to follow a declining trend in OECD countries, but rise in non-OECD countries.Transport is the main cause of such emissions, and the scale of increasing mobility indeveloping countries outpaces the effect of the emission standards that many of thesecountries are implementing, though such regulation is nonetheless very effective indecoupling the growth in vehicle ownership from an equivalent increase in NOx. Trendsfor particulate matter vary by region, depending on the extent of reliance on biomass asa household fuel and regulation of emissions from cars. The trends in the New PoliciesScenario for particulate matter imply a worsening of the health impact – in India, forexample, a reduction of life expectancy of more than six months per person by 2035,compared with current levels (IIASA, 2011). In 2009, the global cost of air pollution controlswas around $280 billion and this cost increases to more than $550 billion by 2035, due tohigher activity levels and the greater stringency of the controls.
© O
EC
D/IE
A, 2
011

Chapter 3 - Oil market outlook 103
CHAPTER 3
H I G H L I G H T S
OIL MARKET OUTLOOK
Will investment come fast enough?
" Policy action to curb demand and a continuing ability to develop new supplies willbe critical to the mid- and long-term outlook for international oil markets. Global oildemand in the New Policies Scenario increases slowly over the Outlook period, from87mb/d in 2010 to 99 mb/d in 2035. The crude oil price rises to $120/barrel (in year-2010 dollars) in 2035. All the net growth in demand comes from non-OECD countries,mostly in Asia; OECD oil use falls.
" All of the net growth in global oil demand in theNewPolicies Scenario comes from thetransport sector in emerging economies. Non-OECD car markets expand substantially– vehicle production there is projected to overtake theOECDbefore 2015 and car salesto exceed those in the OECD by 2020 – forcing up oil consumption despite impressivegains in vehicle fuel economy. Alternative vehicle technologies are emerging that useoil muchmore efficiently or not at all, such as electric vehicles, but it will take time forthem to become commercially viable and penetrate markets.
" Oil production (net of processing gains) reaches 96 mb/d in 2035, a rise of 13 mb/don 2010 levels in the New Policies Scenario. Crude oil supply increases marginally to aplateau of around 69mb/d (just below the historic high of 70mb/d in 2008) and thendeclines slightly to around 68 mb/d by 2035. Nonetheless, gross capacity additionsof 47 mb/d – twice the current OPEC Middle East production – are needed just tocompensate for declining production at existing fields. A growing share of globaloutput comes from natural gas liquids, unconventional sources and light tight oil.
" Non-OPEC production falls marginally, while OPEC’s market share expands from 42%in 2010 to 51% in 2035. Output grows in most Middle East OPEC countries (led byIraq and Saudi Arabia), but falls in most non-OPEC countries (the main exceptionsbeing Brazil, Canada and Kazakhstan). Increasing reliance on imports in the importingnon-OECD regions, notably Asia, will inevitably heighten concerns about the costof imports and supply security. To meet the projected oil supply requirements inthe New Policies Scenario calls for growing levels of capital spending – cumulativeupstream investment of $8.7 trillion (in year-2010 dollars) is needed in 2011 to 2035.
" In a Deferred Investment Case, we examine the implications of MENA upstreaminvestment running one-third below the level in the New Policies Scenario in 2011 to2015.MENAproduction is, as a result,more than6mb/d lower by 2020 andprices jumpto$150/barrel, before falling back as production rises.MENAexporters earnmore in thenear term, thanks to higher prices, but less in the longer term, as they losemarket share.
© O
EC
D/IE
A, 2
011

104 World Energy Outlook 2011 - GLOBAL ENERGY TRENDS
Demand
Primary oil demand trends
The outlook for oil demand differs markedly between the three scenarios presented in thisOutlook, primarily as a result of the different assumptions about government policies, suchas fuel efficiency standards, removal of end-user subsidies and support for alternative fuels,and the extent to which they succeed in curbing oil demand. After two consecutive yearsof decline during the economic crisis, global primary demand for oil (excluding biofuels)rebounded in 2010 with economic recovery, reaching 86.7 million barrels per day (mb/d),a 3.1% increase over 2009. Demand continues to grow over the Outlook period in both theCurrent Policies and New Policies Scenarios, drivenmainly by developing countries, but fallsin the 450 Scenario (Figure 3.1 and Table 3.1).
Figure 3.1 " World primary oil demand and oil price* by scenario
0
50
100
150
200
250
300
50
60
70
80
90
100
110
1980 1990 2000 2010 2020 2030 2035
mb/d
Dollarsperb
arrel(20
10)
Oil price (right axis):
Oil demand:Current PoliciesScenarioNew PoliciesScenario450 Scenario
Current PoliciesScenarioNew PoliciesScenario450 Scenario
* Average IEA crude oil import price.
The Current Policies Scenario, in which only existing policies are assumed to be in effect,sees oil demand reaching 107 mb/d by 2035, a 24% increase over 2010 levels, or anaverage annual increase of 0.8%. In the New Policies Scenario, which takes account ofpolicy commitments and cautious implementation of published targets, oil demand reaches99 mb/d by 2035, a 15% increase over year 2010 levels (0.5% per year). Lower oil demandin the latter scenario is largely a result of policy action that promotes more efficient oiluse, switching to other fuels and higher end-user prices as a result of reduced subsidiesin some emerging major consuming countries. In the 450 Scenario, oil demand fallsbetween 2010 and 2035 as a result of strong policy action to limit carbon-dioxide (CO2)emissions; oil demand peaks before 2020 at just below 90 mb/d and declines to 78 mb/dby the end of the projection period, over 8 mb/d, or almost 10%, below 2010 levels.While higher-than-expected demand in 2010 and revised assumptions for economicand population growth have altered the short- and medium-term trajectories, oildemand trends to 2035 are broadly similar to those projected in last year’s Outlook in allthree scenarios. Taking account of the sharp increases in oil prices since late 2010 and
© O
EC
D/IE
A, 2
011

Chapter 3 - Oil market outlook 105
3
the assumed higher GDP growth, however, the oil prices needed to balance demandwith supply are somewhat higher than assumed in WEO-2010. This is despite severalnew policies to reduce oil demand announced over the last year, which are taken intoaccount in the 2011 New Policies Scenario, such as the new fuel economy standardsunder discussion by the government of India for passenger vehicles (see Chapter 1and Annex B for details).
The average IEA crude oil import price to balance demand and supply, which is derivedafter numerous iterations of the World Energy Model, reaches $118 per barrel (in year-2010 dollars) in 2020 and $140/barrel in 2035 in the Current Policies Scenario. In the NewPolicies Scenario, the price rises more slowly, to $109/barrel in 2020 and $120/barrel in2035, as demand grows less rapidly as a result of stronger policy action. There are bothsupply- and demand-side reasons for these assumed oil-price increases. On the demandside, the increasing dominance of the transport sector in global oil demand tends to reducethe sensitivity of demand to oil prices in themedium term, as the economic competitivenessof conventional technologies limits the potential for substitution of oil as a transportationfuel. In addition, the cost of supply rises progressively through the projection period, asexisting sources are depleted and oil companies are forced to turn to more difficult andcostly sources to replace lost capacity in order tomeet rising demand.Moreover, constraintson how quickly investment can be stepped up also limit the rate of growth of production,contributing to upward pressure on prices. In the 450 Scenario, prices are considerably lowerthan in the other scenarios, levelling off at just below $100/barrel in 2015, as a result of thepersistent decline in demand.
Table 3.1 " Primary oil demand by region and scenario (mb/d)
New PoliciesScenario
Current PoliciesScenario 450 Scenario
1980 2010 2020 2035 2020 2035 2020 2035
OECD 40.9 42.5 40.0 35.8 40.8 38.5 38.2 26.5
Non-OECD 19.8 37.6 45.0 54.5 46.3 59.3 42.7 44.2
International bunkers* 3.5 6.6 7.5 9.1 7.5 9.4 7.2 7.7
World oil demand 64.2 86.7 92.4 99.4 94.6 107.1 88.1 78.3
Share of non-OECD 33% 47% 53% 60% 53% 61% 53% 63%
Biofuels demand** 0.0 1.3 2.3 4.4 2.1 3.4 2.7 7.8
World liquids demand 64.2 88.0 94.7 103.7 96.7 110.6 90.8 86.1
*Includes international marine and aviation fuel. **Expressed in energy equivalent volumes of gasoline and diesel.
Historically, economic activity has been the principal driver of oil demand, and it remainsan important factor in all scenarios and regions. However, oil intensity – the volume ofoil consumed for each dollar of gross domestic product (GDP) – has fallen considerablyin recent decades and is expected to continue to fall even faster over the projection
© O
EC
D/IE
A, 2
011

106 World Energy Outlook 2011 - GLOBAL ENERGY TRENDS
period: global oil intensity declined at an annual rate of 1.5% over the past 25 years andis projected to continue to fall by an average 2.8% per year until 2020 in the New PoliciesScenario, amplified by considerable government efforts to curb oil demand (Figure 3.2).Oil intensity declines further thereafter, at a slower rate of 2.1% per year until 2035. Theprincipal reasons for the projected decline in oil intensity at levels above the historicalaverage are the assumed high oil prices required to balance supply and demand in theNew Policies Scenario – on average, prices are nearly three times above the historicalaverage of the last 25 years in real terms, promoting increased efficiency and conservationmeasures – and the continuation of numerous policy efforts to curb oil demand, both inOECD countries and in emerging economies such as China and India, prompted by oil andenergy security concerns.
Oil intensity differs considerably across countries and regions as a result of a combination ofstructural, climatic and cultural factors and different pricing. The United States has historicallyhad a higher intensity than the worldwide average, but it fell below the average in 2008 andthe gap with the rest of the OECD is projected to narrow over the Outlook period. China’sintensity has been, on average, 35% higher than the world average, but well below the figurefor non-OECD countries as a whole. It is projected to fall below the world average by around2020 and continue to decline gradually thereafter as a result of policy efforts to decrease theeconomy’s emissions intensity and increasing efficiency in the transportation sector (AnnexB).While the absolute differences in oil intensity between the major countries and regions areprojected to narrow over theOutlook period, the relative rankings remain stable.
Figure 3.2 " Primary oil intensity* by region in the New Policies Scenario
0
0.2
0.4
0.6
0.8
1.0
1.2
1985 1995 2005 2015 2025 2035
Other non-OECD
World
China
United States
Other OECD
Barre
lper
thou
sand
dollarsof
GDP(
$2010,MER
)
*Oil demand per unit of GDP atmarket exchange rates (MER).World excludes internationalmarine and aviation bunkers.
Regional trends
The pattern of oil demand diverges over the projection period among the major regions,according to their level of economic development. Demand drops in all three OECD regions,but continues to expand in the non-OECD countries in aggregate (Table 3.2). In the New
© O
EC
D/IE
A, 2
011

Chapter 3 - Oil market outlook 107
3
Policies Scenario, OECD primary demand declines steadily through to 2035, from over42 mb/d in 2010 to 40 mb/d in 2020 and 36 mb/d in 2035 – an average rate of decline of0.7% per year. This results from high oil prices, saturation effects and a range of additionalgovernment measures to curb oil demand, particularly in the transportation sector. Thelargest decline in percentage terms occurs in Japan, averaging 1.2% per year, driven mainlyby energy efficiency and alternative vehicle technology policy in the transport sector. TheUnited States experiences the largest decline in absolute terms, with demand dropping3.5mb/dover the projection period. In 2010, only 15%of the 2.6mb/d year-on-year reboundinglobaloil demandwasattributable toOECDcountries (89%ofwhichwas in theUnitedStatesalone) andOECDdemand remains below its historic peak in 2005. OECDdemand declined by2.4% per year on average between 2007 and 2010.
Table 3.2 " Primary oil demand by region in the New Policies Scenario (mb/d)
1980 2010 2015 2020 2025 2030 2035 2010-2035*
OECD 40.9 42.5 41.7 40.0 38.2 36.9 35.8 -0.7%
Americas 20.6 22.6 22.3 21.4 20.4 19.8 19.3 -0.6%
United States 17.3 18.0 17.8 16.8 15.8 15.1 14.5 -0.9%
Europe 14.2 12.7 12.5 12.0 11.5 11.0 10.6 -0.7%
Asia Oceania 6.2 7.2 7.0 6.6 6.4 6.1 5.9 -0.8%
Japan 4.9 4.2 4.0 3.7 3.5 3.3 3.1 -1.2%
Non-OECD 19.8 37.6 42.1 45.0 48.2 51.5 54.5 1.5%
E. Europe/Eurasia 9.4 4.6 4.9 5.0 5.2 5.3 5.4 0.7%
Russia n.a. 2.9 3.0 3.0 3.1 3.1 3.2 0.4%
Asia 4.3 17.7 20.5 22.5 24.9 27.5 29.9 2.1%
China 1.9 8.9 11.1 12.2 13.4 14.5 14.9 2.1%
India 0.7 3.3 3.6 4.2 4.9 6.0 7.4 3.4%
Middle East 1.7 6.9 7.6 8.1 8.7 9.0 9.2 1.2%
Africa 1.2 3.1 3.5 3.6 3.7 3.9 4.0 1.0%
Latin America 3.1 5.2 5.7 5.7 5.8 5.8 5.9 0.5%
Brazil 1.3 2.3 2.5 2.5 2.5 2.6 2.6 0.5%
Bunkers** 3.5 6.6 7.0 7.5 7.9 8.5 9.1 1.3%
World oil demand 64.2 86.7 90.8 92.4 94.4 96.9 99.4 0.5%
European Union n.a. 11.9 11.5 11.0 10.4 9.8 9.3 -1.0%
Biofuels demand*** 0.0 1.3 1.8 2.3 2.9 3.6 4.4 5.0%
World liquids demand 64.2 88.0 92.6 94.7 97.3 100.5 103.7 0.7%
*Compound average annual growth rate. **Includes international marine and aviation fuel. *** Expressed in energyequivalent volumes of gasoline and diesel.
© O
EC
D/IE
A, 2
011

108 World Energy Outlook 2011 - GLOBAL ENERGY TRENDS
In contrast, non-OECD oil demand is set to continue to expand. It has been less affectedby the economic recession, continuing to grow by an average of 3.5% per year in the threeyears to 2010. In the New Policies Scenario, non-OECD primary demand rises on averageby 1.5% per year, from about 38 mb/d in 2010 to 45 mb/d in 2020 and almost 55 mb/din 2035. Oil use in non-OECD countries overtakes that in the OECD by 2015. In absoluteterms, the bulk of oil demand growth in non-OECD countries occurs in Asia, where it growsby 12 mb/d, or 70%, between 2010 and 2035. Half of the increase in Asian oil demand(and about 48% of the global increase) comes from China, where demand expands by6 mb/d. Starting from a low base, India is the second-largest contributor to oil demandgrowth, accounting for 33% of the global increase. Demand in the Middle East grows by2.4mb/d, on the back of strong economic and population growth andwidespread subsidies.
Sectoral trends
The transport sector will remain the main driver of global oil demand as economic growthincreases demand for personal mobility and freight. Transport oil demand reaches almost60 mb/d in 2035, a growth of about 14 mb/d over 2010 levels, outweighing a drop indemand in other sectors. Booming transport oil needs in non-OECD countries more thanoffset a decline in transport demand in theOECD (Figure 3.3). Assumed increases in oil pricesprovide a strong economic signal to reduce oil use inmany sectors, either through increasedefficiency or fuel substitution. This depresses oil demand, particularly in industry, where oilis substituted by natural gas (and other fuels) for heat and steam generation, as is the casein Europe and the United States today.With increasing divergence of oil and gas prices overthe projection period, such inter-fuel substitution becomes more common in Asia as well,where to date relatively higher gas prices have limited its use.
Figure 3.3 " Change in primary oil demand by sector and region in theNew Policies Scenario, 2010-2035
-4 -2 0 2 4 6 8
OECDAmericas
OECD Europe
OECDAsia Oceania
Lakn America
E. Europe/Eurasia
Africa
Other Asia
Middle East
India
China
mb/d
Transport
Buildings
Industry
Other
Changes in oil demand in the buildings sector reflect, to some degree, the stage of economicdevelopment. In the OECD countries and China, oil demand is reduced due to the shiftaway from kerosene and liquefied petroleum gas (LPG) towards electricity; but in Africa andIndia, where access to clean energy for cooking is currently limited, demand increases (see
© O
EC
D/IE
A, 2
011

Chapter 3 - Oil market outlook 109
3
Chapter 13 for a discussion of energy access). There is much more limited scope at presentto substitute for oil-based fuels in the transport sector and the petrochemical industry. Thepetrochemical sector, especially in Asia and to a lesser extent in Europe, relies heavily onnaphtha and LPG as feedstock, though natural gas use is increasing due to the expansion ofethane-based production in the Middle East. The transport sector depends almost entirelyon oil products, with 93% of all the fuel used in the sector being oil-based in 2010. Alternativevehicle technologies that use oil much more efficiently (such as hybrid vehicles or plug-inhybrids) or not at all (such as electric vehicles) are emerging, but it will take time for them tobecome commercially viable on a large scale and for carmakers and fuel suppliers to invest innew production facilities and distribution infrastructure, where needed, on the scale requiredtomake a significant difference.
Focus on the transport sector
Road transport is expected to continue to dominate total oil demand in the transportationsector. In the New Policies Scenario, road transport is responsible for about 75% of globaltransport oil demand by 2035, down only slightly from 77% in 2010 (Figure 3.4). Oil demandfor road freight grows fastest, by 1.7% per year on average, despite significant fuel-efficiencygains, especially in the United States where recent government proposals for heavy-dutyvehicles aim at improving fuel efficiency between 10% and 17% through to 2018.
Figure 3.4 " World transportation oil demand by mode in theNew Policies Scenario
0102030405060708090100
2010 2015 2020 2025 2030 2035
mb/d
Other transport
Domeskc aviakon
Internakonal bunkers
Road freight
PLDVs
Total primary oildemand
Note: PLDVs are passenger light-duty vehicles comprising passenger cars, sports utility vehicles and pick-up trucks.
Passenger light-duty vehicles (PLDVs) remain the single largest component of transport oilconsumption, though their share shrinks from about 45% today to 39% by 2035. This trend isdriven bymajor improvements in fuel economy inmany countries, especially in the largest carmarkets in the United States, China, Europe and Japan – a result both of high international oilprices and of government policies, including fuel efficiency standards, labelling and researchanddevelopment. Thesepoliciesmakea substantial contribution to curbingoverall oil demandgrowth over the Outlook period. However, the July 2011 proposal by the United Statesgovernment to further increase vehicle fuel-efficiency standards (from the current 35.5miles-
© O
EC
D/IE
A, 2
011

110 World Energy Outlook 2011 - GLOBAL ENERGY TRENDS
per-gallon [mpg] by 2016) to an average 54.5mpgby 2025,which is equivalent to 4.3 litres per100 km (l/100 km), is not taken into account in this year’s projections; if confirmed it wouldhave an important impact on longer-termUSoil demand (though the long-term targetwill stillbe subject to an evaluationwell before 2025).
Of the projected increase in transport oil demand between 2010 and 2035, 37% comes fromroad freight traffic, 21% from PLDVs, 18% from international bunkers, 7% from aviation andthe remaining 17% from othermodes. International aviation andmarine bunkers, as well asdomestic aviation and navigation, grow with increasing GDP, but the growth is moderatedby fuel economy targets recently announced by the InternationalMaritimeOrganization forshipping and by energy efficiency measures both in aircraft technology and flight logistics.The increase in demand from road freight traffic comes entirely from non-OECD countries,offsetting a decline in OECD countries resulting from efficiency gains and fuel switching.
Road-freight traffic is strongly correlated with economic growth, as increased levels ofconsumption lead to greater movement of goods. In non-OECD countries, road-freighttonne-kilometres increase by 3.7% annually, slightly more than the resulting oil demand,due to efficiency improvements (Figure 3.5). Although the tonne-kilometres operatedby trucks and lorries grow by 0.5% per year on average until 2035 in the increasinglyservice-orientedOECD countries, the oil needed to fuel this growth drops in theNewPoliciesScenario as a result of efficiency improvements.
Figure 3.5 " Average annual change in transport oil demand and GDPby region and transport mode in the New Policies Scenario,2010-2035
-1%
0%
1%
2%
3%
4%
5%
PLDVs Road freighttraffic
Domeskcaviakon
Internakonalbunkers
GDP
OECD
Non-OECD
World
Increased use of alternatives to oil-based transport fuels (gasoline, diesel and LPG) also help totemper oil-demand growth, though to a much smaller degree than efficiency gains in vehicleswith internal combustion engines. Biofuels make the biggest such contribution, as use growsfrom 1.3 million barrels of oil equivalent per day (Mboe/d) today to 4.4 Mboe/d in 2035, anannual rate of increase of 5%. The share of biofuels in total transport fuel demand rises fromless than 3% today to just above 6% by 2035. Although biofuels are mainly used in the roadtransport sector, the aviation industry has recently done several tests on aviation biofuels and,
© O
EC
D/IE
A, 2
011

Chapter 3 - Oil market outlook 111
3
if large-scale projects were successfully implemented, aviation demand could increase strongly.Natural gas also plays a growing role in the transport sector, its share rising from 3% to 4%. Theuse of natural gas growsmost in road transport, where its share rises from 1% to 3%. Currentlythe dominant use of gas in the transport sector is in gas compression for pipeline transport anddistribution.1While the economic case for natural gas vehicles is often promising, for example intheUnitedStates, there is oftena lackof thepolicy support needed for amore significant uptake(IEA, 2011a). Electricity use ismainly confined to the railway sector in theNewPolicies Scenario.Electricity makes only minor contributions to the road transport energy mix, but the share ofelectricity in total transport fuel demand grows from1% today to about 2% in 2035 (Figure 3.6).
Figure 3.6 " World non-oil-based fuel use by transport mode in theNew Policies Scenario
0
1
2
3
4
5
2010 2035 2010 2035 2010 2035
Mbo
e/d Other*
Rail
Aviakon
Road
Gas Biofuels Electricity
*Other includes navigation, pipeline and non-specified transport.
While theoretically many options exist for replacing oil-based fuels in road transport, forvarious reasons none of the potential candidates and technologies has so far grown out ofnichemarkets. There are barriers to the uptake of each alternative fuel and vehicle technology,including their applicability to different road transport modes, the need to develop vehicledrive-trains to accommodate the specific properties of the fuel, their cost-competitivenessand their environmental performance relative to oil (Table 3.3). Where the alternative fuelcannot be used directly in existing oil distribution networks and applications, it requires thebuild-up of a dedicated infrastructure. To compete today, themajority of alternative fuels needgovernment support of one formoranother.Where such support is provided, it is often justifiedby the energy-security or environmental benefits that those fuels can bring (see Chapter 14for a discussion of biofuels subsidies). For alternative fuels to grow faster than projected inthe New Policies Scenario, stronger and more concerted policy action, improved internationalco-operation and long-termplanningwould be needed.
1. As per IEA defini"on of transport sector energy use.
© O
EC
D/IE
A, 2
011

112
World
EnergyO
utlook2011
-GLO
BALEN
ERGY
TREND
S
Table 3.3 " Factors affecting fuel choices for future road transport technologies
Fuel Application Costcompetitiveness
Technology status2011
Technology potential2035
Environmentalperformance
Infrastructureavailability
Governmentpolicies
Gasoline & diesel(including LPG,methanol and otheradditives)
All vehicle types. Low cost of vehicle;running costs risewith oil price; LPG andmethanol canlower fuel costs.
Mature fuels andvehicles: potentialto use hybrid vehicles.
Vehicle fuel efficiencycould increase by40% (ICE)or 50% (hybrids).
Current emissionshigh, but potential todecrease with vehicleimprovements.
Existing. Mandates to increasefuel efficiency, labelling.
Biofuels All vehicle types. Low cost of vehicle;fuel costs dependon cost and supply ofbiomass.
Vehicles andconventional biofuelsproven; scaling supplydifficult.
Advanced fuels couldbe made; vehicleefficiency similar togasoline and diesel.
Highly variable by fueland region, CO2 notalways reduced vs.gasoline and diesel.
Fuels blended intogasoline or diesel usingexisting infrastructure.
Blending mandates,tax credits,R&D funding.
Natural gas All vehicle types.LNG has more potentialthan CNG for HDVs.
Higher vehicle costs;fuel costs dependon oil-to-gas pricedifference.
CNG vehicles availableand proven, LNGless deployed, buttechnology available.
Vehicle efficiencysimilar togasoline and diesel.
Use of gas is less CO2emission and pollutionintensive thangasoline and diesel.
Exists in some countries,but requires extensiveroll-out in new markets.
Sustained policyguidance to growmarket share is limitedto a few countries.
Electricity All vehicle types butbattery size and weightlimit applications.
Vehicle costs high(battery cost at least$500/kWh); lowrunning cost.
Very efficient fuel use,some vehicles available,but no mass production.
Roll-out depends onbattery cost reductionand consumer response.
No exhaust from pureEVs; WTW emissionsdepend on powergeneration mix.
Required for recharging,but grids availablefor long-distancetransmission.
Subsidies for new carsin several countries.
Hydrogen Feasible for all vehicles,but most practicalfor LDVs.
Vehicle costs high(fuel cell cost atleast $500/kW).
Vehicles currentlyat R&D stage, onlyprototypes available.
Depends on pace offuel cell and hydrogenstorage developments.
Use of hydrogen is clean.WTWemissions dependonhydrogen source.
Required forproduction, refuellingand transmission.
Limited to R&Dsupport.
Key Very strong Strong Neutral Weak
CNG = compressed natural gas. EV = electric vehicle. HDV = heavy-duty vehicle. ICE = Internal combustion engine. LDV = light duty vehicle. LNG = liquefied natural gas. WTW =well-to-wheels.Note: Colours (see key) illustrate the relative strengths and weaknesses of fuels in each category.
© OECD/IEA, 2011

Chapter 3 - Oil market outlook 113
3
Passenger light-duty vehicles
Passenger light-duty vehicles (PLDVs) currently use about 20 million barrels of oil each day,or about 60% of total road oil consumption, and remain the largest oil-consuming sub-sectorover the Outlook period. The extent of the need for oil to fuel the PLDV fleet will hinge onfour main factors: the rate of expansion of the fleet; average fuel economy; average vehicleusage; and the extent to which oil-based fuels are displaced by alternative fuels. In the NewPolicies Scenario, the projected expansion of the fleet would double PLDV oil consumptionbetween 2010 and 2035 if there were no change in the fuel mix, vehicle fuel efficienciesor average vehicle-kilometres travelled; but the projected increase is limited to about 15%, asa result of switching to alternative fuels and, to amuch larger extent, efficiency improvementsand the decrease in average vehicle use as non-OECD vehiclemarkets (where average vehicleuse today tends to be lower than in the OECD) become increasingly dominant (Figure 3.7).
Figure 3.7 " World PLDV oil demand in the New Policies Scenario
0
5
10
15
20
25
30
35
40
45
2010 2035
mb/d Oil demand
Decrease 2010-2035 due to:
Lower average vehicleusage
Improvement in fueleconomy
Use of alternakve fuels
Fleet expansion
Increase 2010-2035 due to:
Note: The theoretical increase in oil use caused by fleet expansion assumes no change in the fuel mix, the vehicle fuelefficiency and the average vehicle-distance travelled.
Demand for mobility is strongly correlated with incomes and fuel prices. So as incomes rise– especially in the emerging economies – the size of the global car fleet will inevitably risein the long term. However, vehicle usage patterns are also affected by incomes and prices.A rise in fuel prices (whether caused by higher prices on international markets or a rise indomestic prices) or a drop in incomes (such as during the global financial crisis) can leadto short-term changes in behaviour. But vehicle-miles travelled usually tend to reboundas consumers become accustomed to the new level of price or as the economy recovers.The United States, one of the largest car markets in the world, is a good example of thisphenomenon, partly because public transport infrastructure is limited and most peoplerely on cars for commuting (Figure 3.8). Government policies to promote modal shifts, likethe extension of rail and urban transport networks, can change the long-term picture. Thegrowth in oil demand from expanding vehicle fleets in countries with large inter-city traveldistances, such as China, will be critically influenced by the availability of non-road traveloptions. However, we assume little change in vehicle usage patterns over the Outlookperiod. Efficiency improvements, therefore, remain the main lever to reduce oil demand.
© O
EC
D/IE
A, 2
011

114 World Energy Outlook 2011 - GLOBAL ENERGY TRENDS
Figure 3.8 " Change in road vehicle travel in relation to changes in GDPper capita and oil price in the United States, 1985-2010
0
10
20
30
40
50
60
70
80
90
100
90
100
110
120
130
140
150
160
170
180
190
1985 1990 1995 2000 2005 2010
Dollarspe
rbarrel(2
010)
Index
(1985=100) Change in kilometres
travelled
Change in GDPper capita($2010, MER)
Internakonal oil price(right axis)
Note: MER =market exchange rate.Sources: US Federal Highway Association database; IEA data and analysis.
The largest car markets in the world were historically to be found in OECD countries, withthe United States the leader, followed by Japan and several European countries, headedby Germany and France (Box 3.1 looks at the regional shift in car making). However, thegrowth in vehicle sales in China over the past ten years has been spectacular, from less than1 million in 2000 to almost 14 million in 2010, when China overtook the United States tobecome the world’s largest single car market (Figure 3.9). Vehicle sales in the United Statesand some European countries plunged during the recession and, despite financial supportby governments, have struggled to recover since.
Figure 3.9 " PLDV sales in selected markets, 2000-2010
0
2
4
6
8
10
12
14
16
18
2000 2002 2004 2006 2008 2010
Million
vehic
les China
United States
Japan
Germany
India
Sources: China Automotive Review statistics database; WardsAuto; IEA databases.
While the rate of growth in PLDV sales in China has been impressive over the last decade,they started in 2000 from a very low base. Even today, vehicle ownership in China is only justabove 30 vehicles per 1 000 people, compared with close to 500 in the European Union and700 in the United States (Figure 3.10). On average, only 40 out of 1 000 people in non-OECD
© O
EC
D/IE
A, 2
011

Chapter 3 - Oil market outlook 115
3
countries own a car today, while average car ownership is approaching 500 per 1 000 peoplein OECD countries.
Figure 3.10 " PLDV ownership in selected markets in the New PoliciesScenario
0
100
200
300
400
500
600
700
800
United States European Union China India Middle East World
2010
2035
Vehic
lespe
rtho
usandp
eople
Despite a slowdown in sales in the first half of 2011, China is projected to reinforce its leadingposition, with PLDV sales reaching more than 50 million cars in 2035 in the New PoliciesScenario. Yet themarketwill still be far from saturated then,with projected vehicle ownershiplevels of only about 300 vehicles per 1 000 inhabitants. China’s total vehicle stock growsmore than three-fold from 2010 to 2035 in the New Policies Scenario. The pace of growthof China’s vehicle stock will be critical for world oil demand: if the entire stock (including allroad-transport modes) grew 1% faster than at the projected level of 5% per year, oil demandin China would be almost 2 mb/d higher by 2035. How likely this is to happen is extremelyuncertain. One reason is the heterogeneity of both vehicle ownership levels and the ratio ofownership to average incomes, evenamong themoredeveloped coastal regions. For example,ownership rates in Beijing in 2009 were almost three times higher than in Shanghai, despitesimilar levels of GDP per capita.2 This is partly the result of differences in urban planning andindicates that future vehicle ownership couldwell be lower than projected.
Non-OECD countries account for 80%of the projected doubling of the global PLDV fleet, theirstock growing from around 200 million vehicles in 2010 to more than 900 million in 2035.In the New Policies Scenario, vehicle sales in non-OECD countries as a whole are projectedto overtake those of OECD countries around 2020, reaching more than 100 million vehiclesper year in 2035. The vehicle stock in non-OECD countries overtakes that in the OECD in theearly 2030s (Figure 3.11). Nonetheless, at about 125 vehicles per 1 000 inhabitants in 2035,vehicle-ownership levels in non-OECD countries remainwell belowOECD levels, where theyclimb to almost 550 per 1 000 inhabitants. By then, around 55% of all the PLDVs on the roadworldwide are in non-OECD countries, compared with less than 30% today.
2. According to data from the Na"onal Sta"s"cs Database of the Na"onal Bureau of Sta"s"cs of China(www.stats.gov.cn).
© O
EC
D/IE
A, 2
011

116 World Energy Outlook 2011 - GLOBAL ENERGY TRENDS
PLDV sales in the New Policies Scenario remain dominated by conventional internalcombustion engine vehicles, though hybrid vehicles are projected to make significantinroads into global car markets. By 2035, 28% of all PLDV sales in OECD countries areprojected to be hybrids, while in non-OECD countries the figure is 18%. The share is less than2%worldwide today. As in previousOutlooks, the inroadsmade by other alternative vehiclesremain marginal: the share of natural gas vehicles reaches about 2% and that of electricvehicles and plug-in hybrids combined is just below 4%.
Figure 3.11 " PLDV sales and stocks in the New Policies Scenario
0
200
400
600
800
1 000
1 200
0
20
40
60
80
100
120
Million
vehic
les
Electric vehiclesNatural gasvehiclesHybrid vehiclesConvenkonal ICEvehicles
Million
vehic
les Vehicle sales:
2010 2020 2030 2035 2010 2020 2030 2035OECD Non-OECD
Vehicle stock(right axis):
OECDNon-OECD
Notes: ICE = internal combustion engine. Electric vehicles include full electric vehicles and plug-in hybrids.
Vehicle fuel efficiency is the other key factor in the outlook for fuel use by PLDVs, and,more generally, transport sector oil demand as a whole. Today, the average tested fueleconomy of a new PLDV worldwide is around 8 l/100km.With existing conventional internalcombustion engine technology, modest hybridisation and non-engine improvements,such as tyres, efficiency improvements of up to 40% are possible, but not all of thispotential is expected to be exploited. Advanced technologies, including hybrids and plug-inhybrids, are also set to contribute to overall improvements in fuel economy. In the NewPolicies Scenario, with recently adopted government policies and measures and highoil prices by historical standards, we project fuel requirements for all new PLDV salescombined to fall to 6 l/100 km by 2020 and just above 5 l/100 km by 2035. Many countrieswith large vehicle markets have taken action to improve the fuel economy of vehiclessubstantially, though in many cases the targets relate to new vehicle sales between2015 and 2020. The effect on the average efficiency of the entire vehicle stockwill not be fullyfelt until the existing stock is fully replaced. For post-2020 vehicle sales, there is currently littlepolicy guidance, which leaves further efficiency improvements to the market and guides ourcautious projections of efficiency gains. However, if policies, such as the currently discussedextension of the US Corporate Average Fuel Economy (CAFE) standards to 2025 were tomaterialise in a number of key vehiclemarkets, oil demand could be reduced further and theeconomic case for alternative fuels and technologies would improve.
© O
EC
D/IE
A, 2
011

Chapter 3 - Oil market outlook 117
3
Box 3.1 " The future of car making
The recent growth of emerging markets such as China could generate a shift in globalcarmanufacturing.While carmanufacturing has historically been concentrated in theUnited States, Japan, the European Union (mostly Germany and France) and Korea,non-OECD car manufacturers, especially in China, are on the rise thanks to the boomin domestic sales and lower labour costs. The share of Chinesemanufacturers in globalcar production more than doubled in the three years to 2009, from 6% to about 13%of all cars produced worldwide (OICA, 2011). Western companies are also profitingfrom this boom by building cars increasingly in non-OECD countries. The share ofnon-OECDcountries inglobal carproductiongrewfrom23%in2005to44%in2010,withtotal output rising from 10.5million to 25.6million vehicles. OECD vehicle production,whichwas around 36million vehicles per year in themid-2000s, plunged to 28millioncars in 2009, but rebounded to close to 33 million in 2010. Although developmentsin car markets over the last five years have been influenced by the economic crisisand government support programmes, it is likely that the level of car production innon-OECD countries could overtake that of OECD countries before 2015.Wherever these cars are built, the growing importance of non-OECD carmarketsmeansthat non-OECD policy will become an increasingly important determinant of global fueleconomy standards and therefore of global oil demand patterns. China has recentlyadopted a fuel economy target of 6.7 l/100 km for 2015, comparable to the 2015 targetin the United States, and the government is considering further increasing this standardto 4.5 l/100 km (equivalent to the fuel consumption of a current hybrid) by 2025.
Government policies will be important in encouraging or mandating improvements in fueleconomy. Generally, standards have an important influence on average fuel economies,given their binding nature. The impact of non-binding policies, such as voluntary agreementsor labelling, can be hard to predict, as running costs are just one ofmany factors that privatemotorists take into account when deciding which car to buy and how to use it. The quickestand cheapest way to reduce oil use by PLDVs (other than by behavioural changes such asfuel-efficient driving or modal shifts towards increased use of public transport) is to utilisesmaller cars. As an illustration of this effect, if US consumers today bought cars of the samesize andweight on average as in Europe, new vehicle fuel economywould improve by about30%per kilometre driven and total US oil demandwould fall by 2.4mb/dwithin about fifteenyears. But vehicle size, comfort and status are important considerations in a consumer’sdecision to buy a car and so it is not certain that consumerswill change purchasing or drivingbehaviour quickly in the absence of incentives that go beyond those already announced.Recent research has shown that US motorists tend to undervalue the potential benefits offuel economy (Greene, 2010). Nonetheless, in countries where households devote a largeshare of their budget to spending on fuel for their cars, fuel economy has been shown to bean increasingly important consideration as fuel prices rise. In the United States, the shareof household spending on vehicle fuel grew from about 3% in the early 1990s and 2000s tomore than 5% in 2008, though it has varied since with changing oil prices.
© O
EC
D/IE
A, 2
011

118 World Energy Outlook 2011 - GLOBAL ENERGY TRENDS
The rate of penetration of alternative fuels is another factor affecting oil use in PLDVs. Froma technology perspective, the share of biofuels is largely a supply-side issue, as inmost casesbiofuels are blended into conventional gasoline or diesel, requiring no change to today’svehicles if mixtures are kept within certain limits. Flex-fuel vehicles, i.e. vehicles that canuse either gasoline or ethanol, are on sale in several markets, but some other fuels, notablyelectricity, require a fundamental change in vehicle technology and refuelling infrastructure.In the New Policies Scenario, electric vehicles and plug-in hybrid sales expand only slowly,amounting to 0.4million vehicles in 2020 and just below 6million in 2035. This slow increaseismainly the result of high vehicle purchase costs which, in the absence of sufficient supportor incentives, make them less economically attractive than internal combustion enginevehicles. Even as new business models improving the economic case for electric vehiclesemerge, consumer acceptance that is required for the widespread adoption of electricvehicles remains uncertain and guides our cautious outlook. In the projections, oil savingsfrom electric vehicles worldwide amount to less than 20 thousand barrels per day (kb/d)in 2020 (Figure 3.12) and about 170 kb/d in 2035.
Figure 3.12 " Oil savings through electric vehicle sales: country targets,3
industry plans and in the New Policies Scenario
0
2
4
6
8
10
12
-1.2
-1.0
-0.8
-0.6
-0.4
-0.2
0
2010 2012 2014 2016 2018 2020
Million
vehic
les
mb/d
New Policies Scenario
Industry targets
Country targets
Oil demand reduckon:
Electric vehicle sales(right axis):
Country targets
Industry targets
New Policies Scenario
The projected levels of sales of electric vehicles and plug-in hybrids in the New PoliciesScenario are well below targets for 2020 that have been adopted by several countries; inaggregate, these targets amount to a stock of almost 25 million electric vehicles and plug-inhybrids, implying vehicle sales to reach about seven million per year by 2020. If the targetswere achieved, sales of electric vehicles would make up almost 8% of global PLDV sales andjust over 2% of the global stock by 2020, saving up to 420 kb/d of oil in that year. However,the car industry does not appear to be prepared to produce that many electric vehicles yet(IEA, 2011b). Plans announced up to mid-2011 suggest that car manufacturers are likely toexpand capacity in total to only 1.4 million electric vehicles per year by 2020, suggesting a
3. Countries included: Austria, Canada, China, Denmark, Finland, France, Germany, Ireland, Israel, Japan, Korea,Netherlands, Portugal, Spain, Sweden, Switzerland, the United Kingdom and the United States. Note that the countrytarget of China that is used here is currently under revision. Some of these countries have launched the ElectricVehicles Ini"a"ve together with the IEA.
© O
EC
D/IE
A, 2
011

Chapter 3 - Oil market outlook 119
3
wait-and-see strategy in a still nascent industry,which in turn couldmean that countrieswouldcollectively achieve only 20% of their targets, with resulting oil savings of less than 80 kb/d.
We estimate that investment in manufacturing capacity able to deliver the targeted numberof electric vehicles (even if that target is unlikely to be met from today’s perspective) wouldbe of the order of $85 billion in the period to 2020.4 Additional investment would be requiredto provide the recharging infrastructure (each electric vehicle typically requires 1.3 rechargingpoints), amounting to roughly $50 billion.5 The consumer would also be required to paymorefor these vehicles, which currently cost at least $15 000 more than a conventional vehicle ofequivalent size. Assuming that this cost increment could be reduced by 50% by 2020, thenthe additional spending on electric vehicles until 2020 would be about $230 billion. Thesecosts would need to be carried by the consumers or, to the extent that they are subsidised, bygovernments. It is still unclear how much more the consumer is willing to pay for an electricvehicle orwhat is the desired payback period, i.e. the time it takes for the fuel savings to offsetthe higher upfront purchase price of the vehicle. Some recent tests of public acceptability byindividual car manufacturers have given promising results; but for electric vehicle adoptionto becomewidespread, it is estimated that payback times will need to be reduced by a factorof about three to four, ormitigated by innovativemanufacturer-consumer businessmodels.
Supply
Resources and reserves
Proven reserves of oil increased in 2010, by about 0.5% to 1 526 billion barrels at year-endaccording to the BP Statistical Review ofWorld Energy (BP, 2011) and by 8.5% to 1 470 billionbarrels according to theOil &Gas Journal (O&GJ, 2010). The bigger increase recorded by theO&GJ reflects an increased estimate for Venezuela, based on recent results from theMagnaCarta project, led by Petróleos de Venezuela (PDVSA), which reassessed reserves in theOrinoco extra-heavy oil belt (Box 3.2 defines different types of liquid fuels). Neither set ofnumbers includes the upward revisions of reserves announced in late 2010 by Iraq and Iran.
An estimated 16 billion barrels of crude oil reserves were discovered in 2010. This is less thanthe 25 billion barrels of crude oil produced in 2010, but well above the 8 billion barrels per yearof discoveries required to satisfy production from fields “yet to be found” called for over theprojection period in theNewPolicies Scenario (Figure 3.16).6 The amount of crude oil discoveredannually over the last decade averaged 14 billion barrels. The trends continue to be towardsboth smaller discoveries in mature basins and larger discoveries in more remote places, withthe significant exception of light tight oil in North America (Spotlight). Although light tight oilhas been known for many years, extraction of it has only recently become economically viable,through the application of new technology and the advent of higher oil prices.
4. This is derived fromanassumedcostbaseof $12200per vehicleper year, basedon recentNissan/Renault announcements.5. This calcula"on assumes costs of $750 for home recharging points and $5 000 for public recharging points. It furtherassumes that the bulk of recharging is done at home as evidenced in recent pilot projects, so that the required densityof public recharging points is low.6. These numbers do not include volumes of NGLs discovered and produced.
© O
EC
D/IE
A, 2
011
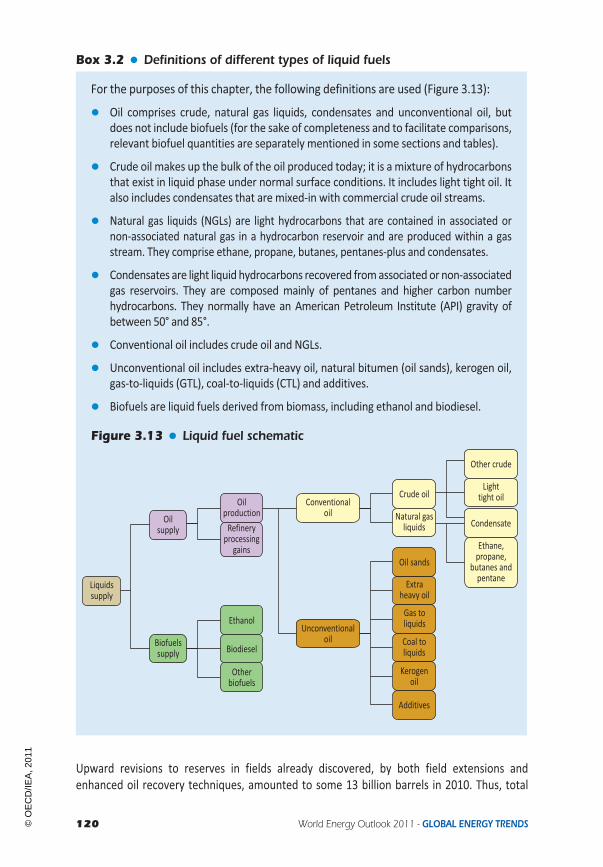
120 World Energy Outlook 2011 - GLOBAL ENERGY TRENDS
Box 3.2 " Definitions of different types of liquid fuels
For the purposes of this chapter, the following definitions are used (Figure 3.13):
" Oil comprises crude, natural gas liquids, condensates and unconventional oil, butdoes not include biofuels (for the sake of completeness and to facilitate comparisons,relevant biofuel quantities are separately mentioned in some sections and tables).
" Crude oil makes up the bulk of the oil produced today; it is a mixture of hydrocarbonsthat exist in liquid phase under normal surface conditions. It includes light tight oil. Italso includes condensates that are mixed-in with commercial crude oil streams.
" Natural gas liquids (NGLs) are light hydrocarbons that are contained in associated ornon-associated natural gas in a hydrocarbon reservoir and are produced within a gasstream. They comprise ethane, propane, butanes, pentanes-plus and condensates.
" Condensates are light liquid hydrocarbons recovered fromassociatedor non-associatedgas reservoirs. They are composed mainly of pentanes and higher carbon numberhydrocarbons. They normally have an American Petroleum Institute (API) gravity ofbetween 50° and 85°.
" Conventional oil includes crude oil and NGLs.
" Unconventional oil includes extra-heavy oil, natural bitumen (oil sands), kerogen oil,gas-to-liquids (GTL), coal-to-liquids (CTL) and additives.
" Biofuels are liquid fuels derived from biomass, including ethanol and biodiesel.
Figure 3.13 " Liquid fuel schematic
Conventionaloil
Unconventionaloil
Oilsupply
Biofuelssupply
Ethanol
Otherbiofuels
Biodiesel
Oilproduction
Refineryprocessing
gains
Crude oil
Natural gasliquids
Extraheavy oil
Gas toliquids
Oil sands
Coal toliquids
Kerogenoil
Additives
Other crude
Lighttight oil
Condensate
Ethane,propane,
butanes andpentane
Liquidssupply
Upward revisions to reserves in fields already discovered, by both field extensions andenhanced oil recovery techniques, amounted to some 13 billion barrels in 2010. Thus, total
© O
EC
D/IE
A, 2
011

Chapter 3 - Oil market outlook 121
3
reserves additions amounted to 29 billion barrels outstripping production by 4 billion barrels(as has been the case now for several decades). Overall, the geographic distribution of provenreserves remains largely unchanged from previous years, with the bulk of them located in theMiddle East.
We now put remaining recoverable resources worldwide at nearly 5 500 billion barrels,with proven reserves7 amounting to about one-quarter of the total (Figure 3.14). Otherrecoverable conventional oil resources amount to 1 300 billion barrels, while recoverableunconventional resources total over 2 700 billion barrels. Unconventional oil resources,including extra-heavy oil and kerogen oil, have a large potential; however, many technical,commercial and political obstacles need to be overcome before they can be fully developed.Recoverable resources, a more important factor in long-term production projections thanproven reserve volumes, are estimated on the basis of data fromvarious sources, notably theUS Geological Survey (USGS) and the German Federal Institute for Geosciences and NaturalResources (BGR) (USGS, 2000, 2008a, 2009a and 2010; BGR, 2010).8 For unconventionalresources, these studies have tended to focus on large known accumulations or specificregions, particularly those where conventional resources have been heavily exploited. It islikely that regions that have received less attention, such as the Middle East or Africa, alsohave important endowments of unconventional resources.
Figure 3.14 " Recoverable oil resources and production by regionand type in the New Policies Scenario
-2 000 -1 000 0 1 000 2 000 3 000 4 000 5 000 6 000Billion barrels
World
-800 -400 0 400 800 1 200 1 600 2 000 2 400Billion barrels
Convenkonal oil
Extra heavy oil
Kerogen oil
Other potenkallyrecoverable volumes:
OECD Europe
Asia/Pacific
Africa
Lakn America
North America
E. Europe/Eurasia
Middle East
Cumulakve produckon:
End-2010
Proven reserves,end-2010
2011-2035
Note: Cumulative production is shown as a negative number, such that the total of the bars to the right indicateremaining recoverable resources.Sources: BGR (2010); USGS (2000, 2008a, 2009a, 2009b and 2010); O&GJ (2010); IEA databases and analysis.
7. Proven reserves are usually defined as discovered volumes forwhich there is a 90%probability of profitable extrac"on(seeWEO-2010 for a detailed descrip"on) (IEA, 2010).8. SeeWEO-2010 for a detailed discussion of the methodology and defini"ons of resources, a detailed analysis of theprospects for produc"on of unconven"onal oil, and a review of the sensi"vity of sources of supply to resource availabilityand accessibility (IEA, 2010).
© O
EC
D/IE
A, 2
011

122 World Energy Outlook 2011 - GLOBAL ENERGY TRENDS
Production prospects
Global oil production, together with processing gains (the volume increase in supply thatoccurs during crude oil refining) matches demand in all three scenarios in this Outlook,and is of course always less than the installed production capacity.9 Production trends varymarkedly across the scenarios, rising to 104 mb/d in 2035 in the Current Policies Scenarioand 96.4 mb/d in the New Policies Scenario, but peaking before 2020 and then falling to76 mb/d in the 450 Scenario (Table 3.4). In the New Policies Scenario, production grows by13 mb/d, or 15%, between 2010 and 2035 (Figure 3.15). The rate of growth falls graduallythrough the projection period, from 1.1% per year from 2010 to 2015 to 0.5% per year inthe period 2030 to 2035, averaging 0.6% per year over the full projection period. Crudeoil production – the largest single component of oil production – increases marginally to aplateau of around 69 mb/d (slightly below the historic high of 70 mb/d in 2008)10 and thendeclines slowly to around 68mb/d by 2035.
Table 3.4 " Oil production and supply by source and scenario (mb/d)
New PoliciesScenario
Current PoliciesScenario
450Scenario
1980 2010 2020 2035 2020 2035 2020 2035
OPEC 25.5 34.8 39.6 48.7 41.1 53.4 36.7 36.5
Crude oil 24.7 29.0 29.8 34.7 31.0 37.6 27.8 26.7
Natural gas liquids 0.9 5.2 8.0 11.0 8.2 12.5 7.2 7.6
Unconventional 0.0 0.6 1.8 3.0 1.8 3.3 1.7 2.2
Non-OPEC 37.1 48.8 50.4 47.7 51.0 50.5 49.0 39.4
Crude oil 34.1 40.3 39.0 33.1 39.4 34.7 38.2 27.6
Natural gas liquids 2.8 6.4 7.3 7.5 7.4 7.8 6.9 6.3
Unconventional 0.2 2.1 4.1 7.0 4.2 8.0 3.9 5.5
World oil production 62.6 83.6 90.0 96.4 92.0 103.9 85.7 75.9
Crude oil 58.8 69.3 68.8 67.9 70.5 72.3 66.0 54.3
Natural gas liquids 3.7 11.7 15.3 18.5 15.6 20.3 14.1 13.9
Unconventional 0.2 2.6 5.9 10.0 6.0 11.3 5.7 7.8
Processing gains 1.2 2.1 2.5 3.0 2.5 3.2 2.4 2.4
World oil supply* 63.8 85.7 92.4 99.4 94.6 107.1 88.1 78.3
Biofuels 0.0 1.3 2.3 4.4 2.1 3.4 2.7 7.8
World liquids supply** 63.9 87.0 94.7 103.7 96.7 110.6 90.8 86.1
*Differences between historical supply and demand volumes are due to changes in stocks. **Includes biofuels, expressedin energy equivalent volumes of gasoline and diesel.
9. Produc"on in this Outlook refers to volumes produced, not to installed produc"on capacity.10. Revisions made to produc"on data since the publica"on of WEO-2010 show worldwide produc"on of crude oil in2008 averaged 70.4 mb/d, slightly above the 70.2 mb/d in 2006.
© O
EC
D/IE
A, 2
011
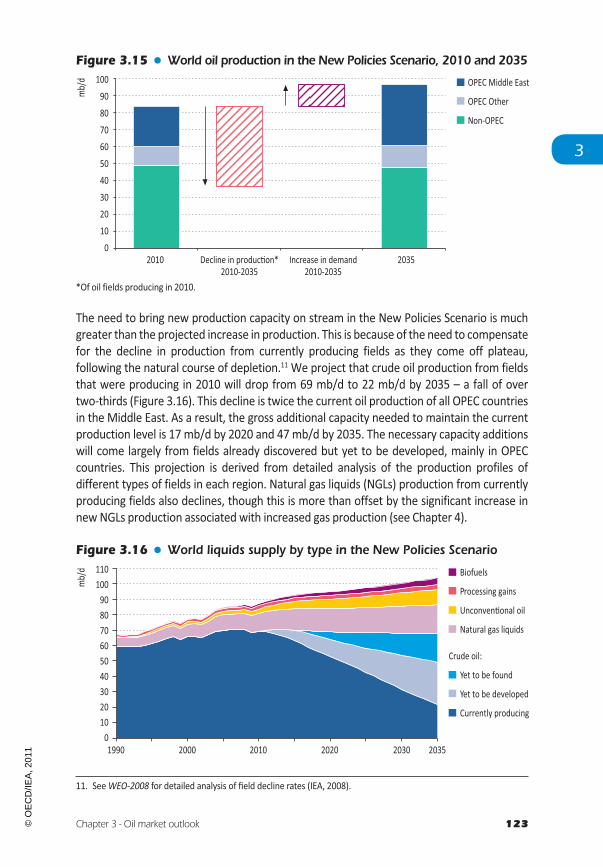
Chapter 3 - Oil market outlook 123
3
Figure 3.15 " World oil production in the New Policies Scenario, 2010 and 2035
0102030405060708090100
2010 Decline in produckon*2010-2035
Increase in demand2010-2035
2035
mb/d OPEC Middle East
OPEC Other
Non-OPEC
*Of oil fields producing in 2010.
The need to bring new production capacity on stream in the New Policies Scenario is muchgreater than the projected increase in production. This is because of the need to compensatefor the decline in production from currently producing fields as they come off plateau,following the natural course of depletion.11 We project that crude oil production from fieldsthat were producing in 2010 will drop from 69 mb/d to 22 mb/d by 2035 – a fall of overtwo-thirds (Figure 3.16). This decline is twice the current oil production of all OPEC countriesin the Middle East. As a result, the gross additional capacity needed to maintain the currentproduction level is 17 mb/d by 2020 and 47mb/d by 2035. The necessary capacity additionswill come largely from fields already discovered but yet to be developed, mainly in OPECcountries. This projection is derived from detailed analysis of the production profiles ofdifferent types of fields in each region. Natural gas liquids (NGLs) production from currentlyproducing fields also declines, though this is more than offset by the significant increase innewNGLs production associated with increased gas production (see Chapter 4).
Figure 3.16 " World liquids supply by type in the New Policies Scenario
0102030405060708090100110
1990 2000 2010 2020 2030 2035
mb/d Biofuels
Processing gains
Unconvenkonal oil
Natural gas liquids
Yet to be found
Yet to be developed
Currently producing
Crude oil:
11. SeeWEO-2008 for detailed analysis of field decline rates (IEA, 2008).
© O
EC
D/IE
A, 2
011

124 World Energy Outlook 2011 - GLOBAL ENERGY TRENDS
NGLs, produced together with natural gas, provide a growing contribution to global oil supply,driven by the projected growth in gas production and reduced gas flaring (associated gas isoften rich in NGLs) and wetter gas production in some countries.12 Unconventional oil, suchas Canadian oil sands, Venezuelan extra-heavy oil, coal-to-liquids (CTL), gas-to-liquids (GTL),kerogen shales and additives, also play an increasingly important role. Current low gas pricesin North America have triggered renewed interest in GTL there. For example, Sasol (a SouthAfrica-based leader in GTL technology) is pursuing feasibility studies into the economic viabilityof GTL plants fed by shale gas located in Louisiana and separately in British Columbia withTalisman, an independent Canadian exploration and production company. Other companiesare thought to be considering GTL projects too. Therefore, our GTL projections have beenupdated to include increased production in North America. Interest in CTL (as well as inmethanol to be used as a gasoline blending agent) remains strong in China. High oil prices andgrowth in the sale of M15 gasoline (a blend of gasoline with 15% methanol by volume) andM85 gasoline (with 85%methanol) have triggered a boom inmethanol productionworldwide,with previously mothballed plants being reactivated in several countries. Methanol is oftencheaper to produce than ethanol, but for technical reasons cannot be blended into gasolinein large concentrations without modifications to the vehicle engine and fuel system. It alsorequires additional safeguards for handling due to its high toxicity. For the purposes of ourprojections, it is classified as an additive, within the category of unconventional oil.
Figure 3.17 " Major changes in liquids supply in the New Policies Scenario, 2010-2035
-3 -2 -1 0 1 2 3 4 5 6mb/d
Crude oil
Unconvenkonal oil
NGLs
Biofuels
Net change
Iraq (*)Saudi Arabia (*)World biofuels
BrazilCanada
KazakhstanVenezuela (*)
United Arab Emirates (*)Kuwait (*)
United StatesAngola (*)
MexicoMalaysia
OmanArgenkna
RussiaNorway
United KingdomChina
(*) OPEC member
12. NGLs are added to crude oil when repor"ng produc"on in volume terms. However, the balance between demandand supply is made on an energy equivalent basis, taking into account the lower energy per unit volume of NGLscompared with crude oil. Addi"onal investment in polymerisa"on units in refineries is included in the investmentprojec"ons to enable NGLs to replace crude oil, par"cularly in producing transport fuels.
© O
EC
D/IE
A, 2
011

Chapter 3 - Oil market outlook 125
3
By country, Iraq provides the biggest projected increase in production between 2010 and2035. Most OPEC countries increase production over the Outlook period, while productionfalls in most non-OPEC countries. The main exceptions are Brazil, Canada and Kazakhstan,all of which see an increase in output of over 2 mb/d or more (Figure 3.17). The biggestprojected declines occur in China, the United Kingdom, Norway and Russia.
Non-OPEC produc!on
In the New Policies Scenario, non-OPEC oil production in aggregate declines slightly over theprojection period, from 48.8mb/d in 2010 to 47.7mb/d in 2035. However, this trendmaskssignificant underlying changes: the 5 mb/d increase of crude oil production from Brazil andKazakhstan is more than offset by declines in most other non-OPEC producers, resulting inan overall decline of 7 mb/d of crude oil output. The balance is partially redressed by anincrease of 5 mb/d in the output of unconventional oil, mainly from oil sands in Canada,CTL projects (principally in China, South Africa and to a lesser degree the United States) andan increase in NGL production of 1 mb/d (Table 3.5).
Latin American production decreases as mature declining basins are only partly offsetby increased production from the deepwater pre-salt play off Brazil. In late 2010, thestate oil company, Petrobras, launched the world’s largest-ever share offering, raisingaround $67 billion, to support its plans to invest $128 billion over the five years to 2016 indeveloping pre-salt discoveries. This will involve building 11 floating production, storage andoffloading vessels, up to 28 drilling rigs (in Brazilian yards) and 146 supply boats to supportthe drilling of up to 500 wells. This effort, along with Petrobras’ other projects, is projectedto drive up Brazil’s production from 2.1mb/d in 2010 to about 3mb/d in 2015 and 4.4mb/dby 2020. We project production to rise further to 5.2 mb/d by 2035.
The Caspian region strengthens its role as a key oil producer and exporter throughout theprojection period.13 Kazakhstan will be an important area of new oil production capacity, withproduction projected to increase from 1.6mb/d in 2010 to nearly 4mb/d in 2035. Kazakhstan’sprojected increase in production has been pushed back in this year’sOutlook, due to continuedwrangling over the Kashagan oilfield development. This super-giant field was discovered in2000 and initial production is anticipated in late 2012 at the earliest. Production from thefirst development phase should ramp up to 300 kb/d and subsequent phases could see totalproduction reach 1.3mb/d by 2030. The development has been plagued by cost over-runs andschedule delays due to technical complexities. The Kazakh government did not approve thePhase 2 development plan in early 2011, citing concerns about the cost and schedule.
Canada sees rapid growth in oil production throughout the projection period, mainly fromoil sands (output of which grows from 1.5 mb/d in 2010 to 4.5 mb/d in 2035). This could behindered by continuing debate about the environmental effects of oil sands exploitation(IEA, 2010). However, the Canadian oil industry and provincial and federal governmentscontinue to seek ways to reduce the environmental footprint and less intrusive in-situextraction techniques are becomingmore common. For example, the government of Albertahas committed to spend $2 billion on developing carbon capture and storage projects.
13. SeeWEO-2010 for a detailed analysis of energy prospects for the Caspian region (IEA, 2010).
© O
EC
D/IE
A, 2
011

126 World Energy Outlook 2011 - GLOBAL ENERGY TRENDS
Table 3.5 " Non-OPEC oil* production in the New Policies Scenario (mb/d)
1980 2010 2015 2020 2025 2030 20352010-2035
Delta %**
OECD 17.3 18.9 19.4 18.8 18.6 18.8 18.9 0.0 0.0%
Americas 14.2 14.1 15.0 15.2 15.6 16.1 16.6 2.4 0.6%
Canada 1.7 3.4 4.3 4.5 5.0 5.4 5.7 2.3 2.1%
Mexico 2.1 3.0 2.7 2.5 2.4 2.5 2.5 -0.4 -0.6%
United States 10.3 7.8 8.0 8.2 8.1 8.2 8.3 0.5 0.3%
Europe 2.6 4.2 3.7 2.9 2.4 2.1 1.8 -2.3 -3.2%
Asia Oceania 0.5 0.6 0.8 0.7 0.6 0.5 0.5 -0.1 -0.5%
Non-OECD 19.8 29.9 31.4 31.6 31.4 30.4 28.8 -1.1 -0.2%
E. Europe/Eurasia 12.5 13.7 14.2 14.0 14.6 15.2 15.1 1.4 0.4%
Russia 11.1 10.5 10.4 9.9 9.7 9.7 9.7 -0.8 -0.3%
Kazakhstan 0.5 1.6 1.9 2.3 3.3 3.9 3.9 2.3 3.6%
Asia 4.5 7.8 7.9 7.5 6.8 5.7 4.7 -3.1 -2.0%
China 2.1 4.1 4.2 4.2 3.8 3.0 2.3 -1.8 -2.2%
India 0.2 0.9 0.8 0.7 0.7 0.7 0.6 -0.3 -1.4%
Middle East 0.5 1.7 1.5 1.2 1.2 1.1 1.0 -0.7 -2.2%
Africa 1.0 2.6 2.6 2.4 2.2 2.0 1.8 -0.7 -1.3%
Latin America 1.3 4.1 5.3 6.4 6.6 6.4 6.2 2.1 1.7%
Brazil 0.2 2.1 3.0 4.4 5.1 5.2 5.2 3.1 3.6%
Total non-OPEC 37.1 48.8 50.8 50.4 50.0 49.2 47.7 -1.1 -0.1%
Non-OPEC market share 59% 58% 57% 56% 55% 52% 49% n.a. n.a.
Conventional 37.0 46.8 47.5 46.3 44.9 43.1 40.6 -6.1 -0.6%
Crude oil 34.1 40.3 40.5 39.0 37.5 35.6 33.1 -7.2 -0.8%
Natural gas liquids 2.8 6.4 7.0 7.3 7.4 7.5 7.5 1.1 0.6%
Unconventional 0.2 2.1 3.3 4.1 5.1 6.1 7.0 5.0 5.1%
Share of total non-OPEC 0% 4% 6% 8% 10% 12% 15% n.a. n.a.
Canada oil sands 0.1 1.5 2.5 2.9 3.6 4.0 4.5 3.0 4.4%
Gas-to-liquids - 0.0 0.0 0.1 0.2 0.3 0.4 0.4 9.1%
Coal-to-liquids 0.0 0.2 0.2 0.4 0.7 0.9 1.2 1.1 8.5%
*Includes crude oil, NGLs and unconventional oil. **Compound average annual growth rate.
Russia, discussed in detail in Chapter 8, maintains its position as the largest oil producerin the world for the next few years, before it is overtaken again by Saudi Arabia. Initiallyrelatively flat at above 10 mb/d, Russian oil production then slowly declines to 9.7 mb/din 2035, as new greenfield developments struggle to keep pace with the increasing decline
© O
EC
D/IE
A, 2
011

Chapter 3 - Oil market outlook 127
3
in production from older fields. Russian fiscal policy is a key determinant of when and howquickly Russian production will decline. Current terms limit the incentive to invest whenprices rise; our projections assume sympathetic evolution of taxation.
In theUnited States, declines in production frommature conventional basins in Alaska and inthe lower-48 states are outweighed by strong growth in supplies of light tight oil (Spotlight),rising NGL production and deepwater production in the Gulf of Mexico, which resumes itsgrowth following the Deepwater Horizon disaster (Box 3.3). There is further potential forupside in production from all of these sources: if shale gas producers target playswith higherliquids content, NGLs would increase, additional light tight oil plays could be developed andmore of the recent discoveries in the Gulf of Mexico (or future Arctic discoveries) could bedeveloped. CTL and GTL also contribute to the growth in total supply, particularly in thelater part of the projection period, when kerogen oil also adds to the production increase.Biofuels are an important contributor to total liquids production, with the United Statescurrently producing almost half of the world’s biofuels.
S P O T L I G H T
The new American revolution: light tight oil
Light tight oil provides another good example of how the industry continues toinnovate, developing new techniques and technologies to tap previously uneconomicresources. The term refers to oil produced from shale, or other very low permeabilityrocks, with technologies similar to those used to produce shale gas, i.e. horizontalwells and multi-stage hydraulic fracturing (see Box 4.1). Geologically, light tight oilis an analogue of shale gas; oil or gas have either not been expelled from the (shale)source rock or havemigrated only short distances into other, usually low permeability,rock formations, adjacent to or within the shale itself. This is why light tight oil is oftenreferred to as shale oil. Unfortunately, the term shale oil is also often used to referto oil produced by industrial heat treatment of shale, which is rich in certain types ofkerogen – a mixture of solid organic material. To avoid confusion, we refer to this askerogen oil, or kerogen shale. In linewith industry practice, we classify light tight oil asconventional oil and kerogen oil as unconventional.Interest in light tight oil started with the Bakken shale, a large formation underlyingNorth Dakota and extending into Saskatchewan, Manitoba andMontana. Productionfrom the Bakken in North Dakota began on a small scale in the early 1950s, reachingabout 90 kb/d in the early 2000s, after operators began drilling and fracturinghorizontal wells. After 2005, production increased more rapidly, to average some310 kb/d in 2010 and reach a high of 423 kb/d in July 2011 (NDSG, 2011). Thecombination of success in the Bakken and the widening of the differential betweenoil and gas prices prompted a flurry of interest in developing light tight oil throughoutNorth America (IEA, 2011c). Shale gas producers trying to improve investment returnsbegan targeting acreage with wetter gas, i.e. higher liquid content, increasing theirNGL production, and some progressed further to shales containing predominantly oil,
© O
EC
D/IE
A, 2
011

128 World Energy Outlook 2011 - GLOBAL ENERGY TRENDS
like the Bakken. Drilling activity is also shifting from gas to oil in the Eagle Ford playin Texas, where oil production was on average only 10 kb/d in 2010 (RRC, 2011), andis also rising in the Niobrara play in Colorado, Utah and Wyoming, in various playsin California (including the Monterrey play) and in the Cardium and Exshaw plays inCanada. Other recently identified plays are also likely to be developed.The size of light tight oil resources and howmuch can be technically and economicallyextracted are still poorly known. The United States Geological Survey estimated inthe past that the Bakken held about 4 billion barrels of recoverable oil, but this is nowwidely considered to be an underestimate, and it is being re-evaluated (USGS, 2008b).Recoverable light tight oil resources in the lower 48 states were recently estimated tobe at least 24 billion barrels (US DOE/EIA, 2011a), larger than the country’s 22.3 billionbarrels of proven reserves (US DOE/EIA, 2010).Like shale gas, production from light tight oil wells declines rapidly. However, initialproduction rates vary widely, depending on geology, well lengths and the numberof fractures carried out. Averaged over the first month, Bakken wells produce from300 barrels per day (b/d) tomore than 1 000 b/d, butwithin five years the greatmajorityof wells are producing less than 100 b/d. Over their life-time they typically recoverbetween 300 thousand barrels (kb) and 700 kb. Given the steep declines in production,new wells are constantly needed to maintain output; hence, constant drilling activity isessential to production growth. During 2010, the Bakken rig fleet doubled to 160 units,which drilled 700 new wells, increasing monthly average oil production betweenJanuary and November by about 120 kb/d. However, in December winter weatherdisrupted activity and no new wells came on stream, resulting in monthly average oilproduction dropping by nearly 13 kb/d.High oil prices have been a key driver of this growth, given that the breakeven oil pricefor a typical light tight oil development is around $50/barrel (including royalty payments).The surge in production has outpaced infrastructure developments. Oil pipelines arebecoming congested, adding to the surplus of oil at the Cushing hub in Oklahoma,which serves as the delivery point for West Texas Intermediate (WTI) crude oil futurescontracts. This is partly why WTI currently trades at an exceptionally large discount toother benchmark crudes, such as Brent. This discount is likely to ease in the longer termas new transport capacity is built, particularly to the refineries on the Gulf Coast. In NorthDakota, the lack of gas treatment and transport facilities has led to an increase in flaring,with a record 29% of produced gas being flared in the first half of 2011.To provide an indication of prospective light tight oil production in the United States,we have modelled the output potential of three plays which are currently active;the Bakken, Niobrara and Eagle Ford. Representative well production profiles wereused for each of the plays and the assumption made that by 2013 the drilling activityin each play rises to the current level in the Bakken, is then maintained until 2020,after which it falls steadily, to zero by 2035. In total some 30 000 wells are drilled.Production reaches about 1.4 mb/d by 2020, peaking shortly thereafter, as drillingrates drop. Cumulative oil recovery by 2035 is about 11 billion barrels, or slightly lessthan half of the latest estimated recoverable light tight oil resources in the United
© O
EC
D/IE
A, 2
011

Chapter 3 - Oil market outlook 129
3
States (US DOE/EIA, 2011a). Of course, any upward reassessment of these resourcescould lead to higher production rates or maintenance of plateau production forlonger, while new plays are likely to be developed if the current levels of profitabilityare sustained.
Figure 3.18 " Light tight oil production potential from selected plays
0
0.2
0.4
0.6
0.8
1.0
1.2
1.4
1.6
2006 2035
Niobrara
Eagle Ford
Bakken
mb/d
2015 20252010 2020 2030
So does light tight oil represent a new energy revolution? It is certainly having animpact in the United States, wherewe estimate production could exceed 1.4mb/d by2020, somewhat reducing US imports; but this alone is unlikely to affect the dynamicsof global oil supply significantly. For this new source of oil to have a wider impact,production would need to take off in other plays or in other parts of the world. Theresources outside North America have not been quantified but, as with shale gas, it islikely that light tight oil is present inmany locationsworldwide. For example, the Parisbasin in France could hold several billion barrels of recoverable resources, and testsare being conducted in the Neuquen basin in Argentina. As is the case for shale gas,environmental concerns or regulatory constraints could hinder developments, but thepotential economic and energy security benefits could result in significantly highergrowth of light tight oil production.
Mexico’s production is projected to continue to decline in the first half of the projectionperiod, due to the slow pace of new developments, and then sees slow growth in linewith the country’s resource potential, particularly in its deepwater sector of the Gulf ofMexico. For many years Mexico’s production relied heavily on the super-giant offshoreCantarell field, discovered in 1976. Cantarell’s production has declined by about 1.5 mb/dover the last decade, though this has been partially offset by production from the adjacentKu Maloob Zaap complex, overall the country’s output is still 0.9 mb/d lower than itsprevious peak. Legislation was changed in 2008 to allow Petróleos Mexicanos (PEMEX), thestate oil company, to sign incentivised development contracts with other oil companies.The first three contracts for secondary development of small, mature onshore fields wereawarded in August 2011. Larger contracts, which could have a more substantial impact onthe country’s production, are expected to be tendered in future.
© O
EC
D/IE
A, 2
011

130 World Energy Outlook 2011 - GLOBAL ENERGY TRENDS
Box 3.3 " The long-term implications of the Deepwater Horizon disaster
Following the Macondo blowout, the US government imposed a moratorium inMay 2010 on all deepwater drilling. Although the moratorium was lifted after fivemonths, no further drilling permits were issued until February 2011, almost tenmonths after the blowout. As a result we estimate that deepwater Gulf of Mexicoproduction in 2011 will be 300 kb/d lower than estimated prior to the disasterand that it could take until 2015 for production to catch-up with pre-Macondoprojections.
Although activity in the Gulf of Mexico was at a standstill for much of 2010, bothoperators and contractors have maintained a strong interest and presence in theregion. Chevron took a final investment decision on the $7.5 billion Jack/Saint Maloproject in late 2010 and Shell did likewise with the Cardamom field, with 140 Mboeof recoverable volumes, in mid-2011. In June 2011, ExxonMobil announced a newdiscovery, with an estimated recoverable volume of 700Mboe. Of the approximately30 deepwater rigs active in the Gulf of Mexico in early 2010, only seven had movedto other regions bymid-2011, leaving sufficient capacity to deliver these new projectsand continue exploration.
The Macondo disaster has led to extensive reappraisal of all aspects of deepwaterdevelopment. Regulators and operators alike have been closely examining thefindings of numerous inquiries, in an effort to avoid a repeat incident.While not all ofthe inquiries are complete, regulations are likely to tighten and operators will becomemore cautious. In the Gulf of Mexico, two consortia have formed organisations toprovide emergency response capabilities for well-control incidents: ten operators,led by the super-majors, have created the Marine Well Containment Company; and24 independents have clubbed together in the Helix Well Containment Group,which will utilise equipment used to cap and kill the Macondo well. While thesedevelopments inevitably lead to increased costs, this is not anticipated to greatlyinflate deepwater costs, though some smaller companies, lacking depth of experienceor the skill levels needed for deepwater developments, may choose to concentrateon other opportunities.
Outside the United States, there has been little discernable reduction in activity.Angola held a deepwater licensing round in 2010, awarding acreage in January2011, and Trinidad and Tobago has announced its intention to hold a deepwaterbid round later in 2011. Deepwater exploration continues in East Africa and Asia,with several discoveries reported. There has been a revival of interest in the SouthChina Sea. Petrobras has continued exploration in Brazilian deepwater basins, findingthe Libra and Franco fields in 2010 and pursuing a swathe of developments, withambitious production targets – the largest deepwater development programme everundertaken. Deepwater production increases in importance throughout the Outlookperiod, as exploration for and discoveries of new fields, particularly in non-OPECcountries, increasingly move to deeper, more difficult areas.
© O
EC
D/IE
A, 2
011

Chapter 3 - Oil market outlook 131
3
Europe’s production decline is well established, with North Sea output dropping from justunder 6mb/d in 2000 to just over 3.5mb/d in 2010. It is projected to fall further, to 1.6mb/dby 2035, though the decline may be offset to some extent by increasing NGL productionand possible development of new discoveries in the exploration frontiers of Greenland,the Barents Sea or exploitation of light tight oil on land. While recent discoveries offshoreNorway could yield over a billion barrels of recoverable resources, these are insufficient toreduce the aggregate rate of decline of the North Sea significantly.
In the Asia-Pacific region, Australia’s conventional oil production stays above 0.5mb/d thanksto rising NGL output from the large liquefied natural gas (LNG) projects that are currentlyunder construction, offsetting declines in crude production. China maintains production atits current level of around 4mb/d until about 2025, before conventional resource limitationslead to declining output. This decline is offset to some extent by growing unconventionalproduction, including CTL. There are some promising developments in non-OPEC Africacountries, notably offshoreWest Africa (Ghana, Cameroon and themore speculative Liberia,Sierra Leone and Sao Tome and Principe) and in East Africa (particularly in Uganda andTanzania). Collectively, their contribution is projected to slow the decline in production ofthe region as a whole, from 2.6 mb/d in 2010 to 1.8 mb/d in 2035. In non-OPEC Middle Eastcountries, there is renewed interest in developing the vast kerogen oil resources in Jordan,with at least three possible projects being studied (another kerogen oil project is beingconsidered in Morocco, where pilot projects have been undertaken in the past). Omani andSyrian oil production continues to decline, with fewnewdiscoveries. Overall, production fromthese countries in aggregate is projected to decline from 1.7mb/d in 2010 to 1mb/d in 2035.
OPEC produc!on
In the New Policies Scenario, OPEC countries in aggregate account for all of the increase inglobal oil production between 2010 and 2035. Consequently, OPEC’s share of oil productiongrows steadily through the projection period, from 42% in 2010 to 44% in 2020 and 51%in 2035 – a level close to its historical peak just before the first oil crisis in 1973. Growth inOPEC output comes mainly from the Middle East, where production grows over 12 mb/d,compared with an increase outside the region of just under 1.7 mb/d (Table 3.6). Thisreflects the pattern of resource endowments and, in part, the onset of decline in Angolanproduction in the second half of the projection period, as the country’s prolific deepwaterdiscoveries, that were brought on stream in the 2000s, go into decline, along with decliningcrude production in Algeria and resource limitations in Ecuador. In theNewPolicies Scenario,the recent unrest in theMiddle East andNorth Africa is assumed to have no significant long-term impact on investment and production in the region. The possibility of investments inthat region being deferred is discussed later in this chapter.
Iraq’s oil productionpotential is immense (Box3.4), but exploiting it dependson consolidatingthe progress made in peace and stability in the country, including resolution of the debateabout the legal status of contracts awarded by the Kurdistan Regional Government(KRG). Iraq remains one of the least explored major resource holders. Although about80 fields have been discovered, only 30 are currently in production and large swathes of theWestern Desert remain unexplored. Proven reserves total 115 billion barrels (O&GJ, 2010),
© O
EC
D/IE
A, 2
011

132 World Energy Outlook 2011 - GLOBAL ENERGY TRENDS
but the resource potential is much larger. Oil production in mid-2011 averaged 2.8 mb/d(IMOO, 2011 and IEA, 2011d), including some 0.14 mb/d of production from the KRG area.According to Deputy PrimeMinister al-Shahristani, it could reach 3mb/d by the beginning of2012. We project production to reach 5.4 mb/d in 2020 and 7.7 mb/d in 2035. Even so, thislevel is well below that targeted originally by the government.
Saudi Arabia is expected to contribute the second-largest increase in oil productionworldwide between now and 2035, raising production by almost 40% from 10mb/d in 2010to nearly 14 mb/d by 2035. The national oil company, Saudi Aramco, will be responsiblefor most of the investment required to build up production in the coming decades, asinternational oil companies are involved in production only in the Partitioned Neutral Zoneshared with Kuwait, and in gas exploration. Roughly half of Saudi production still comesfrom the Ghawar field – the largest oilfield in the world. Smaller fields, some of themsuper-giants in their own right, are now being developed. In some cases, these werediscovered several decades ago, but not brought on stream due to technical or costconsiderations and the global supply-demand balance. In 2010, Saudi Aramco completedthe Khurais and Khursaniya projects, which together added 1.7mb/d of new capacity. SaudiAramco is also implementing a pilot carbon-dioxide enhanced oil recovery scheme on asmall sector of Ghawar to demonstrate its technical viability – which could further extendthe productive life of the field, by increasing recovery.
Box 3.4 " Prospects for increased oil production in Iraq
The Iraqi government has awarded twelve Technical Service Contracts (TSCs) forthe development of major oil fields. So far, operators have focused on “quick-win”activities, like refurbishing facilities, repairing wells and drilling a limited numberof new wells, so as to raise production quickly by 10%, the threshold at which thegovernment is contractually obliged to start making payments. The profit marginin the TSCs is fixed, providing a strong incentive to keep cost and investment down,but there is little opportunity to increase returns should oil prices rise. Continuedinvestment will hinge on the success of these projects and opportunities elsewhere.
BP and the China National Petroleum Corporation (CNPC) have increased outputat the Rumaila oil field to around 1.2 mb/d, triggering payment obligations by thegovernment. CNPC has signed an oil export agreement with the government enablingit to take delivery of about two million barrels in May 2011 as payment in kind.ExxonMobil and ENI, operators of West Qurna and Zubair oilfields respectively, arealso thought to have reached the trigger point for payments.
Iraqi production has grown from an average of 2.4 mb/d in 2010 to around 2.8 mb/din mid-2011. Were all the TSCs to proceed according to their original schedule,Iraqi oil production capacity would reach more than 12 mb/d by 2017. However,given Iraq’s infrastructure, logistical and security challenges, government officials
© O
EC
D/IE
A, 2
011

Chapter 3 - Oil market outlook 133
3
have acknowledged that the target level of production capacity originally implied willnot be achievable and amore realistic aspiration of reaching 6mb/d to 7mb/d by 2017is being discussed. The KRG area contributes around 0.14 mb/d of total productionunder contracts awarded in the last decade, but the validity of these contracts is notyet recognised by the central government. This area has great exploration potentialwhich has attracted a number of companies, but large investments are unlikely untilthe legal differences with Baghdad are resolved.
Slow progress is being made to develop infrastructure. The government is workingon doubling the Gulf export terminal capacity to 3.6 mb/d by early 2012, but manybelieve this project will be delayed. Work is also progressing on repairing andupgrading a pipeline to the TurkishMediterranean port of Ceyhan, to double capacityto around 1 mb/d in 2013. Export bottlenecks mean that production is likely to beconstrained to less than 3 mb/d until 2012. Thereafter, it could start increasing, byaround 300 kb/d annually, as repairs, upgrades and new facilities are completed. Inthe New Policies Scenario, production reaches 5.4 mb/d in 2020 and nearly 8 mb/din 2035. Other supporting infrastructure is also required to facilitate the increasedproduction. Shell is building a quay on the Shatt al-Arab waterway, to allow shippingof equipment to the Majnoon field. ExxonMobil is leading a consortium planning a“common seawater supply facility”, a $10 billion project to deliver up to 12 mb/d oftreated seawater for injection into the southern oilfields.
Roughly half of Iraq’s associated gas production is currently flared. With rising oilproduction, flaring increased from 8.1 bcm in 2009 to 9.1 bcm in 2010 (GGFRP, 2010).In mid-2011 the government signed an agreement with Shell and Mitsubishi to formthe Basra Gas Company which will gather and treat gas produced in the Basra region(such as that currently being flared) andmarket it. The government is keen to use thegas for power generation, so as to reduce shortages, which have been a significanteconomic and political issue for some time.
The United Arab Emirates’ (UAE) oil production has increased over the last decade, from2.6 mb/d in 2000 to 2.9 mb/d in 2010. Abu Dhabi, the UAE’s principal oil producer, hasstated its intention to increase sustainable oil production capacity to 3.5 mb/d by 2018.It recognises that new developments are becoming more complex and will require thecontinued support of international oil companies. These companies already participatein the UAE’s upsteam sector through partial ownership of both Abu Dhabi Company forOnshore Oil Operations (ADCO) and Abu Dhabi Marine Operating Company (ADMA).ADCO’s 75-year concession will expire in 2014 and ADMA’s 65-year concession in 2018. Itremains uncertain whether these contracts will be renegotiated, re-tendered or opened upand restructured. Major new investments are unlikely to be sanctioned until this matter isresolved. We project production to continue increasing steadily throughout the projectionperiod, reaching 3.3 mb/d in 2020 and 4mb/d by 2035.
© O
EC
D/IE
A, 2
011

134 World Energy Outlook 2011 - GLOBAL ENERGY TRENDS
Table 3.6 " OPEC oil* production in the New Policies Scenario (mb/d)
1980 2010 2015 2020 2025 2030 2035 2010-2035
Delta %**
Middle East 18.0 23.8 26.7 28.6 30.4 32.9 36.0 12.2 1.7%
Iran 1.5 4.2 4.2 4.3 4.3 4.5 4.8 0.5 0.5%
Iraq 2.6 2.4 4.2 5.4 6.0 6.8 7.7 5.2 4.7%
Kuwait 1.4 2.5 2.6 2.7 2.9 3.1 3.5 1.0 1.3%
Qatar 0.5 1.7 2.0 2.1 2.1 2.2 2.3 0.5 1.1%
Saudi Arabia 10.0 10.0 10.5 10.9 11.6 12.6 13.9 3.8 1.3%
United Arab Emirates 2.0 2.9 3.3 3.3 3.4 3.7 4.0 1.1 1.3%
Non-Middle East 7.6 11.0 11.0 10.9 11.4 11.9 12.7 1.7 0.6%
Algeria 1.1 1.9 2.0 2.0 2.1 2.1 2.1 0.3 0.5%
Angola 0.2 1.8 1.8 1.8 1.8 1.7 1.5 -0.3 -0.7%
Ecuador 0.2 0.5 0.4 0.3 0.3 0.3 0.2 -0.2 -3.0%
Libya 1.9 1.7 1.6 1.6 1.6 1.8 2.0 0.4 0.8%
Nigeria 2.1 2.5 2.4 2.4 2.5 2.7 2.9 0.4 0.6%
Venezuela 2.2 2.7 2.8 2.8 3.1 3.4 3.9 1.2 1.4%
Total OPEC 25.5 34.8 37.7 39.6 41.7 44.9 48.7 13.9 1.4%
OPEC market share 41% 42% 43% 44% 45% 48% 51% n.a. n.a.
Conventional oil 25.5 34.2 36.3 37.8 39.6 42.4 45.7 11.5 1.2%
Crude oil 24.7 29.0 29.3 29.8 30.7 32.4 34.7 5.7 0.7%
Natural gas liquids 0.9 5.2 7.0 8.0 8.8 9.9 11.0 5.8 3.0%
Unconventional oil 0.0 0.6 1.4 1.8 2.2 2.5 3.0 2.4 6.8%
Venezuela extra-heavy oil 0.0 0.5 1.1 1.4 1.7 1.9 2.3 1.8 6.6%
Gas-to-liquids - 0.0 0.2 0.2 0.3 0.4 0.5 0.4 11.7%
*Includes crude oil, NGLs and unconventional oil. **Compound average annual growth rate.
Kuwait’s oil production has trended upwards in the last decade, from 2.2 mb/d in 2000 to2.8 mb/d in 2008, before falling back in 2009 with OPEC production constraints in the faceof weak demand. In the late 1990s, Kuwait offered contracts to international oil companiesto re-develop and operate several heavy oil fields on its northern border with Iraq in ascheme originally known as “Project Kuwait”. While this project had the potential to expandproduction significantly, it has stalled in the face of political opposition. Emphasis has nowshifted away fromheavy oil to developing the country’s lighter oil reserves. In early 2011, thenational company, Kuwait Oil Company, reaffirmed its target to boost production capacityby 1 mb/d to 4 mb/d by 2020 and to sustain that capacity until 2030. Achieving this will becontingent on securing the technical assistance of international companies and creating aclimate conducive to large investments. We project production to increase gradually overthe projection period, reaching 3.5 mb/d by 2035.
Iran is currently the Middle East’s second-largest oil producer and has significant upsideproduction potential, both for crude oil and NGLs. However, the current political isolationof the country and fiscal terms which discourage foreign investment, make it unlikely that
© O
EC
D/IE
A, 2
011

Chapter 3 - Oil market outlook 135
3
this potential will be realised quickly. Currently, investment in the Iranian oil sector is barelysufficient to maintain production capacity as older producing fields decline. Most revenuesfrom oil exports are consigned to finance other state programmes, starving the national oilcompany of funds to invest in developing new fields and infrastructure and in combatingdeclines at existing fields. Thus, we project only a slow increase in overall oil output duringthe projection period, in large part driven by NGLs.Qatari crude oil production has grown only modestly in the last decade, mainly throughdevelopment of the offshore Al Shaheen field. However, NGL production has risen sharplyin the last two years as a swathe of LNG projects have come on-stream. Qatar’s North Field– the largest gas field in the world – has large condensate reserves, which are likely to fuelfurther growth in NGL production. However, there is currently a moratorium on new gasdevelopments, which is not expected to be lifted before 2015. GTL production is also beingboosted, with the Pearl GTL plant’s production rising to 140 kb/d (together with 120 kb/dof NGLs) in 2012. In the longer term, more LNG export capacity is expected to be addedand there is scope for new GTL projects beyond the current Oryx and Pearl plants, as ahedge against any decoupling of gas and oil prices. As a result of increased gas production,production of NGLs exceeded crude oil production for the first time in 2010 and is set tomake up the greater part of higher oil production throughout the projection period. Total oiloutput is projected to reach 2.3 mb/d in 2035.Venezuela’s oil production has declined through much of the last decade, due to lackof investment. This has been due, in part, to a nationalistic policy, which has compelledinternational oil companies either to cede a significant amount of equity to the nationalcompany, PDVSA, or to leave the country altogether, as in the case of ExxonMobiland ConocoPhillips. We project a modest decline in conventional oil production overthe projection period. However, this decline is more than offset by rapid growth inunconventional, extra-heavy oil from the Orinoco belt, which has attracted investmentfrom a number of foreign companies, in partnershipwith PDVSA.14 In aggregate, Venezuelanproduction rises from 2.7 mb/d in 2010 to 3.9 mb/d in 2035.Nigeria is the largest oil producer in Africa, producing some 2.5 mb/d in 2010, from theNiger Delta and offshore in shallow and, to a lesser extent, deepwater. Production has beensporadically disrupted by civil conflicts, which have led to a substantial amount of capacitybeing shut-in in recent years. Investment has also been slowed by the inability of theNigerian National Petroleum Company, to covers its share of investment in joint ventureswith international oil companies. Uncertainty about a draft Petroleum Industry Bill, firstissued in 2008 and still under review, which could have a significant impact on upstreamterms and conditions, is also damaging the investment climate. With these uncertainties inmind, we project a slow rate of investment in the near term and, therefore, a slight drop inproduction in the early part of theOutlook period. However, we project a rebound in outputlater in the projection period, on the assumption that the investment climate improves. Anincrease in NGL production also contributes to higher oil production in the longer term, asefforts to reduce gas flaring slowly bear fruit. Production drops to 2.4 mb/d in 2015, butrecovers to 2.9 mb/d in 2035.
14. See last year’sOutlook for a detailed discussion of the prospects for Venezuelan extra-heavy oil produc"on (IEA, 2010).
© O
EC
D/IE
A, 2
011

136 World Energy Outlook 2011 - GLOBAL ENERGY TRENDS
Libyan oil production almost entirely stopped in early 2011 following the eruption of conflict.Over the decade to 2010, Libyan production fluctuated between 1.4 mb/d and 1.8 mb/d, andwas averaging around 1.7 mb/d at the start of 2011. Libyan crude oil is generally of a “lightsweet” quality (meaning it has relatively low density and low sulphur content), making it ideal forrefining into low-sulphur transport fuels. Although (as of September 2011) the extent of damageto infrastructure is not fully known, some production has resumed and, if security improves,could rise towards pre-conflict levels over the coming two years. Our projections assumerenewed investment before 2015, allowing production to increase gradually to 2mb/d by 2035.
Other OPEC countries are expected to maintain more or less steady levels of productionfor a large part of the projection period, the variations reflecting their individualresource endowments. Production potential in both Angola and Ecuador is constrainedby the currently limited extent of ultimately recoverable resource estimates, though newdiscoveries could alter this picture.
Trade
International trade in oil (including crude oil, NGLs, unconventional oil, additives and refinedproducts) is poised to continue to grow. In the New Policies Scenario, trade between themajor regions increases from 37 mb/d in 2010 to more than 48 mb/d in 2035, growing11 mb/d over the projection period (Figure 3.19). This compares with a projected increasein global demand of nearly 13 mb/d. Net imports to China exceed 12.5 mb/d by 2035, upby almost 8 mb/d from current levels. India’s net imports grow by over 4 mb/d to nearly7mb/d – the second-largest increase. The reliance on imports in developing Asia, as awholeincreases from 56% of total oil needs in 2010 to 84% in 2035. European imports remainrelatively flat at 9 mb/d, as demand and regional production decline almost in parallel.
Net imports to North America fall by nearly 6 mb/d to under 3 mb/d by 2035, on the backof rising indigenous production and falling demand. The United States accounts for most ofthis decline, with imports falling by 4mb/d below today’s level in 2035. Among the exportingregions, theMiddle East sees the biggest increase in net exports, which expand bymore than9mb/d to almost 28mb/d by the end of the projection period. Exports from Latin Americanalso rise strongly, by more than 2 mb/d between 2010 and 2035, thanks to the projectedsurge in production in Brazil.
The rising dependence on imports in some non-OECD regions, particularly in Asia, willinevitably heighten concerns about supply security, as reliance grows on supplies from asmall number of producers, especially in theMiddle East and North Africa (MENA)15 region,which are shipped along vulnerable supply routes, particularly the straits of Hormuz in thePersian Gulf, the Malacca Straits in Southeast Asia and the Gulf of Aden. That message hasbeen brought home by recent civil unrest in the region and the conflict in Libya. Net importsinto all importing countries are much lower in the 450 Scenario, rising just over 2 mb/dby 2020 and then falling back to close to their current levels by 2035, demonstrating theenergy-security benefits from concerted policy action to avert climate change.
15. The MENA region is defined as the following 17 countries: Algeria, Bahrain, Egypt, Iran, Iraq, Jordan, Kuwait,Lebanon, Libya, Morocco, Oman, Qatar, Saudi Arabia, Syria, Tunisia, United Arab Emirates and Yemen.
© O
EC
D/IE
A, 2
011

Chapter3-O
ilmarketoutlook
13
7
3
Figure 3.19 " Regional oil demand and net trade in the New Policies Scenario (mb/d)
This map is for illustrative purposes and is without prejudice to the status of or sovereignty over any territory covered by this map.
0 5 10
2035
2020
2010
15 20 25
Net imports (mb/d)
Net exports (mb/d)
Demand (mb/d)
OECD Americas
0 5 10
2035
2020
2010
15
OECD Europe
0 5 10
2035
2020
2010
OECD Asia Oceania
100 5
2035
2020
2010
Eastern Europe/Eurasia
10 150 5
2035
2020
2010
China
India
0 5 10
2035
2020
2010
Other Asia
0 5 10
2035
2020
2010
0 5 10
2035
2020
2010
15 20 25 30
Middle East
Africa
0 5 10
2035
2020
2010
0 5 10
2035
2020
2010
Latin America
Notes: Imports and exports show net volumes traded. International marine and aviation fuel use is not included.
© OECD/IEA, 2011
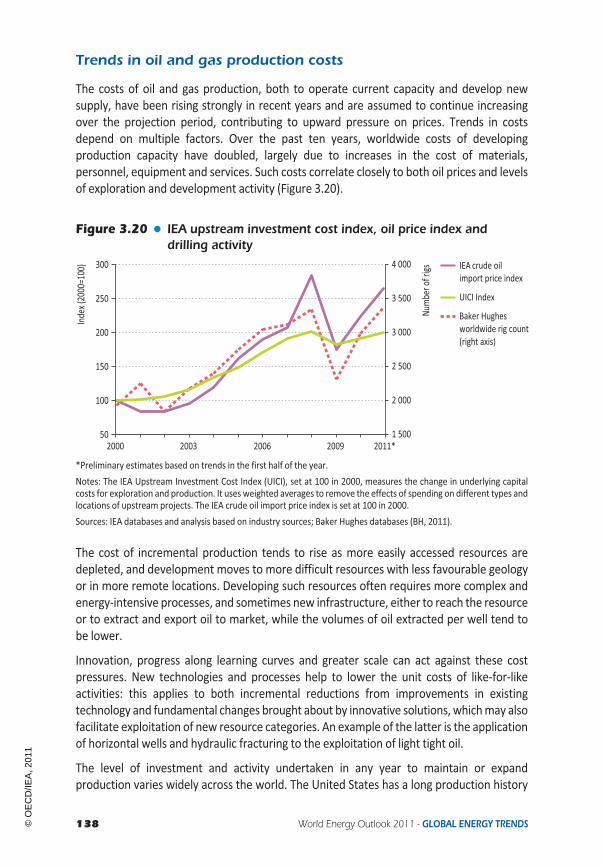
138 World Energy Outlook 2011 - GLOBAL ENERGY TRENDS
Trends in oil and gas production costs
The costs of oil and gas production, both to operate current capacity and develop newsupply, have been rising strongly in recent years and are assumed to continue increasingover the projection period, contributing to upward pressure on prices. Trends in costsdepend on multiple factors. Over the past ten years, worldwide costs of developingproduction capacity have doubled, largely due to increases in the cost of materials,personnel, equipment and services. Such costs correlate closely to both oil prices and levelsof exploration and development activity (Figure 3.20).
Figure 3.20 " IEA upstream investment cost index, oil price index anddrilling activity
50
100
150
200
250
300
1 500
2 000
2 500
3 000
3 500
4 000
2000 2003 2006 2009 2011*
Index
(2000=100)
Numbe
rofrigs IEA crude oil
import price index
UICI Index
Baker Hughesworldwide rig count(right axis)
*Preliminary estimates based on trends in the first half of the year.Notes: The IEA Upstream Investment Cost Index (UICI), set at 100 in 2000, measures the change in underlying capitalcosts for exploration and production. It uses weighted averages to remove the effects of spending on different types andlocations of upstream projects. The IEA crude oil import price index is set at 100 in 2000.Sources: IEA databases and analysis based on industry sources; Baker Hughes databases (BH, 2011).
The cost of incremental production tends to rise as more easily accessed resources aredepleted, and development moves to more difficult resources with less favourable geologyor in more remote locations. Developing such resources often requires more complex andenergy-intensive processes, and sometimes new infrastructure, either to reach the resourceor to extract and export oil to market, while the volumes of oil extracted per well tend tobe lower.
Innovation, progress along learning curves and greater scale can act against these costpressures. New technologies and processes help to lower the unit costs of like-for-likeactivities: this applies to both incremental reductions from improvements in existingtechnology and fundamental changes brought about by innovative solutions, whichmay alsofacilitate exploitation of new resource categories. An example of the latter is the applicationof horizontal wells and hydraulic fracturing to the exploitation of light tight oil.
The level of investment and activity undertaken in any year to maintain or expandproduction varies widely across the world. The United States has a long production history
© O
EC
D/IE
A, 2
011

Chapter 3 - Oil market outlook 139
3
and most of the easily accessible onshore oil has already been produced. Consequentlyoperators now target more difficult resources, like light tight oil, which require many morewells per unit of production than conventional resources. As a result, the United Statesnow uses over half of the world’s drilling rig fleet to produce just 9% of the world’s oil (and19% of the world’s gas). This is largely because the average well in the United Statesproduces about 20 barrels per day (b/d), compared with 3 400 b/d per well in Saudi Arabia(Table 3.7), which still has giant, discovered fields that have yet to be developed. Because ofits high activity levels, the United States attracted nearly one-quarter of worldwide oil andgas investment in 2010. Russia, which produces nearly 40%more oil than the United States,also has a large oil and gas industry and employs the second-largest number of drilling rigsglobally, albeit only about half the number of the United States.
Table 3.7 " Oil production, indicative development activity and investmentin the United States, Russia and Saudi Arabia, 2010
United States Russia Saudi Arabia
Proven oil reserves* (billion barrels) 22 77 265
Crude oil and NGL production (mb/d) 7.6 10.5 9.9
Reserves to production ratio (years) 8 20 73
Number of producing oil wells 370 000 127 000 2 900
Average production per well (b/d) 20 80 3 400
Number of active oil and gas drilling rigs** 1 700 850 100
Oil wells drilled: ExplorationProduction
77818 138
3003 700
27148
Total upstream capital expenditure** ($ billion) 120 30 10
Employment in the oil and gas industry 2 200 000 1 100 000 90 000
*Definitions of proven reserves vary by country. **Drilling activity and expenditure cover both oil and gas. Capitalexpenditure for Saudi Arabia and Russia are estimates.Sources: IEA databases and analysis based on industry sources, including: OPEC (2011), US DOE/EIA (2011b), US DOE/EIA(2011c), Otkritie (2011) and SA (2011) for number of producingwells and number ofwells drilled; BP (2011) for oil reserves;BH (2011) for active number of drilling rigs; API (2011), ILO (2010) and Rosstat (2010) for employment.
Middle East oil resources remain the cheapest in the world to exploit, although costpressures are increasing even there, as operators tacklemore difficult resources. Informationabout costs in specific countries is patchy. BP announced in 2009 that it planned to invest,with its partner China National Petroleum Corporation, around $15 billion over the next20 years in order to increase production from Iraq’s Rumaila oilfield from about 1 mb/d to2.85mb/d, implying a capital cost of around $8 000 per barrel of daily capacity (/b/d) added.This would be close to the lowest cost anywhere in theworld for a development project. Thecapital cost of increasing production from the Upper Zakum oilfield in offshore Abu Dhabifrom about 500 kb/d to 750 kb/d, which is being undertaken by ExxonMobil, is expectedto be about the same per barrel of daily capacity. In Saudi Arabia, the development of theheavy and sour Manifa field, the capacity of which is planned to reach a plateau of around900 kb/d in 2014, is expected to cost about $15 000/b/d. The cost per daily barrel of capacity
© O
EC
D/IE
A, 2
011

140 World Energy Outlook 2011 - GLOBAL ENERGY TRENDS
of developing the giant heavy Wafra oilfield in the Partitioned Neutral Zone, with capacitydue to reach 600 kb/d, is expected to be similar; the field, which is being developed byChevron, requires thermal stimulation with steam injection. Capital costs for developmentof deepwater oil are much higher, ranging from $40 000/b/d to $80 000/b/d.
The total cost of producing oil, including the amortisation of development costs butexcluding taxes and profit margins, is well below the current market price of oil, generatingsignificant economic rent that is captured by governments in taxes and royalties and by oilcompanies in profits (Figure 3.21). The OPEC Middle East countries have by far the lowestcosts, followed by the main North African producers. However, to generate sufficientrevenue to balance government budgets in OPEC countries (the budget breakeven) requiresa much higher oil price and this figure has been rising in recent years. This is particularly thecase in theMiddle East, where large, youthful populations are putting pressure on educationsystems, housing and job creation schemes. In many of these countries, which rely heavilyon oil export revenues to fund government budgets, the budget breakeven oil price is nowabove $80/barrel. This will become an increasingly important consideration in the formationof future oil prices.
Figure 3.21 " Breakeven costs, budget breakeven and commerciallyattractive prices for current oil production for selectedproducers, mid-2011
0
20
40
60
80
100
120
0 05 510 1015 20 25 30 35 40 45Oil produckon (mb/d)
Dollarspe
rbarrel Budget
breakeven
Commerciallyairackve
Qatar Kuwa
it
SaudiArabia
UAE Lib
ya
Russia Venezuala
Angola
Algeria
Iraq
Nigeria
Ecuado
r
Iran
Supermajors
Breakevencost
Notes: Only OPEC countries, Russia and the aggregation of the five super-majors (BP, Chevron, ExxonMobil, Shell andTotal) are included. The breakeven cost is the realised oil price at which all operating expenses (excluding taxes) andcapital costs (including a 10% capital discount rate), are fully recovered.Sources: IEA databases and analysis based on industry sources: APICORP (2011), Deutsche Bank (2011), Credit Suisse(2011), IMF (2011), PFC (2011) and CGES (2011).
For countries and companies where development and production is driven primarilyby commercial rather than fiscal motives, the key criterion for sustainable long-terminvestment is for income from production to cover capital cost recovery, operating costsand fiscal payments, together with a competitive commercial return. For developments in
© O
EC
D/IE
A, 2
011

Chapter 3 - Oil market outlook 141
3
regions where international oil companies and other privately owned companies are theprimary project developers and operators, oil prices in a range from$70/barrel to $90/barrelare currently needed to meet this criterion in most resource categories. This takes intoaccount taxes, royalties and the risk-adjusted required returns on investment. Breakevencosts, which exclude taxes, vary by resource category and average around $40/barrel.
As development and production costs vary both regionally and by resource category,the IEA oil and gas supply models include cost inflation factors (correlated to oil price),regional cost inflation factors (to simulate cost increases as resources are depleted) andtechnology learning curves to compute costs on an annual basis for all regions and resourcetypes over the projection period. Production costs then become input parameters of thesupply-modelling. The worldwide increase in average production cost (as measured by thebreakeven cost) for new oil and gas production is projected to exceed 16% (in real terms)between 2011 and 2035 (Figure 3.22). TheMENA region has the largest production increaseover this period and average breakeven costs there increase from just over $12 per barrelof oil equivalent ($/boe) in 2011 to more than $15/boe in 2035, as production increases bymore than 17Mboe/d. But costs increase by evenmore inmost other regions. They increasemost in Latin America, to over $50/boe by 2035, because of the growing importance of high-cost deepwater developments.
Figure 3.22 " Oil and gas production and breakeven costsin the New Policies Scenario
0
10
20
30
40
50
60
0 10 20 30 40 50 60 70
Dollarspe
rboe
(2010) 2035
2011Lakn America
Rest of Africa
Mboe/d
E. Europe/Eurasia
Middle East and North Africa
OECD Americas
Rest of OECD
Asia
Oil and gas investment
Global upstream oil and gas investment is set to continue to grow strongly in 2011, hitting anew record of over $550 billion – 9% up on capital spending in 2010 (Table 3.8) and almost10% higher than the previous peak in 2008.16 These estimates are based on the announcedspending plans of 70 leading oil and gas companies. Total upstream spending is calculatedby adjusting upwards their announced spending, according to their estimated share of
16. Upstream investment is not always reported separately for oil and gas.
© O
EC
D/IE
A, 2
011

142 World Energy Outlook 2011 - GLOBAL ENERGY TRENDS
world oil and gas production in each year. The increase in spending reflects both rising costs(which are driving up the costs of current and newly launched projects) and higher prices(which have enhanced potential investment returns before tax). The spending plans of25 leading companies suggest that global spending in the downstream sector (which forthese companies represents over one-quarter of total oil and gas investment) may increaseeven faster than in the upstream sector in 2011.
Table 3.8 " Oil and gas industry investment by company (nominal dollars)
Upstream Total2010
($ billion)2011
($ billion)Change
2010/20112010
($ billion)2011
($ billion)Change
2010/2011Petrochina 23.6 27.9 18% 42.7 53.3 25%Petrobras 23.9 24.0 0% 43.4 52.3 21%ExxonMobil 27.3 28.8 6% 32.2 34.0 6%Gazprom 26.9 24.8 -8% 29.2 27.0 -8%Royal Dutch Shell 21.2 19.4 -9% 23.7 26.0 10%Chevron 18.8 22.6 20% 19.6 26.0 33%Pemex 17.4 18.9 9% 20.8 22.2 7%BP 17.8 19.3 9% 18.4 20.0 9%Total 14.8 16.0 8% 18.0 20.0 11%Sinopec 8.2 8.3 1% 16.7 19.1 14%Eni 12.9 12.9 0% 18.4 18.4 0%Statoil 12.6 14.4 14% 14.0 16.0 14%ConocoPhillips 8.5 12.0 41% 9.8 13.5 38%Rosneft 6.1 8.0 31% 8.9 11.0 23%Lukoil 4.9 6.9 41% 6.8 9.0 32%CNOOC 5.1 8.8 73% 5.1 8.8 73%BG Group 5.9 6.0 2% 7.7 8.4 9%Apache 4.2 6.4 51% 5.4 8.1 51%Repsol YPF 4.1 4.5 11% 6.8 7.5 11%Suncor Energy Inc. 4.8 5.4 13% 5.8 6.8 17%Occidental 3.1 4.9 56% 3.9 6.1 56%Devon Energy Corp 5.9 5.5 -7% 6.5 6.0 -7%Anadarko 4.7 5.2 12% 5.2 5.8 12%Chesapeake 4.9 5.8 17% 4.7 5.8 22%EnCana 4.5 4.4 -2% 4.8 4.7 -2%Sub-total 25 292.0 320.9 10% 378.3 435.6 15%Total 70 companies 408.3 446.7 9% n.a. n.a. n.a.World 505.1 552.6 9% n.a. n.a. n.a.
Notes: Only publically available data has been included, but estimates of upstream spending, as a share of the total,have been made in cases where detailed breakdowns were unavailable (IEA databases include both public andnon-public estimates for all major oil and gas producing companies). Theworld total for upstream investment is derived byprorating upwards the spending of the 70 leading companies, according to their estimated share of oil and gas production ineach year. Pipeline investment by Gazprom is classified as upstream as it is required for the viability of projects.Sources: Company reports and announcements; IEA analysis.
© O
EC
D/IE
A, 2
011

Chapter 3 - Oil market outlook 143
3
Trends in upstream spending differ somewhat according to the size and type of operatingcompany. The 25 largest oil and gas companies plan to spend an estimated $320 billion in2011, 10% more than in 2010. Their spending in 2010 turned out to be 8%, or $22 billion,higher than had been budgeted in the middle of the year. The five leading international oilcompanies (or super-majors) – BP, Chevron, ExxonMobil, Shell, and Total – spent a total of$100 billion in 2010 and have reported a 6% increase in budgeted spending for 2011. Thesuper-majors’ share of world upstream spending will fall to 19% of the total, while nationaloil company spending in 2011 is projected to rise by 8%, to over $220 billion, taking theirshare of world upstream spending to 40% (Figure 3.23). Other independent companies planto increase capital spending bymore than 12%, tomore than $220 billion in 2011. There is amarked difference in capital efficiency – defined as the annual capital spending required tomaintain output per barrel of oil equivalent produced – between the national companies,particularly those in the Middle East and North Africa with preferential access to low-costreserves, and other companies.
Figure 3.23 " Worldwide upstream oil and gas investment and capitalefficiency by company type
0
5
10
15
20
25
30
0
100
200
300
400
500
600
2008 2009 2010 2011
Billiond
ollars(no
mina
l) Smaller companies
Other major companies
Five super-majors
Other nakonal oilcompanies
MENA nakonal oilcompanies
Capital efficiency*(right axis)
Dollarspe
rbarrelofo
ilequ
ivalen
t(no
mina
l)
Notes: Capital efficiency is defined as the capital spending to maintain output per barrel of oil equivalent produced, it isnot included for the group of smaller companies. 2011 data is based on company plans. The five super-majors are definedas BP, Chevron, ExxonMobil, Shell and Total.Source: IEA databases and analysis.
Annual upstream investment in nominal terms more than quadrupled between 2000 and2011. In real terms, i.e. adjusted for cost inflation,17 it increased by 120% over this period,as investment shifted to more complex projects with higher costs per barrel per day ofcapacity added. As indicated above, the unit cost for additional capacity added has risensharply. For example, over the last decade the aggregate production of the five super-majorshas fluctuated between 16 Mboe/d and 18 Mboe/d with little discernable trend, despite aquadrupling of upstream investment in nominal terms.
17. Taking account of increases in input costs, such as drilling, equipment and material, and adjusted to remove theeffects of changes in spending on different types and loca"ons of upstream projects.
© O
EC
D/IE
A, 2
011

144 World Energy Outlook 2011 - GLOBAL ENERGY TRENDS
Based on the New Policies Scenario projections, upstream spending will need to continue torise in the medium and longer term, for three reasons: rising demand; rising costs, as a resultof both cost inflation and a need to develop more difficult resources; and a need to combatrising decline rates at existing fields. However, there is at present no evidence that this willoccur, at least in the next five years. We have compiled data on the five-year upstream capitalspending plans of 16 of the largest companies, which represent about 30% of 2011 plannedspending and average over $10 billion annually. The average annual spending planned by thesecompanies to 2015 is slightly lower than the average spending planned for 2011 by the samecompanies. The plans of only four of these companies show an increase in annual averagespending to 2015 compared with 2011, with seven remaining flat and five showing a fall.
In the longer term, the required increase in the rate of investment accelerates, although theneed to develop more costly resources and the high cost of unconventional oil, GTL and CTLplants in non-OPEC regions will be offset to some degree by the shift in production towardsthe Middle East and other regions, where development and production costs are much lower.Cumulative investment over the period 2011 to 2035worldwide in the oil and gas sector in totalis estimated to amount to $19.5 trillion in theNewPolicies Scenario (Table 3.9). Of this, upstreaminvestment accounts for about 80%, or nearly $620 billion per year. This is considerably morethan the average of $440 billion over 2010 to 2035 projected in last year’sWEO. The increase isexplained by faster growth in production in the near term and higher supply from more costlyunconventional sources in non-OPEC countries in the long term, as well as higher cost inflation.
Table 3.9 " Cumulative investment in oil and gas supply infrastructure by regionin the New Policies Scenario, 2011-2035 ($2010 billion)
Oil Gas Annual averageupstream O&GUpstream Refining Total Upstream T&D* Total
OECD 2 438 265 2 703 2 632 933 3 565 203Americas 1 975 126 2 100 1 679 492 2 172 146United States 1 330 96 1 426 1 287 n.a. n.a. 105
Europe 418 93 511 648 354 1 002 43Asia Oceania 45 46 91 305 87 391 14Non-OECD 6 282 745 7 027 4 126 1 139 5 265 416E. Europe/Eurasia 1 310 88 1 398 1 084 380 1 464 96Russia 738 49 787 733 246 979 59
Asia 526 438 963 1 180 385 1 564 68China 300 210 510 408 182 590 28India 63 140 203 175 62 238 10
Middle East 1 010 127 1 137 257 226 483 51Africa 1 522 35 1 557 1 121 58 1 179 106Latin America 1 914 57 1 971 483 91 574 96Brazil 1 350 29 1 379 165 n.a. n.a. 61
World** 8 720 1 010 9 997 6 758 2 072 9 497 619*T&D is transmission and distribution and is calculated on a regional basis. **World total oil includes an additional$268 billion of investment in inter-regional transport infrastructure.World total gas includes an additional $587 billion ofinvestment in LNG infrastructure and $80 billion of investment in LNG carriers.
© O
EC
D/IE
A, 2
011

Chapter 3 - Oil market outlook 145
3
Impact of deferred upstream investmentin the Middle East and North Africa
A time of great uncertainty
The outlook for global energy markets is clouded by considerable uncertainty, notably thepace of economic recovery, the future of climate-change policies, the role of gas in globalenergy supply following the unconventional gas “revolution”, the role of nuclear energyin the aftermath of Fukushima Daiichi and the impact of political changes in the MiddleEast and North Africa (MENA) region. The first four sources of uncertainty are examinedelsewhere in this Outlook: economic growth in Chapter 2, climate polices in Chapter 6,the prospects for faster growth in gas use in Chapter 4 and the future of nuclear power inChapter 12. This section addresses the implications should there be a shortfall in investmentin the near term in upstream oil and gas investment in MENA.
In the New Policies Scenario – our central scenario – we project that MENA will contributemore than 90%of the required growth in oil production to 2035 (Table 3.10). To achieve thisgrowth, upstream investment inMENA needs to average $100 billion per year from 2011 to2020, and $115 billion per year from 2021 to 2035 (in year-2010 dollars). But it is far fromcertain that all of this investment will be forthcoming, for many different reasons affectingsome or all of the countries in the region. The consequences for global energymarkets couldbe far-reaching. Potential causes of lower investment in one or more countries include:
! Deliberate government policies to develop production capacity more slowly in order tohold back resources for future generations or to support the oil price in the near term.
! Constraints on capital flows to upstream development because priority is given tospending on other public programmes.
! Restricted, or higher-cost, access to loans or other forms of capital.
! Delays due to legal changes or renegotiation of existing agreements.
! Increased political instability and conflicts.
! Economic sanctions imposed by the international community.
! Higher perceived investment risks, whether political or stemming from uncertainties indemand.
! Constraints on inward investment as a result of stronger resource nationalism,particularly in regimes seeking to pre-empt popular uprisings.
! Delays due to physical damage to infrastructure during conflicts.
Similar kinds of risk exist in other major oil- and gas-producing countries and regions. Ouranalysis of the MENA region does not focus on any particular country, but considers theconsequences of lower upstream investment across the region.
© O
EC
D/IE
A, 2
011

146 World Energy Outlook 2011 - GLOBAL ENERGY TRENDS
Table 3.10 " The role of MENA in global oil and gas productionin the New Policies Scenario
MENA World Share of world
Conventional remaining recoverable oil resources (billion barrels) 1 178 2 401 49%
Remaining recoverable gas resources (tcm) 154 810 19%
Oil production 2010 (mb/d) 29.9 83.6 36%
Gas production 2010 (bcm) 632 3 275 19%
Oil production growth to 2035 (mb/d)* 12 12.8 93%
Gas production growth to 2035 (bcm) 424 1 474 29%
Upstream investment needed 2011-2035 ($2010 billion) 2 706 15 478 17%
*Oil production in this table and section refers to total oil production (crude oil, NGLs and unconventional oil,excluding biofuels).Note: tcm = trillion cubic metres.
The Deferred Investment Case
The Deferred Investment Case analyses how global oil markets might evolve if investmentin the upstream industry of MENA countries were to fall short of that required in the NewPolicies Scenario over the next few years. The key assumption for this case is that upstreamoil (and gas) investment is reduced by one-third in all MENA countries, compared withthat in the New Policies Scenario over the period 2011 to 2015. The assumed shortfall ininvestment is then made good gradually after 2015 so that by 2020 the level of investmentis back to that provided for in the New Policies Scenario. In this way, the case illustrateswhat could happen if there were an “orderly” shortage of investment, rather than a suddeninterruption resulting, for example, from a serious conflict in one or more of the majorproducing countries of the region.18 The shortfall in upstream investment includes a shortfallin gas investment, sowould affect oil and gasmarkets directly and have knock-on effects forother energy markets; but the prime focus of this analysis is on the oil market.
As a result of the assumed deferral in investment, MENA oil and gas production capacityfalls progressively short of that projected in the New Policies Scenario, reflecting the delayin bringing new capacity on stream. We have assumed that the amount of capacity heldunused (spare capacity) remains constant as a percentage of total available capacity, sothe loss of capacity results directly in lower production. The shortfall in oil production inMENA, compared with the New Policies Scenario, reaches over 6 mb/d in 2020 – largeenough to have a significant impact on global oil balances, so increasing oil and gas prices.That prompts higher investment in developing resources in other countries, though higherdevelopment costs there mean that the shortfall in MENA production is only partially made
18. The effects of the conflict in Libya are already included in all the scenarios.
© O
EC
D/IE
A, 2
011

Chapter 3 - Oil market outlook 147
3
good by other regions. Higher oil and gas prices also lead to some loss of demand, such thatthe reduced demand and increased non-MENA production compensate for the lowerMENAproduction to keep the market in balance.
Box 3.5 " Assumptions and methodology of the Deferred Investment Case
The assumptions on reduced investment in the upstreamoil and gas industry inMENAwere fed into the oil supply module of the World Energy Model (WEM), generatinga lower level of output from already producing fields and fields to be developed ineach country in the region. The impact on international oil prices was derived throughseveral iterations of the WEM supply and demand modules to find the oil-pricetrajectory that brings non-MENA supply and global demand into equilibrium in eachyear of lower MENA supply.
With the exception of international fuel prices, assumptions about all the other factorsdriving energy demand and supply in the MENA region and elsewhere were kept thesame as in the New Policies Scenario. End-user fuel subsidy policies in MENA andother countries were assumed to remain as they are in the New Policies Scenario. Theterms of trade between consuming and producing nations would be likely to changeover the projection period, as oil-producing countries would benefit in the shortterm from higher revenues from imports. However, our analysis shows that, over theprojection period as a whole, the cumulative net revenues of MENA do not changesignificantly compared to the New Policies Scenario. The same holds true for importbills in importing countries. For these reasons, and to avoid unduly complicatingcomparisonswith theNewPolicies Scenario, the GDP assumptions of theNewPoliciesScenario have not been changed. In practice, reduced investment inMENA and higheroil prices would be likely to affect the path of GDP growth to a different extent indifferent regions.
Results of the Deferred Investment Case
Oil prices
The international crude oil price, for which the average IEA crude oil import price servesas a proxy, increases rapidly in the short to medium term, as the investment shortfallbecomes apparent to the market. The price peaks at around $150/barrel in 2016/2017 (inyear-2010 dollars, equivalent to $176/barrel in nominal terms), when the investmentshortfall relative to the New Policies Scenario is starting to decline. The price then startsto decrease gradually and converges with that of the New Policies Scenario by the end ofthe projection period (Figure 3.24). As the oil prices are annual averages, they have smoothtrajectories; however the higher prices of the Deferred Investment Case would be likely tobe accompanied by significantly increased price volatility.
© O
EC
D/IE
A, 2
011

148 World Energy Outlook 2011 - GLOBAL ENERGY TRENDS
Figure 3.24 " Average IEA crude oil import price in the New Policies Scenarioand Deferred Investment Case
0
20
40
60
80
100
120
140
160
2005 2010 2015 2020 2025 2030 2035
Dollarspe
rbarrel(2
010) Deferred
Investment Case
New PoliciesScenario
The upward part of the price trajectory in the Deferred Investment Case is similar to thatwhich occurred in the last decade, resulting in a spike in 2008 – also the result, at least inpart, of insufficient investment. The downward slope is comparable to the decline afterthe second oil shock in 1979/1980, which saw the same kind of market response, involvingdemand reduction through increased efficiency, fuel switching and increased investmentin exploration and production in other regions, as that now assumed in the DeferredInvestment Case (Figure 3.25).
Figure 3.25 " Change in average IEA crude oil import price after initial fallin investment in the Deferred Investment Case, compared topast price shocks
-20
-10
0
10
20
30
40
50
60
70
80
0 1 2 3 4 5 6 7 8 9 10
Dollarspe
rbarrel(2
010)
Years aher inikal investment shorlall
1st oil shock(1972-1978)
2nd oil shock(1978-1986)
2008 price peak(2001-2009)
Deferred InvestmentCase (2011-2021)
Gas and coal prices react to the increased oil price and the reduction in investment ingas supply capacity in MENA, though to a different extent across regions. In the period ofelevated oil prices, gas and coal prices decouple to some degree from oil prices, so that the
© O
EC
D/IE
A, 2
011

Chapter 3 - Oil market outlook 149
3
ratios of gas and coal prices to oil prices are lower than in the New Policies Scenario. This isbecause the loss of gas supply, as a proportion of global supply, is significantly less than thatof oil supply and because oil prices have only a moderate influence over coal prices.
Impact on oil demand
With sharply higher prices, global primary oil demand in the Deferred Investment Casebarely increases in the medium term, reaching only about 88 mb/d in 2015 – fractionallyhigher than in 2010 and about 3.2 mb/d below the New Policies Scenario (Figure 3.26).Thereafter, demand picks up steadily, reaching 89.3 mb/d in 2020 (3.1 mb/d lower thanin the New Policies Scenario) and 97.8 mb/d in 2035 (1.6 mb/d lower). The peak of thedemand reduction occurs in 2017, when demand is 3.9mb/d lower than in the New PoliciesScenario. The change in demand is more pronounced in the near term, because oil pricesrise quickly as the market reacts to the shortfall in investment. The higher price encouragesenergy conservation, notably via reduced driving distances. In the long term, higher oil pricesencourage switching to alternative fuels – notably conventional and advanced biofuelsand electric vehicles – and accelerate the commercialisation and sale of more efficienttechnologies, including more fuel-efficient vehicles. Coal use also sees a modest increase indemand, driven by increase in CTL production.
Figure 3.26 " World primary oil demand in the New Policies Scenario andthe Deferred Investment Case
75
80
85
90
95
100
2000 2005 2010 2015 2020 2025 2030 2035
mb/d
OECD
Non-OECD
mb/d
Fall in demand(right axis):
New PoliciesScenario
DeferredInvestment Case
4
6
8
10
2
0
In the medium term, non-OECD countries account for most of the reduction in oilconsumption in the Deferred Investment Case – nearly 60% (or 1.8mb/d) in 2020 – but theirshare declines to less than 50% (or 0.8 mb/d) by 2035. Consumers in developing countriesrespond to higher prices by delaying the acquisition of their first car or by driving less inthe cars they already own. The poorest consumers switch less rapidly to modern oil-basedfuels. Demand for oil products in OECD countries is less affected initially by the increase ininternational prices than demand in non-OECD countries, mainly because end-user pricesare a smaller share of total OECD prices due to higher taxes and because the cost of oilrepresents a smaller share of total disposable household income. However, sustained highprices at the level expected in the Deferred Investment Case make the production of many
© O
EC
D/IE
A, 2
011

150 World Energy Outlook 2011 - GLOBAL ENERGY TRENDS
types of biofuels competitive (IEA, 2010). This stimulates investment in additional biofuelscapacity – mostly in OECD countries – to replace a portion of oil demand throughout theprojection period. The two largest oil-consuming and importing countries – theUnited Statesand China – play a key role in long-term demand reduction, their combined contributiongrowing from 30% of global reductions in 2020 to 50% in 2035. In the United States, theimpact of higher prices on demand is marked, because taxes there are low comparedwith most of the rest of the world; in China, higher prices spur vehicle manufacturers toaccelerate larger scale production of more efficient conventional and electric vehicles.
The transport sector is responsible for most of the reduction in oil demand, accounting fornearly 70% of the fall in primary demand in 2020 and 95% in 2035. Initially, demand falls asmotorists drive less in response to higher prices. This effect disappears by 2035, as pricesconverge with those in the New Policies Scenario (Figure 3.27). The increase in fuel pricesprompts consumers to purchase more efficient vehicles, but the effect on overall fleetefficiency takes time tomaterialize. Similarly, switching to alternative fuels grows in the longterm as supplies increase and consumers modify and upgrade their vehicles. Biofuels usegrows from 1.3mb/d in 2010 to 5.5mb/d in 2035 – 1.2m/d, or 26%, above the New PoliciesScenario.19 In the longer term, persistently higher prices also accelerate the deployment oflight-duty electric vehicles (including plug-ins): sales reach 7million vehicles, or 4.5% of totalpassenger light-duty vehicles sales, in 2035 – one percentage point more than in the NewPolicies Scenario. Sales of natural gas vehicles do not change significantly, as gas prices alsoincrease, even if not to the same extent as oil prices. Nonetheless, transport energy demandis only slightlymore diversified than in the New Policies Scenario, with oil still accounting for86% of total transport fuel use in 2035 – a reduction of just two percentage points.
Figure 3.27 " Reduction in global oil demand in the transport sector bysource in the Deferred Investment Case relative to theNew Policies Scenario
0
0.5
1.0
1.5
2.0
2.5
2015 2020 2035
mb/d
Less distance travelled
Electric vehicles
Biofuels
Efficiency
Reduckon due to:
19. Much of the increase in biofuels use results from an increase in the volumes blended into conven"onal gasolineand diesel. Higher oil prices increase the incen"ve to invest in biofuels produc"on facili"es, which boosts supply anddisplaces demand for oil-based fuels.
© O
EC
D/IE
A, 2
011

Chapter 3 - Oil market outlook 151
3
Oil demand falls much less in volume terms, compared with the New Policies Scenario, innon-transport sectors. The share of buildings in oil use remains relatively constant at around8%. Demand in industry and in non-energy use reacts more in the near term as a result ofenergy savings, but recovers briskly in the longer term, as prices converge with those in theNewPolicies Scenario, because the potential for energy-efficiency gains ismore limited thanin other sectors.
Impact on oil produc!on
In the Deferred Investment Case, lower investment in MENA countries reduces global oilproduction by 3.8 mb/d in 2017 (at its peak) and 1.5 mb/d in 2035, compared with the NewPolicies Scenario. MENA production falls by 3.4 mb/d in 2015 (Figure 3.28). Between 2015and 2020, the shortfall in MENA production increases further, to peak at around 6.2 mb/din 2020, but this is partially offset by an increase in production of 3.2 mb/d in other regions.MENA investment is assumed to recover gradually after 2015 but, due to the decline inproduction from existing fields, total MENA production continues to fall until 2020. After2020, MENA production begins to increase, attaining its 2010 level by 2023. Moreover,a combination of some permanent demand destruction and the long lifetime of theproduction capacity brought online in non-MENA countries (particularly unconventional oilprojects) means that MENA production never returns to the production levels projected inthe New Policies Scenario; in 2035, MENA production is still about 1.2 mb/d lower.
Figure 3.28 " Changes in global oil production and demand in the DeferredInvestment Case relative to the New Policies Scenario
-8
-6
-4
-2
0
2
4
6
8
2015 2020 2035
mb/d
Unconvenkonal oil
OPEC convenkonal oil
Non-OPEC convenkonal oil
Non-MENA produckon change:
MENA produckon change
Impact of reduced demand
The recovery of production in the MENA region after 2015 is comparable to that observedafter past supply disruptions, though in the Deferred Investment Case the loss of productionis initially smaller, but then becomes larger in the longer term (Figure 3.29). Although thecircumstances of the reduction in production are markedly different from those of anabrupt supply disruption, the comparison suggests that the projected rate of such recoveryis plausible.
© O
EC
D/IE
A, 2
011

152 World Energy Outlook 2011 - GLOBAL ENERGY TRENDS
Initially, production in other regions struggles to increase because of the time involved inbringing new production online. Compared with the New Policies Scenario, the increasein non-MENA production is equivalent to about half of the shortfall in MENA productionin 2020; lower demand makes good the difference. In the near to medium term, increasednon-MENA production comes mainly from outside OPEC. The main contributors are Russia,Canada (with increased unconventional production) and Brazil, but smaller productionincreases come frommany other countries. Nonetheless, towards the end of the projectionperiod, non-MENA production of conventional oil is actually lower than in the NewPolicies Scenario, due to a combination of faster resource depletion, competition fromunconventional capacity built-up earlier and competition from the resurging, lower cost,MENA production. Unconventional oil production – oil sands, extra-heavy oil, CTL, GTL andkerogen oil – accelerates over the projection period, relative to theNewPolicies Scenario. By2035, it is 0.9mb/d higher, compensating for three-quarters of the fall inMENA production.
Figure 3.29 " Profile of oil production recovery after disruptionin Deferred Investment Case and past events
0
1
2
3
4
5
6
0 3 6 9 12 15
mb/d
Years aher produckon disrupkon
Deferred InvestmentCase (MENA)
Kuwait 1991
Iran 1981
Iraq 1991
Iraq 1981
Iraq 2003
Change in produckon:
Overall upstream investment for the period 2011 to 2035 in the Deferred Investment Case,at around $15.3 trillion (in year-2010 dollars), is almost the same as in the New PoliciesScenario – despite lower production over the entire period. This is because the capital costsper unit of production capacity in other regions are generally significantly higher than inMENA.
Impact on trade
In the Deferred Investment Case,MENA oil and gas exports are reduced by a volume similarto the decrease in production, in comparison with the New Policies Scenario (the fall isslightly less, as MENA oil and gas demand is also reduced marginally because of higherprices). In the first eight years of the projection period, when oil prices are highest, MENAcash flows from oil and gas exports (the value of exports, net of lifting costs and investmentcosts) are higher than in New Policies Scenario, because lower export volumes are more
© O
EC
D/IE
A, 2
011

Chapter 3 - Oil market outlook 153
3
than offset by higher oil prices (and the call on the cash flow for investment is also lower).The difference in annual cash-flow gradually grows, reaching 23% in 2015, before droppingback to near zero in 2019. However, becauseMENA countries losemarket share throughoutthe whole projection period, their total cumulative cash flow between 2011 and 2035is lower in the Deferred Investment Case than in the New Policies Scenario: cash flow is$16.7 trillion, versus $17 trillion (in year-2010 dollars) (Figure 3.30). Gains in cash flow inthe period to 2018 are more than offset by the loss in the period from 2019 to 2035, due tolowerMENA production and declining prices; 20 this loss in annual cash-flow reaches 15% in2023, before falling back to 5% in the 2030s.
Figure 3.30 " Oil and gas export cash flows and import costs by region inthe New Policies Scenario and Deferred Investment Case,2011-2035
0
10
20
30
40
50
MENAexport cash flows
Non-MENAexport cash flows
Non-MENAimport costs
Trillio
ndollars(20
10) New Policies Scenario
Deferred InvestmentCase
Note: Cash flows and cumulative import bills are shown undiscounted.
Other exporting countries obviously enjoy higher revenues in the Deferred InvestmentCase, as they replace some of the lost MENA production and benefit from higher oil prices.Non-MENA export cash flow is 60% higher than in the New Policies Scenario, at $8.8 trillion.Oil and gas import bills for importing countries increase in both the medium and long term,as the reduction in demand and increase in domestic production do not fully offset the effectof price increases, relative to the New Policies Scenario. Total import bills increase 10% tomore than $46 trillion in the Deferred Investment Case; but oil supplies aremore diversified,as MENA’s share of inter-regional exports falls.
20. Discoun"ng the value of these cash flows at a rate equal to the rate of growth of GDP per capita – as a proxy –reduces the loss of cash flow to about $70 billion.
© O
EC
D/IE
A, 2
011

© O
EC
D/IE
A, 2
011

Chapter 4 - Natural gas market outlook 155
CHAPTER 4
H I G H L I G H T S
NATURAL GAS MARKET OUTLOOK
Nothing but blue skies?
" Natural gas is projected to play an increasingly important role in the global energyeconomy. It is the only fossil fuel for which demand rises in all three Outlookscenarios. In the New Policies Scenario, world demand increases to 4.75 tcm in 2035at an average rate of 1.7% per year. Global gas consumption catches up with coalconsumption. Gas demand growth in the Current Policies Scenario is 2% per year,pulled up by higher total energy demand, but is only 0.9% in the 450 Scenario asdemand peaks around 2030, before falling in favour of zero-carbon energy sources.
" Economic growth and energy policies in non-OECD countries will be the keydeterminant of future gas consumption: non-OECD countries account for 81% ofdemand growth in the New Policies Scenario. A major expansion of gas use in Chinapushes domestic demand above 500 bcm by 2035, from 110 bcm in 2010. Powergeneration takes the largest share of global consumption, increasing at 1.8% per yearin the NewPolicies Scenario; but there is a broad-based rise in gas use across industry,buildings and (from amuch lower base) also the transportation sectors.
" The world’s remaining resources of natural gas can comfortably meet the projectionsof global demand to 2035 and well beyond. Unconventional gas accounts for roughlyhalf the estimated resource base of over 800 tcm; its share in output rises in the NewPolicies Scenario from 13% in 2009 to above 20% in 2035, although the pace of thisdevelopment varies considerably by region. Growth in unconventional output willdepend on the industry dealing successfully with the environmental challenges.
" Russia is the largest gas producer in 2035 (reaching nearly 860 bcm) and makes thelargest contribution to supply growth over the projection period. China emerges asa major producer in Asia (290 bcm in 2035), while output from the Middle East andAfrica also increases rapidly. Europe remains the largest import market – EU importsreach 540 bcm in 2035 – but imports into China increase fastest. Supply and demandin North America remain broadly in balance throughout the Outlook period.
" Although based on somewhat different assumptions, the projections in this Outlookreinforce the main conclusions of a special report released earlier in 2011 whichexamined whether the world is entering a “Golden Age of Gas”. Fundamental factorson both the supply and demand side point to an increased share of gas in the globalenergymix. Although gas is the cleanest of the fossil fuels, increased use of gas in itself(without CCS) will not be enough to put us on a carbon emissions path consistent withlimiting the rise in average global temperatures to 2oC.
© O
EC
D/IE
A, 2
011

156 World Energy Outlook 2011 - GLOBAL ENERGY TRENDS
Demand
Primary gas demand trends
In last year’sOutlook, we askedwhether the prospects for natural gas are now so bright thatwe are entering a “golden age” of natural gas. A specialWEO report, released in June 2011,examined the prospects for, and implications of, higher gas use by developing a “Golden Ageof Gas Scenario” (IEA, 2011); the key findings from this specialWEO report are summarisedat the end of this chapter. The modelling results presented below incorporate the insightsfrom this special report, but not all its assumptions (which intentionally constituted aparticularly favourable set of conditions for natural gas to 2035). We revert here to theassumptions of the threeWEO scenarios as described in Chapter 1.
This year’sOutlook nonetheless highlights the increasingly important role that natural gas isexpected to play in the global energy mix. It is the only fossil fuel for which demand rises inall three scenarios, underlining one of the chief attractions of gas: it is a fuel that does wellunder a wide range of future policy directions. Moreover, gas demand in all scenarios in2035 is higher than theWEO-2010 projections. This reflects the impact on the years to 2015of the 12th Five-Year Plan, announced by China in 2011, which envisages a major expansionof domestic use of natural gas. The global consequences of the damage to the Fukushimanuclear plant in Japan push up projections of future gas consumption, as natural gas is thefuel which benefits most readily from any switch away from nuclear power (see Chapters 5and 12). Higher projected output of unconventional gas also acts to keep increases in theprice of natural gas below the level envisaged inWEO-2010, increasing its competitivenessagainst other fuels. There is, nonetheless, still a large variation in the trajectories of gasdemand between the three scenarios (Table 4.1).
Table 4.1 " Primary natural gas demand by region and scenario (bcm)
New PoliciesScenario
Current PoliciesScenario
450Scenario
1980 2009 2020 2035 2020 2035 2020 2035
OECD 959 1 518 1 705 1 841 1 714 1 927 1 597 1 476
Non-OECD 557 1 558 2 183 2 909 2 215 3 160 2 068 2 400
World 1 516 3 076 3 888 4 750 3 929 5 087 3 665 3 876
Share of non-OECD 37% 51% 56% 61% 56% 62% 56% 62%
In the New Policies Scenario, demand for natural gas grows from 3.1 trillion cubic metres(tcm) in 20091 to 4.75 tcm in 2035, an increase of 55%. The pace of annual demand growthaverages 1.7% per year over the entire period 2009 to 2035, but the rate of growth
1. Es"mated global gas demand in 2010 rebounded to 3.3 tcm.
© O
EC
D/IE
A, 2
011
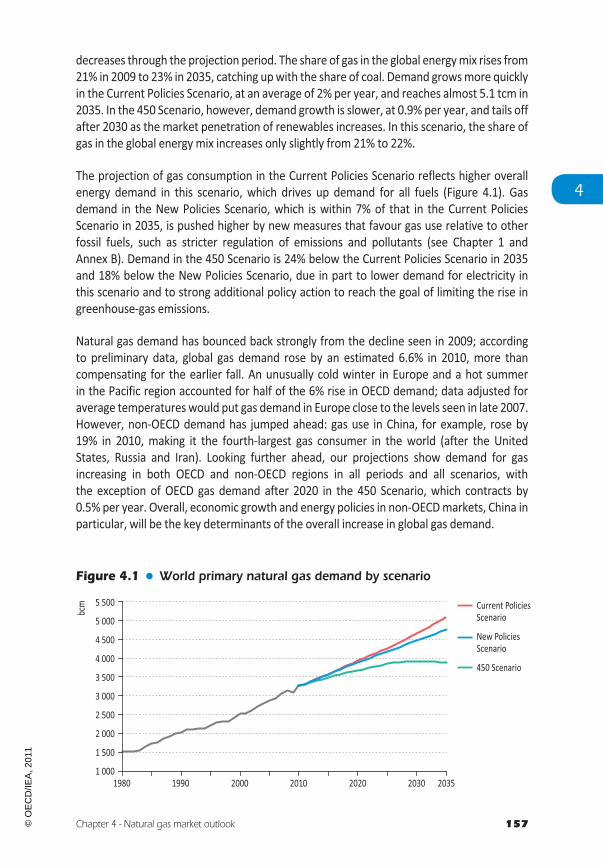
Chapter 4 - Natural gas market outlook 157
4
decreases through the projection period. The share of gas in the global energymix rises from21% in 2009 to 23% in 2035, catching upwith the share of coal. Demand growsmore quicklyin the Current Policies Scenario, at an average of 2% per year, and reaches almost 5.1 tcm in2035. In the 450 Scenario, however, demand growth is slower, at 0.9% per year, and tails offafter 2030 as the market penetration of renewables increases. In this scenario, the share ofgas in the global energy mix increases only slightly from 21% to 22%.
The projection of gas consumption in the Current Policies Scenario reflects higher overallenergy demand in this scenario, which drives up demand for all fuels (Figure 4.1). Gasdemand in the New Policies Scenario, which is within 7% of that in the Current PoliciesScenario in 2035, is pushed higher by new measures that favour gas use relative to otherfossil fuels, such as stricter regulation of emissions and pollutants (see Chapter 1 andAnnex B). Demand in the 450 Scenario is 24% below the Current Policies Scenario in 2035and 18% below the New Policies Scenario, due in part to lower demand for electricity inthis scenario and to strong additional policy action to reach the goal of limiting the rise ingreenhouse-gas emissions.
Natural gas demand has bounced back strongly from the decline seen in 2009; accordingto preliminary data, global gas demand rose by an estimated 6.6% in 2010, more thancompensating for the earlier fall. An unusually cold winter in Europe and a hot summerin the Pacific region accounted for half of the 6% rise in OECD demand; data adjusted foraverage temperatureswould put gas demand in Europe close to the levels seen in late 2007.However, non-OECD demand has jumped ahead: gas use in China, for example, rose by19% in 2010, making it the fourth-largest gas consumer in the world (after the UnitedStates, Russia and Iran). Looking further ahead, our projections show demand for gasincreasing in both OECD and non-OECD regions in all periods and all scenarios, withthe exception of OECD gas demand after 2020 in the 450 Scenario, which contracts by0.5% per year. Overall, economic growth and energy policies in non-OECDmarkets, China inparticular, will be the key determinants of the overall increase in global gas demand.
Figure 4.1 " World primary natural gas demand by scenario
1 000
1 500
2 000
2 500
3 000
3 500
4 000
4 500
5 000
5 500
1980 1990 2000 2010 2020 2030 2035
bcm Current Policies
Scenario
New PoliciesScenario
450 Scenario
© O
EC
D/IE
A, 2
011

158 World Energy Outlook 2011 - GLOBAL ENERGY TRENDS
Regional and sectoral trends
Total demand from non-OECD countries overtook OECD demand in 2008 and is projectedto grow at 2.4% per year over the period to 2035 in the New Policies Scenario, comparedwith 0.7% in the OECD. A disaggregated analysis of the projections confirms that thefastest growing individual gas markets across the world are all outside the OECD (wherethe markets are sizeable, but more mature) (Figure 4.2). The largest increments in demandin 2035, compared to 2009, are in China and the Middle East. Among the major non-OECDmarkets, only in Russia –where natural gas already accounts for more than 50% of primaryenergy use – is the growth in consumption more modest (see Chapter 7).
Figure 4.2 " Natural gas demand by selected region in the New PoliciesScenario, 2009 and 2035
0
200
400
600
800
1 000
NorthAmerica
EuropeanUnion
MiddleEast
Russia China India Japan
bcm
2009
Incremental gasdemand from 2009to 2035
Notes: 2009 is the base year for gas projections. Rates of growth would be lower if 2010 figures were used as base yeardue to the impact of the economic crisis on gas demand in 2009.
Among the major countries and regions, China is the fastest growing, with annual averagegrowth of 6.7%. Over the projection period as awhole, China accounts for a quarter of globalgas demand growth (Figure 4.2 and Table 4.2). Only around 10% of residential householdsin China presently have access to natural gas, well below the global average of 40%, andnational policies are increasingly supportive of an expanded role for gas in China’s energyconsumption as a way to diversify the energymix and reduce local pollution. Our projectionfor China’s demand for gas in 2015 is nearly 200 bcm, rising to 500 bcm in 2035, 11% ofChina’s energy mix. Increases are spread across all of the main consuming sectors, with thelargest increment in power generation.
Gas demand also expands quickly in other parts of Asia and in the Middle East: gas isa particularly attractive fuel for countries that are seeking to satisfy rapid growth in fast-growing cities. As in China, the Indian government plans to increase the share of gas inits energy mix. The domestic gas market is projected to grow from 59 bcm in 2009 to190 bcm in 2035, 11% of total primary energy demand. In the Middle East, gas has becomethe preferred fuel for power generation, substituting for oil in many cases and freeing upthe more valuable product for export. Consumption in gas to-liquids (GTL) plants in the
© O
EC
D/IE
A, 2
011

Chapter 4 - Natural gas market outlook 159
4
Middle East (included in “other energy sector” in Figure 4.3) also adds to the increase.Overall,gas use in the Middle East rises from 340 bcm in 2009 to 620 bcm in 2035, a growth rate of2.3% per year. Demand in Russia growsmore slowly, at an average of 0.8% per year, mainlybecause of continuing improvements in energy efficiency as the capital stock is renewed andend-user gas prices increase.
Table 4.2 " Primary natural gas demand by region in the New PoliciesScenario (bcm)
1980 2009 2015 2020 2025 2030 2035 2009-2035*
OECD 959 1 518 1 654 1 705 1 746 1 804 1 841 0.7%
Americas 660 811 852 877 900 928 951 0.6%
United States 581 652 680 685 692 703 710 0.3%
Europe 264 537 604 627 644 666 671 0.9%
Asia Oceania 35 170 198 201 202 210 219 1.0%
Japan 25 97 118 122 122 125 126 1.0%
Non-OECD 557 1 558 1 911 2 183 2 417 2 668 2 909 2.4%
E. Europe/Eurasia 438 627 698 723 763 797 830 1.1%
Caspian n.a. 107 124 131 143 151 161 1.6%
Russia n.a. 426 467 478 495 513 530 0.8%
Asia 36 357 531 686 796 921 1063 4.3%
China 14 93 197 301 366 435 502 6.7%
India 2 59 76 99 120 150 186 4.5%
Middle East 35 343 402 450 509 578 622 2.3%
Africa 13 99 112 129 142 153 161 1.9%
Latin America 35 133 168 196 208 220 233 2.2%
Brazil 1 20 41 60 70 80 91 5.9%
World 1 516 3 076 3 565 3 888 4 164 4 473 4 750 1.7%
European Union n.a. 508 572 593 608 626 629 0.8%
*Compound average annual growth rate.
In OECD countries, gas for the power sector accounts for the largest share of demandgrowth over the projection period; the share of gas in the OECD electricity mix rises by onepercentage point to 24% in 2035. This continues a trend to gas as the predominant choice fornew generation over the last ten years, albeit at a slower pace. Economic uncertainty, policychoices (includingcarbonpricing inEurope)andtheadditionofmorevariable renewableshaveall contributed to the attraction of gas-fired power, which has lower capital costs and shorterconstruction times than the main alternatives. Compared withWEO-2010, gas demand forpower generation is higher because of decisions in someOECD countries in 2011, notably inGermany, to reduce or rule out the role of nuclear power in their energy mix. Consumptionof natural gas in the European Union increases by an average of 0.8% per year from
© O
EC
D/IE
A, 2
011

160 World Energy Outlook 2011 - GLOBAL ENERGY TRENDS
2009 to 2035 in the New Policies Scenario and reaches 630 bcm in 2035, 30 bcmhigher thanthe corresponding figure for 2035 inWEO-2010.
Figure 4.3 " Incremental primary natural gas demand by region and sectorin the New Policies Scenario, 2009-2035
0 50 100 150 200 250 300 350 400 450
OECDAsia OceaniaAfrica
Labn AmericaIndia
OECD EuropeOECDAmericas
Other AsiaE. Europe/Eurasia
Middle EastChina
bcm
Power generabon
Other energysector
Industry
Buildings
Other*
*Includes agriculture, transport and non-energy use.
The largest share of global gas demand comes from the power sector, where gas usefor electricity generation rises to more than 1.9 tcm by 2035, at an annual rate of 1.8%(Figure 4.4). The share of gas in global electricity generation increases slightly from 21%today to 22% in 2035, while the share of coal declines from 40% in 2009 to 33% in 2035 andthe share of oil falls from 5% to 1% over the same period. After power generation, the nextlargest consumption of gas in 2035 is in buildings, primarily for space and water heating;70% of gas demand in the buildings sector currently comes from OECD countries. Globalconsumption of gas in buildings growsmore slowly over the projection period than in othermajor end-use sectors. Demand growth is quicker in industry, where gas is used mainly forthe production of steam for mechanical energy and supplying the heat needed to producematerials and commodities. If available, gas can be an attractive choice for industrialprocesses, since it is easy to handle, more efficient and has fewer adverse environmentalimpacts than other fossil fuels. Gas use in industry grows from 535 bcm in 2009 to 890 bcmin 2035, with petrochemicals, iron and steel, and non-metallic minerals sub-sectors such ascement, taking the largest shares.
At a global level, gas does not currently compete strongly in all markets or in all sectors, butit is making inroads. From a low base, gas use in road transportation is projected to increasemore quickly than in any other sector, at an average rate of 5.3% per year in theNewPoliciesScenario. This is at present a relatively under-developed market for natural gas: more than70% of the world stock of natural gas vehicles is in only five countries: Pakistan, Argentina,Iran, Brazil and India. Although natural gas in transportation typically brings considerablefuel-cost savings and emissions reductions, greater use has usually been held back by thelimited availability of refuelling infrastructure. We project natural gas consumption in roadtransportation will quadruple to more than 80 bcm by 2035; even so, this is still only 3% ofthe total energy used for road transportation.
© O
EC
D/IE
A, 2
011

Chapter 4 - Natural gas market outlook 161
4
Figure 4.4 " Primary natural gas demand by sector in the New PoliciesScenario, 2009 and 2035
1 216
326535
85
741
173
20093 076 bcm
1 925
500890
160
1 030
245
20354 750 bcm
Electricity and heat
Other energy sector
Industry
Transport
Buildings
Other*
*Includes agriculture and non-energy use.
Supply
Resources and reserves
The world’s remaining resources of natural gas can comfortably meet the projections ofglobal demand growth in this Outlook to 2035 and well beyond. This conclusion has beenreinforced over the last few years as our understanding of the recoverable resource basehas expanded, particularly of the size of unconventional gas resources – from coal beds(coalbedmethane), low-permeability reservoirs (tight gas) and shale formations (shale gas).2Conventional recoverable resources of just over 400 tcm are equal to around 120 yearsof production at 2010 levels; adding unconventional recoverable resources (which are ofsimilar size) brings this figure to nearly 250 years (Figure 4.5).
The fact that unconventional resources are more widely dispersed than conventionalresources has implications for gas security since all major regions now have totalrecoverable gas resources equal to at least 75 years of current consumption. This doesnot mean that gas is readily available in each region; resources require substantialinvestment – sometimes over decades – before they can be produced and marketed.But it does imply that countries and regions have the option, if they so wish, to developalternative, more diversified sources of gas supply; our analysis (IEA, 2011) suggests thatplentiful volumes of unconventional gas can be produced at costs similar to those ofNorth America (between $3 per million British thermal units [MBtu] and $7/MBtu). It isworth comparing the outlook for gas with that for oil where, even with growing output ofunconventional oil, the trend is towards greater reliance on a small number of producers,with oil delivered tomarkets along a limited number of potentially vulnerable supply routes(see Chapter 3).
2. For example, the recent assessment of worldwide shale gas resources from the US Energy Informa"on Administra"on(US DOE/EIA, 2011).
© O
EC
D/IE
A, 2
011

162 World Energy Outlook 2011 - GLOBAL ENERGY TRENDS
Proven gas reserves of 190 tcm are estimated based on operators’ public filings orgovernment records, and are only a relatively small proportion of the total resources(Cedigaz, 2010). Most of the proven reserves are conventional. Unconventional provenreserves account for a significant share of the total only in the United States and Canada.Overall, 130 tcmout of the total proven reserves, a 70% share, are in Eastern Europe/Eurasia(mainly Russia) and the Middle East (Iran and Qatar); however, these regions account for amuch smaller share (46%) of the total estimated recoverable resources.
Figure 4.5 " Recoverable gas resources and production by region and type,end-2010
0 50 100 150 200 250
-200 0 200 400 600 800 1 000
Years
tcm
World
OECD Europe
Labn America
Africa
Asia Pacific
OECD Americas
Middle East
E. Europe/Eurasia
0 150 300 450 600 750
-50 0 50 100 150 200 250
Years
tcm
Regional resource toconsumpbon rabo(top axis)
Cumulabveproducbon
Proven reserves
Other convenbonalrecoverableresources
Potenbalunconvenbonalrecoverable resources
Notes: Cumulative production to date is shown as a negative number, so that the total of the bars to the right indicatesremaining recoverable resources. Russian reserves are discussed in detail in Chapter 8.Sources: Cedigaz (2010); USGS (2000 and 2008); BGR (2010); US DOE/EIA (2011); IEA estimates and analysis.
Production prospects
Gas production of between 3.9 tcm and 5.1 tcm is required to meet projected levels ofconsumption in 2035, depending on the scenario (Table 4.3). Gas prices are the mainmechanism bringing demand and supply into balance. Higher prices in the Current PoliciesScenario stimulate the production necessary to meet demand; on the other hand, lowerprices in the 450 Scenario, brought about by far-reaching policy measures that weakendemand, result in lower investment and, consequently, lower output (see discussion of retailand end-user fuel prices in Chapter 1). In all scenarios, most of the increase in output comesfrom countries outside the OECD.
© O
EC
D/IE
A, 2
011

Chapter 4 - Natural gas market outlook 163
4
Table 4.3 " Primary natural gas production by region, type and scenario (bcm)
New PoliciesScenario
Current PoliciesScenario
450Scenario
1980 2009 2020 2035 2020 2035 2020 2035
OECD 890 1 145 1 223 1 296 1 221 1 308 1 161 1 157
Non-OECD 639 1 906 2 666 3 454 2 708 3 780 2 504 2 719
World 1 528 3 051 3 888 4 750 3 929 5 087 3 665 3 876
% unconventional 0% 13% 15% 22% n.a. n.a. n.a. n.a.
Notes: Definitions and reporting of tight gas vary across countries and regions, so the split between conventional andunconventional gas production is approximate (and reported only for the New Policies Scenario). Differences betweenhistorical supply and demand volumes are due to changes in stocks.
Conventional gas will still account for the bulk of global gas production in 2035, but theshare of unconventional gas rises from 13% in 2009 to 22% in 2035 and it provides 39% ofincremental production over this period in the New Policies Scenario. Most of the increasein unconventional output in this scenario comes from shale gas and from coalbed methane,both ofwhich reach a 9% share of global production in 2035. Tight gas has a lower share (4%).
Mergers, acquisitions and partnerships, reflecting confidence in the potential forunconventional output growth outside North America, are spreading expertise in itsproduction. However, production projections are subject to a large degree of uncertainty,particularly in regions where little or no such production has been undertaken to date. Evenwhere production is already taking place, environmental concerns could hold back or reduceoutput (Box 4.1). A range of factors needs to be positively aligned before unconventionalproduction canmake headway, including suitable geology, public acceptance, well-adaptedregulatory and fiscal regimes and widespread access to experience and technology. Fora relatively new industry, this points to a future in which the pace of unconventionaldevelopment will vary considerably by country and by region.
Sources of incremental gas production in OECD Europe are increased conventional gasoutput fromNorway and, later in theOutlook period, some unconventional gas production,most likely led by Poland. However, production from these sources is not enough to offsetdeclines elsewhere so the overall output trend is down; production falls from nearly300 bcm in 2009 to just above 200 bcm in 2035. The figures for the EuropeanUnion (withoutNorway) are evenmore striking, with gas production declining from the 2009 level of nearly200 bcm to less than 90 bcm in 2035, a 55% drop.
The share of unconventional gas production in North America is projected to increase steadily.It was already 56% in 2009 and rises to 64% in 2035, meaning that, in this market at least, itshould no longer be strictly considered as “unconventional”. After briefly overtaking Russia asthe world’s largest gas producer, the United States returns to being the second-largest globalgas producer, a position that it retains throughout the projection period. Among other OECDproducers, Australia increases gas output substantially, from47 bcm in 2009 to almost 160 bcmin 2035, production being both conventional and unconventional (mainly coalbedmethane).
© O
EC
D/IE
A, 2
011

164 World Energy Outlook 2011 - GLOBAL ENERGY TRENDS
Box 4.1 " Environmental impact of unconventional gas
Although used as a production enhancement technique for many years, the rapidexpansion of hydraulic fracturing to produce unconventional gas in the United Stateshas put a spotlight on the environmental impact of shale gas production. Hydraulicfracturing involves pumping large volumes of water, mixed with sand and chemicals,into shale formations. Fracturing the rock is essential to stimulate the flow of gas intoshale gas wells. The total volume of water injected ranges from 7 500 to 20 000 cubicmetres per well. Given that each shale gas development requires drilling a largenumber of wells, concerns have been raised about the availability of water forhydraulic fracturing and the possible contamination of freshwater aquifers. Questionshave also been raised about the level of greenhouse-gas emissions from shale gasproduction, compared with conventional production.
Best practice for shale gas production, backed up by effective regulation and monitoring,canmitigate theenvironmental risks, reducing thepotential effects toa level similar to thatfor conventional gas production. The most important measures ensure that the well andthe shale formation itself remain hydraulically isolated from other geological formations,especially freshwater aquifers. There is also the need to minimise water use, including byrecycling it, and to ensure appropriate treatment anddisposal of thewater that is used.
Combustion is the main source of greenhouse-gas emissions from gas and combustionof shale gas is no different from combustion of natural gas from any other source.Nonetheless, shale gas produced to proper environmental standards has slightly higherwell-to-burner emissions than conventional gas. The main incremental source ofemissions is from the gas released during the process of completing wells, when somegas returns to the surface, together with the fracturing fluids. Depending on how theseadditional volumes are treated, whether they are vented or flared, the result overall iswell-to-burner emissions for shale gas that are 3.5% to 12% higher than the equivalentfor conventional gas (IEA, 2011). Inmost cases it is possible, using specialised equipment,to capture, treat and market the gas produced during the completion phase. Doing sobrings overall emissions even closer to the levels of conventional gas production; whileentailing a slight increase in costs, it alsomakes additional gas available for sale.
Gas production in Eastern Europe/Eurasia, from Russia and the Caspian countries, is greater thanin any otherWEO region over the period to 2035 (Table 4.4). The prospects for Russian gas, withoutput increasing from 570 bcm in 2009 to almost 860 bcm in 2035, are discussed in detail inChapter8.ThedevelopmentofCaspianresources isheldbackbythelongdistancetomarketandanuncertain investmentclimate insomecountries. Turkmenistan isexpectedtocontinue its recoveryfrom the collapse in its gas production in 2009, the rise in Turkmenistan output being driven bythe super-giant South Yolotan field,which becomes themain source for export to China along theexpandedCentralAsiaGasPipeline.Azerbaijan’s gasproduction isprojected to rise toover55bcmin 2035,more than three times current output, as incentives for upstreamdevelopment improvewith theanticipatedopeningof a southerngas corridor toEuropeanmarkets.
© O
EC
D/IE
A, 2
011

Chapter 4 - Natural gas market outlook 165
4
Table 4.4 " Primary natural gas production by region in the New PoliciesScenario (bcm)
1980 2009 2015 2020 2025 2030 2035 2009-2035*
OECD 890 1 148 1 181 1 227 1 242 1 275 1 297 0.5%
Americas 658 796 814 840 865 905 932 0.6%
Canada 78 164 161 176 178 172 172 0.2%
Mexico 25 48 45 46 51 59 60 0.9%
United States 554 583 606 616 633 669 696 0.7%
Europe 219 294 279 259 240 222 204 -1.4%
Netherlands 96 79 83 67 54 41 28 -3.8%
Norway 26 106 109 117 122 124 120 0.5%
United Kingdom 37 62 37 27 17 12 10 -6.9%
Asia Oceania 12 55 84 124 134 146 159 4.2%
Australia 9 47 78 120 131 144 158 4.8%
Non-OECD 639 1 903 2 384 2 661 2 921 3 197 3 452 2.3%
E. Europe/Eurasia 485 753 909 957 1 069 1 138 1 197 1.8%
Russia n.a. 572 679 692 779 822 858 1.6%
Turkmenistan n.a. 38 71 89 98 109 120 4.5%
Azerbaijan n.a. 16 22 39 48 55 56 4.8%
Asia 59 393 502 581 642 708 773 2.6%
China 14 85 135 176 212 252 290 4.8%
India 2 46 63 78 91 105 120 3.7%
Indonesia 17 77 95 102 106 112 119 1.7%
Malaysia 2 60 69 71 72 73 74 0.8%
Middle East 38 412 527 580 614 701 773 2.5%
Qatar 3 89 160 174 180 205 219 3.5%
Iran 4 137 137 151 165 195 225 1.9%
Iraq 1 1 9 28 41 57 70 17.1%
Saudi Arabia 11 75 89 95 97 108 116 1.7%
UAE 8 49 50 52 52 56 60 0.8%
Africa 22 196 260 320 361 399 442 3.2%
Algeria 13 78 107 134 147 160 171 3.1%
Nigeria 2 23 40 56 75 91 110 6.2%
Libya 5 16 15 20 25 35 49 4.4%
Latin America 35 152 190 228 238 253 269 2.2%
Brazil 1 12 24 55 73 88 99 8.5%
Venezuela 15 22 25 31 40 56 73 4.8%
Argentina 10 44 48 54 52 45 41 -0.3%
World 1 528 3 051 3 565 3 888 4 164 4 473 4 750 1.7%
European Union n.a. 196 174 145 122 103 89 -3.0%
*Compound average annual growth rate.
© O
EC
D/IE
A, 2
011

166 World Energy Outlook 2011 - GLOBAL ENERGY TRENDS
In Asia, themost significant development is the emergence of China as amajor gas producer(even though it continues to rely on imports to meet domestic demand) as nationalcompanies step up their efforts to increase output (Figure 4.6). China’s gas production risesfrom 85 bcm in 2009 to 290 bcm in 2035. The bulk of this increase is expected to come fromtight gas deposits, coalbed methane and shale gas (China’s first licensing round for shalegas acreage took place in mid-2011.) Domestic production in India is estimated at morethan 50 bcm in 2010 and output is projected to rise to 120 bcm in 2035. As in China, thereis increased interest in unconventional gas: a fifth coalbed methane licensing round and ashale gas licensing round are scheduled for 2012.
Figure 4.6 " Change in annual natural gas production in selected countriesin the New Policies Scenario
-100 -50 0 50 100 150 200 250 300
United KingdomNetherlands
Trinidad and TobagoThailand
United Arab EmiratesMalaysia
KazakhstanLibya
AzerbaijanSaudi ArabiaVenezuela
IraqIndia
TurkmenistanNigeriaBrazilIran
AlgeriaAustralia
United StatesQatarChinaRussia
bcm
2009-2020
2020-2035
Gas production in theMiddle East expands rapidly, rising at an average rate of 2.5% per yearthroughout the projection period, to more than 770 bcm in 2035. The initial boost comesfrom Qatar, as newly built liquefied natural gas (LNG) plants increase their throughput andthe Pearl GTL project ramps up. Production jumps from about 90 bcm in 2009 tomore than160 bcm in 2015, but then rises more slowly, under the influence of the moratorium onnew development projects which has been put in place pending the outcome of a studyof the effects of current projects on the world’s largest gas field, the North Field. Sizeable
© O
EC
D/IE
A, 2
011

Chapter 4 - Natural gas market outlook 167
4
production growth in Iran is likely only after 2020, as short-term prospects are held backby international sanctions that limit investment and technology transfer. The resourcebase in Iraq could support a substantial rise in gas output, but average annual increases of17% come from a very low base. Rising production costs and generally low domestic pricepresent a challenge to many countries across the region, particularly as gas starts to beproduced from gas condensate fields rather than produced as low-cost gas together with oilproduction (associated gas).
The outlook for North African producers has been affected by the political upheavals in theregion in 2011 but, even before this, there were signs of difficulty inmaintaining productionin some countries, notably Egypt, at the pace necessary to satisfy domestic demand andexport commitments. We project that output from Egypt will peak around 2020, beforefalling back to slightly less than 60 bcm in 2035. Projections for Libya in the period to2015 have been cut back substantially, compared toWEO-2010, as a result of the conflict.Elsewhere, Algeria remains the continent’s largest producer, with output expected to rise tomore than 170 bcm in 2035. But, overall, we expect the traditional predominance of NorthAfrican producers to be challenged by a number of sub-Saharan developments, with Nigeriaand Angola leading the increases in output. Production for the African continent as a wholerises to over 440 bcm in 2035, a 9% share of global supply. In Latin America, production ofconventional gas continues to predominate. The main source of supply growth is Brazil,where development of the pre-salt fields is expected to boost production from 12 bcm in2009 to 100 bcm in 2035. Brazil overtakes Argentina as the region’s largest producer andbecomes a net gas exporter before 2025.
Inter-regional tradeThe volume of gas traded internationally (between WEO regions) is set to increase, withboth pipeline gas and LNG playing important roles. The main growth in pipeline supplyoccurs in Eurasia, with the expansion of Russian and Caspian capacity for export, both toEurope and to China. LNG trade has expanded at an unprecedented rate in recent years,with global liquefaction capacity inmid-2011 estimated at 370 bcm, comparedwith 250 bcmin 2007. The pace of capacity additions is slowing down, but LNG still accounts for 42%of theprojected growth in inter-regional gas trade during the period to 2035.
Rising exports from Russia, supplemented by increasing trade out of the Caspian region,mean that Eastern Europe/Eurasia strengthens its position as the largest net exportingregion (Figure 4.7). An important shift over the projection period – and a major driver forproduction increases in this region – is that Russian and Caspian resources start to meet amuch larger share of China’s growing import needs, as well as supplying traditional marketsin Europe (see Chapter 9). Overall, China accounts for 35% of the total growth in inter-regional trade, as its import requirement grows from less than 10 bcm in 2009 to 125 bcmin 2020 and over 210 bcm in 2035. China becomes the second-largest import market in theworld after Europe. China’s imports come from a variety of sources, by pipeline fromCentralAsia, Russia and also fromMyanmar, and as LNG from a suite of global suppliers.
© O
EC
D/IE
A, 2
011

168 World Energy Outlook 2011 - GLOBAL ENERGY TRENDS
Figure 4.7 " Net gas trade by major region in the New Policies Scenario(bcm)
-500 -400 -300 -200 -100 0 100 200 300 400bcm
2035
2009
Importers Exporters
E. Europe/Eurasia
Africa
Middle East
OECD Oceania
Labn America
OECD Americas
India
OECD Asia
ChinaOECD Europe
Australia (included in OECD Oceania) becomes a major gas exporter over the projectionperiod, with net exports increasing from 14 bcm in 2009 to 85 bcm in 2020 and 115 bcmin 2035. Six major LNG export projects are underway, including the giant Gorgon projectin Western Australia and three projects in Queensland that are the first in the world tobe based on coalbed methane. Based on currently operating and sanctioned projects,Australian LNG export capacity could exceed 70 bcm soon after 2015, making it the second-largest global LNG exporter after Qatar.
Even though gas consumption in the Middle East grows rapidly, gas production growthexceeds domestic demand, meaning that the region, led by Qatar, bolsters its standing asa major supplier to global markets. Likewise, net exports from Africa increase rapidly, fromjust below 100 bcm in 2009 to 280 bcm in 2035, through amixture of pipeline gas (primarilyfrom North Africa) and LNG. Latin America remains a marginal net exporter.
Europe’s requirement for gas imports has increased, compared with last year’s Outlook,because of the higher projection for natural gas consumption. OECD Europe is projectedto import 470 bcm of gas in 2035, almost double the 2009 figure, and the requirement forthe European Union rises to 450 bcm in 2020 and 540 bcm in 2035 (86% of total EU gasconsumption), up from 310 bcm in 2009. However, the expectation, from a few years ago,that North America would also be a major importer of LNG, has been turned on its headby the increase in regional production of unconventional gas. This means that the NorthAmerican market does not need to depend on inter-regional imports and has even led toLNG export projects (from North America) moving forward. Our projections suggest thatsupply and demand of natural gas in North America will be roughly equal over the comingdecades (Box 4.2).
The spectre of a gas-supply glut which loomed over the gas market for the past threeyears has been considerably dissipated with the recovery of demand in 2010. The
© O
EC
D/IE
A, 2
011

Chapter 4 - Natural gas market outlook 169
4
projections of the New Policies Scenario suggest that the rate of utilisation of inter-regional transportation capacity will be back to pre-crisis levels before 2015.3 Themarket is tightening first in the Asia-Pacific region (notably in China and Japan) and theeffects could be quickly transmitted to the European market as competition increasesfor available LNG.
Box 4.2 " North America: net gas importer or exporter?
Gas production and demand in North America are currently both some 800 bcm peryear. Both are projected to increase to above 900 bcm in 2035. The net trade position,therefore, depends on the balance between two very large numbers. Small shifts oneither the supply or the demand side could quickly have relatively large implicationsfor imports into the region or exports from it.In all threeOutlook scenarios, the North Americanmarket remains broadly in balancethroughout the period to 2035 (with the region as a whole a marginal net importer).One of the reasons this balance is maintained is that unconventional supply in theUnited States is expected to becomemore responsive to fluctuations in demand, thushelping tomaintain a regional equilibrium.Moreover, while higher prevailing prices inAsia and Europe create incentives for export, theremay be competitive optionswithinNorth America, for example, to supply natural gas vehicles or GTL projects. Some LNGexport projects are expected to go ahead – for example, the involvement of Asiancompanies, such as KOGAS, in Canadian gas production could lead to trans-Pacific LNGtrade – but our projections do not suggest that North Americawill assume amajor rolein global gas trade.
InvestmentProjected trends in gas demand and supply call for total cumulative investment of around$9.5 trillion (in year-2010 dollars) in supply infrastructure in the New Policies Scenario forthe period 2011 to 2035 (Figure 4.8). Output from currently producing conventional gasfields declines to 1.1 tcm in 2035, supplying less than a third of projected conventionaloutput in 2035. The gross upstream investment requirement for conventional gasproduction capacity over the projection period is $5 trillion, around three-quarters ofwhich arises in non-OECD countries. Investment needs for unconventional gas productioncome to $1.8 trillion, but here the regional split is reversed, with three-quarters of thissum being spent within the OECD. Total investment in LNG supply infrastructure overthe projection period is estimated at $590 billion, and a further $2.1 trillion is neededfor pipeline transmission and distribution systems. A detailed discussion of oil and gasinvestment and costs is included in Chapter 3.
3. Some of the incremental pipeline capacity being built to serve the European market is designed to subs"tute for,rather than supplement, exis"ng routes to market (and, therefore, is not an indicator of excess supply capacity).
© O
EC
D/IE
A, 2
011

170 World Energy Outlook 2011 - GLOBAL ENERGY TRENDS
Figure 4.8 " Cumulative investment in natural gas supply infrastructure byregion and activity in the New Policies Scenario, 2011-2035
0
1 000
2 000
3 000
4 000
5 000
6 000
OECD Non-OECD
Billiond
ollars(2010) Transmission and distribubon
LNG
Upstream - unconvenbonal
Upstream - convenbonal
Note: The estimated $80 billion of investment needed worldwide in LNG carriers is not included.
Are we entering a Golden Age of Gas?
TheWEO special report “Are We Entering a Golden Age of Gas?”, released in June 2011,examined the proposition that natural gas might play a significantly greater role in thefuture global energy mix. It did this on the basis of a Golden Age of Gas Scenario (GASScenario) which incorporated plausible but deliberately favourable assumptions aboutpolicy, prices and other drivers that positively affect gas demand and supply projections.This section briefly re-caps the main assumptions and findings of this special report andcompares the projections of the GAS Scenario with those of the New Policies Scenario inthis Outlook.
The starting point for the GAS Scenario was the New Policies Scenario from WEO-2010.4Four major new assumptions were adopted:
! Amore ambitious policy for gas use in China, driven principally by the policy of expandinggas use included in China’s 12th Five-Year Plan. China’s gas demand in this scenario is alsoinfluenced by the assumption of lower gas prices (making gas more competitive versuscoal) and of slower growth in nuclear power capacity.
In the WEO-2011 New Policies Scenario, we recognise the impact of the 12th Five-YearPlan but adopt a slightly more cautious view of China’s gas demand growth, whichaverages 6.7% per year over the period 2009 to 2035, as opposed to 7.6% in the GASScenario (Figure 4.9).
! Changing supply and demand fundamentals, the GAS Scenario incorporates a moreoptimistic assumption about future gas supply – primarily as a result of the availability
4. The GAS Scenario adopted the same assump"ons for popula"on and economic growth as the scenarios inWEO-2010.However, these have subsequently been updated for the projec"ons in this year’s Outlook (see Chapter 1).
© O
EC
D/IE
A, 2
011

Chapter 4 - Natural gas market outlook 171
4
of additional unconventional gas supplies at relatively low cost – and, accordingly, lowerprice assumptions. Prices are assumed to be $1.5/MBtu to $2.5/MBtu lower than in theWEO-2010 New Policies Scenario and around $1/MBtu to $1.5/MBtu lower than in theWEO-2011 New Policies Scenario.5 The effect of lower gas prices, both in absolute termsand also relative to other fuels, is to increase gas demand across the board.
The WEO-2011 New Policies Scenario sees unconventional gas supply rising to over1.05 tcm in 2035, 22% of total gas production. In the GAS Scenario this supply rises to1.2 tcm in 2035, or 24% of total output.
! Greater use of natural gas for transportation: the GAS Scenario assumes thatgovernments in some countries act vigorously to encourage greater introduction ofnatural gas vehicles (NGVs); penetration of NGVs is also encouraged by a favourableprice differential between natural gas and oil. As a result, the GAS Scenario projects thatthere will be over 70 million NGVs by 2035 (up from 12 million currently) and that theshare of natural gas in the fuel mix for road transportation rises from the current 1% to5% in 2035.
In theWEO-2011 New Policies Scenario, the rise in the number of NGVs is less dramatic,reaching only around 35 million vehicles by 2035, with the share of natural gas in roadtransportation rising to around 3% at the end of the projection period. This is the mainreason for the lower average annual increase in gas use in the transportation sector inWEO-2011, at 2.5%, than the 3.6% seen in the GAS Scenario (Figure 4.9).
! Slower growth of nuclear power capacity: in the aftermath of Fukushima, the GASScenario assumes that the licenses of fewer existing plants are extended and fewer newplants are built, compared with theWEO-2010 baseline. As a result, the share of nuclearpower in primary energy demand rises (from 6% today to 7% in 2035), but more slowlythan had previously been projected.
In theWEO-2011 New Policies Scenario, we assume a less significant constraint on thegrowth in nuclear capacity. Whereas the GAS Scenario (developed in early 2011) limitedworldwide nuclear generation capacity to a total of 610 GW in 2035, the New PoliciesScenario in this year’s Outlook sees nuclear capacity expanding to over 630 GW (seeChapter 12 for a discussion of the implications of lower nuclear capacity growth).
Taken overall, gas demand growth in the GAS Scenario is 2% per year for 2009 to2035, compared with 1.7% in theWEO-2011 New Policies Scenario. Despite the variationsarising from different underlying assumptions, the results of our WEO-2011 New PoliciesScenario reinforce the main conclusion of the GAS Scenario – that fundamental factorson both the supply and demand side point to an increased share of gas in the globalenergy mix. Natural gas resources are abundant, well spread across all regions and recent
5. Despite the observed trend of increasing globalisa"on of natural gas, we assume in both the GAS scenario and inWEO-2011 that the gas price differen"als between the United States, Europe and Japan remain broadly constant. Themagnitude of the differences is similar to the costs of transporta"on between the regions.
© O
EC
D/IE
A, 2
011
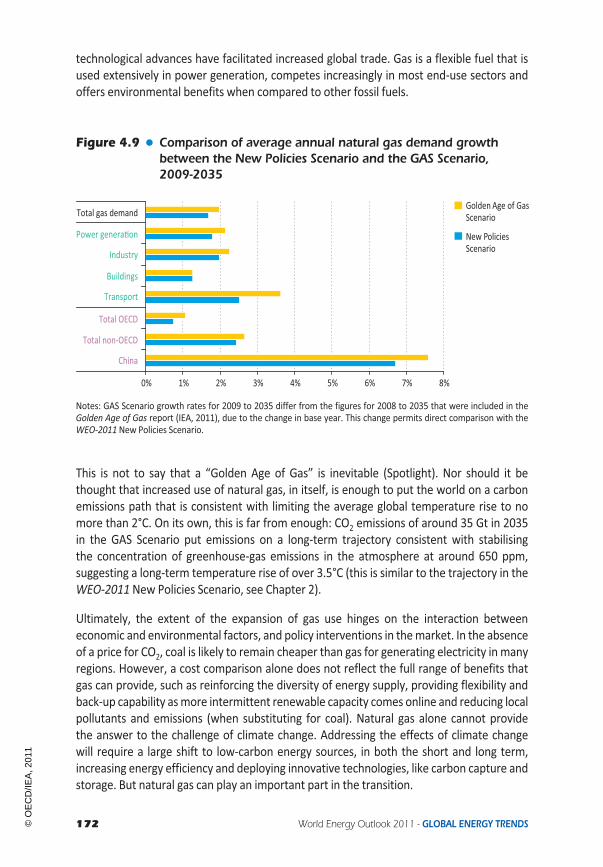
172 World Energy Outlook 2011 - GLOBAL ENERGY TRENDS
technological advances have facilitated increased global trade. Gas is a flexible fuel that isused extensively in power generation, competes increasingly in most end-use sectors andoffers environmental benefits when compared to other fossil fuels.
Figure 4.9 " Comparison of average annual natural gas demand growthbetween the New Policies Scenario and the GAS Scenario,2009-2035
0% 1% 2% 3% 4% 5% 6% 7% 8%
Golden Age of GasScenario
New PoliciesScenario
Buildings
Transport
Industry
Power generabon
Total OECD
Total non-OECD
China
Total gas demand
Notes: GAS Scenario growth rates for 2009 to 2035 differ from the figures for 2008 to 2035 that were included in theGolden Age of Gas report (IEA, 2011), due to the change in base year. This change permits direct comparison with theWEO-2011New Policies Scenario.
This is not to say that a “Golden Age of Gas” is inevitable (Spotlight). Nor should it bethought that increased use of natural gas, in itself, is enough to put the world on a carbonemissions path that is consistent with limiting the average global temperature rise to nomore than 2°C. On its own, this is far from enough: CO2 emissions of around 35 Gt in 2035in the GAS Scenario put emissions on a long-term trajectory consistent with stabilisingthe concentration of greenhouse-gas emissions in the atmosphere at around 650 ppm,suggesting a long-term temperature rise of over 3.5°C (this is similar to the trajectory in theWEO-2011 New Policies Scenario, see Chapter 2).
Ultimately, the extent of the expansion of gas use hinges on the interaction betweeneconomic and environmental factors, and policy interventions in themarket. In the absenceof a price for CO2, coal is likely to remain cheaper than gas for generating electricity in manyregions. However, a cost comparison alone does not reflect the full range of benefits thatgas can provide, such as reinforcing the diversity of energy supply, providing flexibility andback-up capability asmore intermittent renewable capacity comes online and reducing localpollutants and emissions (when substituting for coal). Natural gas alone cannot providethe answer to the challenge of climate change. Addressing the effects of climate changewill require a large shift to low-carbon energy sources, in both the short and long term,increasing energy efficiency and deploying innovative technologies, like carbon capture andstorage. But natural gas can play an important part in the transition.
© O
EC
D/IE
A, 2
011

Chapter 4 - Natural gas market outlook 173
4
S P O T L I G H T
Do all roads lead to a Golden Age of Gas?
There are powerful arguments in favour of a bright future for natural gas. In all thescenarios examined in this Outlook (including the GAS Scenario released in June2011), natural gas has a higher share of the global energy mix in 2035 than it doestoday. But a golden age of gas could nonetheless be tarnished or cut short by policydecisions or by technological or other developments that reduce the attractivenessof gas relative to other energy sources. While some of these are unlikely orunforeseeable, it is nonetheless worth considering circumstances in which the rise ofnatural gas might be held back.A first consideration is that much of the momentum behind the rapid growth ofnatural gas comes from supportive government policies in non-OECD countries. InChina, India and other countries, governments are targeting an increased role fornatural gas and are intervening in the market in order to promote the infrastructureand end-uses that will allow this to happen. But if market economics became anabsolute priority in choosing the fuel and technology for deployment in powergeneration in China, for example, gas would have little impact on the power mix,except in regions where transport costs raise coal prices considerably (IEA, 2011).This could, in theory, lead to a reversal or weakening of support for natural gas,leaving it as a niche fuel, rather than a mainstream contributor to non-OECD energydemand growth.From another angle, a dramatic reduction in the cost of a major renewabletechnology could have a large impact, as could a significant improvement in theefficiency of carbon capture and storage – although this would have to be somehowweighted in favour of CO2 capture from coal-fired combustion if it were to tip thescales against natural gas. The role of gas as a back-up to variable renewables wouldbe affected if cost-effective electricity storage were to be developed.On the supply side, there is already public and political concern about theenvironmental impact of unconventional gas; if not adequately addressed throughthe adoption of best practices in gas production, these concerns could become amajor constraint in some countries on the expansion of gas output. Inmarkets wherealternative supplies are limited, further experience of disruptions to deliveries froman established supplier – as happened in Europe in 2006 and 2009 during the Russia-Ukraine disputes – can quickly raise concerns about gas security that could, in turn,lead to action to temper increased reliance on natural gas consumption.A setback to a golden age of gas could also come from concerted policy action on CO2emissions and efficiency, particularly if deployment of carbon capture and storageis delayed. This could make a reality of the trend that is visible in the 450 Scenario,where gas consumption flattens towards 2030 and then starts a gradual decline.
© O
EC
D/IE
A, 2
011

© O
EC
D/IE
A, 2
011

Chapter 5 - Power and renewables outlook 175
CHAPTER 5
H I G H L I G H T S
POWER AND RENEWABLES OUTLOOK
Electrifying solutions?
! World electricity demand in the New Policies Scenario is projected to increase from17 200 TWh in 2009 to over 31 700 TWh in 2035, an annual growth rate of 2.4%,driven by economic and population growth. China and India account for over half ofthe increase, with OECD countries making up less than one-fifth. Globally, industryremains the largest consuming sector, followed by the residential and services sectors.
! Over the Outlook period, 5 900 GW of new capacity is added worldwide in the NewPolicies Scenario to meet demand growth and replace retired power plants, at aninvestment cost of nearly $10 trillion (in year-2010 dollars). Renewable energytechnologies account for half of cumulative additional capacity and 60% of theinvestment. Gas and coal each provide one-fifth of new capacity additions. China addsmore coal, gas, nuclear, hydro, biomass,wind, and solar capacity thananyother country.
! From 2009 to 2035, 44% of the increase in electricity generation comes fromrenewables. Mainly driven by government policies, generation from non-hydrorenewables increases from 3% of the total in 2009 to over 15% in 2035. Coal useincreases by almost 50% over the Outlook period, remaining the largest source ofelectricity, but its share of total generation falls by seven percentage points over theOutlook period. Gas and hydro broadly maintain their shares in the generation mix.Despite recent announced policy changes, nuclear also retains its share of globalelectricity generation through 2035, buoyed by expansion in China.
! In the New Policies Scenario, over two-fifths of global investment in the powersector goes to transmission and distribution (T&D), with almost three-quartersof this for distribution networks. Nearly two-thirds of the investment is made innon-OECD countries, to meet growing demand. Two-fifths is to replace ageinginfrastructure currently in use. Reinforcing and expanding T&D networks is necessaryto integratemore renewables-based generation, accounting for just below 10%of thetransmission investment (excluding distribution). Grid integration costs of renewablescan be higher for certain regions such as the European Union, where it is 25% oftransmission investment. In the 450 Scenario, global grid integration costs rise to over18% of total investment in transmission.
! Worldwide CO2 emissions from the power sector in the New Policies Scenario increaseby one-fourth between 2009 and 2035, growing more slowly than demand. This ismainly the result of the increased use of renewables and improved plant efficiency thatreduce the CO2 intensity of the power sector by about 30% over theOutlook period.
© O
EC
D/IE
A, 2
011

176 World Energy Outlook 2011 - GLOBAL ENERGY TRENDS
Electricity demand
Demand for electricity grows steadily in each of the three scenarios presented in this year’sOutlook, continuing the long-term upward trend. In the wake of the economic recession,electricity demand fell by 0.7% in 2009, the first fall since IEA records began in the early 1970s;but it recovered strongly in 2010, growing by 6%. In the New Policies Scenario, globalelectricity demand is projected to grow by more than four-fifths between 2009 and 2035,from 17 200 terawatt-hours (TWh) to over 31 700 TWh, at an annual growth rate of 2.4%(Table 5.1). It doubles in the Current Policies Scenario, and increases by almost two-thirds inthe 450 Scenario. The variation in demand growth across the three scenarios is primarily dueto the extent to which more energy-efficient technologies are adopted in end-use sectors inresponse to changing electricity prices and government measures, and, in the 450 Scenario,to the increased demand from the transport sector, due to the higher penetration of electricvehicles. Differences between scenarios in end-user prices of electricity emerge because ofthe differentmix of fossil-fuel plants, changes in fossil-fuel prices, the impact of carbonpricingin regions where this is introduced, differences in subsidies to renewables and differingassumptions about the phase-out of subsidies over time.Muchof the growth in each scenariooccurs in countries outside theOECD, driven by their faster economic and population growth,expanding access to electricity and rising per-capita consumption.
Table 5.1 ! Electricity demand* by region and scenario (TWh)
New PoliciesScenario
Current PoliciesScenario
450Scenario
1990 2009 2035 2009-2035** 2035 2009-
2035** 2035 2009-2035**
OECD 6 593 9 193 12 005 1.0% 12 554 1.2% 11 343 0.8%Americas 3 255 4 477 5 940 1.1% 6 119 1.2% 5 612 0.9%United States 2 713 3 725 4 787 1.0% 4 898 1.1% 4 505 0.7%
Europe 2 321 3 088 4 028 1.0% 4 244 1.2% 3 802 0.8%Asia Oceania 1 017 1 628 2 037 0.9% 2 191 1.1% 1 930 0.7%Japan 759 950 1 158 0.8% 1 225 1.0% 1 075 0.5%
Non-OECD 3 492 8 024 19 717 3.5% 21 798 3.9% 16 978 2.9%E. Europe/ Eurasia 1 585 1 280 1 934 1.6% 2 238 2.2% 1 742 1.2%Russia 909 791 1 198 1.6% 1 401 2.2% 1 057 1.1%
Asia 1 049 4 796 13 876 4.2% 15 334 4.6% 11 666 3.5%China 559 3 263 9 070 4.0% 10 201 4.5% 7 447 3.2%India 212 632 2 465 5.4% 2 590 5.6% 2 117 4.8%
Middle East 190 600 1 393 3.3% 1 525 3.7% 1 264 2.9%Africa 263 532 1 084 2.8% 1 152 3.0% 1 000 2.5%Latin America 404 816 1 430 2.2% 1 550 2.5% 1 306 1.8%Brazil 211 408 750 2.4% 792 2.6% 675 2.0%
World 10 084 17 217 31 722 2.4% 34 352 2.7% 28 321 1.9%European Union 2 227 2 793 3 530 0.9% 3 716 1.1% 3 351 0.7%
*Electricity demand is calculated as the total gross electricity generated less own use in the production of electricity andtransmission and distribution losses. **Compound average annual growth rate.
© O
EC
D/IE
A, 2
011

Chapter 5 - Power and renewables outlook 177
5
Around 80% of the growth in electricity demand over the projection period occurs innon-OECD countries, with China and India accounting for nearly two-thirds of it. Althoughnon-OECD annual per-capita electricity consumption increases from 1450 kilowatt-hours(kWh) in 2009 to 2 750 kWh in 2035, it remains far below the OECD annual average ofaround 7 500 kWh in 2009. In addition to the lower rates of economic and populationexpansion, slower growth in OECD electricity demand stems from faster energy efficiencyimprovements and conservation, prompted in part by higher fuel prices and the adoption ofmeasures such as carbon pricing.
In the New Policies Scenario, industry remains the largest electricity-consuming sectorthroughout theOutlookperiod, accounting formore thanone-third of total electricity demandthroughout (Figure 5.1). Electricity demand in the residential sector rises by 88% between2009 and 2035, outpacing population growth by a factor of over three as access to electricityincreases and the use of modern electrical appliances expands. Nevertheless, the residentialsector’s share remains fairly stable, at slightly over a quarter, over the period. The servicessector’s electricity consumption also increases steadily, at 2%per year on average throughoutthe Outlook period, though this rate is slower than the 2.5% growth rate in the residentialsector, primarily due to energy efficiency measures in OECD countries and an increase in thedirect use of renewables for heat both in OECD and non-OECD countries. With an averagegrowth rate of 3.6% per year, transport is the fastest-growing sector, as demand from railalmost triples, though transport still accounts for only 2% of total electricity demand in 2035.
Figure 5.1 ! World electricity supply and demand by sector in the NewPolicies Scenario
0
5 000
10 000
15 000
20 000
25 000
30 000
35 000
40 000
2000 2005 2010 2015 2020 2025 2030 2035
TWh Own use
T&D losses
Other
Transport
Services
Residendal
Industry
Electricity supplyGlobal electricity generation is projected to increase by 2.3% per year on average overthe Outlook period in the New Policies Scenario, from 20 000 TWh in 2009 to more than36 000 TWh in 2035 (Table 5.2). It grows at an average rate of 2.6% per year in the CurrentPolicies Scenario and 1.8% per year in the 450 Scenario. Supply grows at a slower rate thandemand, due to the falling shares of own use and transmission and distribution losses.
© O
EC
D/IE
A, 2
011

178 World Energy Outlook 2011 - GLOBAL ENERGY TRENDS
Table 5.2 ! Electricity generation by plant type and scenario (TWh)
New PoliciesScenario
Current PoliciesScenario
450Scenario
1990 2009 2020 2035 2020 2035 2020 2035
OECD 7 629 10 394 11 997 13 304 12 143 13 939 11 743 12 541
Fossil fuels 4 561 6 306 6 649 6 165 6 993 7 713 6 133 3 285
Nuclear 1 729 2 242 2 445 2 779 2 389 2 472 2 495 3 463
Hydro 1 182 1 321 1 476 1 592 1 461 1 547 1 505 1 683
Non-hydrorenewables
157 525 1 427 2 768 1 300 2 208 1 610 4 110
Non-OECD 4 190 9 649 15 884 22 946 16 426 25 429 15 092 19 683
Fossil fuels 2 929 7 139 10 944 14 327 11 764 18 463 9 702 7 481
Nuclear 283 454 1 130 1 879 1 105 1 582 1 246 2 932
Hydro 962 1 931 2 904 3 926 2 793 3 597 3 042 4 369
Non-hydrorenewables
15 125 905 2 814 764 1 787 1 102 4 900
World 11 819 20 043 27 881 36 250 28 569 39 368 26 835 32 224
Fossil fuels 7 490 13 445 17 593 20 492 18 757 26 176 15 835 10 765
Nuclear 2 013 2 697 3 576 4 658 3 495 4 053 3 741 6 396
Hydro 2 144 3 252 4 380 5 518 4 254 5 144 4 547 6 052
Non-hydrorenewables
173 650 2 332 5 582 2 063 3 995 2 712 9 011
In theNewPolicies Scenario, coal remains the largest source of electricity generation globallythroughout the Outlook period, with coal-generated output growing by 48% between 2009and 2035. Nonetheless, its share of generation falls from 41% to 33% (Figure 5.2). Theproportion of electricity produced from oil also drops, from 5% in 2009 to 1.5% in 2035.A marked increase in electricity generation from renewable sources offsets the fall in theshares of coal and oil. The share of generation fromnon-hydro renewables grows from3% in2009 to 15% in 2035, with almost 90%of this increase coming fromwind, biomass, and solarphotovoltaics (PV). Natural gas, hydro and nuclear all maintain relatively constant sharesof electricity generation throughout the period of 22%, about 16% and 13% respectively.In the 450 Scenario, generation from non-hydro renewables rises to 28% of total electricityoutput in 2035, as a result of policies to enhance energy security and to curb greenhouse-gas emissions.
The change in the mix of technologies and fuels used to produce electricity is driven mainlyby their relative costs, which are influenced by government policies. Government targets toreduce greenhouse-gas emissions and local energy-related pollution and, in some countries,the power sector’s dependence on imported fuels have a significant impact on technologychoices. In theNewPolicies Scenario, two types ofmeasure have themost significant impacton the generation mix over time: carbon pricing and subsidies to renewables.
© O
EC
D/IE
A, 2
011

Chapter 5 - Power and renewables outlook 179
5
Figure 5.2 ! Share of world electricity generation by fuel in the NewPolicies Scenario
0% 20% 40% 60% 80% 100%
2035
2020
2009
Coal Gas Oil Nuclear Biomass Hydro Wind Other renewables
20 043 TWh
27 881 TWh
36 250 TWh
Many countries have introduced or are considering the introduction of some form ofcarbon price, typically through an emissions-trading scheme, whereby overall emissionsare capped and the price that must be paid to emit a tonne of carbon dioxide (CO2) is setby the market, or through a fixed-rate carbon tax. The carbon price encourages investmentin technologies that emit less carbon, such as renewables or nuclear (Figure 5.3), andincreases the operating costs of fossil-fuel plants. Both effects increase the cost of electricityto consumers, which lowers overall demand. Carbon pricing increases the absolute costof gas-fired generation, but as the emissions intensity of gas is lower than that of coal andgas combined-cycle gas turbine plants are more efficient than coal plants, the impact ofthe carbon price on the cost of gas-fired generation is approximately half that of coal-firedgeneration. Fossil-fuel plants fitted with carbon capture and storage (CCS) emit significantlyfewer carbon emissions, but the relatively high costs of CCS means that its deploymentremains limited in the New Policies Scenario. The use of CCS is muchmore significant in the450 Scenario (see Chapter 6).
In the NewPolicies Scenario, it is assumed that carbon pricing, explicit or implicit, is adoptedin several OECD countries and in China (see Chapter 1 for details). In the 450 Scenario, theuse of carbon pricing is more widespread (all OECD countries, China, Russia, Brazil andSouth Africa are assumed to adopt it) and prices are higher, resulting in a stronger shift tolow-carbon technologies.
Carbon pricing alone does not account for all the growth in renewable electricity generationover the Outlook period. A large number of governments have adopted additional policies,including subsidies, designed specifically to stimulate investment in renewable energytechnologies. As the cost of renewable energy technologies falls over time, some becomefully competitive during theOutlook period – particularly in regions where there is a carbonprice (see Chapter 14). As is the case for all generation technologies, the economic viabilityof renewable energy technologies is determined not just by the direct costs of generation,
© O
EC
D/IE
A, 2
011

180 World Energy Outlook 2011 - GLOBAL ENERGY TRENDS
but also by the costs of integrating the capacity into the system. These include the associatedgrid infrastructure costs (see implications of increasing renewables-based capacity in thischapter) and the particular contribution of each technology to system adequacy.
Figure 5.3 ! Typical levelised cost by plant type and carbon price* in theOECD in the New Policies Scenario, 2020
0
20
40
60
80
100
120
Coal ultra-supercridcal
GasCCGT
Coal oxyfuelwith CCS
Nuclear Windonshore
Dollarspe
rMWh(
2010
)
CO2 price of$30/tonne
Costs withoutCO2 price
CO2 price of$50/tonne
*Levelised cost is cost per unit of electricity generation, taking into account all the costs over the lifetime of the asset,including construction, operation andmaintenance, fuel inputs and the cost of capital. In the New Policies Scenario, CO2prices range from zero to $30/tonne.
Coal
Electricity output from coal-fired plants worldwide increases from just over 8 100 TWh in2009 to around 12 000 TWh by 2035 in the New Policies Scenario, though the share of coalin total electricity generation falls from 41% to 33%. Strong growth in non-OECD countries,where coal-fired generation doubles, far outweighs the fall in OECD countries (Figure 5.4).The European Union accounts for almost two-thirds of the fall in coal-fired generation inthe OECD, largely as a result of the impact of the European Union Emissions Trading Systemon the competitiveness of coal relative to other technologies. In the United States, whereonly a shadow carbon price is assumed in the New Policies Scenario, the use of coal remainscomparatively stable, declining by 3% between 2009 and 2035. The biggest growth in coalgeneration in a single country is in China, but the share of coal in total generation there fallsover time. Government targets to reduce local pollution and to increase the deployment ofother generation technologies, such as nuclear and wind, reduce the share of coal in Chinafrom 79% in 2009 to 65% in 2020. The continuation of these trends further reduces theshare of coal to 56% in 2035. In India, coal use is projected to almost triple over the forecastperiod, eventually displacing the United States as the world’s second-largest consumer ofcoal for power generation. India’s increased use of coal for power is driven by strong growthof electricity demand, due to rapid population and economic growth, and coal’s strongcompetitive position (see Chapter 10).
© O
EC
D/IE
A, 2
011

Chapter 5 - Power and renewables outlook 181
5
Figure 5.4 ! Incremental global coal-fired electricity generation relativeto 2009 by region in the New Policies Scenario
-1 000
0
1 000
2 000
3 000
4 000
5 000
2015 2020 2025 2030 2035
TWh Other non-OECD
India
China
OECD
In the New Policies Scenario, the mix of coal-fired generation technologies changes overthe Outlook period as older plants are retired and more efficient new plants are built,including ultra-supercritical designs and integrated gasification combined-cycle (IGCC) plants(Figure 5.5).1 Increases in the price of coal, reductions in the capital costs of advanced coaltechnologies and the introduction of carbon prices all contribute to the shift towards higher-efficiency coal plants. As a result, the average global thermal efficiency of coal plants increasesby four percentage points, from38% in 2009 to 42% in 2035. Thesemore efficient technologiesentail higher capital costs than the subcritical and supercritical plant designs that make upmost of the current fleet of coal-fired plants, but they use less fuel and, therefore, emit lessCO2 andother emissions for each unit of electricity they generate. Lower fuel use due to higherefficiency plants also helps tomoderate import dependence for importing countries.
Figure 5.5 ! World coal-fired electricity generation by plant type in the NewPolicies Scenario
0
2 000
4 000
6 000
8 000
10 000
12 000
2009 2015 20252020 2030 2035
TWh Coal-fired CHP
plants
Coal plants fibedwith CCS
Advanced coalplants*
Supercridcal plants
Subcridcal plants
*Advanced coal plants include ultra-supercritical and IGCC plants.
1. See Chapter 10 for a detailed discussion of coal-fired genera"on technologies.
© O
EC
D/IE
A, 2
011

182 World Energy Outlook 2011 - GLOBAL ENERGY TRENDS
The deployment of CCS in coal plants is limited in the New Policies Scenario. The cost ofCCS falls over the Outlook period, but it only becomes competitive with other generationtechnologies towards the end of the period, in those regions that have adopted a carbonprice. In 2035, there are 65 gigawatts (GW) of coal capacity equippedwith CCS, contributingonly 3% of coal-fired generation and 1% of total electricity generation. In the 450 Scenario,in 2035, generation from coal capacity equipped with CCS accounts for 60% of coal-firedgeneration and 9% of total electricity generation (see Chapter 6).
Natural gas
Natural gas-fired power plants continue to play an important role in the electricitygeneration mix in the New Policies Scenario, accounting for a stable 22% of globalgeneration throughout the Outlook period. Gas-fired generation grows from around4 300 TWh in 2009 to a little over 7 900 TWh in 2035. Over three-quarters of theglobal increase in gas-fired generation over the period occurs in non-OECD countries;China and the Middle East account for one-fifth of the global increase each andone-tenth occurs in India (Figure 5.6). There is also significant growth in generation fromgas within the OECD, as further efficiency improvements and carbon pricing enhance thecompetitiveness of gas-fired plants, relative to coal.
Figure 5.6 ! Gas-fired electricity generation in selected countries and regionsin the New Policies Scenario
0
200
400
600
800
1 000
1 200
UnitedStates
MiddleEast
EuropeanUnion
China Russia India Japan
TWh 2009
Incremental generadonin 2035 over 2009
CCGT plants remain the dominant gas-fired generation technology. In the New PoliciesScenario, generation from CCGT plants grows from a little under 2600 TWh in 2009 toalmost 4 900 TWh in 2035, accounting for over 60% of the growth in gas-fired generation.Generation from open-cycle gas turbine (OCGT) plants more than doubles, increasingfrom 370 TWh in 2009 to over 800 TWh. OCGT plants generally operate for relatively fewhours each year, generating at periods of particularly high demand. One of the factors
© O
EC
D/IE
A, 2
011
Chapter 5 - Power and renewables outlook 183
5
driving the growth in this technology is the need for peaking plants, such as these, as thepenetration of variable renewables increases. Given their relatively high costs and thenature of the government policies assumed in the New Policies Scenario, deploymentof CCS in gas-fired plants is limited; such plants provide less than 1% of the electricitygenerated from gas in 2035.
Nuclear power
In the wake of the accident at the Fukushima Daiichi nuclear plant in March 2011, severalgovernments are reviewing their policies towards nuclear power (see Chapter 12).Announced changes in policy are taken into account in all the scenarios presented in thisyear’s Outlook: early retirement of all nuclear plants in Germany by the end of 2022; nolifetime extensions or new plants in Switzerland; decommissioning of units one to fourand no construction of new units at the Fukushima Daiichi site; and delays in capacityadditions in China, due to the temporary suspension there of approval for new projects.Due to increased uncertainty, financing may become more difficult to secure, leadingto increased cost of capital for nuclear projects. Compared to WEO-2010, the expectedconstruction costs of new plants have risen by 5% to 10%. Although the prospectsfor nuclear power in the New Policies Scenario are weaker in some regions than inlast year’s projections, nuclear power continues to play an important role, providingbaseload electricity. Most non-OECD countries and many OECD countries are expectedto press ahead with plans to install additional nuclear power plants, though there may beshort-term delays as the safety standards of existing and new plants are reviewed.Globally, nuclear power capacity is projected to rise in the New Policies Scenario from393 GW in 2009 to 630 GW in 2035,2 around 20 GW lower than projected last year.3Therefore, the share of nuclear in cumulative gross additions is 6% over the Outlookperiod, compared to 7% in WEO-2010. In several OECD countries, capacity is projectedto grow much less than previously expected, but this is partially offset by an increase inprojected non-OECD capacity, which is 8 GW higher than projected last year by 2035,mainly due to improved prospects in China.
In the New Policies Scenario, generation from nuclear power plants worldwideincreases by almost 2000 TWh over the Outlook period, more than the nuclear output inNorth America and OECD Europe combined in 2010. This increase comes predominantlyfrom non-OECD countries, with China alone accounting for over two-fifths of the globalincrease (Figure 5.7). In India, nuclear power generation grows almost ten-fold. In Russia,it grows by two-thirds. About 60% of the nuclear capacity added in the OECD replacesageing nuclear plants that are retired in the Outlook period; in total, capacity increases byonly 16%.
2. Capacity figures for all technologies are provided in gross terms, therefore including own use. For nuclear, thedifference between net and gross capacity figures is generally 5% to 6%.3. Including units 5 and 6 of the Fukushima Daiichi plant and the Fukushima Daini plant, which are not re"red, but arenot being used.
© O
EC
D/IE
A, 2
011

184 World Energy Outlook 2011 - GLOBAL ENERGY TRENDS
Figure 5.7 ! Additions and retirements of nuclear power capacity by regionin the New Policies Scenario
-30
-20
-10
0
10
20
30
40
50
60
70
GW OECD: addidons
OECD: redrements
Other non-OECD:addidons
China: addidons
Non-OECD:redrements
Net capacitychange
2011-2015 2016-2020 2021-2025 2026-2030 2031-2035
Renewables
The use of renewable energy sources to generate electricity expands significantly in all threescenarios. In the New Policies Scenario, renewables-based electricity generation worldwidealmost triples, from 3 900 TWh in 2009 to 11 100 TWh in 2035. This expansion is drivenlargely by government policies, including subsidies (see Chapter 14), and represents 44%of the growth in total electricity generation over the period. The bulk of this growth comesfrom four sources: wind and hydro provide approximately one-third each, biomass accountsfor about one-sixth and solar PV for one-tenth (Figure 5.8).
Figure 5.8 ! Incremental global renewables-based electricity generationrelative to 2009 by technology in the New Policies Scenario
30%
32%
34%
36%
38%
40%
42%
44%
46%
0
1 000
2 000
3 000
4 000
5 000
6 000
7 000
8 000
2015 2020 2025 2030 2035
TWh Other renewables
Solar PV
Biomass and waste
Hydro
Wind
Share of renewablesin total increase ingeneradon (right axis)
In the New Policies Scenario, over three-quarters of the growth in installed wind capacityand 70% of the growth in solar PV capacity occurs in the United States, European Union,China and India (Figure 5.9). Rapid capacity expansion in China has already seen onshorewind electricity generation increases from just 2 TWh in 2005 to 27 TWh by 2009, and itis projected to reach almost 590 TWh by 2035, making China the world’s leading onshore
© O
EC
D/IE
A, 2
011

Chapter 5 - Power and renewables outlook 185
5
wind power producer. Generation from installed onshore wind capacity increases morethan three-fold in the European Union, from 133 TWh in 2009 to 480 TWh in 2035, andmore than five-fold in the United States, from 74 TWh to 390 TWh. A steady improvementin the economics of offshore wind power encourages widespread increases in the installedcapacity of this technology, which contributes one-fourth of total wind power generationby 2035; output increases from less than 1 TWh in 2009 to 670 TWh in 2035, almost levelwith generation from solar PV. As with onshorewind, themajority of the growth in offshorewind generation occurs in China, the European Union and the United States.
Figure 5.9 ! Solar PV and wind power capacity by region in the NewPolicies Scenario
0 20 40 60 80 100 120 140
European UnionOther non-OECD
IndiaChina
United StatesJapan
Other OECD
Solar
PV
GW
0 50 100 150 200 250 300 350
ChinaEuropean Union
United StatesOther non-OECD
IndiaOther OECD
Japan
Wind
GW
2010
Capacity increase2011-2020
Capacity increase2021-2035
Solar PV electricity generation increases substantially over the Outlook period, from20 TWh in 2009 to 740 TWh in 2035 in the New Policies Scenario, growing at an averagerate of 15% per year. The European Union accounted for three-quarters of global solar PVgeneration in 2010. This has been driven by strong government programmes, particularlyin Germany where there has been rapid growth in recent years. Over the early years of theOutlook period, Europe continues to exhibit very strong growth in solar PV but, between2020 and 2035, the increase in solar PV generation in each of China, the United States andIndia is larger than that in the European Union.
Hydropower has already been developed extensively in many OECD countries and thereis limited remaining potential, given the costs and environmental constraints. By contrast,large developments of hydro are expected to take place inmany non-OECD countries. Thesecountries account for 85% of total hydro capacity additions in the New Policies Scenario,with China, India and Brazil making up almost 60% of non-OECD hydro additions. In severalcases, these resources are located far away from load centres and require significantinvestment in transmission lines.
© O
EC
D/IE
A, 2
011

186 World Energy Outlook 2011 - GLOBAL ENERGY TRENDS
Electricity supply frombiomass power plants grows at an average annual rate of 6.5%,whichresults in a five-fold growth in output over the Outlook period, from 288 TWh in 2009 to1 500 TWh in 2035. The bulk of the growth comes from non-OECD countries: the combinedgrowth in demand in China and India is more than one-third of the global total. Othersources of renewable energy – geothermal, concentrating solar power andmarine power –gain a small foothold in the power sector by the end of the Outlook period.
CO2 emissions
In theNewPolicies Scenario, CO2 emissions from thepower sector grow from11.8 gigatonnes(Gt) in 2009 to 14.8 Gt in 2035 – a rise of 25%. Growth in electricity generation is more thanthree times larger than this, reflecting a 30% reduction in the CO2 intensity of the powersector over the Outlook period – the amount of CO2 released into the atmosphere foreach unit of electrical energy produced – from 530 grammes of CO2 per kWh in 2009 to375 grammes in 2035. This reduction arises mainly from the shift away from coal and oil asfuel sources for electricity generation towards lower-carbon nuclear and renewables-basedtechnologies. Efficiency improvements within the coal and gas generation fleets also makea considerable contribution to improving the carbon intensity of the sector, as older lessefficient plants are retired and more efficient plants are installed. The introduction of CCStechnology, though only on a relatively small scale, also contributes to driving down the CO2intensity of the power sector. These factors yield annual emissions savings of around 7.8 Gtby 2035, compared with the emissions that would have been generated for the projectedlevel of electricity generation had there been no change in themix of fuels and technologiesand no change in the efficiency of thermal generating plants (Figure 5.10). The largestshare of these savings comes frommore efficient plants (36% of the cumulative reduction),followed by savings attributed to wind, nuclear and hydro, each of which accounts foraround 15% of the abatement.
Figure 5.10 ! Global CO2 emission savings in power generation relative tothe 2009 fuel mix* in the New Policies Scenario
10
12
14
16
18
20
22
24
2010 2015 2020 2025 2030 2035
Gt More efficient plants
Nuclear
Hydro
Biomass
Wind
Other renewables
CCS
2009 fuel mix*
New Policies Scenario
*The emissions savings compared with the emissions that would have been generated for the projected level ofelectricity generation were there no change in the mix of fuels and technologies, and no change in the efficiency ofthermal generating plants after 2009.
© O
EC
D/IE
A, 2
011
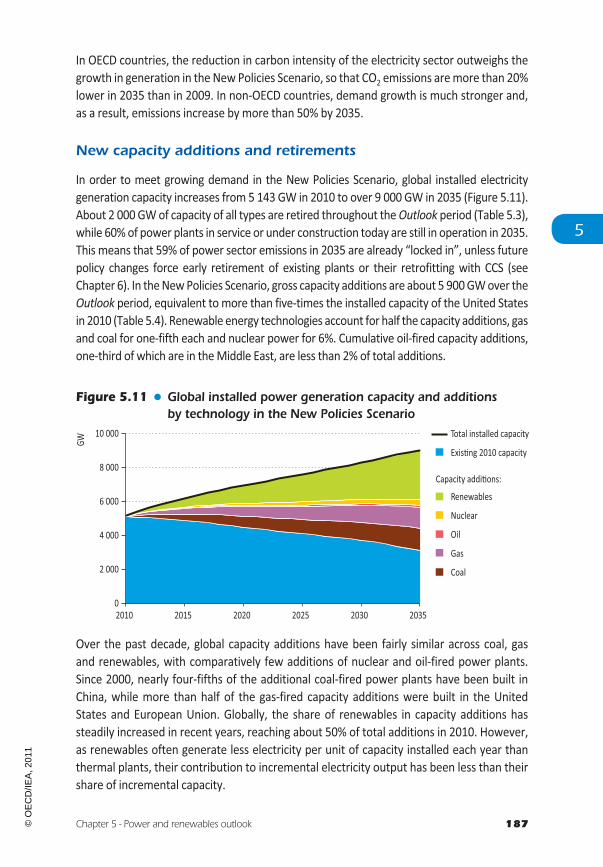
Chapter 5 - Power and renewables outlook 187
5
In OECD countries, the reduction in carbon intensity of the electricity sector outweighs thegrowth in generation in the New Policies Scenario, so that CO2 emissions aremore than 20%lower in 2035 than in 2009. In non-OECD countries, demand growth is much stronger and,as a result, emissions increase by more than 50% by 2035.
New capacity additions and retirements
In order to meet growing demand in the New Policies Scenario, global installed electricitygeneration capacity increases from 5 143 GW in 2010 to over 9 000 GW in 2035 (Figure 5.11).About 2 000GWof capacity of all types are retired throughout theOutlook period (Table 5.3),while 60%of power plants in service or under construction today are still in operation in 2035.This means that 59% of power sector emissions in 2035 are already “locked in”, unless futurepolicy changes force early retirement of existing plants or their retrofitting with CCS (seeChapter 6). In theNewPolicies Scenario, gross capacity additions are about 5 900GWover theOutlook period, equivalent tomore than five-times the installed capacity of the United Statesin 2010 (Table 5.4). Renewable energy technologies account for half the capacity additions, gasand coal for one-fifth each and nuclear power for 6%. Cumulative oil-fired capacity additions,one-third of which are in theMiddle East, are less than 2% of total additions.
Figure 5.11 ! Global installed power generation capacity and additionsby technology in the New Policies Scenario
0
2 000
4 000
6 000
8 000
10 000
2010 2015 2020 2025 2030 2035
GW
Total installed capacity
Exisdng 2010 capacity
Renewables
Nuclear
Oil
Gas
Coal
Capacity addidons:
Over the past decade, global capacity additions have been fairly similar across coal, gasand renewables, with comparatively few additions of nuclear and oil-fired power plants.Since 2000, nearly four-fifths of the additional coal-fired power plants have been built inChina, while more than half of the gas-fired capacity additions were built in the UnitedStates and European Union. Globally, the share of renewables in capacity additions hassteadily increased in recent years, reaching about 50% of total additions in 2010. However,as renewables often generate less electricity per unit of capacity installed each year thanthermal plants, their contribution to incremental electricity output has been less than theirshare of incremental capacity.
© O
EC
D/IE
A, 2
011
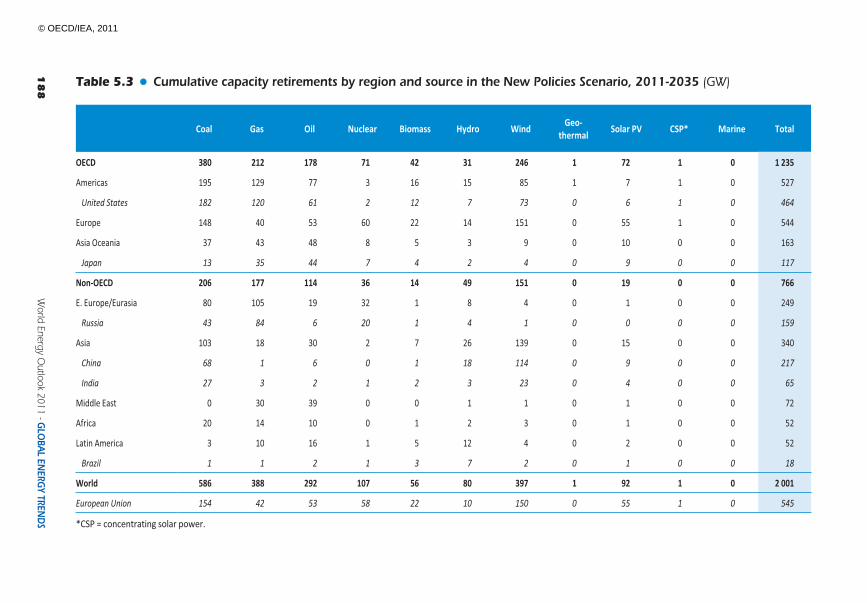
188
World
EnergyO
utlook2011
-GLO
BALEN
ERGY
TREND
S
Table 5.3 ! Cumulative capacity retirements by region and source in the New Policies Scenario, 2011-2035 (GW)
Coal Gas Oil Nuclear Biomass Hydro Wind Geo-thermal Solar PV CSP* Marine Total
OECD 380 212 178 71 42 31 246 1 72 1 0 1 235
Americas 195 129 77 3 16 15 85 1 7 1 0 527
United States 182 120 61 2 12 7 73 0 6 1 0 464
Europe 148 40 53 60 22 14 151 0 55 1 0 544
Asia Oceania 37 43 48 8 5 3 9 0 10 0 0 163
Japan 13 35 44 7 4 2 4 0 9 0 0 117
Non-OECD 206 177 114 36 14 49 151 0 19 0 0 766
E. Europe/Eurasia 80 105 19 32 1 8 4 0 1 0 0 249
Russia 43 84 6 20 1 4 1 0 0 0 0 159
Asia 103 18 30 2 7 26 139 0 15 0 0 340
China 68 1 6 0 1 18 114 0 9 0 0 217
India 27 3 2 1 2 3 23 0 4 0 0 65
Middle East 0 30 39 0 0 1 1 0 1 0 0 72
Africa 20 14 10 0 1 2 3 0 1 0 0 52
Latin America 3 10 16 1 5 12 4 0 2 0 0 52
Brazil 1 1 2 1 3 7 2 0 1 0 0 18
World 586 388 292 107 56 80 397 1 92 1 0 2 001
European Union 154 42 53 58 22 10 150 0 55 1 0 545
*CSP = concentrating solar power.
© OECD/IEA, 2011

Chapter5-Pow
erandrenew
ablesoutlook
18
9
5
Table 5.4 ! Cumulative gross capacity additions by region and source in the New Policies Scenario, 2011-2035 (GW)
Coal Gas Oil Nuclear Biomass Hydro Wind Geo-thermal Solar PV CSP* Marine Total
OECD 260 468 42 125 106 104 686 12 278 31 17 2 129
Americas 166 226 10 28 51 41 257 8 77 14 2 880
United States 159 163 8 20 42 20 209 6 68 11 1 708
Europe 67 139 15 48 44 50 390 3 153 15 14 938
Asia Oceania 27 103 16 50 11 12 39 2 48 3 1 311
Japan 5 75 16 22 8 7 22 1 36 0 1 193
Non-OECD 1 031 767 71 221 138 578 618 18 275 49 1 3 767
E. Europe/Eurasia 53 146 1 53 11 30 28 3 6 0 0 331
Russia 32 96 0 33 8 18 13 3 2 0 0 204
Asia 923 348 14 148 103 401 525 12 206 21 1 2 700
China 555 170 3 114 58 213 384 2 89 16 0 1 605
India 251 91 2 24 20 79 95 0 89 4 0 657
Middle East 0 148 40 7 4 14 23 0 21 15 0 271
Africa 47 56 4 6 8 45 19 2 22 11 0 222
Latin America 8 70 11 7 12 88 22 2 20 3 0 243
Brazil 3 40 4 5 7 40 12 0 13 1 0 125
World 1 291 1 235 112 346 244 682 1 304 30 553 81 17 5 896
European Union 61 127 13 50 43 32 373 2 152 15 13 882
Average economiclifetime (years)
30 25 25 35 25 50 20 25 20 20 20
*CSP = concentrating solar power.
© OECD/IEA, 2011
190 World Energy Outlook 2011 - GLOBAL ENERGY TRENDS
In the OECD, renewables account for about 60% of cumulative capacity additions between2011 and 2035 in the New Policies Scenario. Wind and solar PV cumulative capacityadditions are greater than the sum of additions from gas, coal and nuclear power, thoughtheir share of incremental output is generally far lower. In North America, capacity additionsof wind and gas are similar (slightly more than 25% each of total additions), with about220 GW of additional gas capacity (in part because of relatively low gas prices). In OECDEurope, government policies drive wind power capacity additions to nearly three-timesthose of gas, almost six-times those of coal additions and eight-times those of nuclear powerbetween 2011 and 2035. In Japan, nuclear capacity additions are much lower than both gasand solar PV, and similar to added wind capacity of 22 GW.
In non-OECD countries, fossil-fuel capacity additions (coal, gas and oil) are roughly equal tonon-fossil-fuel capacity additions (wind, hydro, solar PV, nuclear, biomass and otherrenewables) in the New Policies Scenario between 2011 and 2035. Almost all of the coal-firedcapacity built in non-OECD countries (and three-quarters worldwide) occurs in Asia. China andIndia combined account for over 60% of all the coal-fired capacity built during the Outlookperiod. The additional wind and hydro capacity built in non-OECD Asia is also extremelylarge, greater than that of all OECD countries combined. In Russia and the rest of EasternEurope/Eurasia, gas-fired plants dominate capacity additions, followed by nuclear, coal andhydro. In Africa, gas, coal, and hydro make the biggest contributions to additional capacity.Latin America relies mainly on hydro and gas for new capacity, but solar PV and wind capacityadditions are also significant. In theMiddle East, gas and oil account for 70% of new capacity.
Implications of increasing renewables-based capacity
The increasing contribution of renewables to meeting rising electricity demand hasimportant implications for the design of electricity systems, because of the variablenature of the output of several renewables-based technologies, such as wind, solar PVor concentrating solar power (CSP) without storage (see Chapter 10 in WEO-2010 forfurther discussion). The integration of these variable renewables into the system results inadditional costs for electricity systems to ensure security of supply (Box 5.1).
Our analysis provides a global estimate of the quantity of flexible capacity needed toensure system adequacy – the ability of the electricity system to meet electricity demandat all times with an acceptably high probability – due to the increasing share of variablerenewables in the system in the New Policies Scenario.4We find that for every 5megawatts(MW) of variable renewable capacity installed, about 1 MW of other (flexible) capacity isneeded tomaintain system adequacy. In 2035 in theNewPolicies Scenario, this correspondsto around 300 GW, or about 8% of the non-variable capacity additions over the Outlookperiod.5 This level of additional capacity leads to system adequacy costs ranging from $3 permegawatt-hour (MWh) to$5/MWhofvariable renewablesgeneration,dependingontheregion.
4. While ample data are available for the United States and Europe, resources of variable renewables and the hourlyelectricity demand are not covered with the same quality in all WEO regions. The impact of increased penetra"on ofrenewables on the rest of the genera"onmix is an emerging area of research requiring further inves"ga"on (IPCC, 2011)5. Full details of the methodology used by the IEA in this analysis are available at:www.worldenergyoutlook.org/methodology_sub.asp.
© O
EC
D/IE
A, 2
011

Chapter 5 - Power and renewables outlook 191
5
Box 5.1 ! Costs of integrating variable renewables into the electricity system
Total system integration costs range from $5/MWh to $25/MWh of variablerenewables-based generation. This is made up of three components: adequacy costs,balancing costs and grid integration costs (IEA, forthcoming).
! Adequacy costs: Electricity systems must have enough generating capacityavailable to meet system demand even at peak times. This is known as systemadequacy. Variable renewables make a relatively low contribution to systemadequacy, because only a small proportion of their potential output is certainto be available at times of peak demand. As a result, other plants are needed onthe system to compensate for this variability. Based on our estimates, the costsassociated with this additional capacity ranges from $3/MWh to $5/MWh ofvariable renewables generation.
! Balancing costs: The variable nature of supply requires more flexibility from therest of the power system, typically on short time-scales. Additional services areneeded in order to perfectly match supply and demand and to maintain systemstability. Balancing services can be supplied by flexible generation, smart grids,strong interconnections between grids or energy storage technologies, such aspumped hydro, compressed-air and large-scale batteries. The costs are largelyoperational (rather than capital) and range between $1/MWh and $7/MWh ofvariable generation, depending on the region (IEA, 2011a).
! Grid integration costs: Once renewables capacity is built, it must be linked to theexisting power grid and existing transmission and distribution (T&D) networksmayneed to be reinforced to transport the generated electricity to consumers. Thecosts range from $2/MWh to $13/MWh for variable renewables and are discussedin detail in the T&D section in this chapter.
The additional 300GWof capacity is required to compensate for the difference between theaverage power output of variable renewables and the amount of power they can reliably beexpected to produce at the timeswhen demand for electricity is highest (the lattermeasureis known as the capacity credit).6 This capacity is added to contribute to system adequacy,but runs for significantly fewer hours each year than would be the case in the absence ofvariable renewables (IEA, forthcoming).
The average power output of variable renewables is higher in most cases than theircapacity credit. By the end of the Outlook period, globally, wind and solar combined havean average power output of 25% in the New Policies Scenario, higher than their combined
6. The capacity credit of variable renewables depends mainly on the "me of day (or season) at which the output isavailable and howwell thatmatcheswith the "meof peak demand. It also depends on the characteris"cs of the resource(e.g. the strength and consistency of the wind), and on the level of deployment of each type of variable renewable.
© O
EC
D/IE
A, 2
011

192 World Energy Outlook 2011 - GLOBAL ENERGY TRENDS
average capacity credit of 9%.7 The global capacity credit estimate masks considerableregional variations. In 2035, the combined global capacity credit of wind, solar PV andCSP (without storage) plants in the New Policies Scenario ranges from 5% to 20% amongthe different regions modelled. It is relatively low in OECD Europe, largely due to theexpansion of solar PV in central European countries, such as Germany, where energyoutput is zero or near zero during times of peak demand, which are generally on coldwinterevenings. It is highest in Japan as there is a higher correspondence between the peaks indemand –which are driven in part by air conditioning requirements on sunny afternoons –and the output of solar PV, which make up about 60% of the variable renewables capacityin operation in Japan by 2035.
In the New Policies Scenario, OECD Europe and the United States account for over 40%of the gross capacity additions of wind and solar capacity over the Outlook period. Inthe United States in 2035, installed capacity of wind and solar PV combined is 240 GW,with an average utilisation rate of 27%, resulting in an average power output of around65 GW. Given their 8% capacity credit, only about 20 GW of this is reliably availableat times of peak demand. To compensate for this difference, 45 GW of other types ofcapacity is required to maintain system adequacy. In OECD Europe, which has a lowercapacity credit (5%) and higher variable renewables capacity in 2035 (about 450 GW),the amount of additional capacity required in the system is higher, at around 90 GW(Figure 5.12).
Figure 5.12 ! Capacity of wind and solar PV and their system effects for theUnited States and OECD Europe, 2035
0
100
200
300
400
500
United States
GW Installed capacity
Other flexible capacityrequired for system adequacy
Capacity credit
Average poweroutput of installedcapacity
0
100
200
300
400
500
OECD Europe
GW
The capacity credit of variable renewables, and therefore the additional capacity required tomaintain systemadequacy, can be increased in severalways, includingwider interconnectionbetween regional grids, which can smooth the variability of wind and solar resources, andmay improve alignment between generation and peak demand. Using a more diverse mix
7. Based on data from Heide et al. (2010), NREL (2010, 2011a, 2011b), andWorld Wind Atlas (2011).
© O
EC
D/IE
A, 2
011

Chapter 5 - Power and renewables outlook 193
5
of renewables can also improve capacity credit because their outputs, being diverse, aremore constant overall. Using energy storage technologies that are directly linked to variablerenewables is another way to improve reliability in meeting demand.
Investment
In the New Policies Scenario, cumulative global investment in the power sector is$16.9 trillion (in year-2010 dollars) over the Outlook period, an average of $675 billion peryear (Figure 5.13). New generating capacity accounts for 58% of the total investment, withtransmission and distribution (T&D) making up the remaining 42%. Renewables make up60% of investment in new power plants, led by wind, solar PV and hydro, even though theyrepresent only half of the capacity additions; their larger share of investment reflects theirhigher capital costs, relative to fossil-fuel power plants. Investment in coal-fired powerplants, which account for the largest share of total investment other than renewables as agroup, is relatively constant over time. Investment in nuclear power, which is much morecapital-intensive, is slightly less than in coal-fired plants while cumulative capacity additionsare only half those of coal. Investment in gas-fired plants is lower than coal or nuclear whileadditional capacity is substantially higher, reflecting far lower capital costs per MW ofcapacity.
Figure 5.13 ! Investment in new power plants and infrastructure in the NewPolicies Scenario
2021 to 2035$10.1 trillion
2011 to 2020$6.8 trillion T&D
Coal
Gas
Oil
Nuclear
Wind
Hydro
Solar PV
Other renewables12%6%1%
6%
8%
7%4%
10%5%0%
7%
8%
8%8%
44%12%
41%
13%
Investment in new power plants in non-OECD countries increasingly outpaces investment inthe OECD over time. In the 2011 to 2020 period, the levels of investment in the OECD andnon-OECD are similar (less than 20% apart) for all three scenarios. Asia accounts for mostof non-OECD investment. In the 2021 to 2035 period, non-OECD investment in new powerplants is over 30% beyond the level in the OECD in the New Policies Scenario, with Asiaaccounting for almost 70% of the investment in non-OECD countries (Table 5.5).
© O
EC
D/IE
A, 2
011

194
World
EnergyO
utlook2011
-GLO
BALEN
ERGY
TREND
S
Table 5.5 ! Investment in new power plants in the New Policies Scenario, 2011-2035 ($2010 billion)
Coal Gas Oil Nuclear Biomass Hydro Wind Geo-thermal Solar PV CSP* Marine Total
OECD 634 372 27 540 359 272 1 210 28 701 129 64 4 336
Americas 416 174 7 143 174 105 451 16 189 54 8 1 738
United States 405 131 6 111 157 51 372 11 170 45 5 1 463
Europe 155 115 10 207 155 136 690 8 386 65 51 1 976
Asia Oceania 63 83 10 191 30 31 69 3 126 10 5 621
Japan 12 60 10 94 20 18 39 1 97 0 2 354
Non-OECD 1 151 545 59 585 305 1 134 932 42 544 156 2 5 456
E. Europe/Eurasia 117 128 1 186 29 62 43 7 15 0 0 588
Russia 75 84 0 116 20 37 19 6 5 0 0 362
Asia 943 206 8 331 227 758 794 27 391 66 2 3 752
China 430 87 2 228 137 336 590 7 170 50 1 2 037
India 347 59 1 68 38 167 138 1 165 14 1 999
Middle East 0 130 39 22 8 29 34 0 43 46 0 352
Africa 80 34 4 20 17 90 28 5 48 34 0 360
Latin America 11 47 6 25 24 196 34 4 48 10 0 404
Brazil 4 28 2 17 13 93 19 0 30 6 0 211
World 1 785 917 86 1 125 664 1 406 2 142 71 1 245 285 66 9 791
European Union 144 107 8 216 149 92 663 7 382 65 51 1 884*CSP = concentrating solar power.
© OECD/IEA, 2011

Chapter 5 - Power and renewables outlook 195
5
Focus on T&D infrastructureRobust networks are vital to delivering electricity reliably to consumers. Reinforcementand expansion of network capacity will be needed in the future to accommodate demandgrowth, integrate greater renewables-based generation, improve access to electricity indeveloping countries, facilitate the use of electricity in road transport and increase electricitytrade across borders. Indeed, transmission and distribution (T&D) infrastructure accountsfor 42% of all power sector investment over the Outlook period (though it is often under-represented in discussions about the power sector).8
Electricity networks can be broadly divided into two types. Transmission grids comprisehigh-voltage lines and support structures that transport power over large distances frompower plants to demand centres and large industrial facilities. Distribution grids deliverpower from the transmission level to individual households and businesses. They are denserthan transmission grids and account for 90% of the total length of T&D grids worldwide.In 2009, there were about 70 million kilometres (km) of T&D lines globally – more than1 500 times the circumference of the planet and equivalent to the length of all the world’sroads. Most of the features of the technology have remained fundamentally unchangedsince the early days of the industry a century ago, but there has been considerableinnovation in some areas, including the introduction of digital communication and controltechnologies. The evolution of such “smart-grids” is expected to continue in coming decades.
Grid expansion
The structure and size of national grids is determined by geographic, political and economicconditions. In industrialised countries, large parts of the electricity grid were built in the 1960sand1970s. In emerging economies, rapid growthof grids startedmore recently and is continuing(Figure 5.14). The total length of all grids combined almost tripled between 1970 and 2009.
Since 1970, grid growth has been largest in Asia, led by China. Asia accounted for 60% of thegrowth in this period, resulting in a more than six-fold increase in the continent’s grid length.Grid length in theUnited States and Europe doubled, but fromahigher starting point. One-thirdof investment in T&D infrastructure in 2009wasmade in China, where $62 billion (in year-2010dollars) was spent on T&D, more than OECD Europe and the United States combined.
T&D assets last on average for about 40 years, but can operate for much longer in somecases. Lifetime varies considerably according to the asset type: poles and lines routinelylast longer, while control centres and substations need more frequent refurbishment. Theconditions under which the assets are used and the way in which they are maintained arealso important determinants of equipment life. For example, poor maintenance during theeconomic downturn of the early 1990s is expected to shorten considerably the operatinglifetimes of network assets in Eastern Europe/Eurasia. By 2035, half of the grid infrastructurein place globally in 2009 will have reached 40 years of age (Figure 5.15).
8. Full details of the methodology used by the IEA in this analysis are available atwww.worldenergyoutlook.org/methodology_sub.asp.
© O
EC
D/IE
A, 2
011

196 World Energy Outlook 2011 - GLOBAL ENERGY TRENDS
Figure 5.14 ! Expansion of T&D grids,1970-2009, and regional shares ofglobal grid investment in 2009
0% 6% 12% 18% 24% 30% 36% 42%
0 2 4 6 8 10 12 14
China
OECD Europe
United States
India
OECDAsia Oceania
Ladn America
Africa
Middle East
Russia
Share of total grid investments
Million km
1971-1980
1981-1990
1991-2000
2001-2009
Regional share in 2009(top axis)
Sources: ABS (2010); ENTSO-E (2011).
The length of the electricity grid per square kilometre (km2) of land area and generationper-capita provide twomeasures of thematurity of a power system (Figure 5.16). Both tendto increase quickly initially and then begin to level off, reflecting saturation effects. In theearly stages of system development, the length of electricity grids usually grows faster thanper-capita generation, as distribution networks are expanded to connect more end-users.More advanced stages tend to require only incremental grid extensions, with investmentshifting towards strengthening grids to support relatively gradual increases in demand.
Figure 5.15 ! Share of T&D infrastructure in place in 2009 reaching40 years of age
0% 10% 20% 30% 40% 50% 60% 70%
World
Russia
India
United States
Ladn America
China
Middle East
OECD Europe
OECDAsia Oceania
Africa
2015
2025
2035
Sources: ABS (2010); IEA analysis.
Increases in grid density in the coming decadeswill occur primarily in less developed regions.Africa has seen a marked increase in the length of the electricity grid per km2 over recent
© O
EC
D/IE
A, 2
011

Chapter 5 - Power and renewables outlook 197
5
years and this is set to continue. In the New Policies Scenario, Africa’s T&D grid per km2
increases from 10% of the OECD average in 2009 to 14% in 2035. Per-capita generationgrowth is slower. In 2009, per-capita generation in Africa amounted to around 600 kWh,only 7% of the OECD average (about 7 500 kWh). In the New Policies Scenario, per-capitageneration in Africa rises, but is still only 8% of the OECD average by 2035. In the highlyindustrialisedOECD, grid density and per-capita generation are fairly stable over theOutlookperiod, due to the power system becoming more efficient and to saturation effects.
Figure 5.16 ! T&D grid length and per-capita generation for selected regionsin the New Policies Scenario
-100%
-50%
0%
50%
100%
-100% -50% 0% 50% 100%
T&Dlen
gthp
erkm
2as
apercentageo
f200
9level
Per-capita generadon as a percentage of 2009 level
Africa 1970
Non-OECD Asia
OECD
2009
2035
In Asia, both grid density and per-capita generation grow significantly. In India and China,which have experienced rapid T&D growth in the past, grid density begins to saturate overtheOutlook period while per-capita generation continues to grow. The average grid densityin non-OECDAsia is about two-thirds of theOECD value in 2035, comparedwith 15% in 1970and 50% in 2009.
T&D investment needs
In the New Policies Scenario, a total of $7.1 trillion (in year-2010 dollars) is invested in T&Dinfrastructure over 2011 to 2035. $2.6 trillion, or 36%, of this investment is in the OECDand $4.5 trillion in non-OECD countries. There are three components of this investment:additional capacity to meet higher demand, refurbishment and replacement of existingassets as they reach the end of their technical lifetime and increases due to the integrationof renewables. Additional capacity accounts for 57% of total T&D investment globally,
© O
EC
D/IE
A, 2
011
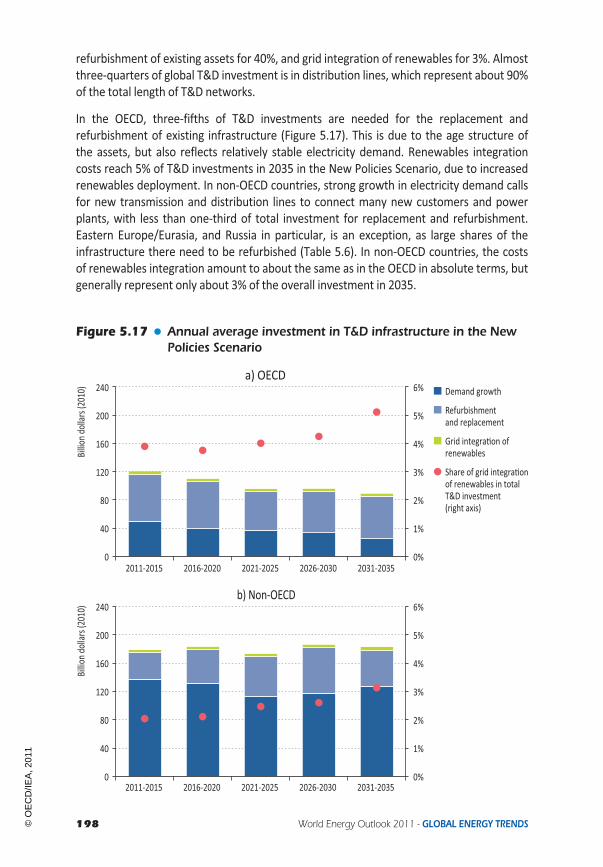
198 World Energy Outlook 2011 - GLOBAL ENERGY TRENDS
refurbishment of existing assets for 40%, and grid integration of renewables for 3%. Almostthree-quarters of global T&D investment is in distribution lines, which represent about 90%of the total length of T&D networks.
In the OECD, three-fifths of T&D investments are needed for the replacement andrefurbishment of existing infrastructure (Figure 5.17). This is due to the age structure ofthe assets, but also reflects relatively stable electricity demand. Renewables integrationcosts reach 5% of T&D investments in 2035 in the New Policies Scenario, due to increasedrenewables deployment. In non-OECD countries, strong growth in electricity demand callsfor new transmission and distribution lines to connect many new customers and powerplants, with less than one-third of total investment for replacement and refurbishment.Eastern Europe/Eurasia, and Russia in particular, is an exception, as large shares of theinfrastructure there need to be refurbished (Table 5.6). In non-OECD countries, the costsof renewables integration amount to about the same as in the OECD in absolute terms, butgenerally represent only about 3% of the overall investment in 2035.
Figure 5.17 ! Annual average investment in T&D infrastructure in the NewPolicies Scenario
Demand growth
Refurbishmentand replacement
Grid integradon ofrenewables
Share of grid integradonof renewables in totalT&D investment(right axis)
0%
1%
2%
3%
4%
5%
6%
0
40
80
120
160
200
240
2011-2015 2016-2020 2021-2025 2026-2030 2031-2035
Billiond
ollars(2010)
a) OECD
0%
1%
2%
3%
4%
5%
6%
0
40
80
120
160
200
240
2011-2015 2016-2020 2021-2025 2026-2030 2031-2035
Billiond
ollars(2010
)
b) Non-OECD
© O
EC
D/IE
A, 2
011

Chapter5-Pow
erandrenew
ablesoutlook
19
9
5
Table 5.6 ! Investment in T&D infrastructure in the New Policies Scenario, 2011-2035 ($2010 billion)
Transmission Distribution
Total Total New Refurbishment Renewables Total New Refurbishment Renewables Share fromrenewables
OECD 2 561 626 212 326 87 1 936 709 1 208 18 4.1%
Americas 1 271 402 147 217 38 869 283 578 9 3.7%
United States 1 009 312 109 172 31 696 203 486 7 3.8%
Europe 915 179 49 87 42 737 297 431 8 5.5%
Asia Oceania 375 45 16 23 7 330 129 200 1 2.1%
Japan 219 24 6 15 4 195 66 128 1 2.0%
Non-OECD 4 530 1 214 852 273 89 3 316 2 288 1 008 21 2.4%
E. Europe/Eurasia 442 133 47 83 4 308 120 188 1 1.0%
Russia 252 95 29 65 2 157 54 103 0 1.0%
Asia 3 267 850 644 137 69 2 417 1 728 673 16 2.6%
China 1 931 623 477 97 49 1 308 910 387 11 3.1%
India 632 111 76 22 13 521 327 190 3 2.6%
Middle East 231 59 40 13 6 172 137 34 1 3.1%
Africa 278 78 60 13 5 199 156 42 1 2.1%
Latin America 313 93 61 27 5 220 148 71 1 2.1%
Brazil 193 63 42 19 3 130 89 40 1 2.1%
World 7 092 1 839 1 064 599 176 5 252 2 997 2 216 39 3.0%
European Union 809 160 38 82 40 649 236 406 8 5.9%
© OECD/IEA, 2011

200 World Energy Outlook 2011 - GLOBAL ENERGY TRENDS
The costs of refurbishing or expanding grids must be recouped by grid operatorsthrough their tariffs. Based on global investments in T&D in the New Policies Scenariototalling $7.1 trillion, residential customers around the world will pay between $10/MWhand $20/MWh in 2035 to cover these infrastructure costs, with an average of $12/MWh.9The weight of the tariff in the residential end-user price varies across regions (Figure 5.18).
Figure 5.18 ! T&D infrastructure costs as a share of residential end-userprice in the New Policies Scenario, 2035
0%
4%
8%
12%
16%
20%
0
4
8
12
16
20
UnitedStates
OECDEurope
OECDAsia Oceania
Russia China India
Dollarspe
rMWh(
2010) Costs to
residendalend-users
Share of residendalend-user price(right axis)
Because T&D infrastructure is considered a natural monopoly,10 T&D tariffs are normallyregulated by public authorities to prevent abuse of monopoly power and excess profits.Grid regulation is crucial to avoid cross-subsidisation, set appropriate tariffs and ensuregrid-access rights for new market entrants, an issue especially relevant for renewablesgenerators. Regulations are a key determinant in the efficiency and reliability of T&Dinfrastructure. Additionally, planning and building new transmission and distribution cantake up to ten years or longer and often exceeds the time to build new power plants.Therefore, providing a stable investment framework for grid operators is an important taskfor regulators.
Grid integration of renewables
The best sites for producing renewables-based electricity are not always located close tocentres of demand. To exploit remote renewable energy sources, additional high-voltagetransmission lines have to be built and some aspects of existing T&D networks reinforced.The associated capital costs are known as grid integration costs and make up one part of the
9. Our es"mates exclude other charges such as system services, losses, conges"on and regulatory charges that are o#enincluded in, and can add significantly to, transmission tariffs (ENTSO-E, 2011).10. A natural monopoly in this case means that the economies of scale achieved by a single electricity transmission anddistribu"on network in any territory are so large that it is not feasible for two or more grids to co-exist compe""vely.
© O
EC
D/IE
A, 2
011
Chapter 5 - Power and renewables outlook 201
5
total system integration costs (see Box 5.1). In the New Policies Scenario, over the period2011 to 2035, grid integration costs of renewables make up 10% of total transmissioninvestment costs worldwide (excluding investment in distribution), 14% of transmissioninvestment in the OECD and 25% of transmission investment in the European Union. Theshare in global T&D investment costs taken together is 3%.
The grid integration costs of renewables vary considerably by region, driven in part by theproximity of renewable resources to population centres. In the United States, for instance,the areas with the greatest wind potential are located in the middle of the country, faraway from the main load centres on the east and west coasts. The situation is similarin China, where high wind speeds can be found close to Mongolia and in the northwestprovince, while the load centres are located along the coast. In the Europe Union, T&Dgrids are already well-developed, but the distances between the windiest regions in andaround the North Sea and the main centres of demand are still significant, resulting in thecost of grid integration of renewables accounting for 25% of total transmission investmentthere.
Grid integration costs also vary by technology. Solar PV and CSP entail grid integrationcosts per unit of capacity similar to those of wind. The location of solar PV, CSP and windplants is influenced by where sunlight or wind is the strongest and most constant, whichcan be distant from demand centres. Costs for other renewable energy technologies,such as biomass, are generally lower as they tend to be located closer to existingnetworks and demand centres. Hydro and geothermal grid integration costs varygreatly across countries, as they are determined by geography. Grid integration costsper unit of output for variable renewables are also higher than those of other typesof generators (renewables-based or otherwise) because their average power outputis generally lower, making it necessary to spread costs over fewer units of generatedpower. Due to the variation in the average power output between technologies and theirproximity to demand centres, grid integration costs for variable renewables range from$2/MWh to $13/MWh in the New Policies Scenario.
The cumulative global investment in T&D related to the grid integration of renewables is$220 billion (in year-2010 dollars) in the New Policies Scenario, assuming an average costof $150/kW of renewables capacity.11 The share of renewables grid integration costs intotal transmission investment is above 18% in the 450 Scenario, where significantly morerenewables are deployed, or nearly 6% of cumulative T&D investment (Figure 5.19). Higherassumed grid integration costs of $250/kW would increase cumulative investment from2011 to 2035 to $360 billion in the New Policies Scenario. Even with higher integrationcosts and significantly more deployment of renewables in the 450 Scenario, the share inglobal T&D investment costs remains below 10%.
11. See Figure 5.19 note.
© O
EC
D/IE
A, 2
011

202 World Energy Outlook 2011 - GLOBAL ENERGY TRENDS
Figure 5.19 ! Renewables grid integration costs as a share of global T&Dinvestment costs in the New Policies Scenario by integrationcost, 2011-2035
$6 bn/yr
$9 bn/yr
$15 bn/yr
$10 bn/yr
$14 bn/yr
$24 bn/yr
0%
2%
4%
6%
8%
10%
CPS NPSTypical
450 CPS NPSHigh
450
Specific renewables grid integradon costs
Hydro, geothermal,biomass, marine
Solar PV and CSPwithout storage
Wind
Notes: Grid integration costs are $150/kW in the New Policies Scenario, and are denoted above as “typical”. Additionalillustrative examples are provided using a higher grid integration cost of $250/kW. These figures are drawn fromdetailed studiesfor Europe and the United States, showing a range from $60/kW to $320/kW (NREL, 2010 and 2011a; ECF, 2010).
Smart grids
A smart grid is an electricity grid that uses digital and other advanced technologies tomonitor and manage the transport of electricity from generation sources to meet thevarying electricity demands of end-users (IEA, 2011b). Such technologies are expected toplay an important role in boosting the flexibility of the system to deal with the challengesof rising demand, shifting load patterns, new sources of supply and the variability of somesources of renewables-based supply.
Smart grids enable electricity generators, end-users and grid operators to co-ordinate theirneeds and capabilities. This can improve efficiency, reliability and flexibility; lower the cost ofelectricity supply; and reduce the environmental impacts. Compared with today’s systems,smart grids will involve the exchange of more information on all levels. Furthermore,information flows (including the availability of real-time pricing) become bi-directional.Withdistributed generation and electric vehicles, the consumer can, in principle, feed electricityinto the grid. But, for this to occur efficiently, market participants will need access toreal-time information about the power system. The potential bi-directional flow ofinformation has created some concerns about data protection and privacy, which will haveto be addressed if smart grid technology is to be widely adopted.
Smart grid technologies can increase network efficiency by providing more timelyinformation to operators through wide-area monitoring and integrated communicationssystems (e.g. radio networks, internet, cellular and cable); reducing outage times andmaintenance as a result of improved sensing and automation on low-voltage distributiongrids; and reducing transmission losses through transmission enhancements (e.g. dynamicline rating systems). With the deployment of smart meters and advanced communications
© O
EC
D/IE
A, 2
011

Chapter 5 - Power and renewables outlook 203
5
systems, smart grids can also increase the flexibility of the power system by enabling end-users (motivated by a suitable financial incentive) to vary their demand according to theneeds of the system. Potential areas for such demand-side response include heating andcooling loads in the industrial, commercial and residential sectors. In the future, it couldalso include supply to the grid from electric vehicles. This enhanced flexibility could alleviatesome of the challenges of integrating renewables generation and reduce balancing costs.
Smart grid technologies could facilitate the integration of electricity grids over largergeographic areas. Conceptually, regional electricity grids could be combined and reinforcedto interconnect larger regions or even continents, allowing significantly more electricitytransport across large areas (known as “super-grids”). There are two main drivers of thispotential development: the advantages of physical interconnection of electricity markets,enabling more efficient use to be made of power plants, with higher reliability of supply toconsumers, and the need to integrate variable renewables.
A larger grid can facilitate the integration of variable renewable energies by allowing them toserve demand that bestmatches their variable output, even if the demand is geographicallyremote. It can also reduce balancing costs by smoothing the cumulative output of variablerenewables, because the strength of sunshine or wind is less correlated over longerdistances. Based on a simulation of a super-grid spanning the entirety of the United Statesand another extending acrossOECDEurope,we estimate that the development of super-gridscould reduce system adequacy costs related to variable renewables by up to 25%. Systemadequacy costs fall because the super-grids facilitate a significant increase in the capacitycredit of variable renewables (Figure 5.20). The actual deployment of super-grids willdepend on the extent of the other economic benefits that theymight provide to the systemand their cost relative to other means of managing variability, such as energy storage or theincreased installation of flexible generation capacity. Theywill also be contingent on politicaland public acceptance of additional transmission lines.
Figure 5.20 ! Effect of a super-grid on the capacity credit for wind andsolar PV for the United States and OECD Europe, 2035
0% 5% 10% 15% 20% 25% 30%
United States(Installed 241 GW)
OECD Europe(Installed 451 GW)
Capacity credit
Addidonal capacity creditdue to super-grid
Average power outputof installed capacity
Addidonal flexible capacitynecessary for system adequacy
Note: Super-gridsweremodelled in theUnited States and Europe as networks that allow unrestricted electricity transportacross the entirety of each region.
Sources: Capacity credit calculated based onHeide et al. (2010), NREL (2010, 2011a, 2011b) andWorldWind Atlas (2011).
© O
EC
D/IE
A, 2
011

© O
EC
D/IE
A, 2
011

Chapter 6 - Climate change and the 450 Scenario 205
CHAPTER 6
H I G H L I G H T S
CLIMATE CHANGE AND THE 450 SCENARIO
The door is closing, but when will we be “locked-in”?
! Global energy-related carbon-dioxide (CO2) emissions reached 30.4 Gt in 2010, 5.3%above 2009, representing almost unprecedented annual growth. In the New PoliciesScenario, our central scenario, CO2 emissions continue to increase, reaching 36.4 Gtin 2035, and leading to an emissions trajectory consistent with a long-term globaltemperature increase of more than 3.5°C.
! The450Scenarioprescribesstrongpolicyactionto limitclimatechange,andresults inglobalCO2emissionspeakingbefore2020andthendecliningtoreach21.6Gt in2035.Theshareoffossil fuels in theglobalenergymix falls from81%in2009to62%in2035.Globaldemandforboth coal and oil peak before 2020, and then decline by 30% and 8% respectively by 2035,relative to their 2009 level. Natural gas demand grows by 26%. The 450 Scenario requiresadditional cumulative investment of $15.2 trillion relative to the New Policies Scenario,but delivers lower fossil-fuel import bills, reducedpollutionandhealthbenefits.
! New country-by-country analysis reveals that 80% of the total CO2 emitted over theOutlook period in the 450 Scenario is already “locked-in” by our existing capital stock(e.g. power plants, buildings, factories), leaving little additional room for manoeuvre.If internationally co-ordinated action is not implemented by 2017, we project thatall permissible CO2 emissions in the 450 Scenario will come from the infrastructurethen existing, so that all new infrastructure from then until 2035 would need to bezero-carbon. This would theoretically be possible at very high cost, but probably notpracticable in political terms.
! The long lifetime of capital stock in the power sector means that the sector accountsfor half of the emissions locked-in to 2035. This lock-in exceeds the projectedemissions for the sector in the 450 Scenario. Delaying action until 2015 would call forearly retirement or retrofitting of plants emitting 5.7 Gt in 2035, around 45% of theglobal installed fossil-fuel capacity. Delaying action is a false economy, because forevery $1 of investment avoided before 2020, an additional $4.3 would need to bespent after 2020 to compensate for the increased emissions.
! Carbon capture and storage (CCS) is a key abatement option, accounting for 18% ofemissions savings in the 450 Scenario, relative to the New Policies Scenario, but itfaces regulatory, policy and technical barriers that make its deployment uncertain.In the Delayed CCS 450 Case, adoption is delayed by ten years, compared with the450 Scenario, meaning it is widely deployed only after 2030. This increases the costof the 450 Scenario by $1.14 trillion (8%) and puts unprecedented pressure on otherlow-carbon technologies, supporting the economic case to invest now in CCS.
© O
EC
D/IE
A, 2
011

206 World Energy Outlook 2011 - GLOBAL ENERGY TRENDS
IntroductionThe last year has not been a good one for those concerned about the contribution ofenergy-related carbon-dioxide (CO2) emissions to climate change. Energy-related CO2emissions in 2010 increased by 5.3%. Developing countries have continued to play a keyrole in powering global economic growth, providing modern energy to tens of millions ofadditional people, but they are doing so, to varying degrees, by using fossil fuels. Manycountries have continued to move forward with plans to address climate change but, inmany cases, those plans have yet to be implemented and their effectiveness proven. Policyintentions have come under pressure as budgets tighten and priorities change in the face ofthe uncertain economic outlook. Small stepswere taken towards a global climate agreementat the United Nations Framework Convention on Climate Change (UNFCCC) 16th Conferenceof the Parties (COP-16) in Cancun, Mexico, when a heroic leap was needed to set the worldon an emissions trajectory compatible with the stated long-term target of limiting theaverage global temperature increase to 2°C. Heightened awareness of the vulnerability ofoil supply could help or hinder efforts to combat climate change, depending on whethercountries see it as a reason to move away from fossil fuels or to invest further in domesticfossil-fuel supply. The events at FukushimaDaiichi in Japanmake itmore difficult to envisagea substantial and growing component of low-carbon nuclear power in the future energymix.What do these, and other, developments mean for our efforts to tackle climate change?To what extent are energy-related emissions to 2035 already locked-in, setting the futureclimate trajectory?
This chapter seeks to reappraise the climate implications of the projected energy future,primarily in terms of our 450 Scenario. Unlike other scenarios presented in this Outlook,the 450 Scenario is an output-driven scenario: the constraint set is that the global energypathway must be compatible with a 50% chance of meeting the goal of limiting the globalincrease in average temperature to 2°C, compared to pre-industrial levels (Box 6.1). Thisrequires the long-term concentration of greenhouse gases in the atmosphere to be limitedto about 450 parts per million of carbon-dioxide equivalent (ppm CO2-eq). Within theframework of the policy assumptions made in this scenario, in the 450 Scenario an energyfuture is constructed which produces a level of energy-related emissions compatible withthis objective, at the lowest achievable cost to the energy sector. The cost constraint isimportant: it recognises that there are other ways to achieve such an emissions trajectory,but also that they are likely to be more costly. Where appropriate, comparisons are madebetween the results of our 450 Scenario and those of our other WEO-2011 scenarios, inorder to demonstrate the divergence between the projected future paths and, particularly,what more needs to be done to achieve the climate goal.
This chapter begins by examiningmajor developments of the last year that have, ormay have,a significant impact on global efforts to tackle climate change. It sets out the projections of our450 Scenario on global energy demand and the consequences for emissions of greenhousegases and local pollutants, broken down by region and by sector. It then considers theimplications of delay in making commitments to the necessary trajectory, in terms of the“lock-in” to a high-carbon infrastructure that would then make meeting the climate targetsmuchmore difficult and expensive, or even, in terms of practical politics, impossible.
© O
EC
D/IE
A, 2
011
Chapter 6 - Climate change and the 450 Scenario 207
6
Box 6.1 " What is special about 2°C?
The expected warming of more than 3.5°C in the New Policies Scenario would havesevere consequences: a sea level rise of up to 2 metres, causing dislocation of humansettlements and changes to rainfall patterns, drought, flood, and heat-wave incidencethat would severely affect food production, human disease andmortality.
Alarmingly, researchpublished since the International Panel onClimateChange’s FourthAssessment Report in 2007 suggests that this level of temperature change could resultfrom lower emissions than those of theNewPolicies Scenario, due to climate feedbacks(IPCC, 2007a). For example, drying of the Amazon would release CO2 that would thenlead to further warming (Lewis et al., 2011) and rising arctic temperatures would leadto extra emissions from melting permafrost (Schaefer et al., 2011). These feedbackshave not yet been characterised with certainty, but they are expected to be triggeredby temperature rises between 2°C and 5°C (Smith et al., 2009). The threshold for large-scale sea level risemaybe similar, between1.8°Cand2.8°C (Lenton et al., 2008; Hansenet al., 2008).From the perspective of emission scenarios, these feedbacks imply that an increasein emissions can no longer be assumed to result in a pro-rata incremental increasein impacts. Put another way, a decision to relax climate policy and aim for a highertemperature target, such as 2.5°C or 3°C, may not actually allow much room for anincrease in emissions, given the likelihood of further emissions and warming beingtriggered by feedbacks. For example, Schaefer et al. (2011) calculate that underconditions similar to the New Policies Scenario (which stabilises the atmosphericconcentration at around 650 ppm CO2-eq), emissions from melting permafrost wouldlead to a further increase of 58 to 116 ppm in CO2 concentrations, resulting in furtherwarming andmore feedbacks.
The 450 Scenario, by definition, achieves a long-term atmospheric concentration of450 ppm CO2-eq (resulting in average warming of 2°C). Such a temperature increase(even without allowance for additional feedback effects) would still have negativeimpacts, including a sea-level rise, increased floods, storms and droughts.
The new evidence has led some researchers to conclude that even keeping thetemperature rise to 2°C may risk dangerous climate change, and that an even lowertemperature threshold and corresponding stabilisation target (such as 350 ppm)should be set (Anderson and Bows, 2011; Hansen et al., 2008; Rockström et al., 2009;Smith et al., 2009). The uncomfortable message from the scientific community is thatalthough thedifficulty of achieving 450ppmstabilisation is increasing sharplywith everypassing year, so too are the predicted consequences of failing to do so.
Recent developmentsIn many ways, the pattern of global energy-related CO2 emissions – the main contributorto global warming –mirrored that of the global economic recovery overall. The anticipated
© O
EC
D/IE
A, 2
011

208 World Energy Outlook 2011 - GLOBAL ENERGY TRENDS
decline in 2009, due to the economic downturn, was only 1.7% compared with 2008, lowerthan expected. Emissions in almost all OECD1 countries fell, but increased demand forfossil fuels (and the corresponding increase in emissions) in non-OECD countries partiallycompensated for this (Figure 6.1). The biggest component of the increase in non-OECDcountries was demand for coal, especially in China, where it grew by almost 8% in 2009.India also saw strong growth in emissions due to increasing coal demand – 7% growth in2009 compared with 2008 – and oil demand, which grew by 9% compared with 2008. In2010, global emissions returned to growth, reaching 30.4 gigatonnes (Gt). This is despite thefact that OECD emissions remained below their 2008 levels in many cases, including in theUnited States and European Union.
Figure 6.1 " Energy-related CO2 emissions by country, 2008-2010
0 1 2 3 4 5 6 7 8
Japan
Russia
India
Other OECD
European Union
United States
Other non-OECD
China
Gt
2010*
2009
2008
*Es!mated.
In contrast to the OECD, energy-related emissions in non-OECD countries as a group werehigher in 2010 than ever before, having grown in both 2009 and 2010. China, which becamethe largest source of energy-related emissions in 2007, continued in this position, withestimated energy-related emissions of 7.5 Gt in 2010. This is 40% higher than the UnitedStates, a very significant change over the four years since 2006, when the two countrieshad virtually the same level of energy-related emissions. Per-capita emissions in China areat 5.6 tonnes, one-third those of the United States. Emissions in India reached just over1.6 Gt in 2010, India becoming the third-largest emitter on a global level, though per-capitaemissions in India remain very low, at just 14% of the OECD average. Russia was one of thefew large non-OECD countries to see a drop in emissions in 2009, but strong growth in 2010meant that energy-related emissions rose slightly higher than pre-crisis levels, approachinglevels last seen in the early 1990s (see Chapter 9). Coal was the biggest source of emissionsgrowth in 2010, primarily driven by use in China and India. Natural-gas emissions alsoincreased strongly in 2010, but from a relatively low base. While the increase in emissions
1. In this chapter, references to the OECD also include countries that are members of the European Union, but not ofthe OECD.
© O
EC
D/IE
A, 2
011

Chapter 6 - Climate change and the 450 Scenario 209
6
was driven by economic growth as the global economy began to recover from the financialcrisis, emissions growth was stronger than GDP growth, implying a slight increase in theglobal CO2 intensity of GDP.The substantial rise in emissionswas not accompanied bywidespread intensification of actionto combat climate change. TheCOP-16meeting in Cancun resulted in someprogress, recordedin two documents, but not the comprehensive, legally binding, global agreement that somestill hoped for. The 2°C goal has been made explicit and is for the first time formally agreed;second, the individual emissions reduction pledges made by the countries are made official;and third, there is explicit acknowledgement that in order to limit long-term temperatureincrease to below 2°C, greater ambition is necessary. The COP explicitly urged countries togo beyond these pledges, opening the door to tighter restrictions on emissions before 2020.Since the COP-16 meeting in 2010, implementation of climate policies across the globe hasdeveloped in different directions. Some countries, such as Australia, China and the EuropeanUnion, seem to be moving forward. Australia has developed plans to tax carbon emissionsfrom the country’s largest emitters, starting at 23 Australian dollars per tonne in 2012 beforemoving to amarket-based trading scheme in 2015. This schemeaims to cut national emissionsby 5%, compared with 2000 levels, by 2020. A parliamentary vote on the scheme is expectedbefore the end of 2011. China’s 12th Five-Year Plan (see Chapter 2) has introduced pilot cap-and-trade schemes, as a lead in to one of themeans to achieve China’s pledge of 40% to 45%reductions in CO2 intensity below 2005 levels by 2020. An emissions trading system coveringtheentire economyandentering into forcebefore 2020 is alsounder discussion. TheEuropeanUnion is discussing post-2020 targets and policies designed to give investors clear signals ofrequirements beyond the third trading period of the EU Emissions Trading System. On theother hand, theArab Spring and the consequences of the Japanese tsunami have switched theattention of energy policy makers away from climate change, with energy security concernsclimbing higher up the agenda ofmany countries.In any case, the pledges made in association with the Copenhagen Accord and CancunAgreements are not sufficient to put theworld on a climate-sustainable path. Even if countrypledges are interpreted in the most stringent possible way, and other policy commitments,such as removal of inefficient fossil-fuel subsidies, are implemented by 2020, action wouldneed to be very significantly stepped-up after 2020 in order to achieve the 450 trajectorydescribed in this chapter. This path differs very little from that set out in theWorld EnergyOutlook-2010, which outlined in detail the scale of the effort required after 2020 in order toachieve a 450 trajectory given the lack of ambition of climate pledges for 2020. For instance,WEO-2010 found that the weakness of the pledges for 2020 would increase the cost ofachieving the 450 Scenario by $1 trillion over the period 2010 to 2030, compared withWEO-2009’s 450 Scenario, which assumed earlier strong action (IEA, 2010a). Supportingour conclusions, the United Nations Environment Programme (UNEP) emissions gap reportfound that the level of emissions expected as a result of the Copenhagen pledges is higherthan would be consistent with either a “likely” or “medium” chance of staying below 2°C or1.5°C (UNEP, 2010). Momentum may rise again in the preparation for COP-17 in late 2011,andwemake the assumption that actionwill not ceasewith the expiry of the Kyoto Protocolfirst commitment period in 2012; however, very little time is left to get the appropriatepolicies in place.
© O
EC
D/IE
A, 2
011

210 World Energy Outlook 2011 - GLOBAL ENERGY TRENDS
Overview of trends in the 450 ScenarioBefore examining the main trends and implications of the 450 Scenario, it is important tohighlight briefly why the scenario is needed. It is because (as illustrated in Figure 6.2) neitherthe New Policies Scenario, our central scenario, nor the Current Policies Scenario puts us ona future trajectory for greenhouse-gas emissions that is consistent with limiting the increasein global temperature to no more than 2°C, the level climate scientists say is likely to avoidcatastrophic climate change. The 450 Scenario illustrates one plausible path to that objective.
Figure 6.2 " World energy-related CO2 emissions by scenario2
20
25
30
35
40
45
1990 2000 2010 2020 2030 2035
Gt
15 Gt
7 Gt71%
65%
33%
28%OECD
Non-OECD Current PoliciesScenario
450 Scenario
New PoliciesScenario
Note: There is also some abatement of inter-regional (bunker) emissionswhich, at less than 2%of the difference betweenscenarios, is not visible in the 2035 shares.
In line with practice in previous World Energy Outlooks, we have estimated greenhouse-gasemissionsfromallsourcesandforallscenarios(Table6.1).Wehavethenassessedtheconsequencesfor long-termconcentrationsand temperature increasesof suchemissions trajectories.
The New Policies Scenario, which takes account of both existing government policies anddeclared policy intentions (including cautious implementation of the Copenhagen Accord andCancun Agreements), would result in a level of emissions that is consistent with a long-termaverage temperature increase ofmore than 3.5°C (see Chapter 2 for energy trends in theNewPolicies Scenario). The outlook in the Current Policies Scenario, which assumes no change ingovernment policies andmeasures beyond those thatwere enacted or adopted bymid-2011,is considerablyworse, and is consistentwith a long term temperature increase of 6°Cormore.
The trends and implications of the 450 Scenario, a scenario based on achieving an emissionstrajectory consistentwith an average temperature increase of 2°C, are sometimes presentedhere against the baseline of the New Policies Scenario to help demonstrate what moreneeds to be done, particularly in terms of carbon abatement. The main changes to the450 Scenario in WEO-2011 relate to the policy assumptions, which reflect changes indomestic and international energy and climate policies (Box 6.2). Non-policy assumptionsrelating to energy and CO2 prices, GDP and population are presented in Chapter 1.
2. In 2009, energy-related CO2 emissions contributed 61% to total greenhouse-gas emissions.
© O
EC
D/IE
A, 2
011

Chapter 6 - Climate change and the 450 Scenario 211
6
Table 6.1 " World anthropogenic greenhouse-gas emissions by scenario(Gt CO2-eq)
NewPolicies Scenario Current Policies Scenario 450 Scenario
2009 2020 2035 2020 2035 2020 2035
CO2-energy 28.8 34.4 36.4 36.1 43.3 31.9 21.6
CO2-other 1.4 1.2 1.1 1.7 1.9 1.0 0.8
CH4 7.7 7.2 7.1 9.3 10.7 6.4 5.1
N2O 3.2 3.2 3.2 3.8 4.2 3.0 2.7
F-gases 0.7 0.7 0.9 1.4 2.3 0.5 0.5
LULUCF3 5.2 4.3 1.9 4.3 1.9 4.3 1.9
Total 47.1 50.9 50.6 56.5 64.4 47.1 32.6
Notes: F-gases include hydrofluorocarbons (HFCs), perfluorocarbons (PFCs) and sulphur hexafluoride (SF6) from severalsectors, mainly industry. CO2-other = CO2 from industrial processes; LULUCF = land use, land-use change and forestry.Peat emissions are not included.Source: IEA-OECD analysis using OECD Env-Linkages model.
Box 6.2 " Updates to the 450 Scenario policy framework 3
To reflect developments over the last year, we have updated the policy framework forthe 450 Scenario in the following ways:" OECD countries: In addition to the emissions trading schemes already in place in
the European Union and New Zealand, we assume that Australia introduces a CO2price from mid-2012 and an emissions trading scheme from 2015, while Japanand Korea introduce CO2 pricing in 2020. All other OECD countries are assumed tointroduce CO2 pricing by 2025, either through cap-and-trade schemes or carbontaxes. We assume that trading schemes are linked at a regional level from 2025,when CO2 prices start to converge (see Chapter 1 for CO2 price assumptions).
" Non-OECD countries: In addition to China (where a CO2 price covering all sectorsis in place in 2020), Brazil, Russia and South Africa are also assumed to implementdomestic CO2 pricing from 2020, either through cap-and-trade schemes or carbontaxes. All trading schemes have access to carbon offsets.
Under these assumptions, 51% of global energy-related CO2 emissions are covered by aCO2 price in 2020 in the 450 Scenario and 36% in 2035.As inWEO-2010, we assume that fossil-fuel subsidies are removed in all net-importingregions by 2020 (at the latest) and in all net-exporting regions by 2035 (at the latest),except for the Middle East where it is assumed that the average subsidisationrate declines to 20% by 2035. We also assume that fuel economy standards areimplemented in the transport sector, strict energy efficiency measures are adopted inthe buildings sector and that support for CCS and renewables is available.
3. Emissions from land use, land-use change and forestry are assumed to remain unchanged in all scenarios. Inprac!ce, ac!ons to reduce deforesta!on and land-use changewill reduce these emissions to varying degrees in differentscenarios, while increased use of biomass and biofuels will increase them.We assume that these two factors cancel oneanother out in all scenarios.
© O
EC
D/IE
A, 2
011

212 World Energy Outlook 2011 - GLOBAL ENERGY TRENDS
Primary energy demand in the 450 Scenario
In the 450 Scenario, global primary energy demand increases by 23% from 2009 to reachnearly 14 900 million tonnes of oil equivalent (Mtoe) in 2035 (Table 6.2). Energy demandincreases by an average of 1.4% per year to 2020, but this growth slows to 0.3% per yearfrom 2020 to 2035. This represents a significantly lower level of energy demand growththan in otherWEO-2011 scenarios and principally reflects greater efforts to improve energyefficiency.
The composition of energy demand changes considerably in the 450 Scenario, with the shareof fossil fuels in the energymix declining from81% in 2009 to 62% in 2035. Global demand forcoal peaks around 2016 and then declines by 2.7%per year on average, to reach 3 310milliontonnes of coal equivalent (Mtce) in 2035, 30% lower than 2009. In the 450 Scenario, globaldemand for oil also reaches a peak around 2016 before declining to 78.3 million barrels perday (mb/d) in 2035, 6.9% lower than 2009. This peak in global oil demand is brought aboutby additional policy intervention, such as stringent fuel economy standards for passengervehicles and strong support for alternative fuels. While oil continues to hold the largestshare of the energy mix throughout the Outlook period, its share drops from 33% in 2009 to25% in 2035. Natural gas demand grows steadily, at 1.2% per year through 2030, stabilisingthereafter and reaching almost 3 900 billion cubic metres (bcm) in 2035.
Table 6.2 " World primary energy demand by fuel in the 450 Scenario
Demand (Mtoe) Share
2009 2020 2035 2009 2020 2035
Coal 3 294 3 716 2 316 27% 26% 16%
Oil 3 987 4 182 3 671 33% 29% 25%
Gas 2 539 3 030 3 208 21% 21% 22%
Nuclear 703 973 1 664 6% 7% 11%
Hydro 280 391 520 2% 3% 3%
Biomass and waste 1 230 1 554 2 329 10% 11% 16%
Other renewables 99 339 1 161 1% 2% 8%
Total 12 132 14 185 14 870 100 % 100 % 100 %
In the 450 Scenario, the overall share of low-carbon fuels in the energy mix doubles from19% in 2009 to 38% in 2035. Demand for all low-carbon fuels grows strongly. Electricitygenerated from nuclear power increases by around 140% over the Outlook period, withalmost 70% of this increase being in non-OECD countries (for the implications of a slowernuclear expansion for the achievability of the 450 Scenario, see Chapter 12 and Box 6.4).China, in particular, sees strong growth in nuclear power, its share of primary energydemand growing from 1% in 2009 to 13% in 2035. Electricity generated from hydropowerincreases globally by an average of 2.4% per year over the Outlook period, to stand at just
© O
EC
D/IE
A, 2
011

Chapter 6 - Climate change and the 450 Scenario 213
6
over 6 000 terawatt hours (TWh) in 2035. In 2035, hydropower accounts for nearly 70% ofthe electricity generated in Latin America, almost 25% in Africa and nearly 20% in developingAsia. Global demand for biomass nearly doubles, reaching 2 330 Mtoe in 2035. Biomassfor power generation and biofuels in transport account for 44% and 29% of the growthrespectively. Other renewables, including wind, solar, geothermal and marine power, growmore than ten-fold over the Outlook period, albeit from a low base, and their share of theenergy mix grows from 1% in 2009 to 8% in 2035. Electricity generation from wind powerexperiences a large increase, going from 1% of global electricity generation in 2009 to 13%in 2035, with China, the European Union and the United States being the largest markets.Solar, meanwhile, increases its share from less than 1% in 2009 to nearly 7% in 2035. Thelargest proportional increases are seen in India, where solar reaches 8% of total electricitygeneration, and North Africa, where solar reaches almost a quarter of total generation.
Energy-related emissions and abatement4
In the 450 Scenario, energy-related CO2 emissions peak at around 32.6 Gt before 2020 andthen decline to 21.6 Gt by 2035, almost back to 1990 levels. Global CO2 emissions from coalpeak around 2016 and then decline at an ever more rapid pace to reach 5.4 Gt in 2035,about 40% of the level of 2010 (Figure 6.3). Global CO2 emissions from oil peak at 11.3 Gtaround 2016, before declining to 9.6 Gt in 2035. In contrast, CO2 emissions from natural gas,which emits the lowest level of CO2 of all fossil fuels when combusted, peak around 2025,after which they stabilise and then fall slightly as carbon capture and storage (CCS) for gas ismore widely deployed, reaching around 6.6 Gt in 2035, 8% higher than 2010. CO2 intensity– the amount of emissions per unit of GDP – declines at a rate of 3.5% per year from 2010to 2020, and 5.5% per year from 2020 to 2035. This rate is more than six-and-a-half timesgreater than the annual intensity improvements achieved in the last ten years.
Figure 6.3 " World energy-related CO2 emissions by fossil fuelin the 450 Scenario
0
3
6
9
12
15
2010 2015 2020 2025 2030 2035
Gt Coal
Oil
Gas
4. Abatement analysis in the 450 Scenario is calculated against a baseline of the New Policies Scenario, our centralscenario.
© O
EC
D/IE
A, 2
011

214 World Energy Outlook 2011 - GLOBAL ENERGY TRENDS
Energy efficiency measures account for half the cumulative CO2 abatement achieved in the450 Scenario, relative to the New Policies Scenario, over the Outlook period (Figure 6.4).The scale of this reduction underlines the importance of strong policy action to ensurethat potential efficiency gains are realised, in such forms as building standards, vehicle fueleconomy mandates and insistence on widespread use in industry of the best-availabletechnologies (Box 6.3). After the cheaper energy efficiency measures are exploited early inthe Outlook period, more expensive abatement options take a larger share, and the annualshare in abatement of efficiency measures falls to 44% in 2035. The increased adoption ofrenewable energy (including biofuels) is the second-most important source of CO2 abatement,relative to theNewPolicies Scenario, growing froma combined19% in 2020 to 25% in 2035, ora cumulative 24% over the period as awhole. Nuclear power grows rapidly in importance andaccounts for a cumulative 9%, while CCS also accounts for an increasing share, growing fromonly 3% of total abatement in 2020 to 22% in 2035, or a cumulative 18%.
Figure 6.4 " World energy-related CO2 emissions abatement in the450 Scenario relative to the New Policies Scenario
Gt
2020 2035
EfficiencyRenewablesBiofuels
Nuclear
72%17%2%
5%
44%21%4%
9%
3% 22%
Abatement
Total (Gt CO2)
CCS
20
22
24
26
28
30
32
34
36
38
2010 2015 2020 2025 2030 2035
New Policies Scenario
450 Scenario2.5 14.8
Box 6.3 " Reaping abatement through efficiency in the 450 Scenario
In the 450 Scenario, energy efficiency policies and measures are the cheapestabatement option available and the most important source of abatement. Efficiencyis responsible for half of cumulative global abatement relative to the New PoliciesScenario, or 73 Gt, between 2011 and 2035. The role of energy efficiency varies bycountry, according to the remaining potential and energy pricing. In OECD countries,despite the strong efficiency improvements already occurring in the New PoliciesScenario, efficiency in the 450 Scenario is responsible for almost 42% of abatementrelative to the New Policies Scenario. This share rises to 54% in non-OECD countries,where efficient energy-producing and -using technologies are in general less widelydeployed. This is due to both their higher costs relative to less efficient technologies,and because energy subsidies often present in these countries do not encourageenergy efficiency.
© O
EC
D/IE
A, 2
011

Chapter 6 - Climate change and the 450 Scenario 215
6
Efficiency policies are by far the largest source of abatement in end-use sectors relativeto the New Policies Scenario. They are responsible for 91% of buildings sector directabatement. To reap this abatement, we assume that strict energy efficiency standardsare set for new buildings, incentives are put in place for refurbishment of existingbuildings, and increasingly high efficiency standards are set for appliances, alongsidehigher electricity prices due to pricing of CO2 inmany countries. In the transport sector,where efficiency measures are responsible for 64% of cumulative abatement relativeto the New Policies Scenario over the projection period, we assume the widespreadimplementation of fuel economy standards for cars. We also assume that the level offuel taxes is adjusted tomaintain the price of oil-based fuels for vehicles (which wouldotherwise fall as demand falls) at a level similar to the Current Policies Scenario, so asto avoid a rebound effect which would lead tomore energy use. Efficiency gains in theindustry sector, which are responsible for 59% of abatement in this sector, are drivenby the implementation of CO2 pricing in OECD countries, China, Russia, Brazil andSouth Africa. In order to avoid international relocation (referred to as carbon leakage)in those sectors that could face it, we have assumed that countries not introducing CO2pricingwould enter into international sectoral agreements settingminimumefficiencystandards.Full energy efficiency potential will not be realised while end-user prices are too low.Fossil-fuel subsidies are amajor barrier to energy efficiency, as the artificial reductionin energy costs leads to higher than optimal demand for energy (see Chapter 14).Removal of fossil fuel subsidies in the 450 Scenario accounts for a cumulative 7.9 Gtof abatement from 2010 to 2035, relative to the New Policies Scenario.Energy efficiency measures have associated benefits, in terms of energy security andreduced local pollution. Despite this, and their sound economic rationale, energyefficiency measures are more difficult to implement than one might suppose. Forexample, landlordsmaynotbewilling to invest indouble-glazedwindows, as theydonotreap the benefits of reduced energy bills or a drivermay prefer the experience of drivinga more powerful car than a more efficient one. To help governments overcome suchobstacles, the IEA hasmade recommendations to theG-8 in 2006 and subsequent yearsto improve energy efficiency. The IEA estimates that if thesewere implemented globallywithout delay, they would result in annual CO2 savings of as much as 7.6 Gt by 2030 (or70%of the savingsbetween theNewPolicies and450Scenarios in that year). In 2011, theIEApublishedaprogress reporton the implementationof these recommendationsby IEAcountries, which found that 70% of the recommendations can be categorised as fully orpartially implemented, or that implementation is underway (IEA, 2011). To conformwiththe 450 trajectory, full implementation of those recommendationswould be required inall countries, coupledwith subsidies removal.
Policies aimed at reducing energy-related CO2 emissions in the 450 Scenario also have theeffect of reducing emissions of other air pollutants that have a negative impact on humanhealth and the environment, such as sulphur dioxide (SO2), nitrogen oxides (NOx) and
© O
EC
D/IE
A, 2
011

216 World Energy Outlook 2011 - GLOBAL ENERGY TRENDS
particulate matter (PM2.5) (Figure 6.5). By 2035, SO2 emissions are almost 42% lower than2009 levels in the 450 Scenario, a reduction of 38million tonnes (Mt). Most OECD countriesalready have sulphur control measures in place, so themajority of these reductions (25Mt)occur in other countries and result mainly from reduced fossil-fuel consumption. Globalemissions of NOx, which causes acidification of rain and ground-water and contributes toground-level ozone formation, are 27% lower in the 450 Scenario in 2035 than in 2009, as aresult of reduced use of coal and oil. Emissions of PM2.5, which together with NOx is themaincause of smog formation and the subsequent deterioration of urban air quality, are 10%lower globally by the end of theOutlook period. In OECD countries, PM2.5 emissions in 2035are almost identical to 2009 levels, as a result of greater use of biomass in the residentialsector; but emissions of PM2.5 in non-OECD countries decrease by 4 Mt over the Outlookperiod, with the largest reductions occurring in China and India.
Figure 6.5 " Emissions of major air pollutants by region in the 450 Scenario
0
20
40
60
80
100
2009 2020 2030 2035 2009 2020 2030 2035 2009 2020 2030 2035
Mt OECD
Non-OECD
Sulphur dioxide Nitrogen oxides Par`culate ma^er
Note: The base year of these projec!ons is 2005; 2009 is es!mated by IIASA.Source: IIASA (2011).
Regional energy-related CO2 emissions and abatementEnergy-related CO2 emissions in the OECD decline by 50% between 2009 and 2035 in the450 Scenario, to reach 6 Gt, and their share of global emissions falls from 42% in 2009 to28% in 2035. In 2035, the OECD accounts for 31% of global CO2 abatement, relative tothe New Policies Scenario, equal to 4.6 Gt. CO2 emissions in non-OECD countries fall by amuch smaller 9% over the Outlook period, to reach 14.3 Gt in 2035, though this is still asubstantial 10.0 Gt of CO2 abatement, relative to the New Policies Scenario, in 2035. Aroundthree-quarters of the global abatement of CO2 emissions in the 450 Scenario, relative to theNew Policies Scenario, occurs in six countries or regions, highlighting their importance inachieving an emissions trajectory consistent with 2°C (Figure 6.6).
China’s energy-relatedCO2 emissionspeakat around9.1Gt just before2020and thendecline tojust under 5.0 Gt in 2035, 28% lower than 2009. Despite this decline, China remains the largestCO2 emitter throughout the Outlook period (although in cumulative terms from 1900 to 2035,China’s energy-related emissions remain below those of both the United States and European
© O
EC
D/IE
A, 2
011

Chapter 6 - Climate change and the 450 Scenario 217
6
Union in the450Scenario).ChinaachievescumulativeCO2abatement in the450Scenario relativeto the New Policies Scenario of 49.5 Gt over the Outlook period, more than any other country,andaccounts for34%of theglobal cumulativeabatement.China’sCO2abatement comesmainlyfrom efficiencymeasures, which are responsible for half of the total, and from fuel-switching torenewables (including biofuels), which accounts for 18% of the total. Adoption of CCS also playsan important role,but ismoreprominent towards theendof theOutlookperiod. In2035,China isby far the largestmarket for renewables and electric vehicles (EVs). China’s per-capita emissionsincrease to exceed those of the European Union before 2020, but by the end of the projectionperiod strong policy actionmeans that they have fallen again and, at 3.6 tonnes per person, areonlymarginally higher than those of the EuropeanUnion, andwell below the level of Japan, theMiddle East, Russia and theUnited States (Figure 6.7).
Figure 6.6 " Energy-related CO2 emissions in the 450 Scenario andabatement relative to the New Policies Scenario by region,2009 and 2035
0
2
4
6
8
10
12
China UnitedStates
India EuropeanUnion
Russia Japan OtherOECD
Othernon-OECD
Gt CO2 abatementrela`ve to NewPolicies Scenario,2035
CO2 emissions,2035CO2 emissions,2009
In the 450 Scenario, energy-related CO2 emissions in the United States decline by 56%from 2009 to reach 2.3 Gt in 2035. A shift away from coal in favour of natural gas inpower generation is central to achieving these reductions. Demand for renewables growsthroughout the projection period, with generation from renewables increasing from around11% of total generation in 2009 to 17% in 2020 and then more sharply to 38% by 2035. Inthe transport sector, strong improvements in fuel economy, increased use of biofuels anda shift to electric, hybrid and plug-in hybrid electric vehicles (PHEVs) are also important. By2035, biofuels account for a quarter of fuel use in transport and electric vehicles and PHEVsaccount for 54% of passenger light-duty vehicle (PLDV) sales.
India’s energy-related CO2 emissions grow steadily to 2.2 Gt in 2035, 39% above the 2009level. India’s emissions-intensity target of improvements of 20% to 25% by 2020, comparedwith 2005, is exceeded in the 450 Scenario, mostly thanks to investment to generate offsetcredits (either from domestic sources for sale to other countries seeking to meet their ownemissions-reductions targets or by foreign companies and governments seeking to meet
© O
EC
D/IE
A, 2
011

218 World Energy Outlook 2011 - GLOBAL ENERGY TRENDS
their own obligations) and direct financial transfers from developed countries (withoutoffset credits). Efficiency and renewables play a big role in abatement. Government policiessuch as the new trading scheme for energy-efficiency or ‘white’ certificates in industryand feed-in tariffs for renewables (assumed to be implemented in all scenarios, but withthe most stringent targets in the 450 Scenario) are expected to be key instruments in thetransformation. India’s per-capita emissions remain very low at only 1.4 tonnes by 2035,43% below the global average, as lack of access to modern energy persists (Spotlight).
Figure 6.7 " Energy-related CO2 emissions per capita in the 450 Scenarioby region
0
3
6
9
12
15
18
2009 2015 2020 2025 2030 2035
Tonn
es United States
Japan
European Union
Russia
Middle East
China
India
World
In the European Union, energy-related CO2 emissions are 1.8 Gt in 2035, 49% below thelevel in 2009. Renewables account for 23% of primary energy demand in 2020, exceedingthe target of 20%.5Discussion is ongoing in the EuropeanUnion to define objectives for 2030and beyond on the path to an 80% cut in emissions by 2050, relative to 1990 levels, andstrong action is expected to continue in the region. Renewables continue to grow stronglyacross the period, reaching a share in the total energymix of 35% in 2030 and 43% by 2035.Biomass represents 60% of renewables use in the European Union in 2035, being widelyused for heating, power generation and transport. By 2035, wind represents the largestsingle share of installed electricity generating capacity, 29% higher than that of natural gas.CO2 emissions from new PLDVs reach on-road levels of 50 gCO2/km in 2035, 70% belowcurrent levels.
Russia’s energy-related CO2 emissions peak before 2015 in the 450 Scenario, falling fromtheir 2009 level of 1.5 Gt to 1.1 Gt in 2035. Russia’s target of reducing emissions by 25%,relative to 1990 levels, is exceeded in the energy sector in the 450 Scenario, where emissionsin 2020 are 29% below their 1990 level. This is partly due to the sharp decline whichoccurred in Russia’s emissions after the collapse of the Soviet Union, but policies to improveenergy efficiency and support the deployment of renewables and nuclear power also playa role. Later in the period, the implementation of a CO2 price encourages efficiency and
5. The European Union uses a slightly different methodology to calculate energy sta!s!cs than that of the IEA. These figuresare calculated using the EUmethodology.
© O
EC
D/IE
A, 2
011

Chapter 6 - Climate change and the 450 Scenario 219
6
strengthened support for low-carbon technologies also contributes. Per-capita emissions fallonly gradually across the period and, at 8.3 tonnes per person in 2035, they are among thehighest of any country, over three-times the global average (see Chapter 9).6
Japanese energy-related CO2 emissions reach around 520 Mt in 2035 in the 450 Scenario,less than half the 2009 level and 43%below the level in the NewPolicies Scenario.Measuresto drive efficiency improvements are the biggest source of this abatement, delivering nearly
6. Since much of the popula!on without access to modern energy sources relies on kerosene for ligh!ng and cooking atpresent, the baseline against which the change in emissions as a result of switching to electricity use is not zero-emissions.Although we cannot quan!fy this effect, the net result is to reduce the addi!onal emissions resul!ng from addi!onal gridconnec!ons.
The International Year of Sustainable Energy for All: can universalaccess be achieved without increasing CO2 emissions?
2012 has been named the “International Year of Sustainable Energy for All” by theUnited Nations General Assembly. This year’s Outlook, again addresses the issue ofenergy poverty, focussing on financing in the Energy for All Case (Chapter 13). But theanalysis in that chapter is seen in the context of the New Policies Scenario: it is valuablealso toexamine theadditional costs imposedbyattempting tomeet asmuchaspossibleof theelectricityneedsof thepoor through low-carbonsources.6Today1.3billionpeoplelack access to electricity, 84% of whom live in rural areas. Electrification of the urbanpoor through low-carbon sources would be extremely difficult, as, broadly speaking,generation for the national grids in poor countries is largely high-carbon throughoutour projection period, and it is unrealistic to assume all new electrificationwould comeentirely from low-carbon options due to the high cost. In fact, it is also unnecessary, asclimate goals can be achieved through abatement in countries other than the poorest.However, rural electrification offers more scope for low-carbon solutions andthey are indeed often more suitable than conventional sources to meet off-griddemand (due, for example, to cost-effectiveness at small scale). Achieving universalrural electrification by 2030 with only low-carbon off-grid options, such as solarphotovoltaics, small and mini-hydro, biomass, and wind, would require additionalgeneration from these sources of 670 TWh in 2030.The cumulative investment needed to bring this low-carbon electricity to all ruralpopulations is estimated to be $586 billion between 2010 and 2030. About 60% ofthis investment is needed in sub-Saharan Africa and over 20% in India. In our Energyfor All Case, we estimate the costs of rural electrification with a mix of fossil-fuel-based grid connection and off-grid options to be around $480 billion between 2010and 2030. In that case, total additional CO2 emissions amount to 240Mt in 2030, withrural electrification accounting for around 38% of those additional CO2 emissions.For an extra $5 billion a year, rural electrification could be achievedwhile saving over90Mt of CO2 emissions in 2030.
S P O T L I G H T
© O
EC
D/IE
A, 2
011

220 World Energy Outlook 2011 - GLOBAL ENERGY TRENDS
40% of cumulative abatement, relative to the New Policies Scenario. Renewables accountfor almost a quarter of abatement, as their share in generation increases to 31% by 2035,and CCS is also important, at 19% of cumulative abatement. Despite a fall in its share in theearly years of the period, nuclear power remains very significant in the Japanese energymix,accounting for 17% of abatement relative to the New Policies Scenario and reaching 46% ofelectricity generation by 2035.
Ten policies account for 42% of abatement, relative to the New Policies Scenario, in 2020 and54% in2035 (Table 6.3). Thesepolicies are implemented in just five regions– theUnited States,the European Union, China, India and Russia. Rapid and stringent implementation of policiesin these countries is vital to the success of the 450 Scenario. Chinese power generation is, dueto its sheer scale and reliance on coal, the largest source of abatement in both 2020 and 2035,with Chinese industry not far behind. Abatement in these sectors partly reflects governmentpolicies to rebalance the economy, but also ambitious capacity targets for low-carbon energysources. Economy-wide CO2 pricing, coming into effect from 2020, drives further abatementlater in the period. CO2 pricing in the United States, European Union and Russia also plays animportant role by 2035, with reductions achieved in the power and industry sectors, bothdomestically and through the purchase of international offset credits.
Sectoral emissions and abatement
The power sector, currently the source of 41% of global energy-related CO2 emissions, isthe biggest source of abatement, in the 450 Scenario relative to the New Policies Scenario.Emission reductions due to fuel-switching to less carbon-intensive generation, powersector efficiency and reduced electricity demand reach a cumulative 99.0 Gt by 2035, ortwo-thirds of total abatement fromall sectors (Figure 6.8). Abatement frompower generationis so substantial that by 2035 transport,which currently emits only just over half of the amountthat is emitted by power generation, becomes the largest sectoral source of emissions.Abatement from buildings and industry, where there is generally less low-cost abatementpotential, accounts for 5% and 10% each of total cumulative abatement from all sectors.
Figure 6.8 " World energy-related CO2 abatement by sector in the450 Scenario compared with the New Policies Scenario
-15
-12
-9
-6
-3
02015 2020 2025 2030 2035
Gt
Power genera`on
Reduced electricitydemand
Transport
Industry
Buildings
Other sectors
© O
EC
D/IE
A, 2
011

Chapter 6 - Climate change and the 450 Scenario 221
6
The power generation sector plays a crucial role in the 450 Scenario, with emissions decliningby 60% from 2009 levels to reach 4.8 Gt in 2035. The sector’s share of total energy-relatedemissions falls from 41% in 2009 to 22% by the end of theOutlook period. The 450 Scenarioreflects a strong policy push towards low-carbon technologies in power generation,resulting in their share of global electricity generation increasing from one-third in 2009 tothree-quarters in 2035. This transformation occurs mainly thanks to a combination of:
! The introductionof CO2pricing in allOECDcountries and severalmajor non-OECDcountries.! Enabling policies for deployment of low-emissions technologies, including nuclear andCCS.! Higher support for renewables-based electricity generation technologies.
Of the total cumulative global abatement in power generation, relative to the NewPolicies Scenario, around 66 Gt comes from power plant efficiency and fuel-switching tolower-carbon energy sources and technologies, while the remaining 33 Gt of savings areattributable to reduced demand for electricity from final end-use sectors (Figure 6.9).
Figure 6.9 " Change in world energy-related CO2 emissions from the powergeneration sector in the 450 Scenario compared with the NewPolicies Scenario
-10
-8
-6
-4
-2
02010 2015 2020 2025 2030 2035
Gt
Reduced demand
Renewables
Nuclear
CCS
More efficient use offossil-fuel plants
In the 450 Scenario, emissions from transport peak before 2020 at around 7.3 Gt and thengradually decline to reach 6.6 Gt in 2035. Improved fuel efficiency is the most significantfactor in reducing emissions, accounting for more than half of the reduction observed in2035, relative to the New Policies Scenario. In the 450 Scenario, electric vehicles and plug-inhybrids account for 6% of total light-duty vehicles sales in 2020 (up from less than 0.01%today) and this share increases to 37% by 2035 (see Chapter 3 for more on electric vehiclesand hybrids). Cumulatively, electric vehicles and plug-in hybrids constitute 14% of all vehiclesales during the Outlook period. Biofuels are the second-largest contributor to transportemissions savings in the 450 Scenario, with their share in total transport fuels increasingfrom about 2% in 2009 to 13% by 2035, or 7.8 mb/d. In 2035, more than 60% of all biofuelsconsumed are advanced biofuels derived from ligno-cellulosic or other non-food crops,highlighting the need for early investment in research and development to bring these fuelsto commercial viability.
© O
EC
D/IE
A, 2
011

222
World
EnergyO
utlook2011
-GLO
BALEN
ERGY
TREND
S
Table 6.3 " Top ten sources of abatement in the 450 Scenario relative to the New Policies Scenario by policy area
2020 2035
Sector Measures Abatement(Mt CO2)
Sector Measures Abatement(Mt CO2)
China Powergeneration
More ambitious government targets for low-carbon generation, including wind, nuclearand solar.
198 China Powergeneration
Domestic CO2 price covering all sectors from 2020.Support to renewables and nuclear. Deployment ofCCS.
2 477
China Industry Rebalancing of the economy and efficiencyimprovements.
175 United States Powergeneration
Domestic CO2 price from 2020. Extended support torenewables and nuclear.
1 344
China Buildings 50% of building stock has improvedinsulation to reduce energy consumptionper unit area by 65% vs. 1980 level. 50% ofappliances stock meets highest-availableefficiency standards.
143 China Industry Domestic CO2 price from 2020. Rebalancing of theeconomy and use of CCS.
929
India Powergeneration
Feed-in tariff to reach 15% of renewablesinstalled capacity by 2020. Support andregulation for more efficient coal.
94 China Buildings Domestic CO2 price from 2020. More stringentimplementation of standards. Mandatory energyefficiency labels. 100% of buildings stock hasimproved insulation to reduce energy consumptionper unit area by 65% vs. 1980 level.
712
European Union Buildings Enhanced efficiency standards for existingbuildings. Zero-carbon footprint for all newbuildings as of 2018.
84 India Powergeneration
Support to renewables, nuclear and efficient coal.International offset projects.
680
© OECD/IEA, 2011

Chapter6-Clim
atechange
andthe
450Scenario
22
3
6
Table 6.3 " Top ten sources of abatement in the 450 Scenario relative to the New Policies Scenario by policy area (continued)
2020 2035
Sector Measures Abatement(Mt CO2)
Sector Measures Abatement(Mt CO2)
European Union Powergeneration
EU Emissions Trading System. Support forrenewables and CCS.
81 European Union Powergeneration
EU Emissions Trading System. Extended support torenewables and CCS.
371
India Industry Efficiency improvements in iron, steel andcement due to international offset projects.
73 United States Transport(road)
Passenger light-duty vehicle fuel economy standards,biofuels incentives and incentives for natural gas usein trucks.
358
United States Buildings More stringent mandatory building codes.Extension of energy efficiency grants. Zero-energy buildings initiative.
61 Russia Powergeneration
CO2 pricing implemented from 2020. Support fornuclear power and renewables.
293
India Buildings Mandatory energy conservation standardsand labelling requirements for all equipmentand appliances. Increased penetration ofenergy efficient lighting.
54 United States Buildings More stringent mandatory building codes. Extensionof energy efficiency grants. Zero-energy buildingsinitiative.
277
China Transport(road)
More stringent on-road emissions targetsfor PLDVs to gradually reach 100 gCO2/km by2035. Enhanced support to alternative fuels.
42 European Union Buildings Zero-carbon footprint for all new buildings as of2018.
241
Total 1 005 7 682
Share of total abatement 42% 54%
© OECD/IEA, 2011

224 World Energy Outlook 2011 - GLOBAL ENERGY TRENDS
In the industry sector, energy demand in the 450 Scenario continues to increase throughoutthe Outlook period, with average growth of 1.2% per year. This slowdown relative to theNew Policies Scenario is accompanied by fuel-switching away from coal and oil and towardselectricity (generated in an increasingly decarbonised power sector) and renewables. As aresult, direct emissions from the industry sector decline by 0.2% per year over the Outlookperiod, to reach 4.7 Gt in 2035.
Global direct emissions from the buildings sector peak in the 450 Scenario at 3.0 Gt around2012 and then decline gradually to 2.6 Gt in 2035. The emissions profile in the buildingssector is influenced heavily by developments in OECD countries, where emissions areexpected to peak in 2010 and decline by 1.1% per year thereafter. In non-OECD countries,emissions do not start to decline in this sector until around 2020, and then fall on average by0.2% per year. This is because energy demand in the sector in non-OECD countries is undercountervailing upward pressure from increasing population, increasing average incomes(driving residential energy demand) and the shift towards tertiary sectors in the growingeconomies (driving up services sector demand).
Investment in the 450 ScenarioThe global energy sector will require very substantial investment over the next 25 years,regardless of the path followed; the total investment differs by scenario, but totalinvestment in energy supply is much larger than the differences between scenarios. In the450 Scenario, investment in energy supply, including in coal, oil and gas extraction andtransportation, biofuels production and electricity generation, transmission and distribution,amounts to a cumulative total of $36.5 trillion (in year-2010 dollars) from 2011 to 2035.This is around 4% less than is required in the New Policies Scenario, with investment infossil-fuel supply in the 450 Scenario falling by around $4.6 trillion in total compared withthe New Policies Scenario. This supply-side reduction in investment relative to the NewPolicies Scenario is, however, more than offset by an increase in investment in low-carbontechnologies and efficiencymeasures, both on the supply side and on the demand side. Thisincludes additional investment by consumers in more energy-efficient and lower-emittingvehicles and appliances. Overall, additional investment in low-carbon technologies andenergy efficiency in the 450 Scenario, relative to the New Policies Scenario, amounts to acumulative $15.2 trillion over the period (Figure 6.10).
Average annual investment in the 450 Scenario, over and above that needed in the NewPolicies Scenario, grows fast over time, from just over $160 billion per year in the decade2011 to 2020 to $1.1 trillion annually by the end of the Outlook period. The increase is dueto the fact that the abatement achieved in 450 Scenario up to 2020, evenwith action arisingfrom the Cancun Agreements, leaves much to be accomplished in the later period and ata higher capital cost per unit of CO2 saved. As a result, only 11% (or $1.6 trillion) of totaladditional investment is incurred before 2020.
Of the cumulative additional investment in the 450 Scenario relative to the New PoliciesScenario, $6.3 trillion, or over 40%, is needed in the transport sector. Most of this is directedtowards the purchase of more efficient or alternative vehicles. The building sector is thesecond-largest recipient of additional investment, amounting to $4.1 trillion (or 27% of
© O
EC
D/IE
A, 2
011

Chapter 6 - Climate change and the 450 Scenario 225
6
the total).7 Refurbishment of buildings in OECD countries and solar PV installations accountfor most of the investment. The decarbonisation of the power sector requires a net additional$3.1 trillion. About two-thirds of total investment in electricity generation goes to renewable-based technologies, 14% to nuclear, 8% to plants fitted with CCS and 12% to fossil-fuel plantsnot fittedwithCCS. Industry invests anadditional $1.1 trillion, almost a thirdof it directed toCCS.
Figure 6.10 " Cumulative energy sector investment by scenario, 2011-2035
0
10
20
30
40
New PoliciesScenario
450 Scenario
Trillio
ndollars(20
10)
Total supply side investment
450 Scenario
Trillio
ndollars(20
10)Industry
Buildings
Transport
Biofuels
Power plants
Coal
Gas
Oil
Power T&D
Change in investmentrela`ve to New Policies Scenario
-6
-3
0
3
6
9
12
15
18
Notes: Investment in solar PV in buildings is a%ributed to power plants in supply-side investment. Elsewhere, it isa%ributed to the buildings sector. T&D = transmission and distribu!on.
Within power generation, there is some avoided investment in electricity transmission anddistribution lines, totalling about $930 billion. The lower level of electricity demand in the450 Scenario – achieved through the $2.7 trillion investment made in buildings and industry inimprovingefficiencyofelectricityend-use– leads toa reduction ingrid infrastructure investmentof around $1.1 trillion. The increased usage of renewable energy, which requires greaterinvestment in transmission and distribution than other energy sources (see Chapter 5), addsnearly $165 billion in the 450 Scenario, partially offsetting the savings due to lower demand.
Mirroring their importance in global abatement relative to the New Policies Scenario, Chinaand the United States need the largest additional investment – $3.2 trillion and $2.8 trillionrespectively. Non-OECD countries account for almost half of the total cumulative additionalinvestment relative to the New Policies Scenario, with their share increasing towards theend of the period in line with their share of abatement.
Other spending in the 450 Scenario: fuel costs and subsidies
The changes in the energy sector to achieve the 450 Scenario have an impact on fuelexpenditure, relative to the New Policies Scenario, as lower international fuel prices interact
7. It is important to note that this investment finances not only the direct abatement from the buildings sector reportedin Figure 6.8, but also a propor!on of the indirect abatement through electricity demand reduc!on due to investment inmore efficient end-use equipment.
© O
EC
D/IE
A, 2
011

226 World Energy Outlook 2011 - GLOBAL ENERGY TRENDS
with policies aimed at addressing climate change, such as carbon pricing, fossil-fuel subsidyremoval and support for low-carbonenergy sources, and the resulting changes in the structureof demand. These various forces act together to varyingdegrees toproducediffering effects onconsumer fuel expenditure in different regions. At the global level, the net effect is a reductionin consumers’ expenditure on energy, with total cumulative savings, relative to the NewPolicies Scenario, of $690 billion (in year-2010 dollars) over the period 2011 to 2035.
However, not all regions see savings. Lower international fuel prices and lower demandmight be expected, other things being equal, to lead to lower fuel expenditure byconsumers. But, a number of factors cut across this. We assume that end-use fuel-pricesin the transport sector are kept at a level similar to the Current Policies Scenario throughtaxation, in order to avoid a rebound effect, as lower demand would otherwise drive end-use prices down, thus discouraging efficient behavior. This reduces potential savings toconsumers (although increasing importing countries’ governments’ revenues). Pricing ofCO2, which is intended to reduce demand for carbon-intensive technologies, is assumedto be passed onto consumers, increasing fuel costs relative to the New Policies Scenario.At the same time, removal of fossil-fuel subsidies also increases expenditure by end-users(although simultaneously reducing expenditure by governments). In the Middle East, forexample, expenditure on energy is a cumulative $2.5 trillion higher in the 450 Scenariothan in the New Policies Scenario – subsidies on fossil fuels amount to $4 trillion across theperiod, around $2 trillion less than in the New Policies Scenario. China and India, on theother hand, see total combined savings on energy costs of more than $1.4 trillion over theOutlook period, $840 billion in China and $600 billion in India.
Global spending on fossil-fuel subsidies is a cumulative $6.3 trillion over the period 2011 to2035 in the 450 Scenario, $4.1 trillion lower than in the New Policies Scenario. Subsidies forrenewables, meanwhile, are a cumulative $550 billion higher in the 450 Scenario than in theNew Policies Scenario. Again, there is significant regional variation, with China spending acumulative $366 billionmore on renewable-energy subsidies in the 450 Scenario, comparedwith the New Policies Scenario, and making around $62 billion in savings on fossil-fuelsubsidies, while Russia spends around $28 billion more on renewables subsidies over theperiod and saves just over $340 billion on fossil-fuel subsidies. As mentioned, the greatestchange is in the Middle East, with an additional $39 billion spent on renewables subsidies,far outweighed by the $2 trillion reduction in fossil-fuel subsidies.
Benefits of the 450 Scenario
The 450 Scenario, apart from leading to lower adaptation costs than the other scenariospresented inWEO-2011 (see, for example, Parry et al., 2009; IPCC, 2007b; Stern, 2006), givesrise to a number of other benefits, notably in terms of import bills, local pollutants and healthimpacts. In the 450 Scenario, crude oil, steam coal and natural gas import prices are muchlower than in the other scenarios, reflecting lower demand. In real terms, the IEA crude oilimport price needed to balance supply and demand reaches $97/barrel (in year-2010 dollars)in 2020 and remains stable at that level thereafter. The oil price in 2035 is $23/barrel lowerthan in the New Policies Scenario. Likewise coal and natural gas prices aremuch lower in the450 Scenario than in theNewPolicies Scenario, with the greatest change being to coal prices,
© O
EC
D/IE
A, 2
011

Chapter 6 - Climate change and the 450 Scenario 227
6
which by 2035 are $42/tonne, or 38%, lower in the 450 Scenario (Table 6.4). Lower demandfor oil and gas are also likely to reduce uncertainty in upstream investment and diminish thevolatility in oil and gas markets compared with the New Policies Scenario8 (see Chapter 3for the implications of deferring investment in oil and gas), while energy security is alsoenhanced by diversification of the energy mix which reduces import dependence.
Table 6.4 " Fossil-fuel import prices in the 450 Scenario (2010 dollars per unit)
Unit 2010 2020 2035 Change fromNPS in 2035
IEA crude oil imports barrel 78.1 97.0 97.0 -19%
OECD steam coal imports tonne 99.2 93.3 67.7 -38%
Natural gas - Europe MBtu 7.5 9.8 9.4 -22%
Natural gas - Pacific MBtu 11.0 12.0 12.1 -15%
Natural gas - North America MBtu 4.4 6.5 7.8 -8%
Note: NPS = New Policies Scenario.
Lower oil-import requirements and lower international oil prices significantly reduce importdependence, and reduce oil-import bills in the 450 Scenario, compared with the NewPolicies Scenario. Over the whole period, the five-largest importers – China, the EuropeanUnion, the United States, India and Japan – collectively spend around $7.4 trillion, or morethan one-fifth, less than in the New Policies Scenario, while all importing countries as agroup spend $9.1 trillion less. These savings increase over time as the impact of efficiencyand diversificationmeasures grows and as the difference between oil prices in the differentscenarios increases.
In some OECD importing countries, oil-import bills are actually lower in 2035 than in 2010.The oil-import bill in the United States peaks in 2014, at around $350 billion, and declines tosome $130 billion in 2035, less than half 2010 levels. The savings for the United States arealso very large relative to the import bill in theNewPolicies Scenario –more than $140 billionin 2035. Among OECD countries, the proportionate impact on the import bill is highest inthe United States, but the reduction in other countries is also marked (Figure 6.11). In theEuropean Union, import bills peak around 2015, at $340 billion, and decline steadily to justover $230 billion in 2035, again lower than the 2010 level, while import bills in Japan in the450 Scenario are also well below their 2010 level by 2035. Nonetheless, the revenues of oil-exporting countries are projected to grow in the 450 Scenario: andOPEC countries’ revenuesare projected to be almost three-times higher in the period 2011 to 2035 than they werein the period 1985 to 2010, at a cumulative $25 trillion over the period 2011 to 2035. Thiscompares to cumulative revenues of $32 trillion in the New Policies Scenario.
8. Lower levels of interna!onal fossil-fuel prices do not always imply lower end-user prices compared to theNewPoliciesScenario. Subsidies removal, the introduc!on of CO2 prices, and the shi" towards more costly electricity genera!onop!ons tend to increase end-user prices, cancelling or tempering the decline in interna!onal prices at the end-user level.
© O
EC
D/IE
A, 2
011

228 World Energy Outlook 2011 - GLOBAL ENERGY TRENDS
Figure 6.11 " Oil-import bills in selected regions by scenario
0
100
200
300
400
500
600
Japan United States India European Union China
Billiond
ollars(2010) 2010
2035: New PoliciesScenario
2035: 450 Scenario
Lower fossil-fuel consumption in the 450 Scenario reduces local pollution. Noxious emissionsfrom the burning of fossil fuels, and particularly fine particles (or particulate matter) havea significant health impact – exposure to these emissions induces increased respiratorydisease and shortens life expectancy. A commonly used measure is the number of yearsof life lost, obtained by multiplying the number of people exposed to the pollutants byits impact in terms of the reduced life expectancy, measured in years. On this basis, fineparticles caused the loss of about 1.3 billion life years in China and 570 million in India in2009. In the 450 Scenario, by 2035 this number drops by 18% in China. In India it increasesby 81%, but is still 21% lower than in the New Policies Scenario. This has implicationsfor health-related costs, often borne by government sources, as well as for productivity(IIASA, 2011). The global cost of pollution control, including of particulate matter, reachesaround $430 billion in 2035, or just over $125 billion lower than the cost in the same yearin the New Policies Scenario. Over the period as a whole, this represents a saving of almost$1.3 trillion, relative to the New Policies Scenario (Table 6.5).
Table 6.5 " Cost of pollution control by region and scenario ($2010 billion)
NewPolicies Scenario Current Policies Scenario 450 Scenario
2010 2020 2035 2020 2035 2020 2035
United States 68 86 91 90 100 85 67
European Union 77 107 109 110 121 103 92
Other OECD 51 66 69 67 75 63 52
Russia 7 13 17 13 18 12 13
China 39 87 115 90 133 82 86
India 5 11 28 12 31 11 21
Middle East 10 20 29 21 34 19 22
Other non-OECD 40 74 98 76 106 69 75
World 296 465 555 479 617 443 428
Source: IIASA (2011).
© O
EC
D/IE
A, 2
011

Chapter 6 - Climate change and the 450 Scenario 229
6
Implications of delayed actionThis section discusses the implications for the energy sector if action to intensify policymeasures and deploy low-carbon technology is delayed, despite adherence to the long-termobjective of limiting temperature increase to 2°C. The present slow pace of internationalnegotiations towards a global architecture to tackle emissions makes it important tounderstand the implications of each year of delay. Most important is the way investmentin the built-in infrastructure of energy assets locks in the situation for years to come.Lock-in is a problem that is widely discussed, but not yet widely understood, althoughincreasing attention is being paid to quantification of this issue.9 Through a sector-by-sectoranalysis, covering power generation, industry, transport and buildings, we have quantifiedthe emissions projected to come from the energy infrastructure now existing and thatunder construction – the lock-in.10 For the first time, we present a quantification of thecosts and implications of delaying action. We then analyse the implications for achievinga 450 Scenario of a ten-year delay in the roll-out of CCS. Both analyses point to a clearconclusion: actions being currently taken are insufficient, costs are rising and time is runningout very fast.
Lock-in in the energy sector
In the 450 Scenario presented so far, we assume that an international climate agreementis reached quickly and that governments vigorously enact policies – such as CO2 pricing andsupport for low-carbon technologies – which are strong enough to steer the energy sectoronto a steep decarbonisation path. This new, intensive action is implemented as early as2013 in all OECD countries andwithin this decade for other large emitters. Pricing emissions,as in the 450 Scenario, leads to rapid transformation across all sectors and, in some sectors –like the power and industry sectors – the CO2 price leads to actions such as early retirement,refurbishment, or retrofitting, which are economic under the new circumstances.
The current pace of international negotiations is unlikely to produce an early internationalagreement, and only a few countries have put in place a clear framework adequate toincentivise investment in low-carbon infrastructure. In this situation, investment decisionswill tend to reinforce a carbon-intensive infrastructure which, when CO2 and other negativeexternalities are not priced, is often cheaper. The result will be a higher level of emissionsfrom existing infrastructure over a longer period than the 450 Scenario suggests.
Emissions that will come from the infrastructure that is currently in place or underconstruction can be thought of as “locked-in”, because they cannot be avoided withoutstringent policy intervention to force premature retirements, costly refurbishment andretrofitting or letting capacity lie idle to become economic. They are not unavoidable, butavoiding them does not make economic sense in the current policy context. To examinethe consequences, we pose the following questions, sector-by-sector: What quantity of
9. A quan!fica!on of the extent of lock-in in the energy sector (but over a different !me period and under differingassump!ons) has been undertaken by Davis et al., (2010).10. The analysis also covers emissions from fossil-fuel combus!on in the agriculture, non-energy use and other energysectors.
© O
EC
D/IE
A, 2
011

230 World Energy Outlook 2011 - GLOBAL ENERGY TRENDS
emissions is currently locked-in by existing infrastructure? What quantity of additionalemissions will be locked-in for every year of delay in agreeing to an international climateframework?What are the additional costs of this delay?
A country-by-country and sector-by-sector analysis of the capital stock in place and underconstruction shows that energy-related CO2 emissions of 23.9 Gt in 2020 (or nearly 80%of 2010 emissions) come from power plants, buildings, factories and vehicles already inplace or under construction today (Figure 6.12). Looking further out, the options are, ofcourse, more open, but still notably constrained: by 2035, this figure is 16.1 Gt (or 53% of2010 emissions). This is under the assumption that over the Outlook period the existinginfrastructure is allowed to operate as in the New Policies Scenario, i.e. in the absence ofstrong new government interventions stemming from an international climate agreement.11That is, once built, infrastructure is allowed to operate for the term of its economic lifeaccording to the conditions prevailing in place in the New Policies Scenario.
Cumulative emissions over the Outlook period from infrastructure in place and underconstruction amount tomore than 590Gt. This is 80%of the total emissions from the energysector over the Outlook period consistent with a 450 trajectory. Installations in non-OECDcountries account for 57% of these locked-in emissions.
Figure 6.12 " World energy-related CO2 emissions from locked-in infrastructurein 2010 and room for manoeuvre to achieve the 450 Scenario
0
5
10
15
20
25
30
35
2010 2015 2020 2025 2030 2035
Gt Room for manoeuvreto achieve 450 Scenario
Locked-in emissions:
Other
Buildings
Transport
Industry
Power genera`on
If infrastructure investments continue in line with the New Policies Scenario beyond today,the picture would look even bleaker. If strong action to move away from the New PoliciesScenario trajectory were not implemented until 2015, and all infrastructure in place orunder construction in the New Policies Scenario at that point were allowed to operate as inthat scenario, emissions from locked-in infrastructure would represent almost 95% of the
11. This means that policy interven!ons going beyond what is assumed in the New Policies Scenario could reduce theseemissions. For instance, changes inCO2prices, early re!rements, retrofi$ng, refurbishment,mothballing, fuel-switching (e.g.from coal to biomass), among others, would reduce the actual emissions below the projected level. Some of these ac!onswould be expected to take place under the 450 Scenario, leaving greater space for emissions from newer, more efficientinfrastructure. All analysis of locked-in emissions in this sec!on is based on the assump!ons of the New Policies Scenario.
© O
EC
D/IE
A, 2
011

Chapter 6 - Climate change and the 450 Scenario 231
6
cumulative budgeted emissions of the 450 Scenario to 2035. If action were to be delayeduntil 2017, all the available headroom for emissions through 2035 would be taken up bythe plants and equipment already existing or under construction at that date (Figure 6.13).Expressed another way, no new investment could be made after 2017 in new powergeneration, industrial capacity additions, newbuildings, passenger and commercial vehicles,appliances, space heating and agricultural equipment unless it were zero-carbon. Any newemitting plant or facility installed after this point would require the early retirement of someexisting plant or facility to create headroom for the new investment.12
Everyyearofdelayof introductionofaglobal frameworkwith thesufficientlypowerful economicincentives to direct investment to follow the path of the 450 Scenario has two consequences:
! It increases the amount of capital stock that will need to be retired early, mostly in thepower and industry sectors.
! It limits dramatically the amount of more carbon-intensive infrastructure that can beadded in the future.
Figure 6.13 " World energy-related CO2 emissions in the 450 Scenario andfrom locked-in infrastructure in 2010 and with delay
0
5
10
15
20
25
30
35
40
2010 2020 2025 20352015 2030
Gt Delay un`l 2020
Delay un`l 2017
Delay un`l 2015
No delay
450 Scenario totalemissions
The power generation and industry sectors have the greatest lock-in, due to the long lifetimeof power plants and industrial installations.13 They account respectively for 50% and 21%of cumulative locked-in emissions. The high-carbon infrastructure already in place or underconstruction will continue to be a source of emissions far into the future unless thereare very strong economic incentives for retrofitting or early retirement. Even once suchincentives are in place, there would be some lag before there would be an impact on powersector emissions, both because such policies take time to implement and because fossil fuel-fired plants under construction would still come on-stream as planned.
12. This is in addi!on to the early re!rements necessary in the 450 Scenario even without delay.13. This analysis focuses on direct emissions from end-use sectors. Indirect emissions due to electricity demand in end-use sectors are a%ributed to the power sector, since they are determined by the genera!onmix. This reduces the rate oflock-in a%ributed to the end-use sectors, par!cularly the buildings sector.
© O
EC
D/IE
A, 2
011

232 World Energy Outlook 2011 - GLOBAL ENERGY TRENDS
If power plants were allowed to operate as in the New Policies Scenario, we estimate thatin 2020 around 12.1 Gt of emissions would come from power plants that are already inplace today or are currently under construction. The level of locked-in emissions would fallto 8.8 Gt by 2035. Cumulative emissions over the Outlook period, just from power plantsexisting and under construction today, would exceed all the budgeted emissions for thepower sector in the 450 Scenario. Delaying the implementation of stringent new measuresto 2015 would make returning to a 450 trajectory after that date more costly and difficult,as emissions in the early part of the period would exceed the 450 trajectory laid out inthis Outlook, necessitating greater abatement later on, meaning even more retirementsof power plants before the end of their economic lifetime (Figure 6.14). In order to regaina trajectory consistent with a long-term atmospheric stabilisation at 450 ppm CO2-eq,investors would have to retire early or retrofit plants emitting 5.7 Gt by 2035 – around 45%of the world’s fossil-fuel power generation capacity.
Figure 6.14 " World energy-related CO2 emissions in the 450 Scenario andfrom locked-in infrastructure in 2010 and with delay to 2015in the power sector
0
2
4
6
8
10
12
14
16
2010 2020 2030
Gt Locked-in emissions,delay to 2015:
Non-OECD
OECD
Locked-in emissions,no delay:
OECD
Non-OECD
Emissions frompower genera`on,450 Scenario
2015 2025 2035
Globally, coal plants account for nearly three-quarters of the emissions locked-into thepower sector, and gas-fired power plants for most of the remainder. Installations in non-OECD countries account for 67% of these locked-in emissions. Annual locked-in emissionsin China are 4.0 Gt in 2020 (20% above 2009 levels) and they decline slightly to 3.2 Gt in2035 (or 96% of current emissions). The profile is similar for India – a country, like China,where most of the recent capacity additions have been coal-based – though at an absolutelevel around one-quarter that of China. Although the efficiency of plants recently installed,particularly in China, is typically higher than the average level of new installations in theadvanced economies, the quantity of emissions projected to come from these new plantsover the projection period is nonetheless high because of the scale of recent construction.Plants in non-OECD countries are relatively young as most have been built to respond toheightened demand growth during the past two decades. About 63% of installed fossil-fuelcapacity in those countries is less than 20 years old, somost of it will not be reaching the end
© O
EC
D/IE
A, 2
011

Chapter 6 - Climate change and the 450 Scenario 233
6
of its technical lifetime before 2035. Reflecting the rate of growth of electricity demand inthese countries, 330 GW of fossil-fuel plants are currently under construction. In contrast,plants in OECD countries are ageing, particularly the coal plants that have long providedbaseload generating capacity. About 30%of the installed fossil-fuel capacity in 2010 in OECDcountries will be approaching the end of its lifetime in the next ten to fifteen years.
Industry is the second-largest source of locked-in emissions. In 2020, annual emissions fromcapacity currently in place or under construction will be 5.2 Gt (similar to today’s levels). By2035 locked-in emissions will be around 25% lower. Delaying the implementation of newpolicy action to 2015 broadly increases emissions across the period by around 1 Gt per year(Figure 6.15). Taking either 2011 or 2015 as the point up to which capacity is locked-in, theproportion of locked-in emissions declines only very slowly over the period, due to the longlifetime of capital stock in industry – up to 80 years in some cases, and with an average ofaround 50 years. Thismeans only capacity installedmore than 25 years agowould, in normalcircumstances, to be retired over the course of the projection period.
Figure 6.15 " World energy-related CO2 emissions in the 450 Scenario andfrom locked-in infrastructure in 2010 and with delay to 2015in industry
0
1
2
3
4
5
6
7
2010 20202015 2025 20352030
Gt Locked-in emissions,delay to 2015:
Non-OECD
OECD
Locked-in emissions,no delay:
OECD
Non-OECD
Emissions fromindustry,450 Scenario
As in the power sector, most of the locked-in emissions arise in non-OECD countries andalmost all additional emissions resulting from delay in introducing more stringent standardsarise in those countries. This is due to the fact that over the next five years, almost no growthin projected installed industrial capacity occurs in the OECD. By contrast, growth in non-OECDcountries is very substantial and is expected to continue after the end of our projection period(IEA, 2010b). We do not, at present, envisage a need for large-scale early retirements inindustry in order to achieve the 450 Scenario (although we do expect that refurbishment andretrofitting of existing capital stock, particularlywith CCS,would take place in order to improveefficiency and reduce emissions). But because of the long lifetime of capital stock in theindustry sector, any delay now could have very severe consequences for the continued cutsin emissions necessary after 2035. Indeed, our analysis suggests that delay until 2015 wouldmean that installations in place or under construction in 2015 would give rise to emissions
© O
EC
D/IE
A, 2
011
234 World Energy Outlook 2011 - GLOBAL ENERGY TRENDS
equal to the total emissions in the 450 Scenario, leaving no room for manoeuvre in thissector. Since the global location of industrial activities is relatively flexible, the consequenceof exhausting the national “budget” of emissions from this sector could well be that activitieswould simply be switched to countries without CO2 restrictions. This points to the need for aglobal sectoral approachwhenaddressing the issueof emissions control in the industry sector.
In the OECD countries, the chemical sub-sector has the highest rate of lock-in and accountsfor 34% of the cumulative emissions from industry over the Outlook period which arealready locked-in. By 2035, chemical plants currently in place or under constructionwill emit470 Mt (or 80% of their current level of emissions). Cement has the second-highest rate oflock-in in OECD countries, accounting for one-fifth of cumulative locked-in emissions. In non-OECD countries, cement accounts for 37% of cumulative locked-in emissions. Iron and steelaccounts for 21%. By 2035, emissions from iron and steel plants currently existing or underconstruction in non-OECD countries will be 750 Mt (or 80% of current emissions). Pulp andpaper also has a very high lock-in rate, both at the global and regional level, with emissionsfrom plants currently existing and under construction actually higher in 2035 than thecurrent level of emissions from these plants in non-OECD countries. This is due to increasedproduction from these plants in these countries. However, this sub-sector accounts for only6% of total industry emissions over the period. China has the highest average lock-in acrosssectors, due to strong growth in recent years. India, by contrast, has relatively low lock-in formost industrial sectors. However, due to the current rapid pace of economic developmenttaking place in India, there is the potential for lock-in to increase rapidly in the next fewyears, as new capacity additions continue to be made. Other developing Asian economiesare expected to have higher levels of lock-in than India, but less than China, mainly becausestrong growth in production is not expected until later in the period.
Passenger and other road vehicles (rather than long-lived stock like railways) are the mainsource of CO2 emissions in the transport sector. Because of their shorter lifetime, locked-inemissions from road transport, which stand at 2.7 Gt in 2020, decline to 850Mt in 2035. Ofthe cumulative energy sector emissions over the period which are already locked-in, roadtransport accounts for 12%. Even with a delay to 2015, there is still substantial room formanoeuvre. However, for the transport sector, the major lock-in is the manufacturing andfuel retail infrastructure in place, and as such it is difficult to capture in this kind of analysis.
The extent of lock-in in the buildings sector is largely dependent on the building shell, asinstalled equipment, like boilers and heaters, has a significantly shorter lifetime. Thus, thelevel of locked-in emissions declines steeply initially, leaving a residual level of emissionswhich changes slowly due to the slow depreciation of building stock. And for this reason,the non-OECD regions, although locked-in initially at high levels of energy intensity, providean excellent window of opportunity: current rates of development and growth suggestthat much investment in buildings and their associated equipment will be made in thenear future in these countries. But, by the same token, every year of delay leads to greaterlock-in in the basic infrastructure. Emissions from the building sector account for 7% of thecumulative emissions over the period from the energy sector that are already locked-in. As is
© O
EC
D/IE
A, 2
011
Chapter 6 - Climate change and the 450 Scenario 235
6
the case for transport, however, there is a degree of lock-in that exists in urban planning andinfrastructure – such as the natural gas distribution networks – that will commit emissionsfor a very long time, but which is not captured in this analysis.
The cost of lock-in
If action is delayed until 2015, emissions from the power sector will overshoot thetrajectory of the 450 Scenario in the early years of the projection period. These additionalemissions must be offset by reductions later in the period. The additional abatement could,theoretically, occur in the power sector or elsewhere. Our analysis shows that in mostcountries the power sector still offers the cheapest abatement.We therefore assume that theadditional reductions will be made in this sector. Postponing the compensating abatementuntil later than 2035 means that emissions would have to become negative, i.e.widespreaduse of biomass generation with CCS would be needed. As this technology is not proven atcommercial scale, and therefore cannot be counted upon, we assume that the majority ofthe additional power sector abatement takes place, over theOutlook period, by othermeans.
Given a delay in action to 2015, containing cumulative emissions from the power sector toa level compatible with stabilisation of the atmospheric concentration of greenhouse gasesat 450 ppm CO2-eq over the Outlook period would require the following actions, from thecheapest to the most expensive:
! Retrofitting plants with CCS, when this is more economic than early retirement. In thiscase, the associated capital cost is the cost of retrofit (and there may be some additionaloperating costs).
! Shut down of plants that are beyond their economic lifetime, but still safe and profitableto operate, i.e. plants for which the initial investment has been repaid. This will reducerevenues compared to the New Policies Scenario.
! Retirement of plants before the end of their economic lifetime, i.e. before the upfrontinvestment has been fully recovered. In this case there will be a lost sunk cost, as well asa loss of revenues.
! Additional investment in low-carbon generation.
Delay in action results in some financial savings in the early years of the projection period,relative to the450Scenario.While there is increased investment in fossil fuel-basedgeneration,particularly in cheaper, inefficient plants, there would be a reduction in investment in highlyefficient and low-carbon plants. Over the decade 2011 to 2020, we estimate that the neteffect would be to avoid $150 billion of investment, relative to the 450 Scenario. After 2020,the additional abatement to compensate for higher emissions earlier in the periodmeans thatmore low-carbonplants and equipment need to be installed, relative to the 450 Scenario,witha net effect of adding $650 billion to investment over the period 2021 to 2035 (Figure 6.16).In other words, for every $1 of avoided investment between 2011 and 2020, either throughreduced low-carbon investment or adoption of cheaper fossil-fuel investment options, anadditional $4.3 would need to be spent between 2021 and 2035 to compensate.
© O
EC
D/IE
A, 2
011

236 World Energy Outlook 2011 - GLOBAL ENERGY TRENDS
Figure 6.16 " Change in investment in power generation by technologyin the Delayed 450 Case, relative to the 450 Scenario
-400
-200
0
200
400
600
800
2011-2020 2021-2035
Billiond
ollars(2010
) Renewables
Nuclear
Gas and coal plantsretrofi^ed with CCS
Efficient coal plants andcoal plants fi^ed with CCS
Gas plants including plantsfi^ed with CCS
Inefficient coal
Net change in investment
What if CCS does not deliver?
The 450 path set out in thisOutlook is just oneway of achieving an emissions path consistentwith long-term stabilisation of the atmospheric concentration of CO2-eq at 450 ppm. Thereare, of course, other paths that the energy sector could take in the future that would havethe same outcome. What matters for a given climate goal is not the particular choice ofpolicy measures, nor the investment cost – nor, even the specific emissions profile (at leastin the absence of major overshooting, which could lead to the kind of feedback effectsdiscussed in Box 6.1) – but the cumulative level of emissions over a certain period. Oneway of viewing this is to regard the world as having a total emissions budget. At what rateand how this budget is used up does not matter from a climate change viewpoint. Whatmatters is that the budget is not exceeded. A budget of a cumulative 1 000Gt of CO2 emittedbetween 2000 and 2049 would, if respected, give a 75% chance of keeping the globalaverage temperature increase to 2°C or less (Meinshausen et al., 2009). In the 450 Scenario,this budget is exceeded by 2035.
Reducing the probability of success to 50% increases the budget to 1 440 Gt. Since a total of264 Gt of emissions have already been emitted between 2000 and 2009, 1 176 Gtmore canbe emitted from 2010 to 2049. The implications for global energymarkets of this budget areprofound, as it implies that less than half of the remaining proven fossil-fuel reserves canbe used over the next 40 years (Figure 6.17). More of the reserves could be used withoutexceeding the emissions budget if CCS technology becomes available. However, CCStechnology has not yet been proven at commercial scale and the level of commitment todemonstration plants leaves doubts about how fast this can be achieved.We examine in thissection what it would mean for the energy sector’s contribution to attaining the 2°C goal ifthis crucial technology is not deployed on a large scale until ten years later thanwe envisagein the 450 Scenario. This would mean no commercial application in the power sector until2030, leaving only five years of operation within the projection period; and in the industrysector, CCS only beginning to be introduced at any scale by 2035.
© O
EC
D/IE
A, 2
011
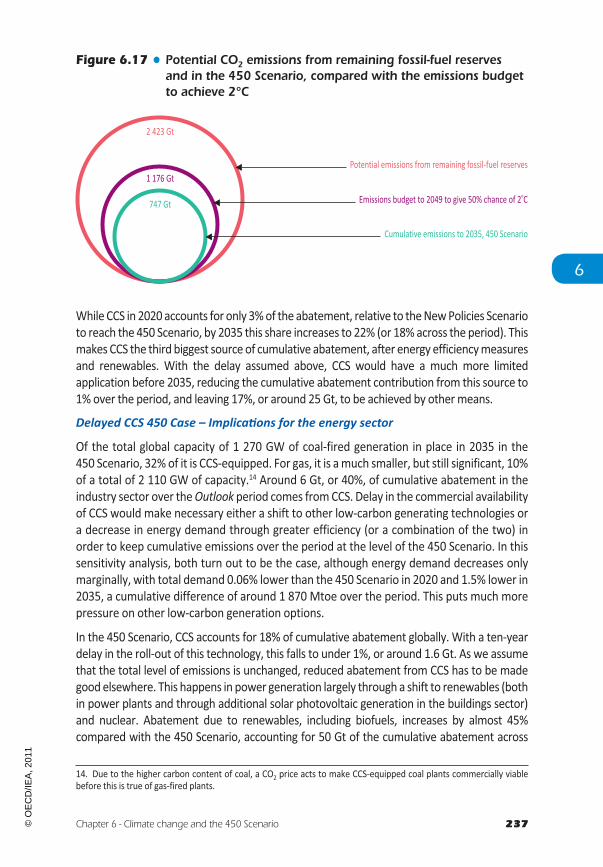
Chapter 6 - Climate change and the 450 Scenario 237
6
Figure 6.17 " Potential CO2 emissions from remaining fossil-fuel reservesand in the 450 Scenario, compared with the emissions budgetto achieve 2°C
Potential emissions from remaining fossil-fuel reserves
Emissions budget to 2049 to give 50% chance of 2 Co
Cumulative emissions to 2035, 450 Scenario
2 423 Gt
1 176 Gt
747 Gt
While CCS in 2020accounts for only 3%of the abatement, relative to theNewPolicies Scenarioto reach the 450 Scenario, by 2035 this share increases to 22% (or 18%across the period). Thismakes CCS the third biggest sourceof cumulative abatement, after energy efficiencymeasuresand renewables. With the delay assumed above, CCS would have a much more limitedapplication before 2035, reducing the cumulative abatement contribution from this source to1% over the period, and leaving 17%, or around 25 Gt, to be achieved by othermeans.
Delayed CCS 450 Case – Implica!ons for the energy sector
Of the total global capacity of 1 270 GW of coal-fired generation in place in 2035 in the450 Scenario, 32%of it is CCS-equipped. For gas, it is amuch smaller, but still significant, 10%of a total of 2 110 GW of capacity.14 Around 6 Gt, or 40%, of cumulative abatement in theindustry sector over theOutlook period comes fromCCS. Delay in the commercial availabilityof CCS would make necessary either a shift to other low-carbon generating technologies ora decrease in energy demand through greater efficiency (or a combination of the two) inorder to keep cumulative emissions over the period at the level of the 450 Scenario. In thissensitivity analysis, both turn out to be the case, although energy demand decreases onlymarginally, with total demand 0.06% lower than the 450 Scenario in 2020 and 1.5% lower in2035, a cumulative difference of around 1 870 Mtoe over the period. This puts much morepressure on other low-carbon generation options.
In the 450 Scenario, CCS accounts for 18% of cumulative abatement globally. With a ten-yeardelay in the roll-out of this technology, this falls to under 1%, or around 1.6 Gt. As we assumethat the total level of emissions is unchanged, reduced abatement from CCS has to be madegoodelsewhere. This happens in power generation largely through a shift to renewables (bothin power plants and through additional solar photovoltaic generation in the buildings sector)and nuclear. Abatement due to renewables, including biofuels, increases by almost 45%compared with the 450 Scenario, accounting for 50 Gt of the cumulative abatement across
14. Due to the higher carbon content of coal, a CO2 price acts to make CCS-equipped coal plants commercially viablebefore this is true of gas-fired plants.
© O
EC
D/IE
A, 2
011

238 World Energy Outlook 2011 - GLOBAL ENERGY TRENDS
the period as a whole. Total abatement from efficiency increases only very marginally, as the450 Scenario already absorbs almost all of the available efficiency potential in most regions.For comparison, the Low Nuclear 450 Case (Box 6.4 and Chapter 12) sees a smaller increasein the contribution of renewables including biofuels, from a share of 23% of cumulativeabatement in the 450 Scenario to 32%. The remainder of the shortfall in this case is madeup by expansion of CCS, which delivers more than a fifth of abatement in the Low Nuclear450 Case (Figure 6.18). In both of these sensitivity cases, cumulative additional investment,relative to theNewPolicies Scenario, is substantially higher than in the450Scenario, increasingby $1.14 trillion in the Delayed CCS 450 Case and by $1.5 trillion in the LowNuclear 450 Case.This underlines the importance of these two technologies in achieving the 450 Scenario at thelowest possible cost. Investment in the Delayed CCS 450 Case is discussed below.
Box 6.4 " The implications of less nuclear power for the 450 Scenario
The accident at the Fukushima Daiichi power station in early 2011 has led to are-evaluationof the risks associatedwith nuclear power and to greater uncertainty aboutthe future role of nuclear power in the energy mix. In order to assess the impact on ourprojections of a reduced role for nuclear, we include in this year’s Outlook a chapteroutlining two special cases. The first is a variant of the New Policies Scenario, which wecall the Low Nuclear Case, in which nuclear plays a much smaller role in global energysupply. The secondexamines the implications of those same lownuclear assumptions forachievement of the 2°C global climate objective – the LowNuclear 450 Case, a variant ofthe 450 Scenario. The results of those analyses are presented in Chapter 12.
To contain energy sector emissions within the CO2 budget of the 450 Scenario with amuch lower component of nuclear power is a formidable challenge. It would requiremuch greater deployment of other low-carbon technologies. Renewables-basedelectricity generation capacity in 2035 would need to be almost 20% higher than itsalready very high level in the 450 Scenario, while CCS-equipped coal- and gas-firedcapacity would need to be more than a third higher than in the 450 Scenario. Therewould be a need for additional cumulative investment of $1.5 trillion over the period2011 to 2035. In practice, it is by no means certain whether these projections couldactually be realised, given the scale of the imposed commercial losses and practicallimitations on deploying low-carbon technologies on such a large scale and so quickly.
At a regional and country level, abatement in the Delayed CCS 450 Case mostly follows asimilar pattern to the global changes compared with the 450 Scenario. OECD countries seean increase in the importance of nuclear for abatement of about 50% while abatement fromrenewables including biofuels increases by 33%. The abatement in major emerging marketsfrom these sources also increases substantially, with China’s abatement fromnuclear rising bynearly 70%. Other developing countries, withmuch less nuclear to begin with, see a relativelysmall increase in abatement from this source, instead relyingona large increase in renewables.
It is important to note that the results of the Delayed CCS 450 Case assume extremely rapidroll-out of renewable energy technologies, nuclear generation and electric vehicles. For
© O
EC
D/IE
A, 2
011

Chapter 6 - Climate change and the 450 Scenario 239
6
example, it would require an average annual addition of some90GWofwind power between2011 and 2035, which is 50%more than the total installed capacity in non-OECD countries in2010 (Table 6.6). Sales of hybrids, plug-in hybrids and electric vehicles would need to be 75%of total sales of PLDVs in 2035, requiring a significant transformation of the infrastructureused to fuel/recharge the cars. Every year, some 27 GW of new nuclear reactors need to bebuilt, necessitating widespread acceptance of such technology. Other technologies whichwill be called upon, such as large hydro and biofuels, also carry with them issues of socialacceptability due to their potential environmental consequences and sustainability issues.It is also worth noting that, given long lead-times in constructing nuclear power plants inparticular, the fact that CCS would not be available as planned in the 450 Scenario wouldhave to be apparent early in the period in order for nuclear to reach the necessary level in atimely manner, a degree of foreknowledge and forward planning that might not be availablein the real world. Given the fact that achieving the 450 Scenario would already be extremelychallenging, it is highly optimistic to assume the feasibility of rolling out technology even faster,and transforming both individual behaviour and urban planning.
Figure 6.18 " Cumulative share of abatement relative to the New PoliciesScenario in the 450 Scenario, Delayed CCS 450 Case andLow Nuclear 450 Case
14.5
15.0
15.5
16.0
16.5
17.0
0%
20%
40%
60%
80%
100%
450 Scenario Delayed CCS450 Case
Low Nuclear450 Case
Trillio
ndollars(20
10)
Shareo
fabatemen
t Efficiency
Renewables
Biofuels
Nuclear
CCS
Addi`onal investment(right axis)
If changes on this scale were to be achieved, demand for individual fuels would change verysignificantly. Coal demand peaks in the 450 Scenario at around 3 880Mtoe in 2016, falling to2 315Mtoe by 2035; in the Delayed CCS 450 Case it peaks in the same year at the same level,but fallsmuchmore steeply to under 1 700Mtoe by 2035. Although coal is the fuel which – aswould be expected – suffers themost dramatic change, gas demand also falls significantly andis 4% lower in 2035 than in the 450 Scenario (Figure 6.19). Thebiggest increase among the low-carbon fuels is nuclear, demand for which is just over 15% higher in 2035 in the Delayed CCS450 Case than in the 450 Scenario, while demand for renewables increases by 8%. Sincemuchof this increase in demand for renewables comes froma shift to renewables-based generationin the power sector, the Delayed CCS 450 Case actually sees an increase in coal and gascapacity without CCS. This is because variable renewables require additional flexible capacity,partially provided by coal and gas plants (for which CCS is not available) (see Chapter 5).
© O
EC
D/IE
A, 2
011

240
World
EnergyO
utlook2011
-GLO
BALEN
ERGY
TREND
S
Table 6.6 " Consumption, capacity and stock of selected technologies by scenario
2010 2035 Average annualadditions,2006-2010
Average annual additions, 2011-2035
New PoliciesScenario
450 Scenario Delayed CCS450 Case
New PoliciesScenario
450 Scenario Delayed CCS450 Case
Hydro (GW) 1 027 1 629 1 803 1 976 40.0 27.3 34.2 41.2
Wind (GW) 195 1 102 1 685 2 059 32.1 52.1 75.8 90.7
Solar PV (GW) 38 499 901 1 030 10.0 22.1 38.5 43.7
Nuclear (GW) 393 633 865 998 1.7 13.8 21.9 27.2
EV stock (million)* 0 13 140 173 0.0 0.6 6.3 7.6
PHEV stock (million)** 0 18 280 285 0.0 0.8 13.4 13.7
Biofuels consumption (mb/d) 1.3 4.4 7.8 8.4 0.2 0.1 0.3 0.3
*EV= electric vehicle. **PHEV= plug-in hybrid electric vehicle.
© OECD/IEA, 2011

Chapter 6 - Climate change and the 450 Scenario 241
6
Figure 6.19 " Change in global energy demand by fuel in the Delayed CCS450 Case compared with the 450 Scenario
-900
-600
-300
0
300
600
2020 2025 2030 2035
Mtoe Hydro
Biomass
Other renewables
Nuclear
Coal
Gas
Oil
The cost of delaying CCS
Overall, the cost of living within the cumulative emissions budget of the 450 Scenariowould be increased by a ten-year delay in the roll-out of CCS by $1.14 trillion (or 8%) overthe period 2011 to 2035 (Figure 6.20). These additional costs are weighted towards thepower generation and transport sectors because, in the absence of CCS, these sectors arethe most cost-effective sources of abatement. Overall, investment in industry actually fallsrelative to the 450 Scenario because, due to the long lifetime of industrial capacity andthe CO2 intensity of industrial processes, retrofitting with CCS in this sector is by far thelargest source of abatement, and was expected to have accounted for around one-thirdof investment in the 450 Scenario. Without CCS, other abatement options in industry arelimited and are costly. The greatest proportional increase in overall investment occurs inthe last five years of the period, when investment is 12% higher than in the 450 Scenario.
Figure 6.20 " Additional investment in the Delayed CCS 450 Case
0
2
1
4
5
7
3
6
2011-2015 2016-2020 2021-2025 2026-2030 2031-2035
Trillio
ndollars(20
10) Addi`onal investment,
Delayed CCS 450 Caseover 450 Scenario
Addi`onal investment,450 Scenario over NewPolicies Scenario
© O
EC
D/IE
A, 2
011

242 World Energy Outlook 2011 - GLOBAL ENERGY TRENDS
This analysis demonstrates the importance of CCS to cost-effective avoidance of dangerousclimate change. Though the effectiveness and commercial acceptability of CCS have yetto be proven (and hard-headed reappraisal will be needed year-by-year for several yearsyet), intensive investment and effort to demonstrate the commercial viability of CCS is therational course of action for governments seriously intent on restricting the average globaltemperature rise to nomore than 2°C. Successful demonstrationwill need to be followed byequally rapid andwidespread deployment. This judgement holds even after allowing for theheavy discounting appropriate to more distant investment in alternative solutions.
Regulatory and policy support will be critical to successful CCS deployment. CCS generatesno revenues or other market benefits if there is no carbon price. It is both costly to installand, once in place, increases operating costs. To overcome these barriers, effective, well-designed policy is essential.
In addition, the ongoing analysis for the Fifth Assessment Report of the International Panelon Climate Change shows that the majority of new emissions profiles compatible with 2°Cwould see energy-related emissions becoming negative around 2070.15 This presumes, inpractice, widespread use of biomass with CCS, underlining even further the importanceof quickly deploying this technology at a large scale. Any delay in action is likely to makeCCS even more important, as retrofitting coal- and gas-fired power plants and industrialinstallations is the only economically viable way to avoid locking-in these emissions.
15. See www.pik-potsdam.de/~mmalte/rcps/.
© O
EC
D/IE
A, 2
011

PREFACE
Part B of this Outlook looks at one of the key players in the global energy economy, theRussian Federation.
Chapter 7 starts with a brief overview of energy in Russia and the role of Russian energyin the world. It then sets out the assumptions underpinning our projections, includingthe macroeconomic and policy landscape, the critical issue of domestic energy pricingand the potential for energy efficiency savings. It also considers the main policy issuesand challenges that will affect the development of the Russian domestic energy marketand sets out our projections for Russian energy demand to 2035.
Chapter 8 goes into detail on Russian resources and supply potential, focusing primarilyon hydrocarbons, but also covering the potential for nuclear power, hydropower andother renewable sources of energy. It assesses the costs and challenges of developingthese resources and, on the basis of our projections to 2035, identifies the potential roleof Russia as a global energy supplier.
Chapter 9 examines the national and global implications of the trends identified inthe previous two chapters. It looks at the role of energy in Russian national economicdevelopment and also integrates the outlook for Russia into the broader picture byexamining the contribution of Russia to regional and global energy security, the potentialdevelopment of new trading relationships, notably with China, and the impact of activityin the Russian energy sector on environmental sustainability.
PART BOUTLOOK FOR RUSSIAN ENERGY
© O
EC
D/IE
A, 2
011

© O
EC
D/IE
A, 2
011

Chapter 7 - Russian domestic energy prospects 245
CHAPTER 7
H I G H L I G H T S
RUSSIAN DOMESTIC ENERGY PROSPECTS
Energy: master or servant of the Russian economy?
! Russia is a key player in the global energy economy and the energy policy choicesmade by the authorities in the coming years will shape not only the prospects forRussia’s own economic development but will also have major implications for globalenergy security and environmental sustainability.
! The energy intensity of Russian GDP has improved in recent years but, even allowingfor Russia’s industrial structure and harsh climate, energy use in Russia is still highlyinefficient. Raising efficiency in each sector of the economy to the levels of comparableOECD countrieswould savemore than 200Mtoe of primary energy per year, 30%of totaldemand and an amount similar to the energy used in a year by theUnited Kingdom.
! Stronger energy efficiency policies and price reforms in the New Policies Scenariostart to tap into this energy savings potential, dampening overall increases in energydemand. As a result, the energy efficiency gap between Russia and OECD economiesnarrows, but it remains significant: energy savings potential in 2035, relative to OECDefficiencies, would still be 18% of total primary consumption.
! Total energy demand rises 28% to reach 830 Mtoe in 2035, at an annual average rateof1%.Energyuse for transportation, growsat the fastestpace, followedby the industryandpower sectors. Demand growth in the 450 Scenario flattens after 2015 and averages only0.4%per year,while in theCurrentPolicies Scenario growth ishigher at 1.3%per year.
! Higher domestic natural gas and electricity prices encourage efficiency, but on theirown do not lead tomajor changes in the energymix: the share of gas falls only slightlyfrom 54% in 2009 to 52% in 2035. Gas demand rises by 0.8% per year on average andreaches 530 bcm in 2035. Oil consumption edges higher to 3.2 mb/d in 2035 from2.7 mb/d in 2009. Coal use stays within a range of 155 to 175Mtce per year.
! Electricity output grows to 1 440 TWh in 2035, an average increase of 1.5% per year.Natural gas remains the most important fuel in the power sector even though nuclearand, from a low base, renewables grow more quickly. The ability of a liberalisedelectricitymarket to deliver adequate and timely investmentwill be a keymeasure of itssuccess; the power sector requires total investment of $615billion (in year-2010dollars)during the period to 2035.
! Reform efforts have been directed at the electricity market, but have yet to touchthe district heating sector in the same way. Demand for district heating grows onlyat 0.3% per year as it struggles to compete with own-use boilers (and CHP) installedby industry and with decentralised space heating in apartments and private homes.
© O
EC
D/IE
A, 2
011
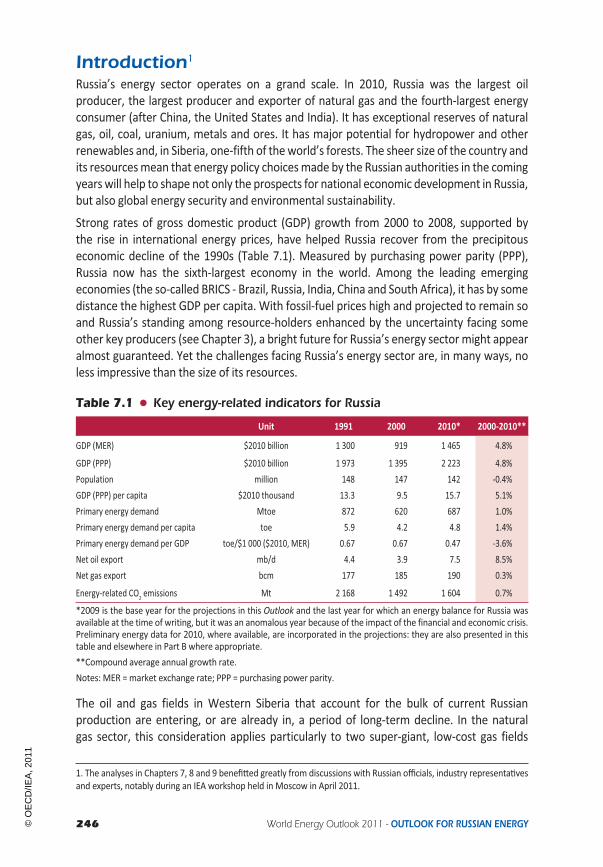
246 World Energy Outlook 2011 - OUTLOOK FOR RUSSIAN ENERGY
Introduction1
Russia’s energy sector operates on a grand scale. In 2010, Russia was the largest oilproducer, the largest producer and exporter of natural gas and the fourth-largest energyconsumer (after China, the United States and India). It has exceptional reserves of naturalgas, oil, coal, uranium, metals and ores. It has major potential for hydropower and otherrenewables and, in Siberia, one-fifth of theworld’s forests. The sheer size of the country andits resourcesmean that energy policy choicesmade by the Russian authorities in the comingyearswill help to shape not only the prospects for national economic development in Russia,but also global energy security and environmental sustainability.
Strong rates of gross domestic product (GDP) growth from 2000 to 2008, supported bythe rise in international energy prices, have helped Russia recover from the precipitouseconomic decline of the 1990s (Table 7.1). Measured by purchasing power parity (PPP),Russia now has the sixth-largest economy in the world. Among the leading emergingeconomies (the so-called BRICS - Brazil, Russia, India, China and South Africa), it has by somedistance the highest GDP per capita. With fossil-fuel prices high and projected to remain soand Russia’s standing among resource-holders enhanced by the uncertainty facing someother key producers (see Chapter 3), a bright future for Russia’s energy sector might appearalmost guaranteed. Yet the challenges facing Russia’s energy sector are, in many ways, noless impressive than the size of its resources.
Table 7.1 ! Key energy-related indicators for Russia
Unit 1991 2000 2010* 2000-2010**
GDP (MER) $2010 billion 1 300 919 1 465 4.8%
GDP (PPP) $2010 billion 1 973 1 395 2 223 4.8%Population million 148 147 142 -0.4%GDP (PPP) per capita $2010 thousand 13.3 9.5 15.7 5.1%Primary energy demand Mtoe 872 620 687 1.0%Primary energy demand per capita toe 5.9 4.2 4.8 1.4%Primary energy demand per GDP toe/$1 000 ($2010, MER) 0.67 0.67 0.47 -3.6%Net oil export mb/d 4.4 3.9 7.5 8.5%Net gas export bcm 177 185 190 0.3%
Energy-related CO2 emissions Mt 2 168 1 492 1 604 0.7%
*2009 is the base year for the projections in this Outlook and the last year for which an energy balance for Russia wasavailable at the time of writing, but it was an anomalous year because of the impact of the financial and economic crisis.Preliminary energy data for 2010, where available, are incorporated in the projections: they are also presented in thistable and elsewhere in Part B where appropriate.**Compound average annual growth rate.Notes: MER =market exchange rate; PPP = purchasing power parity.
The oil and gas fields in Western Siberia that account for the bulk of current Russianproduction are entering, or are already in, a period of long-term decline. In the naturalgas sector, this consideration applies particularly to two super-giant, low-cost gas fields
1. The analyses in Chapters 7, 8 and 9 benefi$ed greatly from discussions with Russian officials, industry representa!vesand experts, notably during an IEA workshop held in Moscow in April 2011.
© O
EC
D/IE
A, 2
011

Chapter 7 - Russian domestic energy prospects 247
7
(Urengoy and Yamburg) that have made a preeminent contribution to the gas balanceover the last two decades. The task of compensating for declines from existing fields iscomplicated by the fact that new production areas are higher-cost, more difficult technicallyand often even more remote. Uncertainties over the fiscal regime and the pace of demandgrowth in differentmarkets further complicate decisions on the timing and extent of Russia’sinvestment in new production and transportation capacity.
On the domestic front, Russia needs to modernise its ageing infrastructure and tackle theinefficiency of its energy use. These are recognised by the Russian authorities (Box 7.1) asmajor policy priorities, but the scale of the task is huge. For the moment, it is unclear to whatextent Russia will realise its potential for energy savings and whether it will create domesticenergymarkets that deliver strong commercial incentives both for investment and for efficientoperation and end-use. For the next few years, strong energy exports will be essential tooverall economic growthbut, looking further ahead, there are competingpaths for theRussianeconomy and the role of its energy resources: is Russia to remain predominantly an exporterof raw materials, highly dependent on the oil and gas sectors for economic growth; or willRussia foster amore broadly based and diversified economy, served – but not dominated – bya market-driven energy sector? The answer to these questions will determine not only thefuture of Russian energy but also, to a significant extent, the rate of economic growth in Russiaand how the benefits of growth are spread among the population.
Trends in energy demand and supply
Recent trends in energy demand reflect the economic upheaval of the 1990s and thesubsequent recovery (Figure 7.1). A deep slump in industrial and economic activity in theearly part of the 1990s meant a similarly sharp decline in energy use: between 1991 and1998, Russian GDP declined by 40%, while in the same period domestic energy demandfell by almost one-third. Following the 1998 financial crisis, the Russian economy starteda prolonged period of growth which halted, and then reversed, the decline in energy use.
Figure 7.1 ! Primary energy demand in Russia by fuel and GDP, 1990-2009
0
25
50
75
100
125
0
200
400
600
800
1 000
1990 1995 2000 2005 2009
Index
(1990
=100
)
Mtoe Other
renewables
Hydro
Nuclear
Coal
Oil
Gas
GDP index*(right axis)
*GDP is measured at market exchange rates (MER) in year-2010 prices.
© O
EC
D/IE
A, 2
011
248 World Energy Outlook 2011 - OUTLOOK FOR RUSSIAN ENERGY
Figure 7.1 also shows significant divergence between the paths of economic growthand energy consumption growth since 2000. Between 2000 and 2009, GDP grew bymorethan 50% while energy demand increased by less than 5% as economic output shiftedtowards less energy-intensive sectors. This represents an improvement of one-third inthe energy intensity of Russia’s GDP over this period. However, the amount of energyrequired to produce a unit of GDP (in PPP terms) is, in Russia, still more than twice theaverage in OECD countries.
On the supply side, Figure 7.2 shows the bumpy ride taken by Russian oil and, to alesser degree, coal production since the early 1990s, compared with the much morestable levels of output from the gas sector. Continuity in gas supply was facilitated bythe commissioning of key super-giant fields brought on stream in the 1980s and bythe transformation in 1989 of the Soviet-era Ministry of the Gas Industry into the newcorporation, Gazprom. Oil output, which was already stagnating in the late Soviet period,was depressed further in the early 1990s by the fragmentation of productive capacity intomultiple state entities, many with only regional scope, that were often plagued by poormanagement and under-investment. Oil production declined by more than 40% beforestarting to recover around the turn of the century, as the industry was consolidated andpartially privatised.
Box 7.1 ! Policy making and regulation in the Russian energy sector
Given the importanceof theRussian energy sector to thenational economy,most keydecisions about energy policy are taken at the highest levels of government. Belowthis level,multipleministries and other executive officeswork on the development ofenergy sector policy proposals and different aspects of policymaking.
The Ministry of Energy takes the lead on day-to-day regulation and supervisionof the energy sector, but is by no means the only body with responsibilities inthis area. Among the other ministries, the Ministry of Natural Resources andEnvironment is responsible for regulating upstream activities, awarding fieldlicenses and monitoring compliance. The Ministry of Finance answers for fiscalpolicy, a critical component of the investment climate. The Ministry for EconomicDevelopment holds sway over tariff policy in the gas and electricity sectors andco-ordinates energy and energy efficiency policies with the overall priorities fornational economic development.
Other important agencies for the energy sector are the Federal Anti-MonopolyService, responsible for competition policy, the Federal Tariff Service, which setstransportation, transmission and other regulated tariffs and the Russian EnergyAgency, which is responsible, under the Ministry of Energy, for promoting andmonitoring implementation of energy efficiency policies and measures.
© O
EC
D/IE
A, 2
011

Chapter 7 - Russian domestic energy prospects 249
7
Figure 7.2 ! Energy production in Russia by fuel, 1990-2009
0
200
400
600
800
1 000
1 200
1 400
1990 1993 1996 1999 2002 2005 2009
Mtoe Other renewables
Hydro
Nuclear
Coal
Oil
Gas
Russia produces far more energy than it consumes internally. Indeed, energy dominatesRussia’s overall export mix, accounting for around two-thirds of exports by value. Russiaexported an average of 7.5 million barrels per day (mb/d) of oil in 2010, around two-thirdsas crude oil or natural gas liquids (NGLs) and the rest as refined products. Net exports ofnatural gas were 190 billion cubicmetres (bcm) and net coal exports were 82million tonnesof coal equivalent (Mtce).2 The bulk of these exports were transported westward alongwell-established routes to neighbouring countries and to European markets; however,a small but increasing share of oil, gas and coal is also being delivered to China and theAsia-Pacific region. This incipient shift in favour of fast-growing Asianmarkets is expected togain momentum throughout the projection period.
The presentation in this Outlook of projections for Russia as a whole should not disguisethe fact that there are strong variations between the Russian regions in terms of resources,prices and policy challenges. Energy production is heavily concentrated in specific partsof the country, notably in the Urals Federal District, which includes the autonomousregions of Khanty-Mansisk (almost 60% of oil production) and Yamalo-Nenets (closeto 90% of gas production), and in Siberia, which includes the main coal-producingKuzbass and Krasnoyarsk regions as well as most of Russia’s hydropower production andpotential (Figure 7.3). By contrast, the Central Federal District, which includes Moscow,has negligible resources and production of fossil fuels. The 37 million inhabitants of thisDistrict, in commonwith others in European regions of Russia, rely on supplies from otherparts of the country, delivered over long distances. Transportation costs lead to largedifferentials between energy prices in different regions, as well as variations in the actualand potential fuel mix.
2. Preliminary data for 2010 are provided here to give a more representa!ve picture of current export volumes.
© O
EC
D/IE
A, 2
011

250
World
EnergyO
utlook2011
-OU
TLOO
KFO
RRU
SSIANEN
ERGY
Figure 7.3 ! Share of Russia’s population, energy consumption and fossil-fuel production by federal district, 2009
km
0 400 800
This map is for illustrative purposes and is without prejudice to the status of or sovereignty over any territory covered by this map.
Volga
Central
Siberia
Population
Energy consumption
Oil production
Gas production
Coal production
Far East
Southern / N. Caucasus
North West
Urals
0%
25%
50%
75%
100%
0%
25%
0%
25%
0%
25%
50%
0%
25%
0%
25%
0%
25%
50%
75%
100%
Moscow
St. Petersburg
Rostov-on-Don
Nizhny Novgorod
Yekaterinburg
Novosibirsk
Khabarovsk
Yamalo-Nenets
Khanty-Mansisk
Krasnoyarsk
Sakhalin
Island
Kemerovo
© OECD/IEA, 2011

Chapter 7 - Russian domestic energy prospects 251
7
Trends in policies and governance
The experience of economic turbulence in the 1990s has been reflected in trends in energy-sector policies and governance for much of the last decade. With an emphasis often onstability, rather than far-reaching reform, the state maintained or, in some cases, increasedits involvement in many key parts of the national economy. However, this trend has notbeen uniform – the liberalisation of the electricity sector in the mid-2000s is an exception –and it is being challenged.3 There is a widely shared recognition in Russia that the countryneeds to strengthen the quality of both state and market institutions if it is to realise its fullpotential. Survey data4 suggests that Russia is still perceived as prone to serious problemswith corruption and bureaucratic interference which contribute to the costs and risks ofdoing business. Doubts persist about the respect for contracts and private sector propertyrights, a factor which discourages investment. A further challenge for Russia, as for manyresource-owning countries, is to ensure that large natural resource revenues do notprejudice the development of other parts of the economy or of effective national institutionsand good governance.
Key assumptions for the Russian energy outlookAs elsewhere in this Outlook, our energy projections for Russia are contained in threescenarios: the Current Policies Scenario, the New Policies Scenario and the 450 Scenario(see Chapter 1 for a full description of the assumptions underlying each scenario). Detailedresults are presented only for the New Policies Scenario. This scenario takes into accountboth existing policies and Russia’s policy intentions including, where available, targets forthe energy sector and the environment that are set out in national strategy documentsand sector programmes, even where the relevant measures or instruments for theirimplementation are not yet in place. We are cautious in assessing the prospects for fullimplementation of these policies and targets, bearing inmind the difficulties that often arisewith securing the necessary budgetary and financial support and, crucially, in ensuring theoptimal performance of the relevant institutions and administrative mechanisms.
GDP and population
Russia was among the countries most affected by the recent global economic and financialcrisis: an 8% decline in GDP in 2009 highlighted the risks associated with Russia’s exposureto downturns in international commodity prices and energy demand. The economy is nowrecovering from this sharp shock: a large fiscal stimulus, equivalent to 9% of GDP, cushionedthe initial effects of the recession in some sectors and higher oil prices since then havehelped to boost production and employment. However, in the view of the International
3. An example is the proposal to divest part of the state holding in companies such as the oil giant, Rosne", the powercompany, InterRAO, the hydropower company, Rushydro, andpossibly even theoil pipeline company, Transne" (althoughit is not yet clear when, or whether, these plans will come to frui!on).4. Russia ranks 123rd out of 183 countries in theWorld Bank’s Ease of Doing Business index (World Bank, 2011) and 154th
among 180 surveyed in Transparency Interna!onal’s Corrup!on Percep!ons Index (Transparency Interna!onal, 2010).
© O
EC
D/IE
A, 2
011

252 World Energy Outlook 2011 - OUTLOOK FOR RUSSIAN ENERGY
Monetary Fund (IMF), Russia needs strengthened policies to avoid growth tapering off toless than 4% per year in the medium term, significantly less than the rate of growth seenprior to the financial and economic crisis (IMF, 2011a).
OurGDP growth assumptions for the period to 2015 are drawn from the IMFWorld EconomicOutlook (IMF, 2011b); this means real GDP is assumed to grow at an average annual rateof 4.3% for the period from 2009 to 2015. After 2015, the rate of economic growth isassumed to slow down progressively in the longer term, such that the average for the entire2009 to 2035 period is 3.6% (Table 7.2). The contribution of the services sector to GDP isassumed to increase steadily over time, continuing the shift seen since 1990. AlthoughRussia could surprise in either direction, longer-term growth is assumed to be constrainedfrom rising higher by a decline in the population, a weak banking sector, relatively low ratesof investment in new or upgraded productive capacity and continued concerns over theinvestment climate and governance. Nonetheless, the annual average figure of 3.6% is higherthan the 3% assumption in last year’sOutlook for the period 2008 to 2035.
Table 7.2 ! Indicators and assumptions for population and GDP in Russia
Population GDP ($2010, PPP) GDP per capita ($2010, PPP)
2009(millions)
1991-2009*(%)
2009-2035*(%)
2009($ billion)
1991-2009*(%)
2009-2035*(%)
2009($)
1991-2009*(%)
2009-2035*(%)
Russia 142 -0.2% -0.3% 2 138 0.4% 3.6% 15 069 0.7% 3.9%
World 6 765 1.3% 0.9% 70 781 3.2% 3.6% 10 463 1.9% 2.6%European Union 501 0.3% 0.2% 14 911 1.9% 1.9% 29 755 1.5% 1.7%
*Compound average annual growth rate.
A key medium-term challenge will be to mobilise the investment required to upgrade andrenovate Russia’s industrial base. Gross fixed capital formation (that is, spending on physicalassets such asmachinery, land development, buildings, installations, vehicles or technology)is around 20% of GDP (having reached a high point of 22% in 2008), a relatively low figurecompared to other emerging economies. Foreign investment has played a relatively minorrole: capital inflows rose steadily in the 2000s, bolstered by Russian capital returning fromabroad, but – even at its peak of $75 billion in 2008 – foreign investment did not exceed 5%of GDP (MER).5
Our GDP assumptions, which are constant across all three scenarios, are generallylower than those that have been used to develop Russia’s own strategy documents anddevelopment plans for the energy sector. For example, the baseline scenario of Russia’sEnergy Strategy to 2030 assumes average annual GDP growth of almost 5% per year(Institute of Energy Strategy, 2010). The difference in GDP assumptions naturally has amajorimpact on energy demand. To allow for a more direct comparison between our projections
5. Despite limita!ons on par!cipa!on in oil and gas projects, a significant share of foreign investment has nonethelesscome to the energy sector: Rosstat data suggest that 30% of foreign investment was in oil, gas and electricity in theperiod 2004 to 2010.
© O
EC
D/IE
A, 2
011

Chapter 7 - Russian domestic energy prospects 253
7
and those in Russian strategy documents, we have run a high GDP case in linewith themoreoptimistic outlook for GDP growth from the RussianMinistry of Economic Development (the“favourable” scenario for economic growth). The results are presented in Chapter 9.
Demographic trends are a source of political concern within Russia and of uncertaintywith regard to the future. Russia’s population has fallen by around 4% since 1990, from148 million to 142 million, although Rosstat data shows that the rate of decline has slowedin recent years. In our scenarios, the Russian population is assumed to continue to decrease,but at a slower rate, reaching 133million in 2035. This falls between the “low” and “medium”scenarios from Rosstat, which show figures for 2030 of 128 and 139 million, respectively.Over the period to 2035, the share of Russia’s population living in urban areas is expectedto increase from 73% to 78%. The results of the 2010 Census will enrich understanding ofRussian demographics; provisional figures, released in second-quarter 2011, put the totalpopulation at 142.9 million in 2010. They also suggest some strong regional variations intrends within Russia, with the largest decline in population seen in the Far East.
GDP per capita (PPP) was $15 100 in 2009, more than twice as high as the figure for Chinaand half the level of the European Union. Projected average growth in GDP per capita to2035 is 3.9% per year, higher than the headline rate for GDP growth because of the expecteddecline in the population. As living standards rise, so do our assumptions about residentialspace per capita, which increases from an average of 22 squaremetres (m2) in 2009 to 38m2
in 2035, and indicators such as car ownership, which rises from 220 passenger vehicles per1 000 people in 2009 to 390 vehicles per 1 000 people in 2035.
Energy and climate policies
The Energy Strategy to 2030 (Government of Russia, 2009) provides a detailed overarchingframework of long-term policy priorities for the energy sector. The Strategy is supplementedand, in some cases, modified by development programmes for the oil, gas and coal sectorsand a similar document for the power sector, adopted in 2008 and then amended in 2010.Investment, efficiency, security and reliability are recurrent themes in the Energy Strategy,which foresees three main changes to the Russian energy balance in the period to 2030: areduction in the share of natural gas in the primary energy mix to under 50%; an increasein the share of non-fossil fuels in primary energy consumption to 13% to 14% (from 10%today); and a reduction in the energy intensity of GDP. The Energy Strategy adopts a multi-scenario approach to test the implications of different future levels of demand and supply. Acomparison with the projections of thisOutlook is included in Chapter 9.
Market reform has proceeded at various speeds in different sectors of the Russian energyeconomy. Domestic coal, oil and wholesale electricity markets have been liberalised, whilereforms to other parts of the electricity sector (retail and capacity markets) are at an earlierstage, as are reform efforts in the domestic gas sector and in heat supply. The interplaybetween sectorswith differentmarket and regulatory structures is an element of complexityand uncertainty in the Russian domestic energy outlook.We assume that the domestic coal,oil and wholesale electricity markets will remain commercially competitive, with gradual
© O
EC
D/IE
A, 2
011

254 World Energy Outlook 2011 - OUTLOOK FOR RUSSIAN ENERGY
reform in the other areas.We assume that the upstream structure of the oil and gas industryremains dominated by Russian companies (state and private) throughout the projectionperiod (see Chapter 8).
Russia’s policies on energy efficiency and intensity and, to a lesser extent, its commitmentson greenhouse-gas emissions are important in shaping the outcomes examined in thisOutlook (Table 7.3). Russia’s pledge to the Copenhagen Accord was a 15% to 25% reductionin emissions by 2020, relative to a 1990 baseline.6 Implementation of this pledge is includedin our assumptions, the lower figure, which is considered as a business-as-usual trajectory, inthe Current Policies Scenario, a 20% target in theNewPolicies Scenario and the higher figure,25%, in the 450 Scenario. These are all achieved, with room to spare, in our projections sothey do not impose additional policy constraints in the period to 2020 (see Chapter 9). Bycontrast, the aim to reduce Russia’s energy intensity by 40% to 2020, compared to thatof 2007, sets a much higher level of ambition. This target was announced by PresidentMedvedev in 2008 and its achievement would have substantial implications for energy use.
Table 7.3 ! Main assumptions for Russia by scenario
New Policies Scenario 450 Scenario
Electricityand natural gas prices
- Gas prices for industry reach “netback parity”by 2020; gradual above-inflation increase inresidential electricity and gas prices.
- As in the New Policies Scenario, but higher ratesof increase in residential electricity and gasprices.
Power generation - State support to the nuclear and hydropowersectors; support mechanisms for non-hydrorenewables introduced from 2014.
- Domestic emissions trading scheme post-2020for power generation.Stronger support for nuclear and renewables.
Industry - Efficiency measures driven by prices.- Reduction in share of GDP value-added in favourof the services sector.
- Domestic emissions trading scheme post-2020.
Transport - Accelerated development of natural gas vehicles. - Introduction of fuel-efficiency standards.
Buildings - New building codes, meter installations andrefurbishment programmes lead to efficiencygains in space heating 50% above CurrentPolicies Scenario.
- Efficiency standards for appliances.- Per-capita residential space increases from 22m2
to 38m2.
- As in the New Policies Scenario, but a higher rateof efficiency gains in space heating, 150% aboveCurrent Policies Scenario.
- Stricter efficiency standards for buildings andappliances.
CO2 emissions - 20% reduction in 2020 compared with 1990. - 25% reduction in 2020 compared with 1990.
Oil and gas supply(all scenarios)
- The tax regime for oil and gas will succeed in mobilising the necessary investment to allow anappropriate level of exploitation of the oil resources in each region, according to the economicpossibilities (see Chapter 8).
- The target for 95% utilisation of associated gas, i.e. a reduction in gas flaring, is reached in 2014.
6. The target within this range depends on the extent to which the role of Russia’s forests as a carbon sink will be takeninto account and whether all major emi$ers adopt legally binding obliga!ons.
© O
EC
D/IE
A, 2
011

Chapter 7 - Russian domestic energy prospects 255
7
Another target adopted by the Russian authorities for 2020 is to increase the share ofrenewable energy resources in the electricity mix to 4.5%. For the moment, this is notbacked up by legislation or economic incentives and this target is not met in the NewPolicies Scenario, though we do assume that renewables support mechanisms are inplace from 2014, leading to faster growth in renewable energy use later in the projectionperiod. In the 450 Scenario, we see a more concerted effort to promote lower-emissionstechnologies both in power generation and in other energy-intensive sectors. Many ofthe policies considered in the 450 Scenario come from the Climate Doctrine Action Plan(Government of Russia, 2011), which was adopted in April 2011.7 This plan sets out arange of measures for different sectors of the Russian economy, including economicinstruments for limiting greenhouse-gas emissions in industry and power generation,which accounts for our introduction of a domestic emissions trading system in the450 Scenario after 2020.
Energy pricing
Russia has made substantial changes to pricing in both the electricity and gas sectors inrecent years, improving the incentives for investment and efficiency. In the New PoliciesScenario, we assume that industrial electricity prices remain liberalised and that industrialgas prices follow a path consistent with reaching parity with gas export prices, minus theexport duty and transportation costs, in 2020. We assume that regulated residential pricesfor both gas and electricity increase at a rate above the inflation rate, reducing, but notentirely removing, subsidies to households.
In the electricity sector, full liberalisation of the wholesale market took place inJanuary 2011, ensuring cost-reflective wholesale pricing for industrial consumers.8Pricing of electricity for all residential consumers remains government-controlled:regulated electricity tariffs are set by regional energy commissions, within overallboundaries set by the Ministry of Economy and Federal Tariff Service. The system ofregulation has been under challenge in 2010/2011 because of significant increases indistribution network charges, leading to the imposition of additional end-user price capsin 2011. While this particular imposition was, arguably, justified, undue and persistentprice capping would distort market operation and undermine the prospects for efficientinvestment.
In the gas sector, the Federal Tariff Services sets wholesale tariffs for natural gas destinedfor industrial and power sector use; tariffs to residential and municipal customers, as forelectricity, are established on a local basis by regional energy commissions. Gazprom is
7. The Ac!on Plan is not supported by funding and, in most areas, has more of the character of an agenda for policyresearch (and possible future implementa!on), rather than a specific declara!on of policy goals that could be consideredfor inclusion in the New Policies Scenario.8. The wholesale market does not cover the whole of Russia: there are “non-price zones” (around 5% of total consump-!on) where, because of limited compe!!on, all prices remain regulated. North Siberia is not part of the unified powernetwork and is excluded from wholesale trade (Solanko, 2011).
© O
EC
D/IE
A, 2
011
256 World Energy Outlook 2011 - OUTLOOK FOR RUSSIAN ENERGY
required by law to supply pre-negotiated volumes of gas to customers at regulated prices,regardless of profitability. Additional gas can be purchased from Gazprom or independentproducers at higher prices; this deregulated sector has grown and now accounts for aroundone-third of domestic gas supply.
Average natural gas prices to Russian industry have increased consistently in recent years,from $0.4 per million British thermal units (MBtu) in 2000 to $2.8/MBtu in 2010. The statedaim, since 2007, has been to increase industrial prices to “netback parity”, a level equivalentto the Gazprom export price to Europe, minus export duty and transportation costs. Thisis a moving target and in some years even quite significant domestic price increases havenot kept pace with the faster rise in the reference price, which is in part linked to oil pricesthrough the contractual conditions of long-term supply contracts to Europe. The initialtarget date to reach netback parity was 2011, but this has been postponed to 2014-2015and we assume that a further postponement will occur. Indeed, it is questionable whetherthe target of netback parity, conceived in an era of lower oil prices, will remain the formalobjective of gas pricing policy.
One alternative to netback parity would be a regulated price ceiling for the domesticmarket. Another possibility, in the event of further domestic gas sector reform, would be atransparent market-driven price, set at a gas trading exchange or hub. A price set on suchan exchange would tend to reflect the long-run marginal cost of Russian gas supply (andan efficient regulated price would be set at similar levels). The assumed marginal cost ofRussian supply varies, depending on which region the marginal gas is sourced from andaccording to the applicable tax rate, but our analysis suggests that such an approach wouldproduce an average domestic gas price around $5.5/MBtu (in year-2010 dollars) in 2020.In practice, this is only slightly below the $6.4/MBtu figure produced by a calculation ofthe netback value, taking the OECD Europe gas import price in 2020 as the starting point.For the purposes of our analysis, we assume that higher average industrial gas prices willremain an objective of Russian policy and we have retained netback parity as a ceiling forfuture price increases. Average Russian industrial gas prices are assumed tomove on a pathconsistent with reaching this level, i.e. $6.4/MBtu, in 2020, following which the pace of realprice increases slows to less than 1% per year.
The amount spent on energy in all sectors of final consumption in Russia, expressed as ashare of GDP, rose from around 4% of GDP in 2000 to an estimated 11% in 2011 (Figure 7.4).Comparing levels of spending on energy across countries can be misleading because ofdifferences in climate and the structure of GDP, but a comparison of trends over the lastten years can nonetheless be instructive. Russia’s energy spending as a share of GDP hasconverged towards the figures for the European Union and China and, since 2007, has beenhigher than the figure for the United States, highlighting the impact of price increases forgas and electricity over this period. Moreover, the fact that Russia – still with relatively lowaverage end-user prices – expends more than 10% of its GDP on energy is a pointer to theextent of wasteful energy consumption. This indicates that greater energy efficiency needsto complement further price reforms, in order tomitigate the impact on household budgetsand industrial costs.
© O
EC
D/IE
A, 2
011

Chapter 7 - Russian domestic energy prospects 257
7
Figure 7.4 ! Total energy costs as a percentage of GDP
3%
5%
7%
9%
11%
13%
2000 2003 2006 2009 2011
China
European Union
Russia
United States
Note: 2010 data are preliminary; 2011 data are estimates.
Energy savings potential
There is greater scope to use energy more efficiently in Russia than in almost all othercountries. How Russia uses this potential over the coming decades will shape its energybalance, helping to determine the requirement for upstream investment and the availabilityof resources for export. The energy intensity of Russian GDP – the amount of energy usedto produce a unit of Russian output – has declined since reaching a peak in 1996. However,as the Russian government has recognised (Government of Russia, 2010), this improvementin energy intensity has been due mainly to structural changes in the economy, i.e. a dropin the share in GDP of energy-intensive output. Only a relatively small part of the changesince 2000, one-fifth, was derived from actual improvements in the efficiency of energy useand, despite this limited improvement, Russia’s energy intensity remains among the highestin the world. The country’s size, its long, harsh winters and its industrial structure providea partial explanation for the high intensity of Russia’s energy consumption but, even takingthese factors into account, the potential for efficiency gains is still enormous.
If Russia used energy as efficiently as comparable OECD countries in each sector of theeconomy in 2008, it could have saved more than 200 million tonnes of oil equivalent(Mtoe) from its primary energy demand – equal to 30% of its consumption that year andan amount similar to the total primary energy used by the United Kingdom. This snapshotof a more energy-efficient Russia emerges from a detailed and disaggregated analysis ofRussia’s energy consumption in 2008 relative to OECD benchmarks9 (Figure 7.5). With
9. 2009 was an anomalous year because of the recession and so 2008 was chosen as the base year for analysis. Thesame calcula!ons for 2009 showed that the volume of poten!al savings was lower (slightly less than 200Mtoe), but thepercentage saving, at 30%, was the same. Benchmarking was against OECD Europe in all sectors and sub-sectors exceptthose affected by climate, i.e. higher hea!ng needs for buildings, where Finland and Canada were used as points ofcomparison. The comparison was facilitated by reference to IEA (2010, 2011), UNIDO (2010), CENEF (2008). Analysis bythe World Bank (2008) and the Russian Academy of Sciences (2009) measured Russia’s energy savings poten!al rela!veto best-available energy technologies (rather than against OECD countries who themselves can improve their efficiencyin various sectors), and so found even higher savings poten!als.
© O
EC
D/IE
A, 2
011

258 World Energy Outlook 2011 - OUTLOOK FOR RUSSIAN ENERGY
these savings, Russia’s energy intensity would still be about 60% higher than the OECDaverage (or 85% higher than the European Union), due to Russia’s more energy-intensiveindustrial structure and the large share of its population living in areas with high heatingrequirements.10 These savings would, though, bring Russia’s energy intensity very close tothe figure for Canada, which is the OECD country most similar to Russia in terms of averageannual temperatures and of the share in GDP of energy and heavy industry. An alternativeway of reading this analysis is to conclude that Russia’s current level of energy consumptioncould in practice support a considerably larger economy i.e. future economic growth neednot be accompanied by increases in energy demand if effective policies promoting energyefficiency are implemented.
Figure 7.5 ! Primary energy savings potential in Russia based on comparableOECD efficiencies, 2008
0
100
200
300
400
500
600
700
2008 2008 with savings
Mtoe Coal
Oil
Gas
Biomass andwaste
30%
Among primary fuels, the savings potential is equal to almost 180 bcm of gas, 600 kb/dof oil and oil products and more than 50 Mtce of coal. The current internationalmarket value of these saved primary resources is about $70 billion, which is 46%of Russian domestic spending on energy in 2008. Final electricity consumption wouldbe 170 terawatt-hours (TWh) lower than today’s levels, a reduction equivalent to the annualoutput from about 75 combined-cycle gas turbine (CCGT) plants.11 Among final consumers,the greatest potential savings are in the buildings sector (including residential end-uses andservices), followed by industry and then transport (Figure 7.6). Large savings of primary fuelsare available in the power and heat sectors, as a result of greater efficiency of conversion ingeneration,more efficient transmission and distribution and also because less electricity andheat need to be generated in order to supply more efficient final uses.
Among the fossil fuels, the largest share of savings is in natural gas. These savings arisemainly from improvements in the efficiency of power and heat generation, and from lowerdemand for electricity in a more efficient economy, although the buildings sector also
10. Comparisons of current energy intensity are expressed as total primary energy demand divided by GDP expressedin PPP terms; future trends are presented using GDP at market exchange rates (MER).11. Plants of 400 megawa$s (MW) each opera!ng at an assumed u!lisa!on rate of 65%.
© O
EC
D/IE
A, 2
011

Chapter 7 - Russian domestic energy prospects 259
7
accounts for a significant share (Figure 7.7). Given the huge scale of Russian gas demand,policies affecting gas use have important implications for the requirement for investmentin Russian gas supply and for the availability of gas for export. Potential savings of almost180 bcm, including those from reduced gas demand and those from reduced gas flaring,are equivalent to the planned plateau output from the three-largest fields on the Yamalpeninsula combined (Bovanenkovo, Kharasaveysk and South Tambei). It is also close toRussia’s net export of natural gas in 2010 (or 120% of its net export in 2009).
Figure 7.6 ! Energy savings potential in Russia by sector, 2008
-100 0 100 200 300 400
Other**
Buildings
Transport
Industry
Gas flaring
Indirect savings*
Other energy sector
Electricity and heat
Finalconsum
paon
Mtoe
Energyconsumpaon
Potenaalsavings
*Indirect savings reflect the additional decrease in primary energy use that accompanies savings in final consumption,e.g. 1 MWh of saved electricity in the buildings sector results in savings of the primary fuels that would have been usedto generate that unit of electricity.**Includes agriculture and non-energy use.
Despite some selective investment in more efficient energy use in Russia, notably inexport-oriented industrial sectors, thus far the progress made in reducing the wastefulenergy practices inherited from Soviet times has been slow. Prices have yet to reach a levelsufficient to generate widespread efficiency improvements, meaning in many cases thatwhile the technical potential for savings is there, energy efficiency investments face longpayback periods and uncertain rates of return. A related issue is the poor availability ofdata and insufficient communication, leaving households and companies either unawareof the potential gains from investing in efficiency or underestimating their value. Whensuitable energy efficiency investments are identified, Russian capital markets are oftennon-responsive to the opportunities. There is also a relative scarcity of energy efficiencyexpertise, both within energy-using institutions and to support growth in the fledglingenergy services sector.
The policy and regulatory framework to support energy efficiency improvements hasevolved rapidly since 2009. Prior to then, and with the exception of a brief burst ofnational activity in the late 1990s, there were no systematic efforts to implement energyefficiency policies at national level. There were some initiatives taken by municipal andregional authorities, but energy efficiency measures by industry and households that were
© O
EC
D/IE
A, 2
011

260 World Energy Outlook 2011 - OUTLOOK FOR RUSSIAN ENERGY
implemented were motivated in part by rising gas and electricity prices or, more often, bythe imperative to replace older pieces of machinery and equipment as they reached theend of their useful life. However, President Medvedev’s definition of energy efficiency asa strategic priority and, in particular, the target to reduce energy intensity by 40% in 2020(relative to 2007), has given new impetus to national policy.12
Figure 7.7 ! Natural gas savings potential in Russia, 2008
-200 -100 0 100 200 300 400 500bcm
Electricity and heat
Other energy sector
Industry
Transport
Buildings
Other*
Indirect savings**
Potenaal savings
2008 gas demand
Potenaal reduced gas demand
160 bcm
177 bcm New gas demand
Gas flaring***
*Includes agriculture and non-energy use.**Indirect savings reflect the additional decrease in primary gas use that accompanies savings in final consumption.***Gas flaring, a non-productive use of gas, is not a component of gas demand and therefore reductions in this area arereflected only in the total potential savings.
The main measures promoting more efficient energy use are contained in the 2009framework law on energy efficiency and the State Programme for Energy Saving to 2020(Government of Russia, 2010), which was adopted in late 2010 and is in the early stages ofimplementation. Although there are still gaps in policy as well as in the institutional capacityto implement policies effectively, there are now measures in place or under developmentcovering compulsory energy metering by industry and households, energy efficiencystandards for appliances, energy efficiency building codes and standards, compulsory energyaudits for large energy consumers andmandatory reductions in specific energy consumptionin public buildings. Moreover, there is committed federal support for the developmentand implementation of regional energy efficiency programmes and a system of federalguarantees for energy efficiency programmes put in place by large enterprises.
Where mechanisms are in place to realise its provisions, the energy efficiency law isconsidered in the Current Policies Scenario. Partial implementation of the State Programmeis taken into account in the New Policies Scenario and fuller implementation in the450 Scenario. Aspects of the energy efficiency programme that rely on regulation, such as
12. The IEA prepared energy efficiency policy recommenda!ons across 25 fields of ac!on for the G-8 and evaluatedthe progress of G-8 countries against these benchmarks (IEA, 2009). Russia was assessed to have “full and substan!alimplementa!on” in only 10% of these areas and in around one-third there was no sign that implementa!onwas plannedor underway. However, an updated assessment conducted by Russia’s Centre for Energy Efficiency (Bashmakov, 2011)showed significant progress by Russia since 2009 in adop!ng the relevant regulatory acts.
© O
EC
D/IE
A, 2
011

Chapter 7 - Russian domestic energy prospects 261
7
stricter building codes, are considered more likely to have an additional impact on energydemand than those parts (for example in relation to industrial energy use), which relyon limited state funds to act as a catalyst for mobilising much larger amounts of privateinvestment.13 In calibrating our assumptions about the rate of efficiency improvement in theNewPolicies Scenario, we take into account the institutional capacity and expertise requiredfor full implementation of an energy efficiency programme, as well as the record of fallingshort of targets set by a previous energy efficiency programme.14
Russian domestic energy outlook
Overview
Russian total primary energy demand expands progressively both in the New PoliciesScenario (at an average pace of 1% per year from 2009 to 2035) and in the Current PoliciesScenario (at a faster rate of 1.3% per year). By the end of the projection period in 2035,Russia’s energy consumption in the Current Policies Scenario exceeds the amount used inits first year of independence (910 Mtoe versus 872 Mtoe in 1991). However, at 830 Mtoe,energy consumption in the New Policies Scenario in 2035 is well below the 1991 figure. In the450 Scenario, total primary energy demand increases much more modestly, at only 0.4% peryear (Figure 7.8), reaching 720Mtoe in 2035, 20% lower than in the Current Policies Scenario.15
Figure 7.8 ! Total primary energy demand by scenario
550
600
650
700
750
800
850
900
950
1990 2000 2010 2020 2030 2035
Mtoe Current Policies
Scenario
New PoliciesScenario
450 Scenario
13. Total federal funding for the energy efficiency programme for the period 2011 to 2020 is envisaged at 70 billionroubles ($2.5 billion), out of a total es!mated cost of 9 500 billion roubles ($340 billion), less than 1% of the total.Regional budgets are expected to contribute a further 6.5% of the total; but the overwhelming majority (the remaining93%) is expected to come from non-budgetary funds, i.e. commercial or interna!onal lending or investment by industryand households.14. The “Federal Targeted Program for an Energy Efficient Economy for the Period 2002-2005 with an Outlook to 2010”that was adopted in 2001.15. Growth rates are lower if the period is calculated from 2010 to 2035 so as to exclude the demand effects of the 2009recession; in this case, the annual average growth in energy demand falls to 0.8% in the New Policies Scenario, 1.1% inthe Current Policies Scenario and 0.2% in the 450 Scenario.
© O
EC
D/IE
A, 2
011
262 World Energy Outlook 2011 - OUTLOOK FOR RUSSIAN ENERGY
Combined with the projected gradual decline in the Russian population, these trends producenotable differences in energy demand per capita in the different scenarios: starting from4.6 tonnes of oil equivalent (toe) per capita in 2009, the 450 Scenario shows a slight increase inper-capita consumption over the projection period to reach 5.4 toe in 2035; the New PoliciesScenario is higher at 6.3 toe in 2035; while in the Current Policies Scenario the level reaches6.8 toe over the same period. For comparison, the respective indicator for the European Unionin 2009 is 3.3 toe per capita, a figure that remains stable throughout the period to 2035.
Energy savings
In the New Policies Scenario, higher energy prices, an improved policy and regulatoryframework and progress with implementation of the State Programme for Energy Savingto 2020 are all expected to hold back energy demand growth. The results vary by sector,16but cumulative savings of energy over the projection period in this scenario, relative to theCurrent Policies Scenario, are 715Mtoe,more than one year of current energy consumption.These savings also lower the overall energy bill for Russian consumers (Box 7.2).
Box 7.2 ! Counting the benefit of increased energy efficiency
Properly designed energy efficiency measures save both energy and money. Theefficiency measures taken into account in the New Policies Scenario, even if they donot realise Russia’s full potential for energy saving, lead to a substantial reductionin the energy bills paid by Russian industry and households. Cumulative spendingon energy in Russia in all end-use sectors is $230 billion less (in year-2010 dollars) inthe New Policies Scenario than in the Current Policies Scenario from 2010 to 2035.The annual savings rise through the projection period; by 2035 they amount to over$25 billion per year, almost 1% of projected GDP (MER). These savings arise despitethe assumption that domestic energy prices rise more slowly in the Current PoliciesScenario. The largest share of the benefit goes to households, services and agriculture,which together reap more than $100 billion; industry saves a further $90 billion andthere are also savings from greater efficiency in energy used for transport.
At the same time, the impact of the policies and measures considered in the New PoliciesScenario is not sufficient to take advantage of all the potential efficiency gains. A sector-by-sector analysis of the efficiency of Russia’s energy use in 2035 in the New Policies Scenario,compared with the levels achievable if efficiency levels matched those projected for OECDcountries, reveals that, in 2035, Russiawould still have potential savings of almost 150Mtoe,or 18% of projected primary energy consumption (Figure 7.9). The level of achievement inthe New Policies Scenario is a clear improvement on the situation in 2008, when savingsrelative to OECD efficiencies were estimated at 30% of primary energy consumption, but itfalls short of Russia’s aspirations.
16. Details on policies and projec!ons by sector (power and heat, industry, transport and buildings) are included laterin this chapter.
© O
EC
D/IE
A, 2
011

Chapter 7 - Russian domestic energy prospects 263
7
Figure 7.9 ! Primary energy savings potential in Russia based on comparableOECD efficiencies in the New Policies Scenario, 2008 and 2035
0
100
200
300
400
500
600
700
800
900
Primary energydemand
With potenaalsavings
Projected primaryenergy demand
With potenaalsavings
2008 2035
Mtoe Other
renewables
Biomass andwaste
Hydro
Nuclear
Gas
Oil
Coal
-30%
-18%
Notes: The data for 2008 are as presented in Figure 7.5. The data for 2035, based on the New Policies Scenario, are asimplified version of the same analysis, i.e. using OECD benchmarks for most sectors except those directly influenced byclimatic factors, where indicators from Canada and Finland were used for comparison.
The relatively modest pace of energy efficiency improvement projected in the New PoliciesScenario is due in part to the assumed rate of GDP growth, which does not allow for arapid renewal or replacement of the Russian capital stock. It is also due to some remaininggaps in policy. Despite the ambition of some of Russia’s policy objectives – notably the40% reduction in energy intensity that is targeted by 2020 – all the measures that wouldbe required to reach them have yet to be put in place or even, in some cases, identified.An example of the latter is the transport sector, which has seen the fastest pace of energydemand growth in recent years but where there are, for the moment, no standards for fuelefficiency or other efficiency measures under consideration. Our analysis suggests that torealise a greater share of Russia’s energy efficiency potential, including achievement ofthe 2020 target for energy intensity, would require further market-driven reforms, bothinside and beyond the energy sector, and enhanced efforts to more fully reflect costs andexternalities in energy prices.
An even more substantial challenge is one shared by many countries around the world:to see that policies are implemented in an effective way. Russia has put in place a policyand regulatory framework for energy efficiency at a quick pace since 2009, but there areno guarantees that the returns on this investment will be as rapid. Experience from OECDcountries suggests that the different regulatory, institutional, financial and behaviouralobstacles to energy efficiency improvements are not easily removed (IEA, 2009). Despiteefforts to develop Russia’s institutional capacity and expertise on energy efficiency, notablyin the Russian Energy Agency, this process is still at a relatively early stage and will requirea sustained commitment of human and financial resources. Early evidence suggests thatsome important aspects of the energy efficiency strategy, for example, the regional energyefficiency programmes and the industrial energy audits, are making progress but they are
© O
EC
D/IE
A, 2
011

264 World Energy Outlook 2011 - OUTLOOK FOR RUSSIAN ENERGY
running behind the schedule originally envisaged. Monitoring and evaluation of policies,a crucial element of any successful energy efficiency strategy, is hindered by gaps in theenergy data.
The speed with which Russia meets its energy intensity targets does not depend only onenergy prices or policies. The rate of economic growth and the rate of structural changein the economy away from energy-intensive industries will both have a profound effect onthe ratio of energy demand to GDP. As noted above, this was the main reason for the fall inenergy intensity observed in the period 2000 to 2008. Our assumption that GDP growth willbe slower in the years ahead than in 2000 to 2008 also holds back the pace of this structuralchange. This puts greater weight on actual improvements in the efficiency of use in orderto deliver the desired reduction in energy intensity. In the New Policies Scenario, the 40%reduction in energy intensity that is targeted by the Russian authorities for 2020 is achievedin 2028 (Figure 7.10); it is reached in 2025 in the 450 Scenario.17 While the projected declinein Russian energy intensity narrows the gap with OECD countries and the European Union,the rate of the improvement in Russia is slower than the rate anticipated for the other mainemerging economies (the BRICS countries). Russia cuts the energy intensity of its GDP by halfbetween 2009 and 2035,while, over the sameperiod, the reduction in energy intensity in theother BRICS is 56%.
Figure 7.10 ! Primary energy intensity in Russia and other selected regionsin the New Policies Scenario
0
0.1
0.2
0.3
0.4
0.5
0.6
0.7
2000 2010 2020 2030 2035
toep
erthou
sand
dollarsof
GDP($2010,MER
) Russia
BRICS excludingRussia
European Union
40% target
Note: The BRICS countries are Brazil, Russia, India, China and South Africa.
Domestic energy trends by fuel
Fossil fuels are by far the most important source of domestic energy supply in Russia andthis is projected to remain the case throughout the New Policies Scenario. In 2009, fossilfuels accounted for 90% of total primary energy supply, downmarginally from 93% in 1991;
17. This target would be achieved sooner with faster expansion of less energy-intensive sectors such as light industry andthe services sector. The implica!ons of higher GDP growth for the energy sector are examined in Chapter 9.
© O
EC
D/IE
A, 2
011

Chapter 7 - Russian domestic energy prospects 265
7
this decline is projected to continue during the period to 2035, reaching 85% in 2035 as theshares of nuclear and renewables gradually increase (Figure 7.11).
Figure 7.11 ! Primary energy demand in Russia by fuel in the NewPolicies Scenario
0
200
400
600
800
1 000
1990 2000 2010 2020 2030 2035
Mtoe Other renewables
Hydro
Nuclear
Gas
Oil
Coal
Among the fossil fuels, a major strategic issue highlighted in the Energy Strategy to 2030 isthe desirable share of natural gas in the primary energy mix. It increased from 43% in 1991to 54% in 2009 and Russia’s domestic gas consumption has rebounded almost to the levelsof the early 1990s, while domestic oil and coal demand remain at just over half of the 1991figures. Gas demand growth in the 1990s was encouraged by domestic pricing policiesthat kept gas prices low, in large part to manage the social and industrial impact of thepost-Soviet recession, while those for coal and oil were liberalised. Increases in naturalgas prices since 2000 were designed to reign in the rise in gas consumption, while alsosupporting the necessary supply side investments in new gas production. However, naturalgas consumption has remained buoyant in Russia, increasing by an average of 1.4% per yearfrom 2000 to 2010. The target set in the 2009 Energy Strategy is to reduce the share of gasin the fuel mix from 54% to between 46% and 47% in 2030.
In the New Policies Scenario, natural gas consumption grows at themoremodest rate of 0.8% peryear on average over the period from2009 to 2035, reaching 530 bcm in 2035. Annual demand forcoal remainswithinarange from155Mtceto175Mtceover theprojectionperiod,whiledemandforoilmoves higher to 3.2mb/d. Comparing the shares by fuel in the energymix (using our projectionsfor2030,not2035)with those targeted in theEnergyStrategy to2030, theshareofnatural gas inourOutlook, at 53% in 2030, is substantially higher than the figure targeted by the Energy Strategy. Asa consequence, the shares of both coal and oil are lower than their respective targets in the EnergyStrategy: 19% for oil (versus a target of 22%) and 15% for coal (versus 18% to 19%).
Our analysis suggests that, even as natural gas prices rise, gas will continue to have a strongcompetitive position in Russia (Box 7.3) and this underpins its continued prominence inthe fuel mix. The shift in relative prices would need to be larger in order for coal or othercompeting fuels to make significant inroads into the market share of gas. Gas has theadvantage of being the incumbent fuel across large parts of European Russia, where most
© O
EC
D/IE
A, 2
011

266 World Energy Outlook 2011 - OUTLOOK FOR RUSSIAN ENERGY
Russian industrial and residential demand arises. Where price differences are marginal, gasremains the preferred fuel for new equipment in industry and power generation because ofits flexibility and environmental performance. Coal is not considered a plausible competitivefuel for residential use and there are tough constraints on the competitive position ofcoal as an alternative fuel for industrial use or power generation, most notably the longdistance and the high transportation costs between the main areas of coal production inSiberia and the main centres of demand in the European part of Russia. To an extent, thesame consideration applies to hydropower, where the largest share of potential is alsoconcentrated in Siberia (see Chapter 8).
Box 7.3 ! Higher gas prices, efficiency and fuel switching
Rising industrial gas prices in Russia will have implications for the efficiency of Russiangas use and will affect also the attractiveness of gas compared to other fuels. At certainprice levels, it would make sense for the big consumers of gas – in industry and powergeneration – to switch to alternative fuels: the main competing fuel is domestic coal.The average industrial gas price in Russia in 2010 was $2.8/MBtu. In the New PoliciesScenario, this price increases to $6.4/MBtu in 2020 ($230 per thousand cubic metres;all prices in year-2010 dollars) as it reaches an equivalent level to the assumed Russianexport price, minus export duty and transportation costs. Real price increases after 2020are much more modest, at less than 1% per year. The average delivered price of steamcoal to industry remains at between $50 to $60 per tonne throughout the projectionperiod, less than half the average post-2020 gas price on an energy-equivalent basis.While this would appear to suggest that coal will be in a good position to supply aportion of the domestic market currently using natural gas, a closer look reveals thatsubstitution of gas by coal may in practice be more limited. The present averageprice of steam coal is kept low by the predominance of coal deliveries over relativelyshort distances from the main areas of coal production in Siberia. But if coal is totake appreciable market share from gas, it needs to compete further away in theEuropean part of Russia that has the largest concentrations of population andindustry (the Central and Volga Federal Districts in Figure 7.3). Transporting thiscoal across the country pushes up the delivered cost substantially. With incrementaltransportation costs by rail of at least $30/tonne, the price of steam coal toindustry or power plants in the heart of European Russia rises to $80 to $90/tonne.At these price levels, the benefits of choosing coal over natural gas are less evident,noticeably in the power sector, as coal-fired power generation achieves a lowerconversion efficiency than natural gas. Analysing the long-runmarginal costs of Russianelectricity generation,we estimate that, at $85/tonneof steamcoal in EuropeanRussia,gas prices would have to rise to $7.5/MBtu for coal-fired power to be competitive. IntheNewPolicies Scenario, average natural gas prices in Russia do not reach this level atany point in the projection period. As a result, there is little fuel switching from gas tocoal in the power sector (and no sign of this in the end-use sectors).
© O
EC
D/IE
A, 2
011

Chapter 7 - Russian domestic energy prospects 267
7
The current contribution of non-fossil fuels to the Russian energy balance is dominated bynuclear power, which meets 7% of primary energy demand; the share of renewable energysources is small, at 3%,most of which consists of hydropower (2%). Over the period to 2035,all of these energy sources are projected to grow at faster rates than those of the fossil fuels.Nuclear power expands at an average of 2% per year and use of renewable energy grows at4% per year, with non-hydro renewables growing quickly from a very low base. As a result,the combined share of nuclear and renewables in the New Policies Scenario rises from 9%today to 15% in 2035 (13.5% in 2030, in line with the 13% to 14% targeted by the EnergyStrategy).
Domestic energy trends by sector
The increase in Russian energy demand since 2000 has varied strongly by sector. Annualconsumption in the buildings sector (including residential and services) fell by an averageof 0.9% per year over the last ten years; energy use in industry was flat over the decade;the largest contribution to overall demand growth, by some distance, came from thetransportation sector, where consumption grew by 3.1% per year.18 Electricity and heatproduction also showed divergent trends; electricity output increased by almost 2% peryear, while district heating supply fell by an annual average of 1%.
In the New Policies Scenario, energy demand in the transport sector is projected to continueto grow at the fastest rate, albeit at a slower pace, averaging 1.3% per year (Figure 7.12).This is followed by energy use for industry and for power and heat generation. The slowestrate of energy demand growth is in the buildings sector (including residential and services),reflecting the very high potential for energy saving in this sector and the impact, in part, ofnew efficiency policies.
Figure 7.12 ! Incremental energy demand by sector and fuelin the New Policies Scenario, 2009-2035
-0.3% 0% 0.3% 0.6% 0.9% 1.2% 1.5%
-20 0 20 40 60 80 100
Other**
Buildings
Transport
Industry
Other energy sector
Electricity and heat
Finalconsum
paon
Mtoe
Coal
Oil
Gas
Nuclear
Hydro
Biomass andwaste
Other renewables
Electricity
Heat
CAAGR* (top axis)
*Compound average annual growth rate. **Includes agriculture and non-energy use.
18. Figures are provided for the period 2000 to 2010, using preliminary data for 2010; growth rates for the period 2000to 2009 are lower because of the impact of the economic and financial crisis.
© O
EC
D/IE
A, 2
011

268 World Energy Outlook 2011 - OUTLOOK FOR RUSSIAN ENERGY
Electricity and heat
The electricity sector in Russia is the fourth-largest in theworld after theUnited States, Chinaand Japan and, together with the extensive heat supply network, constitutes the backboneof the Russian economy. The electricity and heat systems, linked through the widespreadinstallation of combined heat and power (CHP) plants, face some similar challenges withageing infrastructure but have, in practice, followed quite different paths over the last twodecades. Electricity demand has returned almost to the levels of 1991 and the structure andoperation of the industry have been transformed by a major, albeit incomplete, market-driven liberalisation. Production of district heating, by contrast, is around 40% below 1991levels, growth prospects are tepid and, althoughmost CHP plants are now in private hands,there has been relatively little progress in designing or implementing reforms to meet theparticular challenges of the heat sector.
The reform of the Russian electricity market, launched in 2003, is expected to have asubstantial impact on Russia’s energy sector and longer-term economic performance.This was one of the most ambitious electricity sector reforms undertaken anywhere, andinvolved restructuring the RAO UES electricity system and executing the largest electricitysector privatisation to date. Generating capacity of 100 gigawatts (GW) was sold to newowners, includingmajor Russian companies (Gazprom, SUEK, Lukoil) and foreign ones (Enel,E.ON, Fortum). If Russia can make progress with effective regulation and relieve somepressing constraints on inter-regional transmission, there is the possibility of a competitivewholesale spot market covering European Russia, the Urals andmost of Siberia.
Achieving and maintaining a competitive environment for power generation will be achallenging task. Although liberalisation put a large share of thermal generation capacityinto private hands, the state still owns or controls more than 60% of total capacity and thisfigure has crept up in recent years. Nuclear and most hydropower assets are state-ownedand an additional share of thermal power plants is being brought under the control ofmajority state-owned companies, notably Inter RAO and Gazprom.19 This balance could beaffected by new privatisation efforts, for example, in the hydropower sector. However, thecurrent trend towards consolidation within state-owned or state-controlled entities makesindependent, objective regulation and supervision indispensable if a really competitivewholesale market structure is to flourish.
Another challenge for Russian policy makers over the projection period lies in thecross-linkages between different parts of the energy market that are at different stages ofdevelopment, including the links between wholesale and retail electricity markets, heatsupply, arrangements for new generation capacity, and the markets for different fuels(primarily natural gas). Further development of the electricity sector could be a catalyst forwider energy-sector reforms, but this outcome is far from certain. The market orientationof the wholesale electricity sector stands out from the approach to other sectors of the
19. This trendwas reinforced inmid-2011with the announcedmerger of Gazprom’s power assets (36GW),which includethe Mosenergo company supplying the capital city, with those of privately held IES Holding (16 GW). IES will get a 25%stake in Gazprom Energoholding, whose post-merger 52 GW would represent one-third of Russia’s thermal genera!oncapacity.
© O
EC
D/IE
A, 2
011

Chapter 7 - Russian domestic energy prospects 269
7
energy economy and the government could be tempted to intervene in the power marketin ways that could damage the incentives for efficient investment, operation and end-usein the longer term.
The total installed capacity for electricity generation in Russia is around 225 GW, of whichover two-thirds are thermal power plants, a further 21% are hydropower and 11% arenuclear. Slightlymore than half of the thermal plants are CHP, although precise classificationof the capacity shown in Figure 7.13 is complicated by the fact that most electricity-onlyplants also produce andmarket small amounts of heat.20Gas-fired power plants (electricity-only and CHP together) make up 44% of total capacity.
Figure 7.13 ! Breakdown of installed electricity and CHP capacityin Russia, 2009
0 20 40 60 80 100 120
Gas
Hydro
Coal
Nuclear
Oil
Other renewables
GW
Electricity only
Combined heat andpower (CHP)
In the New Policies Scenario, generation capacity increases to 280 GW in 2035 and totalelectricity generation in Russia is projected to grow by an average of 1.5% per yearbetween 2009 and 2035, reaching 1 440 TWh (Figure 7.14). Current annual final electricityconsumption per capita, at around 5megawatt-hours (MWh), is close to current levels in theEuropean Union (5.5 MWh) and is projected to grow at around 1.9% per-year, overtakingper capita consumption in the European Union in 2017. Natural gas remains the mostimportant fuel for power generation; gas-fired power output rises from 470 TWh in 2009to 630 TWh in 2035, a 44% share of the total. Coal-fired power output stabilises at around225 TWh. The use of fuel oil for power generation tails off almost entirely.
The fastest pace of growth in electricity output comes from nuclear power and also, later inthe projection period, fromnon-hydro renewables. Considering figures for 2030 (to allow forcomparison with the goals set by the Energy Strategy to 2030), the shares of nuclear power(19%), hydropower (15%) and other renewables (4%) in electricity generation in 2030 areclose to the objectives set by the Energy Strategy (in percentage terms rather than absolute
20. IEA sta!s!cs classify almost all thermal capacity as CHP because of its heat output, but for the purposes of modellingthe sector we have adopted the split between power, i.e. electricity-only plants, and CHP shown in Figure 7.13, based onthe type of technology used at the different plants.
© O
EC
D/IE
A, 2
011

270 World Energy Outlook 2011 - OUTLOOK FOR RUSSIAN ENERGY
levels of output; see Chapter 8 for more detail). As a result, the share of non-fossil fuels intotal power output rises from 34% to 38% in 2030, in line with the Strategy’s target figure.
Figure 7.14 ! Electricity generation by fuel in Russia in the New PoliciesScenario, 1990-2035
0
250
500
750
1 000
1 250
1 500
1990 2000 2009 2015 2020 2025 2030 2035
TWh Other renewables
Biomass andwaste
Hydro
Nuclear
Gas
Oil
Coal
Theability of theelectricity systemtodeliver efficient investmentwill beessential to its success.The post-1990 decline in power demand meant that there has been relatively little newthermal or nuclear capacity brought online in Russia over the last twenty years (Figure 7.15).This has left Russia with a stock of power generation assets that is significantly older than thatinOECDEurope (and radically different to that of China,where rapid population andeconomicgrowth mean that the majority of generation capacity has been built within the last tenyears). The high average age of Russian installed capacity also means low average efficiency:according to IEA data, the average thermal efficiency of gas-fired power generation in Russia(excluding CHP) is 38%, compared to an average of 49% in OECD countries and up to 60% fora new CCGT plant, which is the best-available technology. From another perspective, the factthat a lot of power generation capacity needs to be replaced is an opportunity for Russia,given a supportive regulatory framework, to improve rapidly the efficiency andenvironmentalperformance of the sector. In this sense, Russia’s “room formanoeuvre” is much greater thanthat ofmany other leading industrial economies (see Chapter 5).
New investment is currently secured to 2018 through a contractual obligation placed onpurchasing parties under the privatisation process. This administrative approach was ajustifiable way to ensure stable operation of the system, particularly in the absence ofwell-developed financial markets and experienced regulators. However, it lacks flexibilityand reduces the scope for innovation. The government is now reviewing the capacityregime and examining options for securing investment beyond 2018, with the intention ofmoving to a more market-based approach that will deliver efficiently timed, sized and welllocated generation investment at least cost. This will require additional improvements tothe regulatory framework. Policy makers will also need to consider the implications of achanging profile of annual electricity demand over the next decades, in part because of alikely increase in demand for summer cooling (Box 7.4).
© O
EC
D/IE
A, 2
011

Chapter 7 - Russian domestic energy prospects 271
7
Figure 7.15 ! Age profile of installed thermal and nuclear capacity in Russia,comparison with selected countries and regions, 2010
0%
10%
20%
30%
40%
50%
60%
70%
0
10
20
30
40
50
60
70
<10years
10-19years
30-39years
40-49years
Notspecified
GW Nuclear
Oil
Gas
Coal
Russia
China
European Union
Share of thermaland nuclear capacity(right axis):
20-29years
> 50years
Sources: Pla$s World Electric Power Plants Database, December 2010 version; IAEA (2011).
Box 7.4 ! Keeping Russia cool: heat waves and demand for air-conditioning
The summer of 2010 was the hottest on record in Russia: in the European part ofRussia and the southern Urals the variation from average summer temperatureswas over 6°C (RosHydroMet, 2011). While not quite as hot, 2011 has continued therun of summers well above trend temperatures. As Russia gets wealthier and as achanging climate potentially pushes average summer temperatures higher, demandfor cooling is likely to grow. Ownership of air conditioners is still relatively low, at sixper 100 households, according to Rosstat data for 2009, but the market has beenincreasing rapidly.The effects on seasonal electricity consumption of increased demand for coolingcan be seen across the countries of southern Europe, all of whom have experienceda large increase in summer electricity demand over the last decades. In Italy,ownership of air conditioners rose by 15% per year between 2001 and 2009, from11 to 34 units per 100 households (sales were also given a boost in Italy by anespecially intense heat wave in 2003). This has contributed to a summer peak inelectricity demand that is now regularly higher than peak demand in the winter.It is highly unlikely that the seasonal profile in Russia would change to this extent,electricity demand during the Russian winter is around 30% higher than duringthe summer months. Nonetheless, even a slight flattening of the demand profilethrough the year would have implications for the operation of the electricitysystem. Russia would tend to need more baseload generation relative to othercapacity and schedules for plant repair and maintenance, traditionally conductedin the summer months, would need to be reviewed. Demand for cooling wouldalso contribute to a more general trend, the increased share of electricity demand,relative to heat demand, that will affect decisions on new capacity and limit thescope for new CHP plants.
© O
EC
D/IE
A, 2
011
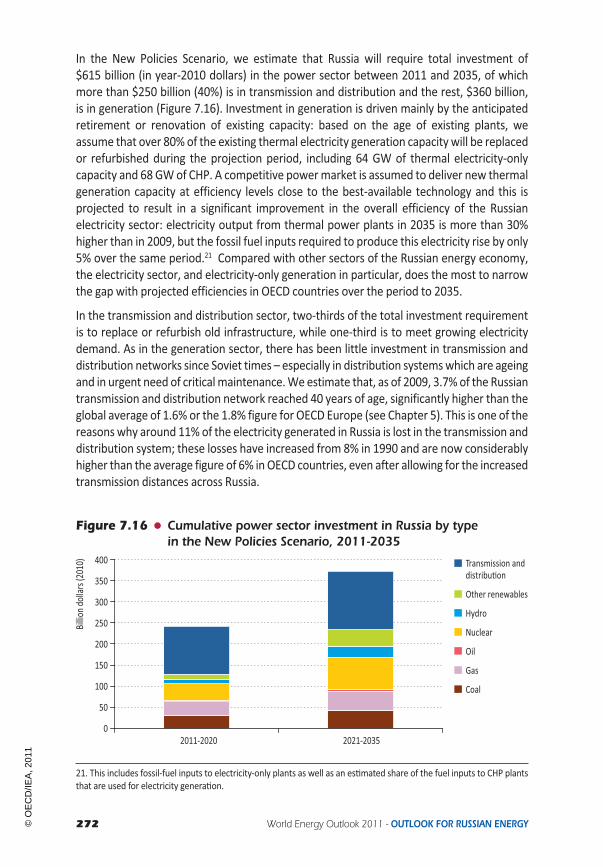
272 World Energy Outlook 2011 - OUTLOOK FOR RUSSIAN ENERGY
In the New Policies Scenario, we estimate that Russia will require total investment of$615 billion (in year-2010 dollars) in the power sector between 2011 and 2035, of whichmore than $250 billion (40%) is in transmission and distribution and the rest, $360 billion,is in generation (Figure 7.16). Investment in generation is driven mainly by the anticipatedretirement or renovation of existing capacity: based on the age of existing plants, weassume that over 80% of the existing thermal electricity generation capacity will be replacedor refurbished during the projection period, including 64 GW of thermal electricity-onlycapacity and 68 GWof CHP. A competitive powermarket is assumed to deliver new thermalgeneration capacity at efficiency levels close to the best-available technology and this isprojected to result in a significant improvement in the overall efficiency of the Russianelectricity sector: electricity output from thermal power plants in 2035 is more than 30%higher than in 2009, but the fossil fuel inputs required to produce this electricity rise by only5% over the same period.21 Compared with other sectors of the Russian energy economy,the electricity sector, and electricity-only generation in particular, does the most to narrowthe gap with projected efficiencies in OECD countries over the period to 2035.
In the transmission and distribution sector, two-thirds of the total investment requirementis to replace or refurbish old infrastructure, while one-third is to meet growing electricitydemand. As in the generation sector, there has been little investment in transmission anddistribution networks since Soviet times – especially in distribution systemswhich are ageingand in urgent need of criticalmaintenance.We estimate that, as of 2009, 3.7%of the Russiantransmission and distribution network reached 40 years of age, significantly higher than theglobal average of 1.6% or the 1.8% figure for OECD Europe (see Chapter 5). This is one of thereasonswhy around 11%of the electricity generated in Russia is lost in the transmission anddistribution system; these losses have increased from 8% in 1990 and are now considerablyhigher than the average figure of 6% inOECD countries, even after allowing for the increasedtransmission distances across Russia.
Figure 7.16 ! Cumulative power sector investment in Russia by typein the New Policies Scenario, 2011-2035
0
50
100
150
200
250
300
350
400
2011-2020 2021-2035
Billiond
ollars(2010) Transmission and
distribuaon
Other renewables
Hydro
Nuclear
Oil
Gas
Coal
21. This includes fossil-fuel inputs to electricity-only plants as well as an es!mated share of the fuel inputs to CHP plantsthat are used for electricity genera!on.
© O
EC
D/IE
A, 2
011

Chapter 7 - Russian domestic energy prospects 273
7
Reform efforts directed at the electricity market have yet to touch the heat sector in thesame way, making the future of district heating in Russia a major uncertainty (Spotlight).Consumption of heat produced by centralised plants – CHPs and large boiler plants – fellduring the 1990s and, in contrast to the rebound in electricity demand after 2000, continuedto decline thereafter (Figure 7.17). Disconnections from the district heating system andreductions in consumption by existing consumers – particularly by large industrial users– outweighed increased demand due to new housing construction. We project that heatsupply will remain relatively flat over the projection period to 2035 in the New PoliciesScenario, rising only by an average of 0.3% per year.
Figure 7.17 ! District heat supply by sector in the New Policies Scenario,1990-2035
0
0.5
1.0
1.5
2.0
2.5
0
50
100
150
200
250
1990 2000 2009 2015 2020 2025 2030 2035
Mtoe Other*
Buildings
Raao of district heatto electricity(right axis)
Industry
*Agriculture, non-energy use and other energy sector, including losses in heat supply.
The heat sector is one of the biggest product markets in Russia and, as the consumer ofaround one-third of Russia’s primary energy, it is a critical sector from an energy savingand environmental perspective. Data on the heat sector is generally poor, but IEA dataputs total deliveries from centralised heat supply sources in 2009 at 5 650 petajoules (PJ)(135 Mtoe or 1 570 TWh), around 1.6 times higher in energy terms than the output fromthe electricity sector. More than 40% of this heat is produced by around 500 CHP plants,50% by heat-only boilers and the balance by industrial and other sources.22
We estimate that between 70% and 80% of the housing stock is at present covered bydistrict heating and that almost 3 billion square metres of heated floor area are connectedto centralised systems; this is currently the primary source of heat for around 100 millionpeople. However, the market for centralised heat supply is being squeezed by industrymoving away fromurban areas and by the rising popularity of new single-family homes awayfrom city centres. A combination of poor levels of service and increasing prices (particularlyfor industry) is also driving away the sector’s existing customers: in Chelyabinsk, for example,
22. Heat generated by industry and households for their own use does not appear as heat produc!on in IEA sta!s!cs,only heat generated and sold is included.
© O
EC
D/IE
A, 2
011
274 World Energy Outlook 2011 - OUTLOOK FOR RUSSIAN ENERGY
over the period 1992 to 2002, more than 660 MW of heat load was detached from thedistrict heating system, as industrial customers installed their own boilers. Some better-offresidential customers are also opting for decentralised space heating in apartments. Thesetrends exacerbate a number of the problems facing the district heating sector. Suppliers areleft with a relatively poor customer base that is even less able to cover the costs of much-needed investment. For CHP plants, it reduces the efficiency of their output by cutting theheat load relative to electricity demand.
S P O T L I G H T
What future for district heating in Russia?
A large share of district heating and CHP plants is often considered a hallmark ofefficient energy use, but this is not the case in Russia. The sector currently suppliesinflexible and generally low quality heating services at increasing tariffs (although,in most cases, still below cost recovery) and with a high level of wasted energy.One objective of the Russian Energy Strategy to 2030 is to develop an advancedheat supply system, with CHP expanding its share of the market at the expense ofheat-only boilers. This would be in line with trends in the rest of the world. However,in practice, heat supply from CHP plants in Russia has fallen substantially since1991 and has yet to show signs of recovery. Although CHP offers great potential forefficiency, comparedwith separate heat and electricity production,market conditionsare not supportive and the sector as a whole remains starved of investment.Small-scale and micro-CHP units are likely to be widely deployed by individualenterprises or isolated communities, but a continued divergence in performanceand prospects between a liberalised power market and an unreformed heat sector isunlikely to favour the commissioning of new large-scale CHP plants.A first priority for Russian policy is to install the meters and controls that will provideaccurate information on heat production and consumption and allow for a realcalculation of costs and expenditures (as well as allowing consumers to regulate theirheat use). The creation of a commercially oriented district heating sector will alsorequire movement on the sensitive issue of tariffs and tariff methodologies so as toallow them to reflect the full costs of efficient supply and to remove cross-subsidies.But an equally significant challenge to reform of the district heat sector (which hasmoved ahead with the adoption of a law on heat supply in 2010) is the absence of asingle ministry or federal entity having overall responsibility for an industry consistingof thousands of heat suppliers, distributors and local municipalities.
There are large potential savings in Russia’s heat supply systems, both in heat generationat CHP plants and boilers and, in particular, in the heat supply networks. The efficiency ofRussia’s CHP plants and heat boilers is well below that of the best technology plant usedinternationally. According to theMinistry of Energy, 80%of Russian boilers are over 30 yearsold (20% are over 50 years old) and there are high, and increasing, losses from an ageingnetwork of almost 200 000 km of heat supply pipes across the country. These losses are
© O
EC
D/IE
A, 2
011

Chapter 7 - Russian domestic energy prospects 275
7
difficult to assess with any accuracy, because of poor metering and data, but are put at 19%of total heat production in the Energy Strategy to 2030. Losses tend to be even higher fordeliveries to households, because of the longer distribution network, reaching 30% of heatsupply and beyond, compared with 5% to 15% in Finland.
Our projection for centralised heat supply in the New Policies Scenario is based on theassumption that reform efforts in the heat sector will continue to be hesitant and subject tostrong regional variations. In the aggregate, investment is sufficient to keep urban districtheating systems operational, but the marginal increases achieved in the efficiency of heatsupply are not expected to win back customers or to reverse the decline in market share– the trend towards decentralised heat provision in industry and the residential sectorcontinues apace. This means a growing discrepancy between the heat and power sectors,which would be felt first and foremost by the regional electricity companies that supplyboth products. As shown in Figure 7.17, the ratio of district heat to total electricity demandis projected to fall substantially over the period to 2035, implying a contracting share of CHPin Russia’s electricity production.
Industry
Russian industry consumes around 125 Mtoe of energy per year, 29% of total final energyconsumption, with gas, electricity and heat accounting for 76% of this amount. The mainindustrial energy users in Russia are producers of iron and steel (29%), chemicals (23%),non-metallic minerals (12%), such as cement and non-ferrous metals (5%), such asaluminium. The energy intensity of Russian industrial production has halved since reachinga peak in themid-1990s. Increased use of productive capacity, closure of themost inefficientplants and implementation of some energy efficiency measures have all contributed to thisimprovement, but a sector-by-sector analysis reveals that Russian industry still uses a greatdeal more energy per unit of production than its international counterparts.
The iron and steel industry is a case in point. This sector has undergone significant structuralchanges over the last two decades: for example, the share of Russian steel production fromopen-hearth furnaces, the most inefficient technology, declined from over 50% in 1990 tounder 10% in 2009 – a faster shift away from this technology than seen in Ukraine (WorldSteel Association, 2000, 2010). Even so, we estimate that the energy savings potential inRussia remains significant, at 5.3 gigajoules (GJ) per tonne of steel produced (IEA, 2010).23Raising the efficiency level of Russian iron and steel production to OECD levels would resultin savings of 5.3 Mtoe from total energy consumption in this sector of around 35 Mtoe.For the industrial sector as a whole, the estimated savings relative to OECD efficiencies are27Mtoe, or 21% of current consumption.
In theNewPolicies Scenario, industrial energy consumption growsby27%over theperiod2009to 2035, at an average rate of 0.9%per year. This is less than the rise in overall industrial output,an intensity improvement that is helped by a gradual shift towards lighter manufacturing. Thestructural shift, together with a swing in relative gas and power prices in favour of power,
23. This is based on a comparison with best-available technologies; the savings considered for our energy savingsanalysis, rela!ve to OECD benchmarks, are less.
© O
EC
D/IE
A, 2
011

276 World Energy Outlook 2011 - OUTLOOK FOR RUSSIAN ENERGY
pushes up industrial demand for electricity, which grows at an average of nearly 2% per year,becoming by 2035 the largest single direct energy input to the sector (Figure 7.18). Industry’suse of district heat is expected to remain relatively flat, as manufacturers build more on-siteco-generation plants and boilers (for which gas remains the preferred fuel).
Figure 7.18 ! Industry energy demand by fuel in Russia in the New PoliciesScenario, 2000-2035
0
10
20
30
40
50
60
2000 2009 2020 2035
Mtoe Coal
Oil
Gas
Electricity
Heat
Biomass and waste
Energy efficiency improvements in the industrial sector are expected to be driven by theintroduction of new machinery and technologies, as existing industrial assets reach the endof their useful life. The speed of this turnover will depend in part on energy prices, particularlyfor those industrial sectors that are competing on export markets. However, in many cases theshare of energy in overall production costs is relatively low and it is not axiomatic that priceincreases alone will be sufficient to lead to more widespread investment in new technologies.This is the logic behind the provision in energy efficiency legislation for mandatory energyaudits for all industrial enterprises spending more than 10 million roubles per year on energy($350 000 at mid-2011 exchange rates), a provision that applies to around 150 000 companies.The audits and the energy “passports” issued as a result are intended to raise awareness ofenergy saving opportunities and propel companies into adopting efficiency projects but, thusfar, implementation is proceeding relatively slowly.24 The energy services market, which couldhelp companies take advantage of energy saving opportunities, is still relatively undeveloped,held back by some technical and legislative barriers aswell as poor access to longer-term finance.
Transport
The transport sector in Russia accounts for 21% of final energy consumption, 90Mtoe. It hasbeen the fastest growing of all the end-use sectors, with energy demand increasing at anaverage of 3.4% per year from 2000 to 2008, before declining by 8% in 2009. Overall energyuse in transportation is divided between passenger and freight transportation (65% of thetotal) and the energy used for oil and gas transportation. In the New Policies Scenario,
24. The first round of energy audits for eligible industrial companies should be completed by the end of 2012. Thisrequirement also applies to all u!li!es, energy suppliers and public bodies and authori!es. The Russian Energy Agencyis making efforts to accelerate this process, but given a rela!vely slow start and the large number of eligible companiesthe deadline may need to be pushed back.
© O
EC
D/IE
A, 2
011

Chapter 7 - Russian domestic energy prospects 277
7
energy demand in the transport sector grows by 1.3%per year (Figure 7.19). The sub-sectorsresponsible for the largest amounts of the additional energy consumed are pipelines androad transportation (33% and 28%, respectively), but the fastest rates of growth in demandcome from railways (3.5% per year) and domestic aviation (2.9% per year).
Figure 7.19 ! Energy consumption in the transport sector by type in theNew Policies Scenario, 2000-2035
0
20
40
60
80
100
120
140
2000 2009 2015 2020 2025 2030 2035
Mtoe Other
Navigaaon
Domesacaviaaon
Rail
Road
Pipeline*
*Pipeline energy consumption refers to the energy used for oil and gas transportation.
The Russian carmarket has grown very quickly over the last ten years, particularly taking intoaccount the decline in the population. According to Rosstat, the number of privately-ownedpassenger vehicles increased from under 20million in 2000 to over 31million in 2009 (fromunder 10million in 1991). Russia was one of the fastest growing light-duty vehiclemarkets intheworld before themarket was hit hard by the economic crisis: sales were down by almost50% in 2009, compared with the previous year. A recovery is underway, but the prospectsfor consistently high rates of market growth are constrained by long driving distancesbetween Russian cities and the relatively slow pace of infrastructure development; this isexpected to hold back increases in energy demand for road transportation after 2015.
Russia aims to double the length of its roads by 2030 and to expand the rail network anddomestic aviation and to make more efficient use of inland waterways (Governmentof Russia, 2008). The current density of the national road network in Russia is low byinternational standards, because of the country’s huge size; at 776 000 km, the total lengthof Russian paved roads is 20% less than the figure for Japan, even though Russia’s landarea is 45 times larger. There is also a growing disparity between vehicle sales growth andinfrastructure development: the size of the Russian vehicle fleet increased by 60% in theyears from 2000 to 2009, but the road network increased by only 3% over the same period.In the New Policies Scenario, car ownership rises steadily through the projection period, toaround 390 cars per 1 000 people in 2035, but the increase is slower than during the periodfrom 2000 to 2009, when the number of cars per 1 000 people increased from 140 to 220(Table 7.4).
© O
EC
D/IE
A, 2
011

278 World Energy Outlook 2011 - OUTLOOK FOR RUSSIAN ENERGY
Table 7.4 ! Passenger light-duty vehicle ownership in selected countriesin the New Policies Scenario (vehicles per 1 000 people)
2000 2009 2020 2035 2009-2035*
Russia 140 220 300 390 2.2%
China 4 30 110 300 9.5%
European Union 430 475 520 560 0.7%
*Compound average annual growth rate.
We estimate that the average on-road consumption of the Russian car fleet is over 13 litresper 100 km. If Russia were to raise efficiency levels to match those of OECD Europe (wherethe average efficiency is about 8 litres per 100 km), this would result in an annual savingof around 12 Mtoe (nearly 240 kb/d) in oil products. In the New Policies Scenario, in theabsence of specific policies to encourage fuel efficiency or renewal of the vehicle stock,Russia moves relatively slowly to tap these potential gains. We project a gradual increasein the average efficiency of the Russian car fleet, reaching 8 litres per 100 km by 2035. Theimprovement is due to broader international trends in car design and efficiency, transferredto Russia in the shape of imported cars and foreign brands for local assembly,25 thatinfluence also the fuel economy of Russian brands. The trend towards greater efficiency ishelped by a shift away from premium high-performance vehicles towards cheaper, moreefficient models for larger-volumemarkets.
The use of natural gas vehicles in Russia is projected to increase rapidly, helped by supportfrom Gazprom and regulations that keep the price of compressed natural gas (CNG) belowthe gasoline price. There are currently around 100 000 natural gas vehicles in Russia and250 CNG filling stations. Gazprom is supporting a steady expansion of the CNG infrastructureand this is expected to boost natural gas use in road transportation by an average rate of13% per year. In the New Policies Scenario, sales of natural gas passenger vehicles rise tomore than 200 000 per year by 2035 (10% of total Russian sales). Starting from a low base,overall natural gas consumption in road transportation is projected to reach 3 bcm of gasper year in 2035, amounting to a share of around 5% of the total energy used for roadtransportation.
Energy demand for oil and gas pipeline transportation is projected to increase graduallyover the projection period by around 1.4% per year, driven by a rise in gas productionand exports and the resultant growth in the overall length of the pipeline transportationsystem. We estimate that potential savings from greater efficiency in gas transportationare around 6Mtoe (7 bcm). Gazprom has been investing in replacing inefficient equipmentand compressor stations (more than $5 billion in the period 2006 to 2009, according toGazprom’s annual reports). However, the available data does not show that the amount ofenergy used to transport Russia’s gas is declining: for the period 2000 to 2009, the amount ofenergy required tomove 1million cubic metres along 1 km of pipeline has remained stable,
25. According to Rosstat, non-Russian brands account for more than a third of the Russian vehicle fleet and over half inthe two largest ci!es, Moscow and St. Petersburg.
© O
EC
D/IE
A, 2
011

Chapter 7 - Russian domestic energy prospects 279
7
at around 20 kilogrammes of oil equivalent. This suggests that while Gazprom’s investmentmay be counteracting the natural deterioration in performance as existing equipment getsolder, it is not yet increasing the efficiency of the system as a whole.
In the gas sector, much of the attention and investment is focused on the high-pressuretransmission network, but a greater concern, from the viewpoint of efficiency andenvironmental impact, is themuch longer gas distribution system. Gas distribution losses arearound 6 bcm, according to IEA data (but the real figuremay be considerably higher). Basedon earlier research (IEA, 2006), wemake a conservative estimate that up to 12 bcm per yearcould be lost, due to leakages, across Russia’s gas network as a whole. In the distributionnetwork the investment that would be required to reduce leakages is difficult to justifyon economic grounds, even with carbon credits, since the leaks occur across more thanhalf-a-million kilometres of pipes.
Buildings
The buildings sector (including residential and services) accounts for 35% of Russian finalconsumption, a total of 147 Mtoe in 2009, making it the largest energy end-use sector.Consumption of heat makes up the largest share of energy use (45%), followed by naturalgas (30%) and electricity (16%). Most of the energy is used for space andwater heating. Thecombined share of energy used for cooking, appliances and lighting is estimated to be lessthan 20%. Energy use in buildings has fallen since 1991, at the rapid rate of 2.3% per year,although the rate of decline has slowed since 2000. Even so, the building stock remains oneof the main sources of potential energy efficiency savings available to Russia. ComparingRussian residential energy use with Canada, the OECD country with the closest averagetemperatures to Russia, we found that more than twice as much energy is used to heat asquare metre of residential space in Russia (Figure 7.20).26 This finding matches evidencefrom projects implemented in Russia, for example a World Bank project in Cherepovetsduring the late 1990s that retrofitted 650 buildings and reduced heat demand by 45%(World Bank, 2010). Total potential savings in the buildings sector are 61 Mtoe, of whichalmost 47Mtoe are in space heating.
A challenge for Russia in raising the efficiency of its residential housing stock is to acceleratethe refurbishment rate of existing buildings. This rate has been slowing in Russia over recentdecades. In the 1970s to 1980s, major repairs were carried out on 3% of total housing stockeach year, but this indicator had fallen to 0.6% by 2009. Inmulti-family buildings it is difficultto co-ordinate building-wide efficiency initiatives among themultiple owners and then veryhard for homeowners’ associations to obtain credit for capital improvements: easing accessto finance for such improvements in the buildings sector will be vital to achieve Russia’sefficiency goals.
A range of new policies and measures, not all yet backed up by mechanisms forimplementation, are assumed in the New Policies Scenario to moderate the increase in
26. The calcula!on was adjusted for the different composi!on of the housing stock in the two countries, the majorityof residen!al buildings in Russia are mul!-family homes rather than single-family, whereas the opposite is the case inCanada.
© O
EC
D/IE
A, 2
011

280 World Energy Outlook 2011 - OUTLOOK FOR RUSSIAN ENERGY
energy use in buildings and could – if extended and implemented in full – have a profoundimpact on the Russian buildings sector.27 These include stricter building codes for newbuildings, new appliance efficiency standards and the phase-out of incandescent lamps,requirements to renovate the existing building stock and incorporate energy efficiencyimprovements, and the obligation to install meters in all buildings for electricity, heat,water and natural gas. There is a specific policy emphasis on efficiency in the public sector;as of 2010, for example, all state entities have been obliged to reduce their specific energyconsumption of energy and water by at least 3% per year, for the five years to 2015.28 Insome areas, these initiatives at federal level follow in the footsteps of existing measuresenacted by individual regions or cities (Box 7.5); in most cases, though, they represent asubstantial new direction for Russian policy.
Box 7.5 ! As efficient as... Moscow?
The construction boom in Moscow over the last decade has added over 3 million m2
of residential space to the housing stock each year; the rate of renovation of theexisting building stock has also been higher than elsewhere in the country. The capitalhas not only grown, it has also become richer: over the period from 2000 to 2009,Moscow’s real GDP increased by over 6% per year (8.5% per year excluding 2009).Yet this increase in wealth and living space is not reflected in the indicators for energyand water use.Water consumption fell over the same period by an average of almost4% per year, while hot water consumption fell by 1.4% per year. Residential demandfor heat was flat and gas consumption by households declinedmarginally by 0.3% peryear. Of all the main indicators, only residential electricity use showed an increase.The performance ofMoscow stands out for two reasons: because of the concentrationof construction activity andwealth in the capital and also becauseMoscow, alongwithregions such as Tatarstan and Chelyabinsk, has been among the front-runners inpromoting more efficient energy use in Russia in the buildings sector. Acting aheadof federal legislation, Moscow introduced a new building code in 1994, tightenedthe requirements again in 1999 and was one of the first movers in promotingthe installation of electricity meters. As well as providing incentives for efficiencyimprovements, metering revealed, in some cases, that actual consumption was wellbelow the level that had been assumed and billed.Measures such as these are now being adopted more widely – as of 2009, 53 regionsof Russia, out of 83, had introduced building codes stipulating energy efficiencystandards – and policy efforts are now underpinned by stricter federal regulationas well. Successfully replicating and surpassing Moscow’s efforts across the countrywould be a notable achievement for energy efficiency in Russia.
27.We assume that thesemeasures are implemented in part (or in some cases, with a delay) in theNewPolicies Scenario(Table 7.3).28. This type of measure raises the broader ques!on about the design of some of Russia’s energy efficiency measures,whether they find the right balance between administra!vemeasures and financial incen!ves to encouragemore energyefficient choices.
© O
EC
D/IE
A, 2
011

Chapter 7 - Russian domestic energy prospects 281
7
In the New Policies Scenario, policy action is not strong enough to continue the declinein energy use in the buildings sector experienced since 1991. Overall energy demand forbuildings (including residential and services) grows at 0.7% per year on average, pushedhigher by demand in the services sector, which expands at 1% per year, and by the assumedincrease in living space per capita. There is an improvement in the efficiency of energy usein the residential sector: the average amount of energy required to heat a square metre offloor space goes down from 0.023 toe in 2009 to 0.018 toe in 2035 (Figure 7.20). However,the projected pace of this improvement still leaves Russia using 50%more energy to heat asquare metre of floor space in 2035 than Canada used in 2009.
Figure 7.20 ! Efficiency of energy consumption for space heatingin the residential sector, 2009-2035
0
0.005
0.010
0.015
0.020
0.025
2009 2015 2020 2025 2030 2035
toep
ersquare
metre Russia
Canada, 2009
© O
EC
D/IE
A, 2
011

© O
EC
D/IE
A, 2
011

Chapter 8 - Russian resources and supply potential 283
CHAPTER 8
H I G H L I G H T S
RUSSIAN RESOURCES AND SUPPLY POTENTIAL
Raising the next generation of super-resources?
" Russia has world-class energy resources sufficient to underpin its continuing roleas a major producer and exporter throughout the period to 2035 and beyond. Ourprojections of fossil fuel supply are not limited by availability of resources, but ratherby the long time scales and technical challenges involved in developing new fields inremote areas, while production from existing fields is declining.
" In the New Policies Scenario, oil production plateaus around 10.5 mb/d for thecoming five years before starting a slight decline that takes output to 9.7 mb/d in2035. Oil exports decline from 7.5 mb/d in 2010 to 6.4 mb/d in 2035. There is animportant shift to new, higher-cost production areas in Eastern Siberia, the Caspianand the Arctic. Natural gas liquids also play a growing role.
" We assume that the tax regime will provide sufficient incentives both for thedevelopment of new production areas and for continued investment in the coreregion of Western Siberia. However, if the prevailing effective tax rate in thetraditional producing regions were maintained, our projections for production (andexport) would be around 1.8 mb/d lower in 2035.
" Gas production increases from 637 bcm in 2010 to 860 bcm in 2035. Net gasexports rise substantially from 190 bcm to close to 330 bcm in 2035. Productionfrom the Yamal peninsula becomes the new anchor for Russian gas supply, helpingto offset the expected declines in other parts of Western Siberia and to meetdemand growth, alongside output from the Barents Sea and Eastern Siberia.A larger share of gas output is expected to come from companies other thanGazprom, but both gas and oil production remain dominated by Russian state andprivate companies.
" Coal production rises to 270 Mtce in the mid-2020s and then starts a slow decline.Domestic demand for coal is flat over the period and export levels start to tail off inthe latter part of theOutlook period, as global coal demand plateaus and Russian coalstruggles to compete.
" Russia has large-scale plans to expand the role of nuclear power and hydropower.Although our projections for new nuclear capacity are lower than these official plans,output from nuclear plants still expands by two-thirds over the period to 2035, at arate of 2% per year. Large hydropower increases at 1% per year. The contribution ofnon-hydro renewables increases at the fastest rate, but remains small relative both toother fuels and to the large potential.
© O
EC
D/IE
A, 2
011

284 World Energy Outlook 2011 - OUTLOOK FOR RUSSIAN ENERGY
OverviewRussia hasworld-class energy resources: 13%of theworld’s ultimately recoverable resourcesof conventional oil, 26% of gas and 18% of coal (Figure 8.1), as well as clear potential toincrease its output from renewable sources of energy. Although often located in remoteregions with harsh climates, these resources underpin Russia’s continuing role as a majorenergy producer and exporter throughout the projection period and beyond. Production isnot expected to be limited by access to capital (though this could be improved), but by thelong time scales and technical challenges involved in developing new fields in remote areasat a time when production from existing fields will be declining.
Figure 8.1 " Russian share in global resources, production and export offossil fuels, 2010
0%
5%
10%
15%
20%
25%
30%
Resources Produc^on Exports
Coal
Oil
Gas
Notes: Only conventional oil and gas resources have been taken into account. If unconventional gas resources areincluded, Russia’s share of gas resources drops to 22%. Data for production and exports is from 2010; the figure forexports is a share of net exports from all WEO regions.Source: IEA databases.
In the New Policies Scenario, Russian oil production plateaus around 10.5 million barrels perday (mb/d) for the coming five years and then declines slowly to 9.7 mb/d in 2035 (Figure 8.2).Net exports of crude and refined products are reduced as internal demand gradually increases,particularly from the transport sector; this means that the high water mark for Russia’s net oilexports is projectedprior to 2015.Over the projection period, the centre of gravity of Russian oilproduction shifts further east, away from the traditional production areas in Western Siberia.There is anaccompanying re-orientationofexport flows in favourof fast-growingAsianmarkets.
Gasproductionincreasesfrom637billioncubicmetres(bcm)peryearin2010to690bcmin2020and860bcmin2035(Figure8.3).1Moderategrowth indomesticdemand,asRussiastarts tousegasmoreefficiently, allows for an increase innet exports to close to330bcmper yearby2035.The major change in exports over the projection period is the start of gas trade with China,anticipated towards 2020, which increases rapidly after 2020 to reach 75 bcm per year in2035. Exports to Russia’s long-standing export markets in Europe increase more slowly,reaching around 235 bcm in 2035, compared with 200 bcm in 2010.2
1. For an explana!on of the way that IEA presents gas produc!on volumes from different countries, refer to Box 8.3.2. Gazprom imports gas from the Caspian region, so the total volume of gas exported by Russia is higher than the figurefor net exports.
© O
EC
D/IE
A, 2
011

Chapter 8 - Russian resources and supply potential 285
8
Figure 8.2 " Russian oil balance in the New Policies Scenario
0
2
4
6
8
10
12
1990 2000 2010 2020 2030 2035
mb/d
Net exports
Produc^on
Consump^on
Figure 8.3 " Russian gas balance in the New Policies Scenario
0
200
400
600
800
1 000
1990 2000 2010 2020 2030 2035
bcm
Net exports
Produc^on
Consump^on
Figure 8.4 " Russian coal balance in the New Policies Scenario
-50
0
50
100
150
200
250
300
1990 2000 2010 2020 2030 2035
Mtce
Net exports
Produc^on
Consump^on
© O
EC
D/IE
A, 2
011

286 World Energy Outlook 2011 - OUTLOOK FOR RUSSIAN ENERGY
Coal production rises to close to 270 million tonnes of coal equivalent (Mtce) in the mid-2020s and then decreases slowly thereafter (Figure 8.4). Domestic coal demand remainsflat, as efficiency improvements in coal use offset the effects of economic growth. Althoughexports have expanded strongly in recent years, the competitive position of Russian coal, bothon domestic and international markets, is held back by high transport costs. As Europeandemand for imported coal declines, so the focus for Russian coal export switches to the east;China’s relative proximity to themainRussian coal reserves in Siberiamakes it themain exportdestination. But, overall, Russia struggles to compete with other exporters as global demandfor coal decreases slowly after peaking in 2025 in the New Policies Scenario.
Alongside its wealth of fossil-fuel resources, Russia also has a major nuclear industry andhuge potential both for hydropower and for harnessing other renewable sources of energy.The contribution of nuclear power and renewables is projected to increase steadily over theprojection period, with their combined share in Russia’s primary energy supply rising from10% in 2009 to 15% in 2035. The largest increases come from nuclear power, which growsat an average of 2% per year, and hydropower at 1% per year. However, the fastest ratesof growth come from non-hydro renewables, which rise from a very low base at an averageof 7% per year, with the increases heavily weighted towards the latter part of the projectionperiod, as supportmechanisms are put in place and technology costs come down (Figure 8.5).
Figure 8.5 " Russian nuclear and renewables output in the NewPolicies Scenario
0
20
40
60
80
100
120
140
1990 2000 2010 2020 2030 2035
Mtoe Other renewables
Biomass and waste
Hydro
Nuclear
The lion’s share of production fromnuclear power and renewables is consumeddomestically,although there are projects underway or under consideration that have an eye to exportmarkets, such as hydropower projects near the Chinese border or the proposed nuclearpower plant in the Russian Baltic enclave of Kaliningrad. Future renewables-based electricityand biomass projects could also be oriented towards export to the European Union, wherethey could help to meet policy targets for increased use of renewable energy resources.The primary actors in the Russian nuclear power industry are state-owned companies andthere has also been a consolidation of hydropower assets within the majority state-ownedRushydro over recent years, although some hydropower plants are controlled by private
© O
EC
D/IE
A, 2
011

Chapter 8 - Russian resources and supply potential 287
8
Russian industrial groups (and there are also indications that the governmentmay reduce itsstake in Rushydro over the next few years). Growth in the renewables sector is expected toopen up opportunities both for new entrants and for the existing electricity utilities.
The main industry players in oil production are all Russian companies: two majority state-owned companies, Rosneft and Gazprom (including its primarily-oil-producing subsidiaryGazpromNeft), and seven that are privately owned or publicly traded: Lukoil, TNK-BP,SurgutNefteGaz, Tatneft, Bashneft, Russneft and Slavneft (controlled jointly by TNK-BP andGazpromNeft). Together, these produce about 90% of the country’s oil (Figure 8.6). Smallerprivate Russian oil companies and a sprinkling of international oil companies (ExxonMobil,Shell, Total, Statoil, Wintershall, ENI3) contribute the rest under various arrangements(production sharing agreements in the cases of ExxonMobil in Sakhalin-1 and Total inKharyaga; minority ownership, with or without operatorship, for the others). Even whereprivately owned, the large Russian oil companies all retain strong ties with the government.Long distance oil pipelines are a monopoly of state-owned Transneft.4
Figure 8.6 " Estimated Russian oil and gas production by typeof company, 2010
0 2 4 6 8 10 12
Oil
Gas
Mboe/d
Gazprom
Novatek
Russian oil companies
Russian state oil companies
Other Russian oil/gas producers
Foreign interna^onal companies
Largest-seven private Russianoil companies
Notes: TNK-BP is classified as Russian. Data are in million barrels of oil equivalent (Mboe) to allow for comparison byenergy content; the 10.5 Mboe/d of gas production is equivalent to 637 bcm per year.
There are about 80 gas producing companies in Russia (Henderson, 2010). Most are smalland regional in scope and gas production is dominated by Gazprom (80%). There are growingcontributions from private gas producer Novatek (6%) and from oil companies producingassociated gas (10%), with the rest being divided between foreign companies and small localindependents. Gazprom’s hold on the Russian gas industry is secured by its monopoly overlong-distance gas transport pipelines andgas exports, although its dominant position inRussianproduction couldbe challenged toadegreeby the riseofNovatekandotherRussianproducers.
3. Wintershall and ENI (together with ENEL) are partners in gas fields with produc!on of condensate.4. The only excep!on is the Caspian Pipeline Consor!um (CPC) pipeline that crosses from the northern Caspian to theRussian Black Sea port of Novorossiysk. Transne" is a minority shareholder in this pipeline. Around 80% of CPC capacityis used for transporta!on of Kazakhstan crude oil.
© O
EC
D/IE
A, 2
011

288 World Energy Outlook 2011 - OUTLOOK FOR RUSSIAN ENERGY
We assume that the structure of the oil and gas industry remains dominated by Russianstate and private companies throughout the period. Despite intermittent signs from thegovernment of a desire to open the Russian oil and gas industry to foreign investment,history suggests this is likely to be a slow process. A possible exception in the medium termcould be the participation of Chinese (and perhaps Indian) companies in Eastern Siberia andthe Far East, possibly as providers of loans rather than providers of equity. Previous effortsby Chinese companies to secure roles in the Russian upstream have yielded moderateresults,5 but China’s growing role in the worldwide energy industry and its position as amarket for Russia’s eastern resourceswouldmake this a natural evolution, albeit a politicallysensitive one. Participation of western international companies is likely to be limitedmainlyto the Arctic or deep offshore resources, which are very capital intensive and require themost recent technologies, as exemplified by the participation of Total and Statoil in theShtokman project, of Total and other foreign companies in the Yamal-LNG project and theagreement between ExxonMobil and Rosneft for exploration in the deep waters of theBlack Sea and the Kara Sea in the Arctic. Participation by western companies in a large gas-to-liquids (GTL) plant could also be a possibility. On the other hand, the provision of oilfieldservices is likely to come increasingly from independent service companies, as the servicearms of previously vertically integrated oil and gas companies continue to be spun-off,bringing increased competition and efficiency.
Russia’s coal industry was slower than the oil industry to restructure in response to thepost-Soviet downturn. But the sector has now been fully liberalised and productionincreased steadily after 1999 until it was hit by the 2009 economic crisis. Of the ten majorproducers with output greater than 10 Mtce per year, SUEK has emerged as the largest.Several of the key players are part of large diversified groups, with activities including powergeneration, steel production, mineral extraction andmetals fabrication, e.g.Mechel, Evraz,Severstal, which tend to use their coal production within the group rather than market it.SUEK is the number one exporter, with 30 Mtce out of about 80 Mtce total net exports in2010. We assume that the industry will continue to rationalise.
OilResources
We estimate proven reserves of oil in Russia to be about 77 billion barrels. This estimateis close to the numbers quoted by the BP annual statistical review (BP, 2011) and by BGR(BGR, 2010). It matches well with the sum of the numbers published by the main Russianoil companies. As all the major Russian oil companies have their reserves credibly audited(both according to the rules of the US Securities and Exchange Commission (SEC) and therecommendations of the Petroleum Resources Management System [PRMS]), this provenreserves number is well established. Ultimately recoverable resources (URR) are less wellestablished. Based on the 2000 United States Geological Survey (USGS) assessment and
5. Sinopec has a joint-venture with Rosne" (Udmurtne") producing oil in the Volga-Ural basin, and China Na!onalPetroleum Corpora!on has an explora!on joint-venture with Rosne" in Eastern Siberia (Vostok Energy). Also of noteis the Chinese loan for the construc!on of the Eastern Siberia-Pacific Ocean pipeline in exchange for preferen!al futuresupply.
© O
EC
D/IE
A, 2
011

Chapter 8 - Russian resources and supply potential 289
8
subsequent updates,6 IEA analysis puts the level of ultimately recoverable resources ataround 480 billion barrels (crude and natural gas liquids), of which about 144 billion havealready been produced.
Due to Russia’s size and diversity, we have considered andmodelled themain resource-richareas of Russia individually in thisOutlook; these eight basins (the same for both oil and gas)are shown in Figure 8.7. The bulk of these resources are in the historical producing regionsof Western Siberia and Volga-Urals, which together are estimated to hold almost 65% ofthe total remaining recoverable conventional oil (Table 8.1). Two factorsmightmake this anoverstatement of the dominance of the traditional areas:
! Attributing too large a reserve growth to these regions; on the one hand they are verymature; on the other hand, small increases in recovery rates in their huge historical fieldswould yield large additional reserves.
! Fairly small resources estimates in the USGS study for the newer regions. Indeedother sources give larger numbers for ultimately recoverable resources in EasternSiberia (Efimov, 2009), in the Sakhalin area, and in the Arctic offshore continental shelf(Government of Russia, 2009; Kontorovich, 2010; Piskarev, 2009), including the BarentsSea, the Kara Sea and the largely unexplored Laptev, East Siberian and Chukchi Seas. Thedeep-offshore Black Seawas not assessed byUSGS, but is generally creditedwith 7 billionbarrels of recoverable resources.
Table 8.1 " Conventional oil resources in various Russian regions, end-2010(billion barrels) (crude + NGLs)
Provenreserves*
Ultimatelyrecoverableresources
Cumulativeproduction
Remaining recoverable resources
Total Share Share perABCD**
Western Siberia 48 266 80 186 55% 55%
Volga Urals 16 81 51 29 9% 10%
Timan Pechora 4 28 5 22 7% 7%
Eastern Siberia 5 21 0 21 6% 14%
Sakhalin 2 9 1 7 2% 3%
Caspian 2 25 5 20 6% 5%
Barents Sea 0 18 0 18 5% 3%
Other offshore Arctic 0 30 0 30 9% 3%
Others 0 2 1 0 0% 0%
Total Russia 77 480 144 336 100% 100%
*Proven reserves are approximately broken down by basin based on company reports.**This column is an IEA estimatebased on the Russian (“ABCD”) classification system (Box 8.1) taking into account recovery factors and the probabilitiesof the various categories to estimate a mean value.Sources: USGS; data provided to the IEA by the US Geological Survey; IEA databases and analysis.
6. We have used: updates to USGS resource es!mates published since the 2000 assessment; cumula!ve produc!on asper IEA databases; and some simplifying assump!ons on theworldwide distribu!onof the “reserves growth” componentof the USGS assessment.
© O
EC
D/IE
A, 2
011

290
World
EnergyO
utlook2011
-OU
TLOO
KFO
RRU
SSIANEN
ERGY
Figure 8.7 " Oil and gas basins in Russia
Sakhalin
Other offshore Arctic
Other offshore Arctic
Barents Sea
Sea of
Okhotsk
Volga/
UralsEastern Siberia
Laptev Sea
East Siberian Sea
Chukchi
Sea
Bering
Sea
Caspian
Sea
Black
Sea
Baltic Sea
Caspian
Mongolia
China
China
Japan
Kazakhstan
Ukraine
Azerbaijan
Georgia
Armenia
Iran
Azer.
TurkmenistanUzbekistan
Belarus
EstoniaLatvia
Lithuania
Poland
Sweden
Finland
Norway
Western Siberia
Yamal-NenetsAutonomous
Region
Timan
Pechora
Kara SeaYamalPeninsula
Sakhalin
Barents Sea
This map is for illustrative purposes and is without prejudice to the status of or sovereignty over any territory covered by this map.
Notes: “Western Siberia” includes only onshore; offshore (Kara Sea) is included in “Other offshore Arctic”. “Eastern Siberia” includes the northern part of the Krasnoyarsk administrative region (thelocation of the Vankor field); although this area is geologically related to theWestern Siberian basin, it is reported as Eastern Siberia, to which it belongs administratively. Sakhalin includes SakhalinIsland and the Sea of Okhotsk. Caspian includes the Russian sector of the Caspian Sea and the pre-Caspian basin: the North Caucasus region is included here as well, both because the fields in theNorth Caucasus are geologically related to the pre-Caspian basin and because production and reserves in the region are considered state secrets, making it difficult to establish separate projections.
© OECD/IEA, 2011

Chapter 8 - Russian resources and supply potential 291
8
Our USGS-based estimates have been compared to the “ABCD” resource estimatespublished by the Russian government (Table 8.2) and, to the extent that the two systemscan be compared, the results are consistent (Box 8.1 details the Russian classification of oiland gas resources and how it compares to other international systems).
Addition of the proven, probable and possible reserves of the main Russian oil companies(as audited under the PRMS scheme) gives a total of about 150 billion barrels. This takesinto account only already licensed fields and does not include the vast regions that areunlicensed and poorly explored, including most of the Arctic continental shelf. So the totalvalue for ultimately recoverable resources of 480 billion barrels, which forms the basis of ourprojections for future production, is plausible.
Box 8.1 " Russian reserves system versus the Petroleum ResourcesManagement System
Although the reserves of Russian oil and gas companies are increasingly reported underthe Petroleum Resources Management System (PRMS) classification system or the USSecurities and Exchange Commission rules for reserves reporting, documents fromthe Russian government and academic institutes generally use the Russian system ofreserves classification. This system uses alphabetical classes (A, B, C1, C2, D1, D2 andD3) that reflect decreasing certainties for technically recoverable resources:" “A” are reserves that have been fully ascertained through drilling and production.
" “B” are reserves that have been established through well-testing.
" “C1” are estimates for established fields, including parts that may not have beendrilled and tested yet, but for which geophysical information is available.
" “C2” represents preliminary estimates based on exploration.
" “D1” represent estimates of hydrocarbon potential, based on surface seismic.
" “D2” are possible resources in new areas, based on studies of regional geology.
" “D3” represent a prognosis for the hydrocarbon resources of new basins, based ongeneral geological considerations.
There is no unique correspondence between the Russian classification and the PRMSone. But in general, industry experts assume that A, B and C1 reserves (“ABC1”) lie inbetween proven and proven + probable; C2 and part of C1 correspond to probableand possible reserves; while D1, D2 and D3 resources are closer to estimates ofundiscovered hydrocarbons. Further, the D1, D2 and D3 resources are normallyquoted as oil-in-place, rather than recoverable oil. C1 and C2 are typically technicallyrecoverable, not necessarily economically recoverable. A and B, as they are basedon an approved development plan, are normally both technically and economicallyrecoverable.7
7. For gas, it is tradi!onal in Russian assessments to assume a recovery factor of 100%, which is one of the reasons whyPRMS assessments give smaller values than “ABC1”.
© O
EC
D/IE
A, 2
011

292 World Energy Outlook 2011 - OUTLOOK FOR RUSSIAN ENERGY
Table 8.2 " Conventional hydrocarbon resources in various Russian regions,end-2009, according to the Russian system of classification
Oil(billion barrels)
NGLs(billion barrels)
Gas(trillion cubic metres)
ABC1,C2 C3,D1,D2 ABC1,C2 C3,D1,D2 ABC1,C2 C3,D1,D2
Western Siberia 111 208 16 30 41 71
Volga Urals 28 23 0.6 0.9 0.9 2
Timan Pechora 15 31 0.5 3 0.7 4
Eastern Siberia 19 79 3 20 8 40
Sakhalin 3 15 0.7 4 1 8
Caspian 4 15 8 4 6 8
Barents Sea 3 9 0.5 12 5 12
Other offshore Arctic 0.1 28 0.0 11 4 18
Others 0.4 5 0.0 0.0 0.5 0.2
Total Russia 183 414 29 85 68 163
Notes: For oil, “ABC” reserves are considered state secrets, so there is uncertainty on the total and the regional values.D resources are published by theMinistry of Natural Resources, as well as all categories for gas and gas-condensates. Thistable summarises the key values by region, including IEA estimates for oil “ABC” numbers. C3, a previously used categoryof undiscovered resources, has been merged into D1 in the latest version of the classification system, which comes intofull force in January 2012.
Production
More than 1 000 different fields produce oil or condensate in Russia, though about35 major fields contribute 50% of total production. Production peaked during Soviettimes at around 11.5 million barrels per day (mb/d) in the 1980s and then went througha trough, around 6 mb/d, in the mid-1990s, before recovering in the 2000s to exceed10 mb/d in 2007. The Energy Strategy to 2030 (Government of Russia, 2009) foresees agradual increase in production over the coming decades, to between 530 and 555 milliontonnes in 2030 (around 11 mb/d). The General Scheme for Development of the OilIndustry to 2020 (Ministry of Energy of the Russian Federation, 2011) is oriented moretowards keeping production constant, through a combination of fiscal incentives,efficiency improvements and increases in exploration and drilling activities. We drawfrom these strategy documents the assumption, underpinning our supply projections, thatpolicy (including fiscal policy) will be designed and adjusted through the projection periodwith the aim of encouraging production around current levels, i.e. at or around 10 mb/d,for as long as possible.
In the New Policies Scenario, we project that Russian oil production will stabilise around10.5 mb/d for the next few years and then start a slight decline, while remaining above
© O
EC
D/IE
A, 2
011

Chapter 8 - Russian resources and supply potential 293
8
9.6 mb/d throughout the period to 2035 (Figure 8.2). This results from a balance betweendecreases in old (Volga-Urals) or ageing (Western Siberia) fields, on the one hand, andnew field developments, often in remote areas. The slight overall decline comes despite asignificant projected increase in production of natural gas liquids (NGLs), which is discussedmore fully in the gas section of this chapter and Box 8.4.
The recent history of oil production in Russia has two main phases (Figure 8.8). The firstsaw the resurgence of supply from Western Siberia, driven by the application of moremodern field management technologies, until around 2006. The second phase, overthe last five years, has seen production coming online in newer oil provinces – TimanPechora, Sakhalin and, more recently, Eastern Siberia – while production from WesternSiberia flattened out or even decreased. Of note is the remarkable resilience of productionfrom the Volga-Urals basin throughout the period – in spite of this basin having alreadyproducedmore than 60% of its estimated recoverable resources in the seventy years sinceproduction started. This is also due to the application of modern technology, a processthat started later than in Western Siberia.
Given its dominant position in Russian oil production, accounting for around two-thirdsof the total, the evolution of production in Western Siberia is a key element in anyprojection of future oil production. The flattening of production there since 2006 mightindicate that all the easy wins from modern technology have been realised already.At the same time, the large volume of remaining recoverable resources suggests thatproduction could be maintained or even increased, with suitable investment. Existing taxholidays and other incentives generally favour investment in new fields in regions such asEastern Siberia, so a critical issue for Western Siberia – and therefore for Russian outputas a whole – is whether the fiscal system will be restructured in a way that promotesinvestment in small fields that have not been developed so far or in enhanced recoveryat existing fields.
Figure 8.8 " Recent evolution of Russian oil production by region
0
2
4
6
8
10
12
2002 2004 2006 2008 2010
mb/d Others
Eastern Siberia
Sakhalin
Caspian
Timan Pechora
Volga Urals
Western Siberia
© O
EC
D/IE
A, 2
011
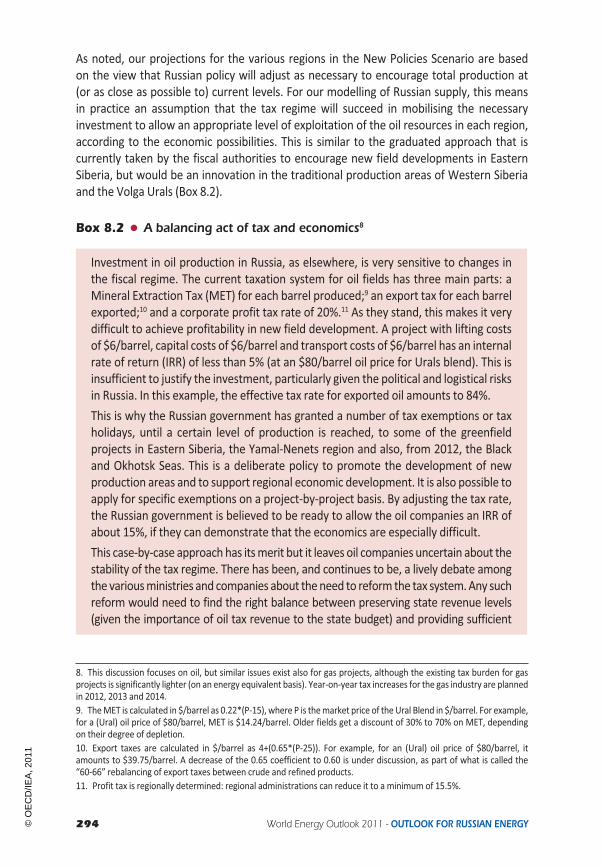
294 World Energy Outlook 2011 - OUTLOOK FOR RUSSIAN ENERGY
As noted, our projections for the various regions in the New Policies Scenario are basedon the view that Russian policy will adjust as necessary to encourage total production at(or as close as possible to) current levels. For our modelling of Russian supply, this meansin practice an assumption that the tax regime will succeed in mobilising the necessaryinvestment to allow an appropriate level of exploitation of the oil resources in each region,according to the economic possibilities. This is similar to the graduated approach that iscurrently taken by the fiscal authorities to encourage new field developments in EasternSiberia, but would be an innovation in the traditional production areas of Western Siberiaand the Volga Urals (Box 8.2).
Box 8.2 " A balancing act of tax and economics891011
Investment in oil production in Russia, as elsewhere, is very sensitive to changes inthe fiscal regime. The current taxation system for oil fields has three main parts: aMineral Extraction Tax (MET) for each barrel produced;9 an export tax for each barrelexported;10 and a corporate profit tax rate of 20%.11 As they stand, this makes it verydifficult to achieve profitability in new field development. A project with lifting costsof $6/barrel, capital costs of $6/barrel and transport costs of $6/barrel has an internalrate of return (IRR) of less than 5% (at an $80/barrel oil price for Urals blend). This isinsufficient to justify the investment, particularly given the political and logistical risksin Russia. In this example, the effective tax rate for exported oil amounts to 84%.This is why the Russian government has granted a number of tax exemptions or taxholidays, until a certain level of production is reached, to some of the greenfieldprojects in Eastern Siberia, the Yamal-Nenets region and also, from 2012, the Blackand Okhotsk Seas. This is a deliberate policy to promote the development of newproduction areas and to support regional economic development. It is also possible toapply for specific exemptions on a project-by-project basis. By adjusting the tax rate,the Russian government is believed to be ready to allow the oil companies an IRR ofabout 15%, if they can demonstrate that the economics are especially difficult.This case-by-case approach has itsmerit but it leaves oil companies uncertain about thestability of the tax regime. There has been, and continues to be, a lively debate amongthe variousministries and companies about theneed to reform the tax system.Any suchreform would need to find the right balance between preserving state revenue levels(given the importance of oil tax revenue to the state budget) and providing sufficient
8. This discussion focuses on oil, but similar issues exist also for gas projects, although the existing tax burden for gasprojects is significantly lighter (on an energy equivalent basis). Year-on-year tax increases for the gas industry are plannedin 2012, 2013 and 2014.9. TheMET is calculated in $/barrel as 0.22*(P-15), where P is themarket price of theUral Blend in $/barrel. For example,for a (Ural) oil price of $80/barrel, MET is $14.24/barrel. Older fields get a discount of 30% to 70% on MET, dependingon their degree of depletion.10. Export taxes are calculated in $/barrel as 4+(0.65*(P-25)). For example, for an (Ural) oil price of $80/barrel, itamounts to $39.75/barrel. A decrease of the 0.65 coefficient to 0.60 is under discussion, as part of what is called the“60-66” rebalancing of export taxes between crude and refined products.11. Profit tax is regionally determined: regional administrations can reduce it to a minimum of 15.5%.
© O
EC
D/IE
A, 2
011

Chapter 8 - Russian resources and supply potential 295
8
incentives for companies to invest in new projects (thereby promoting economicdevelopment in new regions), while also safeguarding the incentive to reduce coststhrough the application of new technologies.Designing the tax system to provide sufficient incentives to at least maintainproduction in the core region of Western Siberia will be essential, as a shortageof investment there could lead to a rapid decline in total Russian oil production.The currently prevailing effective tax rate in the traditional producing regions ofWestern Siberia and Volga Urals is around 75% for exported oil. We estimate that, ifthis rate were to be maintained throughout the projection period, total Russian oilproduction (and exports) would drop by a further 1.8 mb/d in 2035. Although the taxrevenue would be about the same (with higher taxes offsetting lower production),an accompanying significant loss of economic growth would be likely, given theimportance of the oil sector in Russia’s GDP.12
With this assumption about the fiscal regime, the projections for oil production in each ofthe main basins (Table 8.3) track, to a degree, the proportionate distribution of remainingregional resources, given in Table 8.1. Declines in the Volga Urals region are delayed, butaccelerate after 2020; the Timan-Pechora and Sakhalin regions remain at or close to plateau;while Eastern Siberia and the Caspian basin realise their potential for significant productionincreases. Crucially, production inWestern Siberia remains relatively buoyant, falling slightlyin the period to 2025, but rebounding towards the end of the projection period, helpedby the anticipated increase in NGLs production from the gas sector. The offshore Arcticcontinental shelf also has large potential, but logistical challenges are assumed to preventit from becoming amajor production area until the closing years of the projection period. 12
Table 8.3 " Projections for oil* production by main basins (mb/d)
2010 2015 2020 2025 2030 2035
Western Siberia 6.75 6.33 5.87 5.80 5.98 6.19
Volga Urals 2.10 2.07 1.90 1.72 1.46 1.15
Timan Pechora 0.60 0.62 0.59 0.57 0.58 0.59
Eastern Siberia 0.43 0.72 0.76 0.75 0.74 0.72
Sakhalin 0.31 0.30 0.31 0.31 0.32 0.29
Caspian 0.23 0.27 0.34 0.35 0.38 0.41
Barents Sea 0.00 0.00 0.01 0.05 0.10 0.13
Other offshore Arctic 0.00 0.00 0.00 0.00 0.01 0.01
Others 0.02 0.11 0.11 0.11 0.16 0.18
Total Russia 10.45 10.42 9.89 9.68 9.72 9.66
*Includes crude oil, NGLs, and unconventional oil.Notes: “Others” include projections for additives (IEA, 2010a, Chapter 4 for a definition of additives) and GTL for all ofRussia, which explains its growth. 2010 data do not include additives, for lack of historical data.
12. For the purpose of this analysis of sensitivity to tax rates, we assumed GDP growth was unchanged.
© O
EC
D/IE
A, 2
011

296 World Energy Outlook 2011 - OUTLOOK FOR RUSSIAN ENERGY
Looking atWestern Siberia inmore detail, production is stabilised at around 5.9mb/d in the2020s. Prospects in this region depend on multiple fields (Figure 8.9), of which some of themajor producers are: 13
! Samotlor, a super-giant field opened in 1965, with original recoverable resources ofthe order of 28 billion barrels. Production peaked in 1980 at more than 3 mb/d. It stillcontains about 7 billion barrels of reserves and production has recently stabilised ataround 500 thousand barrels per day (kb/d), a level TNK-BP plans to maintain throughsteady investment.
! Priobskoe, one of the “younger” giant fields in the region, with about 7 billion barrels ofreserves. It is divided in two parts by the Ob River. The left bank started production in1988, the right bank in 1999. Production has been increasing in the last ten years to reachabout 800 kb/d, the largest producer in Russia.
! Krasnoleninskoe, actually a group of fields, with oil-in-place comparable to Priobskoe.Although production started in the 1980s, it is a complex reservoir that is being developedonly recently on a large scale. It currently produces about 150 kb/d.
! Urengoy, better known for its gas production, is also a giant oil and condensate reservoir,with about 1 billion barrels of oil reserves and 4 billion barrels of condensate. It currentlyproduces about 70 kb/d of condensate and less than 10 kb/d of crude.
! Lyantor and Federovskoe are examples of old, declining giants, with ultimatelyrecoverable resources in the order of 10 billion barrels. They still represent the best partof Surgutneftegas’ decliningWestern Siberian production, with production of more than150 kb/d each.
! Tevlinsko-russkinskoe, Povkhovskoe, Vateganskoe are also ageing giants, formingthe basis of Lukoil’s production in Western Siberia. With remaining reserves of about2.5 billion barrels, they have recently declined by about 6% per year, to about 400 kb/din 2010. However Lukoil has indicated that this was partly due to limitations on electricalpower availability to lift the increasingly water-rich production, so production couldstabilise after additional investment.
! Uvat is an interesting case of a greenfield development, demonstrating that theWesternSiberian basin still contains significant untapped resources.14 Located in the south ofthe basin, far from the existing infrastructure, its development is only just starting.Recoverable resources are estimated to be close to 2 billion barrels, with planned plateauproduction around 150 kb/d. There are other fields in the same part of the basin thatcould make use of the infrastructure developed for Uvat.
13. As much as possible, we follow Russian GOST (state standard) 7.79-2000 for the translitera!on of Russian fieldnames, except when there is a widely used name in English.14. Another example of the poten!al for new large fields inWestern Siberia is the Gydan peninsula in the Yamal-Nenetsdistrict, close to the border of the north of the Krasnoyarsk district.
© O
EC
D/IE
A, 2
011

Chapter8-Russian
resourcesand
supplypotential
29
7
8
Figure 8.9 " Major oil fields and supply infrastructure in Russia
Sakhalin
Other offshore Arctic
Other offshore Arctic
Barents Sea
Sea of
Okhotsk
Eastern Siberia
Laptev Sea
East Siberian Sea
Chukchi
Sea
Bering
Sea
Caspian
Sea
Black
Sea
Baltic Sea
Mongolia
China
China
Japan
Kazakhstan
Ukraine
IranTurkmenistan
Uzbekistan
Sweden
Finland
Norway
Kara Sea
Sakhalin
Island
Barents Sea
Volga/
Urals
TimanPechora
Georgia
Armenia
Azerbaijan
Caspian
EstoniaPoland
LatviaLithuania
Belarus
Western Siberia
This map is for illustrative purposes and is without prejudice to the status of or sovereignty over any territory covered by this map.
Major pipeline
Oil terminal
Selected oil fields
Proposed pipeline
Romashkino
Kharyaga
PriobskoeFederovskoe
Krasnoleninkoe
UvatSamotlor
Moscow
NovorossiyskSamara
Irkutsk
Taishet
Skovorodino
Tomsk
DaqingNakhodka
Khabarovsk
Kozmino
Vanino
St. PetersburgUst-Luga
Primorsk
Murmansk
Surgut
TuapseVerkhnechonsk
UrengoyVankor
Prirazlomnoe
Trebsand Titov
BPSBP
S-2
R U S S I AR U S S I A
© OECD/IEA, 2011

298 World Energy Outlook 2011 - OUTLOOK FOR RUSSIAN ENERGY
In spite of its remarkable performance over the last ten years, production in the Volga-Uralsregion is projected to start an inexorable decline after 2016, due to resource depletion. Theregion features some old giants, such as:
! Arlanskoye in Bashkiria which, withmore than 8 000wells, produceswithmore than 93%water content. With initial reserves of about 2 billion barrels, it is now largely depletedand produces about 60 kb/d of oil.
! Romashkino in Tatarstan is the grandfather of Russian super-giant fields. Opened in 1948with 18 billion barrels of estimated original recoverable resources, it still contains about2 billion barrels of proven reserves. Tatneft has been maintaining steady production ofaround 300 kb/d for a number of years.
The Timan Pechora basin contains many recently developed fields. They are generally ofmedium size and we are projecting production to remain at around 0.6 mb/d to 2035. Ofnote are:
! Prirazlomnoe, in the Pechora Sea (not to be confused with the onshore field of thesame name in Western Siberia). It is the first offshore development in the Russian Arcticcontinental shelf and, as such, receives a lot of attention as a precursor of possible futuredevelopments. It reuses thedecommissionedNorth-WestHuttonproductionplatform fromtheNorth Sea. Production is expected to start in 2012 and to reach a plateau of 120 kb/d.
! Kharyaga, operated by Total under a production sharing agreement, with currentproduction of 25 kb/d and proven and probable reserves in excess of 1 billion barrels.
! The Trebs and Titov fields, together one of the last known super-giant fields to belicensed. With proven and probable reserves estimated around 1 billion barrels,these fields were licensed to Bashneft at the end of 2010. Development is planned inpartnership with Lukoil.
Figure 8.10 " Changes in Russian oil production by region in the NewPolicies Scenario
-1.0 -0.8 -0.6 -0.4 -0.2 0 0.2 0.4
Volga Urals
Western Siberia
Sakhalin
Timan Pechora
Other offshore Arc^c
Barents Sea
Others
Caspian
Eastern Siberia
mb/d
2009-2020
2020-2035
Note: “Others” include projections for additives and GTL for all of Russia, which explains its growth.
© O
EC
D/IE
A, 2
011

Chapter 8 - Russian resources and supply potential 299
8
Production in Eastern Siberia is projected to make the largest contribution to incrementalRussian supply (Figure 8.10) during the period to 2035, with supply rising by more than300 kb/d in the next five to eight years to reach a total of almost 0.8 mb/d. Productionthen remains near this level throughout the projection period, with declines in the recentlydeveloped fields being offset by gradual expansion of production from new fields fartherfrom existing infrastructure. Overall, Eastern Siberia has themost recently discovered fields:
! Vankor, with reserves estimated at 3 billion barrels, came on stream in 2009/2010and has largely been responsible for the increase in Russian oil production since then.It reached 250 kb/d in 2010 and 315 kb/d in July 2011. Plans to increase productionto 500 kb/d have not been fully confirmed and may depend on negotiations with thegovernment on the applicable tax regime. Although belonging administratively tothe Krasnoyarsk region, and therefore usually reported as an Eastern Siberian field,Vankor is related geologically to the Western Siberian basin and located very close to theYamal-Nenets region, so it can tap into the transport infrastructure existing there. Rosnefthas constructed a new 500 kilometre (km) pipeline, linking Vankor to the Transneftsystem (at Purpe), that creates the link between the Yamal-Nenets region and the EasternSiberia – Pacific Ocean (ESPO) pipeline and eastern markets. This enhanced access tomarket removes a major obstacle to the development of other fields in the region.
! Verkhnechonskoe is in the Irkutsk region.15Withmore than 1 billion barrels of reserves, itsdevelopment was made possible by the construction of the ESPO pipeline, which passesclose to the field, ensuring easy transportation in an otherwise remote region. Currentlyat 60 kb/d, production is being increased towards an expected peak of 150 kb/d.
! Talakanskoe, with 800 million barrels of reserves, is located close to Verkhnechonskoeand therefore to the ESPO pipeline. It is a key element of the expansion of Surgutneftegasinto Eastern Siberia. Production, at 40 kb/d, is in the ramp-up phase.
Commercial production in the Russian sector of the Caspian Sea began in 2010. This areais set to play a small but increasing role in Russia’s oil production, with output increasinggradually from the current 230 kb/d to 400 kb/d in 2035 (including the onshore pre-Caspianand North Caucasus parts of the basin):
! The Yuri Korchagin field is the first large offshore field to be developed in the Russiansector of the Caspian. Operated by Lukoil, it contains more than 200 million barrels ofproven reserves and produced first oil in 2010.
! The Filanovskiy field, the largest offshore field discovered in the Russian Caspian Seawithmore than 1 billion barrels of recoverable resources, is the next planned offshore Caspiandevelopment.
The main developments on Sakhalin Island are producing significant quantities of liquidsand there are substantial recoverable resources in the region. However, while a number of
15. Verkhnechonskoe, and a few similar fields in Eastern Siberia, is unusual in that it produces from pre-Cambrian rocks;this feature, together with the absence of nearby source rock, had been used by proponents of the existence of abio!coil as evidence for their theory. However, more recent work has fully established the bio!c origin of the oil and confirmedit migrated from source rocks located a significant distance away (Evere$, 2010).
© O
EC
D/IE
A, 2
011

300 World Energy Outlook 2011 - OUTLOOK FOR RUSSIAN ENERGY
additional Sakhalin projects are under discussion (Sakhalin-3, -4, -5…), we project that highcosts will delay developments, with production essentially flat, near 300 kb/d, until 2035.
! Chayvo, Odoptu and Arkutun-Dagi are the three main oil producing fields, operated byExxonMobil as part of the Sakhalin-1 project.With proven reserves of 300million barrels,Chayvo produced about 100 kb/d in 2010, a 50% decline compared to its peak in 2007.This decrease does not necessarily indicate early onset of decline, as production is limitedby the absence of a gas export facility. Production from Odoptu, on the other hand, isgrowing, compensating for the reduced production in Chayvo.
! Piltun-Astokhskoe and Lunskoye, part of Sakhalin-2, primarily a gas and liquefiednatural gas (LNG) project also contain large recoverable oil resources of the order of700 million barrels. They currently produce about 150 kb/d of oil.
The Barents Sea is primarily a gas province but development of the Shtokman field, assumedfor the period after 2020, will provide a sizeable volume of NGLs.
Investment and costs
The levels of oil production that we project in the New Policies Scenario imply an overallrequirement for upstreamoil investment of $740 billion (in year-2010 dollars) in Russia overthe period from 2011 to 2035, or an average of over $29 billion per year. This investmentis needed to compensate for the decline in production from existing fields, since crude oiloutput in 2035 from fields that were in production in 2010 drops from 9.8 mb/d to only3 mb/d, a fall of 70% (Figure 8.11). On this basis, there is a need, over the Outlook period,to add a total of 5 mb/d of conventional capacity, in order to meet the projected level oftotal output. Around two-thirds of the crude oil produced in 2035 will come from fields thathave already been found, but a further one-third will need to come from new fields thathave yet to be proven or discovered. We anticipate that most of these new fields will be inSiberia, both Eastern andWestern, in the Caspian region and, to a lesser extent, in the TimanPechora basin.
Figure 8.11 " Russian oil production by type in the New Policies Scenario
0
2
4
6
8
10
12
2000 2005 2010 2015 2020 2025 2030 2035
mb/d Natural gas liquids
Unconven^onal oil
Fields yet to be found
Fields yet to bedeveloped
Currently producingfields
Crude oil:
© O
EC
D/IE
A, 2
011

Chapter 8 - Russian resources and supply potential 301
8
Estimating decline rates at existing Russian oil fields is complicated by the fact thatproduction has been affected by many factors unrelated to geology over the last 20 years.To start with, as noted in Box 8.2, production rates vary in response to changes in the taxregime.Most old fields have also seen an increase in production in the period 2000 to 2010due to application of new technologies (hydraulic fracturing, horizontal drilling and pumpoptimisation) and the development of satellite fields, located around the main producingzones, or of layers originally by-passed above or below the main production zones. Theswings in gas output linked to the 2009 economic downturn also affected NGL output andtherefore total liquids production. However, there are a few examples of fields showing aclear decline trend, at a rate of about 5% to 6% per year, indicating the likely future trendof the large fields in the traditional producing regions.16
Costs of production are low in the mature producing regions of Western Siberia and Volga-Ural, with lifting costs (including marketing and other general costs) estimated to be ofthe order of $4/barrel to $8/barrel. However they are on the increase, with the ageingfields producing more and more water along with the oil, the growing costs of electricityin the liberalised electricity market and the worldwide inflation in service costs. Greenfielddevelopments – whether in parts of Western Siberia away from the main producinginfrastructure or in new regions (Caspian, Eastern Siberia, Sakhalin, Timan-Pechora basin) –have higher lifting costs, ranging from $6/barrel to $10/barrel due to their remoteness andthe limited infrastructure. Offshore developments, such as Sakhalin-1 and Prirazlomnoe(due to start production at the end of 2011 in the Pechora Sea), have even higher liftingcosts, probably in the order of $15/barrel.
Capital costs for greenfield projects are in the range of $5/barrel to $10/barrel. Althoughnew developments in new regions could be expected to be much more capital intensive,because of the requirement for new infrastructure, in practice the development of newregions is likely to be undertaken step-by-step, reducing capital costs significantly: the firstprojects will be those closest to existing infrastructure, with subsequent projects building onthe incremental advancesmade by previous ones. Capital costs in these cases are similar tothose needed tomaintain production in old fields, as exemplified by the investment budgetof TNK-BP in Samotlor: at $4.6 billion over five years to maintain production at around500 kb/d, this works out at a capital cost of about $8/barrel. Offshore fields have highercapital requirements, with Prirazlomnoe estimated to be on the order of $10/barrel to$12/barrel. Because of the huge distances from most fields to market, transportationcosts also play a key role in the economics of oil (and gas) production, with $5/barrel to$10/barrel being typical for most oil exports (with the lower part of the range applying toVolga-Ural exports to Europe, and the upper range forWestern Siberia exports to China viathe ESPO pipeline).
Exports
In the New Policies Scenario, we project that oil exports (crude and refined products) willdecline slowly, from a peak of 7.7 mb/d in 2012, just slightly above the 2010 value, to
16. This is in linewith the findings of IEA (2008), which gives 5.5% as the post-plateau decline rate for onshore giant fields.
© O
EC
D/IE
A, 2
011

302 World Energy Outlook 2011 - OUTLOOK FOR RUSSIAN ENERGY
6.4 mb/d in 2035, as crude production falls and domestic demand for transport fuelcontinues to grow. Exports will continue to go through a variety of routes: existingpipelines to Europe, shipments from northern, eastern and Black Sea ports, andcompletion and extension of the ESPO pipeline to the Pacific Coast and China. We expectcontinued expansion of westward oil flows through the Russian export terminals atPrimorsk and Ust-Luga on the Baltic Sea, in part to avoid transit through third countries;but the major anticipated change over the projection period will be the expansion ofeastward connections to China and Asia-Pacific markets.
Russian oil exports to the east have been slower to develop than commercial logicmight suggest: it has taken time to reconcile commercial and state interests in a mannercapable of moving projects forward, both within Russia (where Yukos’ early leadership inpipeline discussions with China was lost after the company’s bankruptcy) and betweenRussia and the other main regional actors, China and Japan. China’s loan agreements in2009 with Rosneft ($15 billion) and Transneft ($10 billion) facilitated decisions both onthe pipeline route and on volumes (since the loans were to be repaid in oil supply).
Phase I of the ESPO project, completed in December 2009, consisted of a 2 700 kmpipeline from Taishet to Skovorodino with a capacity of 600 kb/d. From January 2011,pipeline deliveries of 300 kb/d began via a southward trunk line from Skovorodino toDaqing in China; the remaining volumes are currently transported by rail to KozminoBay on the Russian Pacific Coast. Phase II of the ESPO, already underway, will extendthe pipeline from Skovorodino to the coast, a further 2 100 km, and increase its overallcapacity to 1 mb/d. There is also the possibility of doubling the capacity of the spurto China (to 600 kb/d). We assume that the expansion to 1 mb/d will be completed in2013 and that a further expansion of the system will bring total capacity to 1.6 mb/d bythe early 2020s. This, together with the potential to further reinforce eastward exportroutes later in the projection period in response to rising oil import demand in Asianmarkets, will give Russia the opportunity to balance its exports between East and West(see Chapter 9).
The split between the export of crude oil and of refined products will be determinedlargely by fiscal policy. Over the last ten years, the Russian government has madevarious attempts to promote exports of refined products at the expense of crude. Thefavourable tax regime for product exports was originally intended to provide incentivesfor much-needed modernisation of Russian refineries and thereby to capture morevalue-added within Russia. Thus far, this policy has failed: although in 2010 around athird of Russian exports were in the form of refined products, most were in the form oflow-end, low-value-added fuel oil, as Russian refineries were still not equipped to supplyhigh-end gasoline products. Anticipated changes in taxation in 2011,17 coupled withmore stringent gasoline specifications on the internal market, are intended to realise theoriginal objective.
17. Such as the much-discussed “60-66” rebalancing of export taxes which would see the marginal tax rate on crude oilexports decreased from 65% to 60%, while that on exports of some refined products would be set at 66% of the exporttax on crude. At the !me of wri!ng, the la$er part has been adopted, while the former is s!ll awai!ng decision.
© O
EC
D/IE
A, 2
011

Chapter 8 - Russian resources and supply potential 303
8
Natural gasResourcesProven reserves of natural gas in Russia are generally quoted to be about 45 trillion cubicmetres (tcm).18 This matches well with the sum of the numbers published by the mainproducing companies, using the “ABC1” reserves under the Russian classification system.Under the PRMS, however, proven reserves are closer to 26 tcm. Gazprom, for example,reports 33 tcm as “ABC1” reserves, but only 19 tcm as proven under PRMS. The lower PRMSfigure takes into account actual recovery factors in the large traditional fields and the factthat the development of new large fields, such as Yamal or Shtokman, is still under study.
Table 8.4 " Conventional gas resources in various Russian regions,end-2010 (tcm)
Provenreserves*
Ultimatelyrecoverableresources
Cumulativeproduction
Remaining recoverable resources
Total Share Share perABCD**
Western Siberia 22 59 18 41 39% 53%
Volga Urals 1 5 1 4 3% 1%
Timan Pechora 1 3 1 2 2% 2%
Eastern Siberia 1 7 0 7 7% 18%
Sakhalin 1 3 0 3 3% 3%
Caspian 1 7 1 6 6% 7%
Barents Sea 0 23 0 23 21% 7%
Other offshore Arctic 0 20 0 20 19% 9%
Others 0 1 0 1 1% 0%
Total Russia 26 127 21 106 100% 100%
*Proven reserves are approximately broken down by basin based on company reports. **This column is an IEA estimatebased on the Russian (“ABCD”) classification system (Box 8.1), taking into account recovery factors and the probabilitiesof the various categories to estimate a mean value.Sources: USGS; data provided to the IEA by the US Geological Survey; IEA databases and analysis.
Using a methodology similar to that in this chapter’s analysis of oil, based on USGSpublications, we estimate the level of ultimately recoverable resources at closeto 130 tcm, of which 21 tcm have already been produced. The breakdown of our estimatedfigure for ultimately recoverable resources between the main basins (Table 8.4) shows thepredominance of Western Siberia, where all the largest Gazprom fields, either producing(Urengoy, Yamburg, Zapolyarnoe) or under development (Yamal peninsula) are located, aswell as most of the gas associated with oil fields produced by oil companies. Although notproducing today, the Barents and Kara seas are considered very strong prospects.
As in the case of oil, the methodology based on the USGS assessment could beoverestimating reserve growth inWestern Siberia and underestimating the resources in thepoorly explored regions of Eastern Siberia and the Arctic offshore continental shelf (other
18. 45 tcm in BP, 2011; 48 tcm in O&GJ, 2010; 46 tcm in Cedigaz, 2011; 48 tcm in Government of Russia, 2009.
© O
EC
D/IE
A, 2
011

304 World Energy Outlook 2011 - OUTLOOK FOR RUSSIAN ENERGY
than the Barents Sea). Overall, our USGS-based numbers are conservative compared withthe values under the Russian classification system, even taking the different definitions intoaccount (Table 8.2). The Russian “ABCD” numbers show, in particular, more resources thanour USGS-based analysis in absolute terms, as well as higher percentages for Western andEastern Siberia.19
Box 8.3 " What’s in a bcm?
A bcm (billion cubic metres) of natural gas is a commonly used measure of gasproduction and trade, but what that “bcm” represents depends on how it is measuredand how much energy it contains. The IEA standard is to report gas volume as actualphysical volumes, measured at 15°C and at atmospheric pressure. This means thata bcm of Russian gas, in terms of energy content, can have a different value from abcm of gas from another country. For example, an average Russian bcm (at 15°C)contains 38.2 petajoules (PJ) of energy (according to the conversion factors used by IEA)compared with 41.4 PJ for a bcm from Qatar. In the case of Russia, there is additionalscope for confusion because the Russian standard reports gas volumes measured at20°C and atmospheric pressure, slightly different to the IEA.20
Negotiating a way through the multiple pitfalls of different calorific values andconversion factors can be difficult and there are different ways of doing so.21 TheIEA approach is to keep the underlying balances for each country on an energy basis(rather than a volume basis) and to maintain a database of the different energycontent of gas imports, exports, production and consumption for each country (IEA,2010b). For the figures presented in bcm units in this Outlook, 1 bcm of Russian gasequals 0.82 Mtoe; 1 bcm is also equivalent to 1.017 bcm reported according to theRussian standard, allowing for the different temperatures at which the volumes aremeasured.
Production
In the New Policies Scenario, total Russian gas production increases from 637 bcm in2010 to 690 bcm in 2020, 820 bcm in 2030 and 860 bcm in 2035 (Box 8.3 explains the IEApresentation of gas volumes). Production of 820 bcm in 2030 puts our projection around 6%below the range targeted in the Russian Energy Strategy to 2030; this is due in part to ourlower projected demand numbers for the domesticmarket. As the indications for remaining
19. Some of the Russian data includes the Kara Sea in Western Siberia, accoun!ng for part of the larger number forWestern Siberia and the lower number for other offshore Arc!c.20. A further complica!on is that the energy content of hydrocarbons can be reported on a gross calorific value basis(GCV) or on a net calorific value basis (NCV); for gas, NCV is approximately equal to 90% of GCV. Russia reports on an NCVbasis; IEA uses GCV when repor!ng energy in joules, but NCV when repor!ng energy in Mtoe (to facilitate comparisonwith other fuels).21. Other organisa!ons, e.g. BP in their yearly sta!s!cal publica!on or Cedigaz, report volumes on an energy-equivalentbasis, i.e. they use a “standard” gas cubic metre with a gross calorific value of 41.87 megajoules (MJ)/m3 (BP) or40 MJ/m3 (Cedigaz, 2011). This is the same approach as expressing oil produc!on in tonnes of oil equivalent, which isactually an energy unit rather than a mass unit.
© O
EC
D/IE
A, 2
011

Chapter 8 - Russian resources and supply potential 305
8
recoverable resources suggest, Russian output continues to be concentrated in WesternSiberia. However, the overall share of this region in total Russian production is projectedto decline from around 90% in 2010 to 78% in 2035, due to rapid increases in output fromEastern Siberia and the Barents Sea.
A breakdown of recent production by region (Figure 8.12) underlines the preeminentposition of Western Siberian fields in the overall Russian picture. Within Western Siberia,three fields stand out: the stalwarts, Urengoy and Yamburg,22 which have provided thebackbone of Russian production for the past two decades, and Zapolyarnoe, which startedproduction in 2001. However, the contribution of other regions to the Russian gas balance isgrowing, notably with the development of gas production and export from Sakhalin.
Figure 8.12 " Recent gas production trends by region
0
100
200
300
400
500
600
700
2002 2004 2006 2008 2010
bcm Others
Eastern Siberia
Sakhalin
Caspian
Timan Pechora
Volga Urals
Western Siberia
In recent years, Russia has been able to satisfy domestic gas demand and its exportcommitments through the development of smaller satellite fields in Western Siberia,together with drawing on a steady increase in production by private companies, such asNovatek, and oil companies’ associated gas output. Demand reduction, due to the economicand financial crisis, eased pressure on supply and drastically reduced the need for large-scalegas imports from Central Asia. But while relatively small supply increments have proved tobe sufficient tomeet Russia’s needs in the recent past, a swift rebound in global gas demandand the need for Russia to compensate for production declines at the traditional Urengoyand Yamburg fields (at a current rate of 50 bcm every four to five years) will impose a needfor new upstream development.
A strategic question for the Russian gas industry is the extent to which Russia will rely onGazprom and Gazprom-led mega-projects, such as Yamal and Shtokman, to meet thesefuture production needs; or, seen from another perspective, whether a larger share ofoutput could come from multiple smaller fields and from other Russian gas producers suchas Novatek and the Russian oil companies, who own some significant and under-exploited
22. These are two of the tradi!onal “big three” of Russian gas produc!on in West Siberia. The third is normally theMedvezhe field. However, produc!on fromMedvezhe was less than 15 bcm in 2009, so the “big three” label is no longeraccurate (unless the third of the three is considered to be Zapolyarnoe).
© O
EC
D/IE
A, 2
011

306 World Energy Outlook 2011 - OUTLOOK FOR RUSSIAN ENERGY
gas assets (Spotlight). Our assumption is that the structure of the Russian gas market willchange slowly over theprojectionperiod,withGazprom’s super-dominanceof gas production,transportation and sales somewhat reduced over the projection period, but not dismantled.Evenwith relativelymarginal improvements in access to transportation capacity andexchange-based gas trading23 (and through joint gas marketing ventures with Gazprom), non-Gazpromproducers are expected toplay anexpanded supporting role in theoverall Russian gas balance,displacing to a large extent the previous reliance on gas from Central Asia.
Our projection for gas supply by region (Table 8.5) shows a gradual increase in output fromWestern Siberia, from 564 bcm in 2010 to about 665 bcm in 2035. Behind this figure thereis a change in the geographical focus of production within Western Siberia, away from theNadym-Pur-Taz region, the location of the largest concentration of producing fields. Declinesin the Nadym-Pur-Taz region have so far been offset, in part by the development of nearbysatellite fields and deeper horizons in the major fields, but mainly by the developmentof Zapolyarnoe since the early 2000s (now at plateau, around 110 bcm per year). Overthe projection period, there is a gradual shift to the Yamal peninsula, thanks to the newtransport infrastructure built for the development of the Bovanenkovo super-giant fieldthere. Bovanenkovo is now expected to come on stream in 2012, with plateau production inthe first phase planned at 110 bcm per year, with other neighbouring fields following later.
Table 8.5 " Projections for gas production by main basins (bcm)
2010 2015 2020 2025 2030 2035
Western Siberia 564 604 604 630 646 665
Volga Urals 24 20 16 14 11 10
Timan Pechora 3 3 2 2 2 2
Eastern Siberia 5 7 24 61 67 77
Sakhalin 23 25 25 26 27 28
Caspian 17 18 17 17 17 17
Barents Sea 0 1 2 27 50 58
Other offshore Arctic 0 0 0 1 1 1
Others 1 1 1 1 1 1
Total Russia 637 679 692 779 822 858
The other large Yamal Peninsula project, the Yamal LNG plant proposed by Novatek, istargeting production and liquefaction of 20 bcm per year by 2016, with gas produced fromthe giant South Tambei and neighbouring fields. The economics of this project received amajor boost when production from Yamal gas fields earmarked for LNGwas exempted fromthe Minerals Extraction Tax (Box 8.2) until cumulative gas output reaches 250 bcm (andcondensate output 20 million tonnes).
23. A pilot Russian gas exchange func!oned from 2006 to 2008; since then, there have been various dra" proposals toreintroduce it on a permanent basis, but no decision as yet on its form or scope.
© O
EC
D/IE
A, 2
011

Chapter 8 - Russian resources and supply potential 307
8
S P O T L I G H T
The last of the mega-projects?
Two gasmega-projects are underway in Russia: the Yamal developmentwas launchedin 2008 and production is expected to start in 2012; the Shtokman project, though ithas experienced numerous delays, is assumed to start production at the end of thecurrent decade.24 By any reckoning, these two developments, particularly Yamal,are set to play an important role in the Russian supply picture. Yet these projectslook less indispensable to the Russian supply outlook than they once did. The reasonfor this change is the growing availability of other supply options, in particular fromnon-Gazprom producers. An increased contribution from these producers isanticipated in the government’s Energy Strategy, which foresees their share of outputrising to above 25% by 2030, from around 20% today. A detailed, asset-by-assetanalysis (Henderson, 2010) puts the potential for non-Gazpromgas production at evenhigher levels, growing from about 150 bcm in 2010 tomore than 300 bcm in 2020 and370 bcm in 2030 (close to 45% of total projected output). A part of this growth isalready provided for in committed company investment plans and it could be realisedin full with easier access to Gazprom pipelines and to the more lucrative parts of thedomestic market.Growth of this magnitude would fulfil our entire projected Russian gas productionincrease in the New Policies Scenario, leaving Gazprom with the task of keeping itsproduction about constant at today’s levels. In this case, development of the Yamalpeninsula and Shtokman field would still be needed to offset decline in currentGazprom fields, but output, particularly for Shtokman, could be built up more slowlythan currently envisaged.Reliance on a larger number of smaller projects with shorter lead times (alongsidea greater focus on the efficiency of domestic gas use) would be a coherent strategicresponse by Russia to the uncertainties over the pace of gas demand growth in Europe.To a degree, this is already reflected in Gazprom’s own plans: after Bovanenkovo (withenvisaged peak production of 110 bcmper year) and Shtokman (70 bcm to 90 bcmperyear), output from the next largest fields envisaged for development drops to 30 bcmto 40 bcm per year.With infrastructure in place on the Yamal peninsula, Gazpromwillhave more flexibility to pace its investment in additional smaller fields in response tomarket developments in Europe and elsewhere.But this does not mean that we have seen the last of such mega-projects. Overthe projection period, demand from faster-growing markets outside Europe is amore likely foundation for such major upstream developments: Gazprom is alreadyconsidering marketing Shtokman LNG to India; and Novatek is seeking markets forYamal LNG in the Asia-Pacific region. Another generation of Russian mega-projects,albeit on a smaller scale to Yamal and Shtokman, is likely to emerge in East Siberia forexport to Asia.
24. At the !me of wri!ng, the development decision has not yet been taken by the partners in the project.
© O
EC
D/IE
A, 2
011

308 World Energy Outlook 2011 - OUTLOOK FOR RUSSIAN ENERGY
According to our projections, developments inWestern Siberia play themost important role inmeeting overall increases in output, joined towards 2020 by new fields in other areas, such astheoffshore Shtokmandevelopment in theBarents Sea. Plans for Shtokmanare still fluctuating,primarily due to uncertainty over where and how the gas will be marketed. The earliest datefor first production is around 2017, but we assume that production begins at the end of thedecade. In our projections, output from the Barents Sea rises to close to 60 bcm in 2035. Aswell as uncertainty over the start-date, there is also upside potential for this projection, sincepreliminary plans fromGazprom forecast a plateau capacity from Shtokman of 70 bcm.
Two large fields in Eastern Siberia, Kovykta, with resources of the order of 2 tcm, andChayandin,withmore than 1 tcmof gas resources, are assumed to play a key role in feeding themuch-discussed gas pipeline to China. Kovykta’s ownership has been hotly contested in the lastfew years, holding back its development. At the beginning of 2011, it was acquired by Gazpromand could provide up to 40 bcm per year. A development challenge for many Eastern Siberiangas fields, including Kovykta, is their high helium content. Although a valuable product withgrowingworldwide shortages, it is hard to transport helium economically from the very remoteEastern Siberian fields to themarket. As Russian regulations rightly prevent venting this valuableresource, project developers are investigating a number of approaches, including undergroundstorage, to enable production to begin. Based on our assumption that Russia and Chinawill findmutually acceptable terms for the start of gas trade,weproject that output fromEastern Siberiaincreases from5bcm in 2010 tomore than 60 bcmby themid-2020s and to over 75 bcmby the2035, providing the second-largest contribution, afterWestern Siberia, to overall supply growth(Figure 8.13). Even without agreement on a pipeline to China, there would be opportunitiesfor sizeable growth in Eastern Siberian gas production, for export as LNG to Asian countries,particularly Japan, Korea and, again, to China.
Further to the east, in the Sakhalin area, the Sakhalin-2 project includes the first LNG plantin Russia, with a capacity of 14 bcm. This is a joint venture between Shell, Gazprom, MitsuiandMitsubishi, developing the Lunskoe and Piltun-Astokhskoe fields. Expansion of the plantby constructing another train of 7 bcm is under discussion, with gas possibly coming fromthe Sakhalin-1 project or other gas fields in the Sakhalin area. As well as gas for export, apart of Sakhalin output (and of that from Eastern Siberia) is earmarked for domestic use; thegovernment is promoting the construction of new transmission and distribution networks tomake gasmorewidely available for local industrial and residential use, initially in Vladivostok(via the newly built connection to Sakhalin via Khabarovsk). Our projection is for a very slightincrease in overall gas production, which reaches 28 bcm per year in 2035.
The other major gas producing region in Russia is the Caspian basin, which is home toanother super-giant gas field, the Astrakhan field, with more than 3 tcm of recoverableresources. Production, at about 10 bcmper year, is small for a field of this size, because of thetechnical challenges and the additional costs created by the high hydrogen sulphide content.Production could increase with progress in the technology needed for such very sour gasfields. The region also features a couple ofmedium size offshore prospects in the Caspian Sea:the Tsentralnoe field and the Khvalynskoe field. The Energy Strategy to 2030 (Government ofRussia, 2009) foresees that gas production fromoffshore Caspian Sea fieldswill rise graduallyto 21 bcm to 22 bcm per year by 2030; our projection is more conservative at 17 bcm.
© O
EC
D/IE
A, 2
011

Chapter 8 - Russian resources and supply potential 309
8
Figure 8.13 " Changes in Russian natural gas production by regionin the New Policies Scenario
-20 0 20 40 60 80 100 120
Volga Urals
Timan Pechora
Caspian
Others
Other offshore Arc^c
Sakhalin
Barents Sea
Eastern Siberia
Western Siberia
bcm
2009-2020
2020-2035
Box 8.4 " The curious case of the missing natural gas liquids…
A feature of Russia’s gas output, compared to other large producers such as Qatar,is the relatively small content of natural gas liquids (NGLs). The explanation is thattraditional gas production from the fields situated onshore in Western Siberiais mostly from the uppermost, “cenomanian” layer. This contains very dry gas,almost pure methane. This is also the case for new projects, such as Bovanenkovoand Shtokman, which will produce from the same layer. As this layer has been themainstay of Russian gas production for many years, Russia historically had relativelylittle production of NGLs and so limited capacity in gas processing plants. In fact, NGLsare poorly reported, with different numbers being reported by different sources. IEAestimates put Russian production of NGLs in 2010 at about 650 kb/d, half of which isfield condensate and the other half gas plant liquids.More recently, the deeper layers (“valenginian” and “Achimov”) of the traditionalfields, containing wetter gas, are being brought into production, with the potential ofproducing more NGLs. New regions, such as Eastern Siberia and Sakhalin, also havewetter gas. Reduction of flaring of associated gas, a naturally rich gas, contributesfurther to production of NGLs. Investment in gas processing plants to recover theNGLs has been slow, so only a small part of the ethane and about half of the butaneand propane is currently marketed. But further development of the gas processingfacilities is an important part of the strategy of the Ministry of Energy, with a dozennew or refurbished plants planned for the next ten years, so we project increasingrecovery and use of NGLs throughout the period, leading to a doubling of NGLsproduction by 2035. The oil price and tax regime is currently very favourable for NGLsand has already prompted companies like Novatek to invest in gas processing facilitiesand to export NGLs. This not onlymakes a very positive contribution to the economicsof their gas fields, but also provides access to exportmarkets, while they are restrictedto the domestic market for gas.
© O
EC
D/IE
A, 2
011

310 World Energy Outlook 2011 - OUTLOOK FOR RUSSIAN ENERGY
Overall, Russian gas productionwill graduallymove north and east, with the Yamal peninsula,the Barents Sea and Eastern Siberia accounting for one-third of production by 2035. In thetraditional regions of Western Siberia, the focus will be on deeper, less productive layers,using the existing infrastructure wherever possible. There will be accompanying efforts tomonetise NGLs, the production of which is projected to double between 2010 and 2035,reaching over 1.3 mb/d (Box 8.4).
Investment and costs
The projections in the New Policies Scenario imply total investment in the upstream gassector of over $730 billion (in year-2010 dollars) between 2011 and 2035. A major share ofthis investment will be required in order to compensate for declining production at existingfields. Decline rates cannot be easily estimated from the production data, not least becausevarying the rate of production in the large fields ofWestern Siberia has been used byGazpromas ameans of matching supply to demand (as demonstrated during the 2009 economic crisis– although some of the oil companies also saw their access to Gazprom pipelines reducedduring this period). Overall, we estimate that Russia will need to bring on 640 bcm of newcapacity by 2035 in order to meet the projection for supply in the New Policies Scenario.
Costs vary significantly between traditional onshore Western Siberian projects and thenew greenfield projects requiring new infrastructure, such as Yamal, Shtokman or Kovykta.Traditional projects have very low capital costs, of the order of $4 per thousand cubicmetres (kcm), as exemplified by some of the recent developments by Novatek, while thenew projects have capital costs as high as $30/kcm to $60/kcm. Similarly, operating costsrun from about $5/kcm for the traditional onshore projects up to $50/kcm for the futureArctic LNG projects. Transportation costs probably vary between $10/kcm and $50/kcm,although for pipeline transport, with Gazprom’s monopoly, costs are not necessarily closelyreflected in prices.
The tax regime for gas is currently more favourable than that for oil, with export tax beingno higher than 30% and the Mineral Extraction Tax (MET) being about ten times less thanthat for oil, on an energy equivalent basis. However, the Russian government has alreadyannounced significant increases in the MET for gas over the next few years, starting in2012, and reform of the export tax is also on the agenda. Even with the current tax regime,the new greenfield projects represent attractive investments only if they benefit from taxbreaks, which are considered on a project-by-project basis (as, for example, with YamalLNG). Projects in the traditional production areas have, in theory, attractive economics, butthese are tempered by the Gazprom pipeline and export monopoly, which means reducedsales prices for other gas producers.
Exports are subject to a duty of 30%, paid on the realised export price. There are someexemptions currently in place: for gas exported via the Blue Stream pipeline across theBlack Sea to Turkey; for some of the gas exports to neighbouring countries; and, thus far, forall LNG export projects. The fact that LNG exports are zero-rated, while pipeline-orientedprojects generally are subject to 30% duty, is an important consideration for the Shtokmanproject as the partners weigh the different options for marketing this gas.
© O
EC
D/IE
A, 2
011

Chapter 8 - Russian resources and supply potential 311
8
Flaring
The rate of utilisation of associated gas produced by oil companies has been steadilyimproving, with the amount of gas produced (and not flared) by oil companies steadilyincreasing, both in absolute terms and when considered relative to oil production. Thenumbers reported for utilisation of associated gas vary between 50% and 95%, dependingon the companies, with an average around 75%, but some scepticism has been expressedconcerning these values. The state companies, Rosneft and GazpromNeft, accountingtogether for more than half of the gas flared, have the worst reported performance.
Since 2002, the rise in the output of associated gas has been larger than the growth inoil production, i.e. the ratio of associated gas production to oil production has increased(Figure 8.14). This is consistent with the view that the amount of gas being flared hasdecreased in recent years. Nonetheless, the regulatory authorities’ aim to reach a 95%utilisation rate of associated gas by 2012 is unlikely to bemet and there are indications thatit might be achieved only in 2014.
Figure 8.14 " Production of associated gas, expressed in volumesand as a ratio to oil production, 2002-2010
0
0.03
0.06
0.09
0.12
0.15
0.18
0
10
20
30
40
50
60
2002 2003 2004 2005 2006 2007 2008 2009 2010
bcm Associated gas
output
Ra^o of associatedgas (bcm) to oilproduc^on(million tonnes)(right axis)
Source: Rosstat.
The exact amount of gas being flared is uncertain, as more than 50% of the flares do nothave meters. Different ministries and officials give estimates ranging from 16 bcm tomore than 20 bcm in 2010. The Global Gas Flaring Reduction Partnership (GGFRP) givesan estimate, based on satellite measurements, of 35 bcm in 2010 (GGFRP, 2010), but themethodology and calibration for satellite measurements is still being refined. Indeed, theGGFRP data shows a large reduction in flaring in Russia from 2009 to 2010, while Russianstatistics indicate an increase, due to the start of new fields in remote regions of EasternSiberia. Other estimates (PFC, 2007) provide figures of around 30 bcm (after adjustment totake into account reductions in flaring since the time of the study).
To promote utilisation of associated gas, the government plans to increase 100 times fromits current (very low) value the fee paid by companies for flaring, and to apply an additional
© O
EC
D/IE
A, 2
011

312 World Energy Outlook 2011 - OUTLOOK FOR RUSSIAN ENERGY
fee for flares that are not metered. However, improved access to Gazprom pipelines andfurther gas price increases in the internal market would likely be a more effective way topromote a reduction. If the 95% utilisation were to be achieved, and taking into accountthe likely extent of current under-reporting, we estimate that additional volumes of up to20 bcm per year of gas would become available.25
Transportation and storage
All production, processing, storage and distribution facilities are integrated in the unifiedsupply gas system, owned and operated by Gazprom. Twenty-five sub-surface gas storagefacilities, with a working storage capacity of 65 bcm, were in operation at the end of 2009.Their maximum daily output was 0.62 bcm/d. Gazprom is investing in additional storagecapacity to match its expectation of growth in domestic demand: 87 bcm of workingstorage capacity and 1 bcm/d of possible output are planned by 2030, together with furtherdevelopment of the distribution system to deliver gas to regions that currently have limitedgas supply (particularly in the Russian Far East).
Prospects for natural gas export flows
Net gas exports increase by almost 75% from 190 bcm in 2010 to close to 330 bcm by 2035(Figure 8.3). Total gas exports grow from around 215 bcm to 360 bcm over the same period,with a modest rise in exports to Europe accompanied by a much faster projected rate ofincrease in exports to Asia, as LNG and by pipeline.
Pipelines will continue to provide the route to market for the bulk of Russian exportsthroughout the projection period (Figure 8.15). In addition to the existing pipelinesto Europe through Belarus and Ukraine, the Nord Stream pipeline through the BalticSea will provide new capacity and increased flexibility in export routes. Nord StreamPhase 1, with 27 bcm per year capacity, is due to come into operation at the endof 2011. Its capacity is due to double in the second phase, expected in late 2012.No firm decision on the proposed South Stream pipeline across the Black Sea isyet known. If built according to the schedule envisaged by Gazprom and its projectpartners, with first deliveries in 2015, South Stream’s 63 bcm of additional annualtransport capacity would change the pattern of Russian export flows considerably(see Chapter 9). By partially substituting for the existing export channels, the pipelinewould reduce the perceived risks of transit through Ukraine, as well as the transit fees.However, South Stream remains an expensive project; the preliminary capital costestimate of $22 billion (South Stream, 2011) is considerably more than the estimated$3 billion cost of rehabilitating the Ukrainian pipeline system (and this estimate doesnot include the additional infrastructure that would be required within Russia to bringlarger quantities of gas to the start of the South Stream pipeline on the Russian BlackSea coast).
25. Savings of 17 bcm from reduced gas flaring are included in the calcula!on of poten!al energy savings available toRussia in Chapter 7.
© O
EC
D/IE
A, 2
011

Chapter8-Russian
resourcesand
supplypotential
31
3
8
Figure 8.15 " Major gas fields and supply infrastructure in Russia
Harbin
Northern Lights
Nord Stream
Export to
Europe
Moscow
Yamburg
Medvezhye
Daqing
Shtokman
Urengoy
MongoliaSyria NorthKorea
China
Irkutsk
Japan
Slov. Rep.
Cz.
Rep.
Poland
Germany
SwedenDen.
R U S S I AR U S S I ASakhalin
IslandKomsomolsk
Khabarovsk
Bovanenkovo
South Tambei
Neth.
Chayandin
Zapolyarnoe
S. Russkoe
Krasnoyarsk
Yakutsk
Export toFinland
St. Petersburg
Estonia
Norway
Finland
Latvia
South Stream
China
Novosibirsk Kemerovo
Tomsk
Surgut
Kazakhstan
U b ki
Tyumen
Orenburg
Astrakhan
Khvalynskoe
Tsentralnoe
Turkey
Georgia
Azer.Arm.
Volgograd
Ukhta
Vladivostok
Murmansk
Yamal
Peninsula
Kovykta
Export to
Europe
RomaniaMol.
Hungary Sakhalin
Other offshore Arctic
Other ArcticoffshoreBarents Sea
Eastern Siberia
Western Siberia
Volga/
Urals
TimanPechora
Caspian
Ukraine
Lithuania
Belarus
Selected gas field
Existing gas pipeline
Pipeline planned/under const.
Existing LNG export terminal
Planned LNG export terminal
This map is for illustrative purposes and is without prejudice to the status of or sovereignty over any territory covered by this map.
Sea of
Okhotsk
Laptev Sea
East Siberian Sea
Chukchi
Sea
Bering
Sea
Caspian
Sea
BlackSea
Baltic Sea
Kara Sea
Barents Sea
© OECD/IEA, 2011

314 World Energy Outlook 2011 - OUTLOOK FOR RUSSIAN ENERGY
Construction of a new gas pipeline to China is dependent on agreement on the pricing offuture deliveries. The overall package of agreements to launch bilateral gas trade couldinclude Chinese loans or pre-payment for gas but is thought unlikely at this stage to includeChinese participation in Russian upstream gas developments (as was the case for China’sgas agreements with Turkmenistan). Two routes for a new pipeline are under discussion,with the Altai, or Western, route being favoured by Russia in the first phase (Figure 8.15). Asecond phase could involve a more eastern pipeline route, closer to markets in Manchuriaand northern China. Gas for China would come initially fromWestern Siberia, tying in to theexisting infrastructure there, and subsequently from new developments in Eastern Siberia,such as the giant Kovykta field. If agreement on prices is reached in 2011, the pipeline couldstart operation as soon as 2016. We project that Russian gas exports to China by pipelinestart towards 2020 and reach 75 bcm in 2035.
Russia is also aiming to diversify gas exports through the development of LNG export capacity.This goal was articulated at a time when North America appeared to be a promising market,but expectations in this direction have been undercut by the boom in North Americanunconventional gas production and a consequentlymuch reduced import requirement.Whileeastern projects (Sakhalin and Vladivostok) could serve growing Asian LNG import markets,the market outlook for Arctic LNG projects (Yamal and Shtokman) is less clear, adding touncertainty over the timing of Russia’s emergence as a global LNG supplier.
In addition to the currently operating Sakhalin-2 plant, several new LNG projects have beenproposed, the main ones being:
! The addition of a third train to the Sakhalin-2 plant, with a capacity of 7 bcm per year.This could possibly receive gas from the Sakhalin-1 fields, eliminating some of the oilproduction bottlenecks there.
! The Vladivostok LNG plant, proposed by Gazprom,with a capacity of 14 bcmper year, to befed either from Eastern Siberian fields through a new pipeline, or with gas from Sakhalin.A preliminary agreement, already reachedwith a consortium of Japanese companies, for afeasibility study of this $7 billion project suggests that a target start date of 2017 is feasible.
! Novatek’s Yamal LNG project, with a capacity of 20 bcm per year. The project includesplans to send LNG across the Northern route to Asian markets (Box 8.5). Completion isproposed for 2016, although this date is expected to be pushed back.
! The Shtokman project in the Barents Sea would feature both pipeline deliveries and, ina second step, an LNG plant of 10 bcm per year capacity. The tentative schedule for firstproduction is 2017, but a decision has not been confirmed yet. We anticipate that thisproject will start at the end of the decade.
Although there are uncertainties surrounding all these projects and a likelihood of delays inexecution of the Arctic projects, given the harsh climate, we project a progressive expansionof LNG capacity from the current 14 bcm per year to 33 bcm per year in 2020 and 70 bcmper year in 2035. LNGwould represent about 20% of total Russian exports by the end of theprojection period. The required investment in LNG infrastructure is estimated at close to$80 billion (in year-2010 dollars).
© O
EC
D/IE
A, 2
011

Chapter 8 - Russian resources and supply potential 315
8
Box 8.5 " The “Northern Route” to market
The “Northern Route” (or Northeast Passage) from the Atlantic to the Pacific acrossthe Russian Arctic seas has fascinated mariners and traders for centuries, thoughit has never been more than a marginal route for global trade because of the veryharsh environment. The gradual reduction in Arctic ice cover, due to climate change,is however likely to increase the number of ice-free sailing days in the summer and tolessen the need to call on ice-breaking assistance. This has attracted the attention ofpotential producers of LNG in Russia’s remote Arctic north, not least because demandfor imports in their initial target market, North America, appears to have evaporated.A demonstration of this renewed interest was Novatek’s deliveries of condensatefromMurmansk to China across the Russian Arctic in the summer of 2010 and again inJuly 2011, the latter being one of the earliest ever summer shipments along this route.
If passable, the Northern Route provides by far the quickest sea route from Europe toNortheast Asia: the Novatek shipments took around 22 days, half the time requiredfor the next best itinerary via the Suez canal. For LNG suppliers, the Northern Routewouldmean a sea journey fromMurmansk to Chinese LNG terminals only around 30%longer than the journey fromQatar. But this route is still a longway from reliable year-round operation and its regular usewill involve significant additional expense: it wouldrequire special ice-strengthened LNG carriers, presumably with lower capacities thantypical carriers because of size constraints to negotiate the narrow straits,26 and theuse of accompanying icebreakers (whose services also come at considerable cost),if only for insurance purposes. Seasonal contracting would see the Asian marketfavoured during the summermonths, when theNorthern Route is open, and sales intoEurope or the Atlantic basin at other times. To avoid interrupting production becauseof transport unreliability, expensive additional storage would be required.
Unconventional resourcesBecause of the large conventional resources of oil and gas, unconventional resourceshave received comparatively little attention in Russia and the extent of the existingunconventional resources is generally poorly known. Nonetheless, Russia has considerablepotential in these areas; as technology improves and costs come down – mainly due toinvestments in other regions of the world – so the opportunities for Russia to develop itsunconventional potential will grow.
Extra-heavy oil and bitumen
Bitumen and extra-heavy oil resources are known to be extensive in Russia, but there aresignificant discrepancies between the published estimates. BGR gives 345 billion barrels
26. The size restrictions are a maximum draft of 12.5 metres (m) and maximum beam of 30m (Ragner, 2008); thiscompares to 12m draft and 50m beam for a Q-Flex LNG carrier and a similar scale (12m and 53m) for a Q-Max.
© O
EC
D/IE
A, 2
011

316 World Energy Outlook 2011 - OUTLOOK FOR RUSSIAN ENERGY
for recoverable resources (BGR, 2010), while Russian sources are more conservative, ataround 250 billion barrels, as discussed in the World Energy Outlook-2010 (IEA, 2010a).Recent Russian government data is evenmore prudent, givingmore than 120 billion barrels,around one-third in Tatarstan, half in Eastern Siberia and some around St. Petersburg. Therehave been several pilot projects with steam-based thermal methods of recovery, suchas steam-assisted gravity drainage, both in Tatarstan (Tatneft) and in the Timan Pechoraregion (Lukoil). However, large-scale developments are very much in their infancy. Forexample, the General Scheme for Development of Oil Industry to 2020 calls for onlymodestdevelopments in Tatarstan, with a capacity of the order of 40 kb/d in the 2020s. As a resultwe project output of close to 100 kb/d by 2035, though the resources suggest there ispotential for a significantly higher figure.
Kerogen shales
Kerogen shales, also known as oil shales, are poorly known in Russia. BGR and USGSestimates (IEA, 2010a) for near-surface resources are around 290 billion barrels, thoughthe recoverable amount is not known. The better studied deposits are near the Baltic Seaand in the Volga-Urals basin. Some deposits are also known in Eastern Siberia. The Balticdeposits were historically exploited as solid fuel for power plants (as in nearby Estonia), butwere abandoned in favour of gas. There is currently no plan for exploitation of near-surfacekerogen shales in Russia.
Of note is the Bazhenov shale, the source rock underlying all theWestern Siberia reservoirs(IEA, 2010a). Probably the most extensive shale formation in the world, it contains bothsome light tight oil, similarly to the Bakken shale in the United States, and very largeremaining amounts of kerogenic matter. Technology to economically produce the latter,which lies at a depth of 3 000 metres, would be a breakthrough, potentially extendingthe life of the Western Siberian infrastructure by many years. We have not included anyproduction for kerogen shales in our projections to 2035.
Gas-to-liquids and coal-to-liquids
Gas-to-liquids (GTL) could be an attractive way for Russia to exploit gas fields located farfrom pipelines, while also hedging against decoupling of gas and oil prices. Some projectshave been proposed, for example in the Yakutia region, to produce either diesel andnaphtha or methanol. However, no project seems to have passed the conceptual stage sofar. Taking into account possible technological developments in small-scale GTL (IEA, 2010a),we project GTL production in Russia to start in the 2020s and to grow to close to 120 kb/din 2035. A large project based on Arctic gas, as an alternative or in addition to some of theplanned LNG plants, could be a viable way to extract value from some expensive Arctic gasfields; such a development is not included in our projections.
Coal-to-liquids (CTL) is also potentially attractive, as Russia has large coal resources locatedfar from markets. There have been some reports of preliminary discussions about CTLprojects – China’s Shenhua group has expressed interest – but in the absence of specific
© O
EC
D/IE
A, 2
011

Chapter 8 - Russian resources and supply potential 317
8
information about project developments, we have not included any CTL production in ourprojections to 2035.
Coalbed methane
Coalbed methane (CBM) exploitation is the most advanced among the unconventionalhydrocarbon resources in Russia. Pilot projects are already operated by Gazprom in theKemerovo region and there are concrete plans to move to large-scale production of 4 bcmper year by 2016 and up to 20 bcm per year in the longer term. We project this interest willcontinue, with production growing to 38 bcm per year by 2035. Recoverable resources areestimated to be 17 tcm, ample to sustain this level of production.
Shale gas and tight gas
Shale gas resources in Russia are very poorly known, with the pioneering work of Rognerstill being the basis for most estimates (Rogner, 1997). IEA analysis estimates about 4 tcmof recoverable shale gas in Russia (IEA, 2009). Russia’s shale formations are in regions thatare not as forbidding as the Arctic, such as the Volga Ural region, the Baltic region or eventheMoscow region, so this resourcewould seem to deservemore attention. Similarly, thereis a shortage of information about other sources of tight gas (gas contained in very lowpermeability formations) in Russia; if such formations are defined as those requiring the useof hydraulic fracturing technology to achieve economical production, we estimate currenttight gas production in Russia to be about 20 bcm per year. In the New Policies Scenario, weproject that production from gas shales and other tight gas formations will grow slowly, toaround 30 bcm per year in 2035.
Methane hydrates
Although the total amount of methane in hydrate deposits around the world is the objectof widely different estimates, there is no doubt that it is extremely large (IEA, 2009) andthat a substantial part of these resources is located in the Russian Arctic, both onshorein permafrost and offshore on the continental platform of the Arctic seas. Although it isoften reported that the Messoyakha field in the north of Western Siberia produced gasfrom methane hydrates, this appears to be somewhat by chance, with a conventional gasreservoir happening to be recharged from above by depressurisation of methane hydrates.Even this interpretation is not fully established.
Although the resources are extremely large, the lack of established technologies to producemethane from hydrates and the large conventional gas resources available in the sameRussian Arctic regions, account for the absence of a concrete pilot production project inRussia. In fact, methane hydrates present in permafrost are more often seen as a safetyhazard in northern drilling than a resource, quite apart frombeing a potential environmentalthreat (Box 8.6). We do not project any production from methane hydrates during theperiod of this Outlook.
© O
EC
D/IE
A, 2
011

318 World Energy Outlook 2011 - OUTLOOK FOR RUSSIAN ENERGY
Box 8.6 " Methane hydrates and climate risks
Methane hydrates are not only potential gas resources; they are also a possiblemajor contributor to climate change. Global warming may trigger the dissociationof methane hydrates, potentially releasing massive amounts of methane into theatmosphere. Since methane has a greenhouse gas effect 25 times that of CO2 on amass basis over 100 years, such a release could trigger a catastrophic feedback loop.The hydrates located in the Arctic are considered most at risk, in this sense, due tothe recent rapid warming in the Arctic and the shallow depth of the seas or low-lyingpermafrost coastal areaswhere they are located. In particular the Eastern Siberian Searegion is considered to be the most vulnerable. Recent, preliminary measurements(Shakhova and Semiletov, 2010) suggestmethane hydrate dissociation rates far higherthan previously thought. Given the very large amount of methane thought to exist ashydrates in the region, if such rates were confirmed, there could be a sudden surgeof interest in producing the methane before it is naturally released. For example, ata long-term price of CO2 of $50 per tonne of CO2 equivalent, the value of preventingmethane release to the atmosphere would be a staggering $890/kcm ($25/MBtu).
CoalRussiahasvast coal resources.Ultimately recoverable resourcesareestimated tobeof theorderof 4 trillion tonnes, ranking third in the world after the United States and China. About two-thirds of this amount is hard coal and the rest is brown coal. Proven reserves amount to about160 billion tonnes under the PRMS classification (190 billion tonnes under the Russian “ABC1”classification), ofwhich some70billion tonnesarehardcoal and the restbrowncoal (BGR,2010).
Although there are coal deposits in many regions of Russia, the Kuznets basin (Kuzbass) inthe Kemerovo region in Siberia alone accounts for 60% of production. The second-largestbasin is the Kansko-Achinsk, in the nearby southern part of the Krasnoyarsk region, withabout 15% of production, primarily lignite. The rest comes mostly from various parts ofEastern Siberia and the Far East and, to a lesser extent, from the Timan-Pechora basin andthe Russian part of the Donetsk basin (Donbass), near the border with Ukraine. Many ofthe coal basins suffer from a harsh climate and tend to be very remote, with limited coaltransport infrastructure. The dominance of the Kuzbass and Kansko-Achinsk basins resultsboth from their vast resources and from their location near the trans-Siberian railway, in thesouth of Siberia. Remoteness is responsible for the vast resources of Siberia’s Tungusk basinor the Lena basin being hardly exploited.
Production has steadily increased over the last ten years (Figure 8.16), except in 2009 whenthe industry suffered as a result of the economic crisis. This pattern of increase has beendriven by increased exports rather than growth in domestic demand. Russia has becomethe third-largest coal exporter in the world (after Australia and Indonesia). The main exportmarket has been the EuropeanUnion, which absorbsmore than 50%of Russia’s exports, butour projections in the New Policies Scenario indicate that the focus will switch to the east,to China in particular. This dovetails with the expectation in Russian strategy documentsthat the main areas of growth in coal production will be in the east of the country, notably
© O
EC
D/IE
A, 2
011

Chapter 8 - Russian resources and supply potential 319
8
the Kansko-Achinsk basin and Eastern Siberia. In these circumstances, as in the oil andgas sectors, increased Chinese involvement in the Russian coal sector would be logical:alongside discussion of possible loans for coal sector development, there are already strongindications of interest fromChinese companies in direct participation in ventures to developRussia’s coal resources. Coal imports to Russia have been steady at around 20Mtce per year.They come primarily from Kazakhstan, as a number of power plants in Russia are linked totheir traditional supply source from Soviet times.
Figure 8.16 " Russian coal production and exports
0
50
100
150
200
250
300
1990 1995 2000 2005 2010
Mtce Net exports
Domes^c supply
The Russian Energy Strategy sets some ambitious goals for increased coal production overthe coming decades, with output targets of between 315 Mtce and 375 Mtce by 2030,depending on the scenario. The implementation of the Strategy detailed in the long-termdevelopment programme for the coal sector similarly sets the lower range for future outputat 320 Mtce in 2030. Our projections are more conservative (Table 8.6), as transport costsput a limitation on the ability of Russian coal to compete in export markets and internaldemand is gradually reduced by improved efficiency. We project coal production in Russiato be about 250Mtce per year in 2035, after peaking just below 270Mtce in themid-2020s.
Table 8.6 " Coal production in Russia by type in the New Policies Scenario (Mtce)
2009 2015 2020 2025 2030 2035
Coking coal 58 61 62 60 59 58
Steam coal 126 158 162 167 161 154
Brown coal 35 38 38 39 37 36
Total 219 258 262 267 257 248
Net exports 77 94 96 96 88 80
Despite an existing policy objective to increase coal use in the domestic market, the shareof coal in Russian primary energy consumption has continued to fall, from 22% in 1990 to19% in 2000 and 15% in 2009. Coal use in Russia has faced formidable competition in the
© O
EC
D/IE
A, 2
011

320 World Energy Outlook 2011 - OUTLOOK FOR RUSSIAN ENERGY
shape of low-priced and readily available domestic gas supplies. As discussed in Chapter 7,the price advantage of gas in the Russian domestic market is gradually being reduced asgas prices increase. This creates an opportunity for coal to increase its share in the Russianenergy mix – particularly in the event that the expansion of nuclear power capacity doesnot proceed as planned. However, while the mining costs of Russian coal are relatively lowby international standards, the distance from the main coal production areas in Siberia tothe main consumption centres in the European part of Russia is a constraint on pricing coalcompetitively with gas in the domestic market – all the more so as the western-most Russianreserves in the Pechora fields and the Donbass are being depleted quickly.27 There are alsologistical and, potentially, environmental issues to overcome before coal could be used morewidely to generate power and heat for the largest cities of Russia. This applies especially tocombined heat and power (CHP) plants, which tend to be located in residential areas.
The prospects for exports in the New Policies Scenario are determined by the shiftingsupply/demand balances projected for the European and Chinesemarkets. Themain currentexport destination is the EuropeanUnion: deliveries in this direction are expected to declineas the European Union import requirement falls from the peak of over 190 Mtce, reachedin 2008, to 155 Mtce in 2020 and 110 Mtce in 2035. Net Chinese import demand (around125 Mtce in 2010) increases over the current decade, reaching around 190 Mtce in 2018,before tailing off to 80 Mtce in 2035, but is vulnerable to small changes in the Chinesedomestic supply and demand balance. The result for Russia is that total net exports rise toaround 100 Mtce in 2018, before decreasing to less than 80 Mtce in 2035 as China’s thirstfor imports declines.
The competitive position of Russian coal on international markets, as within Russia, isaffected by relatively high transportation costs, which account for a high proportion ofexport costs. Russia is at the top of the international cash-cost curve for internationallytraded steam coal (see Figure 11.5 in Chapter 11), leaving it with the smallest margins oninternational sales andmeaning that Russia is likely to be among the exporters first affectedby any downturn in international demand. A key strategic issue, identified in the Russianauthorities’ draft programme for the coal sector, is adequate rail and port capacity as wellas efficient management of the logistics. Charges at Russian ports, for example, can add upto $10/tonne to costs, compared with typical charges of $2/tonne to $5/tonne elsewhere.
NuclearThe Russian nuclear industry languished for many years in the wake of the nuclearcatastrophe at Chernobyl, but its fortunes have improved over the last decade, withincreased political support, new state funding for the domestic construction programme anda greatly enhanced role for nuclear in Russia’s energy strategy. Rosatom – the state nuclearenergy corporation – and the Russian government have plans in place that would morethan double Russia’s nuclear capacity over the next two decades. To date, these plans have
27. See Box 7.4 in Chapter 7. A possible alterna!ve would be to locate coal-fired power plants closer to the reserves inSiberia and then transmit electricity rather than transport coal. Thus far this has been held back by insufficient cross-country transmission capacity, a constraint which is expected to be eased (but not removed) by new investment in theelectricity grid during the projec!on period.
© O
EC
D/IE
A, 2
011

Chapter 8 - Russian resources and supply potential 321
8
not been affected by any change of policy after the Fukushima accident and Russia has theraw materials, and industrial and technological foundation to rebuild its nuclear industry.However, thus far, implementation has been held back by high capital costs, financialresource constraints and lengthy commissioning periods. We expect these constraints toremain, at least in the period to 2020. Russia’s commitment to a number of internationalnuclear projects is also likely to slow the pace of growth at home.
In the New Policies Scenario, Russian nuclear capacity rises from the current 24 gigawatts(GW) to 31 GW in 2020 and 37 GW in 2035, an average increase of 1.7% per year over theprojection period (Figure 8.17). This is more than 25% below the lower end of the rangetargeted in the Energy Strategy to 2030 and in other development plans for the electricityand nuclear sectors. However, since electricity demand in the New Policies Scenario is alsoconsiderably lower than the level anticipated by Russian strategy documents, the share ofnuclear power in overall electricity generation still increases, from the current 17% to 19%in 2035 (and 18.6% in 2030, meeting the increase targeted by the Energy Strategy to 2030).Nuclear power plays a more prominent role in the 450 Scenario, pushed by the assumedintroduction of a domestic emissions trading scheme after 2020. In this scenario, nuclearcapacity rises to 50 GW and electricity output to over 365 terawatt-hours (TWh) in 2035.
Figure 8.17 " Installed nuclear capacity and share of electricity generationin the New Policies Scenario
0%
4%
8%
12%
16%
20%
24%
28%
32%
0
5
10
15
20
25
30
35
40
2010 2020 20302015 2025 2035
GW New capacity
Exis^ng capacity
Share of powergenera^on(right axis)
Note: The schedule for retirement of existing capacity is based on the assumption that all current plants receive a 15-yearextension to their original 30-year license period.
As of 2011, Russia has 32 nuclear reactors at ten power plants. All are operated by the statenuclear power generation company, Rosenergoatom (part of Rosatom, the company withsecond-largest nuclear generation capacity in the world, after EdF).28 Three reactors have
28. Of the reactors in opera!on, sixteen use VVER technology (a Soviet technology similar to the pressurised waterreactor technology in OECD countries), fi"een use RBMK technology (a Soviet graphite-moderated design, of the typeused in Chernobyl, and now considered obsolete) and there is one fast-breeder reactor. The standard genera!ng unit fornew-build reactors is an updated VVER design, providing 1 200 MWe.
© O
EC
D/IE
A, 2
011

322 World Energy Outlook 2011 - OUTLOOK FOR RUSSIAN ENERGY
been commissioned in the last decade, Rostov-1 (also known as Volgodonsk-1) in 2001,Kalinin-3 in 2004 and Rostov-2 in 2010. Two others started operation in the 1990s. All of therest (27 out of 32) were commissioned in the 1970s and 1980s, for an initial licence period ofthirty years. Rosatom has already granted, or is considering, the extension of the operatinglives of these reactors, normally by an additional fifteen years.
The output of Russia’s nuclear plants rose from 130 TWh in 2000 to 164 TWh in 2009,primarily because of an increase in the load factor to close to 80% in 2009. Electricityproduction from nuclear power is projected to reach 270 TWh in 2035. Given thatalmost all of the existing units are scheduled for retirement by the end of the projectionperiod, this means a major acceleration in the commissioning of new reactors. Of theadditional capacity, 12 GW is expected to come from the completion of previously stalledconstructions; the rest would be new reactors, both at existing sites and at twelve newpower plants around Russia.29
Rapid development of Russia’s nuclear power generation capacity will be verycapital-intensive and costs could be pushed even higher if the Fukushima incident leadsto additional safety requirements. Our estimate of the total cost of the nuclear capacityadditions foreseen in the New Policies Scenario is $115 billion (in year-2010 dollars),an average of $4.6 billion each year. This is broadly in line with figures announced byRosatom for 2010, in a total investment programme of 163 billion rubles ($5.2 billion),of which around three-quarters was dedicated to new build. As of 2010, Rosatom wasbuilding ten new reactors on six sites, as well as a floating nuclear power plant designedfor remote, Arctic locations.30
Along with consistently high levels of state financing, the nuclear expansion programmewill require sufficient and timely commitment from Russian industry, for example, to buildthe huge pressure vessels housing the reactors. It will also require a high number and levelof nuclear specialists: as in other countries this is no small task, given that there were fewqualified young engineers attracted to the nuclear industry in the 1990s. The availableindustrial and human resources will need to be sufficient not only for the domestic nuclearprogramme, but also for a growing number of international projects. Atomstroyexport, alsopart of Rosatom, has been an increasingly active competitor for business abroad: Russiahas nuclear power projects underway or in the planning stage in fifteen countries aroundthe world, with the firmest prospects in China (where two reactors were completed in2006/2007 at Tianwan), India, Turkey, Belarus, Vietnam, Armenia and Ukraine. All of thesefactors lead us to be cautious when assessing the prospects for a very swift increase inRussian nuclear capacity in the domestic market.
29. Not all of the new capacity would be for the Russian market: the first of a project for two 1 200 MWe VVER units inthe Kaliningrad region of Russia, close to the Lithuanian border, is provisionally scheduled to start opera!on in 2016 andis aiming to sell more than half of its power output to Germany, Poland and the Bal!c states.30. The launch of the world’s first floa!ng nuclear power plant, the Akademik Lomonosov, equipped with two 35 MWreactors, took place in 2010. It is planned to begin to provide power at an offshore Arc!c drilling site from 2012. Smallmodular reactors are a new technology gaining considerable interest; however, there are ques!on marks about theeconomics and poten!al risks of this type of small nuclear plant.
© O
EC
D/IE
A, 2
011

Chapter 8 - Russian resources and supply potential 323
8
Russia has significant uranium resources to support its ambitions for nuclear power: theseare estimated at 648 thousand tonnes (kt) of which 100 kt are proven reserves, around 4%of the global total (BGR, 2010).31 The figure for proven reserves is 284 kt under the Russian“ABC1” classification. Most of these are in the Sakha Republic in Russia’s Far East and alongthe border with Mongolia, particularly in the Zabaikalsky region. Russia produced 3.6 kt in2009, or 7% of global output. Unlike fossil fuels, mined production of uranium is less thanconsumption, since commercial and military inventories account for around a quarter ofglobal supply; but increased uraniumdemand for nuclear power, both in Russia and abroad,is expected to tighten the global balance.
The main current sources of Russian supply are in the Zabaikalsky region, but Russia hasplans to increase uranium production by exploiting the more remote reserves of the SakhaRepublic. The major project in this area is the huge Elkon development, where productionis expected to start around 2015 and to reach 5 kt by the mid-2020s, more than Russia’sentire output today. Major challenges, as with many of the remaining deposits, are thedistance from existing infrastructure and a severe climate. Several foreign companiesfrom Europe, Japan, India and China participate in, or are interested in, joint projects foruranium mining in Russia, in partnership with state-owned AtomRedMetZoloto (ARMZ).ARMZ is also expanding its operations outside Russia, having taken a controlling stakein Canada’s Uranium One (which operates several projects in Kazakhstan). Russia hasextensive conversion, enrichment and nuclear fuel fabrication capacity, providing fuel andservices both to Russian plants and to foreign nuclear operators. Russia has also createdthe International Uranium Enrichment Centre in Angarsk, Siberia, a multilateral initiativethat aims to ensure guaranteed supplies of uranium products to member countries (asidefrom Russia, these are currently Armenia, Kazakhstan and Ukraine) as an alternative todevelopment of their own enrichment capacities.32
Hydropower and other renewablesRussia has a well-established hydropower sector, developed largely during Soviet times.However, Russia has far from exhausted its hydropower potential and it has not usedmore than a fraction of the possibilities for other, non-hydro renewables. The currentcontribution of renewable energy to the Russian energy balance is anchored in 48 GW ofinstalled hydropower capacity, which accounted for 18% of total electricity output in 2009(Figure 8.18). The other main contribution comes from biomass, mostly firewood used forheating in rural areas. The use of modern renewable technologies is marginal.
31. Unlike other energy resources, reserves and resources of uranium are categorised according to produc!on cost;reserves figures from BGR are <$80/kg.32. The ini!a!ve also now incorporates the idea of a “fuel bank”, under an agreement with the Interna!onal AtomicEnergy Agency, which establishes a reserve of uranium that would be available to na!ons that face supply disrup!onsunrelated to technical or commercial reasons.
© O
EC
D/IE
A, 2
011

324 World Energy Outlook 2011 - OUTLOOK FOR RUSSIAN ENERGY
Figure 8.18 " Share of renewable energy in Russian total primary energydemand, electricity and heat production, 2009
0%
5%
10%
15%
20%
Total primary energy demand Electricity produc^on Heat produc^on
Other renewables
Biomass and waste
Hydro
Hydropower
Russian hydropower, like the nuclear industry, is emerging from a period of dramaticslowdown in activity in the 1990s that saw construction of many planned new plantshalted for lack of funding. As with the nuclear sector, the hydropower sector has someambitious plans for expansion in the coming decades, but there are uncertainties over howquickly they will be realised. There was a tragic setback in 2009 when an accident at the6 400 megawatt (MW) Sayano-Shushenskaya plant in Siberia destroyed three of the tenturbines at Russia’s largest hydropower facility and damaged the rest.
In 2009, total production from Russia’s hydropower and pumped storage plants was slightlybelow the post-1990 peak of 177 TWh, reached in 2007. The largest hydropower companyin Russia is the majority state-owned Rushydro; other assets belong to regional energycompanies and some are also linked to energy-intensive industries and industrial groups.Output from the Krasnoyarsk HPP (6 GW), for example, goes almost entirely to the hugeKrasnoyarsk aluminium smelter.We project that total production from hydropower will increase slowly over the initial partof the projection period, but then more rapidly after 2020, to reach 218 TWh in 2035. Itsshare in the overall electricity mix falls from 18% in 2009 but stays at around 15% after2020. Total capacity increases from today’s 48 GW to 51 GW in 2020 and then to 61 GW in2035. Additional capacity in the early part of the projection period comes mainly from thecompletion of unfinished projects, many of which are in the North Caucasus region. Lateron, growth is expected in parts of European Russia (predominantly in the form of pumpedstorage), but the main locations of capacity growth are anticipated to be Siberia and – to alesser extent – the Far East.The investment challenge for hydropower in Russia is not related to a shortage of resources:overall, Russia uses 20% of its economically exploitable hydropower potential.33 The largest
33. This figure for Russia is 852 TWh per year (WEC, 2010) and is defined as amount of the gross theore!cal capabilitythat can be exploited within the limits of current technology under present and expected local economic condi!ons.
© O
EC
D/IE
A, 2
011

Chapter 8 - Russian resources and supply potential 325
8
obstacle, as discussed for the coal sector, is the distance to market. Most of the remaininghydropower potential is in Siberia, far from themain electricity consumption centres. Use ofRussia’s hydropower potential is expected to remain constrained by limited cross-countrytransmission capacity, although investment in the electricity network eases this constraintsomewhat in the latter part of the projection period. An alternative solution to the problemof limited local demand would be an expansion of cross-border electricity trade with China;bilateral declarations and commercial interest have yet to be turned into specific initiatives,with the main barrier being the lack of long-distance transmission capacity.
The sector also faces a major challenge with ageing equipment and infrastructure: of510 functioning hydropower plants across the country, 72% are more than thirty years oldand 38% are already older than fifty years. Part of future investment must therefore go toupgrading existing facilities, with a short-term imperative, for Rushydro, to reconstruct theSayano-Shushenskaya plant. Repair works at this plant are scheduled for completion by2014, at an estimated total cost of 33 billion rubles ($1.2 billion).
Other renewables
Aside from large hydropower,modern renewables currently occupy only a small niche in theRussian energy mix, a position well below their potential. In the New Policies Scenario, therole of non-hydro renewables is expected to increase to 2035; their share of total primaryenergy supply reaches 4% in 2035 from 1% in 2009, a very large increase in percentageterms, but still constituting only a small part of Russia’s overall energy mix.The use of renewables for power generation is confined at present to a small number oflocal and regional projects, none of which have been built into the integrated network. Thecumulative capacity of small hydropower projects (defined as less than 25 MW) is around250 MW. There are geothermal stations in the Far East (Kamchatka), providing another80MWof capacity; and around 16MW from pilot projects for wind power. There is also anexperimental 1.7 MW tidal project in the Barents Sea that dates back to 1968. Traditionalbiomass (firewood) is widely used for space heating in rural areas, providing 2% of Russia’sheat supply,34 although this is not necessarily sustainable and the firewood is often burnedat low efficiencies.
A sharp increase in the uptake of renewable technologies is an objective set in a numberof Russian strategy documents.35 The most prominent of the various targets is to achievea 4.5% share for renewables (excluding large hydro) in electricity generation by 2020: thiswas accompanied by intermediate targets for 2010 (1.5%, which has already been missed)and 2015 (2.5%). Based on electricity demand projections, we estimate that the 2020 targetwould require 55 TWh of electricity to come from renewables (excluding large hydro). Thisimplies the addition of nearly 15 GW of renewable electricity generation capacity over
34. Es!mates of the share of biomass in Russia’s heat produc!on are o"en higher, around 4%; use of firewood for fuelis o"en under-reported in na!onal sta!s!cs.35. Expanding the share of renewable energy is iden!fied as a priority in government documents: Energy Strategy to2030 (Government of Russia, 2009); Concept of Long-term Social and Economic Development to 2020 (Government ofRussia, 2008); the Russian Climate Doctrine and related Ac!on Plan (Government of Russia, 2011); as well as the StateProgramme on Energy Saving to 2020 (Government of Russia, 2010).
© O
EC
D/IE
A, 2
011

326 World Energy Outlook 2011 - OUTLOOK FOR RUSSIAN ENERGY
the next nine years, or 1.6 GW per year.36 For comparison, China added over 37 GW ofrenewables capacity in 2009 alone.
The investment required tomeet this target in 2020 is estimated at $26 billion (in year-2010dollars), or $3 billion per year. For themoment, there are no supportive policies or incentivesin place to attract this sort of capital to the renewables sector. Various schemes are underdiscussion but, against a background of concern about high end-user electricity prices,the government appears reluctant for the moment to add higher costs into the wholesalemix by agreeing to include a premium in tariffs for new renewables-based electricity. Weassume in the New Policies Scenario that support mechanisms will be put in place in Russiaby 2014 (see Chapter 7). With implementation of support schemes only from that date,the 4.5% share of renewables in electricity generation is not achieved by the official targetdate of 2020 (Figure 8.19). In the 450 Scenario, we assume amuchmore concerted effort topromote low-carbon technologies, leading to their earlier and faster deployment.
Figure 8.19 " Share of renewables in power generation in Russia in theNew Policies Scenario (excluding large hydropower)
0%
1%
2%
3%
4%
5%
6%
7%
2009 2015 20252020 2030 2035
Small hydro
Solar PV
Geothermal
Wind
Biomass and waste
4.5% target
There are opportunities for renewable energy in Russia that are less contingent on statesupport. Chief among these is the provision of energy to isolated communities. Largeparts of Siberia and the Far East are very sparsely populated and are not connected to theunified grid.37 Power often comes from small diesel generators and the supply of fuel tothese communities is very expensive – in some cases having to be brought in by helicopter.Small-scale renewable technologies, with back-up from the existing generators, can bea very competitive proposition in these areas and would not necessarily need financialincentives.With improved access to financing on commercial terms, better information andthe removal of administrative and other barriers, there could be a significant expansion ofoff-grid renewables, primarily wind, geothermal and biomass.
36. Our es!mate is based on the mix of renewable technologies that Russia is projected to have when electricity outputfrom renewables reaches 55 TWh per year (in 2028).37. These are excluded fromwholesale trade (and all electricity is sold at regulated prices); support schemes designed for thewholesalemarket – as currently under discussion –would in any case have no impact on renewables projects in isolated areas.
© O
EC
D/IE
A, 2
011

Chapter 8 - Russian resources and supply potential 327
8
The adoption of renewable technologies in Russia may be held back initially by the limitedindustrial capacity to supply components or products (aside from small hydropower plantsand, to an extent, geothermal energy). The government is taking steps to address this issue,but it will take time to develop a domestic manufacturing base in the renewables sector(and, in the meantime, there are relatively few strong domestic voices –with the exceptionof Rushydro – pushing for stronger policies). Nonetheless, with the progressive removalof this constraint and the introduction of support schemes for the wholesale market, weproject more rapid growth for a range of renewable technologies. The opportunities forsmall-scale hydropower are mainly in the North Caucasus and parts of Siberia; geothermalpotential is concentrated in the Far East and in the North Caucasus; and, although most ofRussia’s wind potential is along the northern and Pacific coasts, areas of very low populationdensity, there is the potential for increased generation of electricity from wind in thesouthern part of European Russia (IEA, 2003, and Popel et al., 2010).
There are also extensive opportunities for Russia to use forestry residues and other biomassfor power and heat generation. Examples already exist in Russia of heat boilers that havebeen switched to use biomass (wood pellets), but only 1 600 of the 66 000 residential heatsupply plants in Russia are fired by renewable sources (Ministry of Natural Resources andthe Environment of Russia, 2010). The areas with the richest sources of this raw materialare in the northwest and in Siberia. In northwest Russia, the estimated annual resource ofresidues from the forestry industry is more than 30 million m3, based on actual productionfrom the timber industry (Gerasimov and Karjalainen, 2011). This is equivalent to over5 Mtoe, or 60 TWh of energy, only a tiny proportion of which is used. In neighbouringFinland, solid biomass use of 7 Mtoe provides almost 20% of primary energy supply; innorthwest Russia, the share of all renewables is around 2%.
There is scope to increase biomass use through co-firing or conversion of existing boilers andbiomass-based CHP could also contribute to meeting the Russian 4.5% renewables target.In many eastern parts of the country, greater use of biomass for heat and combined heatand power could be an efficient alternative to the gasification programme that is currentlyplanned. In western areas, there is also considerable scope to develop renewables projectsprimarily with a view to exporting electricity to the European Union. In addition to possibleexports of the biomass itself, any electricity generated from renewable energy for export tothe European Union would contribute to meeting member country targets.38
38. The European Union Direc!ve 2009/28 on promo!on of renewables aims to encourage joint energy projectsbetween European Union members and third countries; electricity imported from new renewables projects inneighbouring countries can count towards an European Union country’s renewables target. This would require, in manycases, the expansion of cross-border interconnec!on capacity.
© O
EC
D/IE
A, 2
011

© O
EC
D/IE
A, 2
011

Chapter 9 - Implications of Russia’s energy development 329
CHAPTER 9
H I G H L I G H T S
IMPLICATIONS OF RUSSIA’S ENERGYDEVELOPMENT
Who depends on whom?
! Although Russian energy use becomesmore efficient and reliance on oil and gas in thenational economy declines, the pace of these changes in the New Policies Scenario ismoremodest than Russia’s aspirations. The share of the oil and gas sectors in RussianGDP decreases from an estimated 24% in 2011 to 20% in 2020 and 15% in 2035.Faster implementation of energy efficiency measures could help to accelerate themodernisation of the Russian economy and thereby reduce more quickly the risks tothe Russian economy from excessive reliance on the oil and gas sectors.
! Russia will need a cumulative investment of over $2.5 trillion (in year-2010 dollars)to meet the supply requirements of the New Policies Scenario, with the largest shareof this in the gas sector (43%), followed by oil (31%) and then power (25%); averageannual investment needs are over $100 billion, 7% of Russia’s current GDP (MER).
! China becomes a major contributor to Russia’s revenues from the export of fossilfuels, its share increasing from 2% to 20% over the Outlook period while that of theEuropean Union falls from 61% to less than half. Total revenues from the export offossil fuels rise from $255 billion in 2010 to $420 billion (in year-2010 dollars) in 2035.The domestic gas market is an increasingly important source of value as domesticnatural gas prices are raised.
! At 9.7 mb/d of production in 2035, Russia is the largest non-OPEC oil producer andthe second-largest global producer, underlining its vital role in oil markets even asoil exports decline over the projection period. New pipeline routes to both east andwest create a more diverse and flexible oil export system, as well as opportunities toenhance Russia’s role as a transit country for Caspian oil.
! By 2035, Russia provides more than 30% of the gas imported both by the EuropeanUnion (over 170 bcm) and by China (75 bcm), underlining Russia’s central positionin Eurasian and global gas security. Although not at the levels of westward Russiangas export to Europe, the Russia-China relationship is set to become one of the mainarteries of global gas trade.
! Russia benefits from greater diversity of gas export markets, which create a degree ofcompetition between Europe and Asia for positions in Russian supply. However, thechanging dynamics of global gas markets and pressure on traditional pricing modelsfor gas are creating competitive challenges for Russia as it moves to higher-costsources for incremental gas output and looks to expand its position in LNGmarkets.
© O
EC
D/IE
A, 2
011

330 World Energy Outlook 2011 - OUTLOOK FOR RUSSIAN ENERGY
Energy and national economic development
Energy use in Russia is changing. A large part of Russia’s industrial and social infrastructure– its factories, power plants, buildings, networks – needs to be rebuilt or replaced over thecoming decades: much of it is reaching the end of its useful life. Given the low efficiency ofthe existing stock compared to the average technologies available on the market, all threescenarios examined in thisOutlook (and almost any plausible scenario for Russian economicdevelopment) bring an improvement in the overall efficiency of energy use. The speedand depth of this change will depend on Russian policy choices. Driving these choices willbe Russia’s aspiration to create a more efficient, dynamic and broad-based economy, lessdependent on the oil and gas sectors (Box 9.1).
Box 9.1 ! Oil and gas in the Russian economy
It is often said that Russia relies too heavily on oil and gas, but it is surprisingly difficultto pin down exactly how much these sectors contribute to the Russian economy.There are some useful indirect indicators, for example the share of oil and gas inRussia’s overall export earnings at around two-thirds (Figure 9.1), and the share ofoil and gas revenues in federal budget income at almost half.1 But there are differentfigures on the size of the oil and gas sector in Russia’s gross domestic product (GDP).According to the Federal State Statistics Service (Rosstat), oil and gas production andrelated services represent a relatively small share of national output, around 6% to 8% asindicated by data for 2004 to 2009. UnitedNations statistics likewise show that the entireextractive sector, including oil and gas, accounts for 9% of Russian GDP. This compares tothe equivalent figure of over 20% inNorway and around 50% in Saudi Arabia.Investigating why the figure for Russia is lower than for other oil and gas exporters,different studies (World Bank, 2005, and Kuboniwa et al., 2005) have pointed to theshare of Russia’s oil and gas activity that is undertaken by trading companieswhich arerelated to, but separate from, the production entities. These trading companies oftensell the oil and gas on domestic and international markets and, in the statistics, thishas the effect ofmoving profits and value-added from the oil and gas (manufacturing)sector to the trade (services) sector.The Russian Ministry of Economic Development has put the share of oil and gas inRussian GDP at 18.7% for 2007 (Government of Russia, 2008) and Gurvich (2010)has also reviewed the data to come up with higher estimates. For the purposesof this Outlook, we calculated value-added from the oil and gas sector based onrevenue from domestic and foreign oil and gas sales, minus relevant production,transportation and intermediate costs. We estimate that the oil (excluding refining)and gas sectors provided 17% of GDP in 2007, 24% in 2008 and – after falling back in2009 – 21% in 2010.
1. A 43% share of budget revenues in 2010 from the oil and gas sectors (3.6 trillion rubles out of 8.3 trillion) includesmineral extrac!on tax, VAT and excise taxes, and export du!es.
© O
EC
D/IE
A, 2
011

Chapter 9 - Implications of Russia’s energy development 331
9
Figure 9.1 ! Structure of Russian exports by value, 2009
Metals11%
Chemicals6%
Manufactured goods6%
Other9%
Crude oil33%
Oil products17%
Gas14%
Coal 3%
Fossil fuels67%
$303 billion
Note: 2009 was an anomalous year in terms of the volume of exports, but in terms of the value structure of Russianexports fossil fuels held a similar share of the total in 2007 (66%) and 2008 (69%).Sources: Ministry of Natural Resources and the Environment of Russia; Central Bank of Russia.
Improvements in energy efficiency are critical to the modernisation of the Russianeconomy (OECD, 2011): efficiency improvements in energy production and use would beaccompanied and sustained by a broader process of technological change and innovation,as the Russian economy adjusts to the demand for more efficient equipment and relatedenergy services. Industries that produce tradable goods, and particularly those seekingexportmarkets, benefit from lower production costs and increased competitiveness. Energysavings by households and industry release resources that can be used for productiveinvestment. Energy efficiency also reduces the investment required for domestic energysupply (or, alternatively, frees up additional resources for export), as well as improvingenvironmental outcomes.
The efficiency gains projected in the New Policies Scenario are relatively modest comparedwith Russia’s potential, but some of these benefits are nonetheless visible and quantifiablefrom the analysis conducted in Chapter 7.2 Cumulative spending on energy is $230 billionless (in year-2010 dollars) than in the Current Policies Scenario (see Box 7.2); the investmentrequirement in upstream oil, gas and coal is reduced by a total of $130 billion; emissions ofgreenhouse gases andmajor air pollutants are significantly lower.
By improving Russia’s medium-term prospects for economic development, the resourcesand income released by energy efficiency also help to address a second vulnerability facingRussia, the dependence of the national economy on oil and gas (Box 9.1), underlined by thelarge share of fossil fuels in the value of Russian exports (Figure 9.1). As brought home in2009, the main risk of such high reliance on energy is the way that it ties Russian economic
2. Total primary energy demand in 2035 in the New Policies Scenario is 830 million tonnes of oil equivalent (Mtoe),compared with over 900Mtoe in the Current Policies Scenario. However, Russia taps into a rela!vely small propor!on ofits poten!al efficiency gains in the New Policies Scenario. Our analysis in Chapter 7 suggests that poten!al savings fromincreased energy efficiency, rela!ve to comparable OECD countries, are equal to 30% of Russian energy consump!on in2008 and remain at 18% in 2035 in the New Policies Scenario.
© O
EC
D/IE
A, 2
011

332 World Energy Outlook 2011 - OUTLOOK FOR RUSSIAN ENERGY
and fiscal fortunes to movements in international commodity prices. Russia was among thecountries worst affected by the global financial and economic crisis – in large part becauseof the plunge in oil prices and sharp contraction of global energy demand.We estimate thattotal Russian revenues from oil and gas exports fell by 40% in 2009 compared to the recordlevels of 2008. The direct effect of the oil price shock was compounded by similar falls in theprices of other important export commodities, such as basemetals, as well as a sharp swingin capital flows as investors drew back from commodity plays and investments perceived ashigh risk, including emerging market assets. As a result, Russia suffered a larger decline inGDP (8%) than any other major economy in 2009 and, after budget surpluses in every yearsince 2000, the budget deficit in 2009 was 6.3% of GDP. High reliance on the oil and gassectors also creates potential pitfalls for Russia that have been documented in the literatureon the “resource curse”, i.e. the risk that an abundance of natural resources can actuallyhinder broader economic growth and human development in the longer term.3
Based on our GDP assumptions and projections for oil and gas production and export, weproject that the contribution of oil and gas to Russia’s GDP will decline gradually from theestimated 2011 level of 24%, reaching 20% in 2020 and 15% in 2035 in the New PoliciesScenario (Figure 9.2). The relative contributions of oil and gas converge over the projectionperiod, with the share attributable to the gas sector growing from 5% in 2010 to a high pointof 7% in the mid-2020s, before settling back to 6% in 2035, while that of oil falls steadilyfrom a peak of 19% in 2011 to 9% in 2035. The pace of change projected in this Outlook issignificantly slower than the rate of change targeted by Russia, in part because of differentassumptions about GDP growth: the Concept for Social and Economic Development to 2020(Government of Russia, 2008) envisages reducing the share of the oil and gas sector to 12.7%as early as 2020.
Figure 9.2 ! Estimated share of oil and gas in Russian GDPin the New Policies Scenario
0%
10%
20%
30%
40%
2005 2010 2015 2020 2025 2030 2035
Billiond
ollars(2010) Gas value-added
Oil value-added
Share of oil andgas value-addedin GDP (right axis)
0
100
200
300
400
500
600
3. High resource export earnings can strengthen the exchange rate and discourage produc!on in other sectors of theeconomy, although this risk is mi!gated in part in Russia through two funds (the Reserve Fund and the Na!onal WelfareFund), managed by theMinistry of Finance, which accumulate revenues fromoil and gas export du!eswhen oil revenuesexceed a certain threshold.
© O
EC
D/IE
A, 2
011

Chapter 9 - Implications of Russia’s energy development 333
9
Taken together, our assumption for Russia’s GDP growth, the gradual projected decreasein the role of oil and gas in the economy and the moderate progress with energy efficiencyimprovements examined in Chapter 7 imply some continuing risks to Russia’s nationaleconomic development. In particular, the trajectory anticipated in this scenario suggeststhat Russia could remain relatively exposed to external shocks, such as that in 2009, withany fall in international commodity prices having a substantial impact on overall economicactivity.
S P O T L I G H T
What would higher GDP growth imply for the energy sector?
Russia’s existing strategy documents for the energy sector, including the EnergyStrategy to 2030, are based on a more optimistic set of GDP assumptions than thoseused in thisOutlook. The differences are particularly evident in the period after 2015,when growth is assumed to be in the 5% to 6% range (as in the “favourable” scenariodeveloped by the Ministry of Economic Development) before tailing off after 2025.This compares to average rates of growth in WEO-2011 scenarios of 3% to 4% overthe same period.To allow for more direct comparison, we ran a “high GDP” case in line with thefavourable scenario from the Ministry of Economic Development.4 We kept mostassumptions constant from the New Policies Scenario, but assumed a faster paceof energy efficiency improvement – in line with the logic that moving Russia onto a sustained trajectory of higher GDP growth will require a more far-reachingmodernisation of the Russian economy and, in turn, that energy efficiency is anindispensable component of such a strategy. The main results include:! Total primary energy demand rises to over 1 090 Mtoe in 2035, increasing by an
average of 2% per year compared with 1% in the New Policies Scenario. Electricitydemand reaches 1 870 terawatt-hours (TWh) in 2035, 75% higher than currentlevels.
! Russia meets its target for a 40% improvement in energy intensity, relative toa 2007 baseline, in 2023, considerably earlier than in the New Policies Scenario(when it is met in 2028). This underlines that, if Russia is to get close to the40% reduction target by 2020, it will need to combine high GDP growth and aconcerted effort to implement energy efficiency policies.
! While energy intensity targets are met earlier, Russia’s targets for reducinggreenhouse-gas emissions becomemore difficult to achieve as higher GDP growthpushes up overall demand and emissions. CO2 emissions in 2020 are about1 920 million tonnes (Mt), only 12% below 1990 levels, compared to 23% below inthe New Policies Scenario.
4. In this high-GDP analysis, average GDP growth in the period 2009 to 2035 was assumed to be 5.3% per year comparedwith 3.6% in the regular scenarios.
© O
EC
D/IE
A, 2
011

334 World Energy Outlook 2011 - OUTLOOK FOR RUSSIAN ENERGY
A steeper trajectory for GDP, as targeted by policy makers as part of a revised strategy forsocial and economic development to 2020, would bring GDP projections back towards thelevels used to underpin the Energy Strategy to 2030 (Spotlight). For the energy sector, weassume that high GDP growth in the medium term would require accelerated efforts toimplement energy efficiency policies and raise the technical efficiency of Russia’s capitalstock, as well as putting in place the market structures necessary to ensure efficientinvestment, operation and end-use.5
Investment
Although one aim of the modernisation process is to diversify the Russian economy awayfrom oil and gas, the need for innovation and efficiency applies to these parts of the energyindustry as much as to the energy sector and the economy as a whole. With their very largeinvestment needs over the projection period, there is an opportunity for the oil, gas andpower sectors to play an important, even a leading, role in the technological transformationof the Russian economy. Russia will need a total of over $2.5 trillion in cumulativeinvestment (all figures in year-2010 dollars) in order tomeet the energy supply requirementsof the New Policies Scenario over the period 2011 to 2035 (Figure 9.3).
Figure 9.3 ! Cumulative investment requirement in coal, oil, gas and powersupply in the New Policies Scenario, 2011-2035
0
200
400
600
800
1 000
1 200
Coal Oil Gas Power sector
Billiond
ollars(2010)
The largest share goes to the gas sector with over $1 trillion, of which $730 billion is inthe upstream (including delivery of the gas to the existing transmission infrastructure),$250 billion is for maintaining the transmission and distribution network and $80 billion is
5. The link posited here between increased energy efficiency and high GDP growth means a difference in emphasiscompared with the Russian Energy Strategy to 2030: the Strategy’s “energy efficiency” scenario, which includes greaterefforts to reduce greenhouse-gas emissions, assumes a lower rate of GDP growth compared to the baseline (by oneyear’s growth in the period to 2030). While we recognise that a transforma!on of energy produc!on and use at globallevel, as required by the 450 Scenario, could reduce global GDP by the equivalent of one year’s growth to 2035, there arestrong counter-arguments – not least the significant poten!al costs to GDP from a changing climate. This is why GDP isassumed not to change between the main scenarios analysed in this Outlook. In the Russian case, the downside risks toGDP would appear to be highest in a business-as-usual scenario.
© O
EC
D/IE
A, 2
011

Chapter 9 - Implications of Russia’s energy development 335
9
in infrastructure for liquefied natural gas (LNG). The investment needs for the oil sector are$790 billion, most of which is in the upstream. The power sector will need $615 billion, 60%of this for generation and 40% for transmission and distribution. The investment needs ofthe coal sector are relatively modest, but still amount to $24 billion. The average annualinvestment required in the energy sector as a whole is over $100 billion, 7% of Russia’scurrent GDP at market exchange rates (MER).
In the short term, the economic and financial crisis has given Russia some breathing spacefor energy investment by holding back energy demand both at home and on itsmajor exportmarkets. Even so, the current level of investment is not so distant from the average levelrequired over the projection period. In the oil and gas sectors, for example, we estimate thattotal investment in upstream and midstream oil and gas projects was around $50 billion in2010, against our annual average requirement in the New Policies Scenario of more than$70 billion for these sectors.6 Nonetheless, it will be a challenge to mobilise this level ofinvestment throughout the projection period. Success will depend not only on price levelsand the fiscal regime, but also on Russia’s choice of economic model for the next stagein its development, in particular the extent to which this investment will be expected tocome from a limited number of state-owned or state-directed companies, rather than frommultiple market players, both state and private, operating in a broadly non-discriminatoryand competitive environment.
Revenues
Revenue from the energy sector will continue to be an important driver of growth andsource of national wealth, particularly in the near term. We estimate that annual revenuefrom export sales of fossil fuels, including oil, gas and coal, will increase from $255 billion in2010 to $420 billion in 2035 in theNewPolicies Scenario (in year-2010 dollars). Oil continuesto account for the largest share of export revenue, although this share falls from 79% to65% over the projection period as export volumes fall. The share of gas increases from17% to 33%, while that of coal remains relatively small. The most significant shift is in thegeographical sources of this revenue (Figure 9.4).While, in 2010, China accounted for a smallshare of the overall figure (2%), by 2035 this increases to 20%. The European Union remainsthe largest source of Russian fossil-fuel export earnings, but there is a reduction in its sharefrom 61% to 48% in 2035.
A second notable shift over the period to 2020 is the rising value of the domestic marketfor natural gas, compared with export markets. This is due to the continuing process of gasprice reform from the mid-2000s that put Russia on a path to equalise the domestic pricepaid by industry with the European export price (minus differential transportation costsand export duty). Gazprom estimates that it lost up to $50 billion over the last decade onprice-restricted domestic sales, but reported a profit on domestic sales for the first time in2009. Other natural gas producers in Russia, who are denied access to export markets, areobliged to sell only on domestic markets.
6. See tables 3.7 and 3.8 in Chapter 3 for data on oil and gas industry investment in Russia.
© O
EC
D/IE
A, 2
011

336 World Energy Outlook 2011 - OUTLOOK FOR RUSSIAN ENERGY
Figure 9.4 ! Sources of revenue from fossil fuel export sales, 2010 and 2035
61%16%
2%
21%European Union
Other Europe
China
Other (Asia andNorth America)
2010
12%
48%
20%
17%
2035$255 billion $420 billion
15%
Note: Revenue is in year-2010 dollars.
We estimate that the domestic gas market produced around one-fifth of total Russian gas salesrevenue in 2000 and that this share rose to 40% in 2010. In our projections, this sharewill continue toincrease, asdomestic prices rise, to account forhalf of total gas sales revenue in2020beforedecliningin the latterpartof theprojectionperiod (Figure9.5). Theshareof theEuropeanUnion in totalRussiangas sales revenuehas fallen from60% in2000 tounder40% in2010.Although revenue fromgas salestotheEuropeanUnionrises inreal termsovertheprojectionperiod,expressedasapercentageoftotalrevenue it continues to fall, to less than 30% in 2035, because of the value of domestic sales and thenthe increasing importanceofRussianexports toChinaandotherAsianeconomies.
Figure 9.5 ! Estimated share of Russian gas sales revenue from domesticand international gas sales in the New Policies Scenario
0%
20%
40%
60%
80%
100%
2000 2005 2010 2015 2020 2025 2030 2035
European Union
Other Europe
China
Other (Asia)
Domes`c sales
Eurasian and global energy security
Russia’s weight in fossil-fuel resources, production and export give it a critical role inensuring the adequacy and reliability of global energy supply. As of 2011, it is the largest oilproducer and its role in oil markets would be underscored by any deferment of investment
© O
EC
D/IE
A, 2
011
Chapter 9 - Implications of Russia’s energy development 337
9
in the Middle East (see Chapter 3). Russia is also set to remain, throughout the projectionperiod, the largest global gas producer, the largest external gas supplier to the Europeanmarket and an increasingly important provider of gas – and, to some extent, also of coal – toChina and the Asia-Pacific region.
However, there is a range of risks, both short term and longer term that attach to Russia’sposition in the global energy economy. The perceived short-term risks concern, particularly,the possibility of unexpected disruption to supply, whether caused by technical failures,accidents or politics; the longer-term factors relate to the adequacy of investment to enableRussian supply to keep up with demand. These risks are magnified, both for consumers andproducers, in cases where there is high dependence on a single supplier, route, or exportmarket, which is why diversity in these areas features strongly among policies designed topromote energy security. Some key issues related to Russia’s contribution to global energysecurity are: the incentives offered for investment in supply (see Chapter 8); the strengthand geographical sources of demand for Russian fossil-fuel exports; the reliability anddiversity of the routes to market for Russian oil and gas; Russia’s role in providing access tothe market for other oil and gas producers (notably in the Caspian region); and the shareof Russian energy (particularly natural gas) in individual export markets. As examined inChapter 7, the policy framework for the domestic market and the efficiency of domesticconsumption will also have a major impact on the availability of resources for export and inreducing the risk of demand running ahead of deliverability.
Regional energy relationships and oil and gas transit
Russia has a complex set of energy relationships with neighbouring countries. There is someevidence that ties across the former Soviet space are being normalised, as prices for Russiangas exports converge towards the equivalent of international prices. Yet there remainimportant open questions about future trade and transit flows. The first of these relatesto Russia’s gas relationship with Central Asia. Until 2009, large-scale Russian gas importsfrom Central Asia – and from Turkmenistan in particular – were a significant component ofthe Russian gas balance. But Russia now has a reduced need for gas imports, as a result ofthe effects of the economic crisis, more efficient gas use on the domestic market and risingproduction from non-Gazprom producers (see Chapter 8), while the commissioning of theTurkmenistan-China pipeline in late 2009means that Central Asian gas is no longer availableto Russia at a steep discount to international prices, removing the attractive possibilitiesfor arbitrage trade. Under these circumstances, we assume that total Russian imports fromCentral Asia will remain under 40 billion cubic metres (bcm) in the New Policies Scenario.7
A second question concerns Ukraine and its role in the transit of Russian gas exports to themain European markets, after two disputes in 2006 and 2009 that led to interruptions in
7. As described in the WEO-2010 focus on the Caspian region (IEA, 2010), higher Russian import levels are likely onlyif Central Asian gas is either available at a lower price or if there is a par!cular strategic decision to increase them, forexample an a#empt to forestall the development of alterna!ve export routes from Central Asia to Europe. It is alsopossible that the call on Central Asian gas could rise in the event of a delay to major upstream developments in Russia,such as the gas projects on the Yamal peninsula, but non-Gazprom produc!on within Russia would in all probability bea cheaper way to fill any gap.
© O
EC
D/IE
A, 2
011

338 World Energy Outlook 2011 - OUTLOOK FOR RUSSIAN ENERGY
gas deliveries to many parts of Europe. Despite some progress towards a more transparent,commercial basis for gas supply and transit, political considerations continue to bear onthis relationship, as indicated by the gas supply agreement of April 2010, which providedUkrainewith temporary relief on the price of imported gas at the same time as an agreementwas signed extending Russian rights to base its Black Sea Fleet in Crimea. This apparentlyirreducible element of politics, alongside the slowprogress beingmade byUkraine in tacklingthe inefficiency of its own gas consumption (so as tomitigate its high dependency on Russiangas imports) perpetuates the perception of risk associated with this route to market.
TheshareofRussia’sexport flows transitingUkrainehasdecreased fromover90% in the1990s toaround70%with the launchofnewpipelines throughBelarus (Yamal-Europe) in1999andacrosstheBlack Sea toTurkey (Blue Stream) in 2003. This figurewill fall furtherwith the commissioningofNordStreamin2011/2012.TheplannedSouthStreampipelineacross theBlackSea representsan additional threat to Ukraine’s role as a transit country (Figure 9.6). If South Stream were tobe built according to the schedule announced by the project sponsors then, with exports fromRussia to Europe as projected in the New Policies Scenario, there would be a major shift in thepattern of gas flows, involving lower utilisation of the existing routes through Ukraine (andtherefore Slovakia and the Czech Republic) and possibly also through Belarus (and thereforePoland). Thispicturecouldchange if gasdemand inEurope ishigher8and/or ifRussiawere togainahigher shareofEuropeangas imports. Forexample, if RussiahadashareofEuropeanUniongasimports of 40% throughout the projection period, then exportswould be 20 bcmhigher in 2020and 45 bcmhigher in 2035 than indicated in Figure 9.6.
Figure 9.6 ! Projected gas flows from Russia to Europe and potential growthin gas-export pipeline capacity
0
50
100
150
200
250
300
350
2010 2015 2020 2025 2030 2035
bcm Ukraine
South Stream*
Nord Stream
Blue Stream
Belarus, Yamal-Europe
Belarus
Finland, Bal`c States
Projected gas flows toEurope**
*The dates for commissioning of South Stream are the planned dates indicated by the project consortium and are notIEA projections. **Projected gas flows are from the New Policies Scenario and include exports to the European Union, toother OECD Europe and southeast European countries, but exclude Ukraine and Belarus.
Notes: Some of these future flows could also come via LNG. Pipeline capacities are assumed constant; this would requireconsistent investment inmaintenance thatmay not happen in practice, particularly for any capacity that is not being used.
8. See, for example, the Low Nuclear Scenario (Chapter 12) and the Golden Age of Gas Scenario (IEA, 2011b).
© O
EC
D/IE
A, 2
011

Chapter 9 - Implications of Russia’s energy development 339
9
There is similar evidence in the oil sector of Russia’s desire tominimise its exposure to transitroutes. The commissioning of the Baltic Pipeline System to the terminal at Primorsk nearSt. Petersburg in 2001 has reduced oil flows to non-Russian ports and changed the patternof flows along other transit pipelines. Primorsk has already become the largest export outletfor Russian crude, taking the place of the Druzhba pipeline network to Central and EasternEurope and allowing Russia also to ease congestion in the Turkish Straits by diverting exportsaway from the Black Sea port of Novorossiysk.
The expansion of the East Siberia Pacific Ocean (ESPO) pipeline to the east, together with thecompletion of the second Baltic Pipeline System (BPS-2) to Ust-Luga, will give Russia a further2.6millionbarrelsperday (mb/d)ofoil export capacity (130million tonnesperyear),withoutanycorresponding increase in export levels. As oil exports are projected to decline marginally overthecomingdecades, the loomingexcesscapacity in theRussianpipelinenetworkhas implicationsfor Kazakhstan (Box 9.2) aswell as, potentially, for the role of Russian in internationalmarkets.
Box 9.2 ! The Russian route to market for Caspian oil
Despite the commissioning in the 2000s of new export routes from the Caspian regionto both the east (Kazakhstan-China) and the west (Baku-Tbilisi-Ceyhan), Russia stillprovides the route to market for more than half of non-Russian oil exports fromthe Caspian region, including more than three-quarters of the oil exported fromKazakhstan, the region’s largest producer. The decision to expand the Caspian PipelineConsortium pipeline from the Kazakhstani port of Atyrau on the North Caspian coastto the Russian Black Sea port of Novorossiysk will reinforce the predominance ofexport routes through Russia in the period to 2015.The trajectory for the expansion of Kazakhstan’s production beyond 2015 is unclear,with the start date for the second phase of the Kashagan project a major uncertainty(IEA, 2010). In the New Policies Scenario, we project that Kazakhstani output will risefrom 1.6 mb/d in 2010 to 2.3 mb/d in 2020 and 3.9 mb/d in 2035. The bulk of this willbe available for export and, along with an enlarged Kazakhstan-China pipeline, theintention has been to provide for future export growth through a new large-capacitytrans-Caspian export route (known as the Kazakhstan Caspian Transportation Systemor KCTS) that would see Kazakhstani oil arrive at Black Sea or Mediterranean portsvia the South Caucasus. However, though Kazakhstan is likely to be wary of too higha level of dependence on any single transit country, Russia is expected to have amplewestbound capacity in its oil pipeline system by 2020 and could, if it wished, makea competitive offer to transport incremental volumes of its Caspian neighbour’s oil.
Russia in global oil markets
The share of Russia in global oil production decreases over the projection period from 12%in 2009 to 10% in 2035 in the New Policies Scenario (Figure 9.7). Nonetheless, at 9.7 mb/dof production in 2035, Russia is still the largest non-OPEC producer and the second-largest
© O
EC
D/IE
A, 2
011

340 World Energy Outlook 2011 - OUTLOOK FOR RUSSIAN ENERGY
global producer, behind only Saudi Arabia (13.9 mb/d). It remains well ahead of the nextlargest producers, Iraq and the United States. As emphasised in Chapter 8, while there isno shortage of resources in Russia to meet these levels of production, this projection issensitive to decisions on fiscal policy that will determine the attractiveness of the necessaryinvestments.
From the late 1990s until around 2005, Russia was the provider of the “incremental barrel”,meaning that Russia contributed much of the production growth necessary to keep pacewith rising global demand. This will no longer be the case in the future, as exports declinesteadily from 7.5 mb/d in 2009 to 6.4 mb/d in 2035. Nonetheless, Russia retains a criticalrole in the global oil balance as the largest non-OPEC producer and, moreover, a producerwith the resources and strategic goal to keep oil output at a consistently high level (Box 9.3).
Figure 9.7 ! Oil production in Russia and selected countriesin the New Policies Scenario
0%
2%
4%
6%
8%
10%
12%
14%
16%
0
2
4
6
8
10
12
14
16
1990 2000 2010 2020 2030 2035
mb/d Saudi Arabia
Russia
United States
Iraq
Russian shareof global oilproduc`on(right axis)
Russia’s role in oil markets will also be shaped by theway that it gets oil tomarket. As noted,Russia will have an increasing amount of spare capacity in its oil pipeline network throughthe projection period and, in theory, this will give Russia more flexibility in managing itsoil export flows, overcoming to a degree the rigidity of its traditional pipeline choices. Tothe extent that Russian exporters and traders have options available, this will increasetheir bargaining power relative to their potential purchasers, particularly those dependenton Russian deliveries by pipeline such as some refineries in Central and Eastern Europe.Additional spare capacity could also facilitate differentiation between the quality ofdifferent streams of crude oil passing through the Transneft system, allowing producers ofhigher-quality crudes (including, potentially, producers in Kazakhstan) to capture more oftheir value. This flexibility could offer Russia the possibility of adapting its export strategiesquickly, in response to changing market needs; but the scope for short-term flexibility maynot be great – Asian markets are projected to be the main source of global demand growthbut direct eastward routes to these markets will be constrained by the capacity of the EastSiberia-Pacific Ocean pipeline system.
Another issue for Russia is the balance between the export of crude oil and refined products.Boosting the share of refined products has been a long-standing Russian policy goal, in line
© O
EC
D/IE
A, 2
011

Chapter 9 - Implications of Russia’s energy development 341
9
with the overall aim to decrease the share of raw materials in Russia’s export mix. Higherfuel specifications on the domestic market and, in the longer term, a fiscal advantageattached to the export of higher-grade refined products are expected to stimulate furtherrefinery investment in Russia. Export to China is likely to remain dominated by crude, butincreasing demand for imported products in other markets, notably diesel in Europe, couldstimulate additional product export from Russia. Europe has a structural shortage of dieseloutput to meet increasing demand and Russia was the largest single supplier of Europe’snet 1.1 mb/d imports in 2010. This import requirement is expected to increase to 1.4 mb/dalready in 2015 (IEA, 2011a).
Box 9.3 ! Russian role in co-operation among oil and gas producers
There have been occasions – most recently following the precipitous declinein international oil prices in late 2008 – when Russia has expressed the wish toco-ordinate production levels with OPEC members. However, Russia has no spareoil production capacity and, even though the largest companies on the domesticmarket are either state-owned or are subject to a degree of state direction, it is noteasy to see how Russia would acquire the flexibility in output levels that is, at least intheory, required of OPEC members and their national oil companies. Russia’s largerevenue needs and the important role of the oil sector inmeeting themalso lessen thelikelihood of any willingness to restrain output.In the natural gas sector, Russia has assumed a leading role among global gasproducers and was instrumental in the creation of the Gas Exporting Countries’Forum (GECF), which became a fully-fledged international organisation in 2008. TheGECF is focusing on analytical issues and information-sharing and has no role inmarketmanagement that would justify a comparison with OPEC (despite the “Gas OPEC” tagthat has been attached to the organisation). Even if somemembers were to push theForum in this direction, it would be difficult for the GECF to co-ordinate cutbacks inproduction, given volume commitments in long-term contracts and the relative easewith which other fuels can substitute for gas. An alternative, about which Russianofficials have spoken in the past, is a role for the GECF in co-ordination of investmentprogrammes; but it is not yet clear how this could be managed and whether suchco-ordination, if indeed it were to take place, would occur among the group as awholeor, more informally, between individual GECF members on a bilateral basis.
Russia in global gas markets
After briefly ceding its position as the largest producer of natural gas to the United Statesin 2009, in the New Policies Scenario Russia consolidates its place as the leading globalproducer and exporter of natural gas in the period to 2035. Between 2009 and 2035, theincrease in gas production in Russia is greater than that in any other country, accounting for17% of global gas supply growth (Figure 9.8). Russia remains the largest global exporter ofnatural gas in all scenarios; the volume of gas produced varies widely from 970 bcm in the
© O
EC
D/IE
A, 2
011

342 World Energy Outlook 2011 - OUTLOOK FOR RUSSIAN ENERGY
Current Policies Scenario to 635 bcm in the 450 Scenario in 2035 because of the differentpolicies affecting global gas demand and greater or lesser efficiency of gas usewithin Russia.Russia’s positionwould be enhanced further if gas demand in key globalmarkets were to behigher than in theNewPolicies Scenario, as posited in the LowNuclear Case (see Chapter 12)and also in the Golden Age of Gas Scenario (IEA, 2011b). Russia has considerable scope,given a supportive market structure, to increase output from non-Gazprom producers, aswell as from Gazprom itself, and so would be in a position to take up a significant share ofincremental demand in both Europe and Asia in these “higher-gas” scenarios.
Figure 9.8 ! Gas production in selected countries in the New PoliciesScenario, 2009 and 2035
0 150 300 450 600 750 900
Turkmenistan
Australia
Algeria
Qatar
China
United States
Russia
bcm
2009
2035
Developments in the Russian gas industry have indirect impacts on gas markets around theworld, but the direct energy security implications are concentrated in those markets whereRussia is a supplier. Themain Eurasian gas trade flows, derived fromourmodelling results inthe New Policies Scenario, are shown in Table 9.1. Europe is set to remain the largest exportmarket for Russia, but Asianmarkets become increasingly important, with eastward exports(mainly to China, Japan and Korea) projected to rise above 100 bcm in 2035, almost 30% ofRussia’s total gas exports.
China plays a critical role in the orientation of Eurasia’s gas export flows. From 4 bcm in 2010,exports from Russia and producers in the Caspian region to China grow to account for 16% ofEurasia’s total gas exports in 2020 –mainly due to exports fromTurkmenistan. This figure risesto close to 30% in 2035, as exports from Russia and the Caspian region increase. This shift is anatural response to China’s growing import needs: China is projected to account for over one-third of the total growth in inter-regional gas trade over the projection period (see Chapter 4).
While our projections for production and export are lower in absolute terms than thosein Russian strategy documents, the thrust of the export trend does correspond to Russia’sstrategic priorities, namely, to maintain its position on the European market while decreasingits proportional dependenceonEuropeancustomersby increasing the shareof its exports goingto Asia.
© O
EC
D/IE
A, 2
011

Chapter 9 - Implications of Russia’s energy development 343
9
Table 9.1 ! Main gas trade flows from Russia and the Caspian regionin the New Policies Scenario (bcm)
2010* 2020 2035
Caspian net exports 42 100 135to China 3 37 57to Europe via Southern Corridor 6 23 42to Russia (a) 24 34 31
Russia net exports (b) 190 214 328Total Russia exports (a+b) 214 248 359
to Europe 201 225 237to China 1 13 75to other OECD countries 12 10 35to other non-OECD countries 0 0 12
Total Russia and Caspian to China 4 50 132Total Russia and Caspian to Europe 207 248 279
Russia to EuropeanUnion 118 158 171*Preliminary 2010 data.Notes: Figures for the Caspian region include data for Azerbaijan, Kazakhstan, Turkmenistan and Uzbekistan; residualexports from the Caspian region to Iran are not shown. Exports from Russia to other OECD countries are mainly to Japanand Korea; exports to other non-OECD countries are mainly to India.
In the New Policies Scenario, Russia’s share of imports to the European Union market nolonger declines steadily, as it has over the last decade (from almost 50% in 2000 to 38%in 2009 and 34% in 2010). Russia’s share remains at 35% in 2020, before falling graduallyto 32% in 2035 (Figure 9.9). Expressed as a share of EU total gas consumption, Russia’sshare recovers slightly from 23% in 2009 to 27% in 2020, remaining at this level until2035. The share of Russian gas in the Chinese import mix is projected to grow quickly after2015, reaching 10% in 2020 and 35% in 2035. This represents 15% of total Chinese gasconsumption in 2035.
Figure 9.9 ! Russian share of natural gas imports and consumption in theEuropean Union and China in the New Policies Scenario
0%
10%
20%
30%
40%
Share of import Share of consump`on Share of import Share of consump`onEuropean Union China
Shareo
fRussia
ngas 2009
2020
2035
© O
EC
D/IE
A, 2
011

344 World Energy Outlook 2011 - OUTLOOK FOR RUSSIAN ENERGY
Although its share of imports into the European Union drops slightly by 2035, Russia’s increasedshare of overall gas consumption in both the European Union and China highlights its centralposition inglobalgassecurityand,especially, the importanceofGazprom,asthedominantexporterofRussiangas.Russia is set tohaveasignificantdegreeofmarketpower inEurope,whilebecomingless reliant, proportionally, on revenue fromgas sales to Europe. Spare pipeline capacity on routestoEuropewouldgiveRussia scope to re-direct export flows in response toagas supplyemergencyor other contingency, an energy security bonus for customers contemplating a hypotheticalshortageof gas supply, but a situationwhich also reinforces Russianmarket influence. To theeast,alongside increased exports to Japan and Korea, gas supply fromRussia to China is set to becomeoneofthemainarteriesofglobalgastrade,providingRussiawithdiversityofmarketsandrevenues,and China access to the large and as yet underdeveloped gas resources of Eastern Siberia and theRussian Far East. Somewill see thepicture presented in Table 9.1 as a healthy balance in gas traderelationships across Eurasia; othersmay see it as presaging a degree of competition betweenAsiaandEurope forpositions inRussiangas supply, including investment (Box9.4).
Box 9.4 ! Europe versus Asia: competing for Russian gas?
As Russia opens up gas tradewith China it gains greater diversity of gas exportmarketsand some strategic benefits, but the way in which this brings China into competitionwith Europe for Russian gas can be overstated or misunderstood. Russia will continueto supply themajority of its gas via pipelines, anchored by long-term supply contracts;under these circumstances, the contractual scope for Gazprom to vary supplies bydestination is small. Moreover, in relation to switching supplies between Europe andChina, the physical scope for abrupt change is even narrower. With the exception ofthe proposed 30 bcm Altai pipeline that would link existing fields in Western Siberiato China, there is unlikely to be any scope for Gazprom to make discretionary choicesabout the direction of pipeline exports between east and west.Most of the fields earmarked for export to China are in Eastern Siberia and the Far East,thousands of kilometres from the existing westbound infrastructure. These fields areremote and, as noted in Chapter 8, will be expensive to develop. With this in mind,Gazprom has reason to be concerned about its own bargaining position for, oncefixed infrastructure from these remote fields to China is in place, Gazprom’s optionsand therefore its leverage are limited. This helps to explain Gazprom’s preference tosupply China initially fromWestern Siberia (via the so-called Western route, the Altaipipeline): since it also supplies existing Europeanmarkets fromWestern Siberia, it cankeep pressure onChina to bid for this gas at a price closer to the European export price.While geography and the structure of the gas trade make it unlikely that China andEurope will compete for incremental Russian supply on a short-term basis, this isnot to say that there will be no competition over the longer term. But they will becompeting to influence the investment priorities and strategies of Russian companies,primarily but not exclusively those of Gazprom. Political factors will influence some ofthe Russian investment decisions, butmore significant will be the commercial factors:the extent and reliability of demand, the price available on the respective marketsand, perhaps, reciprocal investment opportunities.
© O
EC
D/IE
A, 2
011

Chapter 9 - Implications of Russia’s energy development 345
9
At the same time, the position of Russia on the Chinese market is not yet secured, andits position on the European market is not entirely secure. As noted, Gazprom’s share ofEuropean Union gas imports has declined markedly to 34% in 2010, 16% below its importshare in 2000. Themost recent drop in this share, by 4% in 2010, was the result of a Gazpromstrategy to make minimal changes to its oil-indexed pricing formulas for gas export even asthey came under pressure from cheaper LNG in Europe. This may have optimised revenuesas oil-indexed prices rebounded during the year, but it meant that Gazprom progressivelylost market share to other suppliers with pricing formulas more sensitive to gas-to-gascompetition. Gas demand growth in Europe is becoming increasingly concentrated in thepower sector, calling into question the viability of an export strategy based on indexationto a commodity – oil – that is no longer used for electricity generation in Europe.9 A similarinsistence on maximising export prices holds risks also in relation to supply into China,where pricing remains the main stumbling block in negotiations over gas (even though itseems clearer than in the past that Chinamay be ready to pay the prices necessary to ensuredevelopment of East Siberian gas resources).
Developments within the European gas market will affect the degree of dependence ofsome customers on Russian gas. As of 2010, thirteen countries rely on Russia for more than80% of their total gas consumption and a total of seventeen receive more than 80% of theirgas imports from Russia.10 Some of these countries in central and southeastern Europehave a realistic perspective to gain access to alternative pipeline supplies from the Caspianregion as well as, in some cases, LNG. This part of Europe – for example in Poland – couldsee some development of unconventional gas production. The European Union has alsoestablished a strategic priority to develop amore inter-connected European natural gas grid,through inter-connector and reverse flow projects; this would also have a potential impactin southeast Europe through the Energy Community Treaty that aims to integrate this regioninto a broader European internal energy market. To the extent that these developmentsprovide viable alternatives to Russian supply, they will reduce reliance on Russian gas anddiminish Gazprom’s pricing power in Europe. In the longer term, seriously enhanced effortsin Europe to de-carbonise its energy systemwould have a significant impact on the trajectoryof European demand for imported gas, compared with the New Policies Scenario.11
These uncertainties and competitive pressures are set to increase at a time when Russiais obliged to move to higher-cost sources for incremental gas supply (as compared withexisting output from Western Siberia). Plans to increase its presence on the internationalLNGmarket form one element of the Russian response and this is already paying dividends
9. Less than 3% of the electricity generated in OECD Europe comes from oil, this figure has halved over the period 2000to 2009.10. According to IEA data, countries relying on Russia formore than 80% of their gas consump!on in 2010were Armenia,Belarus, Bosnia and Herzegovina, Bulgaria, Czech Republic, Estonia, Finland, Latvia, Lithuania, FYROM, Moldova, Serbiaand Slovak Republic; in addi!on to these, Croa!a, Romania, Poland and Ukraine also relied on Russia for more than 80%of their gas imports.11. In line with the objec!ve to decrease greenhouse-gas emissions by 80% in 2050, rela!ve to a 1990 baseline; this ismodelled in the 450 Scenario which shows a gradual decline in the European Union’s gas import requirement from theearly 2020s; European Union gas import demand in the 450 Scenario is 360 bcm in 2035, compared with 540 bcm in theNew Policies Scenario.
© O
EC
D/IE
A, 2
011

346 World Energy Outlook 2011 - OUTLOOK FOR RUSSIAN ENERGY
in Asian markets with the start of LNG shipments from Sakhalin. But there are questionsabout LNG export projects in the Russian Arctic, which are set to rely, at least in part, onmarkets in the Atlantic basin. Given that the North Americanmarket is now not expected torequire imported gas, this raises the question of how future Russian LNG supply may affectRussian pipeline deliveries to Europeanmarkets. Russian strategywill need to be responsiveto the changing dynamics of global gas markets.
Russia in global coal markets
Russian exports of coal have increased sharply since 2000. In the New Policies Scenario,Russia’s overall contribution to global exports is expected to bemaintained – the projectionsanticipate that Russian exports of hard coal will remainwithin a range of 75million tonnes ofcoal equivalent (Mtce) to 100Mtce throughout the period to 2035, keeping Russia as one ofthe main coal exporting countries behind only Indonesia, Australia and Colombia.
But the direction of Russia’s coal exports is expected to change. At present, more than 50%of Russian coal exports go to the European Union; but the European requirement for coalimports is projected to fall by almost 40%over the period to 2035, as demand for coal drops.To a degree, the Chinese market presents a viable alternative export market for Russia buthere, too, the market opportunity narrows after 2020 in the New Policies Scenario (seeChapters 10 and 11). Russia is a relatively high-cost supplier and faces increasingly strongcompetition in Asian markets from other producers, primarily Indonesia and Australia butincreasingly also Mongolia (although Mongolia relies in part on Russian transit to reachnon-Chinese markets). In our projections, this constrains Russia’s contribution to the globalbalance and exports decline slowly after 2020.
Environment and climate change
The dramatic economic decline in Russia in the early 1990s brought some environmentalbenefits and emissions reductions, but at a huge social cost. Energy-related carbon-dioxide (CO2) emissions fell by 35% between 1990 and 1997, but this was due entirely to acollapse in Russian industrial output and fossil-fuel use. The rebound in economic activitysince 2000 has been less carbon intensive, such that, while GDP surpassed the 1990 figurein 2007 (at market exchange rates), CO2 emissions in 2009 were still 30% below 1990levels. Nonetheless, Russia remains the fourth-largest emitter of CO2 and one of the mostcarbon-intensive economies in the world: the production of each unit of Russian GDPreleases three times more CO2 than the equivalent in the European Union. Expressed on aper-capita basis, annual emissions are almost 11 tonnes of CO2 (tCO2) comparedwith around7 tCO2 in the European Union (where GDP per capita is twice as large).
Russia has the opportunity over the coming decades to achieve significant additionalenvironmental improvements if policies are introduced to support more efficient energyproduction and use, and the deployment of low-carbon technologies. The projections inthis Outlook show a wide range in the level of energy-related CO2 emissions, depending onthe scenario (Table 9.2). Higher fossil energy use pushes up emissions fastest in the Current
© O
EC
D/IE
A, 2
011

Chapter 9 - Implications of Russia’s energy development 347
9
Policies Scenario, so that they are close to the 1990 level by 2035. In the New PoliciesScenario, emissions growth is more moderate at 0.6% per year; and in the 450 Scenario,emissions decline after 2015, pushed down bymore concerted efforts at energy saving and,after 2020, by the assumed introduction of a domestic emissions trading scheme for powergeneration and themost energy-intensive industrial sectors. The carbon intensity of Russia’sGDP decreases in all scenarios, but most quickly in the 450 Scenario. In terms of emissionsper-capita, the 450 Scenario is the only scenario that registers a decline, from the current11 tCO2 to 8 tCO2, while this figure rises to above 13 tCO2 per-capita in the New PoliciesScenario and to above 15 tCO2 in the Current Policies Scenario.
Table 9.2 ! Energy-related CO2 emissions in Russia by scenario (million tonnes)
1990 2009 2020 2035 2009-2035*
New Policies Scenario 2 179 1 517 1 687 1 787 0.6%
Current Policies Scenario 2 179 1 517 1 732 2 046 1.2%
450 Scenario 2 179 1 517 1 551 1 102 -1.2%
*Compound average annual growth rate.Notes: Energy-related CO2 data from the Russian national inventory, reported to UNFCCC, differ from those of IEA. TheRussian data on emissions are up to 6% lower than IEA data for all years except 1990 and 1991, when they are around10% higher; thus the Russian figure for 1990 is 2 287 million tonnes and for 2009 is 1 387 million tonnes.
Russia’s emission pledge for 2020, submitted to the UNFCCC following the CopenhagenAccord, is a 15% to 25% reduction, relative to 1990. The target within this rangedepends on the extent to which the role of Russia’s forests as a carbon sink will betaken into account and whether all major emitters adopt legally binding obligations.12The minimum target of a 15% reduction in 2020, applied to energy-related emissions,sets a limit of 1 852 million tonnes of CO2 emitted in 2020: this is achieved with room tospare in all three scenarios. A 25% reduction would set the limit at 1 634 million tonnes:this would require additional policy efforts, since it is met only in the 450 Scenario.Our analysis suggests that Russia could comfortably afford to adopt a limit at the moreambitious end of the proposed range; indeed, it would need to be at or beyond25% if it is to provide a meaningful stimulus to national policy in the period to 2020.
Moving Russia towards a lower-emissions trajectory will require much more concertedefforts to improve energy efficiency and to deploy low-carbon fuels and technologies(Figure 9.10). Improvements in energy efficiency contribute half of the cumulativeabatement in emissions in the transition to the 450 Scenario. Increased deployment ofrenewables and power plants equipped with CCS technology, particularly after 2020,accounts for the bulk of the remainder.
12. As a member of the G-8, Russia is also associated with the longer-term goal of achieving at least a 50% reduc!on inglobal emissions by 2050 (2008 Hokkaido G-8 Summit) and the goal of developed countries to reduce emissions by 80%or more by 2050 compared to 1990 or more recent years (2009 L ’Aquila G-8 Summit).
© O
EC
D/IE
A, 2
011

348 World Energy Outlook 2011 - OUTLOOK FOR RUSSIAN ENERGY
Figure 9.10 ! Energy-related CO2 emissions abatement in Russia by sourcein the 450 Scenario compared with the New Policies Scenario
2010 2015 2020 2025 2030 2035
Gt
Total (Mt CO2)
2020 2035
EfficiencyRenewablesNuclear
CCS
73%12%15%
1%
136
46%22%8%
24%
685
Abatement
1.0
1.2
1.4
1.6
1.8
2.0
2.2
450 Scenario
NewPolicies Scenario
Current PoliciesScenario
Anenvironmental scenario does not just bring benefits to the global climate through reductionsinCO2.Sulphurdioxide(SO2),nitrogenoxides(NOx)andparticulatematter (PM2.5)allhavenegativeeffectsonhumanhealthandtheenvironment.Policiesaimedatdecreasingconsumptionof fossilfuels and reducingemissionsofCO2alsohave theeffectof loweringemissionsof thesepollutants(Table 9.3). In the New Policies Scenario, lower energy demand means that emissions of SO2fall by more than 500 000 tonnes compared with the Current Policies Scenarios, a reductionof 10%; emissions of NOx in 2035 are also 8% lower. In both of these cases, there is a decline inthe absolute volume of emissions, relative to 2009. The improvements are due to the assumedimplementationofmeasures tocontrol air pollution frompowergeneration, industrial processesand transportation. However, thesemeasures are not stringent enough to produce a decline inemissions of particulatematter, which remain flat in the New Policies Scenario while increasingslightly relative to 2009 in the Current Policies Scenario. Emissions are even lower in the450 Scenario, further improving air quality and reducing negative health impacts.
Table 9.3 ! Emissions of major air pollutants in Russia by scenario(thousand tonnes)
New Policies Scenario Current Policies Scenario 450 Scenario
2009 2020 2035 2009 2020 2035 2009 2020 2035
Sulphur dioxide (SO2) 6 019 4 223 4 353 6 019 4 317 4 858 6 019 3 977 3 477
Nitrogen oxides (NOx) 4 797 3 653 3 348 4 797 3 718 3 636 4 797 3 442 2 732
Particulate matter (PM2.5) 1 301 1 305 1 302 1 301 1 327 1 387 1 301 1 281 1 214
Notes: Estimates are based on assumed implementation of a range of pollution control measures in place or underconsideration in Russia.13 The regulatory regime is not assumed to change by scenario; variations are due to differencesin the level and structure of energy use.Source: IIASA, 2011.
13. Pollu!on control measures include: large combus!on plants are equipped with moderate control measures likein-furnace control of SO2 emissions or combus!on modifica!on for NOx; measures for mobile sources are based onRussian plans to implement European standards, i.e. Euro IV by 2015; controls on process sources from the non-ferrousmetals industry (important sources of SO2 and dust) have been assumed according to programmes presented by theindustry; medium-to-high efficiency electrosta!c precipitators are introduced to control emissions of PM2.5 from largesta!onary combus!on and process sources.
© O
EC
D/IE
A, 2
011

Chapter 9 - Implications of Russia’s energy development 349
9
Comparing this Outlook with Russian scenariosand objectives
Howdo the results of thisOutlook comparewith the scenarios and targets set out in Russianstrategy documents? Care is neededwhen comparing projections from various sources sincetheymay have different underlying assumptions. But it is, nonetheless, instructive to look atfive key objectives for 2030 from Russian strategy documents alongside the correspondingoutputs from theWEO-2011 (Table 9.4).
Table 9.4 ! WEO-2011 projections (in 2030) compared with selected forecastsfrom the Russian Energy Strategy to 2030
WEO-2011 Energy Strategyto 2030(range)New Policies
ScenarioCurrent Policies
Scenario450
Scenario
Total primary energy demand (Mtoe) 799 849 708 963 - 1 096
Electricity demand (TWh) 1 351 1 514 1 219 1 740 - 2 164
Gas production (bcm) 822 888 657 870 - 925
Oil production (mb/d) 9.7 10.2 8.5 10.6 - 10.7
Coal production (Mtce) 257 309 132 282 - 381
CO2 emissions (Mt) 1 756 1 915 1 232 2 048 - 2 288
Notes: The range for electricity demand in the power sector development plan (General Scheme), as amended in 2010, islower, at 1 553 TWh to 1 860 TWh; electricity demand in this table and in the Spotlight is calculated as productionminusnet exports; the Energy Strategy’s figures for gas production are adjusted to the IEA standard bcm (Box 8.3).
The differences in total primary energy demand and electricity demand between Russianscenarios and theWEO-2011 are driven largely by different assumptions about GDP growth.If we adjust for this factor, our results approach the range included in the Energy Strategyto 2030 (see Spotlight earlier in the chapter), though oil, gas and coal production in the NewPolicies Scenarios are all below the lower end of the targets included in the Energy Strategy,in part because of lower projections of domestic demand.
Higher official expectations in Russia about total primary energy demand and electricitydemand have important implications for energy policy and investment planning, in particularin the electricity sector (see Chapter 7). Russian projections of electricity demand wererevised sharply downwards in 2010 in the wake of the economic crisis (note to Table 9.4)and a correction made to the General Scheme for the sector. Nonetheless, pending theintroduction of a fullymarket-based approach to new investment in the power sector, thereis still a risk of imposed plans providing for levels of demand that may not materialise, withconsumers or taxpayers ultimately paying for capacity that is not efficiently timed, sized orwell located.
© O
EC
D/IE
A, 2
011

© O
EC
D/IE
A, 2
011
PREFACE
Continuing the practice of shining a searchlight on different issues each year in theWEO,Part C (Chapters 10 and 11) focuses on coal, the fuel which has accounted for nearly halfof additional global energy consumption over the decade to 2010. Chapter 10 deals withdemand and Chapter 11 with supply and investment. Recent developments in the sectorare reviewed and the prospects for coal in the three scenarios are presented.
Chapter 10 explains the forces which determine demand for coal and the extentof competition between coal and other fuels in different markets. It looks at theenvironmental aspects of coal use and developments in coal-based technology. Itconcludes with a detailed regional analysis of the main coal-consuming areas of theworld.
Chapter 11 carries out a similar supply-side analysis, detailing global coal resources,the cost of exploiting them by different mining techniques, production, and investmentprospects and international trade, again concluding with a series of country studies.
PART COUTLOOK FOR COAL MARKETS
© O
EC
D/IE
A, 2
011

© O
EC
D/IE
A, 2
011

Chapter 10 - Coal demand prospects 353
CHAPTER 10
H I G H L I G H T S
COAL DEMAND PROSPECTS
Treading water or full steam ahead?
" Coal accounted for nearly half of the increase in global energy use over the past decade.Its prospects vary markedly across the three scenarios in this Outlook, demonstratingthe significance of government policies towards energy, according to the balance theystrike between social, economic and environmental effects. Much depends too on thepace of investment into existing clean coal technologies and thedevelopment of carboncapture and storage.
" In the New Policies Scenario, global coal use rises through to the early 2020s and thenremains broadly flat, above 5 850 Mtce, throughout the rest of the projection period;one-quarter higher than in 2009. Coal continues to be the second-largest primary fuelglobally and the backbone of electricity generation. In the Current Policies Scenario,demand carries on rising after 2020, increasing overall by nearly two-thirds to 2035. Butin the 450 Scenario, coal demand peaks before 2020 and then falls heavily, decliningaround one-third between 2009 and 2035.
" China, responsible for nearly half of global coal use in 2009, holds the key to the futureof the coal market with an ambitious 12th Five-Year Plan to reduce energy and carbonintensity through enhanced energy efficiency and diversifying the energy mix. In theNewPolicies Scenario, China accounts formore thanhalf of global coal demand growth,with its demand growing around one-third by 2020 and then declining slightly beforeremaining broadly stable, above 2 800Mtce, through to 2035.
" India also plays an increasingly important role. Bymore thandoubling its coal use by 2035in the New Policies Scenario, India displaces the United States as the world’s second-largest coal consumer by 2025. Over 60% of the rise comes from the power sector,reflecting the enormous latent demand for electricity in India: in 2009 about one-quarterof the nation’s population still lacked access to electricity. Bringing electricity access to allthe world’s population by 2030, could entail more than half of the resultant increase inon-grid generation capacity coming fromcoal, comparedwith theNewPolicies Scenario.
" Power generation remains the main driver of global coal demand over the projectionperiod, accounting for at least three-quarters of the increase in both the New andCurrent Policies Scenarios. Stronger uptake of existing clean coal technologies andcarbon capture and storage, could boost the long-term prospects for coal use. If theaverage efficiency of all coal-fired power plantswere to be five percentagepoints higherthan in theNewPolicies Scenario in 2035, such anacceleratedmoveaway from the leastefficient combustion technologieswould lower CO2 emissions from thepower sector by8% and reduce local air pollution.
© O
EC
D/IE
A, 2
011
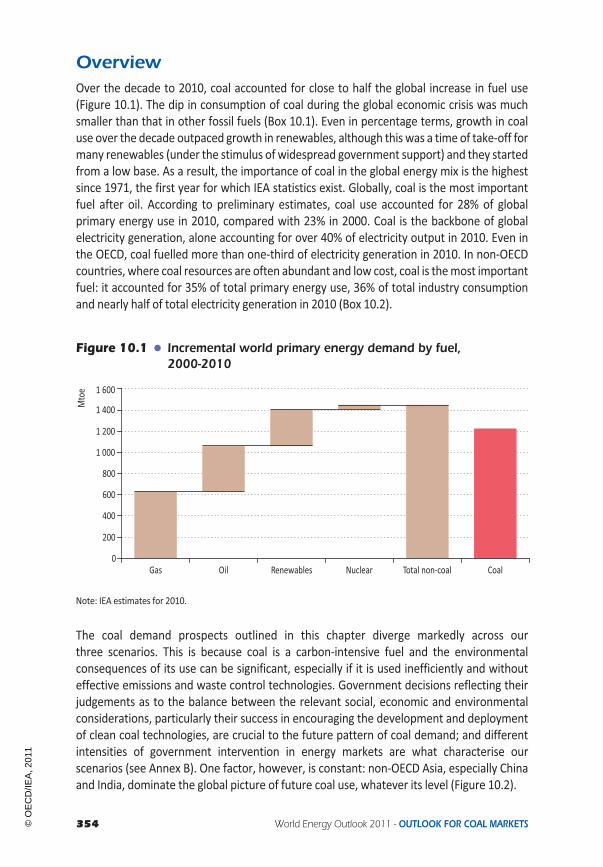
354 World Energy Outlook 2011 - OUTLOOK FOR COAL MARKETS
OverviewOver the decade to 2010, coal accounted for close to half the global increase in fuel use(Figure 10.1). The dip in consumption of coal during the global economic crisis was muchsmaller than that in other fossil fuels (Box 10.1). Even in percentage terms, growth in coaluse over the decade outpaced growth in renewables, although this was a time of take-off formany renewables (under the stimulus of widespread government support) and they startedfrom a low base. As a result, the importance of coal in the global energy mix is the highestsince 1971, the first year for which IEA statistics exist. Globally, coal is the most importantfuel after oil. According to preliminary estimates, coal use accounted for 28% of globalprimary energy use in 2010, compared with 23% in 2000. Coal is the backbone of globalelectricity generation, alone accounting for over 40% of electricity output in 2010. Even inthe OECD, coal fuelled more than one-third of electricity generation in 2010. In non-OECDcountries, where coal resources are often abundant and low cost, coal is themost importantfuel: it accounted for 35% of total primary energy use, 36% of total industry consumptionand nearly half of total electricity generation in 2010 (Box 10.2).
Figure 10.1 " Incremental world primary energy demand by fuel,2000-2010
0
200
400
600
800
1 000
1 200
1 400
1 600
Gas Oil Renewables Nuclear Total non-coal Coal
Mtoe
Note: IEA estimates for 2010.
The coal demand prospects outlined in this chapter diverge markedly across ourthree scenarios. This is because coal is a carbon-intensive fuel and the environmentalconsequences of its use can be significant, especially if it is used inefficiently and withouteffective emissions and waste control technologies. Government decisions reflecting theirjudgements as to the balance between the relevant social, economic and environmentalconsiderations, particularly their success in encouraging the development and deploymentof clean coal technologies, are crucial to the future pattern of coal demand; and differentintensities of government intervention in energy markets are what characterise ourscenarios (see Annex B). One factor, however, is constant: non-OECD Asia, especially Chinaand India, dominate the global picture of future coal use, whatever its level (Figure 10.2).
© O
EC
D/IE
A, 2
011

Chapter 10 - Coal demand prospects 355
10
Box 10.1 " A decade of booming coal use
For all the talk about natural gas and renewables, coal unquestionably won theenergy race in the first decade of the 21st century. Global coal demand acceleratedstrongly in the 2000s, following minimal growth in the 1990s. On average, between2000 and 2010 (a year for which only preliminary estimates are available), primarycoal demand grew by 4.4% per year –well above the average of 2.7% for natural gasand 1.1% for oil. In 2010, world coal demand was almost 55% higher than in 2000 –a bigger increase in both volume and percentage terms than for any other fuelcategory, including renewables. In energy terms, the increase in global coal demandamounted to 1 750 million tonnes of coal equivalent, equal to 75% of China’s coaldemand in 2010. In other words, coal accounted for nearly half of the increase inglobal primary energy demand during the past decade. Coal demand was relativelyrobust during the global economic crisis: it declined by only 0.7% in 2009, as a resultof a 4% rate of growth in non-OECD countries, which offset a drop of nearly 10% inthe OECD. In contrast, world demand for oil and natural gas fell by 1.9% and 2.1%,respectively.
In the New Policies Scenario, which assumes cautious implementation of the policycommitments and plans that have been announced by countries around the world,global coal use rises through to the early 2020s and then remains broadly flat to2035, at above 5 850 million tonnes of coal equivalent (Mtce).1 By then, demand isone-quarter higher than in 2009 and 17% higher than in 2010, based on preliminaryestimates for that year. The prospects are very different in our other two scenarios. Inthe Current Policies Scenario, which assumes no change in government policies relativeto mid-2011, demand continues rising through to 2035, reaching a level nearly one-thirdhigher than in the New Policies Scenario. In the 450 Scenario, which assumes muchstronger policies to achieve the goal of limiting the long-term global temperature increaseto 2°C, coal demand peaks before 2020 and then falls sharply; by 2035, demand is nearly45% lower than in the New Policies Scenario and back to the level of the early 2000s.Should nuclear generation end up developing at a slower pace than we have assumed inthe New Policies Scenario, global demand could be nearly 300 Mtce higher in 2035 in thatscenario – a volume equivalent to over half of global inter-regional steam coal trade in2009 (see Chapter 12). Similarly, if the United Nations “International Year of SustainableEnergy for All” in 2012 should result in a successful commitment to bring electricity to allthe world’s people by 2030, more than half of the resultant increase in on-grid electricitygeneration capacity is expected to be coal-fired, increasing global coal consumptionmarginally in that year (see Chapter 13). On the other hand, stronger policies supportingthe use of natural gas and increased supplies from unconventional sources, as describedin the Golden Age of Gas Scenario, would lower coal demand by nearly 400 Mtce in 2035compared with the New Policies Scenario (see Chapter 4).
1. A tonne of coal equivalent is defined as 7 million kilocalories, so 1 tonne of coal equivalent equals 0.7 tonnes of oilequivalent.
© O
EC
D/IE
A, 2
011

356 World Energy Outlook 2011 - OUTLOOK FOR COAL MARKETS
Figure 10.2 " World primary coal* demand by region and scenario
2 000
3 000
4 000
5 000
6 000
7 000
8 000
1980 1990 2000 2010 2020 2030 2035
Mtce Current Policies
Scenario
450 Scenario
New PoliciesScenario
1 883 Mtce
2 550 Mtce
India
Rest of world
China 47%
50%
14%
14%
*Includes hard coal (coking and steam coal), brown coal (sub-bituminous coal and lignite) and peat.
As noted, the overwhelming bulk of any future growth in coal demand will come fromnon-OECD countries. Their share of world coal demand rises from 70% in 2009 to around80% in all three scenarios as a consequence of faster population and economic growthand the availability of significant low-cost local and regional coal resources, particularly innon-OECD Asia (Table 10.1).
Box 10.2 " The shift to Asia
Over the last decade, more than 80% of the global increase in coal demand came fromChina alone. The country’s share of global coal demand rose from 27% in 2000 to 47%by 2010; its coal use more than doubling to 2 350 Mtce. This increase corresponds totwice the coal consump!on in the United States in 2010, the world’s second-largestconsumer of coal. Even during the period 2008 to 2010, overshadowed by the globaleconomic crisis, China’s coal demand grew by around 80% of the total coal used in theEuropean Union in 2010. India accounted for a further 11% of the global coal demandgrowth from 2000 to 2010, consolida!ng its posi!on as the world’s third-largest coalconsumer. Demand growth in OECD countries was much slower up to 2007 and thenfell for two consecu!ve years as a result of economic troubles; by 2010, demand was6% below peak use in 2007, and nearly back to 2000 levels. In 2010, almost half ofOECD coal demand came from the United States, where prospects for future use arethreatened by expanding supplies of unconven!onal natural gas and renewables, and!ghter air pollu!on restric!ons.
In the New and Current Policies Scenarios, China and India together account for well overtwo-thirds of the projected increase in demand over the Outlook period (Figure 10.3). Bycontrast, there is little prospect of long-term growth in coal demand in theOECD,where coaldemand comes undermuch greater pressure from natural gas and renewables as a result of
© O
EC
D/IE
A, 2
011

Chapter 10 - Coal demand prospects 357
10
the imposition of a carbon price and other government policies that improve the economicsof low-carbon energy sources. Even in the Current Policies Scenario, OECD consumptionreaches a plateau by 2020 and falls back close to the level of 2010 by 2035, while in the450 Scenario OECD coal demand is 60% lower than 2010 by the end of the projection period.In the 450 Scenario, China is the biggest contributor to the global fall in coal demand relativeto the New Policies Scenario, reflecting its dominant position in global coal use.
Table 10.1 " Coal demand by region and scenario (Mtce)
New PoliciesScenario
Current PoliciesScenario
450Scenario
1980 2009 2020 2035 2020 2035 2020 2035
OECD 1 380 1 476 1 494 1 146 1 609 1 588 1 400 623United States 537 693 705 599 751 773 698 326Europe 663 415 383 264 431 400 333 151Japan 85 145 158 115 165 156 141 60
Non-OECD 1 179 3 229 4 339 4 713 4 699 6 154 3 908 2 685China 446 2 179 2 863 2 820 3 069 3 709 2 596 1 535India 75 399 619 883 699 1 148 531 521Russia n.a. 136 166 168 173 203 150 96
World 2 560 4 705 5 833 5 859 6 308 7 742 5 309 3 309Share of non-OECD 46% 69% 74% 80% 74% 79% 74% 81%Share of China 17% 46% 49% 48% 49% 48% 49% 46%Share of India 3% 8% 11% 15% 11% 15% 10% 16%
Figure 10.3 " Incremental world primary coal demand by region and scenario
450 Scenario
New PoliciesScenario
Current PoliciesScenario
2009-2035
Mtce
China
India
Othernon-OECD
OECD
1990-2009
-1 800 -1 200 -600 0 600 1 200 1 800 2 400 3 000 3 600
The power sector remains themain driver of global coal demand over the projection periodin all three scenarios. Power generation accounts, respectively, for just over 80% and around75% of the increase in world coal demand in both the Current and New Policies Scenarios,keeping the share of this sector in total coal demand around or above two-thirds
© O
EC
D/IE
A, 2
011

358 World Energy Outlook 2011 - OUTLOOK FOR COAL MARKETS
(Table 10.2). In the 450 Scenario, the power sector accounts for almost all of the fall inglobal coal demand, driving down the sector’s share to half. Coal use in industry andtransformation processes such as blast furnaces and coke ovens, by contrast, nearly peaksin all three scenarios around 2020. The price differential between oil and coal prices fostersincreased use of coal as feedstock in coal-to-liquids plants (CTL) in all three scenarios,overtaking that of the buildings sector, but this use nonetheless remains small relative topower generation or industry.
Table 10.2 " World coal demand by sector and scenario (Mtce)
New PoliciesScenario
Current PoliciesScenario
450Scenario
1980 2009 2020 2035 2020 2035 2020 2035
Power generation 1 242 3 063 3 811 3 920 4 225 5 547 3 394 1 661
Industry 604 915 1 172 1 092 1 204 1 235 1 104 928
Transformation* 300 447 530 461 543 508 510 388
Coal-to-liquids 3 27 60 178 67 226 55 159
Buildings 339 178 178 129 186 143 164 99
Other 72 75 82 79 84 83 81 75
Total 2 560 4 705 5 833 5 859 6 308 7 742 5 309 3 309
Share of power generation 49% 65% 65% 67% 67% 72% 64% 50%
Share of industry 24% 19% 20% 19% 19% 16% 21% 28%
*Primarily blast furnace and coke oven transforma!on, and own use.
Understanding the drivers of coal demand
Current patterns of coal use are the result of a multitude of factors, most important ofwhich are the overall demand for energy in stationary uses (since coal is rarely directlyused in transport) and the level of economic activity driving that demand, the extentof resource endowments and the cost of producing and delivering them to market, thecompetitiveness of coal against other fuels, technological developments affecting the useof coal and other energy sources, and the geopolitical, policy and regulatory environment.The prospects for coal demand in each sector and region – and the different types of coaldemanded2 – depend, therefore, on how these different factors change (Table 10.3). Thecoal demand projections for the three scenarios in this Outlook rest on assumptions abouteach of these drivers. This section assesses how sensitive coal demand is to each factor andhow predictable they are, in order to shed light on the degree of uncertainty surroundingthe outlook.
2. In prac!ce, coal is very heterogeneous,with big differences in the characteris!cs across deposits. Specific quali!es of coalreferred to as coking coal, generally with low ash content and high calorific value, are required for the produc!on of cokefor steel produc!on. Awider range of types of anthracite and bituminous coal, generally referred to as steam coal, are usedin power genera!on and steam-raising in industry. Brown coal – sub-bituminous coal and lignite –which has a low calorificvalue, is also used for power genera!on (see Box 11.1 for classifica!ons and defini!ons of coal types).
© O
EC
D/IE
A, 2
011

Chapter 10 - Coal demand prospects 359
10
Table 10.3 " Summary of the main drivers of coal demand by sector
Economic activity Price Policies Technology
Powergeneration
Electricity demand isstrongly correlatedwith industrial output,commercial activity andhousehold incomes.
Competitiveness ofcoal-fired plant issensitive to changesin relative fuel prices(especially for newplants and relative tonatural gas).
Policies for low-carbontechnologies, includingcarbon pricing andair pollution, stronglyaffect decisions to buildand operate coal-firedplants.
Clean coal technologies,including more efficientplant, co-firing withbiomass and carboncapture and storage(CCS) could supportfurther growth.
Industry Industrial output,especially iron, steeland cement, is the mainunderlying driver.
Iron and steel coaldemand is relativelyinsensitive to prices; forsteam-raising, demandis highly price sensitiverelative to natural gasand oil.
Strongly influencedby air pollution andother environmentalregulations (slag andash disposal). Carbonpricing can raiseindustry productioncosts significantly.
Some remainingscope for efficiencygains in iron and steeland steam-raising;CCS unlikely to becommercially viable inmost cases for manyyears.
Buildings Personal incomeand cost determinesdemand for space andwater heating.
Normally coal is onlyused where the price iscompetitive with otherfuels.
Local pollutionregulations andsubsidies are the mainfactors.
Important technologicaladvances that wouldboost demand are notexpected.
Coal-to-liquids(CTL)
Indirect impact throughdemand for mobilityand therefore liquidfuels.
Viability of new projectsis highly sensitiveto the ratio of coalto oil prices; can bean attractive way tomonetise remote coaldeposits.
Policies on energysecurity and use of CCSwith CTL will be vital.Local water scarcity canhamper development.
Technological advancescrucial, particularlyCCS; combined withbiomass, CCS couldachieve negative carbonemissions.
Other uses Weak correlation. Feedstock demand forcoal in natural gas andchemical production(in some countries) ishighly price sensitive.
More stringentenvironmental policieswould depress demandin most applications.
Technologicalcost reductionbreakthroughs in coal-to-gas might boostdemand.
Economic activity
At the global level, coal demand is strongly correlated with economic activity: other thingsbeing equal, faster economic growth normally results in faster growth in coal demand.Therefore, uncertainty about the rate of growth in gross domestic product (GDP) in themedium term is a major source of uncertainty for global coal demand. This is especiallytrue of the rate of economic growth in China, the world’s second-largest economy, whichaccounted for close to half of global coal demand in 2010. The correlation between coaldemand and GDP is much stronger in some regions, depending on the importance of coalin the fuel mix and other factors. The intensity of coal use in a given economy is measuredby the amount of coal consumed per unit of GDP at market exchange rates (MER). On thismeasure, China and India have by far themost coal-intensive economies, with China in 2009consuming five times as much coal per dollar of GDP as the world as a whole (Figure 10.4).
© O
EC
D/IE
A, 2
011

360 World Energy Outlook 2011 - OUTLOOK FOR COAL MARKETS
Coal intensity in all regions is expected to fall significantly over the projection period, inline with the long-term downward trend in energy intensity and stronger penetration oflow-carbon sources. In the New Policies Scenario, global average coal intensity is nearlyhalved between 2009 and 2035. The economies of India and China remain much more coalintensive than the rest of the world, though the gap narrows substantially.
Figure 10.4 " Primary coal intensity by region as a percentage of 2009 worldaverage in the New Policies Scenario
0% 100% 200% 300% 400% 500% 600%
India
China
Russia
United States
Japan
European Union2009
2035
2009 worldaverage
2035 worldaverage
Note: Calculated based on GDP expressed in year-2010 dollars (MER).
Globally, growth in electricity demand is highly correlated to GDP growth, with a coefficientof close to one (i.e. every 1% increase in GDP is accompanied by a 1% increase in electricitydemand). Though high initially, the link between coal-fired power generation and GDPis expected to weaken in the future as the role of other fuels and advanced technologiesexpands. This is particularly the case in the 450 Scenario, where the share of coal inpower generation drops from 40% in 2009 to 15% in 2035, compared with 33% in theNew Policies Scenario.
The relationship between coal use andGDP growth is likely to remain strong in the industrialsector, partly because of difficulties in finding commercially viable replacements for cokingcoal in existing technologies in iron and steel production. The iron and steel sector accountsfor around 40% of total industrial coal use in 2009. Historically, iron and steel demand ishighly correlated with many factors – urbanisation, development of infrastructure andgrowth of the heavy-industry sector –which results in a strong indirect correlation betweenthese factors and coal use, mainly coking coal. In the New Policies Scenario, a slowdown inthe rate of growth in global crude steel output, continuing efficiency gains (spurred in part byhigher prices) through technological improvement and fuel substitution towards electricityand natural gas result in coal demand for iron and steel peaking around 2020 (Figure 10.5).While the coal intensity of steel production worldwide is projected to drop by one-third by2035 in the New Policies Scenario, technological innovation (e.g. using hydrogen and plasticwastes) could further reduce coal use in iron and steel production and, therefore, lead to afaster decoupling of industrial coal use from GDP.
© O
EC
D/IE
A, 2
011

Chapter 10 - Coal demand prospects 361
10
Figure 10.5 " World crude steel production, and iron and steel coal useversus GDP in the New Policies Scenario
0
200
400
600
800
1 000
0
500
1 000
1 500
2 000
2 500
0 30 60 90 120 150
Mtce
Million
tonn
es
GDP ($2010 trillion, MER)
Crude steelproduceon
Iron and steelcoal use (right axis)
2035
2009
1980
Sources: IEA analysis; World Steel Associa!on.
Coal prices and inter-fuel competition
In principle, coal can be replaced by at least one other fuel in most applications (thoughthe ease with which this can happen varies), making the price of coal relative to other fuelsa vital determinant of the competitiveness of coal and, therefore, the share of coal in theoverall energymix in any givenmarket. In the short term, with a fixed stock of energy-relatedequipment, fuel switching– to or fromcoal– canoccur only if unutilised capacity ormulti-firingfacilities are available. Data on fuel-switching capability is generally poor, but due to inherenttechnological aspects, it is seen to be greatest in the power sector. For example, in the UnitedStates, there is a significant amount of old, relatively inefficient coal-fired capacity (aroundhalf of its coal-fired power generation capacity is subcritical and over 30 years old) that is heldin reserve, generally to meet peak load, but can be brought online at other times when coalprices are low relative to other fuels, especially natural gas.
In the long term, opportunities for fuel-switching are greater as new equipment capable ofusing different fuels can be installed. However,most often, power stations and industrial boilersare built without multi-firing capabilities and it can be impractical or expensive to install suchequipment or tomodify the installation to use another fuel at a later stage. Decisions about thetype of capacity to be built may have long-term repercussions for coal use, particularly in thecase of power plants which have operating lives spanning many decades. Thus, the use of coalat the end of the projection periodwill be influenced both by the delivered price of coal relativeto other fuels at that time, as well as the price that will prevail between now and then. A periodof relatively low coal prices followed by a steep increasewould result in significantly higher coaldemand in 2035 than if prices rise sharply in the near termand then remain high.
Coal price trends
Around 17% of global hard coal production was traded internationally in 2009. While theprice for a large proportion of coal output is relatively stable, internationally traded coalprices tend to fluctuate over short periods (roughly in line with oil and natural gas prices),
© O
EC
D/IE
A, 2
011

362 World Energy Outlook 2011 - OUTLOOK FOR COAL MARKETS
reflecting the dynamics of inter-fuel competition (supported by financial trading markets),the importance of oil in coal mining operations and the cost of transporting coal over longdistances (see Chapter 11). Although coal prices weakened relative to both oil and naturalgas prices in the early part of the 2000s, they have strengthened since 2005 in responseto differences in market conditions. Because coal markets are regionalised, reflecting thesignificant cost of transportation and inland bottlenecks in the coal supply chain, prices varymarkedly across countries and regions. They are at times related to local weather conditions.
The prices of internationally traded coal have fluctuated significantly in recent years, surgingto record highs in 2008. To a large extent, this movement was part of a broad surge in energyand other commodity prices worldwide, which was driven by booming demand in China andelsewhere; other factors, including a shortage of ships (which caused freight rates to surge),rail transportation constraints in South Africa and Russia, and flooding in Australia, also playeda role. Prices fell back sharply in late 2008, due to the financial and economic crisis. They havesince rebounded strongly, reflecting continuing strong demand in China, which became a netimporter of coal for the first time in 2009, and renewed flooding in Queensland, Australia in2010/2011, strikes in Colombia and increasing costs of production in all the major exporters.For example, European steamcoal import prices peakedat $210per tonne in September 2008,plunged to $60/tonne early in 2009 and then recovered to around $120/tonne by mid-2011.Prices have increased even more in Asia, resulting in a shift in South African exports awayfrom Europe to Asia. Moreover, rapidly strengthening demand for seaborne coal imports hastended to produce a relativelymore global market for both steam and coking coal.
Differentials between the prices of various qualities of coal, notably steam and coking coalcan also oscillate markedly. The price of internationally traded coking coal has tended toincrease relative to the steamcoal price in recent years. Inmid-2011, the price differential hadreached its highest level ever, both in absolute and relative terms. This reflected exceptionallystrong demand for coking coal for steel making, the relatively small volume of internationallytraded coking coal, the existence of fewer suppliers and the inherently higher energy contentcompared to steamcoal.While thequality differential is expected topersist, supply constraintsare likely to diminish as investment shifts from steam to coking coal. As long as the differentialremains high, coking coal will retain preferential access to transportation infrastructure andcertain cross-category coals will bemore utilised formetallurgical purposes.
The prospects for international coal prices are uncertain. The most critical factor is theoutlook for imports into China, which could account for a large share of international coaltrade, even though such imports would remain a fairly small fraction of domestic demand.Chinese import needs are sensitive to small variations between the very large volume of coaldomestically produced and the total volume required on the domestic market. A relativelysmall shift in China’s supply and demand balance could lead to a sudden shift in import needsand significant swings in international prices (see Spotlight in Chapter 2). Chinese utilitieswith plants located on the coast are adept at arbitraging the domestic and internationalmarkets and, over the longer term, policy decisions in China and other major consumingcountries, particularly India, will be central to the evolution of coal demand and, hence,prices. In the New Policies Scenario, we assume that the average OECD steam coal importprice – a proxy for international prices – reaches $110/tonne (in year-2010 dollars) or just
© O
EC
D/IE
A, 2
011

Chapter 10 - Coal demand prospects 363
10
under $200/tonne in nominal terms by 2035 (Figure 10.6).3 Coal prices rise more quicklyin the Current Policies Scenario, as global coal demand and international trade grow morestrongly, but fall heavily in the 450 Scenario, as a result of far-reaching policy action to reducedemand, which in consequence reducesmarkedly the volume of international coal traded.
Figure 10.6 " Average OECD steam coal import price by scenario
0
20
40
60
80
100
120
140
1980 1990 2000 2010 2020 2030 2035
Dollarspe
rton
ne(2010) Current Policies
Scenario
New PoliciesScenario
450 Scenario
In the New Policies Scenario, coal prices are assumed to increase by significantly less than oil andnaturalgasprices inpercentageterms,bothbecauseproductioncostsareexpectedto increase lessrapidly andbecause global coal demand levels off around2025 (Figure10.7). Adetailed analysis ofcoal supply costs in each of themain exporting countries can be found in Chapter 11, whilemoredetails on the fuel priceassumptions foreach scenario in thisOutlook canbe found inChapter1.
Figure 10.7 " Ratio of average OECD steam coal import price to averageregional natural gas and IEA crude oil import prices in theNew Policies Scenario
0
0.2
0.4
0.6
0.8
1.0
1.2
1.4
1.6
1990 2000 2010 2020 2030 2035
Coalprice
divide
dbyfue
lprice Gas: United States
Gas: Europe
Gas: Japan
Oil: IEA
Note: Calculated on an energy-equivalent basis.
3. While variousprice indices canbechosenasaproxy for interna!onalprices, theaverageOECDsteamcoal importprice reflectsa significant part of global trade that takes place both in the Atlan!c and Pacific Basinmarkets by encompassing such impor!ngregions as Japan, Korea andEurope.
© O
EC
D/IE
A, 2
011
364 World Energy Outlook 2011 - OUTLOOK FOR COAL MARKETS
Fuel choice in power genera!on
Fuel choice in power generation involves both short-termdecisions aboutwhich typeof plant torun at any point in time given, a fixed set of generating assets, and periodic long-term decisionsabout investment in new generating capacity. In competitivemarkets, short-term decisions arelargelya functionof theprevailingpricesandavailabilityofdifferent fuels,whichaccount formostof theoperating costsofpowergeneration. Long-termdecisionsabout thechoiceof fuel fornewcapacityarebasedonabroader setof factorswhich togetherdetermine the full, or levelised, costof generation over thewhole operating lifetime of the plant. These factors include assumptionsabout the future price of fuel inputs and about capacity factors (how often the plant runs)together with assumptions about the capital costs, and non-fuel operating and maintenancecosts (includinganyactualorpotential penalties foremissions) foreach typeofplant. Thesecostsare influenced by construction lead times, plant efficiencies and discount rates. Other relevantfactors,whicharenotdirectly financial but have clear financial implications, include thedifficultyof obtaining planning permission, technical risks and operational versatility. Taken overall, atlow coal prices, subcritical coal-fired plants – the cheapest type of coal plant – typically have thelowest levelisedcostof all thedifferentgeneratingoptions (Box10.3).Athigher coalprices,moreefficient supercritical or ultra-supercritical plantsmay have lower levelised costs than subcriticalplants, but theymay thennot be competitivewith other energy sources. In practice, the costs ofdifferent generating options vary significantly across countries.
On an energy-content basis, coal prices have traditionally been much lower than theequivalent prices of oil and natural gas and they are assumed to remain so in all threescenarios in this Outlook. Consequently, coal-fired plants generally find themselves high upin themerit order for dispatch from existing plants (though usually below renewables-basedor nuclear capacity, for which short-term marginal costs are generally extremely low asfuel cost plays a negligible role or none at all). As a result, the utilisation rates for coal-firedplants are normally high, despite their generally lower conversion efficiencies comparedwith natural gas-fired plants (especially combined-cycle gas turbines [CCGTs]). But, whenit comes to new capacity, the relative attractiveness of a coal plant vis-à-vis a natural gasplant is reduced by its typically higher construction costs, longer construction time and, forthe most part, lower operational flexibility (CCGTs are among the most flexible plants). As aresult, the levelised cost of coal-fired plants in some cases can be higher than that of otherfuels and technologies. A decision to build a coal-fired plant also has to take into account thecommercial and financial risk that carbon penalties or other tougher pollution controls maybe introduced at some point in the future, requiring costly retrofitting, and that incentivesmay be given to alternative low-carbon technologies, affecting the cost advantage of coaland potentially reducing the utilisation of the coal-fired plant later in its operating life.For example, the existing EU Emissions Trading System and the currently envisaged morestringent air pollution controls in the United States are discouraging investment in coal-firedcapacity andmay continue to do so for some time.
Coal-fired capacity accounted for one-third of all the generating capacity additionsworldwide over the period 1990 to 2010. Nearly 70% of these coal-fired capacityadditions were in China. The bulk of the coal-fired capacity that has been built overthe last two decades is subcritical – a large proportion of it in China (Figure 10.8).
© O
EC
D/IE
A, 2
011

Chapter 10 - Coal demand prospects 365
10
Box 10.3 " Coal-fired power generating technologies
Different types of coal-fired power generation technologies in operation today, orunder development, have markedly different characteristics and costs. The maintypes are:" Subcritical: Conventional boiler technology – the most commonly used in existing
coal-fired plants – in which water is heated to produce steam at a pressurebelow the critical point of water (the point at which water reaches a pressure of22.06 megapascals [absolute] and a temperature of 374°C). A water separator (ordrum) facility must be installed in order to separate water and steam. Thermalefficiency is typically below 40% (gross terms and lower heating value).
" Supercritical: Steam is generated at a pressure above the critical point of water,so no water-steam separation is required (except during start-up and shut-down).Supercritical plants aremore efficient than subcritical plants (normally above 40%),but generally have higher capital cost.
" Ultra-supercritical: Similar technology to supercritical generation, but operating atan even higher temperature and pressure, achieving higher thermal efficiency (canexceed 50%). Although there is no agreed definition, somemanufacturers classifyplants operating at a steam temperature in excess of 566°C as ultra-supercritical.
" Integrated gasification combined-cycle (IGCC): Involves the production of a fluegas by partially combusting coal in air or oxygen at high pressure. Electricity is thenproduced by burning the flue gas in a combined-cycle gas plant. Thermal efficiencycan exceed 50%.
In order to reduce carbon-dioxide (CO2) emissions from coal-fired power plants,there is much development underway in the field of carbon capture and storage(CCS). This technology involves the capture of CO2 produced in the power plant, itstransportation and long-term storage underground.
Sources: IEA (2010a); IEA (2010b).
But the shares of both supercritical and advanced technologies, such as ultra-supercriticaland IGCC, have grown, especially in the last five years. No commercial large-scale, integratedcoal-fired power stationswith carbon capture and storage (CCS) have yet been built, thoughseveral demonstration plants are planned. In 2010, roughly three-quarters of coal-firedcapacity worldwide was subcritical, compared with close to 85% in 1990; another 20% wassupercritical and only 3%were advanced technologies.
In the Current and New Policies Scenarios, coal remains the backbone of power generation,despite the projected share of coal in global power output falling from 40% in 2009 to 33%in 2035 in the latter scenario. In the New Policies Scenario, coal-fired plants are expectedto account for around 27% of the total new additions to generating capacity worldwidebetween 2011 and 2020, and around 22% between 2011 and 2035. Of the coal-firedcapacity additions, the share of more efficient plants is expected to continue to rise,
© O
EC
D/IE
A, 2
011

366 World Energy Outlook 2011 - OUTLOOK FOR COAL MARKETS
driven by improvements in technology, growth in operational experience and rising coaland carbon prices, which improve the competitiveness of more efficient technologies.Between 2021 and 2035, just over 15% of new capacity is projected to be subcritical, whilethe share of advanced coal-fired plants is projected to rise to 40% (Figure 10.9). Reflectingthe expected pace of development of CCS technology, coal plants fitted with CCS accountfor 10% of total coal capacity additions over the same period, with half being built in OECDcountries (see Chapter 5).
Figure 10.8 " World coal-fired generating capacity by type and major region
0
200
400
600
800
1 000
1 200
1 400
1 600
1990 1995 2000 2005 2010
GW Advanced*
Supercriecal
Subcriecal
China + European Union+ United States
European Union+ United States
United States
*Includes ultra-supercri!cal and IGCC.Note: Excludes coal-fired genera!on from combined heat and power (CHP) plants.Source: Pla$s World Electric Power Plants Database, December 2010 version.
Figure 10.9 " New additions of coal-fired electricity generating capacity bytechnology and region in the New Policies Scenario
0 50 100 150 200 250 300 350
2021-2035
2011-2020
2021-2035
2011-2020
2021-2035
2011-2020
OECD
Othe
rno
n-OE
CDCh
ina
GW
Subcriecal
Supercriecal
Advanced*
Coal with CCS
*Includes ultra-supercri!cal and IGCC.Note: Excludes coal-fired genera!on from CHP plants.
© O
EC
D/IE
A, 2
011

Chapter 10 - Coal demand prospects 367
10
Theprojections describedabove, and those for theother scenarios, are derived fromadetailedanalysis of the levelised costs of all themain coal-fired generating technologies, together withassumptions about government policies. The results by 2020 in the New Policies Scenariofor the three main coal-consuming countries – China, the United States and India – and forselected key generating technologies are shown in Figure 10.10 (the detailed economic andtechnical assumptions4 underlying this analysis can be found in Table 10.4). Based on theseassumptions, coal is the most competitive fuel option in China and India, while in the UnitedStates, natural gas is much more competitive. The levelised costs of subcritical plants are,in most cases, cheaper than supercritical plants, but decisions about which type of plant tobuild will take account of expectations about higher coal prices in the future, which may tipthe balance in favour of supercritical, ultra-supercritical or even IGCC plants. The assumedintroductionof a shadowCO2price in theUnited States andaCO2price inChina (seeChapter 1)reduces the competitiveness of coal-fired technologies, notably subcritical plants.
The type of coal-fired power generation technology that is deployed over the projectionperiod for a given output of coal-generated electricity makes a difference to the totalamount of coal inputs required and consequent emissions. If the average efficiency of allcoal-fired power plants were to be five percentage points higher than in the New PoliciesScenario in 2035, such an accelerated move away from the least efficient combustiontechnologies would lower CO2 emissions from the power sector by 8% and reduce localair pollution. Opting for more efficient technology for new power plants would requirerelatively small additional investments, but improving efficiency levels at existing plantswould come at amuch higher cost.More efficient plants would also substantially reduce thegeneration efficiency penalty related to future CCS retrofitting. In reality, the penetrationof the most efficient coal-fired power generation technologies is constrained by barrierssuch as financing (less efficient plants are often the cheapest way of generating power),the absence of adequate pricing of the external environmental costs of coal-fired power(including CO2 emissions) and technical considerations (Spotlight).
4. The projec!ons of power genera!on by fuel and type of technology are very sensi!ve to the assump!onsmade about futurecapital and opera!ng costs, opera!onal performance and financial parameters. Rela!vely small changes in these can have asignificantimpactontherela!vefinanciala$rac!venessofthedifferentcoal-firedtechnologiesandalterna!vemeansofgenera!on,and, therefore, the shareof coal in total genera!onand thevolumeof coal consumed inpower sta!ons inabsolute terms.
What is impeding the deployment of more efficientcoal-fired generation?
The growth in CO2 emissions from coal-fired power genera!on can be curbedby choosing the most efficient plant designs for new plants and by replacing oldplants with more efficient ones. CCS technology imposes an efficiency penalty andaddi!onal costs, making the underlying plant efficiency of the utmost importance.Improving the efficiency of new coal-fired plants needs to be a high priority wherefleets are being rapidly expanded, notably in China and India.
S P O T L I G H T
© O
EC
D/IE
A, 2
011

368 World Energy Outlook 2011 - OUTLOOK FOR COAL MARKETS
In prac!ce, however, power companies donot always opt for themost efficient plantdesigns, because they are o"en rela!vely expensive on a levelised cost basis. Thethermal efficiency of an ultra-supercri!cal plant is typically up to 50% higher thanthat of a conven!onal subcri!cal plant. But the capital and maintenance costs arehigher, which can make the subcri!cal plant the cheaper op!on at low coal prices,where there is no penalty for CO2 emissions or when regulated electricity ratesresult in losses for the producer. In China, recent data indicate that a typical ultra-supercri!calplant todayhascapital costsonly15%higher thanthoseofasupercri!calplant, yet subcri!cal plants con!nue to make up a substan!al propor!on of newcoal-fired capacity, especially in non-OECD countries. In China, for example, 31%of all the coal-fired capacity brought online in 2010 was subcri!cal. But the shareof supercri!cal and ultra-supercri!cal plants has been growing as the construc!oncost differences diminish, delivered coal prices increase and policy signals thatencourage their deployment strengthen. Where coal is rela!vely expensive, ultra-supercri!cal technology would normally be the op!on of choice. For example, inJapan such plants now account for 28% of coal-fired capacity.
Other factors affect decisions about which technology to use for new plants,including:
" Fuel quality: local coalmay have highmoisture or ash content, or other impurities,such as chlorine.
" The technical capability and experience required to construct and operate suchplants.
" The longer planning and construction lead times of more complex plants.
" The size of the unit: larger plants tend to be more efficient than smaller ones.
" Ambient conditions, such as the availability of cold seawater, or indeed wateravailability in any sense, which may mean less efficient air cooling may have tobe used.
Taken overall, the best-available technology may not be the cheapest or mostprac!cal solu!on. However, in an environment where coal prices are rising, policymakers need to bewary of “locking-in” less efficient technology (see Chapter 6). Thepresence of a carbon price provides a powerful incen!ve for u!li!es to opt for moreefficient plants and maximise the efficiency of exis!ng plants. The cost of avoidingemissions through more efficient coal-fired genera!on can be low.
In the medium to longer term, newer technologies, such as IGCC, promise evenhigher efficiency. But these advanced technologies require further developmentto reduce costs before they can be deployed commercially on a large scale.
© O
EC
D/IE
A, 2
011

Chapter 10 - Coal demand prospects 369
10
Table 10.4 " Levelised electricity generating cost assumptions in theNew Policies Scenario, 2020
Coal GasCCGT
Nuclearpower
WindonshoreSUB SC USC IGCC Oxyfuel
with CCSUnited StatesCapacity factor 75% 75% 75% 75% 75% 55% 90% 28%
Thermal efficiency (gross, LHV) 39% 44% 49% 50% 40% 61% 33% 100%
Capital cost ($/kW) 1 800 2 100 2 300 2 600 4 000 900 4 600 1 750
Construction lead time (years) 5 5 5 5 5 3 7 1.5
Economic plant life (years) 30 30 30 30 30 25 35 20
Unit cost of fuel (various*) 55 55 55 55 55 7 3 -
Non-fuel O&M costs ($/kW) 45 63 69 91 120 23 104 26
China
Capacity factor 75% 75% 75% 75% 75% 60% 85% 25%
Thermal efficiency (gross, LHV) 37% 42% 48% 49% 39% 59% 33% 100%
Capital cost ($/kW) 600 700 800 1 100 1 700 550 2 000 1 500
Construction lead time (years) 4 4 4 4 4 3 6 1.5
Economic plant life (years) 30 30 30 30 30 25 35 20
Unit cost of fuel (various*) 70 70 70 70 70 11 3 -
Non-fuel O&M costs ($/kW) 21 28 32 50 68 18 70 23
India
Capacity factor 75% 75% 75% 75% 75% 65% 80% 23%
Thermal efficiency (gross, LHV) 34% 39% 44% 45% 35% 58% 33% 100%
Capital cost ($/kW) 1 200 1 500 1 700 1 900 2 975 700 2 800 1 550
Construction lead time (years) 5 5 5 5 5 3 7 1.5
Economic plant life (years) 30 30 30 30 30 25 35 20
Unit cost of fuel (various*) 60 60 60 60 60 11 3 -
Non-fuel O&M costs ($/kW) 42 60 68 86 119 25 105 23
*Natural gas in $/MBtu; coal in $/tonne; nuclear in $/MWh.
Notes: All costs are in year-2010 dollars. Unit fuel costs do not include CO2 prices. The weighted-average cost ofcapital is 7% for China and India, and 8% for United States. Investment costs are overnight costs (see Chapter 5). Forcoal and nuclear, capacity factors are es!mated averages for baseload opera!on, and mid-load opera!on for naturalgas. SUB = subcri!cal; SC = supercri!cal; USC = ultra-supercri!cal; IGCC = integrated gasifica!on combined-cycle.O&M = opera!on and maintenance; LHV = lower hea!ng value.
The choice of power generation technology, and in particular the choice of coal-firedtechnology in China, will be of enormous importance for global CO2 emissions from coal use.Policy decisions determining the role of nuclear power and renewablesmay shape the residualrole for fossil-fuel based plants. When competing against natural gas for new capacity on apurely commercial basis, the relative financial attractiveness of coal-fired generationwill hingecritically on relative coal andnatural gas fuel prices, aswell the extent and cost of requirementsto install pollution-control equipment at coal plants, notably flue-gas desulphurisation (FGD).
© O
EC
D/IE
A, 2
011
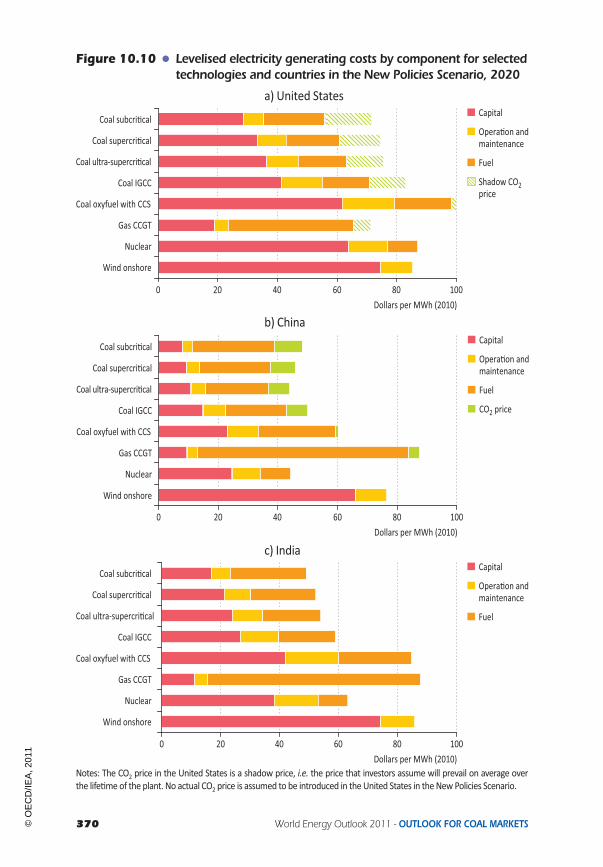
370 World Energy Outlook 2011 - OUTLOOK FOR COAL MARKETS
Figure 10.10 " Levelised electricity generating costs by component for selectedtechnologies and countries in the New Policies Scenario, 2020
a) United States
0 20 40 60 80 100
Wind onshore
Nuclear
Gas CCGT
Coal oxyfuel with CCS
Coal IGCC
Coal ultra-supercriecal
Coal supercriecal
Coal subcriecal
Dollars per MWh (2010)
Capital
Operaeon andmaintenance
Fuel
Shadow CO2price
b) China
0 20 40 60 80 100
Wind onshore
Nuclear
Gas CCGT
Coal oxyfuel with CCS
Coal IGCC
Coal ultra-supercriecal
Coal supercriecal
Coal subcriecal
Dollars per MWh (2010)
Capital
Operaeon andmaintenance
Fuel
CO2 price
c) India
0 20 40 60 80 100
Wind onshore
Nuclear
Gas CCGT
Coal oxyfuel with CCS
Coal IGCC
Coal ultra-supercriecal
Coal supercriecal
Coal subcriecal
Dollars per MWh (2010)
Capital
Operaeon andmaintenance
Fuel
Notes: The CO2 price in the United States is a shadow price, i.e. the price that investors assume will prevail on average overthe life!meof the plant. No actual CO2 price is assumed to be introduced in theUnited States in theNewPolicies Scenario.
© O
EC
D/IE
A, 2
011

Chapter 10 - Coal demand prospects 371
10
Fuel choice in industry
Coal has different uses in industry and can be substituted by other fuels with varying degreesof ease. About 40% of all the coal used in industry at present is for iron and steel production;non-metallic minerals production, such as cement and glass, account for one-quarter. Steelis produced through a dozen or so processing steps, which can take various configurations,depending on the product mix, available raw materials, energy supply and investmentcapital (IEA, 2010b). In principle, any fossil fuel source can be used instead of coal to makesteel, but in practice coking coal is normally the preferred source (Figure 10.11), as it is mosteasily and cheaply converted into the coke (almost pure carbon), which is needed to reduceiron ore (most often in a blast furnace) and then into steel (in a basic oxygen furnace).A wider range of coal types, including steam coal, can be used to process iron ore usingpulverised coal injection technology, which involves the injection of coal directly into theblast furnace to provide the carbon for iron fabrication, displacing some of the coke requiredfor the process.
Figure 10.11 " World iron and steel sector energy consumption by type inthe New Policies Scenario
0%
15%
30%
45%
60%
75%
90%
0
200
400
600
800
1 000
1 200
2000 2009 2015 2020 2025 2030 2035
Mtce Other
Gas
Electricity
Steam coal
Coking coal
Share of coal(right axis)
The choice of steelmaking technology depends, among other things, on the relative prices ofcoking and steam coal. Steel can be produced using less coal (or other sources of carbon) inan electric-arc furnace, in which the feedstock includes a large proportion of scrap steel, orbe replaced by natural gas in the direct reduced iron process. In the New Policies Scenario,coal remains the principal energy source for steelmakingworldwide, at over 70%, though theshares of electricity and, especially natural gas, increase over the projection period (partly asthe availability of scrap steel increases and alternative production processes are adopted).
In the cement industry, any source of energy can be used tomake clinker – lumps or nodulesproduced by sintering limestone and alumina-silicate at high temperatures – which is thenground up to make cement. But coal is generally the preferred fuel where it is cheaper andits use is less restricted by environmental regulations. Coal use for cement manufacturinghas been soaring in China and other emerging economies, driven by booming constructionof basic infrastructure. In the New Policies Scenario, while cement production continues to
© O
EC
D/IE
A, 2
011

372 World Energy Outlook 2011 - OUTLOOK FOR COAL MARKETS
grow over the projection period, use of coal for cement and other non-metallic mineralspeaks around 2015, at 270 Mtce, and then declines throughout the rest of the projectionperiod, partly as a result of substitution by natural gas. In industry as a whole, the share ofcoal in overall energy use drops from 28% in 2009 to 23% by 2035 in the same scenario, aslighter, more highly specialised industrial activities, where coal is less suitable for processenergy needs and more stringent environmental regulations tip the balance in favour ofother forms of energy. Electricity overtakes coal’s contribution to industrial energy demandby 2035.
Fuel choice in other uses
Coal is no longer widely used in buildings (services and residential sectors) for space andwater heating, forwhich the primary energy inputs inmost cases are natural gas, oil productsand electricity. Nonetheless, in some countries, notably China and India, a significant numberof poor households rely on the direct use of coal. In the New Policies Scenario, global coaluse in buildings is projected to level off within the next decade and then to decline, as risingincomes, infrastructure development and health concerns encourage switching to cleanerandmore practical fuels. By 2035, the share of coal in energy consumption in buildings dropsto 2%, from 4% in 2009.
Coal-to-liquids (CTL) plants have emerged as a new and potentially important marketfor coal. CTL, a process involving the production of liquid hydrocarbons from coal, has along history. First used industrially in Germany during the Second World War, it was thenextensively applied in South Africa. Since 1955, Sasol’s plants, with a combined capacity in2010 of 160 thousand barrels per day (kb/d), have produced more than 1.5 billion barrelsof synthetic liquid fuel. In these plants, the coal is gasified to create “syngas”, a mixture ofhydrogen and carbon monoxide. This is similar to the old “town gas” that was used beforenatural gas becamewidely available (the same process of gasification is used in IGCC powerplants, albeit in different types of gasifiers). In a second step, the syngas is turned into aliquid hydrocarbon, typically high quality diesel, using the Fischer-Tropsch (FT) technique,with an iron or cobalt catalyst. An alternative “direct” route involves reacting coal withhydrogen in the presence of suitable catalysts to produce liquid oil that can be used in astandard refinery to produce commercial hydrocarbon products. This is the technology usedby Shenhua Group from China in its 24 kb/d plant in InnerMongolia, which is being broughtup to full production at present.
Around 20 CTL projects have been announced in the past five years, the majority in theUnited States and China, with a few in Indonesia, India, Australia, Canada, and SouthAfrica. All of the announced projects are expected to incorporate CCS technology, but theuncertainty surrounding the regulatory framework for CCS is thought to be a key reason forthe slow pace of development of these projects. Apart from water scarcity, future coal andoil prices are another key factor for CTL projects: the higher the oil price relative to the coalprice, the better the economics of CTL production.
Because no large CTL plant has been built recently, there is a wide range of estimates forthe capital costs associated with CTL technology, from $80 000 to $120 000 per barrel perday of capacity. Syngas/FT plants offer significant economies of scale, falling within this
© O
EC
D/IE
A, 2
011

Chapter 10 - Coal demand prospects 373
10
range of capital costs only for capacities above 50 kb/d. The capital costs of plant usingthe methanol and direct routes are less dependent on size. The oil price required to makeCTL economic is in the range $60 to $100/barrel, depending on the location of the projects(China being in the lower part of the range) and the cost and quality of the feedstock. Theseprices include CCS, which typically adds only modestly to the cost and will probably be arequirement in most cases, as CO2 emissions from CTL plants without CCS are very high(IEA, 2010c). CTL is economic at the assumed oil price trajectories in all three scenarios.In the New Policies Scenario, coal demand for CTL production rises from 27 Mtce in 2009to 60 Mtce in 2020 and around 180 Mtce in 2035, with resultant oil production increasingfrom 0.2 mb/d to 0.4 mb/d and 1.2 mb/d, respectively (Figure 10.12). There is also growinginterest in using coal as a feedstock for the production of petrochemicals and methanol,which is increasingly used as a blend stock for gasoline in China and some other countries.
Figure 10.12 " Coal-to-liquids inputs by country in the New Policies Scenario
0
0.4
0.8
1.2
1.6
2.0
0
40
80
120
160
200
2009 2015 2020 2025 2030 2035
mb/d
Mtce Rest of world
Indonesia
India
Australia
United States
South Africa
China
World CTL output(right axis)
Energy and environmental policies
Government energy policies can have a decisive influence over coal use. Its use may bedeliberately encouraged for economic or social reasons (to provide a market for localproduction and support employment and regional development, or to keep down energycosts to households and businesses) or for energy security reasons (to reduce reliance onenergy imports). Policies may be designed to encourage switching away from coal to moreenvironmentally benign or lower carbon sources, for example, air quality regulations orcarbon penalties (taxes or cap-and-trade schemes). The structure of energy taxation canoften favour the use of coal, relative to the other two fossil fuels. However, othermeasures,such as subsidies for renewables, may skew the competitive playing field against coal andother fossil fuels.
Environmental attitudes are especially important for coal use, as burning coal gives riseto airborne emissions of various pollutants, CO2 and other greenhouse gases (thoughspecialised equipment can be installed to lower or eradicate such emissions). As the most
© O
EC
D/IE
A, 2
011

374 World Energy Outlook 2011 - OUTLOOK FOR COAL MARKETS
carbon-intensive fossil fuel, coal is the leading source of CO2emissions globally, accountingfor 43% of all fuel-combustion-related CO2 emissions in 2009. In the New Policies Scenario,global coal-related emissions climb by 20%, though their share of global emissions dropsto 41% (Table 10.5). All of the growth in coal-related CO2 emissions comes from non-OECDcountries; emissions in the OECD fall. By contrast, in the 450 Scenario, coal-related CO2emissions fall by 57% globally. According to differences in policies and regulations, coal-related emissions of local air pollutants show divergent trends. In the New Policies Scenario,global emissions of nitrogen oxides and particulate matter grow only marginally throughthe projection period, while emissions of sulphur dioxide (SO2) fall (see Chapter 2). Coal isthe leading source of SO2 emissions, but contributes much less than other fuels to NOx andparticulate emissions.
Table 10.5 " CO2 emissions from coal combustion by region and scenario(gigatonnes)
New PoliciesScenario
Current PoliciesScenario
450Scenario
1980 2009 2020 2035 2020 2035 2020 2035
OECD 3.6 4.0 4.0 2.8 4.3 4.1 3.7 0.6
Non-OECD 3.0 8.5 11.4 12.1 12.4 16.1 10.2 4.8
World 6.6 12.5 15.4 14.9 16.7 20.2 13.9 5.4
Share of coal in world CO2 36% 43% 45% 41% 46% 47% 44% 25%
The differences in emissions and the amount of coal consumed between each scenarioresult mainly from fuel-switching in power generation, and lower electricity use, whichreduces the need to burn coal in power stations (Figure 10.13). These two factors accountfor more than three-quarters of the fall in coal use in 2035 in the 450 Scenario vis-à-vis theNewPolicies Scenario. The other contributing factors are efficiency gains in the power sectorand in other end-use sectors as well as fuel-switching.
Figure 10.13 " Reduction in world primary coal demand by sectorand scenario
2 000
3 000
4 000
5 000
6 000
7 000
8 000
2000 2010 2020 2030 2035
Mtce
Current Policies Scenario
New Policies Scenario
450 Scenario
Other sectors
Industry
Efficiency gains
Electricity demand
Fuel-switching
Power generaeon:
© O
EC
D/IE
A, 2
011
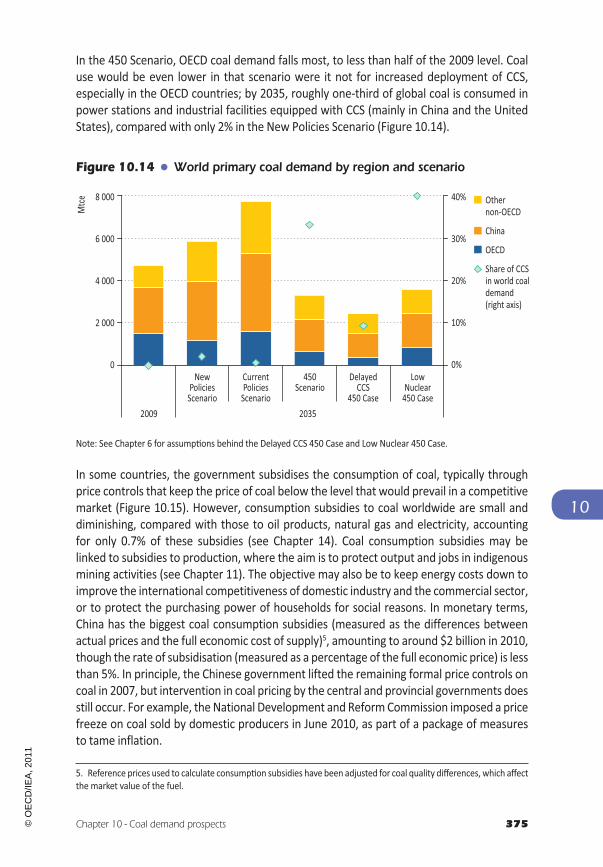
Chapter 10 - Coal demand prospects 375
10
In the 450 Scenario, OECD coal demand falls most, to less than half of the 2009 level. Coaluse would be even lower in that scenario were it not for increased deployment of CCS,especially in the OECD countries; by 2035, roughly one-third of global coal is consumed inpower stations and industrial facilities equipped with CCS (mainly in China and the UnitedStates), compared with only 2% in the New Policies Scenario (Figure 10.14).
Figure 10.14 " World primary coal demand by region and scenario
0%
10%
20%
30%
40%
0
2 000
4 000
6 000
8 000
2009
NewPoliciesScenario
CurrentPoliciesScenario
450Scenario
DelayedCCS
450 Case
LowNuclear450 Case
Mtce Other
non-OECD
China
OECD
Share of CCSin world coaldemand(right axis)
2035
Note: See Chapter 6 for assump!ons behind the Delayed CCS 450 Case and Low Nuclear 450 Case.
In some countries, the government subsidises the consumption of coal, typically throughprice controls that keep the price of coal below the level that would prevail in a competitivemarket (Figure 10.15). However, consumption subsidies to coal worldwide are small anddiminishing, compared with those to oil products, natural gas and electricity, accountingfor only 0.7% of these subsidies (see Chapter 14). Coal consumption subsidies may belinked to subsidies to production, where the aim is to protect output and jobs in indigenousmining activities (see Chapter 11). The objective may also be to keep energy costs down toimprove the international competitiveness of domestic industry and the commercial sector,or to protect the purchasing power of households for social reasons. In monetary terms,China has the biggest coal consumption subsidies (measured as the differences betweenactual prices and the full economic cost of supply)5, amounting to around $2 billion in 2010,though the rate of subsidisation (measured as a percentage of the full economic price) is lessthan 5%. In principle, the Chinese government lifted the remaining formal price controls oncoal in 2007, but intervention in coal pricing by the central and provincial governments doesstill occur. For example, the National Development and ReformCommission imposed a pricefreeze on coal sold by domestic producers in June 2010, as part of a package of measuresto tame inflation.
5. Reference prices used to calculate consump!on subsidies have been adjusted for coal quality differences, which affectthe market value of the fuel.
© O
EC
D/IE
A, 2
011

376 World Energy Outlook 2011 - OUTLOOK FOR COAL MARKETS
Figure 10.15 " Coal consumption subsidies for selected countries, 2010
0% 20% 40% 60% 80% 100%
0 0.5 1.0 1.5 2.0 2.5
Kazakhstan
Thailand
China
Billion dollars
Monetary value
Rate ofsubsidisaeon(top axis)
Notes: Measured using the price gap approach (see Chapter 14). The rate of subsidisa!on is the subsidy expressed as apercentage of the full economic price.
Technological innovation
Future choices of energy technology will be determined by a combination of economic andpolicy factors. Those choices, particularly in producing power, will have a major effect oncoal consumption worldwide. Technological innovation could lead to large changes in theoperational and economic characteristics of the different coal-fired technologies and incompeting technologies,with potentially important consequences for coal demand, especiallyin the longer term. Experience suggests that technological change is likely to accelerate,increasing theuncertainty involved in investment decisions. Theprospects for advances in coaltechnology, and their consequences, are discussed briefly by sector in this section.6
Coal-fired genera!ng technologies
Almost all coal-firedgeneration today is basedon thepulverised coal combustion (PCC)method,which in aboiler creates steamand thenuses the steam todrive a turbine toproduceelectricity.Most existing plants operate under subcritical steam conditions, with a maximum efficiencyof about 39%. However, an increasing share of new plants are capable of operating undersupercriticalorultra-supercritical conditions,withefficienciesofup to47%.Advances inmaterialshave paved the way for larger unit capacities, with single PCC units of 1 000 megawatts (MW)now in commercial operation. Further developments in materials are underway, involving theuse of nickel-based super alloys, which should permit the use of steam temperatures of 700°Candhigher in the next generation of coal plants, potentially boosting efficiencies to over 50%.
There is also potential for improving fluidised-bed combustion (FBC) technology, which iscurrently used in niche applications, notably where flexibility is required to adapt to varyingfuel quality: FBC can be designed to work well with low-quality coals, biomass and generalwaste. Since FBC plants operate at lower combustion temperatures than conventional
6. This sec!on draws on the findings of the 2010 edi!on of the IEA’s Energy Technology Perspec!ves (IEA, 2010b).
© O
EC
D/IE
A, 2
011

Chapter 10 - Coal demand prospects 377
10
PCC plants, they are said to reduce emissions of nitrogen oxides easily. They also offer thepotential for integrated in-bed sulphur reduction. Today, there are several hundred FBCplants in operation, most of which are small. Manufacturers hope to be able to scale updesigns to offer units within the range of 500MW to 800MW.
Integrated gas combined-cycle (IGCC) technology, which fell out of favour in the late 1990sbecause of problems with reliability and high costs, could make a come-back with designimprovements. IGCC plants have the potential to achieve levels of efficiency as high as thoseof PCC plants. Today, only four plants are still in commercial operation – two in Europe andtwo in the United States – with capacities of 250 MW to 300 MW each and efficienciesof 40% to 43%. Future designs may achieve efficiencies of over 50%, possibly with theaddition of a water-gas shift reactor, whereby additional hydrogen can be produced andcarbon monoxide converted to CO2 for capture and storage. Given the high efficiency andflexibility of an IGCC plant, significant effort is being devoted to the development of IGCCtechnologies, particularly in China, the United States, Japan and Europe.
Carbon capture and storage
Carbon capture and storage (CCS) technology, if widely deployed, could potentially reconcilethe continued widespread use of coal with the need to reduce CO2 emissions. While thetechnology exists to capture, transport and permanently store CO2 in geological formations,it has yet to be deployed on a large scale in the power and industrial sectors and so costsremain uncertain. The experience yet to be gained from the operation of large-scaledemonstration projects will be critical to the prospects for widespread deployment of CCS.The demonstration phase, which is only just beginning, is likely to last for over a decade. Atthe end of 2010, a total of 234 active or planned CCS projects had been identified across arange of technologies, project types and sectors, but only eight projects (of which five areconsidered full CCS projects, in that they demonstrate the capture, transport and permanentstorage of CO2 utilising sufficient measurement, monitoring and verification systems andprocesses to demonstrate permanent storage) are currently operating – most of them atdemonstration-scale (GCCSI, 2011). The likelihood is that therewill be, at best, nomore thana dozen large-scale demonstration plants in operation by 2020.
CCS raisesmany legal, regulatory and economic issues thatmust be resolved before it can bewidely deployed. Several initiatives have been taken by the IEA and other bodies, such as theGlobal CCS Institute and the Carbon Sequestration Leadership Forum, to develop the policyand regulatory framework to facilitate commercial deployment of CCS on a large scale, butmuch remains to be done.
The main challenges to successful full-scale demonstration and commercial deployment ofCCS include (IEA, 2009):
! High construction costs (assuming an average project cost for a CCS plant of $3 800 perkilowatt (kW), equates to around $2 billion for a 500 MW plant) and difficulties infinancing large-scale projects, particularly in the absence of any carbon penalty.
! Higher operating and maintenance costs and the reduced thermal efficiency of plantsfitted with CCS, relative to similar coal-fired power plants without CCS.
© O
EC
D/IE
A, 2
011

378 World Energy Outlook 2011 - OUTLOOK FOR COAL MARKETS
! The development and financing of adequate CO2 transport infrastructure.
! Public acceptance, appropriate geological conditions and the development of legal andregulatory frameworks to ensure safe and permanent CO2 storage.
At present, it is estimated that incorporating CCS into a power plant increases the levelisedcost of the electricity produced by between 39% and 64%, depending on the technology andfuel source (IEA, 2011).7 This results from the cost of installing capture equipment and theloss of thermal efficiency. For coal-fired power generation, the main capture technologiescurrently available show little difference as yet in performance and cost. The average netefficiency penalties for post- and oxy-combustion capture are ten percentage points, relativeto a PCC plant without capture, and eight percentage points for pre-combustion capture,compared with an IGCC plant (IEA, 2011). Overall construction costs (excluding interest)of power plants with carbon capture in OECD countries are estimated at $3 500/kW to$4 200/kW, which is 60% higher than the cost without capture, based on a PCC plant (costfigures vary substantially depending on the type of power plant and fuel used).8 This impliesan average cost per tonne of CO2 avoided of around $55. Depending on the application, theoverall costs of CCS can be higher in industry, where the scale is generally smaller. Whilethere are several cost estimates for CCS, there is an inherent uncertainty associated withestimating the cost of a technology that is yet to be implemented at scale.
CCS technology is deployed on a limited scale in the New Policies Scenario, with its share ofcoal-fired power generation rising from zero in 2009 to 3% in 2035 (1% of total generation).Most of the projected generation from power plants fitted with CCS equipment is in OECDcountries and China, driven by successful government initiatives to build demonstrationfacilities to prove the technology (Figure 10.16). By 2035, 65 gigawatts (GW) of CCS coalplants (roughly equivalent to 40 to 80 full-sized plants) are commissioned, as well as 9 GWof CCS natural gas-fired plants. The New Policies Scenario does not assume any operationalCCS in the industry sector during the Outlook period.
Stronger CO2 price signals than those in the NewPolicies Scenario and faster cost reductionswould be needed to stimulate wider adoption of CCS technology. In the 450 Scenario,these factors are assumed to drive much faster deployment of CCS towards the end of theprojection period, including in industry. By 2035, just over 400 GWof coal-fired CCS capacityis installed in the 450 Scenario, resulting in around 60% of all coal-fired power at that timecoming from plants fitted with CCS equipment, half of it in China. The feasibility of CCSdeployment at such scale and speed is put into question by regulatory, policy and technicalrisks. If adoption of CCS is delayed by ten years compared with the 450 Scenario, mitigationcosts increase by 11% and unprecedented pressure is put on other low-carbon technologies;supporting the economic case to invest now in proving the viability of CCS (see Chapter 6).
7. The unproven nature of CCS technology for power genera!on means that many of the data on opera!onalperformance and costs are based on feasibility studies and pilot projects.8. In China, where there is significant poten!al for CCS due to the large share of coal in power genera!on, the cost ofinstalla!ons is likely to be significantly lower.
© O
EC
D/IE
A, 2
011

Chapter 10 - Coal demand prospects 379
10
Figure 10.16 " Coal-fired generating capacity equipped with CCSby scenario, 2035
0%
15%
30%
45%
60%
75%
90%
0
100
200
300
400
500
600
Current PoliciesScenario
New PoliciesScenario
450Scenario
Delayed CCS450 Case
Low Nuclear450 Case
GW Rest of world
United States
China
Share of CCS in worldcoal-based electricitygeneraeon (right axis)
Note: See Chapter 6 for assump!ons behind the Delayed CCS 450 Case and Low Nuclear 450 Case.
Coal-based industrial and other technologies
There is considerable potential for industry to use coal more efficiently with technologies thatare already commercially available. For example, an estimated 22% of the energy used in ironand steel production (almost all of which is coal) could be saved this way, and 26% in cementproduction (IEA, 2010b). How quickly this potential is exploited depends on several factors,including the pace of capital stock turnover, relative energy costs, rawmaterials availability, therequired rates of return on investment and regulation. In the longer term, additional significantimprovements in the efficiency of coal use in industry and in reducing the emissions intensity ofcoal-based industrial processesarealsopossible. Theavailabilityof thenecessary technologywilldepend on successful research and development efforts.Widespread deployment of advancedtechnologies could have a significant impact on total coal demand, whether up or down:efficiencygainscould reducedemand,butbreakthroughs inCCS technologycouldboost coaluse.
In the iron and steel sector, there is still potential for innovation that could reduce coalrequirements – particularly in non-OECD countries, where modern techniques that keepfuel costs to a minimum are less widely deployed. New smelting and top-gas recyclingprocesses are under development. Demonstration plants are already in operation and othersare planned. Other technologies under development include iron production using moltenoxide electrolysis and hydrogen smelting. Advances in natural gas-based direct reductionof iron (DRI) production, which entails the complete replacement of coal, could make thetechnologymorewidespread. In other industrial sectors, there is varying scope for incrementaladvances, or even breakthroughs in existing technology to increase energy efficiency.
Other coal-based conversion technologies
CTL is a relativelymature technology, though incremental improvements in the efficiency andcost reductions for the different processes are possible, including the capture and disposal ofthe CO2 produced. Almost all of the new CTL projects that have been announced that involvethe indirect route incorporate CCS. Without it, CO2 emissions from CTL production are very
© O
EC
D/IE
A, 2
011
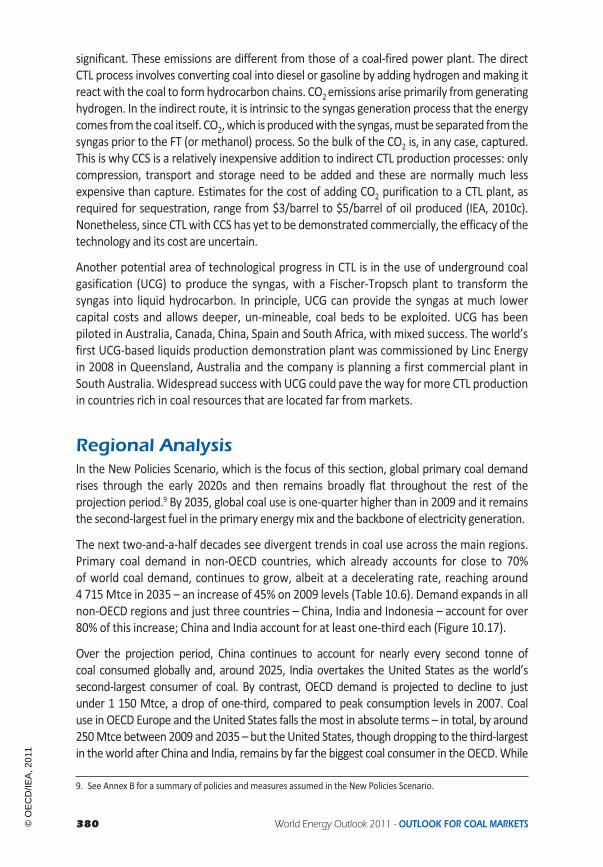
380 World Energy Outlook 2011 - OUTLOOK FOR COAL MARKETS
significant. These emissions are different from those of a coal-fired power plant. The directCTL process involves converting coal into diesel or gasoline by adding hydrogen andmaking itreactwith the coal to formhydrocarbon chains. CO2emissions arise primarily from generatinghydrogen. In the indirect route, it is intrinsic to the syngas generation process that the energycomes fromthe coal itself. CO2,which is producedwith the syngas,must be separated fromthesyngas prior to the FT (or methanol) process. So the bulk of the CO2 is, in any case, captured.This is why CCS is a relatively inexpensive addition to indirect CTL production processes: onlycompression, transport and storage need to be added and these are normally much lessexpensive than capture. Estimates for the cost of adding CO2 purification to a CTL plant, asrequired for sequestration, range from $3/barrel to $5/barrel of oil produced (IEA, 2010c).Nonetheless, since CTLwith CCS has yet to be demonstrated commercially, the efficacy of thetechnology and its cost are uncertain.
Another potential area of technological progress in CTL is in the use of underground coalgasification (UCG) to produce the syngas, with a Fischer-Tropsch plant to transform thesyngas into liquid hydrocarbon. In principle, UCG can provide the syngas at much lowercapital costs and allows deeper, un-mineable, coal beds to be exploited. UCG has beenpiloted in Australia, Canada, China, Spain and South Africa, with mixed success. The world’sfirst UCG-based liquids production demonstration plant was commissioned by Linc Energyin 2008 in Queensland, Australia and the company is planning a first commercial plant inSouth Australia.Widespread success with UCG could pave the way formore CTL productionin countries rich in coal resources that are located far frommarkets.
Regional AnalysisIn the New Policies Scenario, which is the focus of this section, global primary coal demandrises through the early 2020s and then remains broadly flat throughout the rest of theprojection period.9 By 2035, global coal use is one-quarter higher than in 2009 and it remainsthe second-largest fuel in the primary energymix and the backbone of electricity generation.
The next two-and-a-half decades see divergent trends in coal use across the main regions.Primary coal demand in non-OECD countries, which already accounts for close to 70%of world coal demand, continues to grow, albeit at a decelerating rate, reaching around4 715Mtce in 2035 – an increase of 45% on 2009 levels (Table 10.6). Demand expands in allnon-OECD regions and just three countries – China, India and Indonesia – account for over80% of this increase; China and India account for at least one-third each (Figure 10.17).
Over the projection period, China continues to account for nearly every second tonne ofcoal consumed globally and, around 2025, India overtakes the United States as the world’ssecond-largest consumer of coal. By contrast, OECD demand is projected to decline to justunder 1 150 Mtce, a drop of one-third, compared to peak consumption levels in 2007. Coaluse in OECD Europe and the United States falls themost in absolute terms – in total, by around250Mtce between 2009 and 2035 – but theUnited States, though dropping to the third-largestin theworld after China and India, remains by far the biggest coal consumer in the OECD.While
9. See Annex B for a summary of policies and measures assumed in the New Policies Scenario.
© O
EC
D/IE
A, 2
011
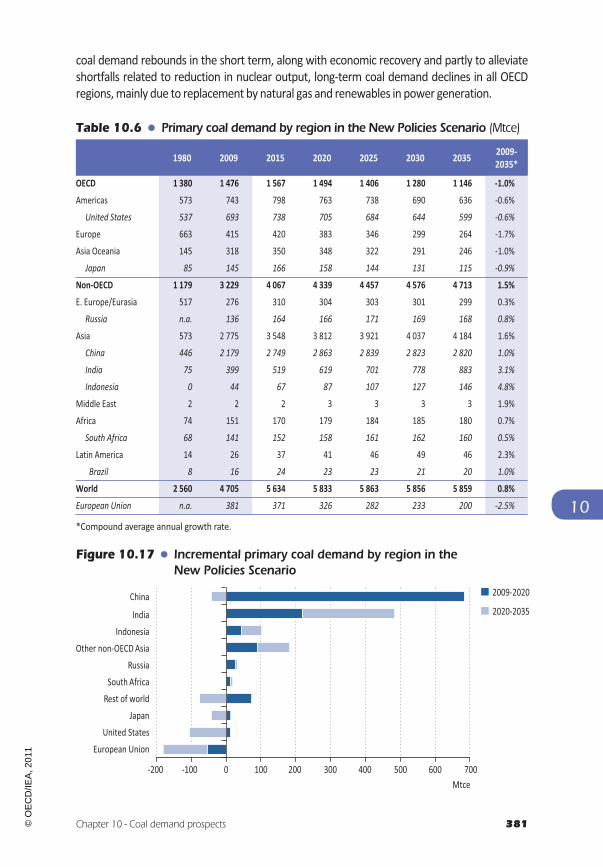
Chapter 10 - Coal demand prospects 381
10
coal demand rebounds in the short term, along with economic recovery and partly to alleviateshortfalls related to reduction in nuclear output, long-term coal demand declines in all OECDregions,mainly due to replacement by natural gas and renewables in power generation.
Table 10.6 " Primary coal demand by region in the New Policies Scenario (Mtce)
1980 2009 2015 2020 2025 2030 2035 2009-2035*
OECD 1 380 1 476 1 567 1 494 1 406 1 280 1 146 -1.0%Americas 573 743 798 763 738 690 636 -0.6%
United States 537 693 738 705 684 644 599 -0.6%Europe 663 415 420 383 346 299 264 -1.7%
Asia Oceania 145 318 350 348 322 291 246 -1.0%
Japan 85 145 166 158 144 131 115 -0.9%Non-OECD 1 179 3 229 4 067 4 339 4 457 4 576 4 713 1.5%E. Europe/Eurasia 517 276 310 304 303 301 299 0.3%
Russia n.a. 136 164 166 171 169 168 0.8%Asia 573 2 775 3 548 3 812 3 921 4 037 4 184 1.6%
China 446 2 179 2 749 2 863 2 839 2 823 2 820 1.0%India 75 399 519 619 701 778 883 3.1%Indonesia 0 44 67 87 107 127 146 4.8%
Middle East 2 2 2 3 3 3 3 1.9%
Africa 74 151 170 179 184 185 180 0.7%
South Africa 68 141 152 158 161 162 160 0.5%Latin America 14 26 37 41 46 49 46 2.3%
Brazil 8 16 24 23 23 21 20 1.0%World 2 560 4 705 5 634 5 833 5 863 5 856 5 859 0.8%European Union n.a. 381 371 326 282 233 200 -2.5%
*Compound average annual growth rate.
Figure 10.17 " Incremental primary coal demand by region in theNew Policies Scenario
-200 -100 0 100 200 300 400 500 600 700
European UnionUnited States
JapanRest of worldSouth Africa
RussiaOther non-OECD Asia
IndonesiaIndia
China
Mtce
2009-2020
2020-2035
© O
EC
D/IE
A, 2
011

382 World Energy Outlook 2011 - OUTLOOK FOR COAL MARKETS
ChinaChina will remain far and away the largest coal consumer in the world. Based onpreliminary estimates for 2010, China accounted for nearly half of global coal use. Coaldemand in China amounted to around 2 350 Mtce in 2010 – equal, in energy terms, totwice the oil consumption of the United States, the world’s biggest oil consumer. Chinesecoal consumption grew by 50% alone, between 2005 and 2010 to satisfy surging demandin power generation and heavy industry; in volume terms, this increase was equivalent tomore than total coal demand in the United States in 2010.
In the New Policies Scenario, China’s coal demand is projected to grow by about 30% from2009 to over 2 850 Mtce by 2020, and then decline slightly, before stabilising for the restof the projection period above 2 800 Mtce (Figure 10.18). The share of coal in China’s totalprimary energy demand declines to around 50% by 2035, from just over 65% in 2009. Thepower sector continues to drive demand and, towards the end of the projection period,accounts for two-thirds of China’s total coal demand. The increase in power-sector coaldemand between 2020 and 2035 is largely offset by a fall in demand in industry, where coaldemand peaks before 2020. The share of coal in both sectors declines through 2035 and,while coal still remains the principal source of energy for power generation, coal is overtakenby electricity use in industry. These projections are highly sensitive to the underlyingassumptions about economic growth and industrial output, which are the primary drivers ofelectricity demand and coal needs for both generation and industry. GDP growth is assumedto decelerate through the projection period as the economymatures (see Chapter 1).
Figure 10.18 " Coal demand in China by sector in the New Policies Scenario
0%
10%
20%
30%
40%
50%
60%
70%
80%
0
400
800
1 200
1 600
2 000
2 400
2 800
3 200
2000 2009 2015 2020 2025 2030 2035
Mtce Other
Buildings
Non-energy use
Other energy sector
Industry
Power generaeon
Power generaeonas share of total coaldemand (right axis)
As elsewhere, government policies will have a major influence on coal demand in China(and, therefore, globally) in the longer term. For energy diversification and environmentalreasons, China has been targeting a large expansion of nuclear power, natural gas andrenewables, as well as major improvements in the efficiency of energy use. The 12th Five-Year Plan for 2011 to 2015, which was adopted in March 2011, sets targets for reducing
© O
EC
D/IE
A, 2
011

Chapter 10 - Coal demand prospects 383
10
energy intensity and carbon intensity, which are in line with China’s Copenhagen pledge(Box 2.2). The share of non-fossil-fuel consumption in the primary energy mix is to beincreased from 8.3% in 2010 to 11.4% by 2015. Nuclear, renewables and natural gas areexpected to be aggressively promoted. Many of the policies reflected in the 12th Five-Year Plan are expected to be taken forward through more detailed targets. In some cases,this Outlook anticipates such targets, based on credible reports at the time of writing, inorder to provide further depth to the analysis. The energy targets outlined by officials showcoal consumption reaching around 3.8 billion tonnes in 2015. Coal demand could turn outto be higher if the targets aremissed or if the Chinese economy grows faster than assumedin the plan. On the other hand, more ambitious targetsmight be set in future plans, leadingto lower coal use over the Outlook period.
Power sector
The recent surge in demand for coal for power generation mainly results from soaringelectricity demand, growth of which has averaged around 12% per year since 2000.China’s electricity generation reached an estimated 4 220 terawatt-hours (TWh) in 2010,up by almost 15% since 2009 and more than 200% since 2000. It has continued to growstrongly, with output expected to reach above 4 500 TWh in 2011; when China will almostcertainly become the world’s biggest power producer, overtaking the United States.China’s expansion of generating capacity has been impressive, more than doubling fromaround 455 GW in 2005 to nearly 1 000 GW in 2010, with coal-fired plants contributingmore than 60% of the increase. Demand has grown so quickly that power shortages havebeen common and seem likely to continue in the near future, especially in hotter monthswhen demand peaks. Part of the reason for the shortages is that electricity prices remainunder tight governmental control as a means of limiting inflation. However, coal priceshave been largely deregulated and have increased significantly since 2007. This has led topower companies incurring losses, discouraging investment in new plants and worseningshortages.
Growth in electricity consumption has come principally from the industrial sector, whichcurrently accounts for over half of total electricity use. Industrial electricity demand grewvery quickly to 2007, slowed substantially in 2008 as export-destined manufacturingwas affected by the global economic crisis, and has since resumed its strong growth. Onaverage, it grew by around 13% per year between 2000 and 2010. Urbanisation and anationwide programme of electrification have boosted power use in the buildings sector by12% annually over the same period. Even so, annual per-capita use, at around 3 000 kWh,remains low compared with the OECD, at 8 200 kWh. Electricity demand in all sectors willcontinue to grow, though policy interventions could temper the pace of growth, particularlyin the industrial sector. In the New Policies Scenario, Chinese electricity demand in total isprojected to grow on average by 8% per year between 2009 and 2015, and then slow to anaverage of 3% per year over the remainder of the projection period as economic growthslows and electricity use becomes more efficient. By 2035, China’s total electricity demandis nearly equal to that of the OECD in 2009.
© O
EC
D/IE
A, 2
011

384 World Energy Outlook 2011 - OUTLOOK FOR COAL MARKETS
Coal is abundant, in absolute terms and relative to other fossil fuels, and low cost in mostregions of China, and will remain the backbone of the country’s power sector for some timeto come. However, mining costs have been rising; they now fall into an average range of$55/tonne to $70/tonne for steam coal at the mine mouth. If users and utilities are located farfromproducingareas, transport costs,whichmay includeboth rail andseaborne freight, canaddsubstantially to this cost. In mid-2011, competing imported steam coal was trading at around$120/tonnedelivered to coastal regions in China. Considering all of these factors, it appears thateven relativelyexpensivenatural gasat$10permillionBritish thermalunits (Mbtu) to$12/MBtumaybecompetitive in some locations in someapplications in thepower sector (Figure10.19).Atpresent, coal prices are lowenough for coal to be generally competitivewith natural gas inmostlocations. But higher coal prices and tighter environmental regulations could increasingly favournatural gas-fired capacity over coal. The share of natural gas in total generation increases fromamere 2% in 2009 to 8% in 2035 in the New Policies Scenario. The rate of penetration of naturalgas in the Chinese power sectormakes a sizeable difference to fuel needs: an additional 10 GWof coal-fired power replaced by natural gaswould save around 20Mtce, while requiring around10billion cubicmetres (bcm) of additional natural gas supply.
Figure 10.19 " Breakeven price of coal versus natural gas for powergeneration in China, 2020
30
40
50
60
70
80
90
20 40 60 80 100 120 140Mine-mouth coal produceon cost ($2010 per tonne)
Coal ultra-supercriecal:domesec mine at 2 000 km
Coal subcriecal:domesec mine at 500 km
Coal ultra-supercriecal:domesec mine at 500 km
Gas CCGT: generaeng cost
Gas price: $11 per MBtu
Gene
raen
gcost($2010p
erMWh)
Gas price: $6 per MBtu
Note: Coal plant costs include flue-gas desulphurisa!on and NOX emission control equipment.
Taking all factors into account, the size of coal’s share in overall power generation usein China is expected to decline substantially, as a result of diversification policies andsteady improvement in the thermal efficiency of the stock of coal-fired plants. In theNew Policies Scenario, around 330 GWof coal-fired generating capacity is added during thecurrent decade, accounting for 40% of total capacity additions in the period (Figure 10.20).Of this coal-fired capacity, 90 GW is already under construction, around 70% of whichis relatively high efficiency supercritical or ultra-supercritical plant; the remaining is lessefficient, subcritical plants. Over the whole projection period, coal plants account for onlyone-third of the total net increase in China’s generating capacity, as other technologies, suchas wind, hydro, natural gas and nuclear, gain prominence.
© O
EC
D/IE
A, 2
011

Chapter 10 - Coal demand prospects 385
10
Figure 10.20 " New additions of power-generating capacity in China by typein the New Policies Scenario
0 100 200 300 400 500 600
Coal
Wind
Hydro
Gas
Nuclear
Solar PV
Other
GW
2011-2020
2021-2035
In the longer term, the importance of coal in China is expected to decline even though it willundoubtedly remain the cornerstone of the electricity mix throughout the Outlook period(Figure 10.21). In the New Policies Scenario, the share of coal in electricity generation dropsfrom 79% in 2009 to 65% in 2020 and 56% in 2035. However, coal consumption in the powersector rises briskly, from1175Mtce in 2009 to around1700Mtce in 2020, and then growsmoregradually to 1 850Mtce in 2035. The main reasons for the slowdown in coal needs for power isslower electricity demand growth after 2020,more efficient coal-fired capacity additions and theincreased penetration of other fuels and technologies. Natural gas-fired generation increasesparticularly rapidly: by 2035, it is fourteen-times higher than in 2009, contributing 8% to totalelectricity generation. The shareof low-carbonpowergeneration inChina—nuclearpower, CCS-fittedcoal-andnaturalgas-firedplants,hydropowerandother renewables—expandsrapidlyandby 2035 these sources make up almost 40% of total generation, compared with around 20% in2009.Asa resultof this shift andefficiencygains, thecarbon intensityofChina’spowergenerationfalls significantly, fromaround800 grammesof CO2per kWh in2009 to500 gCO2/kWh in2035.
Figure 10.21 " Electricity generation in China by type in theNew Policies Scenario
0
2 000
4 000
6 000
8 000
10 000
12 000
2000 2009 2015 2020 2025 2030 2035
TWh Other
Solar PV
Biomass and waste
Wind
Gas
Nuclear
Hydro
Coal
United States electricitygeneraeon, 2009
OECD electricity generaeon, 2009
© O
EC
D/IE
A, 2
011

386 World Energy Outlook 2011 - OUTLOOK FOR COAL MARKETS
Industry and other sectors
The recent rapid expansion of coal use in China’s non-power sectors is set to reverseover the projection period (Figure 10.22). Coal demand in industry – the main non-powersector – grew at an annual rate of 9% between 2000 and 2009. The bulk of industrialcoal use is in the steel and cement sectors. In the New Policies Scenario, industrial coaldemand slows markedly from 2015 and then begins to fall steadily by around 2020, at anaverage rate just below 1.5% through 2035. This results from a combination of factors:progressively slower growth in industrial production (notably steel), increasing energyefficiency in industry and displacement of coal by electricity and natural gas. The share ofcoal in total industrial energy consumption drops from around 60% in 2009 to just below40% by 2035. Three-quarters of the growth in energy use in industry is met by electricity,which increases its share of final demand in the sector to 44% by 2035; the sectoralshare of natural gas rises from 2% to 9%. The projected change in the industrial energyfuel mix is driven by macroeconomic factors, notably a shift in the economy towardslighter industry, inter-fuel competition, stricter environmental regulation and alreadyannounced targets to decarbonise the economy. Natural gas increasingly displaces coalin the production of process heat. The restructuring of the economy towards lighterindustry, including high-technology products and services, favours the use of electricity.
Figure 10.22 " Non-power generation coal demand in China by sector in theNew Policies Scenario
0 50 100 150 200 250
Other
Paper
Buildings
CTL
Chemicals
Non-metallic minerals
Blast furnace and coke oven
Rest of industry
Iron and steel
Mtce
2000
2009
2035
Coal use in steel making, the single most important industrial sector, is set to dropsignificantly in the longer term. Annual crude steel production in China almost quintupledbetween 2000 and 2010, reaching around 630million tonnes. This is almost six times higherthan that of the second-largest producer, Japan. This led to an unprecedented increasein the sub-sector’s need for coal: coal-based energy use in steel making (including blastfurnace and coke oven activity) increased from around 115 Mtce in 2000 to 385 Mtce in2009, an average annual rate of growth of 14%. The share of coal in the steel industry’stotal energy consumption increased from 83% to 86% over the same period, mostly atthe expense of oil (the share of electricity also increased). Coking coal accounted for
© O
EC
D/IE
A, 2
011

Chapter 10 - Coal demand prospects 387
10
around 85% of the increase in coal use, which more than quadrupled between 2000 and2009 to nearly 300 Mtce. In the New Policies Scenario, total coal demand in iron and steelproduction is projected to increase by around 75 Mtce by 2015. Thereafter, the peakingof China’s crude steel production around 2020 and the introduction of more efficienttechniques lead to a decline in coal consumption, averaging 2% per year from 2015 untilthe end of the projection period. A similar pattern is expected in the cement and othernon-metallic minerals.
One new sub-sector that is expected to see significant growth in coal use is coal-to-liquids.China recently brought on stream its first commercial CTL facility – the 24 kb/d ShenhuaGroup plant in Inner Mongolia, which uses the direct CTL route. Several other projects,including the joint-venture project between ExxonMobil and Jincheng Anthracite MiningGroup that uses the former’s coal-based methanol-to-gasoline technology, are in thestart-up phase. Coal use for CTL is expected to reach around 5 Mtce in 2015 and 50 Mtcein 2035, as higher oil prices make new investments in this technology more profitable. Thissub-sector accounts for around 2% of China’s total primary coal demand by the end of theOutlook period.
The use of coal in the buildings sector in China,mostly for space andwater heating, still madeup 15% of total final energy demand in buildings in 2009. In the New Policies Scenario, thatshare declines to 5% by the end of the projection period, pushing coal consumption downto about 50 Mtce from 100 Mtce in 2009. Natural gas, and especially, electricity for waterheating and other appliances account for most of the increase energy demand in buildings.
India
India – currently the third-largest coal user worldwide behind China and the United States– is likely to see continued rapid expansion in coal demand in the absence of radical policychange. Coal demand increased by about 80% between 2000 and 2010, reaching 420Mtce,with growth accelerating to more than 7% per year on average since 2005, compared with5% in the first half of the decade. Booming demand is being driven by rapid economicgrowth, which is pushing up energy needs for power generation and in industry, wherecoal – mainly domestically sourced – is the main fuel. In the New Policies Scenario, Indiabecomes the world’s second-largest consumer of coal by around 2025, with demand morethan doubling to 880Mtce by 2035 (Figure 10.23). Consequently, India is poised to becomethe world’s biggest importer of coal soon after 2020, as rapid demand growth outstripsdomestic supply (see Chapter 11). The share of coal in India’s total primary energy demandincreases in parallel over the next decade, to nearly 46%, before decreasing to the level of42% from 2009 towards the end of the projection period.
More than 60% of the projected rise in Indian coal demand in the New Policies Scenariocomes from the power sector, to meet surging demand. There is enormous latentdemand for electricity: across the country, an estimated 300 million people still lackaccess to electricity; by 2030, this number is expected to fall to around 150 million in theNew Policies Scenario – a significant improvement, but still 10% of the population. Coal isexpected to remain the primary source of power generation, mainly because it is the most
© O
EC
D/IE
A, 2
011
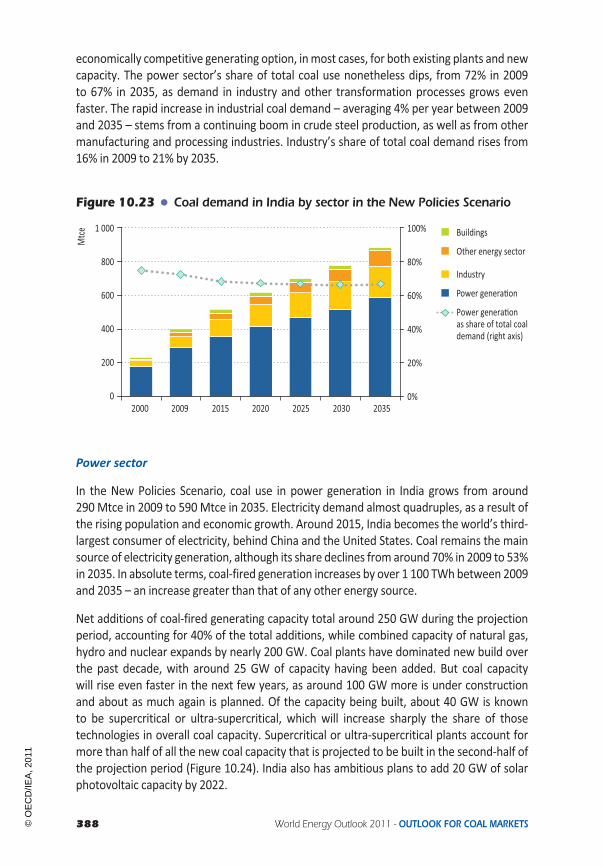
388 World Energy Outlook 2011 - OUTLOOK FOR COAL MARKETS
economically competitive generating option, inmost cases, for both existing plants and newcapacity. The power sector’s share of total coal use nonetheless dips, from 72% in 2009to 67% in 2035, as demand in industry and other transformation processes grows evenfaster. The rapid increase in industrial coal demand – averaging 4% per year between 2009and 2035 – stems from a continuing boom in crude steel production, as well as from othermanufacturing and processing industries. Industry’s share of total coal demand rises from16% in 2009 to 21% by 2035.
Figure 10.23 " Coal demand in India by sector in the New Policies Scenario
0%
20%
40%
60%
80%
100%
0
200
400
600
800
1 000
2000 2009 2015 2020 2025 2030 2035
Mtce Buildings
Other energy sector
Industry
Power generaeon
Power generaeonas share of total coaldemand (right axis)
Power sector
In the New Policies Scenario, coal use in power generation in India grows from around290Mtce in 2009 to 590Mtce in 2035. Electricity demand almost quadruples, as a result ofthe rising population and economic growth. Around 2015, India becomes the world’s third-largest consumer of electricity, behind China and the United States. Coal remains the mainsource of electricity generation, although its share declines from around 70% in 2009 to 53%in 2035. In absolute terms, coal-fired generation increases by over 1 100 TWhbetween 2009and 2035 – an increase greater than that of any other energy source.
Net additions of coal-fired generating capacity total around 250 GW during the projectionperiod, accounting for 40% of the total additions, while combined capacity of natural gas,hydro and nuclear expands by nearly 200 GW. Coal plants have dominated new build overthe past decade, with around 25 GW of capacity having been added. But coal capacitywill rise even faster in the next few years, as around 100 GW more is under constructionand about as much again is planned. Of the capacity being built, about 40 GW is knownto be supercritical or ultra-supercritical, which will increase sharply the share of thosetechnologies in overall coal capacity. Supercritical or ultra-supercritical plants account formore than half of all the new coal capacity that is projected to be built in the second-half ofthe projection period (Figure 10.24). India also has ambitious plans to add 20 GW of solarphotovoltaic capacity by 2022.
© O
EC
D/IE
A, 2
011

Chapter 10 - Coal demand prospects 389
10
Figure 10.24 " Coal-fired generating capacity in India by type in theNew Policies Scenario
0%
5%
10%
15%
20%
25%
30%
35%
40%
0
50
100
150
200
250
300
350
400
2009 2015 2020 2025 2030 2035
GW Advanced*
Supercriecal
Subcriecal
Average efficiencyof coal generaeon(right axis)
*Includes ultra-supercri!cal and IGCC.
Delivering power to its vast population has always been a challenge for India. Althoughoutput rose from around 290 TWh in 1990 to 900 TWh in 2009, this has not been enough toprovide electricity to the entire population. Despite governmental efforts, the grid has notbeen extended to all key rural areas andmany dwellings in urban areas of informal housingare still not connected to the grid. As a result, annual per-capita electricity consumptionis only around 620 kWh, compared with almost 3 000 kWh in China, where almost all thepopulation has access to electricity. Power shortages in India are endemic, largely due tounder-investment in generation and transmission. Technical and non-technical losses intransmission and distribution are extremely high by international standards. The recentinvolvement of the private sector in generation and distribution has improved the situationsomewhat, but there are still wide differences between different states.
Industry and other sectors
Total coal demand in the industrial sector in India is projected to increase almost three-fold,from 65 Mtce in 2009 to almost 190 Mtce in 2035 in the New Policies Scenario – the resultmainly of strong demand from steel making, cement and other heavy industries. Iron andsteel accounted for 70% of total industrial coal use in 2009 and the sector is expected toremain a primary user through the projection period. India is the fifth-largest steel producerin theworld, just behind Russia. In 2010, steel production reached around 70 million tonnes(Mt), an increase of 6% on 2009 and an average of 10% per year since 2000. The Indian ironand steel industry is unique because of the high share of production that relies on feedingdirect reduction of iron into electric furnaces – about 40%. This technique offers severaladvantages, including lower plant construction costs and the fact that it does not require theuse of high-quality coking coal (any kind of carbonaceous fuel can be used). This makes theprocess especially attractive for India, which has very limited reserves of high-quality cokingcoal. Nonetheless, Indian steel making is still comparatively energy inefficient. Around 40%more energy is used per tonne of crude steel production in India compared with the worldaverage, but new technologies and polices are being introduced to close the gap. Total coal
© O
EC
D/IE
A, 2
011

390 World Energy Outlook 2011 - OUTLOOK FOR COAL MARKETS
consumption in steel making, including the use of coal in blast furnaces and coke ovens,is projected to grow by 4% per year on average, from around 45 Mtce in 2009 to nearly140 Mtce in 2035. The other big industrial user of coal is the cement and other non-metallicminerals sector, production from which has been growing rapidly in recent years. India,with production of 220Mt in 2010, is now the second-largest cement producer in theworld,after China. There is limited scope for saving energy in Indian cement production, becauseof low clinker-cement ratios and the increasing use of dry-process kilns with pre-heaters. Asdomestic cement demand remains strong, this will lead to increasing energy demand, mostof which is expected to be met by coal, as it is the cheapest energy source. Coal use in thecement and non-metallic minerals sector is projected to double, to around 20Mtce in 2035.
The remaining industrial sub-sectors, as a group, see continuing growth in demand for coaltoo, their total consumption reaching nearly 30 Mtce by the end of the projection period.Coal use outside the power and industrial sectors, in buildings and agriculture, is relativelysmall and is projected to remain broadly flat. The CTL sub-sector is one exception: higher oilprices making investments in CTL worldwide more profitable, and in response to rising oilimports, India is projected to consume around 20Mtce of coal in CTL by 2035, resulting in aproduction of 125 kb/d of synthetic oil, 1.5% of India’s oil demand.
United States
Based on preliminary estimates for 2010, the United States was the world’s second-largestcoal-consumer, with consumption equal to 30% that of China. Coal accounts for aroundone-fifth of the country’s primary energy use – a larger share than for most other OECDcountries, primarily due to abundant indigenous resources of relatively low-cost coal (thecountry is a major producer and a net exporter of coal). In 2009, about 90% of coal demandin the United States was in the power sector. However, environmental concerns, includinglocal air quality and greenhouse-gas emissions, are expected to severely constrain this useof coal in the coming decades (Figure 10.25).
Figure 10.25 " Coal demand in the United States by sector in theNew Policies Scenario
0%
20%
40%
60%
80%
100%
0
200
400
600
800
1 000
2000 2009 2015 2020 2025 2030 2035
Mtce Industry
Other energy sector
Power generaeon
Power generaeonas share of total coaldemand (right axis)
© O
EC
D/IE
A, 2
011

Chapter 10 - Coal demand prospects 391
10
In the New Policies Scenario, coal demand rebounds from the level of 2009 in theshort-term, but never recovers to pre-recession levels, meaning that coal consumption intheworld’s second-largest consumer peaked in 2005 at a level of nearly 800Mtce. Between2015 and 2035 coal demand is projected to decline by 1% per year, reaching 600 Mtce by2035 – 25% lower than in 2005.
The projected long-term decline in coal demand in the United States is explained mainly bythe dwindling use of coal for power generation, even though new coal-fired power stationscurrently under construction will add about 8 GW of capacity (over end-2009 levels) bythe end of 2012 and additional stations are expected to be built before the end of thecurrent decade, some of them replacing older stations that will be mothballed or retired.In many states, coal is currently the cheapest option for new baseload capacity, but thecost advantage over natural gas is small. However, coal faces increasing public opposition,as well as mounting air pollution restrictions, and, in the longer term, competition fromrenewables-based generation and nuclear power, thanks to government support for thosealternatives, as well as from natural gas. The competitive position of coal is undermined, inpart, by the assumption in the New Policies Scenario that the power sector takes accountin its investment decisions of a shadow CO2 price of $15/tonne (in year-2010 dollars) as of2015 and that the price reaches a level of $35/tonne by 2035.10 Growth in natural gas-firedgeneration is supported by relatively low natural gas prices, compared with the rest of theworld (thanks to abundant resources of unconventional natural gas, especially from shale)and low capital and non-fuel operating costs. Between 2009 and 2035, total generatingcapacity increases for all fuels except coal without CCS, which falls by about 10%, and oil;wind power capacity increases the most in absolute terms. Increased natural gas, nuclearand renewables-based generation displaces coal generation and consequently lowers theaverage load factor for coal-fired plants, which results in the share of coal in total powergeneration in the United States dropping from 45% in 2009 to 35% in 2035 (Figure 10.26).Coal use would be even lower if it were not for cumulative additions over the projectionperiod of 20 GW of plants fitted with CCS.
Traditional use of coal in industry, notably for steam generation and coke production for ironand steel fabrication, also declines throughout the projection period, mainly as a result ofefficiency improvements that reduce the need for process steam and an expected declinein smelting and increased use of electric-arc furnaces in steel making, which reduces cokingcoal needs. In the New Policies Scenario, total industrial coal demand falls by 10% between2009 and 2035, reaching just under 30 Mtce. Lower demand for coal in power generationand in industry is partially offset by increased use of coal as a feedstock for liquids productionin CTL plants (in some cases, blended with biomass feedstock), especially towards the endof the projection period. Around ten CTL plants have been proposed, though none has yetbeen given the green light, mainly because of uncertainties about oil prices and penalties forCO2 emissions. Up from zero in 2009, coal inputs to CTL plants are projected to reach around25Mtce in 2035 and result in an output of 180 kb/d of oil products.
10. The CO2 price in the United States is a shadow price, i.e. the price that investors assume will prevail on averageover the life!me of the plant. No actual CO2 price is assumed to be introduced in the United States in the New PoliciesScenario.
© O
EC
D/IE
A, 2
011

392 World Energy Outlook 2011 - OUTLOOK FOR COAL MARKETS
Figure 10.26 " Electricity generation in the United States by type in theNew Policies Scenario
33%
2%
23%
19%
9%
6%
0.3%9%
2035
Coal without CCS
Coal with CCS
Gas
Nuclear
Wind
Hydro
Oil
Other renewables
45%
23%
20%
2%7%
1%
2%
20094 165 TWh 5 292 TWh
Other non-OECD Asia
In the New Policies Scenario, primary coal consumption in non-OECDAsia outside China andIndia more than doubles, from around 200 Mtce in 2009 to 480 Mtce 2035 – an averageannual rate of growth of 3.5%. Growing demand in the electricity and industrial sectorsdrives this increase in coal use.
Indonesia is the biggest single contributor to this demand growth – it is already the largestcoal consumer in non-OECD Asia after China, India and Chinese Taipei – with consumptionin 2009 of around 45 Mtce. Demand in the world’s fourth most populated nation isexpected to grow strongly in the coming decades, driven by rapid economic growth andunderpinned by a large resource base: Indonesia is already the world’s largest steamcoal-exporter, the second-largest hard-coal exporter and the fifth-largest coal producer. Thegovernment plans to give priority over export sales to meeting domestic coal needs. In theNew Policies Scenario, the country’s domestic demand triples to nearly 150 Mtce by 2035,a rate of growth of 5% per year. This exceeds substantially the rate of growth in demandof any major coal-consuming country or region, including India. By the end of the Outlookperiod, Indonesia moves from being the fourteenth-largest coal consumer globally to thesixth-largest, overtaking Japan. The power sector drivesmost of the growth in demand, withcoal-fired capacity more than quadrupling, to just over 50 GW by 2035.
Eastern Europe/Eurasia
Russia is the largest coal consumer in the Eastern Europe/Eurasia region, accounting foraround half of the region’s primary demand. Yet coal plays a relatively modest role inRussia’s energy mix, meeting only 15% of its total primary energy needs and fuelling aboutone-fifth of its electricity generation. Despite Russia’s ample indigenous resources, theshare of coal in total primary energy demand is expected to remain at around 2009 levels
© O
EC
D/IE
A, 2
011
Chapter 10 - Coal demand prospects 393
10
over the projection period, as the share of nuclear and renewables in the fuel mix increases.In the New Policies Scenario, after rebounding to pre-recession consumption levels by2015, demand remains fairly flat, at around 165 Mtce, throughout the projection period,as energy efficiency gains temper excessive electricity growth and other fuels mainly coverincreased electricity demand. In absolute terms, coal use for power generation remainsbroadly flat, and coal’s share in the generating mix decreases from 17% in 2009 to 16%in 2035 (Figure 10.27). However, there is scope for significantly higher coal use for powergeneration, if the programmeof building newnuclear reactors does not proceed as currentlyplanned (see Chapter 7).
Figure 10.27 " Electricity generation in Russia by type in theNew Policies Scenario
0
100
200
300
400
500
600
700
Gas Nuclear Coal Hydro Other renewables Oil
TWh 2009
2035
The Caspian region, mainly Kazakhstan, is another big coal consumer in Eastern Europe/Eurasia. Nearly two-thirds of the Caspian’s primary use of coal is in power generation. In theNew Policies Scenario, coal demand is expected to grow modestly overall, mainly becauseincremental energy needs are principally met by increased use of natural gas. The plannedconstruction of additional nuclear power, which is assumed to be commissioned towardsthe end of the projection period, also limits the scope for increased use of coal for powergeneration. A significant portion of increased electricity demand could also be met byreducing losses in transmission and distribution, which are very large (IEA, 2010c).
OECD Asia Oceania
Based on preliminary estimates for 2010, Japan – the world’s third-largest economy, thelargest coal importer and the fourth-largest coal user – accounted for almost half of coaldemand in the OECD Asia Oceania region. But this share drops in the New Policies Scenarioas a result of slow economic growth (in line with a declining population) and acorrespondingly modest rise in its electricity needs, as well as a major increase in powersupply from renewable sources and natural gas. Japan’s primary coal demand is projected todrop by 20%, from 145Mtce in 2009 to about 115Mtce in 2035, a level last witnessed in the
© O
EC
D/IE
A, 2
011

394 World Energy Outlook 2011 - OUTLOOK FOR COAL MARKETS
1990s. Demand declines in all sectors, including industry, but is most marked in the powersector (already today Japan has one of themost efficient coal-fired power generations fleetsin theworld, partly due to its import dependency). The overall fall in coal use, is nonetheless,much less marked thanwas projected in last year’sOutlook, mainly because of a downwardrevision to our projections for nuclear power as a result of events at the Fukushima Daiichinuclear power plant (see Chapter 12). As a result, less coal-fired capacity is expected to beretired and coal-fired plants achieve higher load factors, especially in the medium term,because of the loss of baseload nuclear capacity.
In the rest of the OECD Asia Oceania region – Korea, Australia and New Zealand – coaldemand is also projected to decline in the New Policies Scenario. Their combined primarydemand drops from around 175Mtce in 2009 to 130Mtce in 2035, a fall of 25%. As in Japan,falling demand in the power sector is the main reason for lower coal demand in Korea,Australia and New Zealand. Increased use of nuclear power, renewables and natural gasin power generation largely explains the projected 45% fall in coal demand in Korea, to52Mtce by 2035.
Abundant resources of cheap and high quality coal have made Australia the world’sninth-largest coal consumer, just behind Korea. Some 76%of power generation is coal-fired,using hard coal in New South Wales and Queensland and lignite in Victoria. Gas is moreimportant in other mainland states. In Queensland and New South Wales, coal productionfor domestic power tends to be driven by export-focused operations: the coal is often lowcost, but lower quality as well, with higher ash and moisture, although usually low sulphur.The domestic coal-fired plants that use this coal and Victorian lignite were built mostly inthe 1970s and 1980s, somuch of the capacity is subcritical; low coal prices have discouragedinvestment to increase efficiency. Only around 10% of capacity is supercritical, all of it builtin the last decade. As a result of this high coal dependence in the power sector (and lackof low-carbon options such as hydro and nuclear), Australia has relatively high per-capitaemissions of greenhouse gases. However domestic coal consumption is projected to declineslowly over the projection period, as natural gas and renewable sources (especially wind)increase their share. This change is underpinned by significant policy initiatives, respondingto growing public demand, including an expandedmandatory renewable energy target andcarbon pricing.
OECD Europe
Coal demand in Europehas beendeclining steadily in recent years, as a result of a combinationof factors: sluggish economic growth; the accompanying modest rise in electricity demand;an expansion of natural gas and renewables-based generating capacity; the phase-out ofsubsidies to indigenous coal production; the introduction of carbon pricing in the EuropeanUnion; and increasingly stringent local environmental regulations. These factors are setto continue to depress coal demand over the Outlook period, though the rate of declinewill depend on the strength of government energy and environmental policies. In theNew Policies Scenario, Europe’s primary coal demand plunges by over one-third, fromaround 415Mtce in 2009 to 265Mtce in 2035.Most of this decline results from reduced coal
© O
EC
D/IE
A, 2
011

Chapter 10 - Coal demand prospects 395
10
burning for power generation. Load factors at existing plants are set to fall, with increasedcompetition from other baseload and must-run plants, and few new coal plants are likelyto be built, given the strong preference for natural gas plants, the unfavourable economicsof coal (taking account of CO2 prices and support for renewables), the threat of heaviercarbon penalties in the future and more stringent environmental controls, and strong localopposition to coal. Industrial coal use also falls – the result of declining production in heavyindustry, switching to natural gas and electricity and increased energy efficiency.
Africa
South Africa, a large coal resource holder and producer, currently accounts for over 90%of Africa’s total coal consumption. It is expected to account for most of the growth in thecontinent’s coal demand in the coming decades. In the New Policies Scenario, total primarycoal demand in South Africa grows slowly to a peak of around 165 Mtce by 2025 and thenfalls back slightly. Coal use in the next few years will be boosted by the entry into service ofseveral new coal-fired power plants in South Africa, where rapidly rising electricity demandhas led to severe power shortages in parts of the country.
The use of coal for CTL production in South Africa is also set to rise in the longer term. Thecountry already has the two largest CTL plants in theworld, with a combined output capacityof 160 kb/d. These plants account for about one-fifth of the country’s total primary coalconsumption. More capacity is expected to be added, boosting coal use in this sector toaround 35Mtce in 2035 – an increase of 40% on current levels.
Rest of the world
Coal demand in the rest of the world is very small: Canada, Latin America, Mexico and theMiddle East together making up less than 2% of world demand in 2009. While Canada,Colombia and Venezuela are endowed with sizeable coal resources, the majority of theirfuture coal production is projected to be exported in the New Policies Scenario. Consideringalso that Canada, Latin America, Mexico and the Middle East already rely heavily onindigenous oil and natural gas resources, there is, accordingly, little projected coal demandgrowth in these regions as a whole in the New Policies Scenario. By 2035, these regions stillaccount for less than 2% of world coal demand.
© O
EC
D/IE
A, 2
011

© O
EC
D/IE
A, 2
011

Chapter 11 - Coal supply and investment prospects 397
CHAPTER 11
H I G H L I G H T S
COAL SUPPLY AND INVESTMENT PROSPECTS
The sweet and the sour of Asian trade
! Globally, coal is themost abundant fossil fuel, with reserves totalling 1 trillion tonnes,or some 150 years of production in 2009 – in energy terms, around 3.2 and 2.5 timeslarger than those of natural gas and oil, respectively. The coal resource base is muchlarger and geographically diverse, and as market conditions change and technologyadvances, more resources can become reserves.
! In the New Policies Scenario, the lion’s share of the nearly 20% growth in global coalproduction between 2009 and 2035 occurs in non-OECD countries. China contributesmore than half of the increase in global supply to 2035; the bulk of the rest comesfrom India and Indonesia. Australia is the only major OECD producer to increaseproduction to 2035; output in the United States falls around 2020, while Europeanoutput continues its historical decline.
! Rising prices of inputs to coal mining and the opening of more expensive mines since2005 have driven up supply costs on a weighted-average basis by around 12% per year.Yet, international coal prices have risenmuchmore, boosting operatingmargins and theprofitabilityof investments.Continueddepletionofeconomically attractive seamsand theneed to shift new investment to deposits that are less easy-to-mine and/ormore distantfrom existing infrastructure is expected to drive supply costs further upwards, especiallyif extraction rates keep rising rapidly. Increasingly stringent environmental, health andsafety legislation aswell as changing tax regimeswill also add to cost pressures.
! In the New Policies Scenario, inter-regional trade in hard coal grows rapidly to 2020,with volumes stabilising thereafter. By 2035, 18% of world coal production is tradedinter-regionally and the pattern of trade continues to shift towards the Pacific Basinmarkets. Australia and Indonesia command nearly 60% of inter-regional hard coaltrade in 2035, while new supplies fromMongolia andMozambique gain prominence.
! The international coal market will become increasingly sensitive to developments inChina, where marginal variations between very large volumes of coal production anddemand will determine China’s net trade position. Hard coal net imports would fallto zero by 2015 (compared with our projection of around 185Mtce) if China’s outputrises by just 1.2% per year higher than in the New Policies Scenario.
! India is poised to become the world’s biggest importer of hard coal soon after 2020,as rapid demand growth outstrips the rise in indigenous production and India’s inlandtransport capacity. Projected imports reach nearly 300 Mtce in 2035 – about 35% ofIndia’s hard coal use and 30% of inter-regional trade in the New Policies Scenario.
© O
EC
D/IE
A, 2
011

398 World Energy Outlook 2011 - OUTLOOK FOR COAL MARKETS
Overview of projectionsThe outlook for coal supply is intrinsically linked to the prospects for prices and sectoral coaldemand presented in Chapter 10; consequently, production by type varies markedly acrossthe three scenarios in this Outlook (Box 11.1). Compared to an average annual growth rateof 2.3% between 1980 and 2009, global production grows by 0.7% on average per year to2035 in the New Policies Scenario, but in the Current Policies Scenario it expands at morethan double the rate, 1.8%, while in the 450 Scenario it declines by 1.5%. Like demand, coalproduction continues to be dominated by China and other non-OECD countries, especiallyIndia and Indonesia, with their combined share of global production reaching around 80% inall three scenarios, compared to 72% in 2009 (Table 11.1).
Box 11.1 ! Classification and definition of coal types
Coal is an organic sedimentary rock formed from vegetablematter, particularly duringthe Carboniferous period, and consolidated in seams between strata of non-organicrock. The IEA classifies coal as hard coal and brown coal, and also includes peat.Hard coal: coalwith a gross calorific value greater than 5 700 kilocalorie per kilogramme(kcal/kg) (23.9 gigajoules per tonne [GJ/tonne]) on an ash-free but moist basis andwith a mean random reflectance of vitrinite of at least 0.6. It includes anthracite andbituminous coal. Hard coal is calculated as the sumof coking and steam coal:! Coking coal: Hard coal with a quality that allows the production of coke suitable
to support a blast furnace charge (see footnote for the termmetallurgical coal1).
! Steam coal: All other hard coal not classified as coking coal. Also included arerecovered slurries,middlings and other low-grade coal products. Coal of this qualityis sometimes referred to as thermal coal.
Brown coal: non-agglomerating coal with a gross calorific value less than 5 700 kcal/kg(23.9 GJ/tonne) containing more than 31% volatile matter on a dry mineral matterfree basis. Brown coal is the sum of sub-bituminous coal2 and lignite:! Sub-bituminous coal: Non-agglomerating coal with a gross calorific value between
4 165 kcal/kg and 5 700 kcal/kg.
! Lignite: defined as non-agglomerating coal with a gross calorific value less than4 165 kcal/kg.
Peat: a solid formed from the partial decomposition of dead vegetation underconditions of high humidity and limited air access. It is available in two forms for use asa fuel, sod peat andmilled peat. Milled peat is also made into briquettes for fuel use.
1. The terms coking and metallurgical for coal are, strictly, not synonymous. Metallurgical coal includes all types of coalused in the metals sectors. Although coking coal accounts for most of this, it also includes some high-quality steam coal.2. For the following countries, IEA includes sub-bituminous coal in steam coal: Australia, Belgium, Chile, Finland, France,Iceland, Japan, Korea, Mexico, New Zealand, Portugal and the United States.
© O
EC
D/IE
A, 2
011

Chapter 11 - Coal supply and investment prospects 399
11
Table 11.1 ! Coal* production by type and scenario (Mtce)3
New PoliciesScenario
Current PoliciesScenario
450Scenario
1980 2009 2020 2035 2020 2035 2020 2035
OECD 1 385 1 403 1 421 1 197 1 534 1 640 1 297 608Steam coal 847 971 934 805 1 013 1 163 902 351Coking coal 305 219 298 266 306 290 231 185Brown coal 233 213 190 126 216 187 164 71Non-OECD 1 195 3 525 4 412 4 662 4 774 6 102 4 012 2 701Steam coal 868 2 866 3 649 3 945 3 985 5 274 3 319 2 139Coking coal 196 505 556 483 570 537 547 444Brown coal 131 155 207 234 218 292 145 118World 2 579 4 928 5 833 5 859 6 308 7 742 5 309 3 309Share of steam coal 66% 78% 79% 81% 79% 83% 80% 75%Share of coking coal 19% 15% 15% 13% 14% 11% 15% 19%Share of brown coal 14% 7% 7% 6% 7% 6% 6% 6%*Includes hard coal (coking and steam coal), brown coal (sub-bituminous coal and lignite), and peat. See Box 11.1 forclassifications and definitions of coal types.
In the New Policies Scenario, production of steam coal grows faster than that of coking coal,so the share of steam coal in global production rises by three percentage points to 81% in2035. The share reaches 83% in the Current Policies Scenario, due to even stronger demandfrom the power sector, but in the 450 Scenario the share drops three percentage pointsbelow the 2009 level of 78% as coal-fired power generation declinesmuchmore than cokingcoal use in industry. The share of brown coal, mainly utilised in the power sector, declinesslightly from the 2009 level of 7% in all three scenarios.3
Regardless of the scenario, China – which produced 45% of global coal output in 2009 –remains the key producing country over the projection period, making the largestcontribution to the growth of global production in the Current and New Policies Scenarios,and to the decline in the 450 Scenario; 44%, 58%, and 40% respectively (Figure 11.1). Chinesecoal production increased from2008 to 2009 by almost 6%,more than offsetting the drop inproduction in the rest of the world as a whole due to the global economic crisis. In each ofthe three scenarios, the othermain producers include India, Indonesia and Australia, thoughthey are driven by different objectives. India increases production to slow down the paceof growing imports, Indonesian production expands to satisfy both growing domestic andinternational demand, while Australian output changes, for themost part, in line with shiftsin international demand across the three scenarios.
The share of global hard coal output which is traded betweenWEO regions has more thandoubled since 1980 to 17% in 2009, as growing domestic needs in various parts of theworld could not be sufficiently (or, at times, economically) satisfied by local output. Acrossthe three scenarios, the volume of coal traded inter-regionally varies markedly, reflectingthe role of trade, economics and prices in balancing local needs (Table 11.2). In the New
3. A tonneof coal equivalent is definedas7million kilocalories, so1 tonneof coal equivalent equals 0.7 tonnesofoil equivalent.
© O
EC
D/IE
A, 2
011

400 World Energy Outlook 2011 - OUTLOOK FOR COAL MARKETS
Policies Scenario, 18% of global hard coal production is inter-regionally traded in 2035 andin the Current Policies Scenario 22%, driven primarily by rising imports into non-OECD Asia.The global share declines to 15% in the 450 Scenario, as the need to import coal is reducedbecause indigenous resources are generally able tomeetmore of the lower level of demand.The opposite is true in the Current Policies Scenario and, by 2035, global trade in volumetricterms is more than three-times as big as in the 450 Scenario. As coking coal resourcesare less abundant than steam coal in key projected demand centres and there are feweralternatives for coking coal, the share of global coking coal output which is inter-regionallytraded increases in all three scenarios.
Figure 11.1 ! Incremental coal production by scenario and region, 2009-2035
-1 200 -800 -400 0 400 800 1 200 1 600
Rest of world
China
Rest of world
China
Rest of world
China
450S
cenario
NewPolicies
Scen
ario
Curre
ntPolicies
Scenario
Mtce
China
United States
Australia
South Africa
Russia
Indonesia
India
Other
Box 11.2 ! WEO-2011 coal-supply modelling enhancements
For this year’sOutlook, the coal supplymodule in the IEA’sWorld EnergyModel (WEM)has been improved to incorporate more detail at the level of coal type and country,and to provide formodelling for awider range of factors, including resource availability,production and transportation costs, international coal prices and infrastructurebottlenecks. In our projections, the international coal prices assumed (and presentedfor each scenario in Chapter 1) reflect our judgment as to the levels needed to bringforward the investment required to ensure sufficient supply tomeet projected demandand international trade. More details on the IEA’sWEM coal supply module, as well asthe assumptions andmethodologies used to project energy demand by fuel type in theIEA’sWEM, can be found at www.worldenergyoutlook.org/model.asp.
Trade patterns are expected to continue gravitating towards Asia and away from AtlanticBasin markets. Within Asia, China and India are set to increase their dominance of trade,as the importance of Japan and the European Union diminishes. The international coalmarket will remain very sensitive to developments in China, which became a net importer
© O
EC
D/IE
A, 2
011

Chapter 11 - Coal supply and investment prospects 401
11
in 2009 (Figure 11.2). Marginal changes in its very high levels of production and demandwill determine China’s future net trade position, with profound implications for globalinternational trade (see Spotlight in Chapter 2).
Table 11.2 ! World inter-regional* hard coal trade by type and scenario (Mtce)
New PoliciesScenario
Current PoliciesScenario
450Scenario
1980 2009 2020 2035 2020 2035 2020 2035
Hard coal 173 753 1 056 1 017 1 212 1 571 721 480
Steam coal 64 560 740 720 878 1 232 491 261
Coking coal 109 192 316 298 334 339 231 220
Share of world production
Hard coal trade 8% 17% 19% 18% 21% 22% 14% 15%
Steam coal trade 4% 15% 16% 15% 18% 19% 12% 10%
Coking coal trade 22% 27% 37% 40% 38% 41% 30% 35%
*Total net exports for allWEO regions, not including trade withinWEO regions.
Figure 11.2 ! China’s coal trade balance, 2000-2011
-30%
-20%
-10%
0%
10%
20%
-180
-120
-60
0
60
120
2000 2002 2004 2006 2008 2011*
Mtce Exports
Imports
Net trade as shareof world hard coaltrade (right axis)
Net trade as shareof domeshc demand(right axis)
*Preliminary estimates.
Understanding the drivers of coal supplyFuture trends in coal supplywill be determinedby a combinationof factors related essentiallyto resource endowment, the economics of production – the interaction between the cost ofsupply (mining and transportation) and international prices – and policy considerations. Notall coal resources can be produced profitably, due to high production costs, unfavourablegeology (poor quality, thin and deep deposits), infrastructure bottlenecks and long haulagedistances, or lack of affordable labour. Local opposition, safety and environmental hazards,as well as emissions penalties can also affect the economic viability of mining, for example,if fugitive methane emissions are included in emissions control schemes.
© O
EC
D/IE
A, 2
011

402 World Energy Outlook 2011 - OUTLOOK FOR COAL MARKETS
Globally, a vast amount of coal remains in the ground but, over the past century,easy-to-mine and high-quality coal deposits have often been extracted, driving investmentto less attractive deposits or locations further from existing transport infrastructureor demand centres. On the other hand, international coal prices continue to rise andtechnological improvements, such as longwall mining and coal-washing, have maintainedor boosted productivity so as to help keep unit costs down. The majority of coal producedtoday still serves to meet domestic demand, because of the high cost of transportationper unit of energy; only the highest quality coals, or those that can be mined very cheaply,are traded internationally on a large scale. This is likely to remain the case over the comingdecades, especially for steam coal.
Resources and reserves
At the end of 2009, world coal reserves – the part of resources estimated tobe economically exploitable with current technology (Box 11.3) – amounted to1 trillion tonnes, equivalent to 150 years of global coal output in 2009 (BGR, 2010). Interms of energy content, these reserves are approximately 3.2 and 2.5 times larger thanthose of natural gas and oil, respectively, and are more widely dispersed geographically.Total coal resources are many times greater. Globally, coal resources beneath land areestimated at around 21 trillion tonnes but, as market conditions change and technologyadvances, more coal will be “proven” over time. Around 90 countries are known to havecoal resources, but 95% of the global endowment is concentrated in the regions of NorthAmerica, Asia-Pacific and Eastern Europe/Eurasia (Table 11.3). Nearly 40% are locatedin the Asia-Pacific region alone, a region crucial for future coal demand, production andtrade prospects.
Table 11.3 ! Coal resources and reserves by region and type, end-2009(billion tonnes)
Hard coal Brown coal Total
Reserves Resources Reserves Resources Reserves Resources
North America 232 6 652 33 1 486 265 8 138
Asia-Pacific 309 6 861 76 1 075 385 7 936
E. Europe/Eurasia 124 2 891 108 1 324 232 4 215
Europe 17 467 55 282 72 748
Africa 30 78 0 0 30 79
Latin America 9 28 5 20 15 48
Middle East 1 40 - - 1 40
World 723 17 017 278 4 187 1 001 21 204
Notes:World excludes Antarctica. Classifications and definitions of hard and brown coal can differ between BGR and IEAdue to different methodologies.Source: BGR (2010).
© O
EC
D/IE
A, 2
011

Chapter 11 - Coal supply and investment prospects 403
11
Just under three-quarters, or nearly 725 billion tonnes, of global coal reserves are hardcoal, more than half of which is found in just two countries: 31% in the United States and25% in China. Hard coal production is much higher in China (it accounted for almost half ofthe world’s output in 2009, compared with a 16% share for the United States), so China’shard coal reserves-to-production ratio is lower – at 70 years, compared with 250 years forthe United States. Most of the rest of the world’s hard coal reserves are in India, Russia andAustralia (Figure 11.3). Global brown coal reserves total just under 280 billion tonnes andare distributed somewhat differently to those of hard coal, with four countries holding thebulk: Russia, Germany (the world’s biggest brown coal producer in 2009), Australia and theUnited States.
Box 11.3 ! Coal resources and reserves definitions
Conventions for classifying and defining fossil energy resources vary across fuels,countries and international bodies. In the interest of consistency (and because of thehigh reputation of the institution), the coal resource and reserve data presented inthis chapter come from the German Federal Institute for Geosciences and NaturalResources (BGR, 2010).Resources include hydrocarbons in the ground “which are either proved but areat present not economically recoverable, or which are not demonstrated, butcan be expected for geological reasons”. This concept of resources is equivalentto the term “hydrocarbons in place” used to describe the total amount of oil andnatural gas in the ground, not “ultimately recoverable resources”, the measure oflong-termoil and natural gas production potential used in theOutlook. For this reason,direct comparisons of the numbers given for coal and hydrocarbon resources can bemisleading.Reserves are the portion of resources that is known in detail and can be recoveredeconomically, using current technologies. Accordingly, the amount of reservesdepends on current international prices, as well as the state of technological progress.This concept of reserves for coal is equivalent to proven reserves of oil and natural gas(see Chapters 3 and 4).
Similar to oil and natural gas, coal resources and reserve data will evolve over time as moredetailed appraisals aremade, and present data therefore provide only a partial indication ofwhere coal production growth is likely to occur. This will be determined less by the absolutesize of the coal resource or reserve base and more by, the geological characteristics ofthe deposits (affecting the cost of mining and the quality of the coal produced), potentialenvironmental restrictions, the cost of transportation and relative economics. These varywidely from one region to another. Nonetheless, globally, it is clear that the overall size ofthe coal resource base will not be a constraint for many decades to come. The rising cost ofsupply, however, coupled with a likely tightening of environmental regulations and otherpolicies affecting coal demand, might be.
© O
EC
D/IE
A, 2
011

404 World Energy Outlook 2011 - OUTLOOK FOR COAL MARKETS
Figure 11.3 ! Coal reserves by country and type, end-2009
Billion tonnes
Hard coal
Brown coal
R/P raho(top axis)
United StatesChinaRussia
AustraliaIndia
GermanyUkraine
South AfricaKazakhstan
PolandIndonesia
Rest of world
Years0 50 100 150 200 250 300
0 50 100 150 200 250 300
Notes: R/P ratio stands for reserves-to-production ratio. Not shown in the figure, Ukraine and Russia have R/P ratios of625 and 525 years, respectively.Source: BGR (2010).
Cost trends and technologyCoal mining is a much less capital-intensive business than oil and natural gas extraction,with operational costs making up most of the overall cost. In this section, though we makereference to changing investment costs in the coal supply chain, we review coal cost trendslargely in terms of the free-on-board (FOB) cost per tonne.4 This is the cash cost to theproducer of their operations. Capital costs and profit are recovered through the marginbetween FOB cash costs and the FOB price.
Within the category of capital expenditure, transport infrastructure can be a significantpart of total investment in the coal supply chain, with construction lead times for long-hauldomestic transport infrastructure often longer than the timescale for themine itself. To takeone example, investment in Australia averages $30 to $40 per tonne of annual incrementalport capacity and a similar amount is required for inland transport (depending on haulagedistances), compared with an average of $90 or $150/tonne per year for investment in coalmining capacity (opencast and underground, respectively).
In FOB terms, cash costs for internationally traded steam coal have risen globally on aweighted-average basis by around 12% per year since 2005 – a cumulative increase ofaround 70%. Despite a small dip in 2009 in the wake of the economic crisis, all the mainsteam coal exporters have seen significant rises in their supply costs, due to changes in theinput factors contributing to operational costs (Figure 11.4). Nonetheless, supply costs have
4. Free-on-board is a shipping term whereby the seller pays for the transporta!on of the goods to the port of shipment,plus loading costs. The buyer pays the cost of marine freight transport, insurance, unloading and transporta!on from thearrival port to the final des!na!on.
© O
EC
D/IE
A, 2
011

Chapter 11 - Coal supply and investment prospects 405
11
generally risen much less than international coal prices, widening operational margins andboosting the profitability of investments – especially for coking coal, whose internationalprice has risen the most.
Figure 11.4 ! Change in average FOB supply cash costs relative to 2005 forinternationally traded steam coal by selected country andcomponent
-25%
0%
25%
50%
75%
100%
125%
150% Commodity pricesand foreign exchange
Mining costs, produchvity andother
Total cost
2007
2008
2009
2010
2007
2008
2009
2010
2007
2008
2009
2010
2007
2008
2009
2010
2007
2008
2009
2010
Indonesia Australia South Africa Colombia China
Sources: IEAanalysisbasedondata fromIEACleanCoalCentreandthe InstituteofEnergyEconomicsat theUniversityofCologne.
As in the past, future coal supply costs will depend to a large extent on trends in the costof materials, equipment, labour and fuel, as these are major input factors into mining andshipping operational costs (Meister, 2008). Also, foreign exchange rate effects can have amajor impact (outside the United States, a weaker dollar automatically increases the cost oflocal inputs expressed in dollars). Inmature production regions, the depletion of economicallyattractive seams and the need to shift investment towards less easy tomine coal deposits canbeexpected todriveupwardsoperatingmining costs (and capital costs), especially if extractionrates keep rising rapidly. Moreover, moving production to new coal deposits, even thosewith favourable geology and good coal quality (e.g. Mongolia, Mozambique), can increaseoverall supply costs (including capital recovery) because of the lack of existing infrastructure(or remoteness from it). In Australia, for example, the next batch of export mines to bebrought into production are in less developed or completely undeveloped basins, like Surator Galilee, where rail freight distances can be asmuch as 500 kilometres (km) (ABARES, 2011).Increasingly stringent environmental, health and safety legislation may also add to costpressures. Rising costs formarginal sources of supplywould underpin future international coalprices, within the limits of coal’s ability to compete with alternative fuels. Uncertainty aboutthe above factors and the risk that new government policies might curb the growth in coaldemand (with an especially marked impact on traded coal markets) could discourage miningcompanies from investing in newmining capacity and transport infrastructure.
MiningAs in recent editions of the Outlook, we present here the results of analysis of the recentlyprevailing FOB cash costs to key exporters of producing and transporting steam coal to
© O
EC
D/IE
A, 2
011

406 World Energy Outlook 2011 - OUTLOOK FOR COAL MARKETS
local ports for onward shipment (Figure 11.5). Cash costs include the variable costs ofproduction, such as labour, materials, inland transportation and port handling fees, butexclude the depreciation of capital assets and corporate overheads. The weighted-averageFOB cash cost of mining internationally traded steam coal in nominal terms reached anestimated $56/tonne in 2010, up from $43/tonne in 2009. This cost increase was driven byrising input prices at existing operations, but also higher operational costs at new mines.Yet international FOB steam coal prices rose evenmore, to around $90/tonne on average in2010, yielding healthy margins and providing a strong incentive for new investment.
Figure 11.5 ! Average FOB supply cash costs and prices for internationallytraded steam coal, 2010
Dollarspe
rton
ne Indonesia: low cost
Colombia
China
Indonesia: higher cost
South Africa
Venezuela
New South Wales
Queensland
United States
Russia0
20
40
60
80
100
120
0 100 200 300 400 500 600Million tonnes
640
Notes: Prices, costs and volumes are adjusted to 6 000 kcal/kg. Boxes represent FOB costs and bars show FOB prices.Sources: IEA Clean Coal Centre analysis partly based onMarston, IHS Global Insight andWoodMackenzie.
Costs vary markedly across countries but, as in 2009, Indonesia and Colombia had thelowest FOB cash costs of all the main steam coal exporters in 2010. Indonesia, the world’slargest steam coal exporter, is by a wide margin the cheapest producer of steam coal, withsome mines achieving FOB cash costs of $30/tonne or less. Higher cost mines in Indonesiaproduce on average at $50/tonne FOB, but they still remain at the front of the global steamcoal supply cost curve, alongside Colombia, China and South Africa. Due to the dependenceof Indonesian mining companies on diesel fuel in their opencast truck-and-shovel andinland barging operations, the removal of diesel subsidies in 2005, together with worseninggeological conditions and coal qualities, means that Indonesian mining costs have beenrising significantly. For example, some collieries have faced FOB cost increases of up to$15/tonne, shiftingmore of Indonesia’s production up the global supply curve.
Supply costs in South Africa, Australia (New South Wales and Queensland) and the UnitedStates have also increased significantly since 2009, mostly due to the rising costs of labour andcommodity inputs, such as explosives, chemicals, diesel fuel, electricity and tyres, as well asexchange rate fluctuations. Environmental levies and taxes have also driven up costs. SouthAfrican steam coal now costs on average $50/tonne FOB to produce, while costs in Australia
© O
EC
D/IE
A, 2
011

Chapter 11 - Coal supply and investment prospects 407
11
and the United States havemoved up to the $60 to $75 range. The United States, as the swingsupplier in the Atlantic Basin market, exports only when FOB prices exceed $75/tonne anddomestic coalpricesare lower (whichhas recentlybeen thecase,due tocompetition from lowernatural gas prices, spurred by the increase in unconventional natural gas output). Historically,export-mining operations in the United States were mainly located in the Appalachians, butgeological conditions, coal qualities and productivity have been deteriorating, due to thedepletion of favourable coal deposits. Increasing amounts of coal originating from the Illinoisand Powder River basins in theUnited States are now finding their way onto the exportmarket.Russian steam coal for export remains the most expensive, mainly due to the extremely longinland transport distances to the Baltic and Pacific ports (between 4 000 and 6 000 km).
In the coking coal market, global demand has been strong coming out of the economic crisis,due to rising steel production,mainly inAsia. Hard coking coal prices betweenAustralianminesand Japanese steel mills were well above $300/tonne FOB during the first half of 2011, dueto major floods in Queensland, which affected coking coal supplies in particular. For similarreasons to steam coal, despite rising supply costs, coking coal margins have increased sharplyto, on average, over $100/tonne in 2010 (Figure 11.6). In response, coking coal operations arebeing expanded in the key exporting countries, Australia, theUnited States and Canada, whilebrand newmines, notably inMongolia andMozambique, are being developed.
Figure 11.6 ! Average FOB supply cash costs and prices for internationallytraded coking coal, 2010
Dollarspe
rton
ne South Africa
Indonesia
China
Vietnam
Australia
New Zealand
Russia
United States
Canada
0
50
100
150
200
250
0 50 100 150 200Million tonnes
255
Note: Boxes represent FOB costs for all metallurgical coal qualities, while dashed and solid bars show lower and higherquality coking coal FOB prices, respectively.Sources: IEA Clean Coal Centre, citing data fromWoodMackenzie; IEA analysis.
The relative importance of each input factor in total supply cash costs varies greatly betweenindividualmines and countries, due to geological conditions andmining techniques (Box 11.4). Themining method is particularly important. In general terms, underground mining uses less dieselper tonne of coal mined, so countries with a large share of output from undergroundmines, suchas South Africa, the United States and Russia, have seen smaller increases in fuel costs, as theirproduction has been less exposed to rising international oil prices (Rademacher, 2011).
© O
EC
D/IE
A, 2
011

408 World Energy Outlook 2011 - OUTLOOK FOR COAL MARKETS
Box 11.4 ! Coal mining techniques
Depending on the geological conditions of a deposit, coal can be eithermined throughunderground or opencast methods.Opencast mining is economically feasible only if coal seams are close to the surfaceand fulfil certain other requirements. This method can recover 90% or more of thecoal in-situ and can be very low-cost, as labour costs are low due to use of large-scale mining equipment. Typically, the overburden (rock and soil between thesurface and the coal seam) is fractured by explosives and then removed. Once thecoal seam is exposed, it can be drilled, fractured and then mined in three differentways:! Truck and shovel: large capacity electric-powered mining shovel and diesel-
powered hydraulic excavator are used to strip waste material and recover thecoal. A truck or conveyor belt then transports the coal to a preparation plant ordirectly to the final point of use, typically a power station. This method is used inalmost all major coal-producing countries and it can be used in most opencastmines regardless of geological characteristics; but it requires large amounts ofdiesel fuel.
! Dragline: is more capital-intensive than truck and shovel and essentially involvesdragging a large bucket, suspended from a boom via wire ropes, over theoverburden or seam surface. A dragline usually operates on electricity and canmove at times more than 400 tonnes of material in one cycle.
! Bucket wheel-excavator: is among the largest machinery in the world and someare capable of moving up to 240 000 tonnes of coal or waste rock per day. Themachine has a large, rotating wheel with a configuration of scoops that is fixedto a boom and is capable of pivoting. This continuous mining method is mainlyemployed in brown coal production in Germany, Russia and Australia, and thecoal is immediately transported, via conveyor belts, to a stacker or power plant.
Undergroundmining, which accounts for about 60%ofworld coal production, is usedwhere coal seams are too deep to be mined economically using opencast methods.There are two principal undergroundmining methods:! Room and pillar: involves cutting a network of chambers in the seam, while up to
40% to 50% of the seam remains as pillars to support the mine roof. This methodcan be started up quickly and is less capital-intensive than longwall mining. On theother hand, it requires more roof support materials and related equipment.
! Longwall: employs amechanical shearer that is able tomine coal from a seam faceup to 300 metres long. Self-advancing, hydraulically-powered shields temporarilyhold up the roof while coal is extracted, and later the roof is allowed to collapse.Over 75% of the coal in the deposit can be extracted with this method, but capitalexpenditure is high.
Source: IEA based onWorld Coal Association (2005).
© O
EC
D/IE
A, 2
011

Chapter 11 - Coal supply and investment prospects 409
11
Underground mining methods (longwall, room and pillar) are comparatively more labour-intensive than opencast methods (dragline, truck and shovel), where larger miningequipment can be utilised (Figure 11.7). Underground mining also depends more on steel,machinery and electricity. Unsurprisingly, explosives, tyres and diesel costs are significantin truck and shovel operations, while draglines are less diesel intensive, but electricity is amore important cost factor (Trüby and Paulus, 2011). Globally, prices for diesel, explosives,tyres, steel andmachinery parts have increased dramatically since 2005. Consequently cashcosts for opencastmining operations have increased sharply, due to their very high exposureto these input factors, notably in Indonesia, where mining is exclusively carried out usingthe truck and shovel method. The production of explosives and chemicals requires oil andnatural gas as feedstock, so the future prices of these commodities will have an indirect, aswell as direct impact on coal mining costs.
Figure 11.7 ! Share of key input factors in coal mining costs by technique,2009
0%
10%
20%
30%
40%
50% Room and pillar
Longwall
Dragline
Truck and shovel
Diesel/lubricants
Explosives TyresSteelproducts/machinery
parts
Electricity ChemicalsLabour Othermaterials
andservices
Source: IEA analysis based on data from the Institute of Energy Economics at the University of Cologne.
Coal mining productivity, measured as average production per employee per hour, hasdeclined substantially over the past five years in major producing countries, such asAustralia and the United States (Figure 11.8). While various factors (such as changes ininternational coal prices or the size of the workforce) contribute to changes in productivity,significant productivity deterioration can occur as existing coal deposits are exhausted,seams become thinner andmining operations move deeper. As more overburden has to beremoved or trucks have to move coal over longer distances from the mine mouth, the costof mining increases. For example, productivity in opencast mines in the major Australianmining state of Queensland fell, on average, by around 6% per year from 2003 to 2009,as existing deposits became depleted; nonetheless, Australian mines are still among themost productive in the world. During the same time period, productivity, on average, fellby around 4% per year in the United States, with notable falls in Appalachian undergroundmines – a region that has seen extensive coal mining since the 19th century.
© O
EC
D/IE
A, 2
011

410 World Energy Outlook 2011 - OUTLOOK FOR COAL MARKETS
Figure 11.8 ! Coal mining productivity in Australia and the United States,2004-2009
60
70
80
90
100
110
120
2004 2005 2006 2007 2008 2009
Index
(2003=
100)
OpencastUnderground
OpencastUnderground
OpencastUnderground
OpencastUnderground
Queensland:
New South Wales:
East of Mississipi:
West of Mississipi:
Note: Productivity measured as average production in tonnes per employee per hour.Sources: US DOE/EIA (2011); NSW Department of Primary Industries (2011); Queensland Department of Mines andEnergy (2011).
Nevertheless, there is still scope for productivity gains in some key countries. For example,the Chinese mining industry is currently undergoing consolidation, with the closure ofsmall, inefficient and dangerous provincial or community mines and the development ofseveral large-scale coal-power bases, which involve building coal-fired power plants next tomining operations with higher productivity and safety standards (Rui, Morse and He, 2011).Furthermore, technological improvementsmay help to offset increasingmining costs. Theseinclude the introduction of larger and more efficient machinery (e.g. larger haul trucks,larger capacity shovels and draglines), and innovativematerials-handling systems (e.g. in-pitcrushing and conveying systems).
TransportOperational transport costs can make up a sizeable part of the total cost of supplying coal.This includes inland transport and, in the case of internationally traded coal, coal terminalfees and sea haulage rates for bulk carriers. In certain cases, there may be significantadditional costs associated with delivering the coal to final users once the coal is off-loadedat its port of destination.
The importance of inland transportation depends on the distance to the final user orexport terminal. Typically, coal is moved by railway, truck or river barge, though conveyorbelts are sometimes used if the mine is located close to the port. Due to the availabilityof river transport and/or the requirement to move coal over only short distances, coalis cheap to transport in Indonesia and Colombia, around $4 to $8/tonne. Australia andSouth Africa have inland transport costs of $8 to $15/tonne, as distances are longer, socoal has to be moved by railway. In Russia, known for its long railway haulage distancesfor domestic coal output, inland transport costs have almost doubled in the course of thelast five years, to around $35/tonne. Inland transport costs are expected to rise in manycountries, as mining operations move further inland, due to the depletion of deposits
© O
EC
D/IE
A, 2
011

Chapter 11 - Coal supply and investment prospects 411
11
near the coast. Furthermore, bottlenecks in railway infrastructure have become a majorissue in recent years, not least in South Africa and Russia. For example, the railway linelinking the Russian Kuzbass mining region with the Pacific terminals is operating at nearfull capacity (VDKI, 2010). In similar cases, expanding exports or domestic deliveries willrequire substantial new investment in transportation infrastructure. Coal turnover atexport terminals comprises the second main link in the coal transport chain. While actualhandling costs are relatively low, $2 to $5/tonne, limitations to port throughput capacitiescan become critical bottlenecks.
In recent years, utilisation of port infrastructure in several of the major exporting countrieshas been high and in 2010 it increased in most cases (Figure 11.9). Australian ports haverecently been operating at close to capacity, with the queue to load coal averaging morethan 100 bulk carriers in 2010 (effective capacity in Australia was temporarily reduced bycapacity expansion works and weather-related incidents). By contrast, export terminals incountries like Poland and the United States, that used to be major exporters but now haveless competitive supply costs, still have plenty of spare port capacity. Apart from supplyeconomics, another reason for the lowutilisation of ports in theUnited States is the difficultyof effective co-ordination between rail operators and the port authorities responsible forloading schedules, due to limited coal storage space, especially in eastern portswhich exporthigh volumes of coking coal, each type of which needs to be stored individually.
Figure 11.9 ! Coal export port utilisation rates for selected countries
0% 20% 40% 60% 80% 100%
Vietnam
Poland
United States
Russia: west
Russia: east
South Africa
Australia
Canada
Colombia
Indonesia
2009
2010
Note: South Africa includes export capacity from the port of Maputo, in Mozambique.Sources: IEA analysis; McCloskey (2007-2011); DnB NOR (2011); ABARES (2011).
Port utilisation rates remain high in Indonesia and Australia, despite major port expansionsin recent years (Schiffer, 2011). Australia increased port capacity to a level of about380million tonnes (Mt) per year in 2011 and 80Mt/year of capacity is expected to be addedover the next five years (ABARES, 2011). With other countries also planning to expandcoal export capacities, a total global expansion of around 240 Mt/year, or nearly 20%, isenvisaged by 2016 (Table 11.4). Port bottlenecks should ease if these capacities come online
© O
EC
D/IE
A, 2
011

412 World Energy Outlook 2011 - OUTLOOK FOR COAL MARKETS
as scheduled, though lack of railway capacity can limit their use. For example, in South Africaport capacitywas expanded significantly in 2009 and again in 2011 to 108Mt/year; however,lack of railway capacity has kept effective export capacity to less than 70Mt.
Table 11.4 ! Coal export port capacities for selected countries (Mt/year)
2009 2010 2011 2009 to2011 2013 2016 2011 to
2016
Australia 350 365 379 8% 448 459 21%
Indonesia 304 304 315 4% 337 366 16%
United States 121 121 129 6% 155 193 50%
South Africa 75 97 108 45% 108 108 -
Colombia 76 76 77 1% 88 104 35%
Russia: west 85 85 89 5% 89 89 -
Russia: east 45 46 47 4% 55 55 16%
Canada 35 39 41 17% 41 41 -
Vietnam 34 34 34 - 34 34 -
Poland 20 20 20 - 20 20 -
Mozambique 3 5 6 100% 6 16 167%
Venezuela 11 11 11 - 11 11 -
Total 1 158 1 203 1 256 8% 1 391 1 495 19%
Note: South Africa includes export capacity from the port of Maputo, in Mozambique.Sources: IEA analysis; McCloskey (2007-2011); DnB NOR (2011); ABARES (2011).
On average, transport costs make up a much bigger share of the cost of supplyinginternationally traded coal than is the case for oil. Dry bulk carriers are used to ship hard coalover long distances and, occasionally, maritime shipping can be the biggest cost componentin the coal-supply chain. Shipping costs, which can be very volatile, have fallen recently asa result of new vessels becoming available, yet they still account for a significant share ofthe total cost of supply to somemarkets, for example to northwest Europe (Figure 11.10).
In 2008, bulk freight rates hit all-time highs, reaching up to $40/tonne and accountingfor up to 45% of total coal delivered costs on certain routes. This spike in freight ratesled to increased investment in new shipping capacity but, due to the lead times inshipping construction, the new vessels have been coming online since 2009 and 2010,just when freight demand stabilised. The result has been a collapse in freight rates.For example, freight rates for the Australia to northwest Europe route have averaged$18/tonne over the last two years, compared with around $40/tonne in 2007 and 2008(McCloskey, 2007-2011). It is likely that there will continue to be ample spare shipping
© O
EC
D/IE
A, 2
011

Chapter 11 - Coal supply and investment prospects 413
11
capacity in the next two to four years, keeping freight rates low (Figure 11.11). Ship orderbooks are still at very high levels, with almost 2 000 new Panamax and Capesize bulk carriersdue to be commissioned over the period to 2015.
Figure 11.10 ! Steam coal supply cash costs to northwest Europe bycomponent for selected exporters, 2007 and 2009
0%
20%
40%
60%
80%
100%
2007 2009 2007 2009 2007 2009 2007 2009 2007 2009 2007 2009
Shipping
Taxes and royalhes
Port and loading
Inland transport
Coal processing
Mining
South Africa Colombia IndonesiaOpencast Underground Opencast Underground
New South Wales
Sources: IEA Clean Coal Centre analysis citing data fromMarston; McCloskey (2007-2011); IEA analysis.
Figure 11.11 ! Dry bulk carrier market evolution, 2011-2015
-40
-20
0
20
40
60
2011 2012 2013 2014 2015
Million
deadwe
ightton
nes New tonnage required
Accumulated surplus/shortage in capacity
Sources: Barry Rogliano Salles (2011), DnB NOR (2010); IEA analysis.
Government policies
Governments intervene in energy markets in many different ways, with direct or knock-oneffects on both coal demand and supply. Energy and environmental policies, including thoseaimed at mitigating climate change, mainly affect supply through changes in demand, but
© O
EC
D/IE
A, 2
011

414 World Energy Outlook 2011 - OUTLOOK FOR COAL MARKETS
somemeasures directly affect supply, either positively (e.g. via subsidies to local production)or negatively (e.g. restrictions on mining for local environmental reasons). Supply-sidegovernment coal policies can be important in determining the costs and volumes of coalproduced and, therefore, market prices.
Generally, exploration or exploitation ofmineral resources requires a permit. The procedureto gain the permit, together with the requirements on the exploration or exploitation of thedeposit, including royalties, can be critical in fostering or hampering mining activity. Whiletechnology exists tominimise their environmental impact, noise, dust, water use, liquid andsolid wastes, and significant temporary (and, to a lesser extent, permanent) modificationsto the landscape may all inhibit mining operations. Local opposition and the stringency ofregulatory requirements relating to these externalities have a substantial impact on financialrisk, cost and, ultimately, investment in mining.
In a growing number of countries, including China, waste management from mining,particularly reducing the risk of groundwater contamination, and requiring site-rehabilitation,has improved enormously in recent decades and is expected to improve in the future. Butsuch essential improvements unquestionably increase costs. The extent and nature of theenvironmental impact and the rigour of mineral resource permitting are closely linked inpractice. Mining is sometimes prohibited in areas that are protected for environmentalreasons. Access to land is also affected by the nature of the ownership ofmineral resources:when a coal resource is owned by a private landowner, the incentive to lease the land (formineral exploitation) may be stronger, as the owner benefits directly.
Government policies on energy taxation generally also affect coal production. For example, acarbon cap-and-trade schemenot only pushes up the effective price of coal to end-users, butcan also have a significant impact on production costs and supply, as diesel and electricity(the prices of which are affected by the carbon price) are important cost components in coalmining and transportation. The inclusion of fugitive emissions ofmethane from coalmines inany carbon cap-and-trade schemewould have a highly significant impact on coal-productioncosts. In general, mining regulation is expected to become progressively more stringent.
Some countries continue to support coal mining directly (Table 11.5). Usually this isfor reasons of local employment and regional development. Coal production is often alabour-intensive industry (especially in developing countries), both through directemployment in the mines and in auxiliary industries located nearby, such as transport,equipment repair and material and equipment supply. In some regions, coal productionis overwhelmingly the main economic activity, lending the authorities to intervene tosupport mining activities when costs are rising or market prices are falling. Energy securityis also sometimes cited as a rationale for subsidising indigenous coal production in order todisplace oil, natural gas or coal that would otherwise have to be imported. The rationale forcoal production subsidies – whether for social, regional or energy-policy reasons – is oftenpoorly defined and little overt attempt is made to measure this effectiveness.
Coal production can be supported in a variety of ways. Most commonly, subsidisationtakes the form of guaranteeing prices to mining companies and/or guaranteeing demand(usually from local power stations). Other forms of financial support include royalty and tax
© O
EC
D/IE
A, 2
011

Chapter 11 - Coal supply and investment prospects 415
11
exemptions and credits, grants for investment, cheap loans, preferential rail-transportationtariffs (usually where the rail company is publicly owned) and the imposition of tariffs orquotas on imported coal. Assistance may also be offered to retired miners (which does notdirectly affect current production) and to cover the costs associated with land reclamation.
Table 11.5 ! Government support to coal production in OECD countries
Type of support
Germany The cost of producing hard coal in Germany (lignite mining is not subsidised) is normally far higher than theprice of imported coal; the difference is made up by a subsidy to Ruhrkohle AG (RAG), the dominant producer.The cost of these subsidies peaked at $8.5 billion in 1996 and in 2011 was around $2 billion, even thoughproduction had been declining for many years. In mid-2007, the federal government, the governments of thestates with mines, the unions and RAG agreed on a detailed road map to end all subsidies by 2018. Under thedeal, production is being gradually scaled back. Subsidies will continue to be paid jointly by the federal andstate governments until 2014, after which time the federal governmentwill pay all subsidies. Liability costs thatremain after the closure of the pits will primarily be paid out of a fundwhichwill be financed by the proceeds ofa public sale of shares in RAG. Another programme, in place since 2001, provides older coal miners with earlyretirement payments until they become eligible for regular pension payments.
Korea Support to producers of anthracite coal has been in place for several decades, involving price support,subsidies for acquiring capital equipment, subsidies for exploration and support of a more general nature.The price-support component was repealed at the end of 2010. The government also provides supportto the production of anthracite briquettes, mainly by setting the price below cost (to protect low-incomehouseholds) and paying the difference to producers. Support is due to be phased out progressively andterminated by the end of 2020, though a scheme to provide vouchers to subsidise consumption is expectedto be expanded to offset the impact of higher prices.
Poland Most of the costs currently associated with aiding the restructuring of the hard coal industry are associatedwith historic liabilities. Since 2007, the costs of mine closures have been met by a dedicated fund,established for this purpose by the remaining mining enterprises. Coal sales are not subsidised and stateaid is no longer given to support operating costs or to maintain access to already exploited coal reserves.
Spain Transfer payments are made by the government to private coal companies to compensate them for thedifference between their operating costs and the prices at which they sell their output to local powerplants (which are negotiated directly). Under the National Plan for Strategic Coal Reserves 2006-2012,operating aid is to be reduced progressively and production is due to fall from 12.1 Mt in 2005 to 9.2 Mt in2012. Aid is available to pay benefits to former miners, to cover the costs of mine closures, for alternativeindustrialisation projects and for developing infrastructure in the affected mining regions.
Turkey The government subsidises directly hard coal mining by paying the difference between the price at whichTTK (themonopoly state-owned hard coal producer) sells the coal to power generators (linked to the importprice) and the actual cost of production. The government plans to phase out this subsidy with the plannedrestructuring of TTK.
Source: OECD/IEA databases and analysis.
Information about government support to coal production is patchy, especially forcountries outside the OECD. A handful of OECD countries, mostly in Europe, still supportcoal production, though the level of support has in most cases been declining for severalyears. For example, Germany still has hard coal production subsidies, but is due to phasethem out completely by 2018. All support to coal production in Europe is subject toEuropean Union (EU) rules on state aid.
© O
EC
D/IE
A, 2
011

416 World Energy Outlook 2011 - OUTLOOK FOR COAL MARKETS
Coal market and industry structure
International markets
International coal trade takes place largely within two distinct geographical zones: theAtlantic and Pacific Basins. In the Atlantic Basin, Colombia, Russia and South Africa are themain exporters of steam and coking coal, mostly to Europe, though South African coal alsomoves eastwards, mainly to India. In the Pacific Basin, the main exporters are Australiaand Indonesia, supplying their traditional markets in Japan, Korea and Chinese Taipei, butrecently also China and India. Exceptions to these general export patterns do exist: someAustralian and Indonesian coal goes to Europe and the United States exports steam coal toEurope and coking coal to other markets. Canada is also an exporter of coking coal in thePacific Basin and Mongolia is joining its ranks. Mozambique will soon be exporting cokingand steam coal in both the Atlantic and Pacific Basins. China and India have become activeplayers in the coal import market. India, which is facing the prospect of increasing importneeds in coming years, has established strong relations with Indonesia and South Africa inparticular. China’s position is more complex as import volumes depend heavily on arbitrageopportunities between domestic and international prices.
The Atlantic Basinmarket for steam coal hasmatured and become highly liquid: paper tradehas grown rapidly over the last four years and in 2010 was thought to be around ten-timesas big as the physical market. There is a wide range of financial instruments for hedging andmanaging risks. Liberalisation of electricitymarkets, a shift from long-term contracts to spotindex pricing and increased price volatility have helped to drive this development. Flexibilityon both the demand side (particularly concerning the types of coal used) and on the supplyside (including the ability to diversify coal quality through blending facilities) is likely toincrease in the future.
By contrast, the Pacific Basin has not seen the same increase in the sophistication of tradingpractices, probably because of the continued preference on the part of Japanese and Koreanbuyers for long-term contracts, for security-of-supply reasons, which are related to steelproduction to support domestic manufacturing. The Pacific Basin has been dominated bylong-term contracts with annual price negotiations, with spot purchases accounting for onlya small share of total trade. The share of long-term contracts is thought to be from 85% to90% in Japan, 80% to 85% in Chinese Taipei and 75% to 80% in Korea. India is moving fromspot pricing to an equal mix of spot and long-term contracts. The slow pace of electricitymarket deregulation, aversion of some exporters to hedging and difficulties in establishingreliable indices in the complex Chinese and Indianmarkets, have impeded the developmentof amore liquidmarket. Nevertheless, there are signs that the situation is changing in someparts of Asia, with paper and financial trading playing a growing role. For example, the firstIndonesian futures contract for steam coal was launched in 2010.
In the global coking coal market, trade has recently moved from mostly annual contractsto quarterly contracts and pressure from the producers to move to monthly pricing isgrowing. The existence of iron ore and coke derivatives and the launch of the first coking
© O
EC
D/IE
A, 2
011

Chapter 11 - Coal supply and investment prospects 417
11
coal derivatives, which together allow hedging along the whole steel-value chain, are likelyto lead to a rapid change in the way coking coal is traded. It is unclear to what extent thismay be affected by any reduction in the differential between steam and coking coal prices– a prospect that is looking increasingly likely, given recent large investments in new cokingcoal mines.
Industry concentration
The structure of the coal industry worldwide has been undergoing radical changeover the past decade or so, involving increased merger and acquisition activity (bothinternationally and within domestic industries) and increased diversification on thepart of the mining companies, both in terms of the types of commodities they mineand the extent of overseas activities. In general, units within the industry have becomelarger, while most of the big companies have become more international. In China andsome other developing countries, mining has been put on a more commercial footing,with some liberalisation of domestic markets, greater private-sector involvement andmodernisation of operations.
Nonetheless, the coal industry remains far-less concentrated than other fuel industries. The30 leading coal companies (whose share has risen slightly since 2008) accounted for around40% of global production and global trade in 2010, far smaller shares than in the oil ornatural gas sectors. The share of the four big diversifiedmining companies (Anglo American,BHP Billiton, Rio Tinto and Xstrata) in global production actually declined from 7% in 2008 to5% in 2010, though this was mainly because the three-largest Chinese producers (ShenhuaGroup, China Coal Group and Datong Coal Group) expanded their market share from 7% to9%. The recent strong growth in output in China has resulted from the ongoing consolidationof small-scale mining operations into larger, more efficient and safer mining complexes.
The concentration of global coal mining is likely to become more marked in the mediumterm, partly as a continuation of recent trends (in line with global trends across mostindustrial sectors) and because production growth is expected to come mainly fromcountries where the industry is already dominated by a small number of large companies.The trend towards concentration will be accelerated if prices and investment returnsremain high, as they will enhance the ability of big companies to seek out new acquisitions.The increased financial and technical risk associated with greenfield mining and relatedtransport infrastructure will also tend to favour greater concentration, though joint-venture operations can spread this risk. Nonetheless, there may be opportunities for smallcompanies to build market share where policies are put in place to increase production byopening mining blocks to competition.
International trade in hard coal is more concentrated. The four big diversified miningcompanies, together with Drummond and Peabody Energy in the United States, SUEKand Kuzbassrazrezugol in Russia, and Bumi in Indonesia, accounted for nearly 40% ofinter-regional coal trade in 2010. The share of these companies was just under 45%
© O
EC
D/IE
A, 2
011

418 World Energy Outlook 2011 - OUTLOOK FOR COAL MARKETS
in 2008. As Australia and Indonesia account for more than half of the world inter-regionalhard coal trade,mining companies in these countries naturally also account for a large share.Like production, trade is likely to become evenmore concentrated in the future, though, asdemonstrated by the recent increasing importance of Indonesian mining companies, thebarriers to market entry by smaller players are not insurmountable.
Current investment trends5
Despite rising costs, investment in coal mining resumed its strong upward path in 2010,following a temporary slowdown in growth in 2009 in the wake of the global financial andeconomic crisis. The 30 leading coal companies worldwide, accounting for around 40% ofworld coal production, invested a total of $16 billion in 2010 – an increase of $1.5 billion,or 10%, on the 2009 level (Table 11.6). The jump in investment by these companies wasparticularly marked in China and the United States, where their investment had stalled in2009, due to financing difficulties and a slump in demand. On the assumption that the levelof investment per tonne of coal produced by the 30 leading coal companies was matchedby all other coal companies, world coal mining investment totalled about $40 billion in2010. Recently, an increasing share of investments has been directed towards cokingcoal operations, because of the widening differential between steam and coking coalprices. Spending on acquisitions of coking coal companies (not included in our investmentestimates) has also increased.
The four big diversified mining companies – Anglo American, BHP Billiton, Rio Tinto andXstrata – invested a total of $4.6 billion in 2010, marginally higher than in 2009. Investmentby Xstrata increased sharply, with the development of six new coal mines, with a totalcapacity of more than 31 Mt per year, which are due to enter production by 2013. Thisincrease was largely offset by a drop in capital expenditure by BHP Billiton. The combinedspending of the two big Chinese coal-mining companies (ShenhuaGroup and China NationalCoal Group) surged by about 70% to $5.2 billion in 2010, driven by the continuing rapidgrowth in Chinese coal demand. Consequently, their share in the total investments ofthe 30 leading coal companies increased from just over one-fifth to one-third. In 2010,investment by the leading Indonesian companies dropped, partly as a result of unusuallyhigh capital expenditures in 2009; but it was still 85% higher than in 2007.
The 30 leading coal companies combined have a high reserves-to-production ratio,averaging about 60 years. But the ratio differs widely among the companies; for instancefour companies, including the largest Chinese producer Shenhua Group, have a remainingreserve lifetime of less than 25 years. The average reserve lifetime of the four big diversifiedmining companies, at around 40 years, is relatively long. Eight companies have reservescovering more than 50 years of production at current rates, three of which are based in theUnited States. Companies like RWEPower in Germany and ChinaNational Coal Group reportvery large coal reserves. However, reserve statements have to be treated with care due todifferent classification systems and accounting standards between countries.
5. Investment figures presented in this sec!on exclude expenditure on mergers and acquisi!ons.
© O
EC
D/IE
A, 2
011

Chapter 11 - Coal supply and investment prospects 419
11
Table 11.6 ! Key figures for the 30 leading coal companies
Name (corporate base) Production(Mt)
R/P*(Years)
Exports(Mt)
Investment($ million)
2010 2010 2008 2009 2010
Coal India (India) 431 50 n.a. 600 629 513
Shenhua Group (China) 352 21 n.a. 2 090 1 169 2 626
Peabody Energy (US) 198 41 19 264 261 557
Datong Coal Mining Group (China) 150 n.a. n.a. n.a. n.a. n.a.
Arch Coal (US) 146 27 6 497 323 315
China National Coal Group (China) 138 134 n.a. 1 142 1 874 2 564
BHP Billiton (UK-Australia) 104 61 63 938 2 438 1 534
Shanxi Coking Coal Group (China) 101 n.a. n.a. 1 132 1 732 628
RWE Power (Germany) 99 350 n.a. 331 459 241
Anglo American (UK-South Africa) 97 28 48 832 496 491
SUEK (Russia) 89 66 29 449 351 429
Cloud Peak Energy (US) 85 11 3 138 120 92
Xstrata (UK-Switzerland) 80 45 58 1 204 1 111 1 998
Alpha Natural Resources (US) 77 49 9 331 339 345
Rio Tinto (UK-Australia) 73 27 32 515 512 609
Consol Energy (US) 66 31 6 446 580 733
PT Bumi Resources (Indonesia) 59 31 53 567 484 287
Kuzbassrazrezugol (Russia) 50 n.a. 24 667 126 336
Banpu (Thailand) 43 49 n.a. 120 82 42
Sasol (South Africa) 43 n.a. n.a. 121 170 232
PT Adaro Indonesia (Indonesia) 42 20 n.a. 226 141 290
Kompania Węglowa (Poland) 40 n.a. n.a. 371 316 265
Massey Energy (US) 34 63 n.a. 737 275 n.a.
Drummond (US) 32 n.a. 32 n.a. n.a. n.a.
Patriot Coal (US) 28 58 n.a. 121 78 123
Mitsubishi Development (Japan) 28 n.a. n.a. n.a. n.a. n.a.
Alliance Resource Partners (US) 27 23 1 177 328 290
PT Kideco Jaya Agung (Indonesia) 24 n.a. n.a. n.a. n.a. n.a.
Teck Cominco (Canada) 23 32 n.a. 118 69 355
International Coal Group (US) 14 70 1 173 88 107
Total 2 775 60 384 14 304 14 551 16 002
*Reserves-to-production (R/P) ratios are based on the last year of available data for production and the sum of probableand proven reserves. Includes IEA estimates on reserve data, which may not conform to the Australasian Joint OreReserves Committee (JORC) standards.Sources: Company reports and IEA analysis.
© O
EC
D/IE
A, 2
011

420 World Energy Outlook 2011 - OUTLOOK FOR COAL MARKETS
Focus on the New Policies Scenario
Production prospects
In the New Policies Scenario, global coal production increases by nearly 20%, from about4 930 million tonnes of coal equivalent (Mtce) in 2009 to a plateau of 5 860 Mtce in 2025,before remaining broadly flat throughout the rest of the projection period (Table 11.7).The majority of the net growth in world production occurs in non-OECD countries, whileproduction falls markedly in the OECD (particularly in Europe and the United States), at anaverage rate of 0.6% per year. Non-OECD production over 2009 to 2035 expands by almost1 150 Mtce, or 1.1% per year on average, with roughly 50% of the increase coming fromChina and the bulk of the rest from India and Indonesia. Australia is the only major OECDproducer to see a rise in production (12% between 2009 and 2035), but growth is mainlyconfined to the period to 2020.
Table 11.7 ! Coal production by region in the New Policies Scenario (Mtce)
1980 2009 2015 2020 2025 2030 2035 2009-2035*
OECD 1 385 1 403 1 462 1 421 1 358 1 281 1 197 -0.6%
Americas 673 810 856 833 799 750 697 -0.6%
United States 640 757 794 769 740 699 652 -0.6%
Europe 609 249 218 192 169 146 118 -2.8%
Asia Oceania 103 343 388 396 390 386 382 0.4%
Australia 74 338 382 391 384 381 377 0.4%
Non-OECD 1 195 3 525 4 172 4 412 4 505 4 575 4 662 1.1%
E. Europe/Eurasia 519 364 407 408 406 393 382 0.2%
Russia n.a. 219 258 262 267 257 248 0.5%
Asia 568 2 873 3 423 3 634 3 725 3 805 3 903 1.2%
China 444 2 197 2 563 2 675 2 691 2 710 2 739 0.9%
India 77 349 399 441 488 537 589 2.0%
Indonesia 0 238 338 380 406 415 429 2.3%
Middle East 1 1 1 1 1 1 1 0.9%
Africa 100 207 238 254 251 255 256 0.8%
South Africa 95 202 218 224 216 216 214 0.2%
Latin America 8 80 103 115 122 121 120 1.6%
Colombia 4 68 90 101 109 107 107 1.8%
World 2 579 4 928 5 634 5 833 5 863 5 856 5 859 0.7%
European Union n.a. 238 201 171 142 117 89 -3.7%
*Compound average annual growth rate.
© O
EC
D/IE
A, 2
011

Chapter 11 - Coal supply and investment prospects 421
11
Trade prospects
In the New Policies Scenario, total hard coal trade between WEO regions is projectedto rise from about 750 Mtce in 2009 to a plateau of around 1 050 Mtce by 2020, beforefalling back slightly to nearly 1 020 Mtce by 2035 (Table 11.8). The average annual valueof this hard coal trade over the period 2011 to 2035 amounts to about $140 billion(in year-2010 dollars); although this appears large, it is far below the average annual valueof trade in oil ($1.9 trillion) and natural gas ($385 billion). Patterns of coal trade have beenshifting in recent years, with a growing share taken by non-OECD Asian imports, and thistrend is set to continue. Consequently, the centre of gravity in international coal tradecontinues to move to the Pacific Basin market in the New Policies Scenario (Figure 11.12).
Table 11.8 ! Inter-regional* hard coal net trade by country in theNew Policies Scenario (Mtce)
2009 2020 2035
MtceShare
of primarydemand**
MtceShare
of primarydemand**
MtceShare
of primarydemand**
OECD -120 9% -72 6% 50 5%
Americas 38 5% 70 9% 61 9%
United States 32 4% 65 9% 53 8%
Europe -181 65% -191 72% -147 78%
Asia Oceania 23 7% 48 13% 136 37%
Australia 256 81% 310 83% 301 83%
Japan -144 100% -158 100% -115 100%
Non-OECD 178 5% 72 2% -50 1%
E. Europe/Eurasia 87 30% 103 31% 83 26%
Russia 77 42% 96 43% 80 38%
Asia -19 1% -178 5% -281 7%
China -88 4% -188 7% -81 3%
India -61 16% -178 30% -294 34%
Indonesia 191 100% 288 99% 278 94%
Middle East -1 43% -2 54% -2 55%
Africa 56 27% 75 29% 75 29%
South Africa 63 31% 66 29% 54 25%
Latin America 54 70% 74 66% 74 63%
Colombia 63 93% 95 94% 99 93%
World 753 17% 1 056 19% 1 017 18%
European Union -156 62% -155 69% -110 76%
*Total net exports for all WEO regions, not including trade within WEO regions. **Share of production in the case ofexporting regions.Notes: Positive numbers denote exports; negative numbers imports. The difference betweenOECD and non-OECD figuresin 2009 are due to stock change.
© O
EC
D/IE
A, 2
011

422 World Energy Outlook 2011 - OUTLOOK FOR COAL MARKETS
Figure 11.12 ! World inter-regional* hard coal net trade by major regionin the New Policies Scenario
0%
15%
30%
45%
60%
75%
90%
0
200
400
600
800
1 000
1 200
1990 2000 2009 2020 2035
Mtce Atlanhc
Pacific
Pacific as shareof total trade(right axis)
*Total net exports for allWEO regions, not including trade withinWEO regions.
Whereas Japan and the European Union have long been the world’s largest coal importers,China and India are now emerging as equally important. In particular, India is set to relyincreasingly on imports, as its production fails to keep pacewith booming domestic demand.India’s hard coal imports were around 60 Mtce in 2009 and by 2035 are projected to risefive-fold to 300 Mtce – by far the largest volume of any single country (Figure 11.13).International coal pricemovements will increasingly be driven by Indian and Chinese importneeds, which have already had a profound impact on the prices paid by coal-importingOECD countries. Falling demand in the European Union drives down net imports by almost50Mtce between 2009 and 2035, to 110Mtce; most of the change happens after 2020.
China is expected to become an increasingly important net importer in the mediumterm, but in line with a projected slowdown in domestic demand growth and expectedimprovements in domestic coal infrastructure, its trade in coal returns to balance by theend of the projection period. However, this projection is very sensitive to projected rates ofdemand and production growth, since trade is the difference between very large volumesand, therefore, a modestly faster pace of demand growth or slightly slower output growthwould lead to much higher import requirements (and vice versa). Assuming all else wasequal, hard coal net imports would fall to zero by 2015 (compared with our projection ofaround 185 Mtce) if China’s output rises by just 1.2% per year above our projection in theNew Policies Scenario.
Among the coal exporters, by far the biggest increase in volumes traded occurs inIndonesia and Australia, although their growth is concentrated in the period to 2020. Thesetwo countries, which together already accounted for about 60% of global hard coal trade in2009, are projected to contribute nearly half of the increase in global inter-regional tradeto 2035 in the New Policies Scenario. Most of their exports go to India, China, Japan andKorea. Exports from South Africa, the United States and Russian initially follow the growthin global coal trade in the New Policies Scenario to 2020, before declining towards 2035 asglobal trade decreases and competition from the lowest and/or largest exporters intensifies.
© O
EC
D/IE
A, 2
011

Chapter 11 - Coal supply and investment prospects 423
11
Colombia, along with new entrants such as Mongolia and Mozambique, is projectedto contribute substantially to incremental growth in inter-regional trade, increasingdiversification of sources for importers (especially of coking coal in the case of MongoliaandMozambique).
Figure 11.13 ! Major hard coal importers in the New Policies Scenario
-100
-50
0
50
100
150
200
250
300
2000 2005 2009 2020 2035
Mtce Japan
European Union
China
India
Investment outlook
In the New Policies Scenario, global cumulative investment requirements in the coalindustry over the period 2011 to 2035 amount to about $1.2 trillion (in year-2010 dollars),or $47 billion per year. Around half of this capital expenditure is in the period to 2020 andChina alone accounts for over half of the cumulative investments over the projection period(Figure 11.14). Nearly 95% of projected investment goes to mining, including existing andnew operations, and the rest to ports and shipping. While far from negligible, coal capitalexpenditures, at only 3% of global energy-supply investment requirements, are smallrelative to other sectors.
The average annual projected rate of global investment is around 15% higher than theinvestment estimated to have been made in 2010. In effect, the diminishing need for newcapacity, as demand growth slows and saturates by the early 2020s in the New PoliciesScenario, is offset by the assumed rise in capital costs per unit of output. As seen above,after a short period of respite following the onset of the global economic crisis, capitalexpenditure in mining and transportation per unit of output is on the rise again. The globalweighted-average investment between 2008 and 2010 is estimated at $7.8/tonne ofannual mine capacity (in year-2010 dollars), though costs vary significantly across countriesand basins. We assume that investment unit costs in real terms will continue to rise overthe projection period due to continuing upward pressures on labour, steel, equipment,materials and energy costs, albeit at a slower rate than in the recent past – the globalweighted-average investment is assumed to be $9.3/tonne of annual mine capacity overthe projection period.
© O
EC
D/IE
A, 2
011
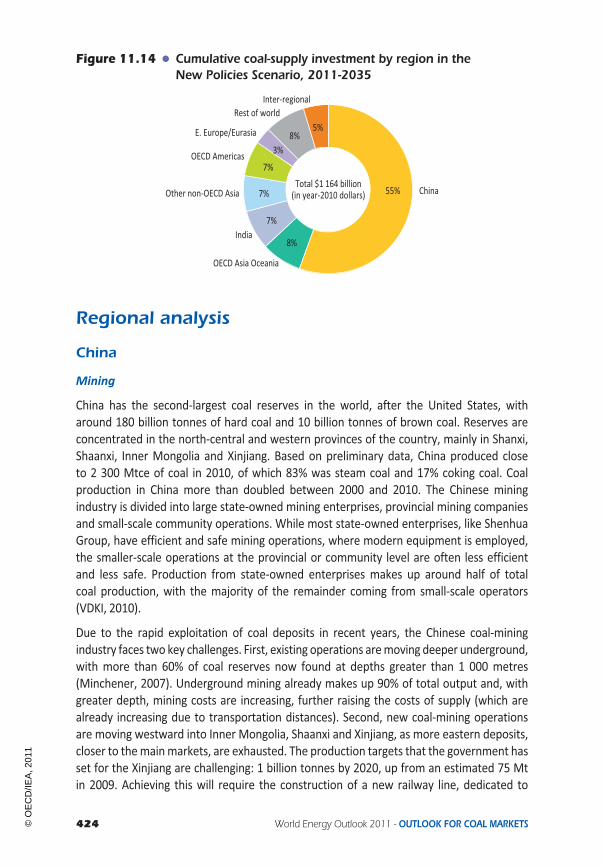
424 World Energy Outlook 2011 - OUTLOOK FOR COAL MARKETS
Figure 11.14 ! Cumulative coal-supply investment by region in theNew Policies Scenario, 2011-2035
55%
8%
7%
7%
7%
3%8%
5%
Total $1 164 billion(in year-2010 dollars) China
OECD Asia Oceania
India
Other non-OECD Asia
OECD Americas
E. Europe/Eurasia
Rest of worldInter-regional
Regional analysis
China
Mining
China has the second-largest coal reserves in the world, after the United States, witharound 180 billion tonnes of hard coal and 10 billion tonnes of brown coal. Reserves areconcentrated in the north-central and western provinces of the country, mainly in Shanxi,Shaanxi, Inner Mongolia and Xinjiang. Based on preliminary data, China produced closeto 2 300 Mtce of coal in 2010, of which 83% was steam coal and 17% coking coal. Coalproduction in China more than doubled between 2000 and 2010. The Chinese miningindustry is divided into large state-owned mining enterprises, provincial mining companiesand small-scale community operations. While most state-owned enterprises, like ShenhuaGroup, have efficient and safe mining operations, where modern equipment is employed,the smaller-scale operations at the provincial or community level are often less efficientand less safe. Production from state-owned enterprises makes up around half of totalcoal production, with the majority of the remainder coming from small-scale operators(VDKI, 2010).
Due to the rapid exploitation of coal deposits in recent years, the Chinese coal-miningindustry faces two key challenges. First, existing operations aremoving deeper underground,with more than 60% of coal reserves now found at depths greater than 1 000 metres(Minchener, 2007). Underground mining already makes up 90% of total output and, withgreater depth, mining costs are increasing, further raising the costs of supply (which arealready increasing due to transportation distances). Second, new coal-mining operationsare moving westward into Inner Mongolia, Shaanxi and Xinjiang, as more eastern deposits,closer to themainmarkets, are exhausted. The production targets that the government hasset for the Xinjiang are challenging: 1 billion tonnes by 2020, up from an estimated 75 Mtin 2009. Achieving this will require the construction of a new railway line, dedicated to
© O
EC
D/IE
A, 2
011

Chapter 11 - Coal supply and investment prospects 425
11
freight, to connect the coal-fields with the inland provinces of Gansu andQinghai. However,transport costs to the coast will be very high, due to the long distances involved.
Between 2000 and 2009, the average cost of production of the major state-ownedenterprises in Shanxi province broadly tripled (Figure 11.15). The labour productivity ofnewer coal-mining operations in China is similar to that in the Appalachian region of theUnited States or in South Africa, thanks to the recent industry consolidation and efforts toincreasemechanisation, but, worsening geological conditions have outweighed productivitygains in recent years. Levies and taxes have been introduced or increased, mostly aimedat diminishing the environmental impact of mining, while the coal resource tax has alsocontributed to higher costs.
Figure 11.15 ! Average coal production costs of major state-ownedenterprises in Shanxi province, 2000-2009
0
10
20
30
40
50
60
2000 2001 2002 2003 2004 2005 2006 2007 2008 2009
Dollarspe
rton
ne(nom
inal) Overhead,
tariffs, taxesand levies
Mining
Sources: Wang and Horii (2008); Tu (2010); IEA analysis.
The massive restructuring of the Chinese coal-mining industry that has been underway forseveral years – aimed at consolidatingmining operations, increasing efficiency and improvedhealth and safety – has contributed to constraining growth in production, as small inefficientmines have been shut down. As a result, production has failed to keep pace with demand,causing imports to rise and exports to drop in the short term, though the restructuring isexpected to reinforce the ability of the industry to attain higher production in the longerterm. However, there are concerns about the adequacy of the incentives to invest, giventhe pressure on the coal industry from power generators to hold down prices. Powergenerators have incurred big financial losses recently as a result of the government cappingelectricity prices (to combat inflation and protect household incomes) to levels that do notcover the rising cost of coal. The government attempted to address this problem in the11th Five-Year Plan by planning large “coal-power bases” – the development of combinedmining operations and coal-fired power plants at the same location. The electricity soproduced is to be transmitted via ultra-high-voltage direct current lines to demand centres.This approach can reduce transport costs and also allows for larger, more efficient and safermining operations. Chinese officials hope that the distribution of business risk resulting
© O
EC
D/IE
A, 2
011

426 World Energy Outlook 2011 - OUTLOOK FOR COAL MARKETS
from this growing integration of the power and coal sectors will reduce the conflict betweencoal and power producers. Currently, fourteen coal-power bases are under development,controlled by state-owned enterprises and the central government. Each will produce andburn more than 100Mt of coal per year.
Inland transporta!on
The greater part of Chinese demand for coal and energy generally is concentrated alongthe coast, mainly in the industrial centres around Beijing, Shanghai, and Guangdong(Figure 11.16). Consequently, coal has to be hauled long distances from the westerncoal-mining areas, sometimes exceeding 1 300 km. As a result, domestic transportationmakes up a significant part of the total cost of supply. It can cost around $35/tonne tomove coal from the central coal provinces to the coast at present (Table 11.9). Most of thecountry’s coal-fired power stations are located near the coastal demand centres, as buildingplants close to mines was previously hindered by a regulatory scheme that discouragedelectricity-grid operators from building transmission lines. The share of coal transportedby railway has rapidly dropped in recent years, but rail is still the dominant mode oftransportation, accounting for 44% of total coal production in 2009 (NBS, 2010). Becauseof inland transportation constraints, growing volumes of domestic coal are shipped by seausing bulk carriers, fromQinhuangdao and other ports in the north tomajor demand centresin the south, and a smaller fraction of the coal produced is moved by road and river barges.
Table 11.9 ! Major railway-to-port coal routes in China
Distance(km)
Costs ($/tonne) Capacity (Mt/year)
2006 2010 2006 2010
From Northern Shanxi/Shaanxi/Inner Mongolia to:Qinhuangdao 650 16 26 193 193
Tianjin 500 13 20 90 108
Jintang 600 15 24 16 46
Hunaghua 600 15 24 90 90
From Central/Southeast Shanxi to:Qingdao 900 23 36 15 15
From Southwest/Southeast Shanxi to:Rizhao 900 23 36 27 45
Lianyungang 950 24 38 17 20
Sources: Tu (2010); Morse and He (2010); Paulus and Trüby (2011); IEA estimates and analysis.
In total, coastal freight amounts to around 500 Mt/year and is expected to increase in theshort term. Coal-transportation capacity has increased rapidly: the capacity of the threemajor railway links connecting the western coal-bearing provinces with the northern coalports has grown from 550 Mt/year in 2005 to around 1 000 Mt/year in 2010. Even so, railbottlenecks have occurred and road transportation has been hindered by massive andcommon traffic jams on the roads to eastern demand centres. Rising rail freight rateshave also driven up coal-supply costs: the railway network is under the control of a state
© O
EC
D/IE
A, 2
011

Chapter 11 - Coal supply and investment prospects 427
11
monopoly, which is able to extract monopoly rents from coal producers. The government’spolicy of encouraging coal-power bases is expected to reduce the need for coastal transport,relieve the pressure on the rail-transport system and limit themarket power of the state railcompany over future coal power projects.
Figure 11.16 ! Major coal production centres and transport routes in China,2009
600
296
594143
76 Xinjiang
Shaanxi
Inner Mongolia
Henan
Shanxi
Guangdong
230
564
210
136Guizhou
128Anhui
Shandong
~500
98
Liaoning 160
Jiangsu210
Zhejiang 132
136
265
Hebei
348CHINA
This map is for illustrative purposes and is without prejudice to the status of or sovereignty over any territory covered by this map.
Notes: All numbers are in millionmetric tonnes. The black circles indicate production and the green circles are deliveriesto major demand centres. Arrows depict major railway lines or coastal shipping. Note that only major production anddemand centres of (more than 100Mt) have been included, except Xinjiang.Sources: NBS (2010b); Tu (2010); IEA analysis.
Trade
China swung from being a net exporter to a net importer of coal in 2009, with a net importbalance of 88 Mtce. In 2010, net imports continued to climb to an estimated 126 Mtce,making China the world’s second-largest coal importer after Japan. China continues toexport some coal, but imports are now much bigger. Exports have been controlled bythe government through export quotas since 2004, mainly because of concerns aboutover-exploitation of domestic resources and the prospect of growing dependence onimported coal. Only fourmining companies (China Coal Company,Minmetals, Shanxi Groupand ShenhuaGroup) hold export licenses. Export quotas are set on an annual basis and havebeen reduced progressively from 80 Mt in total in 2005 to 38 Mt in 2011. The governmentalso levies a tax on coal imports, currently 17% of the FOB price. While subject to oscillationand consequently arbitrage, transportation bottlenecks and high rail-freight tariffs forcoal moved from the northwest of China have led to an increase in domestic deliveredcoal prices and reduced the competitiveness of Chinese production compared with
© O
EC
D/IE
A, 2
011

428 World Energy Outlook 2011 - OUTLOOK FOR COAL MARKETS
imports (Figure 11.17). Average coal prices at Qinhuangdao, the main export terminal,increased from $71/tonne in 2007 to $115/tonne in 2010, and were higher again in 2011.
Figure 11.17 ! China’s steam coal import volumes from selected countries
-14
-7
0
7
14
21
28
35
42
49
-4
-2
0
2
4
6
8
10
12
14
Jan-09 Jul-09 Jan-10 Jul-10 Jan-11 Jul-11
Million
tonn
es
Dollarspe
rton
neat
6000
kcal/
kg
South Africa
Russia
Australia
Indonesia
Imports:
Import cost advantageversus domeshcproduchon (right axis):
Weighted average
Source: Based on data from IEAMedium-Term Coal Market Report (2011), forthcoming.
Outlook
Our projections for China’s production reflect the expected trends in mining and transportinfrastructure outlined above and the underlying coal demand trends presented inChapter 10. Many of the policies contained in China’s 12th Five-Year Plan are expected to betaken forward through more detailed targets. In some cases, this Outlook anticipates suchtargets, based on credible reports at the time of writing, in order to provide further depthto the analysis. The energy targets outlined by officials show coal consumption reachingaround 3.8 billion tonnes in 2015, whichwould call for average annual growth of productionof only around 5% from 2011 to 2015, compared with almost 10% between 2000 and2010. In the New Policies Scenario, total coal production in China is projected to increaseby around 540 Mtce between 2009 and 2035, reaching 2 740 Mtce. Most of the increase– about 90% – occurs by 2020, production growing at an annual rate of 1.8% from 2009 to2020 (Figure 11.18). All of the increase to 2020 is in steam coal, which reaches a level ofnearly 2 300 Mtce. After 2020, coal production remains almost stable until the end of theprojection period, as industrial energy demand slows, with coal increasingly substituted bynatural gas and electricity, and other fuels (like natural gas, nuclear and renewables) becomemore important in power generation. As a result of fuel substitution and due to saturation ofsteel use, coking coal production peaks before 2020 and declines through theOutlook periodfrom 380Mtce in 2009 to around 300Mtce in 2035.
In the New Policies Scenario, Chinese net coal imports increase from around 90 Mtcein 2009 to 185 Mtce by 2015 (Figure 11.19). Over this period, lower economic growthrates, improved energy efficiency and a shift of focus away from coal towards natural gas,renewables and nuclear energy gradually dampen coal demand growth and slow the growthin coal imports. In addition, the opening up of new, highly cost-competitive coal mines in
© O
EC
D/IE
A, 2
011

Chapter 11 - Coal supply and investment prospects 429
11
the west of China, together with increased transmission of electricity rather than transportof coal should increase the competitiveness of domestic supply, compared to imports.Between 2015 and the end of the projection period, net imports decline, though slowly, as aresult of stagnating domestic Chinese coal demand. By 2035, China’s net imports are around3% of the nation’s demand – a level comparable to 2009.
Figure 11.18 ! Cumulative coal production in China by period and type inthe New Policies Scenario
0 600 1 200 1 800 2 400 3 000
0 10 000 20 000 30 000 40 000 50 000
1990-1999
2000-2009
2010-2019
2020-2035
Mtce
Mtce
Steam coal
Coking coal
Average annualtotal produchon(top axis)
Figure 11.19 ! China’s hard coal net trade by type in the NewPolicies Scenario
-40%
-30%
-20%
-10%
0%
10%
20%
-200
-150
-100
-50
0
50
100
1990 2000 2009 2015 2020 2025 2030 2035
Mtce Coking coal
Steam coal
Share ofworld trade
Share ofdomeshc demand
Hard coal (right axis):
Nevertheless, with the import levels projected in the medium term in the New PoliciesScenario, China would remain a crucial player in global coal trade, up to 2020. China’s shareof total inter-regional hard coal trade would remain just below 20%, China becoming theworld’s biggest importer in volume terms; later on, China would be overtaken by India. Onthe other hand, Chinese net imports would still meet only around 7% of total Chinese coaldemand around 2020. As Chinese demand is so large, a relatively small variation in domestic
© O
EC
D/IE
A, 2
011

430 World Energy Outlook 2011 - OUTLOOK FOR COAL MARKETS
coal demandor supplywould havemajor implications for internationalmarkets (see Spotlightin Chapter 2). In this context, prices could be highly volatile, as short-term fluctuations in theChinese domestic market amplify pricemovements on the international market.
United States
Mining
Reserves of hard and brown coal in the United States amounted to 227 billion tonnesand 31 billion tonnes respectively at end-2009 (BGR, 2010). Together, these reserves aresufficient to maintain 2009 production levels for 265 years. The United States accounts foraround a quarter of the world’s coal reserves. Reserves are concentrated primarily east ofthe Mississippi River, notably in Illinois, Kentucky and West Virginia, although output fromwest of the Mississippi River now accounts for more than half of national output. All of thesub-bituminous coal, which makes up 37% of the reserve base, is west of the MississippiRiver, mostly in Montana and Wyoming. Low-value lignite, which accounts for about 9% ofreserves, is located mostly in Montana, Texas and North Dakota. Anthracite, the highest-quality coal, makes up only 1.5% of the reserve base and is found in significant quantitiesonly in northeastern Pennsylvania.
Environmental policies will be crucial to the prospects for coal production, through theirimpact on access to resources and on the cost of complying with regulations aimed atminimising the risks and damage associated with mining activities. Mining regulations arelikely to continue to get tighter. Regulation could also act to cut coal demand. Air pollutionregulations are expected to severely constrain the use of coal in the industry and powersectors in this decade by leading to a substantial shutdown of old plants. Additionally, abig concern on the part of the coal-mining industry is that action to curb the growth ingreenhouse-gas emissions, possibly through a cap-and-trade scheme, will limit the scopefor using coal or increase the cost of doing so. For these reasons, mining companies areincreasingly looking at the possibility of expanding export sales to compensate for any lossof domestic sales. A number of projects underway are designed to expand US coal-exportcapacity (subject to regulatory and legal constraints), such as the Asia-focused GatewayPacific Terminal being built inWashington state.
Outlook
Apart from rebounding in the short term from the dip due to the economic crisis, coal productionin the United States is projected to decline steadily through the projection period, from757 Mtce in 2009 to just above 650 Mtce in 2035, an average rate of decline of 0.6% per year(Figure 11.20). The main reason for this drop in production is the weak outlook for domesticdemand (see Chapter 10), resulting from strong competition from low-cost natural gas andgrowing renewable energy sources in power generation, and the assumption that from 2015investment decisions in the power sector will take into account a “shadow-price” for carbon.The United States has large remaining resources of coal, but much of the resource is relativelyexpensive to extract and transport to market, especially for areas east of the Mississippi.However, due to strong global demand andhigh prices, there has been a rebound in exports over
© O
EC
D/IE
A, 2
011

Chapter 11 - Coal supply and investment prospects 431
11
the past few years, especially of coking coal. In the New Policies Scenario, hard coal net exportsare projected to rise from32Mtce in 2009 to 53Mtce in 2035,withmost of the growth occurringin the first decade of the projection period and consisting predominantly of coking coal.
Figure 11.20 ! Coal production in the United States in the NewPolicies Scenario
0%
2%
4%
6%
8%
10%
12%
14%
16%
18%
0
100
200
300
400
500
600
700
800
900
1990 2000 2009 2015 2020 2025 2030 2035
Mtce Net exports
Demand
Net exports as shareof total produchon(right axis)
Much of the projected fall in production is likely to occur in the higher-cost Appalachianregion, which in 2009 accounted for around one-third of all the coal produced in the UnitedStates. Appalachian coal isminedmainly from large undergroundmines andmost is suppliedtomarketswithin the region (mainly power stations), though growing volumes are exported.The region, especially the central areas, has been extensively mined and production isrelatively costly. In addition, concerns about the environmental impact of the practiceof mountaintop mining in central Appalachia will probably constrain output; a freeze onsurface-mining permits was recently announced and a review of permitting is underway.
Production is expected to remain strong in the western United States, where coal is minedprimarily from very large opencast mines, with generally lower costs than those in theAppalachian and the interior region – the other main producing area, located in Illinois.Low-cost supplies of coal from the west will increasingly meet demand from coal-firedpower plants east of the Mississippi River and will supply most of the coal needed for thenew coal-to-liquids (CTL) plants that are expected to be built during the projection period.Production in the interior region, which has been in decline in recent years, could be boostedby investment in new mines to exploit the substantial reserves of mid- and high-sulphurbituminous coal found in Illinois, Indiana and western Kentucky.
India
Mining
Although coal is widely used in every state in India, coal deposits are heavily concentrated,with 80% of both reserves and resources located in just four states: Chattisgarh, Jharkand,Orissa andWest Bengal. Roughly 95% of the country’s 77 billion tonnes of coal reserves arehard coal (BGR, 2010). Indian hard coal is generally of poor quality, with high levels of ash
© O
EC
D/IE
A, 2
011

432 World Energy Outlook 2011 - OUTLOOK FOR COAL MARKETS
and organic impurities, though the sulphur content is low. Even though Indian power plantsare designed to be able to handle coal with ash content in a range from 25% to 55%, thehigh ash content causes technical problems and gives rise to higher operating costs at powerplants. As a result, coal-washing facilities are increasingly being installed. Calorific values aregenerally low, in a range of 3 100 kcal/kg to 5 100 kcal/kg and averaging around 4 100 kcal/kg(IEA-CCC, 2007). Only around 10% of domestic coking coal readily meets quality standards;the remainder requires intensive washing to make it suitable for coke production.
Coal continues to play a central role in underpinning rapid economic development in India,though the country increasingly has to import coal tomeet its booming energy needs. Indianhard coal production jumped from around 200Mtce in 2000 to 330Mtce in 2010 (based onpreliminary data), growing at an average annual rate of 5%. Brown coal output has grownfrom 8Mtce to 13Mtce over the past decade.
As in China, a mismatch between the geographical locations of coal supply and demandrequires coal to be transported over long distances.More than 50%of the coal traffic, includingimports into India, is moved by rail; another 20% is shipped by road and the rest is consumed(mainly) inmine-mouth power plants. Rail shipments increased from 300Mt in 2005 to 400Mtin 2009; government targets for production imply an increase to 700Mt by 2025.
The Indian coal industry is highly concentrated with several state-controlled miningcompanies dominating the market. One state-owned company, Coal India, controls around80% of total Indian coal output. Private companies account for less than 10%. Most coalcomes from opencast operations, as over 60% of coal resources are found at a depth ofless than 300 metres (Mills, 2007) and opencast mining is usually more efficient and lesscapital intensive than underground mining. Indian mining companies have in recent yearsincreased the share of output fromopencast operations from less than 80% in the late 1990sto almost 90% in 2009. Nonetheless, productivity is very low: the output per employee yearof Coal India was around 1 100 tonnes, compared with, on average, around 9 000 tonnes inAustralian opencast mines. New opencast mines are more difficult to develop, as many ofthe reserves are in environmentally protected areas and permits can be difficult to obtainfrom the various administrative authorities. There is also a lack of coal-washing capacity.Further increases in production will hinge on the introduction of appropriate policies andinvestment to address these concerns.
Trade
A growing share of Indian demand ismet by imports, as demand has outstripped productionfor several years. Indian hard coal imports grew from 20 Mtce in 2000 to 75 Mtce in 2010.Of this, roughly one-thirdwas coking coal. As domestic coal often has to be hauled over longdistances, domestic coal supplies are not always competitive with imported coal, even atinland demand centres. This has increased the incentive to import. Indian coal imports arevery likely to increase further: in February 2010, the Indian coal ministry announced that,in the fiscal year 2011/12, Indian hard coal imports could increase to 142 Mt, an increaseof around 70%, partly due to regulatory hurdles that are impeding growth of domesticproduction.
© O
EC
D/IE
A, 2
011

Chapter 11 - Coal supply and investment prospects 433
11
Indonesian and South African steam coals constitute the largest part of Indian steam coalimports. Imported coal is also used for blending with low-quality domestic coal to bring itup to acceptable standards. Some existing coal-fired plants depend exclusively on importedcoal. The limited amount of domestic coking coal reserves and their relatively poor cokingcapabilities mean that India in 2009 imported almost half of its coking coal needs, mostlysourced from Australia.
Outlook
In the New Policies Scenario, Indian hard coal production grows at an annual average rateof 2%, rising from 340Mtce in 2009 to 570Mtce in 2035 (Figure 11.21). India’s share of totalworld production increases steadily over the projection period and reaches 10% in 2035,consolidating India’s position as the world’s third-largest coal producer. By 2035, India’stotal coal production is only 10% lower than the projected production level of the UnitedStates, compared to about 55% lower in 2009. To maintain India’s production growth inthe near-term, it will be necessary to relieve domestic transport-infrastructure bottlenecksand open up newmining capacity. The Planning Commission for the 11th Five-Year Plan hasalready had to revise coal output projected for 2012 down from 420Mtce to 390Mtce andthe latest estimates suggest that even this new figuremight not bemet, with output in 2012reaching only 370Mtce.
Figure 11.21 ! Coal production in India by type in the New Policies Scenario
0%
2%
4%
6%
8%
10%
12%
0
100
200
300
400
500
600
1990 2000 2009 2015 2020 2025 2030 2035
Mtce Brown coal
Coking coal
Steam coal
Share of worldproduchon(right axis)
Despite continuing strong growth in demand in the Indian steel sector, coking coalproduction is projected to grow at a moderate pace of 1.3% annually until 2035. This ismostly due to the relatively limited resource base, particularly of good-quality coking coal.Brown coal production is projected to grow more rapidly, at around 2.5% per year onaverage over the projection period, but from a lower base, production almost doubles from11 Mtce in 2009 to 20 Mtce in 2035. Nonetheless, the share of brown coal in total Indianproduction still reaches only 3.5% in 2035.
In the New Policies Scenario, net imports of hard coal are projected to rise by more than10% per year between 2009 and 2015, reaching 120 Mtce. Thereafter, imports rise at a
© O
EC
D/IE
A, 2
011

434 World Energy Outlook 2011 - OUTLOOK FOR COAL MARKETS
slower pace, as domestic production picks up, transportation infrastructure expands anddemand growth moderates. They increase to just under 300 Mtce in 2035, growing at arate of around 4.5% per year from 2015 (Figure 11.22). Dependence on coking coal importsincreasesmost, reaching nearly 70% by 2035 (up from 47% in 2009). Overall dependence onhard coal imports rises from around 15% to around 35% over the same period.
Figure 11.22 ! Hard coal net imports in India by type in the NewPolicies Scenario
0%
6%
12%
18%
24%
30%
36%
0
50
100
150
200
250
300
1990 2000 2009 2015 2020 2025 2030 2035
Mtce Coking coal
Steam coal
Share of importsin domeshc hardcoal demand(right axis)
Indonesia
Mining
Indonesia had 5.6 billion tonnes of hard coal reserves and 10.1 billion tonnes of browncoal, at end-2009 (BGR, 2010). Most are found on the islands of Sumatra and Kalimantan.Kalimantan is home to a large part of Indonesia’s coal reserves, which are mostly ofsub-bituminous or bituminous quality in the range of 5 100 to 6 100 kcal/kg. Indonesiancoals are usually low in ash and sulphur, but have a high moisture and volatile mattercontent. Reserves in Sumatra are mostly low-quality lignite and sub-bituminous coals, witha calorific value of less than 5 100 kcal/kg, making them expensive to transport. As a result,coal is increasingly being upgraded by drying or is consumed at the mine-mouth in powerstations, which are linked by high-voltage transmission lines to the major demand centres.
Indonesia’s coal production has risen sharply over the last decade, from 65Mtce in 2000 to282 Mtce in 2010 (based on preliminary data) – a remarkable average growth rate of 16%per year.Most production is steam coal, but output in 2010 included 46Mtce of brown coal,mainly used for domestic power generation. The government has given priority to boostingcoal production, partly to compensate for the decline in crude oil production (which led thecountry to suspend its OPECmembership in 2008).
In recent decades, the Indonesian government operated a so-called “coal contracts of work”(CCOW)mine-licensing system,whereby contract holderswere granted the right to exploit agiven coal deposit for 30 years in return for payment of a royalty of 13.5% of the price of the
© O
EC
D/IE
A, 2
011

Chapter 11 - Coal supply and investment prospects 435
11
coal sold at themine-mouth. The contractorswere also obliged to offer Indonesian investorsat least 51% of the mining stock after a ten-year operating period (Baruya, 2009). In 2001,this provision forced two foreign investors – Rio Tinto/BP and BHP Billiton – to cede shares.At the beginning of 2009, a new Indonesian mining law was enacted which gives foreignas well as Indonesian investors eight years to carry out exploration and another 23 yearsto build and operate the mines. Foreign investors are no longer obliged to offer stock toIndonesian investors. The general objective of the policy is to promotemining developmentby simplifying licensing, improving the planning ofmining areas and clarifying responsibilitiesbetween central, provincial and district authorities. The government has also established aminimum floor price for coal as a means of increasing state revenues from royalties, whichmight be otherwise be based on artificial transfer prices.
Trade
Indonesia, which became the world’s largest exporter of steam coal in 2006, exported233 Mtce of steam coal in 2010, nearly 85% of its total coal production. Steam coalproduction all goes to the export market. There is hardly any trade in brown coal, as it isuneconomic to ship it far due to its low energy content. Themain destinations for Indonesianexports are Korea, Japan and Taiwan. Exports to India and China have been growing very fastsince 2007, reaching 32Mtce and 40Mtce respectively in 2009.
Practically all of the hard coal that is exported comes from south and east Kalimantan.A network of navigable rivers allows many mining operations to haul coal shipments viariver barges to offshore terminals, where coal is loaded onto larger bulk carriers. This systemavoids for themost part the need for domestic railway transport, which is common in othermajor exporting countries, such as Australia and South Africa. This has helped Indonesianproducers to keep costs down and also to increase exports very quickly, as the supply chainis not so constrained by domestic physical transport infrastructure where bottlenecks canoccur.
The Indonesian government plans tomeet rapidly-rising domestic power demand through amassive expansion of coal-based power generation. Therefore, the government has decidedto give the domesticmarket priority over increasing exports. In order tomeet this objective,the government has implemented a range of measures, such as setting a minimumpercentage of coal production that has to be sold to domestic customers. In addition, inearly 2011, the government announced its intention to ban exports of low-quality coal,starting in 2014. This timeframe coincideswith the projected completion of about 7.2 GWofcoal-fired power generation capacity by 2014 (half of which will be brought online by 2012).
Outlook
In the New Policies Scenario, Indonesian production continues its rapid growth in theshort term, with 6% annual growth rate until 2015, when output reaches nearly 340 Mtce(Figure 11.23). This projection takes into account new projects that have already beenlaunched bymining companies operating in Indonesia. After 2015, production growth slowsto 1.2% per year on average, as investors are forced to turn to the lower-quality remainingcoal deposits and as global steam coal trade reaches a plateau. These projections are
© O
EC
D/IE
A, 2
011

436 World Energy Outlook 2011 - OUTLOOK FOR COAL MARKETS
about 15% lower than the production target set by the Indonesian government of around460 Mtce by 2025. By 2035, brown coal production will make up 30% of total volumes –10% higher than the share in 2009.
Figure 11.23 ! Coal production in Indonesia in the New Policies Scenario
0%
10%
20%
30%
40%
50%
60%
70%
80%
90%
0
50
100
150
200
250
300
350
400
450
1990 2000 2009 2015 2020 2025 2030 2035
Mtce Net exports
Demand
Net exports as shareof total produchon(right axis)
Steam coal exports asshare of world steamcoal trade (right axis)
In the New Policies Scenario, the continuation of the recent surge in Indonesian coalproduction underpins growth in exports of almost 4% per year until 2020, when they reacharound 290 Mtce. Thereafter, rising domestic demand and a plateau in global steam coaltrade result in exports remaining almost stable until the end of the projection period. Thisprojection is consistent with the government’s recent interventions to ensure that morecoal supplies aremade available to domestic power stations. Coal exports as a share of totalproduction fall from around 82% in 2009 to just over 65% in 2035. Nonetheless, Indonesiaremains the world’s largest exporter of steam coal throughout the projection period andincreases its share of this market from 34% in 2009 to nearly 40% in 2035.
Australia
Mining and transport
Coal is Australia’s largest fossil-energy resource, with reserves of hard coal at end-2009 of44 billion tonnes, placing Australia in fifth position globally behind the United States, China,India and Russia (BGR, 2010). Australia also has considerable hard coal resources, requiringfurther exploration to prove up, totalling around 1 575 billion tonnes. Furthermore,Australia’s resources of brown coal are the world’s seventh-largest. Much of the country’scoal resource is of high quality (low ash and sulphur) and low cost, since it can be mined byopencast operations (which account for around 80% of output in 2009) or efficient longwallundergroundmining. Coal resources are also located close to demand centres and actual orpotential routes to export.
These resources already underpin a large coal-mining industry. Production totalled355 Mtce in 2010 (based on preliminary estimates), made up of 188 Mtce (53%) of steamcoal, 148 Mtce (42%) of coking coal, and 19 Mtce (5%) of brown coal. At these production
© O
EC
D/IE
A, 2
011

Chapter 11 - Coal supply and investment prospects 437
11
rates, total coal reserves would last around 200 years. Exploration spending directed atexpanding coal reserves is currently at record levels, most of it taking place in Queenslandand New South Wales. The last time comparable levels of exploration took place was inthe early 1980s, in response to a rapid increase in global coal demand, and they resultedin a significant increase in Australia’s coal reserves, notably in the Bowen Basin in centralQueensland, which has gone on to become amajor export region.
The Australian coal industry is gearing up for a massive export-focused expansion over thenear tomedium term. Already coal output is expanding rapidly, with 20 newmines enteringproduction in 2008 to 2010, increasing annual output by some 54Mtce. This involved capitalspending of some $3.9 billion. Over the same period, spending on rail and port infrastructuretotalled $3.1 billion, boosting export capacity by around 80 Mt per year. In the period to2015, plans are advanced to lift infrastructure capacity still further by between 100 Mt and160Mt. There is little doubt that the coal resource can support this level of development andthemining sector is capable of raising the necessary capital and of increasing output to theselevels. However, in the past, matching and coordinating timely development of adequatetransport infrastructure has proved challenging.
The growth in Australia’s coal industry is taking place amid a general resources boom,including natural gas for export as liquefied natural gas (LNG) (see Chapter 4) and ores suchas iron, nickel and copper. While such a cyclical boom is not unknown in Australia, this cycleappears to be deeper, more widespread and longer-lasting than previous ones. Managingthe impact of such a large development on a small economy is proving difficult, as evidencedby project delays and cost over-runs. These pressures may become particularly severewhere developments overlap. One such case is in the Gladstone area, where three large,first-of-a-kind LNG plants, based on coalbed methane, are under construction and wherethere is already a heavy concentration of construction activity, including expansion of thecoal port and other activities. Successfully completing such complex infrastructure projectswill require careful co-ordination across industry, state and federal governments, as well asco-operative initiatives to increase the supply of skilled labour.
The issue of how best to obtain a suitable return to the community from coal-exportearnings, while continuing to encourage investment, has proven difficult. The federalgovernment attempted to introduce a secondary tax on mining profits in 2010, butsubsequently modified this to include only some iron-ore and coal mines. A secondchallenging issue is addressing greenhouse gases through carbon pricing. The governmentannounced in July 2011 an ambitious proposal for an initial carbon tax, starting in 2012 at23 Australian dollars per tonne, which would rise on an annual basis before being replacedby an emissions trading scheme in 2015. Fugitive emissions from coal mining would beincluded in the scheme – a first for a large coal-producing and exporting country. Thegovernment has earmarked some $1.2 billion over five years in assistance for the mostemissions-intensive mines and $64 million to implement carbon-abatement technologies.Carbon pricing would also have a major impact on the power sector and the proposalincludes several transition and compensatory measures to assist power generators andother coal users to adjust to higher prices.
© O
EC
D/IE
A, 2
011

438 World Energy Outlook 2011 - OUTLOOK FOR COAL MARKETS
Trade
In common with Indonesia, but unlike most other major coal-exporting countries, Australiaexports the bulk of the coal produced. Based on preliminary estimates, in 2010, nearly80% of output was shipped abroad. Annual coal output has risen around 4% per yearsince 2000, but domestic use by only 1%, resulting in over 60% of growth in exports in thepast decade. Australia’s total coal exports in 2009 amounted to 256 Mtce. Around 48%of exports are coking coal, the rest is steam coal. Coking coal production is concentratedin central Queensland’s Bowen Basin and exports are made via five ports, including HayPoint and Gladstone; steam coal export is centred on the port of Newcastle in New SouthWales, with output from the Hunter Valley hinterland. Newcastle is the world’s largest coalexport-terminal, with annual capacity in 2010 around 115 Mt. Its capacity is set to increaseto 170Mt by 2013.
In the case of coking coal, Australia’s exports totalled 143 Mtce in 2010, putting thecountry in a leading position in inter-regional world trade with over 50% of the market.Exports go mainly to the Asia-Pacific region, including Japan, Korea, China, and India,though some coal is exported elsewhere (for example, 22 Mtce were shipped to OECDEurope in 2008). In the case of steam coal, Australia is less dominant, with exports of140 Mtce in 2010 – around one-fifth of world steam coal trade. Nonetheless, Australia’sexports of steam coal have nearly doubled since 2000 and (unlike coking coal) continuedgrowing strongly even during the recent global economic downturn, expanding bysome 18% between 2008 and 2009. Despite being the world’s second-largest steamcoal exporter behind Indonesia, Australia’s volumes meet only 3% of global steam coaldemand, since the majority of global steam coal continues to be consumed relativelyclose to where it is produced, and only a small portion is internationally traded. The mainexport destination for Australia’s steam coal is Japan, which accounted for more than 60%of purchases in 2009. However, sales to other Asian markets, especially China and India,have grown rapidly, more than 40% in 2009 over 2008.
Outlook
Growth in coal use early in the projection period, especially in non-OECD countries, is expectedto create significant opportunities for additional Australian exports of both coking and steamcoal. Demand from India, where coking coal resources are limited, and China is expected toremain strong. Beyond 2015, the outlook for continuing growth in exports depends highly onthe long-term prospects for global coal demand. In the New Policies Scenario, Australia’s coalproduction is projected to increase to a peak of about 390 Mtce around 2020, before slightlydeclining to just under 380Mtce in 2035 (Figure 11.24). Exports follow a similar trend, peakingat just over 310Mtce around 2020, before falling to 300Mtce in 2035.
Prospects for Australian coal exports are uncertain in the long term, hinging particularlyon demand and supply trends in China and India. There is considerable uncertaintysurrounding the extent to which both countries will moderate their coal demand growththrough greater energy efficiency and diversifying fuel use in their power sector. Similarlythere is uncertainty about how far their domestic coal industries will be able to keep pacewith demand and the extent to which coal imports will become a structural feature of
© O
EC
D/IE
A, 2
011

Chapter 11 - Coal supply and investment prospects 439
11
their markets. Additionally, over the past few years, Chinese and Indian companies havebeen making large-scale investments in existing or new coal mining operations in Australia,pointing to a likely continued strong participation of their economies in the internationalcoal trademarket. India looks amore likely market for increasing Australian imports of bothcoking and steam coal, especially given transport issues in the south of the country; butChina may be less certain. Australia’s coal exports to European countries seem likely to fall,as the impact of carbon pricing, and renewable and energy efficiencymandates takes effect,though early closures of nuclear plants may slow this decline.
Figure 11.24 ! Coal production in Australia in the New Policies Scenario
0%
10%
20%
30%
40%
50%
60%
70%
80%
0
50
100
150
200
250
300
350
400
1990 2000 2009 2015 2020 2025 2030 2035
Mtce Net exports: steam coal
Net exports: coking coal
Total demand
Coking coal exports as shareof world coking coal trade(right axis)
Steam coal exports as shareof world steam coal trade(right axis)
South Africa
Coal has been the cornerstone of the South African economy, providing it with revenues,employment, low-cost electricity and liquid fuels for decades. However, growing concernsabout greenhouse-gas emissions from coal use, if translated into firm action, will curb thegrowth in demand and, therefore, the need to expand production capacity. South Africahas not yet finalised its climate changemitigation policy, but it has pledged to cut emissionsbelow a business-as-usual baseline. In addition, bottlenecks in rail transportation are likelyto continue to constrain export sales.
South Africa’s coal reserves amount to 28 billion tonnes, equal to about 4% of the worldtotal: no data are available on resources (BGR, 2010). Some 96% of reserves are bituminouscoal, 2% anthracite and the balance coking coal. Total reserves are equal to around 110 yearsof production levels in 2009. There are no significant brown coal resources. The bulk of thereserves and the mines are in the Central Basin, which includes the Witbank, Highveld andErmelo coal-fields. Other coal reserves in the Limpopo Province are also being explored, witha focus on coking coal.
A large proportion of the steam coal for export and domestic markets is produced fromeight mega-mines, each of which produce more than 12 Mtce per year; seven of themare in the Central Basin. Five companies – Anglo-American, Exxaro, Sasol, BHP Billiton andXstrata – account for about 80% of total South African coal production. Production costs
© O
EC
D/IE
A, 2
011

440 World Energy Outlook 2011 - OUTLOOK FOR COAL MARKETS
are on the low side, on average, as most coal seams are thick and close to the surface; aquarter of South Africa’s bituminous coal is between 15 to 50 metres below the surface andmuch of the remainder between 50 to 200 metres (Eberhard, 2011). Consequently, roughlyhalf of production comes from opencast mines. Labour productivity is low by internationalstandards, but this factor is outweighed by low wages. Ash content is generally high andsulphur content is typically between 0.6% and 0.7%. Export-grade coal generally requireswashing to reduce ash content below15%. Average heating values are declining, as the betterquality reserves in the Central Basin are depleted. Steam coal used for domestic power andsynfuel production havemuch lower calorific values, and higher ash content and are suppliedmostly from screened run-of-mine production (although about a third of the coal supplied forelectricity production derives from themiddlings fraction from coal washing).
The Central Basin has been producing coal for many decades and, with the best seams nowdepleted, production is expected to reach a peakwithin the next few years and then begin todecline. This decline is likely to be offset by higher production from the northernWaterbergcoal-field, though significant investment in mining, processing and transport infrastructurewill be needed.
The main constraint on raising production for domestic uses and, especially, for export isthe country’s ageing rail infrastructure. Almost all exported coal is transported by rail alonga dedicated 580 km line from the Central Basin coal-fields to the Richards Bay terminal onthe east coast. The line is owned and operated by the state-owned rail monopoly, Transnet.The line is fully utilised, though more efficient loading operations could, in principle,raise capacity. Even so, any significant increase in supply from the Waterberg field wouldrequire the construction of a new line close to 500 km in length, to link up with the existingCentral Basin-Richards Bay line. The existing Transnet freight network is capable of movingonly small quantities of Waterberg coal. As a result of these constraints, the Richards Bayterminal, which can handle up to 91 Mt per year following an expansion in 2010, has beenoperating at well below capacity. Coal exports through Richards Bay peaked at 69 Mt in2005, but declined to 63 Mt in 2010 – less than 70% of capacity. Transnet has targeted anincrease in deliveries to 70 Mt in 2011. As a result of the constraints, South Africa’s globalranking as a coal exporter has declined, from second behind Australia in 2000 to fifth in2009, overtaken by Indonesia, Russia and Colombia.
In the longer term, South African coal production will be driven primarily by domesticdemand for coal for power generation. This will hinge on the type of capacity that will bebuilt by Eskom – the national power utility – to meet soaring electricity demand. Eskomrecently restarted three coal plants that had been shut for a decade, and two new plantsare under construction. In 2009, electricity generated from coal represented 94% of SouthAfrica’s total power output. In the New Policies Scenario, coal is projected to continue toplay a dominant role in the power generation mix, but its share gradually declines to makeway for new investments in natural gas-fired plants, nuclear power and renewables. Coalproduction is projected to rise to a peak of around 230 Mtce around 2020 and then fallsback to 210 Mtce by 2035 (Figure 11.25). As the projected growth in demand exceeds thatof supply, South Africa’s coal exports gradually decline to around 55 Mtce in 2035 from65Mtce in 2009.
© O
EC
D/IE
A, 2
011

Chapter 11 - Coal supply and investment prospects 441
11
Figure 11.25 ! Coal production in South Africa in the New Policies Scenario
0%
10%
20%
30%
40%
50%
0
50
100
150
200
250
1990 2000 2009 2015 2020 2025 2030 2035
Mtce Net exports
Demand
Net exports as shareof total produchon(right axis)
Steam coal exports asshare of world steamcoal trade (right axis)
Russia
Russia’s coal resources stood at 3.9 trillion tonnes, end-2009, ranking it third in theworld after the United States and China (BGR, 2010). Hard coal accounts for abouttwo-thirds and over 40% (70 billion tonnes) of Russia’s resources and reserves,respectively. Increased export demand has driven a steady increase in Russia’s coalproduction over the past decade and the country is now the world’s third-largest coalexporter. The main export market has been the European Union, which absorbs around60% of Russia’s exports, but there are signs that the focus for future exports may beswitching to the Pacific market – to China in particular (see Chapter 8 for a broaderanalysis of the outlook for Russian coal supply).
The Russian Energy Strategy contains some ambitious targets for increases in coalproduction over the coming decades, with output targets of between 315 and 375 Mtceby 2030. Our projections are more conservative, as transport costs put a limitation on theability of Russian coal to compete in the export market and internal demand is graduallyreduced by improved efficiency. In the New Policies Scenario, coal production rises from220 Mtce in 2009 to around 265 Mtce by the early 2020s, and then slowly declines to justbelow 250 Mtce in 2035. Domestic demand for coal is fairly stagnant over the second-halfof the projection period and exports, after an initial increase to around 100 Mtce by 2020,start to dwindle back to 2009 levels of around 80 Mtce, as global coal trade levels out andRussian coal struggles to compete with other lower cost exporters.
Rest of the world
The countries covered in detail above accounted for almost 90% of world coal productionin 2010, based on preliminary data. Around 40% of the remaining production comes fromOECD Europe. Production there has been in steady decline for many years, with cuts insubsidies and the closure of high-cost mines. At 240 Mtce in 2010, production was about40% of its 1980 level and 25% lower than in 2000. In 2010, the two key main producerswere Poland and Germany, which together accounted for 60% of the region’s total
© O
EC
D/IE
A, 2
011

442 World Energy Outlook 2011 - OUTLOOK FOR COAL MARKETS
coal output. Some European coal producers continue to subsidise their production forsocial and energy-security reasons, though EU rules on state-aid require subsidies to bephased out by 2018. Turkey also plans to phase out its coal subsidies. The biggest drop inproduction is expected to occur in Germany, where a deal negotiated in 2007 provides forall subsidies to current production to be phased out by 2018, which will result in most hardcoal mines being closed (brown coal mines are generally profitable). Mining operations insome countries – notably Poland and the United Kingdom – are already cost-competitivewith imported coal or close to being so. In total, OECD Europe coal production is projectedto fall to around 190 Mtce in 2020 and 120 Mtce in 2035 – almost one-half of outputin 2009.
Colombia is currently the fifth-largest coal exporter worldwide, but has the potential tobecome an evenmore important player. Even though coal deposits are plentiful andminingcosts are generally low, exports of around 60 Mtce have remained significantly below theirmaximum potential during recent years, due to limitations in port capacity. Coal productionis mostly controlled by large, vertically-integrated global mining companies which ownproduction, rail and port capacity. Alongside South Africa, Colombia has been the dominantsupplier in the Atlantic Basin, exporting mostly steam coal to US and European powergenerators. In the first half of 2010, Colombia exported around 6 Mtce to southeast Asia,due to strong demand and favourable freight rates; but Colombia is not at present in ancompetitive position to serve the growing Asianmarkets. The eastern route to Chinese portsis almost double the length of the route South African coal shipments have to traverse. ThePacific route is 4 500 miles shorter but, even disregarding high transit fees, the PanamaCanal has been a bottleneck. In the New Policies Scenario, Colombian coal exports sharplyincrease from about 60 Mtce in 2009 to 85 Mtce in 2015 (Figure 11.26). This increase isdriven by comparatively low mining costs, strong private investment in mining and exportinfrastructure and governmental interventions further to expand coal exports. Additionally,Colombia’s transport disadvantage to supply Asian coal demand is expected to diminish:the expansion of the Panama Canal is projected to be completed by 2014. This will allowbulk carriers up to double the maximum current size to pass through the canal, allowingcoal to be shipped westwards at significantly lower cost. Also, China and Colombia agreedin February 2011 to build a 220 km railway line to allow goods, including coal, to be movedfrom the Colombian port city of Cartagena to the Pacific Ocean, providing an alternativeoutlet for coal shipments. In the second-half of the New Policies Scenario, export growthsaturates in line with developments in global demand and by 2035 Colombia’s exports arejust below 100Mtce.
Venezuela is the other significant coal producer in Latin America. There are two majormining operations:MinaNorte and PasoDiablo. The Venezuelanminingminister announcedin 2009 that the concessions granted forMinaNorte (which expires in 2011) and Paso Diablo(which expires in 2013) will not be renewed. Granting of new concessions has beensuspended for environmental and political reasons, and the government will henceforthwork under operating contracts or joint ventures between the state and private partners.Production is not projected to increase substantially in the New Policies Scenario, unlessthere is a significant shift in policy and investment is stepped up.
© O
EC
D/IE
A, 2
011

Chapter 11 - Coal supply and investment prospects 443
11
Figure 11.26 ! Hard coal net exports from selected smaller exportersin the New Policies Scenario
0%
5%
10%
15%
20%
25%
0
50
100
150
200
250
1990 2000 2009 2015 2020 2025 2030 2035
Mtce Vietnam
Venezuela
Canada
Mozambique andrest of Africa
Mongolia
Colombia
Combined share inworld hard coal trade(right axis)
Mongolia has seen rapid growth in its brown and coking coal industry, with productionincreasing more than seven-fold since 2000, to almost 20 Mtce in 2010 (based onpreliminary estimates). Production rose sharply, by 9 Mtce, in 2010 alone. The country haslarge resources and, given its close proximity to strong Chinese demand, it could furtherincrease production, both for export and tomeet growing domestic needs,mainly for powergeneration. The government has indicated that exports to China could reach 50Mt by 2015,but such an expansion hinges on large investments in developing new mines and buildingtransportation infrastructure. Access to water, which is scarce in areas where the bulk ofresources are located, could be a major constraint. By 2035 Mongolian, coal productionis projected to reach 50 Mtce. Mongolia together, with Mozambique, become two newimportant suppliers of coal (especially coking coal) to the international market.
Mozambique is a promising new player in international hard coal trade. Generally,Mozambique, which enjoys favourable geology, is expected to produce relatively low costcoal, of high quality (particularly coking coal). Three projects Benga, Moatize and Zambeze,all located near Tete in the northwest of the country, are currently being developed. Firstcoal deliveries from the Benga and Moatize opencast mines are already scheduled for2011/2012. These two projects together are planned to reach a capacity of more than30Mt/yearwhen fully operational. Coal will be transported via the 665 km long Sena railwayline, which links the Tete coal fields to the port of Beira. This port is currently expandedto handle 6 Mt/year and the government is planning a new terminal at Beira that shouldbe able to handle between 18 Mt/year to 24 Mt/year. From a freight cost perspective,Mozambique is ideally located to serve coal demand in both, the Atlantic and Pacific Basinmarkets, (especially India). With new operations reaching full capacity over the comingdecade,Mozambique’s coal exports increase steeply until 2020 in theNewPolicies Scenario.With the projected slow-down in global coking coal demand thereafter, Mozambique’sexports grow at a lower rate in the longer run. Yet, Mozambique’s export and productiongrowth rates remain among the highest in the world.
© O
EC
D/IE
A, 2
011

© O
EC
D/IE
A, 2
011

PREFACE
Part D deals with three disparate issues, each of major significance.
Nuclear energy is going through a new period of reappraisal. Though the assumptionsembedded in the main scenarios of WEO-2011 already allow for declared revisions ofgovernment policy in the wake of the accident at Japan’s Fukushima Daiichi nuclearpower plant, it pays to consider the implications if there were to be a much moresevere cut in the nuclear component of energy supply. That is the focus of Chapter12. It examines in detail what a smaller role for nuclear power would mean, includingthe implications for achieving the 450 Scenario, which depends on nuclear energy as acomponent of low-carbon electricity generation.
Chapter 13 develops further an ongoing theme of theWEO since 2002 – bringingmodernenergy to all the world’s people, in terms of their access to electricity and moderncooking facilities. Starting from what is already being done, the chapter evaluates thescale of the remaining challenge, on the basis of the projections of the New PoliciesScenario, and the cost of achieving universal access by 2030. It then concentrates onmatching the investment needs of different aspects of the problem to the actual andpotential funding sources.
Chapter 14 looks at an entirely different aspect of energy funding – subsidies to fossilfuels and renewables. The sums are much greater than those needed to alleviate energypoverty, outlined in Chapter 13. Subsidies to fossil fuels often fail to meet their statedpurpose or could be applied much more effectively in different ways and there is a G-20commitment to phase out inefficient fossil fuel subsidies. So the chapter examineswhat is happening and how subsidy reform might best be implemented. Financingrenewable energy development is seen in a different light. Subsidies in this sector existto overcome technological and market barriers, with a view to their eventual phase-outas the technology becomes established in the market. The extent of this support and itsprospective evolution is measured.
PART DSPECIAL TOPICS
© O
EC
D/IE
A, 2
011

© O
EC
D/IE
A, 2
011

Chapter 12 - The implications of less nuclear power 447
CHAPTER 12
H I G H L I G H T S
THE IMPLICATIONS OF LESS NUCLEAR POWER
How would it affect energy marketsand climate trends?
" The Low Nuclear Case examines the implications for global energy balances of a muchsmaller role for nuclear power. The lower nuclear component of electricity supply is nota forecast, post Fukushima, but an assumption adopted for the purpose of illustrating aglobal energy outlook in such a low nuclear world.
" In the Low Nuclear Case, the total amount of nuclear power capacity falls from393GWat the endof 2010 to 335GW in2035, just over half the level in theNewPoliciesScenario. The share of nuclear power in total generation drops from13% in 2010 to just7% in 2035, with implications for energy security, diversity of the fuel mix, spending onenergy imports and energy-related CO2 emissions.
" In 2035, coal demand increases by 290Mtce comparedwith the New Policies Scenario,over twice the level of Australia’s current steam coal exports. The increase in gasdemand of 130 bcm is equal to two-thirds of Russia’s natural gas exports in 2010. Theincrease in renewables-based generationof about 550TWh is equal to almost five-timesthe current generation from renewables in Germany.
" Energy import bills rise as higher coal and natural gas imports drive up internationalenergy prices. In 2035, net-importing regions collectively spend an additional$90 billion, or 12%, on gas and coal imports over the New Policies Scenario.Energy-related CO2 emissions rise with increased use of fossil fuels in the power sector,ending up some 2.6% (0.9 Gt) higher in 2035 than in the New Policies Scenario.
" These aggregate numbers mask more significant impacts in countries with limitedindigenous energy resources that were projected to rely relatively heavily on nuclearpower, such as Belgium, France, Japan and Korea. Similarly, such a slowdown in thegrowth of nuclear power would make it more challenging for emerging economies,particularly China and India, to satisfy their rapidly growing electricity demand.
" The Low Nuclear 450 Case, a variant of the 450 Scenario, draws a plausible trajectorywhich achieves the climate goal of limiting temperature increase to 2°C with alower nuclear component. Additional investment needs in 2011 to 2035 increase by$1.5 trillion (or 10%), with renewables in particular being called upon to make a largercontribution to abating CO2 emissions. Following this trajectorywould dependonheroicachievements in the deployment of emerging low-carbon technologies, which have yetto be proven. Countries that rely heavily on nuclear power would find it particularlychallenging and significantlymore costly tomeet their targeted levels of emissions.
© O
EC
D/IE
A, 2
011

448 World Energy Outlook 2011 - SPECIAL TOPICS
Why the Low Nuclear Case?The devastating earthquake and resulting tsunami that struck Japan in March 2011 havedisrupted the country’s energy sector and had repercussions for energy markets aroundthe world. In Japan, many oil refineries as well as oil, gas and electricity distributionnetworks were damaged. Several power plants in the northeast were shut down, whileothers were damaged and could not be restarted quickly. The worst damage occurred atthe Fukushima Daiichi nuclear power plant, located some 200 kilometres (km) northeast ofTokyo (Box 12.1). In the hours and days that followed the earthquake and tsunami, four ofthe plant’s six reactors were severely damaged, resulting in off-site releases of radioactivity.
Apart from the immediate andmedium-term effects on Japan’s ability tomeet its electricityneeds, the incident has raised new doubts about the safety risks associated with nuclearenergy, inevitably raising questions about the future role of nuclear power in the globalenergy mix. Opposition to nuclear power in Japan has increased, casting doubt over theexisting plans to expand nuclear capacity. A few countries have already changed theirpolicies, either abandoning previous steps towards building new nuclear plants, as in Italy,or accelerating or introducing timetables for the phase-out of nuclear plants, as in Germanyand Switzerland. These factors, alongside expectations of lower natural gas prices, haveled us to make a downward revision to the projected growth in nuclear power in the NewPolicies Scenario compared withWEO-2010.
With efforts continuing to make the Fukushima plants safe and to appraise the fullimplications of what occurred when the tsunami struck, any assessment of the long-termconsequences can only be provisional and policy conclusions should be confined only tothe actions necessary in the short term. Nonetheless, the prospects for nuclear powerare inevitably now much more uncertain. Additional countries may act to reduce theirdependence on nuclear power. Investors may demand higher risk premiums on lendingor require stronger guarantees and government incentives, making the financing of newplants more challenging. Tighter safety regulations could push up the cost of new reactorsand necessitate unforeseen investment in the existing fleet. At a minimum, investment innew nuclear capacity may be delayed. Some existing nuclear plants may have a shorteroperating lifespan either as a result of early retirement or increased reluctance on the partof the authorities to grant life extensions. Greater public resistance to nuclear power can beexpected in countries that have been trying to revive dormant nuclear programmes or inthose trying to deploy nuclear power for the first time. These conditions are more likely toarise in OECD countries, where existing plants are concentrated, but theymay also slow theexpansion of capacity in non-OECD countries.
In view of these uncertainties, we have prepared a special case – the Low Nuclear Case– which does not attempt to predict international reactions, but to make them betterinformed by analysing the possible implications for global energy balances of amuch smallerrole for nuclear power than that projected in any of the three scenarios presented in thisOutlook. This chapter looks first at the role of nuclear power in the energymix today. It thenreviews the immediate impact of Fukushima on global energymarkets and on nuclear policyin particular, and considers how recent events may alter the economics of nuclear power.
© O
EC
D/IE
A, 2
011

Chapter 12 - The implications of less nuclear power 449
12
On the basis of a necessarily arbitrary assumption about the extent of the loss of nuclearcapacity, compared to that in the New Policies Scenario, the chapter then presents detailedprojections for the cost of energy, the diversity of the fuel mix and CO2 emissions in the LowNuclear Case, comparedwith theNewPolicies Scenario. The final section considerswhat theLowNuclear Casewouldmean for the trajectory to be followed in order tomeet the climategoal of limiting the average global temperature increase to 2° Celsius, as in our 450 Scenario,making some preliminary comments on its feasibility.
Box 12.1 " The Fukushima Daiichi nuclear power station
On 11 March 2011, a magnitude-9.0 earthquake on the Richter scale – the mostpowerful in Japan’s recorded history – occurred off the country’s northeast coast,triggering a deadly tsunami. There were some 26 000 casualties, and many cities,towns and villages were devastated. All eleven reactors that were operating in thenortheast region shut down as designed. However, themassive tsunami engulfed theFukushima Daiichi nuclear power station, prompting a series of events that led to afailure of three of the plant’s six reactors and a leak of radioactive material.The tsunami flooded the entire Fukushima Daiichi plant – which had already beencut off from the external power grid by the earthquake – destroying the back-upelectricity system that powered pumps to cool the nuclear fuel rods. The reactor coresin three of the units began to overheat and water began to evaporate, increasingpressure and lowering the water level inside the reactor vessels, thereby exposingthe fuel rods and resulting in the production of hydrogen. The hydrogen subsequentlyescaped from the reactors and primary containment vessels where it reacted withoxygen, resulting in explosions that damaged the outer buildings. In a fourth unit thathad been in cold shutdown prior to the earthquake, the cooling system for the spentfuel pool was damaged, also leading to a hydrogen explosion. These events led to off-site releases of radioactivity.Some 78 000 people living within a 20 km radius of the plant were evacuated andthose within 30 km were asked to stay indoors. Radiation levels in the vicinity of theplant soared initially, but then declined. At the time of writing, efforts to cool thecrippled reactors and stem leakages of radioactivematerial were continuing. They arescheduled to be brought to “cold shutdown” by early 2012.
The role of nuclear energy todayThe development of nuclear power began almost 60 years ago with the commissioning ofthe Obninsk Nuclear Power Plant nearMoscow in 1954 (Figure 12.1). This signalled the startof a growth period for the global nuclear industry, with an average of seven reactors beingbuilt annually up to 1965. Construction accelerated in the mid-1960s, reaching a peak of37 construction start-ups in 1968 and 1970, and gained further momentum from the firstoil shock of 1973/1974, as countries sought to reduce dependence on oil-fired power. The
© O
EC
D/IE
A, 2
011

450 World Energy Outlook 2011 - SPECIAL TOPICS
nuclear industry then entered amajor downturn in the late 1970s, triggered by soaring costsand delays, coupledwith safety concerns following the ThreeMile Island accident in 1979 inthe United States. This accident sparked public protest, slowed the regulatory process andled many planned projects to be cancelled or suspended. In 1986, the Chernobyl nuclearpower plant accident in Ukraine – the most serious in the history of the industry – furtherdepressed activity and prompted several countries to impose restrictions on existing or newnuclear power plants.
Figure 12.1 " Nuclear reactor construction starts, 1951-2011
0
50
100
150
200
250
300
350
400
0
5
10
15
20
25
30
35
40
1951 1961 1971 1981 1991 2001 2011*GW
Numbe
rofreacto
rs OECD
Non-OECD
Total capacity(right axis)
Three Mile IslandChernobyl
FukushimaDaiichiFirst oil shock
*Data as of 31 Aug 2011.
Outside Japan and Korea, there was little growth in nuclear capacity in the 1990s due toconcerns about public acceptance and safety, construction delays, higher than expectedconstruction costs at some nuclear plants and a return to lower fossil-fuel prices. However,since the mid-2000s, global nuclear capacity had been on an upward trend, largely becauseof rapid development in China, but also power uprates (a process which enables the poweroutput of a reactor to be increased) and life extensions at existing sites in OECD countries.Construction began on 16 new plants in 2010, the largest number since 1980; all but onewere in non-OECD countries. This renewed interest in nuclear power stemmed fromthe need to cost-effectively satisfy rapidly growing electricity demand in the emergingeconomies, as well as efforts to achieve energy and environmental policy objectives,including mitigating greenhouse-gas emissions and providing a secure, diversified and low-cost electricity supply.
In 2010, nuclear power plants supplied 13% of the world’s electricity, down from a peakof 18% in 1996. At the start of 2011, a total of 30 countries around the world operated441 nuclear reactors, with a gross installed capacity of 393 gigawatts (GW) (374 GW net)– 83% being in OECD countries. Another 17 countries have announced their intention tobuild reactors. New construction is now overwhelmingly centred in non-OECD countries,where 55 of 67 new reactors are being built (Table 12.1). China alone accounts for 63%
© O
EC
D/IE
A, 2
011

Chapter 12 - The implications of less nuclear power 451
12
of the construction starts in 2010, followed by Russia, with 13%. The average age of theworld’s, operating nuclear power plants was 26 years at the end of 2010 and has beensteadily increasing with the slowdown in new construction and as more reactors have beengiven life extensions.1
Table 12.1 " Key nuclear power statistics by region, end-2010
Operationalreactors
Installed grosscapacity(GW)
Averagefleet age(years)
Share of totalgeneration
Reactors underconstruction
OECD 343 326 27 21% 12
United States 104 106 31 19% 1
France 58 66 25 75% 1
Japan 54 49 25 27% 2
Germany 17 21 28 23% 0
Korea 21 19 17 31% 5
Canada 18 13 26 15% 0
United Kingdom 19 11 29 16% 0
Other 52 40 28 24% 3
Non-OECD 98 68 21 4% 55
Russia 32 24 28 15% 11
Ukraine 15 14 22 48% 2
China 13 11 8 2% 28
India 19 5 17 3% 6
Other 19 14 24 9% 8
World 441 393* 26 13% 67
*393 GW of gross capacity is equivalent to 374 GW of net capacity.Sources: International Atomic Energy Agency Power Reactor Information System; IEA databases.
What might cause expansion of nuclear capacityto slow?
Possible changes in policy concerning nuclear power
While the long-term implicationsof FukushimaDaiichi remain veryuncertain, it is clear that thisis a critical point for the industry as many governments are now reassessing their plans for theuse of nuclear power (Table 12.2). Risks associatedwith the safety of nuclear energy have beenbrought to the fore andwithinweeks of the incidentmost countries with nuclear programmeshadannounced comprehensive safety reviewsand somehad temporarily suspendedapprovalsfor new projects. While most of these reviews were continuing at the time of writing, they are
1. The fleet is generally older in OECD regions (average 27 years) than in non-OECD regions (average 21 years) becausethe la"er account for most of the reactors built in recent years.
© O
EC
D/IE
A, 2
011

452 World Energy Outlook 2011 - SPECIAL TOPICS
expected to lead at least to regulatory changes that slow plans for expansion and mandateadditional investment to improve safety at existing plants. Before the safety reviews have beencompleted, some plants, deemed particularly at risk because of concerns about their age orlocation, havebeenclosed.A fewcountries havedecided that theywill completely abandon theuse of nuclear energy. Some countries that were working towards introducing nuclear powerfor the first time, or to revive dormant nuclear programmes, have announced that theywill nolongerdo soor thatplanswill bedelayed.On theotherhand, several countrieshave re-affirmedthe importance of nuclear power in their energy mix, including some that have firm plans tosubstantially increase nuclear capacity in order to meet rising baseload demand or to reducetheir dependence on fossil-fuel imports and use.
Table 12.2 " Recent announcements by selected countries regardingnuclear power
Capacity(GW) Mid-2011
European Union 127 Announced plans to “stress test” all 143 plants in its 27 countries.
United States 106 Continues to support nuclear power while stressing safety as paramount concern.
France 66 Continues to support nuclear power while carrying out European Union stress test and looking toincrease the role of renewables.
Japan* 46 Announced a review of the existing plan for nuclear power to account for 53% of electricity outputby 2030.
Russia 24 Affirmed plan to double nuclear capacity by 2020; undertaking comprehensive safety review.
Korea 19 Affirmed plan to continue expansion of the nuclear industry and to conduct safety checks.
Germany** 13Immediately shut reactors operational before 1980 and announced that all other reactors wouldbe closed by 2022, effectively reversing a decision taken in 2010 to delay a previous phase-out planagreed in 2001.
China 12 Temporarily suspended approval of new nuclear reactors, but affirmed 12th Five-Year Plan targetto start construction of an additional 40 GW of nuclear capacity in 2011 to 2015.
United Kingdom 11 Affirmed commitment to nuclear power by announcing plans to build eight new reactors by 2025.
India 5 Affirmed plans to boost nuclear capacity to 63 GW by 2032 and to review safety.
Czech Republic 4 Affirmed plans to build two new units at its Temelin nuclear power station.
Switzerland 3 Announced plans to close its five nuclear reactors by 2034.
Turkey 0 Affirmed no change to plans to commission the first of four planned reactors of 1.2-GW by 2018.
Italy 0 A referendum in June 2011 imposed a permanent ban on the reintroduction of a nuclear powerprogramme.
Poland 0 Affirmed plans to commission its first reactor by 2020.
Indonesia, Thailand 0 Delayed, or is considering delaying, their first nuclear power plant projects until after 2020.
Saudi Arabia, UAE,Vietnam
0 Each affirmed no change to plans to build their first nuclear power plants.
*Incorporates the permanent shutdown of Fukushima Daiichi units 1-4. **Incorporates 9 GW of capacity closed in thefirst half of 2011.
© O
EC
D/IE
A, 2
011

Chapter 12 - The implications of less nuclear power 453
12
How did Fukushima Daiichi impact Japaneseand global energy markets ?
The devastating earthquake and resulting tsunami that struck Japan in March2011 led to the Fukushima Daiichi accident and resulted in the immediate loss of9.7 GW of nuclear capacity, which was automatically shut down. It also led to thetemporary loss of 12 GW of coal-, gas- and oil-fired capacity. In total, this amountedto about 8% of the country’s total power production capacity. In early-May 2011,the 3.6 GW Hamaoka nuclear power plant was also temporarily shut down, untilsafety measures could be implemented to protect the plant from tsunamis andearthquakes. Efforts to bring the remaining plants (other than the Fukushima Daiichiunits 1-4, which are permanently shutdown) back online are continuing.The shortfall in baseload nuclear power capacity necessitated additional oil- andgas-fired generation, which increased Japan’s short-term reliance on fossil-fuelimports. The incremental demand for oil in Japan’s power sector in 2011 isestimated to be 230 thousand barrels per day, while demand for liquefied naturalgas (LNG) is expected to rise by 10 billion cubic metres (bcm).The need for additional imports into Japan has been limited, since many factoriesand other parts of the infrastructure were out of operation following theearthquake and tsunami, thus removing a significant portion of energy demand. Thescarce availability of spare coal-, oil- and gas-fired capacity was a constraint and theauthorities stepped up efforts to encourage energy conservation and, in some cases,rationed supplies to cope with shortages. Businesses and households in certainregions have been encouraged to cut electricity consumption by as much as 15% inorder to reduce the strain on power grids.The impact on global oil and gas was limited, as the volumes involved were not largerelative to global supplies: the increase in Japanese imports equalled only about0.2% of global oil supply, and 0.4% of natural gas supply. International oil, gas andcoal prices increased in the immediate aftermath of the incident, but fell back later.FukushimaDaiichi no doubt contributed to this upward pressure on energy prices, butother factors – including strong demand growth in emerging economies and supplyproblems, notably the loss of Libyan oil production – played a more major role.
In Japan, Fukushima Daiichi has thrown the long-term role of nuclear power into doubt.In 2010, Japan was the world’s third-largest producer of electricity by nuclear power andthe government had ambitious plans to expand the nuclear component of the country’senergy mix. The pre-crisis official target calls for nuclear to provide 53% of the country’stotal power supply by 2030 (up from about 27% in 2009) and, before Fukushima, planswerein place to construct nine new reactors by 2020 and another five by 2030. Public resistancehas now hardened against these plans and the government has announced that it willrevise them. It has announced immediate measures to boost nuclear safety and plans toundertake a stringent safety assessment at each reactor to check its capacity to withstandextreme natural events. Only 11 of Japan’s 54 nuclear reactors were in operation as of mid-
S P O T L I G H T
© O
EC
D/IE
A, 2
011

454 World Energy Outlook 2011 - SPECIAL TOPICS
September 2011. All reactors are required to be shut down at least once every thirteenmonths for regular safety inspections and there is a risk that the number online could fallfurther if delays occur. The government has indicated that its long-term plans may includedeploying more renewable energy, stepping up measures to improve energy efficiency andto encourage cleaner use of fossil fuels.
Outside Japan, the most significant impact of Fukushima Daiichi has been in Germany,where 17 reactors were operating in 2010 with a total gross capacity of 21 GW, whichprovided 23% of the country’s electricity. Within days of the accident, the governmentordered the suspension of operations at seven of its older nuclear plants, removing 7 GWof capacity and it was also decided that another older plant, which had already been shutdown, should not be re-started. There followed a decision in May 2011 to completelyabandon nuclear power, in a step-by-step process that is to culminate in 2022, reversing adecision taken in 2010 to deploy a previous phase-out programme. This makes Germanythe largest user of nuclear power to discontinue its use and close reactors before the endof their economic life.
Responses in other countries have varied. Switzerland has announced its intention tophase out nuclear power by 2034. In Italy, a referendum in June 2011 resulted in therejection of a proposal to lift the indefinite ban on nuclear power. And Thailand hasannounced a three-year delay in plans to commission its first reactor, which is now dueto come online by 2023.
Elsewhere, several countries, while announcing plans to review safety regulations that maydelay the introduction or expansion of new capacity, have also re-affirmed their overallcommitment to nuclear power:
! In theUnited States, theworld’s biggest nuclear power producer, the Nuclear RegulatoryCommission has launched a comprehensive review of the country’s nuclear facilities toidentify lessons that need to be applied as a result of the accident in Japan. The first partof the safety review, aimed at identifying immediate changes needed to maintain safetyduring emergencies such as earthquakes, hurricanes or power outages, was completed inJune 2011. The second part will examine other changes that may be needed.
! The European Union decided in March 2011 to conduct stress tests on all of its143 reactors. The tests will cover “extraordinary triggering events, like earthquakesand flooding, and the consequences of any other initiating events potentially leadingto multiple losses of safety functions requiring severe accident management.” Theresults of the stress tests are expected in 2012, when individual member stateswill have to decide how to respond should any reactors fail the tests. It is expectedthat any such reactors will be shut down and decommissioned if upgrades prove tobe technically or economically impracticable. The European Union has also askedneighbouring countries to commit to implementing the same stress tests on their ownnuclear plants.
! In France, the world’s second-largest nuclear-power producing country (and the mostnuclear dependent country with from 75% to 80% of its power generation from nuclear),the Nuclear Safety Authority has been charged with carrying out safety assessments of
© O
EC
D/IE
A, 2
011

Chapter 12 - The implications of less nuclear power 455
12
the country’s 58 reactors. The government has confirmed its intention to increase theshare of renewables in the electricity generation mix. In July 2011, EdF announced thatits Generation III European Pressurised Reactor (EPR), being built in Flamanville, wouldbe delayed by two years, stemming in part from the need to carry out new safety tests.
! In the United Kingdom, an interim report by the country’s chief inspector of nuclearinstallations concluded that there is no need to alter the operation of its nuclear plants orchange plans for adding new capacity. The final report will be published in third-quarter2011. In June 2011, the government announced a list of eight sites deemed suitable fornew nuclear plants to be built by 2025.
! Russia has announced that it will not be altering its nuclear power expansion plans whileinstructing Rosatom, the state-owned nuclear corporation, to review nuclear plant safety(see Chapter 8 for our projections for nuclear power in Russia).
! China, which has the world’s most ambitious nuclear expansion plans, with 28 reactorsunder construction in 2010, initially froze approvals of new projects and ordered safetychecks on existing plants and those under construction. In June 2011, all of China’soperating nuclear reactors were reported to have passed their safety inspections.
! India, which is actively promoting the role of nuclear power in meeting its growingelectricity demand, has ordered emergency safety checks to be carried out on all nuclearplants. India has signalled that therewill be no change to its target of quadrupling nuclearcapacity to 20 GW by 2020 and reaching 63 GW of installed capacity by 2032.
Possible changes to the economics of nuclear power
Electricity utilities choose between various types of plants – nuclear reactors, fossil-fuelthermal power stations and renewable energy technologies – on the basis of the relativelifetime costs at which they can generate electricity, evaluating this within their particularportfolio of plants and taking into account relative risks. In general, the factors that influencethe lifetime costs include the required level of investment, financing costs, construction times,expected utilisation rates, operational flexibilities, fuel costs, penalties for CO2 emissions andthe cost for plant decommissioning. The cost of generating electricity fromnewly built powerplants varies significantly across countries and regions according to the characteristics ofeach market. Relative costs among the different technologies tend to fluctuate over time.Worldwide, no single technology currently holds a consistent economic advantage:
! Nuclear plants are characterised by very large up-front investments, technical complexity,and significant technical, market and regulatory risks, but have very low operating costsand can deliver large amounts of baseload electricity while producing almost no CO2emissions. Typical construction times are between five and eight years from first concretepoured.
! Coal-fired plants have moderate capital cost and relatively low operating costs as coalis typically cheaper on an energy equivalent basis, compared to other fossil fuels. Thecompetitiveness of coal plants is quickly reduced if a price on carbon is in place and startsrising (see Chapter 10).
© O
EC
D/IE
A, 2
011
456 World Energy Outlook 2011 - SPECIAL TOPICS
! Gas-fired plants typically have the lowest capital costs, short construction times andhigh operational flexibility; but, unless gas supplies are available at low cost, they havehigh operating costs. Gas plants have the lowest CO2 emissions of all fossil-fuel basedtechnologies, typically half of those of coal-fired plants.
! The competitiveness of various renewables-based electricity generating technologiestypically depends on favourable local conditions, e.g.wind or solar availability, and policysupport. Certain technologies often have low load factors, which mean less electricity isgenerated from a given capacity. Rising fossil-fuel and CO2 prices, technological advancesand economies of scale with wider deployment are expected tomake renewables-basedsystems increasingly cost-competitive in coming decades.
Post-Fukushima Daiichi, the relative economics of nuclear power compared with othergenerating technologiesmay deteriorate. Finance providersmay demand tougher financingconditions, driving up the cost of capital, and some may decide to discontinue investing innuclear projects altogether. More stringent safety regulations may lengthen lead times forconstruction and increase construction and operating costs, as could more vigorous actionby opponents of nuclear power.
In the New Policies Scenario, overnight costs of new nuclear power plants in OECDcountries range from $3 500 to $4 600 per kilowatt of capacity.2 The wide range in costsreflects the importance of local conditions, including the structure of the industry. At thelower end of these estimates, the overnight cost is almost five-times that of building anatural gas plant. Moreover, financing costs, which are not included in overnight costs,account for a significant share (sometimes as much as half) of the total cost of building anuclear plant. Financiers of nuclear plants demand interest rates sufficient to compensatefor the risk that the utility may not be able to repay loans in full, because of delays inconstruction, abandonment of the project prior to completion or political or regulatoryfactors that lead to higher costs or early closure. The cost of financing is often significantlylower in emerging economies, as plants are usually built by publicly-owned utilities withaccess to cheap government-backed finance. Such projects are usually centrally planned,which may further reduce construction and operating risks. This is the case in China. Inthe United States, the federal government recently offered loan guarantees for two newreactors at Georgia Power’s Vogtle Plant.
The cost of building a nuclear power plant is sensitive to the construction time: the longerthe project takes to complete, the longer interest payments accrue without any offsettingpositive cash flow. The two evolutionary power reactors (EPRs) currently being built atTaishan in China are expected to take around four years to build. By comparison, theFlamanville reactor in France is expected to take some eight years. Construction delays,which are common in newnuclear programmes orwhen building non-standard designs, cangreatly increase costs. In liberalised markets, it may not always be possible to recoup thecost increases through higher tariffs.
2. The overnight cost is the cost thatwould be incurred if the plant could be built “overnight”, so excludes any financing costs.
© O
EC
D/IE
A, 2
011

Chapter 12 - The implications of less nuclear power 457
12
Our projections of future nuclear power plant construction are based primarily onassumptions about the capital costs of new plants and the cost of capital. Electricitygenerating costs are particularly sensitive to changes to these key parameters. Forexample, relative to a base case nuclear plant that generates electricity at a LRMC of$66/MWh, increasing the overnight capital cost by $1 000/kW, would push up the LRMC by24% (Figure 12.2). Similarly, an increase of two percentage points in the cost of capitalwould push up the LRMC by 19%. Cost increases of such amagnitude could certainly switchinvestment to other forms of electricity generation, especially in liberalised markets.
Figure 12.2 " Sensitivity of long-run marginal cost of nuclear generationto various parameters
-30% -20% -10% 0% 10% 20% 30%
Economic life]me40 years : ±5 years
Fuel cost$10/MWh : ±$2/MWh
Construc]on ]me6 years : ±2 years
Capacity factor85% : ±10%
Cost of capital7% : ±2%
Overnight cost$3 500/kW : ±$1000/kW
Change in LRMC rela]ve to base case
Base case LRMC $66/MWh
Source: IEA analysis.
Lifetime extensions often provide a means of maintaining nuclear power capacity atrelatively low cost. When first built, most of today’s nuclear power plants were expectedto operate for between 25 and 40 years. However, licence renewals to extend operatinglifetimes have become commonplace. For example, of the 104 reactors in the UnitedStates, 66 have had their operating lives extended from the original 40 years to 60 years(WNA, 2011). In France, three of the country’s reactors have received lifetime extensionsover the last decade, from 30 to 40 years, andmany are now seeking extensions to 50 years.Experience of lifetime extensions in the emerging economies is more limited, as fewerreactors have yet come to the end of their design life. Extending the life of a nuclear plantor modifying it to increase output is usually more economic than building a new facility, asthe upfront capital costs have already been depreciated and output increases can oftenbe achieved at relatively low marginal cost, even though utilities typically have to makesignificant investments to upgrade plant safety and replace worn equipment to securelifetime extensions. In the United States, for example, between 2000 and 2008 nuclearoutput increased 5%, although no new reactors entered service. But such extensions maybecome uneconomic if regulators make them contingent on very stringent conditions.
© O
EC
D/IE
A, 2
011

458 World Energy Outlook 2011 - SPECIAL TOPICS
Implications of the Low Nuclear Case for the globalenergy landscapeIt is still early to arrive at a definite judgment on the extent of any reduction in nuclear powergeneration which might result from Fukushima Daiichi. The Low Nuclear Case attempts tomake no such judgment. Rather, it is intended to illustrate how the global energy landscapewould look with a lower component of nuclear supply. The assumptions about the extentof the lost nuclear capacity are necessarily arbitrary. We have modelled the impact of thefollowing assumptions about nuclear power, keeping all other assumptions the same as inthe New Policies Scenario (Table 12.3):
! In OECD countries, no new reactors are built beyond those already under construction.
! In non-OECD countries, only 50% of the capacity additions projected in the New PoliciesScenario proceed as planned, although all those alreadyunder construction are completed.
! Reactors built prior to 1980 are retired after an average lifetime of 45 years (50 years inthe New Policies Scenario).
! Reactors built from 1980 onwards are retired after a lifetime of 50 years on average(55 years in the New Policies Scenario).
Table 12.3 " Key projections for nuclear power in the New Policies Scenarioand the Low Nuclear Case
Low Nuclear Case New Policies Scenario
OECD Non-OECD World OECD Non-OECD World
Gross installed capacity (GW)in 2010 326 68 393 326 68 393
in 2035 171 164 335 380 252 633
Share in electricity generationin 2010 21% 4% 13% 21% 4% 13%
in 2035 9% 5% 7% 21% 8% 13%
Gross capacity under construction (GW)* 14 54 69 14 54 69
New additions in 2011-2035 (GW)** 6 84 91 111 167 277
Retirements in 2011-2035 (GW) 176 42 218 71 36 107
*At the start of 2011. **Includes new plants and uprates, but excludes capacity currently under construction.
Power sector
In the Low Nuclear Case, the total amount of nuclear power capacity drops from 393 GW in2010 to 335 GW in 2035 – a fall of 15% – as a result of the slower rate of new constructionand a bigger wave of retirements (Figure 12.3). This contrasts with an increase to 633 GWin the New Policies Scenario. In other words, nuclear capacity is little more than half that
© O
EC
D/IE
A, 2
011

Chapter 12 - The implications of less nuclear power 459
12
projected in the New Policies Scenario. The disparity begins to widen just after 2020 andthen accelerates. Consequently, the share of nuclear power in total power generation dropsfrom 13% in 2009 to 12% by 2020 and to 7% by 2035. Capacity grows by 97 GW, or over140%, in non-OECD regions, but this is more than offset by the big fall in OECD regions of155 GW, or almost 50%. Retirements of nuclear power capacity amount to 218 GW overthe Outlook period, equal to 55% of the currently installed capacity. Some 11% of existingnuclear capacity in the OECD is retired by 2020 and over 50% by 2035. The fall in capacity,compared with the New Policies Scenario, results in a corresponding fall in nuclear powergeneration, from around 2 700 terawatt-hours (TWh) in 2009 to around 2 450 TWh in 2035(compared with around 4 660 TWh in the New Policies Scenario).3
Figure 12.3 " Nuclear power capacity in the Low Nuclear Case
0
100
200
300
400
500
600
700
2010 2015 2020 2025 2030 2035
GW
Non-OECD
OECD
Low Nuclear Case
New Policies Scenario
Non-OECD
OECD
The lower level of nuclear generating capacity in the Low Nuclear Case is offset by acorresponding increase in the combined capacity of plants based on coal, natural gas andrenewable energy (Figure 12.4). Globally, in 2035 the share of coal-fired generation reaches36%, compared with 33% in the New Policies Scenario (from 41% in 2009), while that of gasreaches 24% compared with 22% in the New Policies Scenario (and 21% in 2009). Thesefigures reflect the installation of some 80 GW of additional coal-fired electricity generationcapacity and 122 GW of additional gas-fired electricity generation capacity. In keeping withannouncements made by some governments since Fukushima Daiichi, it is assumed thatmore ambitious policies to promote renewables are implemented to offset part of theshortfall in nuclear power. This results in the share of renewables in the generation mixrising to 32% in 2035, compared with 31% in the New Policies Scenario (and 19% in 2009),reflecting the installation of over 260 GW of additional capacity, leading to an increase ofabout 550 TWh of renewables generation. The use of oil remains very small, with littledifference in 2035 compared with the New Policies Scenario.
3. For modelling purposes, we have assumed that global electricity demand is the same as in the New Policies Scenariothroughout theOutlook period. In reality, the increase in electricity prices that would result from a lower share of nuclearpower in the genera!on mix is likely to lead to slightly lower demand.
© O
EC
D/IE
A, 2
011

460 World Energy Outlook 2011 - SPECIAL TOPICS
S P O T L I G H T
Will Fukushima Daiichi affect the industry as severelyas Three Mile Island and Chernobyl?
In considering the long-term implications of Fukushima Daiichi, accidents at ThreeMile Island in 1979 and Chernobyl in 1986 are obvious points of reference. Theseaccidents profoundly affected the trajectory of nuclear power, derailing newbuilds globally over the following decades. New construction starts fell from anaverage of 26 per year in the 1970s to just 7 in the 1980s and 1990s. Will nuclearpower development after Fukushima Daiichi experience a similar slowdown?The downturn for nuclear power following the ThreeMile Island and the Chernobylaccidents can be partly attributed to the two accidents. Low energy pricesthroughout much of the 1980s and 1990s also reduced the financial incentive toaccept the risks of the higher capital investment needed to build nuclear plants,whereas the first oil price shock had provided considerable impetus for thesoaring level of construction in the 1970s. Moreover, the liberalisation of powermarkets in many OECD countries transferred the financial risk associated withenergy sector investment from the public sector to private industry. Given theprevailing market conditions and without government support, utilities generallypreferred lower-risk options (such as coal- and gas-fired plants), which have lowerupfront costs, take less time to build and recover costs more quickly, despite theirhigher unit operating costs.Today, the key drivers and players expected to underpin the growth in nuclearpower are significantly different. Emerging economies, led by China and India,dominate future prospects. They need to utilise all options to meet their rapidlygrowing electricity demand, and there is no indication that they are contemplatingruling out nuclear power. The return of high energy prices and heightenedgeopolitical risks in the Middle East and North Africa may increase the value ofgenerating solutions which are independent of large-scale and continuing fuelimports, provided they are safe. Climate change is also a driving force behindnuclear power development, since it is one of the few mature low-carbontechnologies that can be widely deployed in large increments. Bearing in mind thestringency and comprehensiveness of the nuclear safety regulations and measuresimplemented over the past three decades, it remains to be seen how far newrequirements, post Fukushima, might affect the economics of nuclear generation.Nonetheless, in the aftermath of Fukushima Daiichi, trust in the nuclear industryhas suffered greatly and will take years to re-build. There have now beenthree major nuclear incidents over the past three decades, the latest of whichoccurred in one of the most advanced nuclear nations, albeit that the events atFukushima Daiichi were triggered by the combination of an exceptionally powerfulearthquake and tsunami in a zone exceptionally exposed to such risks.
© O
EC
D/IE
A, 2
011

Chapter 12 - The implications of less nuclear power 461
12
Figure 12.4 " Power generation by fuel in the New Policies Scenarioand Low Nuclear Case
0
2 000
4 000
6 000
8 000
10 000
12 000
14 000
Nuclear Coal Gas Renewables
TWh 2009
2035:New Policies Scenario
2035:Low Nuclear Case
Note: Oil-fired power generation is not shown due to its small share of total output.
Overall investment needs in the power-generation sector increase slightly in the LowNuclear Case, as lower investment in nuclear plants is more than offset by increasedexpenditure on coal-fired, gas-fired and, especially, renewables-based plants. Cumulativeglobal investment in nuclear plants over 2011 to 2035, in real 2010 dollars, falls by about$675 billion (or 60%), compared with the New Policies Scenario, while investment in coal-fired plants increases by about $170 billion (or 10%), gas-fired plants by about $104 billion(or 11%) and in renewables-based capacity by about $500 billion (or 9%). The net increaseis about $110 billion (or 1%).
International fuel markets
With the projected increase in coal- and gas-fired electricity generation in the Low NuclearCase, global demand for both fuels inevitably increases over the Outlook period, comparedwith developments in the New Policies Scenario. Demand for coal increases most, reaching6 150million tonnes of coal equivalent (Mtce) in 2035, or 5% higher than in the New PoliciesScenario. This additional demand is equivalent to over twice Australia’s current steamcoal exports. Natural gas demand in 2035 is 3% higher, reaching almost 4 900 bcm. Theincrease is equivalent to two-thirds of Russia’s natural gas exports in 2010. OECD countries,where nuclear capacity declines the most, are responsible for about a 70% and 60% of theadditional demand for coal and gas, respectively.
Higher demand leads to in greater upward pressure on prices in international markets,especially for natural gas. Coal prices are almost 2% higher in 2035 than in the New PoliciesScenario and gas prices are between 4% and 6% higher, depending on region. These higherfossil-fuel prices put upward pressure on the overall cost of generation and electricityprices increase as a result. Greater coal and natural gas-import requirements and higherinternational energy prices push up spending on imported coal and gas. The additionalspending on imports, relative to the New Policies Scenario, rises over time, as the shareof nuclear power in the generation mix progressively falls. In 2035, aggregated across all
© O
EC
D/IE
A, 2
011

462 World Energy Outlook 2011 - SPECIAL TOPICS
net-importing countries, spending on gas imports is up by around $67 billion, or 11%, whilespending on coal imports is up by around $22 billion, or 17% (Figure 12.5). For countriesthat rely heavily on nuclear power and have limited indigenous energy resources (such asBelgium, France, Japan and Korea), the impact will bemore pronounced than the aggregatenumbers suggest.
Figure 12.5 " Global primary coal and gas demand and annual spendingon imports in the Low Nuclear Case
Spending on coalimports
Spending on gasimports
0
150
300
450
600
750
Billiond
ollars(2010) 2009
2035:New PoliciesScenario
2035:Low NuclearCase
0
1 000
2 000
3 000
4 000
5 000
Coaldemand
Gasdemand
Mtoe
Note: Calculated as the value of net imports at prevailing average international prices.
The additional demand for natural gas and coal in the Low Nuclear Case has importantimplications for energy security. Although the share of generation coming from renewablesincreases, the diversity of the power-generation mix declines. The prospect of a limitednumber of producing regions increasingly dominating global gas supply and trade wouldraise concerns about the risk of supply disruptions as well as the risk that some countriesmight seek to use their dominant market position to force prices even higher.
CO2 emissions
One of the major advantages of nuclear power compared with electricity generated fromfossil fuels is that it does not directly generate emissions of carbon dioxide (CO2) or othergreenhouse gases.4 If the 13%of global electricity production that came fromnuclear powerplants in 2010 had instead been generated equally from natural gas and coal (based oncurrent average efficiency levels) we estimate that global CO2 emissions from the powersector would have been 2.1 gigatonnes (Gt), or 17%, higher.
As a result of the increased use of fossil fuels in the Low Nuclear Case, energy-related CO2emissions are higher than in the New Policies Scenario. At the global level, the increase inenergy-related CO2 emissions is roughly 2.6% in 2035. Cumulative CO2 emissions in the
4. There are some CO2 emissions linked to the use of fossil fuels in the nuclear fuel cycle, such as uranium mining andenrichment, but these are at least an order of magnitude lower than the direct emissions from burning fossil fuels.
© O
EC
D/IE
A, 2
011

Chapter 12 - The implications of less nuclear power 463
12
period 2011 to 2035 are higher by 10.2 Gt, or 1.2%, adding to the rising concentration ofgreenhouse gases in the atmosphere and making it harder and more expensive to combatclimate change. These aggregate numbers mask more dramatic increases in countries thatrely more heavily on nuclear power.
CO2 emissions from power plants reach 15.7 Gt in 2035 in the Low Nuclear Case,0.9 Gt, or 6.2%, higher than in the New Policies Scenario (Figure 12.6). Compared withthe New Policies Scenario, 34% of the increase comes from power plants in non-OECDcountries.
Figure 12.6 " Energy-related CO2 emissions from the power sector in theNew Policies Scenario and the Low Nuclear Case
10
11
12
13
14
15
16
2010 2015 2020 2025 2030 2035
Gt New PoliciesScenario
Low NuclearCase
0.9 Gt
Box 12.2 " Human capital and the nuclear industry
The development, maintenance and growth of a nuclear power programmerequire a well-trained and experienced work force. Consequently, variousstakeholders – including governments, industry, academia and intergovernmentalorganisations – invest significant resources into human resource management anddevelopment.One area of concern in recent years has been a looming shortage of people with thenecessary skills, due to the ongoing retirement ofworkers and the lownumber of newentrants (IEA, 2010). In the United States, the nuclear industry work force numbered120 000 people in 2009; approximately 40% of this work force will be eligible toretire by 2015 and, in order to maintain the current numbers, the industry will needto hire about 25 000 more workers by then (NEI, 2010). In Korea, where the nuclearindustry is expected to expand in the coming decade, the Ministry of KnowledgeEconomy estimates that an additional 23 900 nuclear workers will be neededby 2020.
© O
EC
D/IE
A, 2
011

464 World Energy Outlook 2011 - SPECIAL TOPICS
In order to address the possible skills shortage, governments and industry have takenvarious initiatives to attract students to the nuclear industry, including increasing theavailability of training programmes on nuclear energy, offering financial scholarshipsand providing internship opportunities to university and graduate students. In theUnited States, for example, since 2007 the Nuclear Regulatory Commission, the USDepartment of Energy and Center for Energy Workforce Development have fundedexpansion of nuclear energy degree programmes through the Nuclear UniformCurriculum Program. Between 2003 and 2008, the number of students receiving B.S.and M.S. degrees in the United States increased by 288 (or 173%) and 128 (or 97%)respectively. The trend is expected to continue. Between 2008 and 2009 enrolmentin nuclear engineering programmes increased at both undergraduate and graduatelevels by around 15% and 5% respectively (ORISE, 2010).The large-scale phase-out of nuclear power assumed in the Low Nuclear Case wouldlead to a fewer opportunities to gain practical experience in all phases of the nuclearprogramme. Such experience complements academic training and its absence wouldresult in a deterioration of technical skills. Given the design lifetime of nuclear reactors(typically 40 years) and the expectationof life extensions (typically 20 years), the nuclearwork forcewill need to bemaintained for a long period of time. A combination of publicopposition to nuclear power and policy uncertainty about its future role in the energymix could discourage students from pursuing a career in the nuclear industry and couldresult in a critical shortage.
Meeting the global climate goal with less nuclearpower generation
In the Low Nuclear Case, energy-related CO2 emissions grow faster than in the NewPolicies Scenario, leading to likely global average temperature increases of over 3.5°C.Our 450 Scenario, unlike our other scenarios does not project the outcome of a given setof assumptions. Rather it describes a plausible path to the pre-determined objective ofrealising a future in which government policies transform the energy system in such a wayas to meet the 2°C goal (see Chapter 6). But in that scenario, the role of nuclear power isgreater than in the New Policies Scenario andmuch greater than in the Low Nuclear Case.
If there is less nuclear power in the global energy mix, then other changes are essential ifthe objective of limiting the long-term rise in the global average temperature to 2°C is to beachieved:! The share of renewables needs to be greater even than that projected in our
450 Scenario.! Overall primary energy needs must be reduced further, through even greater
improvements in energy efficiency.! Carbon capture and storage needs to be very widely deployed by 2035.
© O
EC
D/IE
A, 2
011

Chapter 12 - The implications of less nuclear power 465
12
In short, to the extent that energy demand in the 450 Scenario cannot be reduced tooffset any loss of nuclear supply, all the replacement supply must come from low-carbontechnologies, so that there is no net increase in global emissions. This will be extremelychallenging and costly.
The Low Nuclear 450 Case
In order to quantify the implications of less nuclear power being available tomeet the 2°Cgoal,we have analysed another case, called the Low Nuclear 450 Case. Since the trajectory ofenergy-related CO2 emissions in the 450 Scenario is, by definition, the one which must beachieved to realise the climate change objective, energy-related emissions must be held tothat same overall trajectory in the new circumstances. This means that as the 450 Scenariois modified to incorporate the assumptions on nuclear power used in the Low Nuclear Case,much stronger government policy actions have to be imposed in order to cut demand furtherand ensure yet wider deployment of other low-carbon technologies. Comparedwith the NewPolicies Scenario, overall emissions in the Low Nuclear 450 Case are 2.4 Gt, or 7%, lower in2020 and 15Gt, or 41%, lower in 2035 (Figure 12.7). Comparedwith the 450 Scenario, the useof fossil fuels is somewhat higher, but emissions are the same, as the increase in demand forfossil fuels is assumed to come solely from fossil-fuel-based power plants that are equippedwith carbon capture and storage (CCS). Increased reliance on renewables compared with the450 Scenariomakeup thedifference.Overall CO2 emissions broadly follow the same trajectoryas in the450Scenario, however, their geographic distribution is slightly different: emissions areslightly higher in the OECD countries and correspondingly lower in the non-OECD countries.
Figure 12.7 " World energy-related CO2 emissions abatement in the LowNuclear 450 Case relative to the New Policies Scenario
20
22
24
26
28
30
32
34
36
38
Low Nuclear 450 Case
New Policies Scenario
2010 2015 2020 2025 2030 2035
Gt
Total (Gt CO2)
2020 2035
EfficiencyRenewablesBiofuels
CCS
72%21%2%
4%
2.4
42%29%4%
25%
15.0
Abatement
In the Low Nuclear 450 Case, as in the 450 Scenario, energy efficiency measures are thelargest source of emissions abatement, accounting for about 47% of the cumulativeemissions savings over the period 2011 to 2035 and underlining the importance of veryvigorous policy action in this area. The shares of total abatement arising from renewablesin power generation and CCS, are substantially higher than in the 450 Scenario. Renewables
© O
EC
D/IE
A, 2
011

466 World Energy Outlook 2011 - SPECIAL TOPICS
account for 29% of abatement in 2035 – eight percentage points higher than in the450 Scenario – and CCS for 25%, three percentage points higher. The wider deployment ofCCS allows for an 8% increase in primary coal use and a 3% increase in the use of natural gasin 2035, comparedwith the 450 Scenario. Renewable energy use is 9% higher, while nuclearpower production is 63% lower.
In the Low Nuclear 450 Case, the transformation required in the power sector is even moreambitious than in the 450 Scenario, due to the narrower portfolio of abatement options.The share of fossil-fuel-fired power stations in total generation in 2035 drops to just 38%,from 67% in 2009 (Figure 12.8). Total renewables-based capacity reaches 6 000 GW in 2035,over 970 GW, or one-fifth, more than in the 450 Scenario. By 2035, the capacity of plantsequippedwith CCS exceeds 820GW, an increase ofmore than 210GW, or a third,more thanin the 450 Scenario. In practice, it is by nomeans certain that these projections could actuallybe realised, as it is still unclear that low-carbon technologies can be deployed on this scale(the implications formeeting the 2°C climate goal of slower CCS deployment than that in theNew Policies Scenario are discussed in Chapter 6).
Figure 12.8 " Share of world power generation by source in the 450 Scenarioand Low Nuclear 450 Case
0%
10%
20%
30%
40%
50%
60%
Nuclear Coal* Gas* CCS Renewables
2009
2035:450 Scenario
2035:Low Nuclear450 Case
*Excludes plants fitted with carbon capture and storage (CCS).
With reduced abatement coming from nuclear power, the cost of achieving the samecumulative emissions as the 450 Scenario increases by some $1.5 trillion in real 2010 dollars,compared with the 450 Scenario (or 10%) over the period 2011 to 2035 (Figure 12.9).Countries that were expected to rely heavily on nuclear power as a source of CO2abatementwould find the financial (and practical) burden particularly heavy.
Of the additional investment required in the LowNuclear 450 Case, only 10% (or $150 billion)is incurred before 2020, the remaining 90% (or $1.3 trillion) arising over the last fifteen yearsof the projection period, reflecting the profile of fewer additions and additional retirementsof nuclear power plants. The power sector absorbs the vast bulk of the net incrementalinvestment ($1.2 trillion). This figure provides for incremental investment of $2.1 trillionfor generation from renewables, which need greater nameplate generating capacity than
© O
EC
D/IE
A, 2
011

Chapter 12 - The implications of less nuclear power 467
12
other generating options because of variable resource availability (see Chapter 5). The costof the new generating capacity is partially offset by a decrease in incremental investment of$1.3 trillion for generation from nuclear.
Figure 12.9 " Incremental energy-related investment in theLow Nuclear 450 Case relative to the 450 Scenario
2011-2020 2021-2035 2011-2035
Billiond
ollars(2010) Biofuels
Buildings
Transport
Power genera]on
0
200
400
600
800
1 000
1 200
1 400
1 600
© O
EC
D/IE
A, 2
011

© O
EC
D/IE
A, 2
011

Chapter 13 - Energy for all 469
CHAPTER 13
H I G H L I G H T S
ENERGY FOR ALL
Financing access for the poor
" Modern energy services are crucial to human well-being and to a country’s economicdevelopment; and yet over 1.3 billion people are without access to electricity and2.7billionpeople arewithout clean cooking facilities.More than95%of thesepeople areeither in sub-Saharan Africa or developing Asia and 84% are in rural areas.
" In 2009, we estimate that $9.1 billion was invested globally in extending access tomodern energy services, supplying 20 million more people with electricity access and7 million people with advanced biomass cookstoves. In the New Policies Scenario, ourcentral scenario, $296 billion is invested in energy access between 2010 and 2030 –an average of $14 billion per year, 56% higher than the level in 2009. But, this is notnearly enough: it still leaves 1.0 billion people without electricity (more than 60%of this is in sub-Saharan Africa) and, despite progress, population growth means that2.7 billion people will remain without clean cooking facilities in 2030. To provideuniversal modern energy access by 2030, cumulative investment of $1 trillion isrequired – an average of $48 billion per year, more than five-times the level in 2009.
" The$9.1billion invested inextendingenergyaccess in2009was sourced frommultilateralorganisations (34%), domestic government finance (30%), private investors (22%) andbilateral aid (14%). To provide the $48 billion per year required for universal access,we estimate that around $18 billion per year is needed from multilateral and bilateraldevelopment sources, $15billionper year fromthegovernmentsof developing countriesand $15 billion per year from the broad range of actors that form the private sector.
" Private sector investment needs to grow themost, but significant barriers must first beovercome. Public authorities must provide a supportive investment climate, such as byimplementing strong governance and regulatory reforms. The public sector, includingdonors, needs also to use its tools to leverage private sector investment where thecommercial case is marginal. At present, energy access funding tends to be directedprimarily toward large-scale electricity infrastructure. This does not always reach thepoorest households. Access to funding at a local level is essential to support initiativesthat cater effectively for local needs, building local financial and technical capacity andstimulating sectoral development.
" Achieving universal access by 2030would increase global electricity generation by 2.5%.Demand for fossil fuels would grow by 0.8% and CO2 emissions go up by 0.7%, bothfigures being trivial in relation to concerns about energy security or climate change.The prize would be a major contribution to social and economic development, andhelping to avoid the premature death of 1.5 million people per year.
© O
EC
D/IE
A, 2
011

470 World Energy Outlook 2011 - SPECIAL TOPICS
IntroductionEnergy is a critical enabler. Every advanced economy has required secure access to modernsources of energy to underpin its development and growing prosperity. While manydeveloped countries may be focused on domestic energy security or decarbonising theirenergy mix, many other countries are still seeking to secure enough energy to meet basichuman needs. In developing countries, access to affordable and reliable energy services isfundamental to reducing poverty and improving health, increasing productivity, enhancingcompetitiveness and promoting economic growth. Despite the importance of thesematters,billions of people continue to be without basic modern energy services, lacking reliableaccess to either electricity or clean cooking facilities. This situation is expected to changeonly a little by 2030 unless more vigorous action is taken.
Developing countries that import oil are today facing prices in excess of $100 a barrel when, at acomparable stage of economic development, many OECD countries faced an average oil price ofaround$22abarrel (in 2010dollars). In little over adecade, thebill of oil-importing less developedcountries1 hasquadrupled tohit an estimated$100billion in 2011, or 5.5%of their gross domesticproduct (GDP) (Figure 13.1).Oil-import bills in sub-SaharanAfrica increasedby$2.2billion in 2010,more than one-third higher than the increase in Official Development Assistance (ODA) over theyear.2 In contrast, oil exporters in sub-Saharan Africa, such as Nigeria and Angola, are benefittingfrom the oil price boomand tackling energy poverty is, financially at least, within theirmeans.Weestimate that the capital cost of providing modern energy services to all deprived households inthe ten-largest oil and gas exporting countries of sub-SaharanAfrica3would be around $30 billion,equivalent toaround0.7%of thosegovernments’ cumulative take fromoil andgasexports.
Figure 13.1 " Oil-import bills in net-importing less developed countries
0%
1%
2%
3%
4%
5%
6%
0
20
40
60
80
100
120
2000 2005 2010 2011*
Billiond
ollars(2010) Oil-import bill
Oil-import bill asshare of GDP(right axis)
*Estimated, assuming an average oil price of $100 per barrel.Notes: Calculated as the value of net imports at prevailing average international prices. Oil-import bills as a share of GDPare at market exchange rates in 2010 dollars.
1. The group includes India and the oil-impor!ng countries within the United Na!on’s classifica!on of least developedcountries (available at www.unohrlls.org). This group has a combined popula!on of 1.8 billion people and accounts for65% of those lacking access to modern energy.2. Data available from the OECD/DCD-DAC database at www.oecd.org.3. These countries include: Angola, Cameroon, Chad, Democra!c Republic of Congo, Equatorial Guinea, Gabon,Ivory Coast, Mozambique, Nigeria and Sudan.
© O
EC
D/IE
A, 2
011

Chapter 13 - Energy for all 471
13
International concern about the issue of energy access is growing.While the United NationsMillenniumDevelopment Goals4 (MDGs) do not include specific targets in relation to accessto electricity or to clean cooking facilities, the United Nations has declared 2012 to be the“International Year of Sustainable Energy for All”. Other strategic platforms to discuss thelink between energy access, climate change and development include the “Energy for AllConference” in Oslo, Norway in October 2011 and the COP17 in Durban, South Africa inDecember 2011. These issues are also expected to be addressed at the United NationsConference on Sustainable Development (UNCSD) in Rio de Janeiro, Brazil in June 2012. Thatconference will aim to secure renewed political commitment to sustainable development,to assess progress to date and to address new and emerging challenges. It will bring tocentre-stage in the international debate the need to reconcile environment, developmentand poverty eradication issues such as energy access.
The World Energy Outlook (WEO) has focused attention on modern energy access for adecade, providing the international community with quantitative, objective analysis. Thisyear our analysis tackles the critical issue of financing the delivery of universal modernenergy access.5, 6 The chapter begins by providing updated estimates of the number ofpeople lacking access to electricity and clean cooking facilities, by country. It offers, tothe best of our knowledge, for the first time in energy literature, an estimate of the totalamount of investment taking place globally to provide access to modern energy servicesand provides details on the sources of financing. The chapter then examines what levelof modern energy access might be achieved by 2030, in relation to the projections in theNew Policies Scenario, our central scenario, and the level of investment involved (theNew Policies Scenario takes account of both existing government policies and cautiousimplementation of declared policy intentions). While the Outlook period forWEO-2011 is2009 to 2035, analysis in this chapter is based exceptionally on the period 2009 to 2030.This period has been adopted to be consistent with the key goal proposed by the UnitedNations Secretary-General of ensuring universal energy access by 2030 (AGECC, 2010).Since the level of projected investment in the New Policies Scenario is not nearly enoughto achieve universal access to modern energy services by 2030, we then estimate thelevel of additional investment that would be required to meet this goal – as defined inour Energy for All Case.7 The chapter then examines the main sources of financing, andthe types of financing instruments that appear to be the most in need of scaling-up inorder to achieve the Energy for All Case (Figure 13.2). This is derived from a bottom-upanalysis of the most likely technology solutions in each region, given resource availability,and government policies and measures. Throughout, we have drawn on experience fromexisting programmes using different financing and business models to provide modernenergy access.
4. See www.un.org/millenniumgoals for more informa!on.5. This chapter benefi$ed from a workshop held by the IEA in Paris on 13 May 2011, and was presented for the first!me to a mee!ng of government leaders and interna!onal ins!tu!ons hosted by the government of Norway in Oslo on10-11 October 2011.6. Due to the focus of this chapter on financing, some elements of WEO analysis on energy access, such as theEnergy Development Index (EDI), are not included here but have been updated and will be made available online atwww.worldenergyoutlook.org.7. Referred to in WEO-2010 as the Universal Modern Energy Access Case. See Box 13.1 for the defini!on of modernenergy access used in this analysis.
© O
EC
D/IE
A, 2
011

472 World Energy Outlook 2011 - SPECIAL TOPICS
Figure 13.2 " Financing modern energy access
Technology solutions
Electricity: on-grid,
isolated off-grid, mini-grid
Cooking: liquefied petroleum
gas (LPG), biogas,
advanced cookstoves
Financing instruments
Grants
Equity
Loans
Insurance
Subsidies
Guarantees
Financing sources
Multilateral organisations
Bilateral Official Development
Assistance (ODA)
Developing country
governments
Private sector
Current status of modern energy access
We estimate that in 2009, 1.3 billion people did not have access to electricity, around20% of the global population, and that almost 2.7 billion people relied on the traditionaluse of biomass for cooking, around 40% of the global population (Table 13.1).8 Thisupdated estimate reflects revised country-level data, where available. More than 95%of the people lacking access to modern energy services (Box 13.1 includes our definitionof modern energy access) are in either sub-Saharan Africa or developing Asia and 84%live in rural areas. Sub-Saharan Africa accounts for only 12% of the global population, butalmost 45% of those without access to electricity. Over 1.9 billion people in developingAsia still rely on the traditional use of biomass for cooking, with around 840 million ofthese in India and more than 100 million each in Bangladesh, Indonesia and Pakistan.In sub-Saharan Africa, Nigeria also has over 100 million people without access to cleancooking facilities.
Despite these sobering statistics, some countries have made notable progress in recentyears in improving access to electricity and reducing the number of people relying onthe traditional use of biomass for cooking. In India, the most recent data show thatexpenditure on electricity was reported by 67% of the rural population and 94% ofthe urban population in 2009 (Government of India, 2011), up from 56% and 93%respectively when surveyed in 2006 (Government of India, 2008).9 In Vietnam, theelectrification rate (the share of the population with access to electricity) has increasedin the last 35 years from below 5% to 98%. Bangladesh and Sri Lanka have seen progresson access to both electricity and clean cooking facilities, but more so on increasedelectrification. Angola and Congo both have seen the share of the population withaccess to modern energy services expand considerably in the last five years, mainly inurban areas.
8. While throughout this analysis we focus on the number of people relying on the tradi!onal use of biomass forcooking, it is important to note that some 0.4 billion people, mostly in China, rely on coal. Coal is a highly pollu!ng fuelwhen used in tradi!onal stoves and has serious health implica!ons (United Na!ons Development Programme andWorldHealth Organiza!on, 2009).9. See www.mospi.nic.in.
© O
EC
D/IE
A, 2
011

Chapter 13 - Energy for all 473
13
Table 13.1 " People without access to modern energy services by region,2009 (million)
People without accessto electricity
Share ofpopulation
People relying on the traditionaluse of biomass for cooking
Share ofpopulation
Africa 587 58% 657 65%Nigeria 76 49% 104 67%Ethiopia 69 83% 77 93%DR of Congo 59 89% 62 94%Tanzania 38 86% 41 94%Kenya 33 84% 33 83%Other sub-Saharan Africa 310 68% 335 74%
North Africa 2 1% 4 3%
Developing Asia 675 19% 1 921 54%
India 289 25% 836 72%Bangladesh 96 59% 143 88%Indonesia 82 36% 124 54%Pakistan 64 38% 122 72%Myanmar 44 87% 48 95%Rest of developing Asia 102 6% 648 36%
Latin America 31 7% 85 19%Middle East 21 11% n.a. n.a.Developing countries 1 314 25% 2 662 51%
World* 1 317 19% 2 662 39%
*Includes countries in the OECD and Eastern Europe/Eurasia.
Box 13.1 " Defining modern energy access10
There is no universally-agreed and universally-adopted definition of modern energyaccess. For our analysis, we define modern energy access as “a household havingreliable and affordable access to clean cooking facilities, a first connection to electricityand then an increasing level of electricity consumption over time to reach the regionalaverage”.10 By defining access to modern energy services at the household level, itis recognised that some other categories are excluded, such as electricity access tobusinesses and public buildings that are crucial to economic and social development,i.e. schools and hospitals.
Access to electricity involves more than a first supply connection to the household;our definition of access also involves consumption of a specified minimum level ofelectricity, the amount varies based on whether the household is in a rural or anurban area. The initial threshold level of electricity consumption for rural householdsis assumed to be 250 kilowatt-hours (kWh) per year and for urban households it is
10. We assume an average of five people per household.
© O
EC
D/IE
A, 2
011

474 World Energy Outlook 2011 - SPECIAL TOPICS
500 kWh per year.11 In rural areas, this level of consumption could, for example,provide for the use of a floor fan, a mobile telephone and two compact fluorescentlight bulbs for about five hours per day. In urban areas, consumption might alsoinclude an efficient refrigerator, a second mobile telephone per household andanother appliance, such as a small television or a computer.
Once initial connection to electricity has been achieved, the level of consumption isassumed to rise gradually over time, attaining the average regional consumption levelafter five years. This definition of electricity access includes an initial period of growingconsumptionasadeliberateattempt to reflect the fact that eradicationof energypovertyis a long-termendeavour. In our analysis, the average level of electricity consumptionpercapita across all those households newly connected over the period is 800 kWh in 2030.This is comparablewith levels currently seen inmuch of developing Asia.
This definition of energy access also includes provision of cooking facilities which canbe used without harm to the health of those in the household and which are moreenvironmentally sustainable and energy efficient than the average biomass cookstovecurrently used in developing countries. This definition refers primarily to biogassystems, liquefied petroleum gas (LPG) stoves and advanced biomass cookstoves thathave considerably lower emissions and higher efficiencies than traditional three-stonefires for cooking. In our analysis, we assume that LPG stoves and advanced biomasscookstoves require replacement every five years, while a biogas digester is assumedto last 20 years. Related infrastructure, distribution and fuel costs are not included inour estimates of investment costs.
Current status of investment in modern energy access11
For the billions of people currently deprived, the lack of access to modern forms of energytends to go hand-in-handwith a lack of provision of cleanwater, sanitation and healthcare. Italso represents amajor barrier to economic development and prosperity. The importance ofmodern energy access is being recognised increasingly by many organisations that providedevelopment funding. We estimate that capital investment of $9.1 billion was undertakenglobally in 2009 (Box 13.2 describes our methodology) to provide 20 million people withaccess to electricity and 7 million people with advanced biomass cookstoves ($70 million ofthe total). An incomplete set of past observations suggests that this is the highest level ofinvestment ever devoted to energy access.12
11. Theassumed threshold levels for electricity consump!onare consistentwithpreviousWEOanalyses.However,we recognisethat different levels are some!mes adopted in other published analysis. Sanchez (2010), for example, assumes 120 kWh perperson (600 kWh per household, assuming five people per household). As another point of reference, the observed electricityconsump!on in India in 2009 was 96 kWh per person in rural areas and 288 kWh in urban areas on average over all peopleconnected to electricity, implying a lower consump!on for those that have been connectedmore recently (Government of India,2011).12. There are currently no comprehensive data available, and those that do exist employ varying methodologies. Oures!mate is constructed from a variety of sources and includes some necessary assump!ons. It is to be hoped that thisshortcoming in the data receives greater a$en!on in future.
© O
EC
D/IE
A, 2
011

Chapter 13 - Energy for all 475
13
Box 13.2 " Measuring investment in modern energy access
Our estimate of investment in modern energy access is based on the latest dataavailable and has several components. The estimate is of the capital investmentmade to provide household access to electricity (both the cost of the provision of firstconnection and the capital cost to sustain an escalating supply over time) and the costof providing clean cooking facilities to those who currently lack them. Operating costs,such as fuel costs andmaintenance costs, are not included. Broader technical assistance,such as policy and institutional development advice, is also not included. In the case ofon-grid and mini-grid solutions for electricity access, the estimate does not include theinvestment required in supportive infrastructure, such as roads.Our estimate is based on an average of high and low estimates of investment data fromseveral sources:" Bilateral Official Development Assistance (ODA) – In line with the Multilateral
Development Banks’ Clean Energy Investment Framework methodology,13 ourestimate of total ODA for energy access includes the investment flows for electricitygeneration, transmission and distribution in countries eligible for InternationalDevelopment Association (IDA) funding, i.e. the poorest countries. We have alsoincluded financing for off-grid generation and transmission for those countrieseligible for International Bank for Reconstruction and Development (IBRD) funding(countries which, while not among the poorest, still have difficulty accessingcommercial credit markets).
" Multilateral organisations (development banks,14 funds, etc.) – This estimate is basedon the organisations’ own data when available,15 or the same methodology as ODAwhere data is not available.
" Domestic governments in developing countries – This estimate includes investmentsmade both directly by the governments and through state-owned utilities. It includesinvestment independently conducted by the governments as well as governmentinvestment leveraged through multilateral funding. In IDA countries, it is estimatedthat for every $1 spent in aid on energy access, it is matched by an additional equalamount fromeither the private sector or developing country governments. Countrieseligible for IDA funding account for 82% of the total population lacking access toelectricity, so the same leverage factor has been applied to all countries.
" Private sector – The broad range of private sector actors makes this the mostchallenging category forwhich to produce a comprehensive estimate. In constructingthis estimate, which is based on data on private sector investment in infrastructure,including public-private partnerships (PPP), sourced from the World Bank PPIdatabase,16 we have assumed that the private sector component of PPP-fundedprojects is around 50% and that between 5% and 20% of the total investment goestowards energy access, depending on the region.
13. See www.worldenergy.org/documents/g8report.pdf.14. Mul!lateral Development Banks are a channel for funds from bilateral sources and from bond markets.15. Publicly available sources supplemented with bilateral dialogue.16. See www.ppi.worldbank.org.
© O
EC
D/IE
A, 2
011

476 World Energy Outlook 2011 - SPECIAL TOPICS
We estimate that bilateral ODA accounted for 14% of total investment in extending energyaccess in 2009, only slightly more than 1% of total bilateral ODA in the same year (Figure 13.3).Multilateral organisations, such as international development banks and funds, accountedfor more than $3 billion of such investment in energy access, around 34% of the total. Thiswas just over 3% of total multilateral aid in the same year. An estimated 30% of investment inenergy access was sourced from domestic governments in developing countries. This includedinvestments made directly by the governments and through state-owned utilities. The privatesector is estimated to have accounted for 22% of the total investment in energy access. Inthe case of investment in energy access by domestic governments and the private sector, theshare of total investment directed to energy access is estimated to be less than 1% of the grossfixed capital formation in these countries in 2009. While sources of investment are referred toseparatelyhere, inpractice twoormoreoftenoperate in conjunction todeliver anenergyaccessproject. Blending funds from different sources can bring important benefits, such as reducingfunding risks and securing buy-in from project participants. Multilateral development banksgenerallyenter intopartnershipswithdevelopingcountrygovernmentsand/or theprivate sectorto deliver projects, such as theAsianDevelopment Bank’s biogas programme inVietnam.
Figure 13.3 " Investment in energy access by source, 2009Total: $9.1 billion
14%
34%
30%
22% Bilateral OfficialDevelopment Assistance
Mul_lateral organisa_ons
Developing countrygovernments
Private sector finance
Outlook for energy access and investmentin the New Policies ScenarioIn the New Policies Scenario, our central scenario, we project that total cumulativeinvestment in extending access to modern energy is $296 billion from 2010 to 2030, anaverage of $14 billion per year.17 The projected annual average investment required istherefore 56% higher in the New Policies Scenario than the level observed in 2009. Allsources of finance increase their investment in absolute terms to meet this requirementin the New Policies Scenario. Domestic finance in developing countries and multilateraldeveloping banks are the largest sources of finance. But private sector finance is closebehind and actually sees the most growth.
17. We focus primarily on the average level of investment per year over the projec!on period, as a be$er illustra!on ofongoing investment ac!vity than the cumula!ve total.
© O
EC
D/IE
A, 2
011
Chapter 13 - Energy for all 477
13
In the New Policies Scenario, around 550 million additional people gain access to electricityand 860 million are provided with clean cooking facilities from 2010 to 2030. The increasein access to modern energy services is driven largely by rapid economic growth in severaldeveloping countries, accompanied by rapid urbanisation in some cases, but populationgrowth acts as a countervailing force. For example, in the case of China, the 12th Five-YearPlan (covering the period 2011 to 2015) provides for rapid urbanisation, with plans to create45million newurban jobs and an expectation that the urbanisation ratewill increase to 52%by 2015, the date by which the country also expects to achieve full electrification.
In several countries, national targets to increase electricity access succeed in deliveringimprovements over the projection period, but only on a limited scale: many such targetswill not be achieved unless robust national strategies and implementation programmes areput in place. Access to clean cooking facilities has in the past often received less governmentattention than electricity access, with the result that there are fewer related programmes andtargets in place at a national level. At an international level, an important step forward wastaken in September 2010 when the UN Foundation launched the “Global Alliance for CleanCookstoves”. The Alliance seeks to overcome market barriers that impede the production,deployment and use of clean cookstoves in the developing world, so as to achieve the goal of100million households adopting clean and efficient stoves and fuels by 2020.18
Access to electricityIn the New Policies Scenario, around $275 billion of investment goes toward providingelectricity access from 2010 to 2030. This represents annual average investment of$13 billion to connect around 26 million people per year. The capital-intensive nature ofelectricity generation, transmission and distribution means that this investment accounts forover 90% of total investment to deliver modern energy services over the projection period.Theaverage annual level of investment in electricity access increases by almost 45%, comparedwith thatobserved in2009.While the shareof theglobal population lacking access toelectricitydeclines from 19% in 2009 to 12% in 2030, 1.0 billion people are still without electricity by theend of the period (Table 13.2). The proportion of those without access to electricity in ruralareas was around five-times higher than in urban areas in 2009, and this disparity widens tobe around six-times higher in 2030. There are examples of progress in increasing rates of ruralelectrification, such as in Angola and Botswana, but this is often froma lowbase.
Annual investment to increase on-grid electricity access averages $7 billion in the NewPolicies Scenario. The main sources of investment for on-grid access are domesticgovernment finance and the private sector. Almost 55% of total private sector investmentis estimated to be in on-grid solutions. Over 40% of the investment made by multilateraldevelopment banks is also estimated to be in on-grid solutions. Investment in mini-gridand off-grid electricity generation together averages around $6 billion annually in the NewPolicies Scenario.19 Private sector investment represents a significantly smaller share of thetotal for such projects, reflecting the obstacles to developing commercially viable projects.
18. See www.cleancookstoves.org.19. Mini-grids provide centralised genera!on at a local level. They operate at a village or district network level, withloads of up to 500 kW. Isolated off-grid solu!ons include small capacity systems, such as solar home systems,micro-hydrosystems, wind home systems and biogas digester systems.
© O
EC
D/IE
A, 2
011

478 World Energy Outlook 2011 - SPECIAL TOPICS
Table 13.2 " People without access to electricity by region in the NewPolicies Scenario (million)
2009 2030
Rural Urban Share of population Rural Urban Share of population
Africa 466 121 58% 539 107 42%
Sub-Saharan Africa 465 121 69% 538 107 49%
Developing Asia 595 81 19% 327 49 9%
China 8 0 1% 0 0 0%India 268 21 25% 145 9 10%Rest of developing Asia 319 60 36% 181 40 16%
Latin America 26 4 7% 8 2 2%
Middle East 19 2 11% 5 0 2%Developing countries 1 106 208 25% 879 157 16%
World* 1 109 208 19% 879 157 12%
*Includes countries in the OECD and Eastern Europe/Eurasia.
At a regional level, the number of people without access to electricity in sub-SaharanAfrica increases by 10%, from 585 million in 2009 to 645 million in 2030, as the rate ofpopulation growth outpaces the rate of connections. The number of people withoutaccess to electricity in sub-Saharan Africa overtakes the number in developing Asia soonafter 2015. This increase occurs in spite of pockets of progress, such as the governmentelectrification programme in South Africa, which has provided 4 million households withaccess to electricity since it was launched in 1990 and aims to achieve complete accessnationally by 2020. Table 13.3 provides examples of national electrification programmes.While the adoption of national targets and programmes for modern energy access isimportant, in practice it has been relatively commonplace for initial ambitions to bedowngraded subsequently.
The number of people without access to electricity in developing Asia is projectedto decrease by almost 45%, from 675 million people in 2009 to 375 million in 2030.Around 270 million people in rural areas are given access to electricity but, despitethis, the rural population still constitutes the great majority of those lacking access in2030. China has provided 500 million people in rural areas with electricity access since1990 and is expected to achieve universal electrification by 2015. In India, the RajivGandhi Grameen Vidyutikaran Yojana Programme is making progress towards a goal ofelectrifying over 100 000 villages and providing free electricity connections to more than17 million rural households living below the national poverty line. Our projections showIndia reaching a 98% electrification rate in urban areas and 84% in rural areas in 2030. In therest of developing Asia, the average electrification rate reaches almost 93%. The differencein trajectory between developing Asia and sub-Saharan Africa is clear, with an improvingsituation in the former and a worsening one in the latter. In developing Asia, India accountsfor much of the increased access to electricity, while in sub-Saharan Africa a more mixedstory within the region does not, in aggregate, overcome the deteriorating picture, drivenprimarily by population growth.
© O
EC
D/IE
A, 2
011

Chapter13-Energy
forall4
79
13
Table 13.3 " Major programmes and targets for improving access to electricity in selected countries
Programme name Description Financing arrangements
Bangladesh Master Plan for Electrification – National EnergyPolicy of Bangladesh 1996-2004
Electricity for all by 2020. Loans and grants from donors are passed on, under a subsidiaryagreement, to the Rural Electrification Board. Domesticgovernment funds cover all local costs of construction.
Brazil Light for All Launched in 2003, extended in 2011 to 2014. So far theprogramme has connected more than 2.4 million householdsand it aims for full electrification.
Funded largely by the extension of a Global Reversion Reservetax incorporated into electricity rates.The scheme also benefits from an investment partnership offederal government, state agencies and energy distributors.
Ghana National Electrification Scheme – Energy Plan2006-2020
Electricity access for all by 2020. Funded through grants and loans by donors and $9 million peryear in domestic government budgetary support.
India Rajiv Gandhi Grameen Vidyutikaran Yojana Electrify 100 000 villages and provide free electricityconnections to 17.5 million households below the poverty lineby March 2012.
Total funds of $5.6 billion disbursed between 2005 and 2011.A government subsidy of up to 90% of capital expenditure isprovided through the Rural Electrification Corporation. Thosebelow the poverty line receive a 100% subsidy for connection.
Indonesia Rural electrification programmes – NationalEnergy Management
Electricity access for 95% of the population by 2025. Investment costs are covered by cross subsidies by the state-owned power utility (PNL) and other costs are funded by donors.
Nepal Rural Electrification Program – National 3-YearInterim Plan
Electricity access for 100% of the population by 2027. A Rural Electrification Board administers specific funds forelectrification of rural areas.
Philippines Philippines Energy Plan, 2004-2013 Electrification of 90% of households by 2017. Funded by grants and loans from a National Electrification Fundand PPPs.
South Africa Integrated National Electrification Programme Electricity access for 100% of the population by 2020. Government funding disbursed by the Department of Energy toEskom (state-owned utility) and municipalities.
Zambia Rural Electrification Master Plan Electricity access for 78% in urban areas and 15% in rural areasby 2015.
The government has created a Rural Electrification Fund that isadministered by the Rural Electrification Authority.
© OECD/IEA, 2011

480 World Energy Outlook 2011 - SPECIAL TOPICS
Outside Asia and Africa, there are at present smaller, but significant, numbers of peoplewithout access to electricity in Latin America, but near-universal access is achieved thereby 2030 in the New Policies Scenario. In Brazil, Luz para Todos (light for all) is a governmentprogramme, operated by a majority state-owned power utility company, and executed byelectricity concessionaires and co-operatives. The project promotes renewable energy asthe most practical solution in remote areas, with the government providing funding to helpcover the costs for renewable energy projects in these areas.
Access to clean cooking facilities
In the New Policies Scenario, $21 billion is invested in total from 2010 to 2030 to provide860 million people with clean cooking facilities. This is equivalent to an average annualinvestment of $1 billion to provide facilities to an average of 41 million people per year.After an initial increase, the number of people without clean cooking facilities drops back to2.7 billion, the level of 2009, in 2030 (Table 13.4). The proportion of people globally withoutclean cooking facilities declines from 39% in 2009 to 33% in 2030.
Table 13.4 " People without clean cooking facilities by region in the NewPolicies Scenario (million)
2009 2030
Rural Urban Share of population Rural Urban Share of population
Africa 480 177 65% 641 270 58%
Sub-Saharan Africa 476 177 78% 638 270 67%
Developing Asia 1 680 240 54% 1 532 198 41%
China 377 46 32% 236 25 19%
India 749 87 72% 719 59 53%
Rest of developing Asia 554 107 63% 576 114 52%
Latin America 61 24 19% 57 17 14%
Middle East n.a. n.a. n.a. n.a. n.a. n.a.
Developing countries 2 221 441 51% 2 230 485 43%
World* 2 221 441 39% 2 230 485 33%
*Includes countries in the OECD and Eastern Europe/Eurasia.
Over the projection period, almost 60% of the investment in clean cooking facilities isexpected to bemade in biogas solutions, with advanced cookstoves and LPG solutions eachaccounting for around 20%.20 Private sector operators in parts of Asia have already made
20. Advanced biomass cookstoves, with significantly lower emissions and higher efficiencies than the tradi!onalthree-stone fires, are assumed to cost $50. An LPG stove and canister is assumed to cost $60. In the analysis, we assumethat LPG stoves and advanced biomass cookstoves require replacement every five years, but only the cost of the firststove and half of the cost of the second stove is included in our investment projec!ons. This is intended to reflect apath towards such investment becoming self-sustaining. The assumed cost of an average-sized biogas digester varies byregion. Based on 2010 data provided by SNV, the Netherlands Development Organisa!on, the cost is $437 for India, $473in China, $660 in Indonesia, $526 in other developing Asia, $702 in La!n America and $924 in sub-Saharan Africa. Relatedinfrastructure, distribu!on and fuel costs are not included in the investment costs.
© O
EC
D/IE
A, 2
011

Chapter 13 - Energy for all 481
13
significant progress in establishing profitable markets for biogas solutions. In 2010, Chinaled the market with 5 million biogas plants installed, while the next three largest Asianmarkets (India, Nepal and Vietnam) had another 0.2 million units collectively (SNV, 2011).In the case of LPG stoves, multilateral development banks and governments are oftenthe source of the initial capital investment, but the private sector may subsequently beinvolved in fuel distribution. Advanced biomass cookstoves receive relatively more fundingfrom bilateral and multilateral donors. Much of this goes to indirect subsidies intended toestablish local, self-sustaining cookstovemarkets and to increase the demand for advancedcookstoves. Examples of how such funds are applied include the training of stove buildersand information campaigns on the health and other benefits of more efficient stoves.Expenditure of this kind is not included in our calculation of the estimated investment costof access.
In the New Policies Scenario, the number of people in sub-Saharan Africa without cleancooking facilities increases by nearly 40%, to reach more than 900 million by 2030, despitea fall in the proportion of population without access. Almost 65% of the increase in numberoccurs in rural areas. By 2030, one-third of the people without clean cooking facilitiesglobally are in sub-Saharan Africa, up from one-quarter in 2009.
In developing Asia, the number of people without access to clean cooking facilities declinesfrom 1.9 billion in 2009 to around 1.7 billion in 2030. In the New Policies Scenario, thenumber of people without clean cooking facilities in India peaks before 2015 and thendeclines, but India still has nearly 780 million people lacking them in 2030. India previouslyhad the “National Programme for Improved Chulhas” (1985 to 2002), and has recentlylaunched the National Biomass Cookstoves Initiative (NCI) to develop and deploy next-generation cleaner biomass cookstoves to households. The government is piloting thedemonstration of 100 000 cookstoves during 2011 and 2012 – providing financial assistancefor up to 50% of the cost of the stoves – and this will be used to formulate a deploymentstrategy for India’s next five year plan (2012 to 2017).
The number of people without clean cooking facilities in China maintains a declining trendand stands at around 260 million in 2030. China, like India, builds on previous nationalprogrammes, such as the National Improved Stove Program, to distribute cookstoves torural areas. Together, China and India account for all of the fall in the number of peoplelacking clean cooking facilities in the region. Across the rest of developing Asia, the numberof people without access increases by 4.5% to reach 690million.
Investment needed to achieve modern energyaccess for allThe remainder of this analysis focuses on the investment required to achieve the goal ofuniversal access to electricity and clean cooking facilities by 2030 – referred to here asthe Energy for All Case – and the methods of financing that may be the most appropriateto support this. We have calculated the cost of achieving this goal to be $1 trillion (inyear-2010 dollars). This estimate includes the $296 billion reflected in the New Policies
© O
EC
D/IE
A, 2
011
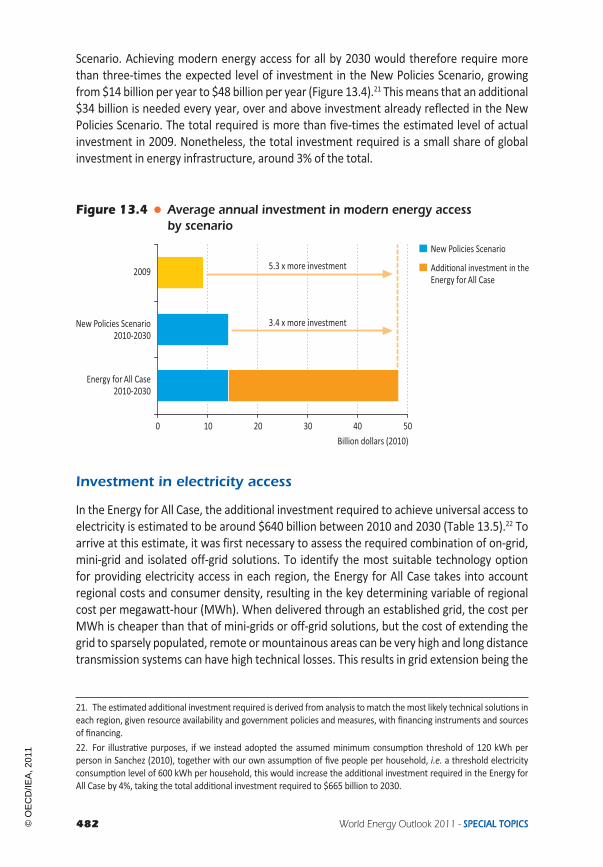
482 World Energy Outlook 2011 - SPECIAL TOPICS
Scenario. Achieving modern energy access for all by 2030 would therefore require morethan three-times the expected level of investment in the New Policies Scenario, growingfrom$14 billion per year to $48 billion per year (Figure 13.4).21 Thismeans that an additional$34 billion is needed every year, over and above investment already reflected in the NewPolicies Scenario. The total required is more than five-times the estimated level of actualinvestment in 2009. Nonetheless, the total investment required is a small share of globalinvestment in energy infrastructure, around 3% of the total.
Figure 13.4 " Average annual investment in modern energy accessby scenario
0 10 20 30 40 50
Energy for All Case2010-2030
New Policies Scenario2010-2030
2009
Billion dollars (2010)
New Policies Scenario
Addi_onal investment in theEnergy for All Case
3.4 x more investment
5.3 x more investment
Investment in electricity access
In the Energy for All Case, the additional investment required to achieve universal access toelectricity is estimated to be around $640 billion between 2010 and 2030 (Table 13.5).22 Toarrive at this estimate, it was first necessary to assess the required combination of on-grid,mini-grid and isolated off-grid solutions. To identify the most suitable technology optionfor providing electricity access in each region, the Energy for All Case takes into accountregional costs and consumer density, resulting in the key determining variable of regionalcost per megawatt-hour (MWh). When delivered through an established grid, the cost perMWh is cheaper than that of mini-grids or off-grid solutions, but the cost of extending thegrid to sparsely populated, remote ormountainous areas can be very high and long distancetransmission systems can have high technical losses. This results in grid extension being the
21. The es!mated addi!onal investment required is derived from analysis tomatch themost likely technical solu!ons ineach region, given resource availability and government policies and measures, with financing instruments and sourcesof financing.22. For illustra!ve purposes, if we instead adopted the assumed minimum consump!on threshold of 120 kWh perperson in Sanchez (2010), together with our own assump!on of five people per household, i.e. a threshold electricityconsump!on level of 600 kWh per household, this would increase the addi!onal investment required in the Energy forAll Case by 4%, taking the total addi!onal investment required to $665 billion to 2030.
© O
EC
D/IE
A, 2
011

Chapter 13 - Energy for all 483
13
most suitable option for all urban zones and for around 30% of rural areas, but not provingto be cost effective inmore remote rural areas. Therefore, 70% of rural areas are connectedeither with mini-grids (65% of this share) or with small, stand-alone off-grid solutions (theremaining 35%). These stand-alone systems have no transmission and distribution costs, buthigher costs perMWh.Mini-grids, providing centralised generation at a local level and usinga village level network, are a competitive solution in rural areas, and can allow for futuredemand growth, such as that from income-generating activities.
Table 13.5 " Additional investment required to achieve universal access toelectricity in the Energy for All Case compared with the NewPolicies Scenario ($2010 billion)
2010-2020 2021-2030 Total, 2010-2030
Africa 119 271 390
Sub-Saharan Africa 118 271 389
Developing Asia 119 122 241
India 62 73 135
Rest of developing Asia 58 49 107
Latin America 3 3 6
Developing countries* 243 398 641
World 243 398 641
* IncludesMiddle East countries.
More than 60% of the additional investment required is in sub-Saharan Africa, with theregion needing the equivalent of an extra $19 billion per year to achieve universal electricityaccess by 2030. There is greater dependency here on mini-grid and isolated off-gridsolutions, particularly in countries such as Ethiopia, Nigeria and Tanzania, where a relativelyhigher proportion of those lacking electricity are in rural areas. Developing Asia accounts for38% of the additional investment required to achieve universal electricity access. Achievinguniversal access to electricity by 2030 requires total incremental electricity output ofaround 840 terawatt-hours (TWh), and additional power generating capacity of around220 gigawatts (GW) (Box 13.3 discusses the potential role of hydropower).
In the Energy for All Case, mini-grid and off-grid solutions account for the greater part ofthe additional investment, $20 billion annually. The annual level of investment is expectedto increase over time, reaching $55 billion per year towards 2030 (Figure 13.5). This growthover time reflects the escalating number of additional connections being made annually inthe Energy for All Case, going from 25million people per year early in the projection periodto more than 80 million by 2030, and the increasing shift in focus to mini-grid and off-gridconnections. It also reflects the gradually increasing level of capital cost associated with thehigher level of consumption expected from those households that are connected earlier inthe period.
© O
EC
D/IE
A, 2
011

484 World Energy Outlook 2011 - SPECIAL TOPICS
Figure 13.5 " Average annual investment in access to electricity by typeand number of people connected in the Energy for All Case
0
15
30
45
60
75
90
0
10
20
30
40
50
60
2010-2015 2016-2020 2021-2025 2026-2030
Million
s
Billiond
ollars(2010)
Addi_onal investment inthe Energy for All Case:
Isolated off-grid
Mini-grid
On-grid
Addi_onal peoplegaining access per yearin the Energy for All Case(right axis)
Investment in theNew Policies Scenario
Box 13.3 " What is the role of hydropower in increasing energy access?
Renewables play a large role in the Energy for All Case. As a mature, reliabletechnology that can supply electricity at competitive costs, hydropower is onepart of the solution to providing universal access to electricity. It has a place inlarge on-grid projects and in isolated grids for rural electrification. The globaltechnical potential for hydropower generation is estimated at 14 500 TWh, morethan four-times current production (IJHD, 2010), and most of the undevelopedpotential is in Africa and in Asia, where 92% and 80% of reserves respectively areuntapped.Water basins can act as a catalyst for economic and social development by providingtwo essential enablers for development: energy and water. Large hydropowerprojects can have important multiplier effects; creating additional indirect benefitsfor every dollar of value generated (IPCC, 2011). However, they may have adverseenvironmental impacts and induce involuntary population displacement if notdesigned carefully.The Nam Theun 2 hydropower plant in Laos is an example of a project that hasadvanced economic and social goals successfully. While managing to achievethis, there are still lessons to be learned in terms of how governments, privatedevelopers and multilateral development banks partner to deliver projects moresimply and efficiently. Small-scale, hydropower-based rural electrification in Chinahas had some success. Over 45 000 small hydropower plants (SHPs), representing55 GW, have been built and are producing 160 TWh per year. While many ofthese plants form part of China’s centralised electricity networks, SHPs constituteone-third of total hydropower capacity and provide services to more than300 million people (Liu and Hu, 2010).
© O
EC
D/IE
A, 2
011

Chapter 13 - Energy for all 485
13
In the Energy for All Case, hydropower on-grid accounts for 14% of additionalgeneration, while SHPs account for 8% of off-grid additional generation. Overall,additional investment in hydropower amounts to just above $80 billion over theperiod 2010 to 2030. Successfully raising this investmentwill depend onmitigating therisks related to high upfront costs and lengthy lead times for planning, permitting andconstruction. Projects that provide broader development benefits and arrangementsto tackle planning approval and regulatory risks are important to achieve the requiredlevel of investment for hydropower development.
Investment in access to clean cooking facilities
In the Energy for All Case, $74 billion of additional investment is required to provideuniversal access to clean cooking facilities by 2030, representing nearly four-times thelevel of the New Policies Scenario. Of this total, sub-Saharan Africa is estimated to need$22 billion. While the largest share of additional investment in the region is for biogassystems, a significant proportion (around 24%) is needed to provide advanced biomasscookstoves to 395 million people in rural areas. Developing Asia accounts for almosttwo-thirds of the total additional investment required for clean cooking facilities, the largestelement ($26 billion) being for biogas systems, principally in China and India (Figure 13.6).
Figure 13.6 " Average annual investment in access to clean cooking facilitiesby type and region, 2010-2030
0
0.5
1.0
1.5
2.0
2.5
Biogas systems LPG stoves Advanced biomasscookstoves
Billiond
ollars(20
10) Investment in the
New Policies Scenario
La_n America
Rest of developing Asia
India
China
Sub-Saharan Africa
Addi_onal investmentin the Energy for All Case:
We estimate that to provide over 250 million households worldwide with advancedbiomass cookstoves an additional cumulative investment of $17 billion will be needed to2030 (Figure 13.7). Additional investment of $37 billion is required in biogas systems overthe projection period, providing access to around 70 million households.23 An estimated
23. Infrastructure, distribu!on and fuel costs for biogas systems are not included in the investment costs. Due to anassumed 20-year lifecycle, we assume one biogas system per household in the period 2010 to 2030, thus replacementcosts are not included (see footnote 20 for cost assump!ons for each technology).
© O
EC
D/IE
A, 2
011

486
World
EnergyO
utlook2011
-SPECIALTO
PICS
Figure 13.7 " Average annual investment required by region and technology in the Energy for All Case, 2010-2030
China*
$0.8 billion
Other Asia
$0.7 billion
Sub-Saharan Africa
$1.1 billion
Latin America
$0.2 billion
10%
73%
17%
Advanced biomass cookstovesBiogas systemsLPG stoves
31%
39%
30%
0
2
4
6
8
10
12
14
16
18
20
0
2
4
6
0
2
24%
41%
34%
5%
82%
13%
Note: the investments are expressed in year-2010 dollarsNot to scale
$18.5 billion
World: $3.5 billion World: $30.5 billion
$0.3 billion
$5.1 billion
35%
38%
27%
India
$0.8 billion
0
2
4
6
8
$6.4 billion
Isolated off-gridMini-gridOn-grid
This map is for illustrative purposes and is without prejudice to the status of or sovereignty over any territory covered by this map.
Electricity accessAccess to clean cooking facilities
*In the Energy for All Case, China’s investment in access to electricity is zero and therefore not shown on the map.Note: World total includes Middle East countries.
© OECD/IEA, 2011

Chapter 13 - Energy for all 487
13
additional investment of $20 billion for LPG stoves over the projection period provides cleancooking facilities to nearly 240million households. Advanced biomass cookstoves and biogassystems represent a relatively greater share of the solution in rural areas, while LPG stovesplay a much greater role in urban and peri-urban areas.
Broader implications of achieving modern energyaccess for allAchieving the Energy for All Case requires an increase in global electricity generation of 2.5%(around 840 TWh) compared with the New Policies Scenario in 2030, requiring additionalelectricity generating capacity of around 220 GW. Of the additional electricity needed in2030, around 45% is expected to be generated and delivered through extensions to nationalgrids, 36% bymini-grid solutions and the remaining 20% by isolated off-grid solutions.Morethan 60% of the additional on-grid generation comes from fossil fuel sources and coal aloneaccounts for more than half of the total on-grid additions. In the case of mini-grid and off-grid generation, more than 90% is provided by renewables (Figure 13.8).
Figure 13.8 ! Additional electricity generation by grid solution and fuel in theEnergy for All Case compared with the New Policies Scenario, 2030
63%
3%
14%
5%5%
10%
On-grid genera-on368 TWh
Fossil fuels*
Nuclear
Hydro
Wind
Solar
Other renewables
36%
8%21%
28%
7%Solar
Small hydro
Biomass
Wind
Diesel
Mini-grid and off-grid genera-on470 TWh
* Coal accounts for more than 80% of the additional on-grid electricity generated from fossil fuels.
Achieving the Energy for All Case is projected to increase global demand for energy by179million tonnes of oil equivalent (Mtoe), an increase of 1.1% in 2030, compared with theNew Policies Scenario (Table 13.6). Fossil fuels account for around 97Mtoe, over half of theincrease in energy demand in 2030. While an additional 0.88 million barrels per day (mb/d)of LPG is estimated to be required for LPG cookstoves in 2030, this is expected to be availablelargely as a by-product of increased production of natural gas liquids (NGLs) and refiningcrude oil. Coal demand increases by almost 60 million tonnes of coal equivalent (Mtce) in2030, around the current production level of Colombia. Ample coal reserves are availableglobally to provide this additional fuel to the market (see Chapter 11). Other renewables,mostly solar andwind, enjoy the largest proportional increase in demand in 2030, providingadditional deployment opportunities beyond those in the New Policies Scenario.
© O
EC
D/IE
A, 2
011

488 World Energy Outlook 2011 - SPECIAL TOPICS
Table 13.6 " Additional energy demand in the Energy for All Case comparedwith the New Policies Scenario, 2020 and 2030
Additional demand (Mtoe) Change versus the New Policies Scenario
2020 2030 2020 2030
Coal 10 42 0.2% 1.0%
Oil 25 48 0.6% 1.1%
Gas 1 7 0.0% 0.2%
Nuclear 3 3 0.3% 0.2%
Hydro 6 8 1.5% 1.7%
Biomass and waste 8 31 0.5% 1.8%
Other renewables 12 41 4.0% 7.8%
Total 64 179 0.4% 1.1%
In 2030, CO2 emissions in the Energy for All Case are 239 million tonnes (Mt) higher thanin the New Policies Scenario, an increase of only 0.7% (Figure 13.9). Despite this increase,emissions per capita in those countries achieving universal access are still less than one-fifthof the OECD average in 2030. The small size of this increase in emissions is attributable tothe low level of energy per-capita consumed by the people provided with modern energyaccess and to the relatively high proportion of renewable solutions adopted, particularly inrural and peri-urban households. The diversity of factors involved means that the estimateof the total impact on greenhouse-gas emissions of achieving universal access to moderncooking facilities needs to be treated with caution. However, it is widely accepted thatadvanced stoves and greater conversion efficiency would result in a reduction in emissionsand thereby reduce our projection.
Figure 13.9 " Additional global energy demand and CO2 emissions in theEnergy for All Case compared with the New Policies Scenario,2030
0
10
20
30
40
0
5 000
10 000
15 000
20 000
Energy demand
Gt
Mtoe
CO2 emissions
Addi_onal demandin the Energy for All Case
New Policies Scenario
Energy demand:
Addi_onal emissionsin the Energy for All Case
New Policies Scenario
CO2 emissions (right axis):
1.1%0.7%
Notes: Percentages are calculated as a share of the total energy demand or CO2 emissions respectively in 2030.Gt = gigatonnes.
© O
EC
D/IE
A, 2
011

Chapter 13 - Energy for all 489
13
As well as the economic development benefits, the Energy for All Case, if realised, wouldhave a significant impact on the health of those currently cooking with biomass as fuel inbasic, inefficient and highly-polluting traditional stoves. Based onWorld Health Organization(WHO) projections, linked to our projections of the traditional use of biomass in cooking,24the number of people who die prematurely each year from the indoor use of biomass couldbe expected to increase to over 1.5million in theNewPolicies Scenario in 2030. The adoptionof clean cooking facilities is expected to prevent themajority of deaths attributable to indoorair pollution.25 The number of premature deaths per year attributable to indoor air pollutionis higher than what the WHO projects for deaths from malaria and HIV/AIDS combined in2030 (Figure 13.10). In addition to avoiding exposure to smoke inhalation, modern energyservices can help improve health in otherways, such as refrigeration (improving food qualityand storing medicines) andmodern forms of communication (supporting health education,training and awareness).26
Figure 13.10 " Premature annual deaths from household air pollution andselected diseases in the New Policies Scenario
0
0.5
1.0
1.5
2.0
2.5
2008 2030Malaria Tuberculosis Smoke from biomass HIV/AIDS
Million
2008 2030 2008 2030 2008 2030
Note: 2008 is the latest available data inWHO database.
Financing to achieve modern energy access for allThe size of the increase in investment that is required in the Energy for All Case is significant.We focus here on how the investment required to achieve the objectives of the Energy forAll Case can best be financed. Whatever the possible sources, it is important to recognise
24. Es!mates for premature deaths are based on WEO-2010 projec!ons for biomass use and on Mathers and Loncar(2006); WHO (2008); Smith et al., (2004); andWHO (2004).25. Evidence of fewer child deaths from Acute Lower Respiratory Infec!on can be expected soon a"er reduc!ons insolid fuel air pollu!on. Evidence of averted deaths from chronic obstruc!ve pulmonary disease would be observed overa period of up to 30 years a"er adop!on of clean cookstoves, due to the long and variable !me-scales associated withthe disease.26. See WEO-2006 and WEO-2010 for a detailed discussion of the harmful effects of current cooking fuels andtechnologies on health, the environment and gender equality; and for a broader discussion on the link between energyand the Millennium Developing Goals (IEA, 2006 and IEA, 2010).
© O
EC
D/IE
A, 2
011

490 World Energy Outlook 2011 - SPECIAL TOPICS
that sufficient finance will not be forthcoming in the absence of strong governance andregulatory reform. Technical assistance in these areas from multilateral and bilateralorganisations and non-governmental organisations (NGOs) will be essential. While suchassistance is often important in influencing the success of energy access projects, the costof its provision is difficult to quantify and the purpose and benefits are rarely confined onlyto the eradication of energy poverty. Moreover, the most appropriate potential sourcesof finance depend, in part, on the technical and social characteristics of the solutions bestsuited to each element of the requirement (on-grid, mini-grid, off-grid). A bottom-upanalysis on this basis has been undertaken to suggest which financing instruments(e.g. loans, grants) and sources of financing (domestic government, multilateral or bilateraldevelopment funding, or the private sector) might be most appropriate.
As elaborated below, there will be demand for a significant increase in financing fromall major existing sources (Figure 13.11). We estimate that investment from multilateraldevelopment banks and bilateral ODA collectively needs to average around $18 billionper year from 2010 to 2030, more than three-times the level projected in the New PoliciesScenario. Such a scale up in financing from these sourceswould require a significant increasein underlying funds and a reordering of development priorities. In addition, average annualinvestment of almost $15 billion is required from governments in developing countries,including state-owned utilities. Developing country governments are expected to providemost of the finance required for mini-grid solutions and for the penetration of LPG forcooking, tailoring the financing instruments used according to the ability of households toafford the associated level of operating expenditure.
Figure 13.11 " Average annual investment in modern energy access bysource of financing and scenario
0
10
20
30
40
50
2009 New Policies Scenario2010-2030
Energy for All Case2010-2030
Billiond
ollars(20
10) Private sector finance
Developing countrygovernments
Mul_lateral development banks
Bilateral Official DevelopmentAssistance
Investment of around $15 billion per year, on average, is required from the diverse range ofactors that collectively constitute the private sector. The private sector accounts for almost35% of the total investment needed to expand on-grid connections and around 40% of theinvestment needed to provide households with biogas systems for cooking. It is expected tofocus particularly on higher energy expenditure households, due to their greater capacity
© O
EC
D/IE
A, 2
011

Chapter 13 - Energy for all 491
13
to pay. In these areas, the share of private sector investment is expected to increase overthe period, as structural barriers are overcome, permitting more rapid expansion andfor its potential to be increasingly realised. By contrast, a breakthrough is still required indeveloping commercially-viable business models for providing modern energy servicesto the rural poor on a significant scale. Until such models are developed, private sectorinvestment is not expected to contribute substantially in this area, meaning that the publicsector plays the dominant role.
In examining financing for access to both electricity and clean cooking facilities, we draw adistinction between lower and higher household energy expenditure. For electricity, this isbased on the classification used by the International Finance Corporation (IFC) in its reporton Energy Access BusinessModels (IFC, forthcoming). It is estimated that around half of the270 million households currently lacking access to electricity spend up to $5.50 per monthon traditional energy for lighting services:27 we refer to these as lower energy expenditurehouseholds and those above this threshold as higher energy expenditure households. Forfinancing clean cooking facilities, a similar distinction, based on IFC energy expenditurethresholds, does not provemeaningful for our purposes.28 Instead, we adopt a classificationbased on the international poverty line of receiving income of $1.25 per day: those livingunder the poverty line are classified as lower income and those above the poverty line ashigher income.29
Electricity access – financing on-grid electrification
In the Energy for All Case, on-grid electrification requires additional annual investment of$11 billion. This is $4 billion per year higher than projected in the New Policies Scenario andprovides access to electricity to an additional 20million people per year. Table 13.7 shows abreakdown of the additional annual investment required for universal access to electricity,together with an indication of what the main and supplementary sources of finance areanticipated to be in each area.
We estimate that around 60% of the additional investment required relates to higherenergy expenditure households. For this category, private investors may be expected tobid for a concession or to enter into a public-private partnership (PPP) with a local utilityto extend the grid and provide universal access in an agreed area.30 It may be importantto include electricity generation, often the financially more attractive element, togetherwith transmission and distribution, as it can be difficult to generate interest in the latterseparately. Such concessionaire grid extensions have taken place in Argentina, Chile,Guatemala and Uganda (World Bank, 2009a). Private investors may also be able to source
27. Ligh!ng services includes kerosene, candles and disposable ba$eries.28. Available informa!on on household expenditure thresholds for cooking fuels results in 95% being placed in onecategory, therefore resul!ng in li$le differen!a!on.29. See www.worldbank.org.30. Public-private partnerships are contractual arrangements typified by joint working between the public and privatesector. In the broadest sense, they can cover all types of collabora!on across the interface between the public and privatesectors to deliver policies, services and infrastructure.
© O
EC
D/IE
A, 2
011

492 World Energy Outlook 2011 - SPECIAL TOPICS
loans from international or local banks on the basis of the financial attractiveness of theproject, backed bymultilateral development bank guarantees. Attracting private investmentto such projects depends crucially on investors being able to charge tariffs that generate areasonable return. In some instances, a state-owned utilitymandated by the government toprovide universal access may be able to attract private sector loans at competitive rates tosupplement internal financing. In other instances, a utility (in private or public ownership)may not be sufficiently creditworthy to raise finance commercially, andmay require support,such as through a partial risk guarantee.
Table 13.7 " Additional financing for electricity access in the Energy for AllCase compared with the New Policies Scenario31, 2010-2030
Additionalannual
investment($ billion)
People gainingaccess annually
(million)
Levelof household
energyexpenditure
Main sourceof financing
Other sourcesof financing
On-grid 11.0 20
Higher Private sector Developing countryutilities
Lower Government budget Developing countryutilities
Mini-grid 12.2 19
Higher Government budget,private sector
Multilateral and bilateralguarantees
Lower Government budget Multilateral and bilateralconcessional loans
Off-grid 7.4 10
HigherMultilateral andbilateral guaranteesand concessional loans
Private sector,government budget
LowerMultilateral andbilateral concessionalloans and grants
Government budget
In providing on-grid electrification for lower energy expenditure households, there is astronger case for explicit public sector funding, such as targeted government subsidies oran equity investment.32 For example, in the case of Vietnam’s successful rural electrificationprogramme, significant cost sharing by local government and the communities beingelectrified was an important element of the financing model. Cross-subsidisation betweenhigher energy expenditure households or business customers and those with lower energyexpenditure may also be pursued (though not desirable on a long-term basis), such as thestate-owned utility Eskom has done in South Africa.
31. See www.worldenergyoutlook.org/development.asp for more on the methodology related to this table.32. An equity investment is one in which the investor receives an ownership stake in a project, giving en!tlement to ashare of the profits (a"er all associated debts have been paid), but also liability to bear part of any residual losses.
© O
EC
D/IE
A, 2
011

Chapter 13 - Energy for all 493
13
Electricity access – financing mini-grid electrification
In the Energy for All Case, mini-grid electrification requires additional annual investmentof $12 billion per year. This area requires the largest increase in financing, relative to theNew Policies Scenario, withmore than $8 billion per year in additional investment required,on average, to connect an additional 19 million people annually.
Often financed initially by government programmes, mini-grids (diesel and small-hydro)have played an important role in rural electrification in China, Sri Lanka and Mali (WorldBank, 2008). Under a Global Environment Fund (GEF) Strategic Energy Programme forWestAfrica, renewable energy powered mini-grids are being established in eight countries.33Hybridmini-grids, integrating renewable generation with back-up capacity, have expandedrapidly in Thailand (Phuangpornpitak et al., 2005), and are becoming competitive comparedwith 100% diesel-based generation (ARE, 2011a). In Laos, a successful public-privatepartnership, has been established to fund a hybrid (hydro, solar PV and diesel) mini-grid,serving more than 100 rural households. In the project, public partners fund the capitalassets, while the private local energy provider finances the operating costs (ARE, 2011b).
The most appropriate type of technical and financing solution for mini-grid projects canvary significantly. In some cases, mini-grid projects can be run on a cost-recovery basiswith a guaranteed margin, and therefore attract private sector finance on commercialterms (particularly diesel systems). In the case of more marginal projects, output-basedsubsidies may be used to support private sector activity in the sector. For many high energyexpenditure households, an auction for concessions, combinedwith output-based subsidies,can keep subsidies low while giving concessionaires incentives to complete promisedconnections. In such cases, electricity providers bid for the value of subsidies that theyrequire (referred to as “viability gap funding”) or for the number of electricity connectionstheywill make during a specified period at a pre-determined rate of subsidy per connection.Ideally, such auctions are technology-neutral, as in Senegal’s recent programme, allowingproviders to determine themost cost-effective solution. Loans or grants to the governmentfrommultilateral and bilateral sources could provide financing to support the initial auctionand subsidy costs, as the International Development Association (IDA) and GEF grants did inSenegal (GPOBA, 2007). Such sourcesmay also help support end-user financing programmeswhich offer assistance to cover the connection charges through the concessionaire or localbanking system. For example, the IDA andGEF helped Ethiopia’s Electric Power Corporationoffer credit to rural customers (GPOBA, 2009).
An important form of financing for mini-grid electrification for low energy expenditurehouseholds is expected to be government-initiated co-operatives and public-privatepartnerships.34 Bangladesh and Nepal provide examples of such co-operatives (Yadoo and
33. See www.un-energy.org.34. Many forms of business co-opera!ves exist but, in general, the term refers to a company that is owned by a groupof individuals who also consume the goods and services it produces and/or are its employees. A u!lity co-opera!ve istasked with the genera!on and/or transmission and distribu!on of electricity.
© O
EC
D/IE
A, 2
011

494 World Energy Outlook 2011 - SPECIAL TOPICS
Cruickshank, 2010). There is a relatively high assumed capital subsidy from the governmentin this model, typically with support in the form of concessional loans frommultilateral andbilateral donors.
Electricity access – financing off-grid electrification
Isolated off-grid electricity solutions require additional investment of $7 billion per yearto 2030. This represents an increase of $5 billion per year, compared to the New PoliciesScenario, in order to provide electricity access to an additional 10 million people peryear. In general, off-grid connections are less attractive to the private sector and requiredifferent technical solutions and related financing. In the Energy for All Case, the mainfinancing model for off-grid electrification of high energy expenditure households involvesenhancing the capacity of dealers in solar home systems and lanterns to offer financing toend-users. Examples of thismay be found in the Philippines (UNEP, 2007) and Kenya (Yadooand Cruickshank, 2010). Government and concessional funds could also be used directlyto support microfinancing35 networks or local banks that, in turn, provide loans down thechain to end-users, as has happened, for example, in UNEP’s India Solar Loan Programme(UNEP, 2007) and in several African countries under the Rural Energy Foundation, whichis supported by the government of the Netherlands (Morris et al., 2007). In some cases,where microfinance is not available, local agricultural co-operatives might be a channel forfunds. Government and concessional funds could also be used for output-based subsidiesin some countries. Different sources of financing can play complementary roles in differentstages of a programme or project to deliver energy access. For example, a programme forsmall hydro systems in rural areas in Nepal received over 90% of its funding from publicsources at the beginning, much of which was dedicated to capacity development. The shareof public financing gradually declined to about 50% at a later stage, suggesting that publicinvestments in developing national and local capacities subsequently attracted privatefinancing (UNDP, AEPC, Practical Action, 2010).
Off-grid electrification of low energy expenditure households is the most challenging areain which to raise finance. A potentially attractive solution for many such cases is sustainablesolar marketing packages, pioneered by the World Bank and GEF in the Philippines andlater introduced in Zambia and Tanzania. They are based on a service contract to install andmaintain solar photovoltaic systems to key public service customers, such as schools, clinicsand public buildings. Such contracts include an exclusive right to provide such services alsoto households and commercial customers, and provide a subsidy for each non-public systeminstalled in the concession area. As for many other solutions, the development of end-userfinancing is also important. The first phase of the “Lighting Africa” programme by the IFCandWorld Bank saw the most basic needs met through solar home systems (SHS) providedon a fee-for-service basis.While donor-basedmodels remain, and SHS are still an importantand growing segment, the lighting market is now entering a new phase that is being led
35. The termmicrofinance typically refers to the provision of financial services to low income people that lack access tosuch services from mainstream providers, either due to the small sums involved or because they are on terms that arenot considered commercially a$rac!ve. The stated inten!on of microfinance organisa!ons is o"en to provide access tofinancial services as a means of poverty allevia!on.
© O
EC
D/IE
A, 2
011

Chapter 13 - Energy for all 495
13
by entrepreneurs providing solar portable lights. The scale of these operations is currentlysmall, and the cost can still be a barrier, but the technology is improving at a rapid rate andbusiness models are maturing (IFC andWorld Bank, 2010).
Clean cooking facilities – financing LPG stoves
In the Energy for All Case, of the additional $3.5 billion per year in investment needed toachieve universal access to clean cooking facilities, $0.9 billion is required for LPG stovesto supply an additional 55 million people per year with a first stove and financing for 50%of the first replacement after five years (Table 13.8). Households supplied with LPG stovesare concentrated in urban and peri-urban areas or may be in areas with high levels ofdeforestation. As in most countries where LPG stoves have been successfully introduced,such as Kenya, Gabon and Senegal, the government has a role to play in market creation,such as developing common standards and the distribution infrastructure. This will requirea certain amount of investment on the part of the government, which may be financed inpart by concessional loans from multilateral and bilateral institutions. Besides investmentin supporting public infrastructure, such as roads, the government may need to ensurethat loans are available for entrepreneurs wishing to invest in LPG distribution. This couldbe done through a guarantee programme for a line of credit made available throughparticipating local banks, possibly ultimately supported by amultilateral development bank.
Table 13.8 " Additional financing for clean cooking facilities in the Energy forAll Case compared with the New Policies Scenario, 2010-2030
Additionalannual
investment($ billion)
People gainingaccess annually
(million)
Levelof household
energyexpenditure
Main sourceof financing
Other sourcesof financing
LPG 0.9 55
Higher Government budget,private sector
Multilateral and bilateraldevelopment banks,microfinance
LowerGovernment budget,multilateral and bilateraldevelopment banks
Private sector
Biogas systems 1.8 15
Higher Private sectorMicrofinance, governmentbudget, multilateral andbilateral development banks
LowerGovernment budget,multilateral and bilateraldevelopment banks
Private sector, microfinance
Advancedbiomasscookstoves
0.8 59
Higher Private sectorGovernment budget,multilateral and bilateraldevelopment banks
LowerGovernment budget,multilateral and bilateraldevelopment banks
Private sector
© O
EC
D/IE
A, 2
011

496 World Energy Outlook 2011 - SPECIAL TOPICS
Higher income households are assumed either to purchase their LPG stove and first cylinderdirectly from their own resources or to obtain credit from banks ormicrofinance institutionsto do so. For example, access to credit through microfinance institutions has helped topromote a relatively rapid uptake of LPG in Kenya (UNDP, 2009). In many countries, urbanand peri-urban areas are those where most LPG penetration is expected and also thosethat aremore likely to be served bymicrofinance institutions. However, somemicrofinanceinstitutions may initially require a partial credit guarantee provided by the public sectorto generate confidence in lending to a new market. Lower income households receivingLPG stoves in the Energy for All Case are expected to benefit from a loan or subsidy thatcovers the initial cost of the stove and the deposit on the first cylinder. This loan or subsidyis assumed to be funded in part by the government and in part by multilateral and bilateraldonors. Experience in Senegal has shown that LPG sometimes requires subsidies to bemaintained for a period in order to keep costs below themonthly amounts that householdspreviously spent on competing wood fuel or charcoal. Indonesia has undertaken aprogramme to distribute free mini-LPG kits to more than 50 million households and smallbusinesses in an attempt to phase out the use of kerosene for cooking (and reduce the fiscalburden of the existing kerosene subsidy). Analysis of the programme indicates that a capitalinvestment of $1.15 billion will result in a subsidy saving of $2.94 billion in the same year(Budya and Yasir Arofat, 2011).
Clean cooking facilities – financing biogas systems
In the Energy for All Case, additional annual investment of $1.8 billion is required in biogassystems over the projection period. This is an increase in investment of $1.2 billion annually,compared with the New Policies Scenario, and provides an additional 15 million people eachyear with a biogas system for cooking. In the Energy for All Case, an output-based subsidyprogramme for trained and certified installation companies is assumed to cover about 30%of the cost of a biogas digester. In 2010, a subsidy of 26% of the total cost was available for ahome biogas plant of an average size in Bangladesh and Nepal, while in China subsidy levelshave been as high as 69% of total costs (SNV, 2011). A subsidymay be provided to the buildervia a rural development agency or equivalent after verification of successful installation. Inreturn for receiving the subsidy, the installer can be obliged to guarantee the unit for severalyears. Assistance frommultilateral and bilateral donors orNGOs can help train biogas digesterbuilders, as theNetherlandsDevelopmentOrganisation (SNV) has done in several of countries.
Both higher and lower income households may require a loan to cover part of the cost ofa biogas system. For example, the Asian Development Bank (ADB) has worked with theNetherlands’ SNV to add a credit component to a biogas programme in Vietnam (ADB, 2009).The Biogas Partnership in Nepal has on-lent donor and government funds to over 80 localbanks and microfinance institutions to provide end-user financing (UNDP, 2009 and AshdenAwards, 2006). This programme involved support for the development of local, private sectorbiogas manufacturing capacity, as well as training and certification facilities to ensure thatquality standardsweremaintained. Between35%and50%of the capital costswere subsidisedthrough grants from international donors, such as the German development financeinstitution, KfW. Loan capital was available for the remaining capital investment.
© O
EC
D/IE
A, 2
011

Chapter 13 - Energy for all 497
13
The government, through a national development bank or rural energy agency, may needto supportmicrofinance institutions or rural agricultural credit co-operatives to expand theircoverage and lending to rural areas. This can be done by offering grants, or by temporarilyoffering partial credit guarantees or loans at below-market interest rates that enableon-lending, until financial institutions are confident to operate in the new market. In somecases, lower income households may also lower the unit price by contributing their labour,which can be around 30% of the cost (Ashden Awards, 2010).
Clean cooking facilities – financing advanced cookstoves
In the Energy for All Case, additional annual financing of $0.8 billion is required in advancedbiomass cookstoves. This is an increase of $0.6 billion per year, compared with the NewPolicies Scenario, and serves to provide a first advanced cookstove to an additional60 million people per year and financing for 50% of the first replacement after five years.While advanced cookstoves can help cut wood fuel use substantially, the economicarguments alone may not be compelling for many households, especially if wood fuelis considered “free” and the time of the persons collecting it – typically women andgirls – is not sufficiently valued. Comprehensive public information and demonstrationcampaigns to explain the health and other benefits are therefore likely to be required toincrease household acceptance. In addition, funding will be required to ensure adequatequality control of cookstoves.36 Such campaigns are expected to be funded with grants,either from the government or multilateral and bilateral development partners, and willbenefit from international support through initiatives such as The Global Alliance for CleanCookstoves. Public information and demonstration campaigns have successfully led tomarket transformation in Uganda, Mali and Madagascar among others (AFD, 2011). InSri Lanka, an estimated 6 million advanced cookstoves have been sold over the last tenyears using innovative business models, such as “try before you buy”. The programmehas been supported by several international donors and the government of Sri Lanka(IEA, 2011).
Of the additional investment in the Energy for All Case, an estimated 70% is directed to lowerincome households. For these, the provision of credit to help purchase advanced cookstovesmay be appropriate in some cases, as successfully implemented by Grameen Shakti inBangladesh (Ashden Awards, 2008). Unfortunately, use of microcredit may be problematicfor advanced stoves, particularly because of the high transaction costs compared with thepurchase price and the traditional focus of microcredit on income-generating activities(Marrey and Bellanca, 2010). As an alternative, the government may help develop dealerfinancing through certified cookstove builders, e.g. using a partial credit guarantee withfunds provided by the government or by multilateral and bilateral development partners.Experience in some countries has shown that large subsidies (and especially give-aways) canactually undermine themarket for advanced stoves and create expectations of a subsidy forreplacement stoves (AFD, 2011).
36. Funding for quality control is not included in our es!mates of the required investment costs.
© O
EC
D/IE
A, 2
011

498 World Energy Outlook 2011 - SPECIAL TOPICS
Sources of financing and barriers to scaling upThis section considers themain sources of financing in more detail, and the types of projectsand instruments to which they are, or may become, most effectively committed. Thesesources are summarised under the main categories: multilateral and bilateral developmentsources, developing country government sources and private sector sources. It is recognisedthat there are instances in which these categories may overlap or change over time. Forexample, countries currently focused on investing in energy access domestically may alsoinvest in other countries. Rapidly industrialising countries, such as China and India, may besuch cases. Within each broad category, several different types of organisations may offerone or more types of financing instrument to improve energy access. Table 13.9 showsdifferent financing instruments and a summary of the sources thatmight typically offer them.
Table 13.9 " Sources of financing and the financing instrumentsthey provide
Gran
ts/c
redits
Concessio
nary
loan
s
Market-rateloa
ns
Cred
itlin
efor
on-le
nding
Partialcred
itguaran
tees
Politica
lrisk
insurance
Equity
Quasi-e
quity
Carbon
finan
cing
Subsidy/
cross-s
ubsid
y
Feed
-intariff
Technicalassistan
ce
Multilateral developmentbanks ✓ ✓ ✓ ✓ ✓ ✓ ✓ ✓ ✓ ✓
Bilateral developmentagencies ✓ ✓ ✓ ✓ ✓ ✓
Export-import banks /guarantee agencies ✓ ✓ ✓
Developing-countrygovernments ✓ ✓ ✓ ✓ ✓ ✓
State-owned utilities ✓ ✓ ✓
National developmentbanks ✓ ✓ ✓ ✓ ✓
Rural energy agencies/funds ✓ ✓ ✓
Foundations ✓ ✓ ✓
Microfinance ✓
Local banks ✓
International banks ✓ ✓ ✓
Investment funds ✓ ✓
Private investors ✓ ✓ ✓
© O
EC
D/IE
A, 2
011

Chapter 13 - Energy for all 499
13
Multilateral and bilateral development sources
Multilateral development sources include theWorld BankGroup,37 the regional developmentbanks38 and major multilateral funds, such as the Organization of the Petroleum ExportingCountries Fund for International Development (OFID) and the Scaling-up Renewable EnergyProgram for Low-Income Countries (SREP) (Box 13.4 considers the International Energyand Climate Partnership – Energy+). Bilateral sources are primarily official developmentassistance provided by the 24 OECD countries that are members of the OECD DevelopmentAssistance Committee (DAC). These OECD member countries account for the bulk ofglobal development aid (99% of total ODA in 2010), including that provided via multilateralsources, but this situation continues to evolve. The major financing instruments used bythese sources for energy access projects are grants, concessional loans and investmentguarantees.39 Carbon financing is another instrument that has begun to be utilised forenergy access projects.
Credits from the International Development Association (IDA) have been the maininstrument employed by the World Bank Group for energy access projects, followed bygrants, including from special funds such as the GEF and the Carbon Funds. However,obtaining grants can require long proposal preparation periods and the need to satisfymultiple criteria. The International Bank for Reconstruction and Development (IBRD) alsoprovides concessional loans to medium-income governments, which are typically appliedto large electricity infrastructure projects. The IFC is able to lend to the private sector andorganise loan syndications that give international banks greater confidence to invest inprojects in developing countries. It also lends to local financial institutions for on-lendingto small and medium businesses, and is increasingly creating guarantee products thathelp develop the capacity of the local banking sector and making equity investments. TheUN Development Programme (UNDP) and UN Environment Programme (UNEP) have beenparticularly active in helping develop schemes for end-user finance.
Political risk insurers, such as the Multilateral Investment Guarantee Agency (MIGA), andbilateral programmes such as Norway’s Guarantee Institution for Export Credit (GIEK),have a mission to promote foreign direct investment in developing countries by insuringprivate investors against risks such as breach of contract, non-fulfilment of governmentfinancial obligations and civil disturbances. Obtaining such risk insurance can have leveragingeffects, making it easier for projects to obtain commercial finance, or to do so at lower cost.Financing frommostmultilateral and bilateral development sources is usually accompaniedby technical assistance, such as policy and institutional development advice to ensure theefficient use of the provided funds. Such investment in technical assistance can be importantin ensuring that an adequate number of private projects enter the financing pipeline.
37. World Bank Group includes the World Bank, Interna!onal Development Associa!on, Interna!onal Bank forReconstruc!on and Development, Interna!onal Finance Corpora!on andMul!lateral Investment Guarantee Agency.38. Regional development banks include the Asian Development Bank, African Development Bank and Inter-AmericanDevelopment Bank.39. Bilateral development sources offer many of the same financing products as mul!laterals sources.
© O
EC
D/IE
A, 2
011
500 World Energy Outlook 2011 - SPECIAL TOPICS
Potential barriers to scaling up the financing instruments provided by multilateral andbilateral sources for energy access include: the significant amount of regulatory and financialsector reforms that may be necessary to enable some countries to absorb increases indevelopment (and other) financing; the need to satisfy multiple criteria in order to applymuch of the available development assistance to energy access projects, particularly thoserelated to renewable sources and climate change; and, the reordering of developmentpriorities thatmay be required of organisations (and the governments behind them) in orderto increase the share of energy-access projects within their portfolios.
Box 13.4 " International Energy and Climate Partnership – Energy+
The International Energy and Climate Partnership – Energy+, an initiative that aimsto increase access to energy and decrease or avoid greenhouse-gas emissions bysupporting efforts to scale up investments in renewable energy and energy efficiency,is a pertinent example of the increasing international recognition of the importance ofprovidingmodern energy access to the poor. It focuses on the inter-related challengesof access to modern energy services and climate change, recognising that both issuesrequire a serious increase in capital financing. The initiative seeks to engage withdeveloping countries to support large-scale transformative change to energy accessand to avoid or reduce energy sector greenhouse-gas emissions. It seeks to apply aresults-based sector level approach and to leverage private capital and carbonmarketfinancing. The Energy+ Partnership aims to co-operate with governments and toleverage private sector investment, to develop commercially viable renewable energyand energy efficiency business opportunities to meet the challenge of increasingaccess to energy in a sustainable manner. The intention is to facilitate increasedmarket readiness by creating the necessary technical, policy and institutionalframeworks. The government of Norway has initiated dialoguewith possible partnersto develop the initiative.
Carbon financing
Carbon finance offers a possible source of income for energy access projects that also helpreduce greenhouse-gas emissions. The revenue is raised through the sale of carbon creditswithin the Clean Development Mechanism (CDM) and voluntary mechanisms. The value ofcarbon credits produced from new CDM projects reached around $7 billion per year priorto the global financial and economic crisis. However, low income regions so far have madelittle use of carbon finance mechanisms to mobilise capital for investment in energy access.Up to June 2011, only 15 CDMprojects, or 0.2% of the total, have been designed to increaseor improve energy access for households.40
The potential for projects to serve both energy access and climate change purposes insub-Saharan Africa is estimated to be large, nearly 1 200 TWh (150 GW) of electricity
40. Data available at UNEP RISOE CDM Pipeline Analysis and Database at www.uneprisoe.org.
© O
EC
D/IE
A, 2
011

Chapter 13 - Energy for all 501
13
generation at an investment cost of $200 billion. In total, these projects could possiblygenerate $98 billion in CDM revenue at a carbon offset price of $10 per tonne of CO2(World Bank, 2011).
Substantial obstacles must first be overcome. Getting any project approved for CDM is atpresent oftena long, uncertain andexpensiveprocess.Upfront costs are incurred todeterminethe emissions baseline and to get the project assessed, registered, monitored and certified.These high transaction costs mean that CDM is not currently practical for small projects. TheCDM Executive Board has taken steps to simplify the requirements for small-scale projectsand for projects in the least developed countries and it is hoped that these and other ongoinginitiatives, such as standardised project baselines, will facilitate the application of the CDMfor energy access projects. The increasing development of programmatic CDM should helpreduce transaction costs by consolidating the small carbon savings of individual accessprojects. National governments in developing countries can act to reap the benefits fromsuch candidates, as recent projects have shown for advanced cookstoves in Togo, Zambia andRwanda, and for household lighting in Bangladesh and Senegal. Rural electrification agenciesor national development banks can act under government direction as co-ordinating andmanaging entities for bundling energy access projects.
Consensus is building on the importance of using carbon finance to support thedevelopment agenda in poor countries. EU legislation provides that carbon credits fromnewprojects registered after 2012 can only be used in the EU Emissions Trading System if theprojects are located in the least developed countries. Such steps provide a more bankablebasis for raising capital. To get capital flowing into energy access projects backed by carbonfinance in low income countries, it remains for national governments fully to empower therelevant national authority to simplify the regulatory requirements and to create the securecommercial environment necessary to win investor confidence. A recent report by theUN Secretary-General’s High-level Advisory Group on Climate Financing (AGF)41 recognisedcarbon offset development as a stimulant for private sector investment. Building privatesector understanding of the process of using carbon finance and confidence in it is animportant objective for all parties.
Developing country government sources
Important sources and forms of finance from within developing countries include thebalance sheet of state-owned utilities, subsidies provided by the government, grants andloans offered by developing country national development banks, and specialised nationalinstitutions and funds, such as rural energy agencies. In many developed countries, gridexpansion is financed from the internally generated funds of private or state-owned utilities.This option is not available where state-owned utilities in developing countries oftenoperate at a loss or rely on state subsidies for capital investment and, sometimes, operating
41. TheUNSecretary-General established aHigh-level AdvisoryGrouponClimate Change Financing on 12 February 2010for a dura!on of ten months. This Group studied poten!al sources of revenue that can enable achievement of the levelof climate change financing that was promised during the United Na!ons Climate Change Conference in Copenhagen inDecember 2009. See www.un.org/climatechnage/agf.
© O
EC
D/IE
A, 2
011

502 World Energy Outlook 2011 - SPECIAL TOPICS
expenditures. Government utilities are nonetheless often a conduit for government fundsin practice. While some are able to borrow on the international or local market, based on agovernment guarantee or good financial track record, many others are not.
Failure by government entities to pay for utility services and politically-imposed limitationson utilities’ ability to enforce payment through disconnection are additional importantbarriers to balance sheet financing by state-owned utilities. Pre-payment meters, whichgained widespread use in South Africa’s electrification programme over the past decade,have helped power companies in many developing countries address the non-paymentissue, although the capital costs of such metering programmes can be a barrier.
Subsidies can be provided from the government budget, sometimes supported by donorfunds (Chapter 14 examines developments in energy subsidies). It is important that subsidiesare used sparingly and are precisely targeted at those unable to pay and at the item theymay have difficulty paying for, usually the connection fee. Unfortunately, many governmentsubsidies in the energy sector are not well targeted (Figure 13.12). A typical example isthe provision of consumption subsidies, including “lifeline” tariffs that provide the first20 to 50 kWh of electricity at below cost to all customers regardless of income. Not onlydoes this waste scarce funds that could be better targeted at poor people, but it foregoes anopportunity to collect cross subsidies from those customers who could afford to pay more.Cross subsidies from customer groups that paymore for their power than the cost to supplythem can be an initial source of funds to help provide energy access to the poor, but are notan efficient long-term solution.
Figure 13.12 " Fossil-fuel subsidies in selected countries, 2010
0 5 10 15 20 25
IndiaChina
IndonesiaThailandPakistan
BangladeshVietnam
South AfricaAngola
PhilippinesSri Lanka
Billion dollars (2010)
Subsidies tolowest 20%income group
Total subsidies
Many developing countries have established development banks to help channelgovernment and donor finance to priority sectors that are not receiving sufficient privateinvestment. National development banks are useful entry points for multilateral andbilateral development institutions seeking to use their lending to the energy-sector,
© O
EC
D/IE
A, 2
011
Chapter 13 - Energy for all 503
13
including to end-users, to generate complementary funding from other sources. Somehave on-lending and credit guarantee programmes with the local banking sector thatmight be adapted to lending for energy access projects. National development banks maysometimes be able to serve as an official guarantor for lending programmes supportedwithdonor financing. In recent years, several developing country governments have establishedagencies specifically to fund and facilitate rural electrification. Some also promote moderncooking facilities, renewables and energy efficiency. Use of rural energy agencies has beenparticularly prevalent in Africa, including in Mali, Tanzania, Zambia, Senegal and Uganda,though they exist in several Asian countries too, including Cambodia and Nepal.
There are many reasons why domestic governments have difficulty in attracting orrepaying financing for energy access. The most notable is poor governance and regulatoryframeworks. The absence of good governance increases risk, so discouraging potentialinvestors. The issue must be tackled.
Private sector sources
Private sector financing sources for energy access investments include international banks,local banks and microfinance institutions, as well as international and domestic projectdevelopers, concessionaires and contractors. Private finance may also come from specialistrisk capital providers, such as venture capital funds, private equity funds and pensionfunds. The main forms of instruments favoured by private sources include equity, debt andmezzanine finance.42 An increasingly important instrument, offered through local banks, isthe extension of credit to end-users, often with guarantees arranged in partnership withmultilateral development banks.
Private investors, enjoying a choice of where to place their money, across countries andacross sectors, respond to tradeoffs between risk and reward. Important issues to tacklewhen seeking to increase private sector investment therefore include the provision of acompetitive rate of return that incentivises private sector performance while representingvalue for money to the public sector, and the clear allocation to the most appropriate partyof responsibility for risk. Existing experience reveals that justifying the business case is notalways easy, and many private sector participants in energy access projects are doing so onthe grounds of broader benefits to the company, such as corporate social responsibility.Despite the challenges, there is significant innovation taking place with several models,products and services in a pilot stage of development. Many potential private sectorparticipants currently view a PPP-type model to be among the most attractive. In instanceswhere the business case for private sector investment is marginal, but there are clearpublic benefits, government support to enhance or guarantee investment returns may beappropriate.
Countries that are seen to be particularly risky, in terms of macroeconomic, political orregulatory stability, either have to assumemore of the risks themselves, by offering credible
42. Mezzanine finance is a hybrid of debt and equity financing. Mezzanine financing is basically debt capital that givesthe lender the right to convert to an ownership or equity interest in the company under certain pre-agreed condi!ons.
© O
EC
D/IE
A, 2
011
504 World Energy Outlook 2011 - SPECIAL TOPICS
guarantees, or seek to have these risks covered by some form of insurance. A strong trackrecord of introducing and implementing robust and equitable government policies canreduce the need for financing guarantees. Important factors for private investors in thepower sector typically include (Lamech and Saeed, 2003):
! A legal framework that defines the rights and obligations of private investors.
! Consumer payment discipline and enforcement.
! Credit enhancement or guarantee from the government or a multilateral agency.
! Independent regulatory processes, free from arbitrary government interference.
International commercial banks have an established record of financing projects in theenergy sector in emerging markets, predominantly in power generation. Pricing finance atmarket rates according to perceived risk, they offer debt financing, mezzanine finance and,in some cases, equity. They can lend to project developers directly or to a special purposevehicle set up to conduct the project. Commercial bank financing terms can be less onerousif certain risks are covered by guarantees from amultilateral development bank or the hostgovernment.
Local financial institutions in many developing countries are unable or unwilling to providecredit to rural energy projects or to the end-users of such projects. The World Bank, UNDPand UNEP, among others, have been involved in pilot projects to create links betweenlocal banks and renewable energy service providers and help them design suitable creditinstruments. Understanding households’ existing energy expenditures is one importantstep towards unlocking end-user finance: poor people often are able to afford the full priceof modern energy because it costs less than the traditional forms it replaces, e.g. kerosenelamps and dry cell batteries, but may be unable to overcome the important hurdle of theinitial capital cost.
Microfinance has been used as part of several programmes to tackle the problem ofend-user financing for energy access, particularly in India and Bangladesh. It has beenfound to be particularly useful for grid connection fees and LPG stoves. The scale of thetransaction is important. Microfinance has proved more problematic in relation to largesolar home systems, where the loan size and consequent payment period can be greaterthan microfinance institutions are used to handling, or in relation to wood-burning stoves,where the transaction costs can be large relative to the loan amounts involved.Microfinanceinstitutions are often part of networks, which act as wholesale lenders to them: thesenetworksmay be able to develop guaranteed lines of credit and related technical assistancefrom larger organisations. However, microfinance institutions and associated networks areoften less prevalent in rural areas, in particular in parts of sub-Saharan Africa.
The main obstacle to obtaining greater private sector financing, apart from uncertaininvestment and regulatory environments and political risks inmany developing countries, isthe lack of a strong business case for tackling theworst cases of energy deprivation, becauseof the inability of users to pay. This issue needs to be squarely faced, through some formof public sector support, if there is to be a breakthrough to universal access to modernenergy. In addition, local financial institutions and microfinance institutions find it difficult
© O
EC
D/IE
A, 2
011

Chapter 13 - Energy for all 505
13
to be sufficiently expert regarding new technologies and may underestimate the potentialcredit-worthiness of poor households, based on the large amount they already pay formoretraditional sources of energy.
Implications for policy
Modern energy services are crucial to economic and social development; yet escalatingglobal energy prices are pushing this fundamental building block further out of reach ofthosemost in need. Evenwith the projected level of investment inmodern energy access of$14 billion per year in the New Policies Scenario, the absolute numbers of people withoutaccess to modern energy in 2030 will be scarcely changed (though the proportion of theglobal population so deprived will have fallen). In sub-Saharan Africa, the numbers withoutmodern energy access will have actually increased. Neither the policies adopted today northe plausible new policies allowed for in the New Policies Scenario will do nearly enough toachieve universal access to modern energy services by 2030.
Global energy access is a necessary prerequisite of global energy security. The barriers toachieving modern energy access are surmountable, as many countries have proven. Whatactions does this analysis suggest that are essential to transform the situation? There arefive:
! Adopt a clear and consistent statement that modern energy access is a political priorityand that policies and funding will be reoriented accordingly. National governments needto adopt a specific, staged energy access target, allocate funds to its achievement anddefine their strategy, implementing measures and the monitoring arrangements to beadopted, with provision for regular public reporting.
! Mobilise additional investment in universal access, above the $14 billion per yearassumed in the New Policies Scenario, of $34 billion per year. The sum is large, but isequivalent to around 3% of global energy infrastructure investment over the period.
! Draw on all sources and forms of investment finance to reflect the varying risks andreturns of the particular solutions adapted to the differing circumstances of thosewithout access to modern energy. To realise the considerable potential for stepping upthe proportional involvement of the private sector, national governments need to adoptstrong governance and regulatory frameworks and invest in internal capacity building.Multilateral and bilateral institutions need to use their funds, where possible, to leveragegreater private sector involvement and encourage the development of replicablebusiness models.
! Concentrate an important part of multilateral and bilateral direct funding on thosedifficult areas of access which do not initially offer an adequate commercial return.Provision of end-user finance is required to overcome the barrier of the initial capitalcost of gaining access to modern energy services. Operating through local banks andmicrofinance arrangements, directly or through guarantees, can support the creation oflocal networks and the necessary capacity in energy sector activity.
© O
EC
D/IE
A, 2
011

506 World Energy Outlook 2011 - SPECIAL TOPICS
! While theWorld Energy Outlook has sought to shed light in this area, it is important thatenergy access programmes and projects make provision for the collection of robust,regular and comprehensive data to quantify the outstanding challenge and monitorprogress towards its elimination. In many ways, providing energy access is an objectivewell suited to development frameworks such as output-based financing, but accuratedata needs to be collected to measure progress.
© O
EC
D/IE
A, 2
011

Chapter 14 - Developments in energy subsidies 507
CHAPTER 14
H I G H L I G H T S
DEVELOPMENTS IN ENERGY SUBSIDIES
The good, the bad and the ugly?
! Energy subsidies have long been utilised by governments to advance particular political,economic, social and environmental goals, or to address problems in the way thatmarkets operate. When they are well-designed, subsidies to renewables and low-carbon energy technologies can bring long-term economic and environmental benefits.However, the costs of subsidies to fossil fuels generally outweigh the benefits.
! Fossil-fuel consumption subsidies amounted to $409 billion in 2010, with subsidies to oilproducts representing almost half of the total. Persistently high oil prices havemade thecost of subsidies unsustainable in many countries and prompted some governments toact. In a global survey, we have identified 37 economies where subsidies exist, with atleast 15 of those having taken steps to phase them out since the start of 2010. Withoutfurther reform, the cost of fossil-fuel consumption subsidies is set to reach $660billion in2020, or 0.7% of global GDP (MER).
! Relative to a baseline in which rates of subsidisation remain unchanged, if fossil-fuelsubsidies were completely phased out by 2020, oil demand savings in 2035 would beequal to 4.4mb/d.Moreover, global primary energy demandwould be cut by nearly 5%and CO2 emissions by 5.8% (2.6 Gt).
! Only 8% of the $409 billion spent on fossil-fuel subsidies in 2010 was distributed to thepoorest 20% of the population, demonstrating that they are an inefficient means ofassisting the poor; other direct forms ofwelfare support would costmuch less.
! Renewable energy subsidies grew to $66 billion in 2010, in line with rising productionof biofuels and electricity from renewable sources. To meet even existing targets forrenewable energy production will involve continuing subsidies. In 2035, subsidies areexpected to reach almost $250 billion per year in theNewPolicies Scenario.
! Unit subsidy costs for renewable energy are expected to decline, due to cost reductionscoupled with rising wholesale prices for electricity and transport fuels. Nonetheless, inall three scenarios most renewable energy sources need to be subsidised in order tocompete in themarket. In theNewPolicies Scenario, onshorewindbecomes competitivearound2020 in theEuropeanUnionand2030 inChina, butnot in theUnitedStatesby theend of theOutlook period.
! By encouraging deployment, renewable-energy subsidies can help cut greenhouse-gasemissions. By 2035, greater use of renewables reduces CO2 emissions by 3.4 Gt in theNew Policies Scenario, compared with the average emissions factor in 2009. Benefits inthe 450 Scenario relative to the New Policies Scenario are even greater: additional CO2emissions savings of 3.5 Gt and fossil-fuel import-bill savings of $350 billion.
© O
EC
D/IE
A, 2
011

508 World Energy Outlook 2011 - SPECIAL TOPICS
Overview of energy subsidiesEnergy subsidies (Box 14.1 provides a definition) have long been used by governmentsto advance particular political, economic, social and environmental goals, or to addressproblems in thewaymarkets operate. It is clear that they are costly. Subsidies that artificiallyreduce end-user prices for fossil fuels amounted to $409 billion in 2010,while subsidies givento renewable energy amounted to $66 billion (Table 14.1).1 Beyond assessing quantitativelythe extent of subsidies to both fossil fuels and renewables, this chapter explores their impacton energy, economic and environmental trends, updating and extending the analyses ofprevious World Energy Outlooks (WEOs). The chapter does not attempt to deal with allforms of energy subsidies, for example, to nuclear energy; it is most comprehensive indiscussing fossil-fuel consumption subsidies (rather than production subsidies, due to datalimitations) and subsidies to renewable energy producers.
Table 14.1 ! Estimated energy subsidies, 2007-2010 ($ billion, nominal)
2007 2008 2009 2010
Fossil fuels (consumption) 342 554 300 409Oil 186 285 122 193Gas 74 135 85 91Coal 0 4 5 3Electricity* 81 130 88 122
Renewable energy 39 44 60 66Biofuels 13 18 21 22Electricity 26 26 39 44
*Fossil-fuel consumption subsidies designated as “electricity” represent subsidies that result from the under-pricing ofelectricity generated only by fossil fuels, i.e. factoring out the component of electricity price subsidies attributable tonuclear and renewable energy.
Fossil-fuel subsidies are often employed to promote economic development or alleviate energypoverty, buthaveproven tobean inefficientmeansof fulfilling theseobjectives, insteadcreatingmarket distortions that encourage wasteful consumption and can lead to unintended negativeconsequences. Moreover, rising international oil prices made their total cost insupportable tomany oil-importing countries in 2010. Volatile energymarkets and the prospect of higher fossil-fuel pricesmean that fossil-fuel subsidies threaten tobeagrowing liability to statebudgets in thefuture. This prospect has created a strong impetus for reform, strengthenedbyother associatedbenefits, includingenergysavings, lowercarbon-dioxide (CO2) emissionsand improvedeconomicefficiency. But fossil-fuel subsidy reform is notoriously difficult as the short-term costs imposedon certain groups of society can be very burdensome and induce fierce political opposition. Inthe case of fossil-fuel consumption subsidies, rising international fuel prices have frequentlyoutpaced the rate at which domestic fuel prices have risen and presented governments withdifficult choices aboutwhether to proceedwith reformplans or protect consumers. If removingthese subsidieswere easy, it would probaly already have happened.
1. Although not addressed in this study, nuclear power is also a recipient of subsidies, which are distributed mainly viamechanisms that assist producers. These include loan guarantees, tax incen#ves, limita#on of u#li#es’ financial liabilityin the event of an accident and grants for research and development.
© O
EC
D/IE
A, 2
011

Chapter 14 - Developments in energy subsidies 509
14
G-20 and APEC leaders in 2009 and 2010 committed to rationalise and phase out overthe medium term inefficient fossil-fuel subsidies (both to producers and consumers) thatencourage wasteful consumption. With respect to fossil-fuel consumption subsidies,progress has beenmixed.While several countries have successfully brought end-user pricescloser to market levels, some of the factors mentioned above have worked against reform.In many countries, the global economic downturn has weakened households’ finances andincreased reliance on subsidies. Several emerging economies in Asia have been grapplingwith high rates of inflation and have been wary of superimposing sudden hikes in energyprices. In parts of theMiddle East and North Africa – a region where fossil-fuel subsidies aresubstantial – political and social unrest has delayed, and in some cases reversed, plans toreform energy pricing.
Box 14.1 ! What is an energy subsidy?
The IEA defines an energy subsidy as any government action directed primarily atthe energy sector that lowers the cost of energy production, raises the price receivedby energy producers or lowers the price paid by energy consumers. This broaddefinition capturesmany diverse forms of support, direct and indirect. Some are easilyrecognised, such as arrangements that make fuel available to consumers at pricesbelow international levels. Othersmay be less so, such as feed-in tariffs that guaranteea premium to power producers for electricity generated from solar panels: theconsumer sees no price benefit (and pays a higher average unit price for electricity),but the producer is enabled to draw on amore costly supply. Related types of subsidyarise from support policies that impose mandates on energy supply, such as portfoliostandards which oblige utilities to buy a certain volume of renewable generation andimplicitly raise the market price for renewables.Energy subsidies are frequently differentiated according to whether they confera benefit to consumers or producers. Consumption subsidies benefit consumersby lowering the prices they pay for energy. They are more prevalent in non-OECDcountries. Production subsidies typically benefit producers by raising the price theyreceive, in order to encourage an expansion of domestic energy supply. They remainan important form of subsidisation in developed and developing countries alike.Subsidies can be further distinguished according to the form of energy they support,for example fossil fuels, renewable energy or nuclear power. Many countries havealready or are currently moving to phase out fossil-fuel subsidies on the groundsthat they are economically costly to taxpayers and encourage wasteful consumption,which also has the effect of worsening damage to the environment through higheremissions of greenhouse gases and other air pollutants. At the same time, manycountries have been introducing subsidies to renewable energy technologies –some of which are still in the early stages of their development – to improve theircompetitiveness and unlock their potential to reduce greenhouse-gas emissions andto improve energy security in the longer term. Unless well-designed and properlytargeted, all types of energy subsidies can lead to an inefficient allocation of resourcesandmarket distortions by encouraging excessive production or consumption.
© O
EC
D/IE
A, 2
011

510 World Energy Outlook 2011 - SPECIAL TOPICS
The deployment of renewable energy often involves some degree of governmentintervention (included, here, in our definition of subsidy) because, for many regions andtechnologies, energy derived from renewable sources remainsmore costly than energy fromfossil fuels. As a result, most renewable electricity and biofuels production capacity built inrecent years has received, or is receiving, some form of subsidy, through direct payments orgovernment mandates. Renewable-energy subsidies are often used to encourage the paceand scale of deployment (most are directed toward producers) and, thereby, to accelerateunit-cost reductions through economies of scale and learning-by-doing. The objective isto improve the future competitiveness of renewable energy compared with conventionalalternatives. Without such support, many forms of renewable energy are projected toremain uncompetitive throughout the Outlook period.Renewable-energy subsidies have also expanded considerably in recent years asgovernments have sought to offset the economic distortions present in market pricing,which fails to put an adequate value on the costs of an insecure and insufficiently diverseenergy supply, or on the costs of local pollution and emissions of climate-change-inducinggreenhouse gases. There are important distinctions that explain moves by governments toincrease renewable-energy subsidies, while phasing out fossil-fuel subsidies. Renewable-energy subsidies are intended to aid the deployment of sustainable technologies in orderto provide long-lasting energy security and environmental benefits. By contrast, fossil-fuelsubsidies, though they may have some near-term benefits, are generally poorly targeted,encourage wasteful consumption and prolong dependence on fuels that are likely to costmore in the future. Most renewable-energy subsidies are intended to make renewableenergy ultimately competitive with conventional alternatives, at which point they would bephased out, whereas fossil-fuel subsidies usually have no expiration date.
Fossil-fuel subsidiesFossil fuels are the recipient of many forms of subsidy, provided through various directand indirect channels. The most common include tax advantages, direct financial transfers,cheap credit, transfer of risk from the private sector to the government, regulation and tradeinstruments. The rationale for subsidies to fossil-fuel consumption is typically either socialor political, such as alleviating energy poverty, redistributing national resource wealth, orpromoting national or regional economic development by conferring an advantage on domesticenergy-consuming industries, often to protect jobs. Subsidies to fossil-fuel production aremotivated by somewhat different goals that include boosting domestic production,maintainingemployment, technology development and social adjustment in declining sectors (Box 14.2).
Both fossil-fuel consumption and production subsidies, by encouraging excessive energyuse, lead to an inefficient allocation of resources and market distortions. While they mayhave well-intentioned objectives, fossil-fuel subsidies have, in practice, usually proved to bean unsuccessful or inefficient means of achieving their stated goals and they invariably haveunintended consequences. This is particularly evident in those energy-importing countriesthat purchase energy at world prices and sell it domestically at lower, regulated prices, wherethe unsustainable financial burdenof fossil-fuel consumption subsidies has becomeapressingreason for reform. In energy-exporting nations, high consumption subsidies can erode export
© O
EC
D/IE
A, 2
011

Chapter 14 - Developments in energy subsidies 511
14
availability and foreign currency earnings. In both, consumption subsidies limit financialresources available for investment in the energy sector, discourage efficient energy use,encourage fuel adulteration and smuggling and lead to increasedenvironmental degradation.2
Box 14.2 ! Support to fossil-fuel production in OECD countries
The measures that directly or indirectly support the production of fossil fuels in OECDcountries vary significantly, dependingon the fuel that benefits fromsuchmeasures.Notall OECD countries produce significant quantities of fossil fuels. Among those that do,some extract crude oil and natural gas, while othersmine coal. Some do both, owing toaparticular set of geographical and geological conditions.Not surprisingly, this variety ofsituations is reflected in the equally diverse array of policies in place in OECD countries.The OECD has recently produced an inventory of those budgetary transfers and taxexpenditures that provide support to the production or use of fossil fuels in a selectednumber of OECD countries (24 countries accounting for about 95%of theOECD’s totalprimary energy supply). This inventory now includes over 250 such measures, whichare tracked over time. The OECD estimates that total support to the production anduse of fossil fuels has ranged between $45 billion and $75 billion per year over theperiod 2005 to 2010.Support to the production of coal is the most visible form of support in OECDcountries. It is also the largest. The OECD estimates that coal (including hard coal,lignite and peat) attracted close to 39% of total fossil-fuel producer support in 2010.The importance of coal in total support is largely explained by the need in Europeto use budgetary transfers and price support to allow a gradual restructuring of thecoal-mining industry in a socially acceptable manner. Coal also receives support inother countries, such as Australia, Canada, Korea and the United States, but at a lowerlevel. It is provided most notably through tax expenditure and funding for researchand development.The OECD Secretariat has estimated that petroleum and natural gas accountedfor about 30% each of total producer support in 2010. Crude oil and naturalgas production are supported mainly through tax breaks, typically in the formof advantageous income-tax deductions, such as depletion allowances and theaccelerated depreciation of capital expenses. Royalty reductions or credits are alsocommonly used to encourage extraction at high-cost ormarginal wells. These featuresof countries’ tax and royalty regimes are often complex and less transparent thandirect expenditures, making country comparisons difficult since the tax expenditureassociated with these policies have to be estimated by reference to country-specificbaselines. Some of thosemeasures relate to aspects of the tax regime that are specificto the resource sector, making the extent of support obscure.
Source: OECD (2011).
2. SeeWEO-2010 for amore detailed discussion of the effects of fossil-fuel subsidies and the ra#onale for reform (IEA, 2010).
© O
EC
D/IE
A, 2
011

512 World Energy Outlook 2011 - SPECIAL TOPICS
Measuring fossil-fuel consumption subsidies
Es!ma!on methodology
The IEA estimates subsidies to fossil fuels that are consumed directly by end-users orconsumed as inputs to electricity generation. The price-gap approach, the most commonlyapplied methodology for quantifying consumption subsidies, is used for this analysis. Itcompares average end-use prices paid by consumers with reference prices that correspondto the full cost of supply.3 The price gap is the amount by which an end-use price falls shortof the reference price and its existence indicates the presence of a subsidy (Figure 14.1). Themethodology is sensitive to the calculation of reference prices. For oil products, natural gasand coal, reference prices are the sumof the internationalmarket price, adjusted for qualitydifferences where applicable, the costs of freight and insurance and internal distribution,and any value-added tax.4 Electricity reference prices are based on the average annual costof production, which depends on themake up of generating capacity, the unsubsidised costof fossil-fuel inputs, and transmission and distribution costs. No other costs, such as forinvestment, are taken into account.
Figure 14.1 ! Illustration of the price-gap methodology: average referenceand retail prices of oil products
0 0.1 0.2 0.3 0.4 0.5 0.6 0.7 0.8
Gasoline
Diesel
LPG
Dollars per litre
Interna`onal price
Freight and insurance
Internal distribu`on
Value-added tax
End-use price
Price gap (subsidy)
Notes: The sum of international price, freight and insurance, internal distribution and value-added tax bar indicates the totalreferenceprice.Gasolineanddiesel pricesare for the transport sector; liquefiedpetroleumgas (LPG)pricesare forhouseholds.
Estimates using the price-gap approach capture only interventions that result in finalprices below those that would prevail in a competitive market. While consumer pricesubsidies account for the vast majority of subsidies to fossil fuels, there are numerousother subsidies which are not captured by the price-gap approach. It does not, for example,capture subsidised research and development. The estimates capture the cost of cross
3. Full details of the price-gap methodology used by the IEA in this analysis are available atwww.worldenergyoutlook.org/subsidies.asp.4. Some countries, such as India, rely on rela#vely low-quality domes#c coal but also import high-quality coal. In such cases,quality differencesmust be taken into account when determining reference prices, as they affect themarket value of a fuel.
© O
EC
D/IE
A, 2
011

Chapter 14 - Developments in energy subsidies 513
14
subsidies, which may subsidise particular regions, technologies or types of consumers byimposing higher prices on another part of the economy (this offsetting component is notincluded). Supply-oriented subsidies that do not result in a lower price to end-users orpower generators are not picked up by our estimates because of the difficulty in identifyingand measuring them. Energy production subsidies have been conservatively estimated tobe at least $100 billion per year (GSI, 2010). Our estimates, which cover only consumptionsubsidies, should be considered a lower bound for the total economic cost of fossil-fuelsubsidies and their impact on energy markets.
For countries that export a given product but charge less for it in the domestic markets, thedomestic subsidies are implicit; they have no direct budgetary impact so as long as the pricecovers the cost of production. The subsidy, in this case, is the opportunity cost of pricingdomestic energy below international market levels, i.e. the rent that could be recovered ifconsumers paid world prices, adjusting for differences in variables such as transportationcosts. For importers, subsidies measured via the price-gap approach may be explicit,representing budget expenditures arising from the domestic sale of imported energy atsubsidised prices, ormay sometimes be implicit.Many countries, Indonesia for example, relyextensively on domestically produced fuels, but supplement domestic supply by importingthe remainder. In such cases, subsidy estimates represent a combination of opportunitycosts and direct expenditures.
Es!mated costs
Fossil-fuel consumption subsidies worldwide are estimated to have totalled $409 billion in2010, about $100 billion higher than in 2009 (Figure 14.2). Subsidies were still well below thelevel of 2008, when they reached more than $550 billion. This estimate is based on a globalsurvey that identified 37 economies as subsidising fossil-fuel consumption; collectively, thisgroup accounted for more than half of global fossil-fuel consumption in 2010 and includesall of the major economies that subsidise end-use prices. Oil products attracted the largestsubsidies, totalling $193 billion (or 47% of the total), followed by natural gas at $91 billion.Fossil-fuel subsidies resulting fromtheunder-pricingof electricitywerealso significant, reaching$122 billion. Subsidies to coal end-use consumptionwere comparatively small at $3 billion.
Figure 14.2 ! Global economic cost of fossil-fuel consumption subsidies by fuel
0
25
50
75
100
125
150
0
100
200
300
400
500
600
2007 2008 2009 2010
Dollarspe
rbarrel(n
omina
l)
Billiond
ollars(no
mina
l) Electricity
Coal
Natural gas
Oil
IEA averagecrude oilimport price(right axis)
© O
EC
D/IE
A, 2
011

514 World Energy Outlook 2011 - SPECIAL TOPICS
Changes in international fuel prices are chiefly responsible for differences in subsidycosts from year to year. The increase in the global amount of subsidy in 2010 closelytracked the sharp rise in international fuel prices. The average IEA crude-oil import priceincreased by 28% between 2009 and 2010; natural gas import prices rose modestly.Higher international prices in 2010 negated or reversed the gains that would haveoccurred in some countries from imposed pricing adjustments, had prices not risen. Theseries of estimates from 2007 to 2010 demonstrates clearly the risk to which governmentsare exposed by regulated domestic prices in international energy markets subject tounpredictable price fluctuations. For net-importing countries, fossil-fuel consumptionsubsidies become particularly difficult to reduce during periods of rising prices, highinflation, uncertain economic growth prospects and fiscal tightening, just when theburden is becoming insupportable. Subsidy estimates can also fluctuate according tochanges in exchange rates and demand patterns. The estimate of fossil-fuel consumptionsubsidies in 2010 would have been higher in the absence of efforts to raise end-user pricestowards more competitive levels, thereby limiting the increase in the price gaps for someproducts.
Fossil-fuel subsidies remain most prevalent in the Middle East, amounting in 2010 to$166 billion, or 41% of the global total. At $81 billion, Iran’s subsidies were the highestof any country, although this figure is expected to fall significantly in the coming yearsif the sweeping energy-pricing reforms that commenced in late 2010 are implementedsuccessfully and prove durable (Figure 14.3). Two leading oil and gas exporters – SaudiArabia and Russia – had the next-highest subsidies in 2010, at $44 billion and $39 billion.Russian subsidies to gas and electricity remain large, despite continuing reformmeasures(see Chapter 7). Of the importing countries, the cost of subsidies was highest in India at$22 billion, followed by China at $21 billion. A total of nine member economies of theG-20 were identified as having fossil-fuel consumption subsidies, collectively amountingto $160 billion. In the 21 member economies from the Asia-Pacific region that constitutethe Asia-Pacific Economic Co-operation (APEC), ten economies were identified that hadfossil-fuel consumption subsidies totalling $105 billion in 2010.
The economic cost of subsidies can bemore completely understoodwhen viewed by othermeasures, such as by percentage of gross domestic product (GDP) or on a per-capita basis(Figure 14.4). In Turkmenistan, for instance, extremely low prices for natural gas meanthat subsidies were equivalent to nearly 20% of the country’s economic output in 2010.At 10% of GDP or more, subsidies also weigh heavily on the economies of Iran, Iraq andUzbekistan. In per-capita terms, subsidies tend to be highest in resource-rich countries ofthe Persian Gulf, ranging from over $350 per person in Iraq to nearly $2 800 in Kuwait.This high level of subsidies is presently paid for in these countries by high revenues fromoil and gas exports during the previous years. While the magnitude of fossil-fuel subsidiesis large in China and India, they are considerably smaller when viewed as a share of theireconomic output or relative to their large populations. In China’s case, subsidies arecomparatively low, at 0.4% of GDP and about $16 per person. The same is true for India,which has subsidies that amount to 1.4% of GDP and $18 per person.
© O
EC
D/IE
A, 2
011

Chapter 14 - Developments in energy subsidies 515
14
Figure 14.3 ! Economic cost of fossil-fuel consumption subsidies by fuelfor top twenty-five economies, 2010
0 10 20 30 40 50 60 70 80 90
IranSaudi Arabia
RussiaIndiaChinaEgypt
VenezuelaUAE
IndonesiaUzbekistan
IraqAlgeriaMexico
ThailandUkraineKuwait
PakistanArgen`naMalaysia
BangladeshTurkmenistanKazakhstan
LibyaQatar
Ecuador
Billion dollars
Oil
Natural gas
Coal
Electricity
For the 37 economies that were identified as having subsidies, fossil fuels weresubsidised at a weighted-average rate of 23%, meaning that their consumers paidroughly 77% of competitive international market reference prices for products(Figure 14.5). The rate of subsidisation was highest among oil and gas exporters inthe Middle East, North Africa and parts of Central Asia, many of which set the priceof domestic fuels above the cost of indigenous production but well below those thatwould prevail in the international market. These have fallen in some cases, such asRussia, where pricing reforms are underway to improve the incentives for investmentand efficiency. Natural gas and fossil-fuel-based electricity were subsidised at averagerates of 53% and 20% in 2010. In addition to the foregone revenues that state-ownedcompanies may face from the under-pricing of energy products to consumers, those inthe electricity and natural gas sectors sometimes bear losses from the under-collectionof bills, which occurs when consumers cannot afford even subsidised energy prices orthere is theft. The subsidisation rate for oil products in the economies studied was about21% in 2010, although some products, such as kerosene and liquefied petroleum gas(LPG), were more heavily subsidised.
© O
EC
D/IE
A, 2
011

516 World Energy Outlook 2011 - SPECIAL TOPICS
Figure 14.4 ! Fossil-fuel consumption subsidies per capita and as apercentage of total GDP in selected economies, 2010
Iran
Saudi Arabia
Venezuela
UAE
Iraq
Kuwait
Algeria
Turkmenistan
Qatar
Libya
0
500
1 000
1 500
2 000
2 500
3 000
0% 5% 10% 15% 25%20%
Subsidies as a share of GDP (MER)
Subsidies as a share of GDP (MER)
Subs
idie
spe
rcap
ita(d
olla
rspe
rcap
ita)
Subs
idie
spe
rcap
ita(d
olla
rspe
rcap
ita)
India
Argentina
Malaysia
Thailand
Pakistan
Bangladesh
Mexico
Indonesia
South Africa
Vietnam
0
50
100
150
200
250
300
0% 1% 2% 3% 4% 5%
Scale
(billion dollars)
See graph
below
RussiaKazakhstan
Ecuador
Ukraine
China
40
10
Egypt
Note: MER = market exchange rate. Circle sizes are propor#onal to the total value of the subsidy and are comparableacross both figures. Uzbekistan is not shown in this figure.
© O
EC
D/IE
A, 2
011

Chapter14-D
evelopments
inenergy
subsidies5
17
14
Figure 14.5 ! Rates of subsidisation for fossil-fuel consumption subsidies, 2010
Above 50%
Between 20% and 50%
Below 20%
This map is for illustrative purposes and is without prejudice to the status of or sovereignty over any territory covered by this map.
Rate of subsidisation
© OECD/IEA, 2011
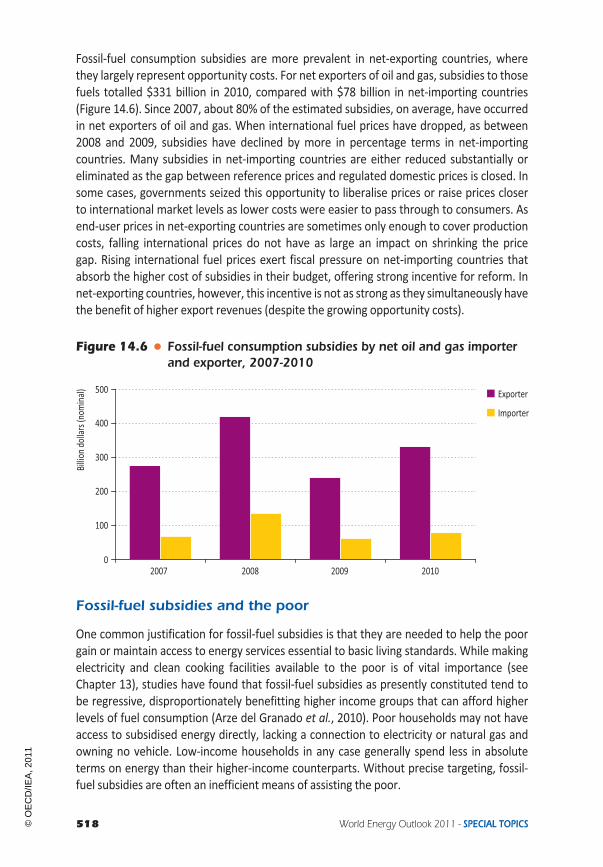
518 World Energy Outlook 2011 - SPECIAL TOPICS
Fossil-fuel consumption subsidies are more prevalent in net-exporting countries, wherethey largely represent opportunity costs. For net exporters of oil and gas, subsidies to thosefuels totalled $331 billion in 2010, compared with $78 billion in net-importing countries(Figure 14.6). Since 2007, about 80% of the estimated subsidies, on average, have occurredin net exporters of oil and gas. When international fuel prices have dropped, as between2008 and 2009, subsidies have declined by more in percentage terms in net-importingcountries. Many subsidies in net-importing countries are either reduced substantially oreliminated as the gap between reference prices and regulated domestic prices is closed. Insome cases, governments seized this opportunity to liberalise prices or raise prices closerto international market levels as lower costs were easier to pass through to consumers. Asend-user prices in net-exporting countries are sometimes only enough to cover productioncosts, falling international prices do not have as large an impact on shrinking the pricegap. Rising international fuel prices exert fiscal pressure on net-importing countries thatabsorb the higher cost of subsidies in their budget, offering strong incentive for reform. Innet-exporting countries, however, this incentive is not as strong as they simultaneously havethe benefit of higher export revenues (despite the growing opportunity costs).
Figure 14.6 ! Fossil-fuel consumption subsidies by net oil and gas importerand exporter, 2007-2010
2007 2008 2009 2010
Billiond
ollars(no
mina
l) Exporter
Importer
0
100
200
300
400
500
Fossil-fuel subsidies and the poor
One common justification for fossil-fuel subsidies is that they are needed to help the poorgain or maintain access to energy services essential to basic living standards. While makingelectricity and clean cooking facilities available to the poor is of vital importance (seeChapter 13), studies have found that fossil-fuel subsidies as presently constituted tend tobe regressive, disproportionately benefitting higher income groups that can afford higherlevels of fuel consumption (Arze del Granado et al., 2010). Poor households may not haveaccess to subsidised energy directly, lacking a connection to electricity or natural gas andowning no vehicle. Low-income households in any case generally spend less in absoluteterms on energy than their higher-income counterparts. Without precise targeting, fossil-fuel subsidies are often an inefficient means of assisting the poor.
© O
EC
D/IE
A, 2
011

Chapter 14 - Developments in energy subsidies 519
14
In practice, the poor capture only a small share of all the subsidies to fossil fuels.We estimate that out of the $409 billion spent on fossil-fuel consumption subsidiesin 2010, only $35 billion, or 8% of the total, reached the poorest income group (thebottom 20%).5 This finding is based on a survey of 11 of the 37 economies identifiedas having fossil-fuel consumption subsidies and does not take into account subsidiesspecifically provided to extend access to basic energy services. The eleven economies,which were selected on the basis of data availability for those that have low levels ofmodern energy access, and have an aggregate population of 3.4 billion, the share oftotal fossil-fuel consumption subsidies reaching the poorest income group ranged fromabout 2% to 11% (Figure 14.7). Among the countries surveyed, the share was lowestfor South Africa.
Figure 14.7 ! Share of fossil-fuel subsidies received by the lowest20% income group in selected economies, 2010
0% 20% 40% 60% 80% 100%
South AfricaSri Lanka
PhilippinesIndia
BangladeshAngola
IndonesiaThailandVietnam
ChinaPakistan Lowest 20%
Remainingpopula`on
Compared to other fuels, subsidies to kerosene tend to be best targeted on the poor,despite its tendency to be sold in the black market. In 2010, nearly 15% of the kerosenesubsidies in the countries analysed reached the lowest income group; subsidies to LPG,gasoline and diesel benefitted the poor least, with only 5% to 6% going to the lowestgroup (Figure 14.8). Despite the utility of LPG as a clean cooking fuel, the up-front costfor infrastructure connections and the practice of selling LPG in larger quantities thankerosene make this fuel less affordable for the poor, elevating the barrier to their gaininginitial access (Shenoy, 2010). Subsidies to electricity and natural gas were in the middleof the range, with shares of 9% and 10% disbursed to the lowest group. These resultsdemonstrate that subsidising fossil fuels is, in practice, an inefficient method of providingassistance to the poor. They also highlight the opportunity for subsidy reform, as the samelevel of financial support could be distributed more efficiently to low-income householdsat a lower cost. In general, social welfare programmes are a more effective and lessdistortionary way of helping the poor than energy subsidies.
5. More informa#on on the methodology can be found at www.worldenergyoutlook.org/subsidies.asp.
© O
EC
D/IE
A, 2
011

520 World Energy Outlook 2011 - SPECIAL TOPICS
Figure 14.8 ! Share of fossil-fuel subsidies received by the lowest20% income group by fuel in surveyed economies, 2010
6%
Diesel
15%
Kerosene
6%
Gasoline
10%
Natural gas
5%
LPG
9%
Electricity
Note: Countries surveyedwere Angola, Bangladesh, China, India, Indonesia, Pakistan, Philippines, South Africa, Sri Lanka,Thailand and Vietnam.
Implications of phasing out fossil-fuel consumption subsidies
Fossil-fuel consumption subsidies induce consumers and producers to trade energyproducts at prices below their true opportunity cost, thereby encouraging additional andoften wasteful consumption of finite resources with adverse economic and environmentalconsequences. Over time, these subsidies can lead to the creation of energy-intensiveindustries that are unable to compete globally on an unsubsidised basis.
This analysis quantifies the economic and environmental gains that could be obtainedfrom removing fossil-fuel consumption subsidies: energy savings, lower CO2 emissionsand reduced fiscal burdens. It is based on simulations using the IEA’s World Energy Model(WEM), assuming the phase-out of all fossil-energy subsidies gradually over the period 2012to 2020. This timeframe is consistent with the “medium term” as discussed in internationalforums such as the G-20 and APEC. Because the economic value of subsidies fluctuates fromyear-to-year, initial subsidisation rates are averaged over themost recent three-year period(2008 to 2010). Savings from eliminating subsidies are presented relative to a baseline casein which average subsidy rates remain unchanged, although the timeframe is extended to2035 since additional benefits are realised even after the phase-out of subsidies is complete.The analysis is intended to illustrate potential gains and should not be interpreted as aprediction; it is unlikely that all subsidies will, in reality, be removed so quickly.
Our analysis shows that, if fossil-fuel consumption subsidies were completely phased outby 2020, global energy demand would be reduced by 3.9%, or about 600 million tonnes oilequivalent (Mtoe) by that year, and 4.8% or some 900 Mtoe by 2035 (Figure 14.9). In theNew Policies Scenario, in which recently announced commitments and plans are assumedto be fully implemented, we project that about three-quarters of this potential would beachieved by 2020.6 The energy savings from subsidy reform result from the higher prices
6. The New Policies Scenario includes other policy measures, in addi#on to some phase-out of fossil-fuel subsidies,which contribute to achieving these savings.
© O
EC
D/IE
A, 2
011

Chapter 14 - Developments in energy subsidies 521
14
that would follow from subsidy removal, incentivising energy conservation and efficiencymeasures. The responsiveness of demand to higher prices varies by country, according tosubsidisation levels and the price elasticity of demand.7
Figure 14.9 ! Impact of fossil-fuel consumption subsidy phase-out on globalfossil-energy demand and CO2 emissions
-3.0
-2.4
-1.8
-1.2
-0.6
0
-1 000
-800
-600
-400
-200
02015 2020 2035
GtMtoe
Gas
Coal
Oil
CO2 emissions(right axis)
Note: Savings from the progressive phase-out of all subsidies by 2020 are compared with a baseline in which subsidyrates remain unchanged.
Subsidy phase-out would measurably trim global oil demand, by about 3.7 million barrelsper day (mb/d) by 20208 and 4.4mb/d, or 4%, by 2035. These cuts stempredominately fromthe transport sector. Demand for transport fuels is relatively inelastic in the short term, buthigher prices (and expectations of such) contribute to greater conservation and the uptakeofmore efficient vehicles long after the phase-out of subsidies has been completed. Naturalgas demand would be cut by 330 billion cubic metres (bcm) in 2020 and 510 bcm, or 9.9%in 2035; the corresponding reduction in coal demand is almost 230 million tonnes of coalequivalent (Mtce) in 2020 and 410Mtce, or 5.3%, in 2035.
Curbing the growth in energy demand via subsidy reform has several important energy-security implications. In net-importing countries, lower energy demand would reduceimport dependence and thereby spending on imports. For net-exporting countries,removing subsidies would boost export availability and earnings. For all countries, it wouldalso improve the competitiveness of renewable energy in relation to conventional fuels andtechnologies, further diversifying the energymix. Lower energy demandwould also alleviateupward pressure on international energy prices, yet the elimination of subsidieswouldmake
7. The price elas#city of demand is the principal determinant of energy and emissions savings from subsidy reform,reflec#ng the extent to which consump#on is responsive to higher prices. Es#mated elas#ci#es vary according to thespecific region, fuel and uses analysed, but generally increase over #me as consumers have opportuni#es to purchasemore energy-efficient equipment and change behaviour.8. This is less than the oil savings in 2020 (4.7 mb/d) es#mated inWEO-2010 because the projec#on period is one yearshorter and subsidisa#on rates at the beginning of the phase-out period were reduced in several countries that haveundertaken reforms.
© O
EC
D/IE
A, 2
011

522 World Energy Outlook 2011 - SPECIAL TOPICS
consumers more responsive to price changes, which should contribute to less volatility ininternational energy markets.
By encouraging higher levels of consumption and waste, subsidies exacerbate the harmfulenvironmental effects of fossil-fuel use and impede development of cleaner energytechnologies. Potential CO2 savings from subsidy phase-out directly reflect the fossil-energysavings. We estimate that energy-related CO2 emissions would be cut by 1.7 gigatonnes(Gt), or 4.7%, in 2020 and 2.6 Gt, or 5.8%, in 2035, relative to the prospects if subsidy ratesremain unchanged (Figure 14.9). Cumulative CO2 emissions over the Outlook period wouldbe lower by 41 Gt. Although not modelled here, other environmental co-benefits wouldarise from subsidy phase-out. In particular, slower demand growth for fossil-fuels wouldreduce emissions of other air pollutants, such as sulphur dioxide (SO2), nitrogen oxides (NOx)and particulates, which cause human health and environmental problems.
High and volatile international energy prices in recent years, and the expectation that theseconditions will persist, have forced many governments to reconsider the affordability offossil-fuel subsidies. Without further subsidy reform, we estimate that the total cost offossil-fuel consumption subsidies would reach $660 billion (in year-2010 dollars) in 2020(0.7% of projected global GDP [MER]), up about 60% from the average level observed overthe period 2007 to 2010. As in the case of the historical estimates, this figure represents amix of implicit and explicit subsidies to fossil-fuel consumption.
Implementing fossil-fuel subsidy reform
Governments face difficult challenges in reforming inefficient fossil-fuel subsidies. Eachcountry must consider its specific circumstances, the types of subsidies that need reformand their intended purpose and effectiveness pursuing economic, political or social goals.Past reforms have had varying levels of success. Many have achieved positive and lastingchange; but some have been planned and implemented poorly, or have succumbed to back-sliding, i.e. governments successfully institute reforms only to reintroduce subsidies later.The risk of adverse consequences if subsidy reform is not carefully planned for and executedis real. Previous experiences have illustrated several barriers to implementing fossil-fuelssubsidy reform and strategies that can help guide future efforts (Figure 14.10).
Inadequate information about existing subsidies is frequently an impediment to reform.Before taking a decision about reform, governments must precisely identify energysubsidies, including their beneficiaries, and quantify their costs and benefits, in order todetermine which subsidies are wasteful or inefficient. If subsidies are failing to serve theirdefined objectives or are leading to unintended adverse consequences (for example, fueladulteration and smuggling), the need for remedial action will be clear. Nonetheless,removing subsidies without understanding and providing for the consequences may hurtvulnerable low-income groups that depend on subsidies for access to basic energy services.Making more information on fossil-fuel subsidies available to the general public can helpbuild support for reform. Disclosure may include data on overall costs and benefits as wellas on price levels, price composition and price changes (Wagner, 2010).
© O
EC
D/IE
A, 2
011

Chapter 14 - Developments in energy subsidies 523
14
S P O T L I G H T
Are the G-20 and APEC commitments being met?
In September 2009, G-20 leaders, gathered at the Pittsburgh Summit, committedto “rationalize and phase out over the medium term inefficient fossil fuel subsidiesthat encourage wasteful consumption”. In November 2009, APEC leaders meeting inSingapore made a similar pledge, thereby broadening the international commitmentto reform. At the request of the G-20, the IEA, the Organisation for EconomicCo-operation and Development (OECD), the Organization of the PetroleumExporting Countries (OPEC) and the World Bank have been collaborating on aseries of reports aimed at guiding policy makers through the implementation offossil-fuel subsidy reform. The latest report in the series (IEA/OECD/OPEC/WorldBank, 2011) was submitted to the 2011 G-20 Summit in Cannes and is available atwww.worldenergyoutlook.org/subsidies.asp.Since making these commitments, many G-20 and APEC member economies havepublicly identified inefficient fossil-fuel consumption and production subsidies andoutlined plans for their removal. These include regulated prices of refined petroleumproducts that are below international levels, financial support to coal industries andpreferential tax provisions related to fossil-fuel production.9 While this represents anencouraging start, much work remains to be done in order to realise the full extent ofbenefits from subsidy reform.Based on our analysis of fossil-fuel consumption subsidies, some members of theG-20 and APEC retain price subsidies that appear to be inefficient, encouragewastefulconsumption and are regressive, but are not earmarked for phase-out or bettertargeting. Of the nine G-20 members identified by the IEA as having price subsidiesthat benefit consumers, seven have disclosed plans for their phase-out, but only somehave been able to raise energy prices and close the price gap. Moreover, membershave failed to identify many existing fossil-fuel production subsidies, an equallyimportant part of the group’s commitment to reform. APEC member economies(those not also in the G-20) have not as yet collectively submitted lists of inefficientfossil-fuel subsidies. Much remains to be done to fulfil the commitments made inthese international forums, both in terms of defining the fossil-fuel subsidies to bephased out and following through with durable and well-designed reform efforts.
Thepolitics of reforming subsidies are challenging. Subsidies createentrenched interests amongdomestic industries advantaged by cheap energy inputs and those income groups that areaccustomed to receiving this form of economic support. Such stakeholders can be expectedto resist subsidy phase-out, particularly in the absence of clear plans to compensate losers ormake the transition gradual. Resistance to fossil-fuel subsidy reform can be particularly strongin major fossil-fuel-exporting countries, where people may feel entitled to benefit directly
9. The list of reforms proposed by G-20 members is available at:www.g20.org/Documents2010/expert/Annexes_of_Report_to_Leaders_G20_Inefficient_Fossil_Fuel_Subsidies.pdf.
© O
EC
D/IE
A, 2
011

524 World Energy Outlook 2011 - SPECIAL TOPICS
from their nation’s resource wealth. Although not always necessary, subsidy reform has abetter chance of success if supported by key interest groups, sometimes achieved throughconsultationwith stakeholders as reform strategies take shape.
Figure 14.10 ! Summary of common barriers to fossil-fuel subsidy reformand strategies for successful implementation
•
•
Collect subsidy data and make it publicly available.
Understand the incidence of subsidies and potential impacts of reform.
•
•
Develop capacity to gather information and administer reforms transparently.
Utilise the technical expertise of independent organisations.
•
•
Better target subsidies to provide access to basic energy services.
Complement phase out with social assistance programmes.
• Allow time for a transition for affected industries.
• Seize opportune moments for reform, low fuel prices or low inflation.i.e.
•
•
Employ a comprehensive strategy for communicating reform plans.
Consult with stakeholders and consider compensating losers.Stakeholder resistance
Economic considerations
Institutional capacity
Information gaps
Impacts on the poor
While the removal of fossil-fuel subsidies generally improves long-term economiccompetitiveness and fiscal balances, fears of negative economic consequences in theshort term can be expected. The phase-out of subsidies must be carried out in a way thatallows both energy and other industries time to adjust, so as to safeguard the communitiesaffected. Energy-price controls are often an important tool for controlling inflation andtheir removal may sometimes be accompanied by other macroeconomic policies to reduceinflationary pressures. Once reforms have been implemented, mounting pressure fromshort-term economic concerns has sometimes led to back-sliding. This risk can bemitigatedif governments dissociate themselves from price-setting, such as when energy prices areliberalised or automatic pricing mechanisms are established.
Even where there is interest in pursuing subsidy reform, certain institutional andadministrative capacity, and even physical infrastructure, is required for governmentsto act effectively. It is important to have institutions that are capable of accurate andtimely collection of data about the existing subsidies, their distribution and the need forcompensation (where necessary) following reform. Governments are well-placed to gatherthis far-reaching information, although other organisations may have integral technicalexpertise that can aid in this effort. Targeted compensation is typically more effectivewhere the necessary administrative capacity exists to reach the intended groups anddistribute benefits reliably and without fraud. Where subsidies are re-targeted to the poorvia direct financial transfers, those eligible to receive supportmay not be registeredwith thegovernment or may lack the means for receiving support, such as having a bank account.Creating new infrastructuremay sometimes be an important element in subsidy reform. Forexample, the availability of public transportation reduces the need for personal vehicles and
© O
EC
D/IE
A, 2
011

Chapter 14 - Developments in energy subsidies 525
14
lessens the burden of the rising cost of transport fuels, although its provision is usually onlyreadily practicable in population centres.
Box 14.3 ! Recent experiences implementing subsidy reform
Iran implemented sweeping reforms to energy subsidies in December 2010 in abid to lessen the burden on its central budget and reverse deep inefficiencies inits energy sector and the larger economy. Prior to the reform, energy prices wereoften subsidised by over 90%. Under the reform programme, the prices of regulargasoline increased by 300%, premium gasoline by 230%, and diesel and gas oil by840%. To date, these higher prices have been maintained, despite the populationhaving been previously accustomed to low energy prices and the limited success(with the exception of its use of smart cards for gasoline rationing) of previousreform attempts. To counter the public sense of entitlement to low energy prices andbuild a case for reform, subsidies were identified and their onerous costs publicisedbefore changes were made. Although details were lacking, the intent to undertakea five-year programme to phase out energy subsidies (that included compensationto consumers) was communicated frequently. To encourage public acceptance anddiminish the economic impact of price increases for households, cash payments weremade to every citizen prior to the effective date and nearly 90% of the populationcontinue to receivemonthly payments. Furthermore, key capabilities were developedto facilitate reform, such as establishing bank accounts for heads of households toreceive government compensation payments. Time will tell whether the reforms willbe permanent, and certain aspects of the programme can be criticised (for example,the lack of discrimination in compensation payments), but its experience thus farreflects serious intent.In El Salvador, the price of LPG cylinders was previously subsidised, benefittingconsumers who could afford to buy larger quantities rather than low-income families.The government raised the price of LPG cylinders tomarket levels in 2011 andbegan toprovide offsetting payments to the poor through electricity bills. This is an interestingexample of targeting assistance to the poor by linking to another household service;the delivery method is not perfect as it fails to offer payments to multiple families ona single connection or those without a connection to the electricity grid.Inequitable distribution of subsidies and the scale of the associated financial liabilities,particularly as international oil prices have risen, provided a strong impetus for reformin Indonesia (Tumiwa et al., 2011). The government accordingly announced in itsMedium-Term Plan in 2010 that it would reduce spending on energy subsidies by 40%by 2013 and eliminate subsidies by 2014. Actual implementationmeasures have beenslowed by macroeconomic concerns and lack of public acceptance. Fuel subsidies toprivate vehicles were to have been phased out, but the programme was postponedin early 2011 because of worries about rising inflation. It will be important for thegovernment to communicate actively the potential benefits to both individuals andthe economy (such as improved competitiveness and freeing government revenuesfor capital investment and social assistance programmes).
© O
EC
D/IE
A, 2
011

526 World Energy Outlook 2011 - SPECIAL TOPICS
Recent developments in fossil-fuel subsidies
The burden of fossil-fuel subsidies on public finances in many countries has provided astrong motive for reform, but progress towards phase-out has been uncertain. Of the37 economies identified in the global survey as having fossil-fuel consumption subsidies, atleast 15 have either implemented reforms or announced related plans since the beginning of2010. Falling prices during the 2008/2009 recession offered awindowof opportunity to alignregulated domestic prices and international prices. This was seized by several governments,but the obstacles to reform have mounted with the return of higher prices. There arerecent examples of progress, but some have struggled to follow-through on subsidy reform(Table 14.2).
Table 14.2 ! Recent developments in fossil-fuel consumption subsidy policiesin selected economies
Recent developments
Angola Increased gasoline and diesel prices by 50% and 38% in September 2010. Plans to reduce fuel subsidies by 20%per year until eliminated.
Argentina Held gasoline prices steady for part of 2011 to shield citizens from the impacts of rising international prices,despite previous efforts to end fuel subsidies.
Bolivia Reversed decision to reduce subsidies to gasoline, diesel and jet fuel in January 2011 due to mounting politicalpressure, strikes and demonstrations.
El Salvador Reformed LPG subsidies in April 2011, instead using targeted cash payments for households consuming lessthan 300 kWh of electricity per month.
India Plans to eliminate cooking gas and kerosene subsidies in a phased manner beginning in April 2012, replacingwith direct cash support to the poor. In June 2011, raised domestic prices for gasoil, LPG and kerosene (by 9%,14% and 20%, respectively).
Indonesia Plans to reduce spending on energy subsidies by 40% by 2013 and fully eliminate fuel subsidies by 2014, butpostponed a restriction of subsidised fuel for private cars in February 2011.
Iran Significantly reduced energy subsidies in December 2010 as the start of a five-year programme to bring theprices of oil products, natural gas and electricity in line with international market levels. Cash payments arebeing made to ease the impact of higher fuel prices.
Jordan Announced an expansion of subsidies in January 2011 by reducing kerosene and gasoline prices.
Malaysia Cut subsidies to gasoline, diesel and LPG in July 2010 as part of a gradual reform programme. However, totalsubsidy bill is expected to double in 2011.
Nigeria Has held gasoline and kerosene prices fixed in 2011 as international prices rose, expanding the subsidy bill.
Pakistan Raised gasoline, diesel and electricity prices in 2011, but price increases have not kept pace with internationalprices. Plans are to reduce the electricity subsidy by 23% this year and gradually phase it out.
Qatar Increased petrol, diesel and kerosene prices by 25% in January 2011.
Syria Announced an expansion of subsidies in 2011: increasing heating oil allowances for public-sector workers inand lowering diesel prices.
Ukraine Raised gas prices for households and electricity generation plants by 50% in August 2010 and announced plansto raise them by 30% in 2011.
© O
EC
D/IE
A, 2
011

Chapter 14 - Developments in energy subsidies 527
14
While the return of higher oil prices in 2010 and 2011 reminded governments of the heavyeconomic liability associated with subsidised prices, many have not been able even to keepdomestic prices increasing in line with the rise in international prices. The cost of subsidiesis expected to grow in 2011 in Pakistan, Qatar and the United Arab Emirates, despite theirhaving raised oil product prices to some extent. The increased prices in Qatar and theUnitedArab Emirates are notable, particularly because both are fossil-energy exporters. Argentina,Malaysia, Morocco, Nigeria, Thailand and Venezuela have frozen prices at times in orderto shield citizens from higher prices, thereby increasing subsidies. Political instability hasmade subsidy reform more challenging across the Middle East and North Africa and, sincelate 2010, strikes, protests and demonstrations have persuaded several governments toreverse efforts to reduce fuel subsidies. In some cases, such as in Bolivia, public oppositionhas stemmed from poorly executed reform.
Renewable-energy subsidies
The development and deployment of renewable energy often involves governmentintervention and subsidies. This occurs because, for many regions and technologies,energy derived from renewable sources is, and is projected to remain throughout theOutlook period, more costly than energy from fossil fuels. On the other hand, some formsof renewable energy are already economic in certain locations and need no subsidy tocompete, particularly hydropower and geothermal. By facilitating deployment and therebyfaster learning, subsidies are intended to lower the cost of renewable energy technologiesin general and improve their future competitiveness.
Important distinctions underlie moves by governments to increase renewable-energysubsidies while phasing out fossil-fuel subsidies. Basically, renewable-energy subsidies areintended to help lower to competitive levels the cost of sustainable technologies that canprovide durable energy security and environmental benefits, though the extent of thesebenefits is not universal for the various types of renewables and depend on their uses andthe regions in which they are deployed. Although fossil-fuel subsidiesmay also deliver somenear-term benefits (such as energy access), consumer subsidies to fossil fuels are generallypoorly targeted, encouragewasteful consumption and prolong dependence on fuels that arelikely to costmore in the future. Reflecting this difference,most renewable-energy subsidiesare time-limited, the aim being to end the need for the subsidy. Fossil-fuel subsidies, on theother hand, usually have no expiration date.
The majority of subsidies to renewables-based electricity and biofuels are producer subsidiesthat raise the price received by renewable energy producers for their output. Unlike fossil-fuelsubsidies, these typically increase the cost of energy services to consumers. Renewable-energysubsidies take a variety of forms, direct and indirect (Table 14.3). Some mechanisms involveovert financial transfers, including tax credits for investment andproductionor premiumsovermarket prices to cover higher production costs. Other interventions, such asmandates, quotasand portfolio obligations, involve less visible transfers, but nonetheless support the uptake ofrenewables at higher cost to society than conventional alternatives. All of these mechanismsfall within the broad definition of energy subsidies adopted by the IEA (Box 14.1).
© O
EC
D/IE
A, 2
011

528 World Energy Outlook 2011 - SPECIAL TOPICS
Table 14.3 ! Common mechanisms for subsidising renewable energy
Description Examples
Trade instruments Tariffs and quotas. Tariffs on imported ethanol.
Regulations Demand guarantees and mandateddeployment rates.
Mandates to blend biofuels with conventional oil-based fuels; renewable electricity standards to reachspecified levels of renewables-based electricity supply.
Tax breaks Direct reductions in tax liability. Tax credits for renewable energy production (PTCs) andinvestment (ITCs).
Credit Low-interest or preferential rateson loans to producers.
Loan guarantees to finance renewable energy projects.
Direct financial transfers Premiums received by producerson top of the market price.
Feed-in tariffs granted to operators for feeding renewableelectricity into the grid.
Note: The list is not exhaustive and is meant to illustrate only the most prevalent mechanisms.
The economic cost of renewable-energy subsidies is borne predominantly bygovernments and consumers, often in combination. Taxpayers fund support whengovernments subsidise renewables, for example, using tax credits. Consumers can alsofund subsidies, for example, through a levy on electricity prices to fund feed-in tariffsor in cases where the private sector passes through additional costs as a charge on allconsumers. Supplymandates, quotas and portfolio obligations that apply proportionatelyto all suppliers often result in a pass-through of additional costs to consumers. Thereare occasional instances when these costs cannot be passed through and the burden isabsorbed by the private sector, such as when end-use prices are regulated. Renewableenergy may involve other associated costs that weigh against potential gains. Theseinclude the need for additional flexible electricity-generating capacity and transmissionand distribution infrastructure investment to integrate variable resources and the life-cycle impacts of biomass production.10
Subsidisation may not be the most cost-effective means of making renewable energymore competitive or to meet broader policy objectives. Internalising the cost of certainexternalities, for example by instituting more widespread or higher CO2 prices, mayrepresent amore economically efficient approach, although there are political hurdles to beovercome. While there have been successes in accelerating the deployment of renewableenergy technologies and lowering their costs, constant attention is needed to evaluate theeconomic efficiency and the effectiveness of the policies being deployed. Choice of theideal mechanism (or, more often, mechanisms) depends in part on national circumstances.In general, policies should provide a framework of incentives that take account of thematurity of the technology and foster a smooth transition towardsmass-market integration,progressively employing market forces (IEA, 2008).
10. Chapter 5 of this report includes a more detailed discussion of integra#on costs for renewable energy in the powersector.WEO-2010 addressed the issue of sustainability of biomass produc#on.
© O
EC
D/IE
A, 2
011

Chapter 14 - Developments in energy subsidies 529
14
Measuring renewable-energy subsidies
Es!ma!on methodology
The methodology employed here for calculating the total cost of renewable-energysubsidies is broadly similar to the approach used to estimate fossil-fuel subsidies: pricegaps are identified, based on the difference between the price paid per unit of renewableenergy and the market value (or reference price) of substitutable fuels or technologies.11We have estimated the costs of subsidies to renewables-based electricity generation andbiofuels (renewables-based transport fuels) and made projections of the level of subsidiesthat would be required to support the required growth of renewables in each of the threescenarios.12 In this manner, our estimates capture most of the subsidies to renewables.The absolute level of renewable-energy subsidies depends on the unit costs of the subsidyneeded tomake renewables competitive, the quantities subsidised and the reference price.Unit subsidy costs of renewables are expected to fall gradually over time thanks to ongoingresearch and development and learning-by-doing, coupled with rising fuel and wholesaleelectricity prices, and higher andmore widespread CO2 prices (Figure 14.11).
Figure 14.11 ! Illustration of the drivers of unit subsidy costs for renewableenergy
Subsidy
needed
Higher fossil
fuel pricesCost of
renewable
energy
Carbon
price
Learning and R&D
Market
value of
energy
Today Future
For renewables-based electricity, subsidies are quantified for 27 countries that presentlymake up about 90% of global electricity generation from biomass, wind, solar photovoltaics(PV) in buildings and geothermal energy. Unit costs derived from these estimates are thenapplied to the renewables-based generation in the remaining countries to arrive at a globalaggregate.13 For historic years, subsidies to renewable electricity are based on the policies inplace in each country. They are measured by calculating the difference between the actual
11. A detailed methodology can be found at www.worldenergyoutlook.org/subsidies.asp.12. Other types of renewable energy –mainly biomass used in buildings – are generally not subsidised.13. Exis#ng small hydropower is not included, but projected new capacity is included. Large hydropower is not included,as it is assumed that it does not, in most cases, need or receive support.
© O
EC
D/IE
A, 2
011
530 World Energy Outlook 2011 - SPECIAL TOPICS
prices paid to generators of renewables-based electricity and wholesale electricity prices,applying that increment across the total volume of renewables-based electricity suppliedunder the support policy. To estimate future subsidies, the additional net economic cost ofrenewables-based output is calculated. The methodology is similar to that used for historicyears, whereby the price paid to generators is assumed to match the cost of productionfor each technology over time, taking account of any cost reductions from learning. In ouranalysis, the total subsidy for renewables-based electricity technologies falls to zero whenthe cost of capacity built in previous years – often at higher costs – has been fully repaid, orwhen wholesale prices have risen to higher levels.
The cost of subsidies to biofuels (mainly ethanol and biodiesel) is assessed for 20 countries,which together account for about 90% of total global biofuels consumption. This figure isthen scaled up to account for the remaining countries to arrive at a global estimate. Tomeasure subsidies to biofuels up to 2010, we havemultiplied the value of the tax advantagegranted to biofuels relative to the oil-based alternatives (gasoline and diesel) by the volumeof biofuels supplied. Where blending mandates exist, implicit subsidies are quantified byaccounting for tax reductions and differences between the prices of ethanol and biodieseland oil-based substitutes on an ex-tax energy-equivalent basis. To estimate the cost ofsubsidies over the Outlook period, ex-tax biofuel prices were compared with gasoline anddiesel prices before taxes, and the difference was multiplied by the amount of biofuelsconsumed. Reference prices for biofuels are calculated using biofuels conversion costs andefficiencies and biomass feedstock prices, projected out to 2035. Where biofuels pricesreach parity with projected fossil-fuel costs over the Outlook period, subsidies are assumedto be eliminated.
The subsidy estimates in this analysis represent the monetary value of most forms ofgovernment intervention that support the deployment and application of renewable energy,irrespective of whether the cost is finally carried by the government (and taxpayer) or theconsumer. However, some subsidies are not captured, including funding for research anddevelopment, grants and loan guarantees. Furthermore, this analysis does not take intoaccount several additional costs associated with renewable energy deployment, such asthe costs of integration and additional flexible capacity to support renewable electricitygeneration (see Chapter 5) or the higher costs for agricultural products.
Es!mated costs of renewable-energy subsidies
Total renewable-energy subsidies worldwide are estimated to have been $66 billion in 2010,a 10% increase over 2009. Of the 2010 total, $44 billion went to renewables-based electricityand $22 billion went to biofuels. In the New Policies Scenario, we project total subsidies torenewable energy in 2035 to increase to nearly $250 billion (in year-2010 dollars) (Figure 14.12).
Renewable-energy subsidies in 2010 were highest in the European Union, at $35 billion,almost double the amount in the United States. Together the two regions account foralmost 80% of the global total. Subsidies to renewable energy during theOutlook period areprojected to growmost in the United States, reaching $70 billion in 2035. This rise is drivenprimarily by the existing biofuels blending mandates and production targets, the latter ofwhich aim to increase volumes of biofuels supply through 2022. Renewable-energy subsidies
© O
EC
D/IE
A, 2
011

Chapter 14 - Developments in energy subsidies 531
14
grow considerably in non-OECD countries towards the end of the Outlook period, as theydeploy large amounts of renewables-based electricity (along with fossil-fuel generation) tomeet burgeoning demand (Figure 14.13).
Figure 14.12 ! Global subsidies to renewables-based electricity and biofuelsby technology and fuel in the New Policies Scenario
0
50
100
150
200
250
2007 2008 2009 2010 2015 2020 2025 2030 2035
Billiond
ollars(2010)
Biodiesel
Ethanol
Other
CSP
Wind
Solar PV
Biomass
Biofuels:
Electricity:
Figure 14.13 ! Global subsidies to renewables-based electricity and biofuelsby region in the New Policies Scenario
0
50
100
150
200
250
2007 2008 2009 2010 2015 2020 2025 2030 2035
Billiond
ollars(2010) Rest of world
India
China
United States
European Union
The higher level of renewables deployment in the 450 Scenario would entail $5.8 trillion intotal subsidies over the Outlook period – $1 trillion more than in the New Policies Scenario.Renewable-energy subsidies grow at comparable rates in the two scenarios until 2020,but accelerate rapidly thereafter in the 450 Scenario, since a substantially higher level ofrenewables deployment is then needed to achieve deep cuts in CO2 emissions. Subsidiesaverage some $190 billion per year between 2020 and 2035 in the 450 Scenario, around 28%more than in the New Policies Scenario.
Es!mated costs of renewable-electricity subsidies
Subsidies to renewables-based electricity – wind, solar PV in buildings, geothermal andbiomass-based technologies – totalled $44 billion in 2010, an increase of 12% over 2009.
© O
EC
D/IE
A, 2
011

532 World Energy Outlook 2011 - SPECIAL TOPICS
This rise was driven by a 22% increase in non-hydro renewables capacity, with wind andsolar PV making up more than 90% of the additions. Renewable-electricity subsidies in2010 were tempered by higher wholesale prices, which effectively narrowed the gap withproduction costs and lowered unit subsidy costs. Additionally, much of the renewable-electricity capacity deployed throughout the year actually generated little output. Totalsubsidies to wind were highest in absolute terms, at $18 billion, receiving, on average,$53 per megawatt-hour (MWh) of output. Solar PV, which produces electricity at a highercost, benefitted from $425/MWh on average. As a result, solar PV received 28% of totalrenewable-electricity subsidies in 2010, despite accounting for only 4% of subsidisedrenewable electricity generation.
In the New Policies Scenario, renewable-electricity subsidies increase to nearly $180 billionin 2035, because of increased deployment and more widespread and stronger supportpolicies. These subsidies help boost global renewables-based capacity by around 2 350 GWbetween today and 2035, allowing generation to nearly triple, increasing by 7 000 terawatt-hours (TWh). The share of subsidies received by each different technology shifts over thenext 25 years, reflecting the respective stages of their development and the timing ofcommercial deployment. For example, unit subsidy costs for wind power fall as it becomesmore competitive, causing total subsidies to wind to decline considerably after 2030, eventhough a significant amount of new capacity comes online. The cumulative extra cost ofrenewables-based electricity in theNewPolicies Scenario is estimated to be $3.3 trillion overtheOutlook period, roughly $750 billion higher than the inWEO-2010 (Box 14.4).
Subsidy costs per unit of output for renewables-based electricity shrink during the Outlookperiod in all three scenarios, as their production costs decline andwholesale electricity pricesincrease. Nonetheless, many renewable technologies still rely on government interventionto support their deployment by 2035. Their cost varies widely according to location, as thequality of renewable resources is site specific and investment costs differ from country tocountry.14 For wind power, for example, critical factors affecting production costs are thestrength and consistency of the wind resource and proximity to existing transmission lines,roads and demand centres. Wholesale electricity prices also vary significantly by region,according to themix of power generation, the cost of fossil fuels and the policy environment.Wholesale electricity prices are set to increase during the Outlook period because ofhigher fuel prices and more widespread and higher carbon pricing. These effects are mostpronounced in the 450 Scenario.
Wind and solar PV technologies experience the strongest growth in output in absoluteterms over the Outlook period in the New Policies Scenario, accounting for more than30% of the total global gross additions to generating capacity and one-fifth of incrementalgeneration from 2009 to 2035. Onshore wind and solar PV in buildings in three regions –China, the European Union and the United States – account for two-thirds of the increasein generation. The best sites, i.e. with the best resources and lowest costs, are normally
14. Comparing average produc#on costs of renewable technologies andwholesale electricity prices does not capture allthe characteris#cs that affect the compe##veness of different genera#ng technologies, including public acceptance andavailability at peak load. The genera#on costs in this sec#on take into account the average costs of the capacity deployedthroughout the Outlook rather than for the best sites only.
© O
EC
D/IE
A, 2
011
Chapter 14 - Developments in energy subsidies 533
14
exploited earlier, but there are exceptions. In the European Union, for example, the bestsites for solar energy are in the southern countries, such as Spain and Italy, yetmost capacityis now being built in Germany.
Box 14.4 ! Why is our estimate of renewables-based electricity subsidieshigher in this year’s Outlook?
Our estimate of cumulative renewables-based electricity subsidies in the NewPoliciesScenario in this year’s Outlook is 30% higher than we estimated last year. There aretwomain reasons for this increase:! Projected wholesale electricity prices are lower, because of the assumption of
lower natural-gas prices and postponed implementation of emissions tradingschemes in several countries. Both delay the point at which certain renewableenergy technologies become competitive. Even when they do, electricity fromcapacity installed before that date continues to be subsidised until the end of itseconomic lifetime (typically 20 to 25 years).
! Wind and solar PV capacity additions accelerated in 2010, accompanied by newpolicies to support further deployment. This acceleration has been included in thelatest projections, increasing the amount of subsidised generation throughout theOutlook period and, therefore, the overall cost of the subsidy.
We have also revised our methodology for calculating subsidies to solar PV inthe buildings sector, which has led to some increase in the estimate. Previously,production costs were compared to end-user prices, but this year subsidies havebeen calculated with respect to the wholesale electricity price, like other forms ofrenewable electricity generation. The wholesale price is considered to be a moreappropriate reference for quantifying subsidies to solar PV in buildings for twomain reasons. First, the difference between the wholesale price and the end-userprice is made up of several additional costs that are not affected by the presenceof distributed generation, such as metering, billing and the other costs of operatingthe electricity system. End-user prices also include the cost of transmission anddistribution, and although distributed generation, such as solar PV, can reduce theneed for some network investment, it does not usually reduce it significantly. Second,end-user prices inmany regions include the cost of support to renewable technologiesand it would not be appropriate to include this in the calculation of the subsidyrequired by solar photovoltaic technology.
In the New Policies Scenario, production costs for onshore wind in China decline by about10% over the Outlook period. With wholesale electricity prices expected to rise, we projectthat onshore wind becomes competitive – and unit subsidy costs are eliminated – byaround 2030; in the European Union, onshore wind becomes competitive around 2020(Figure 14.14a). Onshore wind does not become competitive in the United States by 2035,as wholesale electricity prices are lower than previously expected (due to the increasedavailability of natural gas) and because of the lack of a price for CO2. Production costs
© O
EC
D/IE
A, 2
011

534 World Energy Outlook 2011 - SPECIAL TOPICS
fall more quickly in the 450 Scenario and wholesale electricity prices are higher, bringingforward the dates at which the unit subsidy cost for onshore wind becomes zero.
Figure 14.14 ! Renewable electricity production cost relative to wholesaleprices for selected technologies and regions in the NewPolicies Scenario
0%
20%
40%
60%
80%
100%
120%
140%
160%
180%
2015 2020 2025 2030 2035
China
United States
European Union
Wholesale price
0%
50%
100%
150%
200%
250%
300%
350%
400%
450%
2015 2020 2025 2030 2035
United States
China
European Union
Wholesale price
a) onshore wind
b) solar PV in buildings
Notes: The cost of production is the average long-runmarginal cost at deployed sites over theOutlook period; integrationcosts are excluded.Wholesale electricity prices are taken as the average projected for the respective regions in the NewPolicies Scenario.
Despite steady declines, high production costs prevent solar PV in buildings from becomingcompetitive in both the New Policies or 450 Scenario in all three regions. In the EuropeanUnion, where deployment of solar PV is highest between 2010 and 2035 (and wholesaleelectricity prices are among the most expensive), average production costs drop by about60% over the Outlook period in the New Policies Scenario (Figure 14.14b). By 2035, unitsubsidy costs for solar PV in the European Union are around $75/MWh. In China, unitsubsidy costs for solar PV are $40/MWh in 2035: production costs in China are considerablylower than in the European Union, as are wholesale electricity prices. Unit subsidy costs
© O
EC
D/IE
A, 2
011

Chapter 14 - Developments in energy subsidies 535
14
in the United States decline by about 80% in the New Policies Scenario, falling to about$75/MWh in 2035. In the 450 Scenario, unit support costs for solar PV come downmoderately for theUnited States (to about $65/MWh in 2035) and are onlymarginally lowerin the other two regions, as more deployment shifts to lower-quality sites.
Es!mated costs of biofuels subsidies
Subsidies to biofuels increased by 6% in 2010 compared with 2009, to $22 billion. This wasprimarily the result of higher biofuels supply that was brought forward by existing blendingmandates and, in some countries, was eligible for tax reductions.While cost reductions overthe Outlook period improve the competitiveness of conventional biofuels against gasolineand diesel, rising biofuels use (from 1.3 million barrels of oil equivalent [mboe/d] today to4.4 mboe/d in 2035) results in an increase in the total cost of biofuels subsidies in the NewPolicies Scenario, reaching $67 billion per year in 2035. Conventional biofuels attract the vastmajority of total biofuels subsidies through 2030 while the volumes of advanced biofuelsconsumed are still small. By 2035, advanced biofuels receive $10 billion in subsidies, or a15% share of total biofuels subsidies. The cumulative cost of biofuels subsidies between2011 and 2035 amounts to $1.4 trillion.
With the exception of Brazil, conventional biofuels are generally not cost-competitive withconventional oil-based gasoline, diesel and kerosene-based jet fuel and their deployment istherefore often supported by blendingmandates or other policies. The costs of conventionalbiofuels today vary greatly by region. Sugar cane in Brazil, for example, is generally acheap feedstock compared with the commonly used corn or sugar beet, even if priceshave increased considerably over the past two years as a result of strong El Niño weatherphenomena and low cane renewal rates (F.O. Lichts, 2011). Because sugar cane conversioncosts are low, sugar cane ethanol can be competitive with gasoline, depending on theprevailing sugar prices. By contrast, biodiesel is often produced using vegetable or palm oil,which are high-quality and high-cost feedstocks.
The future competitiveness of conventional biofuels depends critically on the pace at whichtechnology costs can be reduced, and future feedstock prices. For the former, modestcost reductions are generally possible through technology improvements and economiesof scale. As to feedstock costs, the increasing use of conventional biofuels is likely to putupward pressure on prices, due to the competition with other land uses such as food cropproduction. In addition, rising international oil prices will increase the price of fertilisers andtransportation costs. Overall, increasing biomass feedstock prices will offset part of the costreductions achieved in the case of conventional biofuels, so the cost reductions achieved inthe New Policies and 450 Scenarios are modest.
Advanced biofuels potentially offer a way to reduce the problems of environmentalsustainability, cost competitiveness and land-use competition that are associatedwithmanyconventional biofuels (IEA, 2010). Today, advanced biofuels are not available on a largescale. In the New Policies Scenario, advanced biofuels are assumed to be readily available tothemarket by 2020, even though developing and deploying advanced biofuels is challengingand will require a large investment in research and development. Like any new technology,advanced biofuels offer potential cost reductions through technological improvements and
© O
EC
D/IE
A, 2
011

536 World Energy Outlook 2011 - SPECIAL TOPICS
economies of scale, so that average costs in 2035 are projected to be reduced by 23% inthe New Policies Scenario (Figure 14.15). They fall even further in the 450 Scenario, by 29%,where advanced biofuels make up nearly 70% of all biofuels use by 2035 (compared withonly 20% in the New Policies Scenario). Consequently, unit subsidy costs in the 450 Scenariodrop by 57% between 2020 and 2035.
Figure 14.15 ! Indicative biofuels production costs and spot oilproduct prices
NPS: 2010
NPS: 2035
Biofuels costs:
Reduc`on in 450 Scenario
Dollarspe
rlitreo
fgasoline
equiv
alent
0
0.2
0.4
0.6
0.8
1.0
1.2
1.4
Conv. Adv. Conv. Adv.
Oil product spot prices(2008-2010):
Range
Average
Gasoline Ethanol Diesel Biodiesel
Notes: NPS = New Policies Scenario; “Conv.” = conventional; “Adv.” = advanced. The range of gasoline and diesel spotprices is taken from the monthly average in the United States from 2008 to 2010. Biofuels costs are not adjusted bysubsidies; cost variations can be even larger than depicted here, depending on feedstock and region.
Implications for CO2 emissions and import bills
By supporting the deployment of renewables and lowering their costs over time, renewable-energy subsidies can support both energy and environmental policy goals, such aslowering energy import dependency, diversifying energy supplies, reducing greenhouse-gasemissions and mitigating local pollution. In the New Policies Scenario, subsidies underpina rapid expansion of renewable energy, as renewable electricity generation reaches5 900 TWh (excluding large hydro) and biofuels production 4.4 mb/d in 2035. The shareof total renewables in the global energy mix increases from 13% to 18% over the Outlookperiod. This expansion results in considerable CO2 emissions savings. In 2035, renewablesutilisation yield CO2 emissions savings from the power sector (excluding large hydro) ofaround 2.9 Gt comparedwith the emissions that would be generated for the projected levelof electricity generation were there no change in the mix of fuels and technologies (seeChapter 5). Biofuels use for transport corresponds to 0.5 Gt of CO2 emissions savings in 2035,bringing total savings in the two sectors to 3.4 Gt.15
15. In IEA sta#s#cs, CO2 emissions from biofuels (and biomass more generally) are not included in the data for CO2emissions from fuel combus#on. This is to avoid the double-coun#ng of biomass CO2 emissions that are assumed to havebeen released as soon as the biomass is harvested, in line with the 1996 IPCC Guidelines, and are accounted for underland use, land-use change and forestry (LULUCF). Consequently, emissions savings to offset biomass consump#on, suchas forest re-planta#on, are also reported under LULUCF.
© O
EC
D/IE
A, 2
011
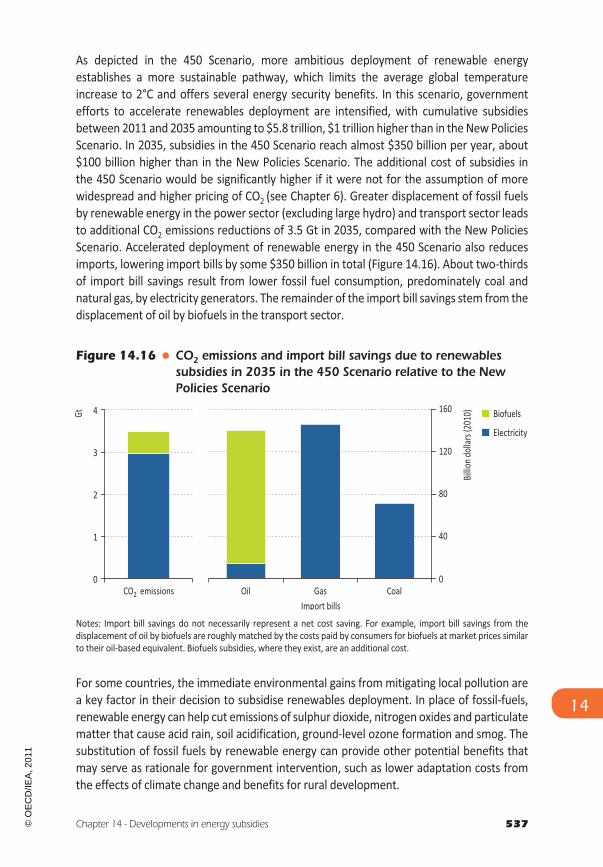
Chapter 14 - Developments in energy subsidies 537
14
As depicted in the 450 Scenario, more ambitious deployment of renewable energyestablishes a more sustainable pathway, which limits the average global temperatureincrease to 2°C and offers several energy security benefits. In this scenario, governmentefforts to accelerate renewables deployment are intensified, with cumulative subsidiesbetween 2011 and 2035 amounting to $5.8 trillion, $1 trillion higher than in theNewPoliciesScenario. In 2035, subsidies in the 450 Scenario reach almost $350 billion per year, about$100 billion higher than in the New Policies Scenario. The additional cost of subsidies inthe 450 Scenario would be significantly higher if it were not for the assumption of morewidespread and higher pricing of CO2 (see Chapter 6). Greater displacement of fossil fuelsby renewable energy in the power sector (excluding large hydro) and transport sector leadsto additional CO2 emissions reductions of 3.5 Gt in 2035, compared with the New PoliciesScenario. Accelerated deployment of renewable energy in the 450 Scenario also reducesimports, lowering import bills by some $350 billion in total (Figure 14.16). About two-thirdsof import bill savings result from lower fossil fuel consumption, predominately coal andnatural gas, by electricity generators. The remainder of the import bill savings stem from thedisplacement of oil by biofuels in the transport sector.
Figure 14.16 ! CO2 emissions and import bill savings due to renewablessubsidies in 2035 in the 450 Scenario relative to the NewPolicies Scenario
0
1
2
3
4Gt
CO2 emissions0
40
80
120
160
Oil Gas Coal
Billiond
ollars(2010) Biofuels
Electricity
Import bills
Notes: Import bill savings do not necessarily represent a net cost saving. For example, import bill savings from thedisplacement of oil by biofuels are roughly matched by the costs paid by consumers for biofuels at market prices similarto their oil-based equivalent. Biofuels subsidies, where they exist, are an additional cost.
For some countries, the immediate environmental gains frommitigating local pollution area key factor in their decision to subsidise renewables deployment. In place of fossil-fuels,renewable energy can help cut emissions of sulphur dioxide, nitrogen oxides and particulatematter that cause acid rain, soil acidification, ground-level ozone formation and smog. Thesubstitution of fossil fuels by renewable energy can provide other potential benefits thatmay serve as rationale for government intervention, such as lower adaptation costs fromthe effects of climate change and benefits for rural development.
© O
EC
D/IE
A, 2
011

538 World Energy Outlook 2011 - SPECIAL TOPICS
Impact of renewable-energy subsidies on end-user electricity prices
In many parts of the world, consumers and businesses have been struggling to cope withhigher electricity prices in recent years. The impact of renewable-electricity subsidies onresidential bills is marginal compared with the impact of rising international coal and naturalgas prices and investment in newgenerating, transmission anddistribution capacity. However,in some cases, rising end-user prices can be attributed to mandated increases in the shareof renewables-based electricity. Renewable-energy subsidies raise the price that producersreceive for their output to cover their higher costs. This additional cost is often passed throughto consumers. The impact of renewable-energy subsidies on retail electricity prices variesdepending on how support mechanisms are designed, the cost of competing non-renewablefuels, the cost of renewable electricity technologies and their volumedeployedover the years.Not all formsof support to renewable energy are reflected in end-user prices, as somearepaidfor by governments. In a few cases, the cost of subsidies is absorbed by state-owned utilities,for instancewhenmandates are applied and end-user prices are regulated.
Figure 14.17 ! Cost of renewables-based electricity subsidies as a percentage ofaverage end-user electricity price in the New Policies Scenario
0%
1%
2%
3%
4%
5%
6%
7%
8%
2010 2015 2020 2025 2030 2035
United States
European Union
Japan
China
Notes: In some countries, notably in the European Union, most of the subsidy is in the form of feed-in tariffs, the cost ofwhich is recovered in final prices to end-users. Elsewhere, end-users may not pay for these costs directly, such as in theUnited States where subsidies are in the form of tax credits.
For the United States, the European Union, Japan and China, the cost of renewable-energysubsidies does not exceed (on average) $12/MWh, or 1.2 US cents/kWh, over the projectionperiod in the New Policies Scenario.16 As a percentage of the electricity price, renewable-energy subsidies are largest in the United States, peaking at over 7% in 2030 (Figure 14.17).In the European Union, renewable-energy subsidies as a percentage of electricity priceslessen after 2020, as an increasing carbon price pushes up the wholesale electricity price,resulting in a reduced subsidy need. The share of subsidies in end-user prices are generally
16. These es#mates are calculated by dividing the annual total renewable support for a country or region by the averageend-user electricity price. They are not a calcula#on of the impact of renewable-energy subsidies on the end-userelectricity price.
© O
EC
D/IE
A, 2
011
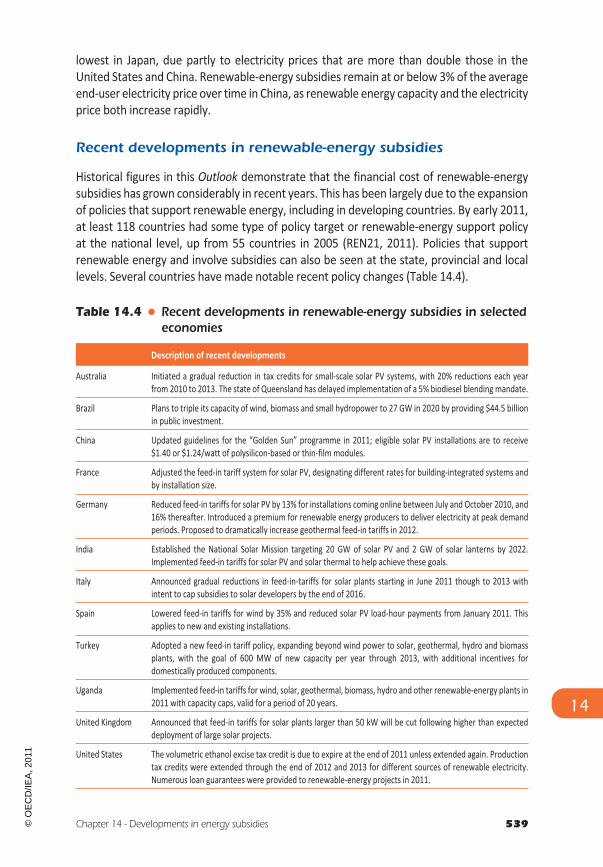
Chapter 14 - Developments in energy subsidies 539
14
lowest in Japan, due partly to electricity prices that are more than double those in theUnited States and China. Renewable-energy subsidies remain at or below 3% of the averageend-user electricity price over time in China, as renewable energy capacity and the electricityprice both increase rapidly.
Recent developments in renewable-energy subsidies
Historical figures in this Outlook demonstrate that the financial cost of renewable-energysubsidies has grown considerably in recent years. This has been largely due to the expansionof policies that support renewable energy, including in developing countries. By early 2011,at least 118 countries had some type of policy target or renewable-energy support policyat the national level, up from 55 countries in 2005 (REN21, 2011). Policies that supportrenewable energy and involve subsidies can also be seen at the state, provincial and locallevels. Several countries have made notable recent policy changes (Table 14.4).
Table 14.4 ! Recent developments in renewable-energy subsidies in selectedeconomies
Description of recent developments
Australia Initiated a gradual reduction in tax credits for small-scale solar PV systems, with 20% reductions each yearfrom 2010 to 2013. The state of Queensland has delayed implementation of a 5% biodiesel blending mandate.
Brazil Plans to triple its capacity of wind, biomass and small hydropower to 27 GW in 2020 by providing $44.5 billionin public investment.
China Updated guidelines for the “Golden Sun” programme in 2011; eligible solar PV installations are to receive$1.40 or $1.24/watt of polysilicon-based or thin-film modules.
France Adjusted the feed-in tariff system for solar PV, designating different rates for building-integrated systems andby installation size.
Germany Reduced feed-in tariffs for solar PV by 13% for installations coming online between July and October 2010, and16% thereafter. Introduced a premium for renewable energy producers to deliver electricity at peak demandperiods. Proposed to dramatically increase geothermal feed-in tariffs in 2012.
India Established the National Solar Mission targeting 20 GW of solar PV and 2 GW of solar lanterns by 2022.Implemented feed-in tariffs for solar PV and solar thermal to help achieve these goals.
Italy Announced gradual reductions in feed-in-tariffs for solar plants starting in June 2011 though to 2013 withintent to cap subsidies to solar developers by the end of 2016.
Spain Lowered feed-in tariffs for wind by 35% and reduced solar PV load-hour payments from January 2011. Thisapplies to new and existing installations.
Turkey Adopted a new feed-in tariff policy, expanding beyond wind power to solar, geothermal, hydro and biomassplants, with the goal of 600 MW of new capacity per year through 2013, with additional incentives fordomestically produced components.
Uganda Implemented feed-in tariffs for wind, solar, geothermal, biomass, hydro and other renewable-energy plants in2011 with capacity caps, valid for a period of 20 years.
United Kingdom Announced that feed-in tariffs for solar plants larger than 50 kW will be cut following higher than expecteddeployment of large solar projects.
United States The volumetric ethanol excise tax credit is due to expire at the end of 2011 unless extended again. Productiontax credits were extended through the end of 2012 and 2013 for different sources of renewable electricity.Numerous loan guarantees were provided to renewable-energy projects in 2011.
© O
EC
D/IE
A, 2
011

540 World Energy Outlook 2011 - SPECIAL TOPICS
While renewable-energy subsidies have been growing strongly, the uncertain outlook forthe global economy and the weak state of public finances is beginning to bring pressureto bear on the maintenance of some subsidies, particularly in OECD countries. Whereasmany countries in Asia, Europe and North America directed part of their stimulus packagestowards renewable energy, in the wake of the 2008/2009 recession, in a bid to boost jobsand economic growth while also addressing climate-change concerns, most of the fundshave now been spent. Some renewable-energy subsidies have already been adjustedand scaled back because of cost reductions from technological improvements or reducedmanufacturing costs, meaning that unit-subsidy rates (for example, feed-in tariffs forsolar power) have declined more quickly than expected. In other cases, renewable-energysubsidy schemes have been adjusted because flaws became apparent in policy design orimplementation. This has revealed some subsidies to be overly generous, unnecessarilypushing up electricity prices and having other unintendedmarket consequences.
© O
EC
D/IE
A, 2
011

ANNEXES
© O
EC
D/IE
A, 2
011

© O
EC
D/IE
A, 2
011

Annex A - Tables for Reference Scenario projections 543
ANNEX A
Annex A - Tables for scenario projections
TABLES FOR SCENARIO PROJECTIONS
General note to the tablesThe tables detail projections for energy demand, gross electricity generation and electricalcapacity, and carbon-dioxide (CO2) emissions from fuel combustion in the Current Policies,New Policies and 450 Scenarios. The following countries and regions are covered: World,OECD1, OECD Americas, the United States, OECD Europe, the European Union, OECD AsiaOceania, Japan, non-OECD, Eastern Europe/Eurasia, Russia, non-OECDAsia, China, India, theMiddle East, Africa, Latin America and Brazil. The definitions for regions, fuels and sectorscan be found in Annex C. By convention, in the table headings CPS and 450 refers to CurrentPolicies and 450 Scenarios respectively.
Data for energy demand, gross electricity generation and CO2 emissions from fuelcombustion up to 2009 are based on IEA statistics, published in Energy Balances of OECDCountries, Energy Balances of Non-OECD Countries and CO2 Emissions from Fuel Combustion.Historical data for electrical capacity is supplemented from the Platts World Electric PowerPlants Database (December 2010 version) and the International Atomic Energy Agency PRISdatabase.
Both in the text of this book and in the tables, rounding may lead to minor differencesbetween totals and the sum of their individual components. Growth rates are calculated ona compound average annual basis and are marked “n.a.” when the base year is zero or thevalue exceeds 200%. Nil values are marked “-”.
Definitional note to the tablesTotal primary energy demand (TPED) is equivalent to power generation plus other energysector excluding electricity and heat, plus total final consumption (TFC) excluding electricityand heat. TPED does not include ambient heat from heat pumps or electricity trade.Sectors comprising TFC include industry, transport, buildings (residential and services) andother (agriculture and non-energy use). Projected electrical capacity is the net result ofexisting capacity plus additions less retirements. Total CO2 includes emissions from otherenergy sector in addition to the power generation and TFC sectors shown in the tables. CO2emissions and energy demand from international marine and aviation bunkers are includedonly at the world transport level. CO2 emissions do not include emissions from industrialwaste and non-renewable municipal waste.
1. Since the lastOutlook, the regional groupings have been updated to incorporate the accession of Chile, Estonia, Israeland Slovenia to the OECD; see Annex C for full details of the new groupings.
© O
EC
D/IE
A, 2
011

544 World Energy Outlook 2011 - ANNEXES
CAAGR (%)
1990 2009 2015 2020 2025 2030 2035 2009 2035 2009!2035TPED 8 785 12 132 13 913 14 769 15 469 16 206 16 961 100 100 1.3Coal 2 233 3 294 3 944 4 083 4 104 4 099 4 101 27 24 0.8Oil 3 226 3 987 4 322 4 384 4 453 4 546 4 645 33 27 0.6Gas 1 671 2 539 2 945 3 214 3 442 3 698 3 928 21 23 1.7Nuclear 526 703 796 929 1 036 1 128 1 212 6 7 2.1Hydro 184 280 334 377 418 450 475 2 3 2.1Biomass and waste 908 1 230 1 375 1 495 1 622 1 761 1 911 10 11 1.7Other renewables 36 99 197 287 394 524 690 1 4 7.8Power generation 2 988 4 572 5 342 5 850 6 276 6 712 7 171 100 100 1.7Coal 1 228 2 144 2 557 2 667 2 705 2 722 2 744 47 38 1.0Oil 377 267 219 189 161 140 135 6 2 !2.6Gas 581 1 003 1 139 1 253 1 361 1 486 1 591 22 22 1.8Nuclear 526 703 796 929 1 036 1 128 1 212 15 17 2.1Hydro 184 280 334 377 418 450 475 6 7 2.1Biomass and waste 60 94 130 187 255 335 429 2 6 6.0Other renewables 32 82 168 248 341 451 586 2 8 7.9Other energy sector 897 1 263 1 423 1 490 1 534 1 584 1 629 100 100 1.0Electricity 182 284 333 365 393 421 448 22 27 1.8TFC 6 292 8 329 9 610 10 177 10 645 11 134 11 629 100 100 1.3Coal 769 818 990 1 002 976 943 910 10 8 0.4Oil 2 607 3 461 3 853 3 958 4 073 4 206 4 325 42 37 0.9Gas 943 1 267 1 490 1 617 1 715 1 816 1 923 15 17 1.6Electricity 835 1 440 1 790 2 033 2 242 2 453 2 670 17 23 2.4Heat 333 253 283 292 294 295 295 3 3 0.6Biomass and waste 801 1 072 1 175 1 234 1 291 1 347 1 402 13 12 1.0Other renewables 4 17 30 40 53 73 104 0 1 7.1Industry 1 809 2 279 2 858 3 089 3 205 3 298 3 388 100 100 1.5Coal 473 640 804 820 804 784 765 28 23 0.7Oil 329 320 352 352 349 341 332 14 10 0.1Gas 359 442 564 636 673 706 736 19 22 2.0Electricity 379 580 781 898 979 1 048 1 118 25 33 2.6Heat 151 110 127 131 127 124 121 5 4 0.4Biomass and waste 116 186 228 252 272 294 315 8 9 2.0Other renewables 0 0 1 1 1 1 1 0 0 2.9Transport 1 579 2 283 2 615 2 734 2 880 3 066 3 257 100 100 1.4Oil 1 483 2 135 2 415 2 499 2 602 2 735 2 863 94 88 1.1Of which: Bunkers 199 329 351 376 398 424 454 14 14 1.2
Electricity 21 23 31 36 41 49 58 1 2 3.6Biofuels 6 52 84 107 135 167 202 2 6 5.4Other fuels 69 73 85 92 101 115 134 3 4 2.3Buildings 2 254 2 844 3 108 3 282 3 449 3 622 3 804 100 100 1.1Coal 241 125 132 124 115 103 90 4 2 !1.2Oil 329 327 341 338 332 324 313 12 8 !0.2Gas 431 612 674 716 759 803 850 22 22 1.3Electricity 404 796 926 1 042 1 157 1 284 1 414 28 37 2.2Heat 172 140 152 158 164 168 170 5 4 0.8Biomass and waste 673 828 855 867 873 873 870 29 23 0.2Other renewables 4 17 28 37 49 68 97 1 3 7.0Other 651 923 1 029 1 072 1 111 1 148 1 180 100 100 0.9
Energy demand (Mtoe) Shares (%)
World: New Policies Scenario
© O
EC
D/IE
A, 2
011

Annex A - Tables for scenario projections 545
A
2020 2030 2035 2020 2030 2035CPS 450 CPS 450
TPED 15 124 17 173 18 302 14 185 14 561 14 870 100 100 1.6 0.8Coal 4 416 5 060 5 419 3 716 2 606 2 316 30 16 1.9 !1.3Oil 4 482 4 808 4 992 4 182 3 905 3 671 27 25 0.9 !0.3Gas 3 247 3 848 4 206 3 030 3 237 3 208 23 22 2.0 0.9Nuclear 908 1 024 1 054 973 1 452 1 664 6 11 1.6 3.4Hydro 366 419 442 391 488 520 2 3 1.8 2.4Biomass and waste 1 449 1 617 1 707 1 554 2 055 2 329 9 16 1.3 2.5Other renewables 256 397 481 339 817 1 161 3 8 6.3 9.9Power generation 6 070 7 297 8 002 5 553 5 815 6 149 100 100 2.2 1.1Coal 2 957 3 547 3 883 2 376 1 400 1 163 49 19 2.3 !2.3Oil 201 157 152 171 105 95 2 2 !2.1 !3.9Gas 1 247 1 535 1 729 1 144 1 217 1 130 22 18 2.1 0.5Nuclear 908 1 024 1 054 973 1 452 1 664 13 27 1.6 3.4Hydro 366 419 442 391 488 520 6 8 1.8 2.4Biomass and waste 172 273 332 206 434 576 4 9 5.0 7.2Other renewables 219 341 410 293 720 1 002 5 16 6.4 10.1Other energy sector 1 522 1 685 1 766 1 428 1 408 1 386 100 100 1.3 0.4Electricity 375 452 493 348 373 386 28 28 2.1 1.2TFC 10 348 11 619 12 303 9 841 10 259 10 400 100 100 1.5 0.9Coal 1 031 1 031 1 023 944 825 771 8 7 0.9 !0.2Oil 4 043 4 455 4 663 3 781 3 618 3 421 38 33 1.2 !0.0Gas 1 651 1 895 2 033 1 560 1 676 1 740 17 17 1.8 1.2Electricity 2 082 2 598 2 893 1 960 2 241 2 386 24 23 2.7 2.0Heat 301 318 325 275 259 250 3 2 1.0 !0.0Biomass and waste 1 204 1 267 1 296 1 275 1 542 1 672 11 16 0.7 1.7Other renewables 36 56 71 46 98 160 1 2 5.6 8.9Industry 3 153 3 511 3 695 2 981 3 074 3 090 100 100 1.9 1.2Coal 843 860 865 773 686 650 23 21 1.2 0.1Oil 361 366 365 344 332 316 10 10 0.5 !0.0Gas 655 752 802 624 678 695 22 22 2.3 1.8Electricity 920 1 129 1 243 861 956 989 34 32 3.0 2.1Heat 135 137 137 125 115 110 4 4 0.9 0.0Biomass and waste 239 266 282 252 303 326 8 11 1.6 2.2Other renewables 1 1 1 1 2 3 0 0 2.9 7.7Transport 2 776 3 218 3 466 2 628 2 746 2 744 100 100 1.6 0.7Oil 2 553 2 924 3 124 2 367 2 248 2 090 90 76 1.5 !0.1Of which: Bunkers 375 432 468 364 380 388 14 14 1.4 0.6Electricity 35 46 53 39 79 133 2 5 3.2 6.9Biofuels 97 135 159 127 294 370 5 13 4.4 7.9Other fuels 92 113 130 94 125 150 4 5 2.2 2.8Buildings 3 331 3 720 3 935 3 166 3 309 3 409 100 100 1.3 0.7Coal 130 112 100 115 85 69 3 2 !0.8 !2.3Oil 347 342 337 314 265 239 9 7 0.1 !1.2Gas 729 835 896 672 690 705 23 21 1.5 0.5Electricity 1 068 1 346 1 508 1 003 1 137 1 189 38 35 2.5 1.6Heat 163 177 184 146 140 136 5 4 1.1 !0.1Biomass and waste 859 854 844 873 901 920 21 27 0.1 0.4Other renewables 34 53 67 43 91 150 2 4 5.5 8.8Other 1 088 1 171 1 208 1 066 1 130 1 157 100 100 1.0 0.9
Current Policies Scenario 450 Scenario2035
CAAGR (%)2009!2035
Energy demand (Mtoe) Shares (%)
World: Current Policies and 450 Scenarios
© O
EC
D/IE
A, 2
011
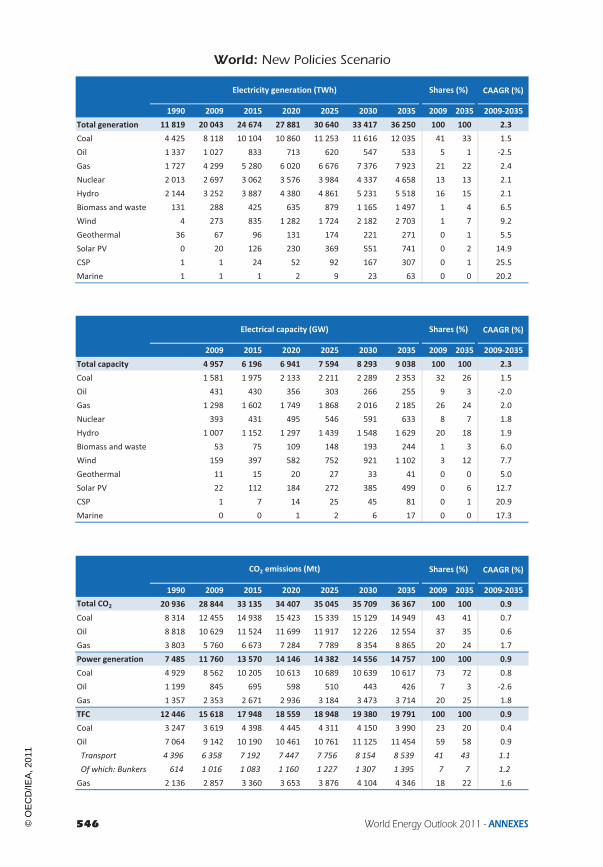
546 World Energy Outlook 2011 - ANNEXES
CAAGR (%)
1990 2009 2015 2020 2025 2030 2035 2009 2035 2009!2035Total generation 11 819 20 043 24 674 27 881 30 640 33 417 36 250 100 100 2.3Coal 4 425 8 118 10 104 10 860 11 253 11 616 12 035 41 33 1.5Oil 1 337 1 027 833 713 620 547 533 5 1 !2.5Gas 1 727 4 299 5 280 6 020 6 676 7 376 7 923 21 22 2.4Nuclear 2 013 2 697 3 062 3 576 3 984 4 337 4 658 13 13 2.1Hydro 2 144 3 252 3 887 4 380 4 861 5 231 5 518 16 15 2.1Biomass and waste 131 288 425 635 879 1 165 1 497 1 4 6.5Wind 4 273 835 1 282 1 724 2 182 2 703 1 7 9.2Geothermal 36 67 96 131 174 221 271 0 1 5.5Solar PV 0 20 126 230 369 551 741 0 2 14.9CSP 1 1 24 52 92 167 307 0 1 25.5Marine 1 1 1 2 9 23 63 0 0 20.2
CAAGR (%)
2009 2015 2020 2025 2030 2035 2009 2035 2009!2035Total capacity 4 957 6 196 6 941 7 594 8 293 9 038 100 100 2.3Coal 1 581 1 975 2 133 2 211 2 289 2 353 32 26 1.5Oil 431 430 356 303 266 255 9 3 !2.0Gas 1 298 1 602 1 749 1 868 2 016 2 185 26 24 2.0Nuclear 393 431 495 546 591 633 8 7 1.8Hydro 1 007 1 152 1 297 1 439 1 548 1 629 20 18 1.9Biomass and waste 53 75 109 148 193 244 1 3 6.0Wind 159 397 582 752 921 1 102 3 12 7.7Geothermal 11 15 20 27 33 41 0 0 5.0Solar PV 22 112 184 272 385 499 0 6 12.7CSP 1 7 14 25 45 81 0 1 20.9Marine 0 0 1 2 6 17 0 0 17.3
CAAGR (%)
1990 2009 2015 2020 2025 2030 2035 2009 2035 2009!2035Total CO2 20 936 28 844 33 135 34 407 35 045 35 709 36 367 100 100 0.9Coal 8 314 12 455 14 938 15 423 15 339 15 129 14 949 43 41 0.7Oil 8 818 10 629 11 524 11 699 11 917 12 226 12 554 37 35 0.6Gas 3 803 5 760 6 673 7 284 7 789 8 354 8 865 20 24 1.7Power generation 7 485 11 760 13 570 14 146 14 382 14 556 14 757 100 100 0.9Coal 4 929 8 562 10 205 10 613 10 689 10 639 10 617 73 72 0.8Oil 1 199 845 695 598 510 443 426 7 3 !2.6Gas 1 357 2 353 2 671 2 936 3 184 3 473 3 714 20 25 1.8TFC 12 446 15 618 17 948 18 559 18 948 19 380 19 791 100 100 0.9Coal 3 247 3 619 4 398 4 445 4 311 4 150 3 990 23 20 0.4Oil 7 064 9 142 10 190 10 461 10 761 11 125 11 454 59 58 0.9Transport 4 396 6 358 7 192 7 447 7 756 8 154 8 539 41 43 1.1Of which: Bunkers 614 1 016 1 083 1 160 1 227 1 307 1 395 7 7 1.2Gas 2 136 2 857 3 360 3 653 3 876 4 104 4 346 18 22 1.6
Electrical capacity (GW) Shares (%)
CO2 emissions (Mt) Shares (%)
Shares (%)Electricity generation (TWh)
World: New Policies Scenario
© O
EC
D/IE
A, 2
011
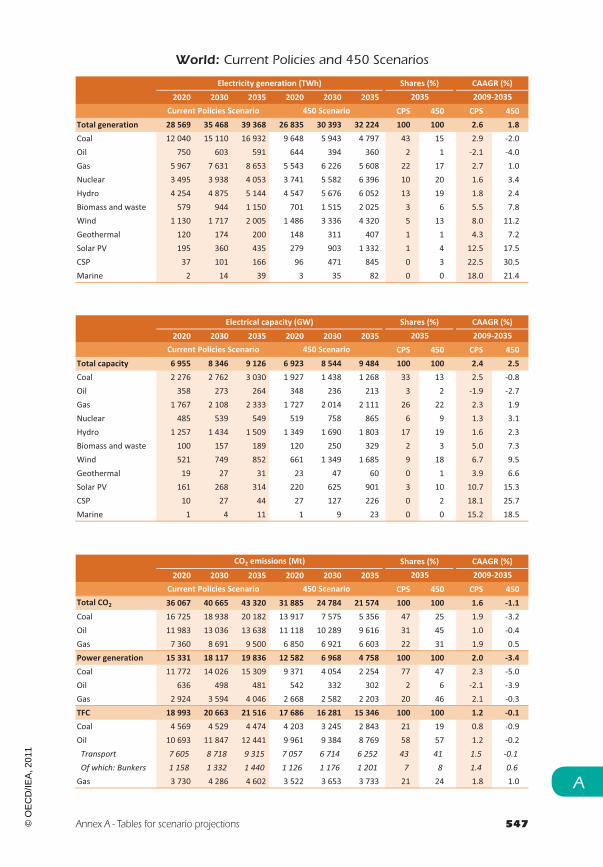
Annex A - Tables for scenario projections 547
A
2020 2030 2035 2020 2030 2035CPS 450 CPS 450
Total generation 28 569 35 468 39 368 26 835 30 393 32 224 100 100 2.6 1.8Coal 12 040 15 110 16 932 9 648 5 943 4 797 43 15 2.9 !2.0Oil 750 603 591 644 394 360 2 1 !2.1 !4.0Gas 5 967 7 631 8 653 5 543 6 226 5 608 22 17 2.7 1.0Nuclear 3 495 3 938 4 053 3 741 5 582 6 396 10 20 1.6 3.4Hydro 4 254 4 875 5 144 4 547 5 676 6 052 13 19 1.8 2.4Biomass and waste 579 944 1 150 701 1 515 2 025 3 6 5.5 7.8Wind 1 130 1 717 2 005 1 486 3 336 4 320 5 13 8.0 11.2Geothermal 120 174 200 148 311 407 1 1 4.3 7.2Solar PV 195 360 435 279 903 1 332 1 4 12.5 17.5CSP 37 101 166 96 471 845 0 3 22.5 30.5Marine 2 14 39 3 35 82 0 0 18.0 21.4
2020 2030 2035 2020 2030 2035CPS 450 CPS 450
Total capacity 6 955 8 346 9 126 6 923 8 544 9 484 100 100 2.4 2.5Coal 2 276 2 762 3 030 1 927 1 438 1 268 33 13 2.5 !0.8Oil 358 273 264 348 236 213 3 2 !1.9 !2.7Gas 1 767 2 108 2 333 1 727 2 014 2 111 26 22 2.3 1.9Nuclear 485 539 549 519 758 865 6 9 1.3 3.1Hydro 1 257 1 434 1 509 1 349 1 690 1 803 17 19 1.6 2.3Biomass and waste 100 157 189 120 250 329 2 3 5.0 7.3Wind 521 749 852 661 1 349 1 685 9 18 6.7 9.5Geothermal 19 27 31 23 47 60 0 1 3.9 6.6Solar PV 161 268 314 220 625 901 3 10 10.7 15.3CSP 10 27 44 27 127 226 0 2 18.1 25.7Marine 1 4 11 1 9 23 0 0 15.2 18.5
2020 2030 2035 2020 2030 2035CPS 450 CPS 450
Total CO2 36 067 40 665 43 320 31 885 24 784 21 574 100 100 1.6 !1.1Coal 16 725 18 938 20 182 13 917 7 575 5 356 47 25 1.9 !3.2Oil 11 983 13 036 13 638 11 118 10 289 9 616 31 45 1.0 !0.4Gas 7 360 8 691 9 500 6 850 6 921 6 603 22 31 1.9 0.5Power generation 15 331 18 117 19 836 12 582 6 968 4 758 100 100 2.0 !3.4Coal 11 772 14 026 15 309 9 371 4 054 2 254 77 47 2.3 !5.0Oil 636 498 481 542 332 302 2 6 !2.1 !3.9Gas 2 924 3 594 4 046 2 668 2 582 2 203 20 46 2.1 !0.3TFC 18 993 20 663 21 516 17 686 16 281 15 346 100 100 1.2 !0.1Coal 4 569 4 529 4 474 4 203 3 245 2 843 21 19 0.8 !0.9Oil 10 693 11 847 12 441 9 961 9 384 8 769 58 57 1.2 !0.2Transport 7 605 8 718 9 315 7 057 6 714 6 252 43 41 1.5 !0.1Of which: Bunkers 1 158 1 332 1 440 1 126 1 176 1 201 7 8 1.4 0.6Gas 3 730 4 286 4 602 3 522 3 653 3 733 21 24 1.8 1.0
Current Policies Scenario 450 Scenario
Electricity generation (TWh)
Electrical capacity (GW)
CO2 emissions (Mt)
Current Policies Scenario 450 Scenario
Current Policies Scenario 450 Scenario
CAAGR (%)2009!2035
Shares (%)
2035Shares (%) CAAGR (%)
2009!2035
2035
2035
Shares (%) CAAGR (%)2009!2035
World: Current Policies and 450 Scenarios
© O
EC
D/IE
A, 2
011

548 World Energy Outlook 2011 - ANNEXES
CAAGR (%)
1990 2009 2015 2020 2025 2030 2035 2009 2035 2009!2035TPED 4 521 5 236 5 549 5 575 5 598 5 640 5 681 100 100 0.3Coal 1 080 1 033 1 097 1 046 984 896 802 20 14 !1.0Oil 1 870 1 958 1 946 1 856 1 768 1 700 1 640 37 29 !0.7Gas 843 1 248 1 362 1 404 1 438 1 486 1 516 24 27 0.7Nuclear 451 585 610 635 662 691 722 11 13 0.8Hydro 102 114 122 127 131 134 137 2 2 0.7Biomass and waste 146 242 305 357 415 477 542 5 10 3.1Other renewables 29 56 107 152 200 255 322 1 6 6.9Power generation 1 719 2 175 2 322 2 370 2 422 2 473 2 503 100 100 0.5Coal 759 846 870 823 767 686 593 39 24 !1.4Oil 154 75 51 35 26 24 23 3 1 !4.5Gas 176 434 479 501 521 556 575 20 23 1.1Nuclear 451 585 610 635 662 691 722 27 29 0.8Hydro 102 114 122 127 131 134 137 5 5 0.7Biomass and waste 53 74 94 115 138 162 185 3 7 3.6Other renewables 25 48 94 134 176 220 268 2 11 6.8Other energy sector 398 447 453 451 449 446 444 100 100 !0.0Electricity 105 123 129 130 132 133 132 27 30 0.3TFC 3 110 3 581 3 837 3 866 3 884 3 919 3 962 100 100 0.4Coal 236 115 137 132 125 118 111 3 3 !0.1Oil 1 593 1 752 1 782 1 719 1 649 1 593 1 545 49 39 !0.5Gas 589 709 774 787 797 804 810 20 20 0.5Electricity 552 771 857 902 943 982 1 012 22 26 1.1Heat 43 59 65 67 70 72 73 2 2 0.8Biomass and waste 94 167 210 242 276 315 356 5 9 3.0Other renewables 4 8 12 17 24 36 54 0 1 7.5Industry 830 773 896 909 908 901 889 100 100 0.5Coal 161 90 111 107 102 97 91 12 10 0.0Oil 169 114 112 106 101 95 88 15 10 !1.0Gas 226 236 277 279 277 274 268 31 30 0.5Electricity 222 239 285 294 297 297 295 31 33 0.8Heat 15 24 26 26 25 25 24 3 3 0.0Biomass and waste 37 69 86 96 104 114 123 9 14 2.3Other renewables 0 0 0 0 1 1 1 0 0 2.8Transport 941 1 172 1 220 1 188 1 152 1 136 1 135 100 100 !0.1Oil 914 1 106 1 131 1 083 1 027 987 958 94 84 !0.5Electricity 8 10 12 13 15 17 20 1 2 2.8Biofuels 0 35 55 68 83 101 120 3 11 4.8Other fuels 19 21 23 24 27 31 38 2 3 2.3Buildings 986 1 225 1 293 1 344 1 399 1 456 1 514 100 100 0.8Coal 71 21 23 21 20 18 17 2 1 !0.8Oil 209 166 160 154 147 139 130 14 9 !1.0Gas 304 420 441 450 458 465 470 34 31 0.4Electricity 316 514 552 586 623 660 690 42 46 1.1Heat 27 35 39 41 44 47 49 3 3 1.3Biomass and waste 56 61 68 76 85 97 110 5 7 2.3Other renewables 4 8 11 15 22 32 49 1 3 7.3Other 353 411 428 425 426 425 423 100 100 0.1
Energy demand (Mtoe) Shares (%)
OECD: New Policies Scenario
© O
EC
D/IE
A, 2
011

Annex A - Tables for scenario projections 549
A
2020 2030 2035 2020 2030 2035CPS 450 CPS 450
TPED 5 657 5 837 5 946 5 416 5 221 5 196 100 100 0.5 !0.0Coal 1 126 1 132 1 111 980 498 436 19 8 0.3 !3.3Oil 1 895 1 793 1 761 1 773 1 411 1 209 30 23 !0.4 !1.8Gas 1 411 1 516 1 587 1 315 1 322 1 216 27 23 0.9 !0.1Nuclear 620 636 642 647 828 900 11 17 0.4 1.7Hydro 126 131 133 129 140 145 2 3 0.6 0.9Biomass and waste 340 422 468 397 638 760 8 15 2.6 4.5Other renewables 139 208 245 174 383 530 4 10 5.8 9.0Power generation 2 409 2 580 2 655 2 300 2 289 2 355 100 100 0.8 0.3Coal 895 902 876 772 317 263 33 11 0.1 !4.4Oil 37 26 25 30 17 15 1 1 !4.2 !5.9Gas 499 558 605 447 472 379 23 16 1.3 !0.5Nuclear 620 636 642 647 828 900 24 38 0.4 1.7Hydro 126 131 133 129 140 145 5 6 0.6 0.9Biomass and waste 109 148 167 119 184 219 6 9 3.2 4.2Other renewables 123 180 208 154 331 434 8 18 5.8 8.8Other energy sector 459 466 472 434 400 379 100 100 0.2 !0.6Electricity 132 139 140 127 123 121 30 32 0.5 !0.1TFC 3 916 4 028 4 107 3 767 3 658 3 608 100 100 0.5 0.0Coal 138 129 124 122 99 89 3 2 0.3 !1.0Oil 1 755 1 682 1 662 1 645 1 325 1 143 40 32 !0.2 !1.6Gas 795 828 847 757 733 725 21 20 0.7 0.1Electricity 912 1 011 1 059 883 934 958 26 27 1.2 0.8Heat 69 75 78 63 61 58 2 2 1.1 !0.0Biomass and waste 231 274 300 277 454 540 7 15 2.3 4.6Other renewables 16 28 37 20 53 95 1 3 6.0 9.9Industry 916 927 927 884 859 836 100 100 0.7 0.3Coal 112 106 102 99 83 76 11 9 0.5 !0.7Oil 109 100 95 104 94 86 10 10 !0.7 !1.1Gas 282 283 283 273 260 251 30 30 0.7 0.2Electricity 298 312 317 286 280 272 34 33 1.1 0.5Heat 26 26 26 25 23 22 3 3 0.3 !0.3Biomass and waste 89 99 105 97 119 129 11 15 1.6 2.4Other renewables 0 1 1 0 1 1 0 0 2.8 3.1Transport 1 212 1 190 1 203 1 158 1 028 961 100 100 0.1 !0.8Oil 1 109 1 060 1 055 1 037 783 638 88 66 !0.2 !2.1Electricity 13 16 17 14 36 68 1 7 2.3 7.9Biofuels 66 85 97 79 172 207 8 22 4.0 7.0Other fuels 24 29 34 28 38 48 3 5 1.8 3.2Buildings 1 357 1 481 1 549 1 298 1 345 1 387 100 100 0.9 0.5Coal 22 19 19 19 13 10 1 1 !0.4 !2.9Oil 156 144 136 139 102 83 9 6 !0.8 !2.6Gas 455 482 497 424 404 395 32 29 0.6 !0.2Electricity 593 674 716 575 611 611 46 44 1.3 0.7Heat 43 49 52 37 37 36 3 3 1.5 0.1Biomass and waste 73 87 95 86 129 162 6 12 1.7 3.8Other renewables 15 25 34 18 49 90 2 6 5.9 9.9Other 432 431 428 426 426 424 100 100 0.2 0.1
Current Policies Scenario 450 Scenario
Energy demand (Mtoe) Shares (%) CAAGR (%)2035 2009!2035
OECD: Current Policies and 450 Scenarios
© O
EC
D/IE
A, 2
011

550 World Energy Outlook 2011 - ANNEXES
CAAGR (%)
1990 2009 2015 2020 2025 2030 2035 2009 2035 2009!2035Total generation 7 629 10 394 11 455 11 997 12 504 12 959 13 304 100 100 1.0Coal 3 093 3 620 3 785 3 673 3 504 3 210 2 882 35 22 !0.9Oil 697 324 223 149 117 105 101 3 1 !4.4Gas 770 2 361 2 662 2 827 2 966 3 139 3 182 23 24 1.2Nuclear 1 729 2 242 2 352 2 445 2 551 2 663 2 779 22 21 0.8Hydro 1 182 1 321 1 424 1 476 1 522 1 561 1 592 13 12 0.7Biomass and waste 124 239 315 398 489 582 675 2 5 4.1Wind 4 223 524 770 994 1 217 1 465 2 11 7.5Geothermal 29 42 56 72 91 108 124 0 1 4.3Solar PV 0 20 94 152 211 270 326 0 2 11.4CSP 1 1 19 33 51 80 117 0 1 20.9Marine 1 1 1 2 9 23 61 0 0 20.0
CAAGR (%)
2009 2015 2020 2025 2030 2035 2009 2035 2009!2035Total capacity 2 614 3 000 3 149 3 291 3 446 3 595 100 100 1.2Coal 638 701 688 665 621 548 24 15 !0.6Oil 218 199 135 101 86 82 8 2 !3.7Gas 787 894 937 967 1 014 1 067 30 30 1.2Nuclear 327 332 341 352 366 380 13 11 0.6Hydro 454 472 489 504 517 527 17 15 0.6Biomass and waste 41 52 64 78 92 106 2 3 3.8Wind 120 246 344 424 498 575 5 16 6.2Geothermal 7 9 11 14 16 19 0 1 3.7Solar PV 22 89 131 170 207 243 1 7 9.7CSP 1 5 9 14 21 31 0 1 16.6Marine 0 0 1 2 6 17 0 0 17.2
CAAGR (%)
1990 2009 2015 2020 2025 2030 2035 2009 2035 2009!2035Total CO2 11 117 11 951 12 399 12 023 11 554 11 064 10 535 100 100 !0.5Coal 4 155 3 971 4 201 3 980 3 681 3 269 2 824 33 27 !1.3Oil 5 035 5 097 5 050 4 802 4 555 4 372 4 220 43 40 !0.7Gas 1 928 2 883 3 149 3 242 3 317 3 424 3 491 24 33 0.7Power generation 3 964 4 663 4 797 4 590 4 347 4 038 3 660 100 100 !0.9Coal 3 066 3 407 3 508 3 305 3 044 2 666 2 252 73 62 !1.6Oil 487 237 164 111 84 75 71 5 2 !4.5Gas 411 1 018 1 125 1 175 1 219 1 296 1 337 22 37 1.1TFC 6 559 6 632 6 950 6 777 6 562 6 379 6 224 100 100 !0.2Coal 1 025 493 595 573 544 512 482 7 8 !0.1Oil 4 185 4 503 4 569 4 386 4 177 4 011 3 869 68 62 !0.6Transport 2 681 3 259 3 334 3 194 3 028 2 911 2 826 49 45 !0.5Gas 1 349 1 636 1 786 1 818 1 840 1 857 1 872 25 30 0.5
CO2 emissions (Mt) Shares (%)
Electricity generation (TWh) Shares (%)
Electrical capacity (GW) Shares (%)
OECD: New Policies Scenario
© O
EC
D/IE
A, 2
011
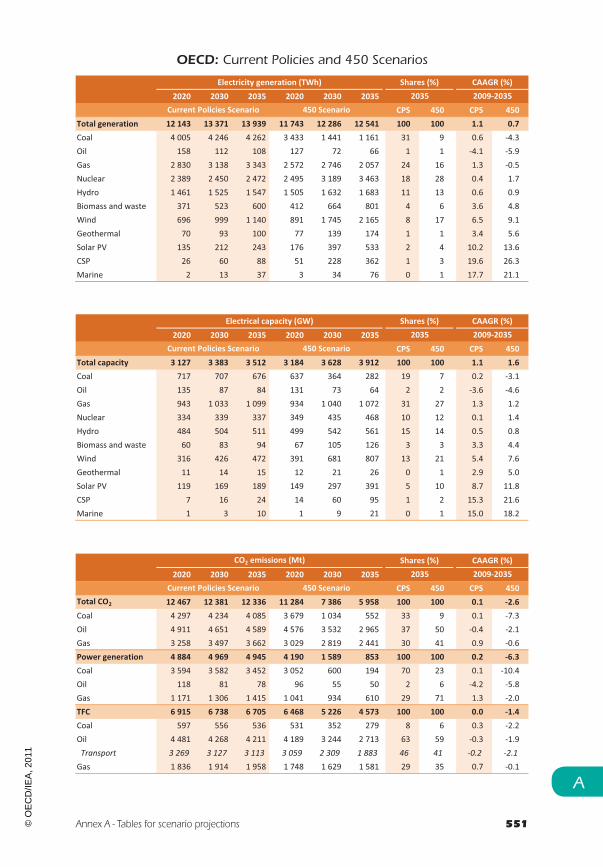
Annex A - Tables for scenario projections 551
A
2020 2030 2035 2020 2030 2035CPS 450 CPS 450
Total generation 12 143 13 371 13 939 11 743 12 286 12 541 100 100 1.1 0.7Coal 4 005 4 246 4 262 3 433 1 441 1 161 31 9 0.6 !4.3Oil 158 112 108 127 72 66 1 1 !4.1 !5.9Gas 2 830 3 138 3 343 2 572 2 746 2 057 24 16 1.3 !0.5Nuclear 2 389 2 450 2 472 2 495 3 189 3 463 18 28 0.4 1.7Hydro 1 461 1 525 1 547 1 505 1 632 1 683 11 13 0.6 0.9Biomass and waste 371 523 600 412 664 801 4 6 3.6 4.8Wind 696 999 1 140 891 1 745 2 165 8 17 6.5 9.1Geothermal 70 93 100 77 139 174 1 1 3.4 5.6Solar PV 135 212 243 176 397 533 2 4 10.2 13.6CSP 26 60 88 51 228 362 1 3 19.6 26.3Marine 2 13 37 3 34 76 0 1 17.7 21.1
2020 2030 2035 2020 2030 2035CPS 450 CPS 450
Total capacity 3 127 3 383 3 512 3 184 3 628 3 912 100 100 1.1 1.6Coal 717 707 676 637 364 282 19 7 0.2 !3.1Oil 135 87 84 131 73 64 2 2 !3.6 !4.6Gas 943 1 033 1 099 934 1 040 1 072 31 27 1.3 1.2Nuclear 334 339 337 349 435 468 10 12 0.1 1.4Hydro 484 504 511 499 542 561 15 14 0.5 0.8Biomass and waste 60 83 94 67 105 126 3 3 3.3 4.4Wind 316 426 472 391 681 807 13 21 5.4 7.6Geothermal 11 14 15 12 21 26 0 1 2.9 5.0Solar PV 119 169 189 149 297 391 5 10 8.7 11.8CSP 7 16 24 14 60 95 1 2 15.3 21.6Marine 1 3 10 1 9 21 0 1 15.0 18.2
2020 2030 2035 2020 2030 2035CPS 450 CPS 450
Total CO2 12 467 12 381 12 336 11 284 7 386 5 958 100 100 0.1 !2.6Coal 4 297 4 234 4 085 3 679 1 034 552 33 9 0.1 !7.3Oil 4 911 4 651 4 589 4 576 3 532 2 965 37 50 !0.4 !2.1Gas 3 258 3 497 3 662 3 029 2 819 2 441 30 41 0.9 !0.6Power generation 4 884 4 969 4 945 4 190 1 589 853 100 100 0.2 !6.3Coal 3 594 3 582 3 452 3 052 600 194 70 23 0.1 !10.4Oil 118 81 78 96 55 50 2 6 !4.2 !5.8Gas 1 171 1 306 1 415 1 041 934 610 29 71 1.3 !2.0TFC 6 915 6 738 6 705 6 468 5 226 4 573 100 100 0.0 !1.4Coal 597 556 536 531 352 279 8 6 0.3 !2.2Oil 4 481 4 268 4 211 4 189 3 244 2 713 63 59 !0.3 !1.9Transport 3 269 3 127 3 113 3 059 2 309 1 883 46 41 !0.2 !2.1Gas 1 836 1 914 1 958 1 748 1 629 1 581 29 35 0.7 !0.1
Current Policies Scenario 450 Scenario
Current Policies Scenario 450 Scenario
CO2 emissions (Mt) Shares (%) CAAGR (%)2035 2009!2035
Current Policies Scenario 450 Scenario
Electrical capacity (GW) Shares (%) CAAGR (%)2035 2009!2035
Electricity generation (TWh) Shares (%) CAAGR (%)2035 2009!2035
OECD: Current Policies and 450 Scenarios
© O
EC
D/IE
A, 2
011
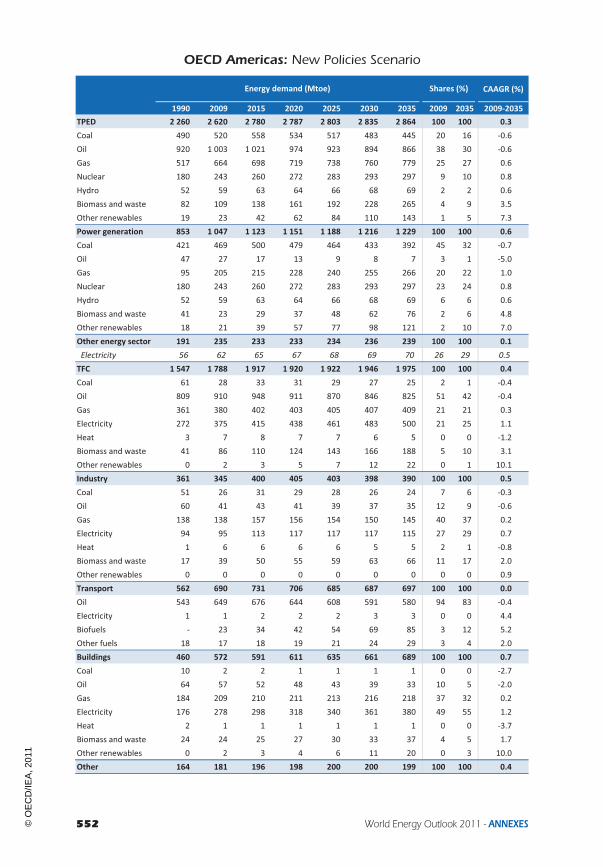
552 World Energy Outlook 2011 - ANNEXES
CAAGR (%)
1990 2009 2015 2020 2025 2030 2035 2009 2035 2009!2035TPED 2 260 2 620 2 780 2 787 2 803 2 835 2 864 100 100 0.3Coal 490 520 558 534 517 483 445 20 16 !0.6Oil 920 1 003 1 021 974 923 894 866 38 30 !0.6Gas 517 664 698 719 738 760 779 25 27 0.6Nuclear 180 243 260 272 283 293 297 9 10 0.8Hydro 52 59 63 64 66 68 69 2 2 0.6Biomass and waste 82 109 138 161 192 228 265 4 9 3.5Other renewables 19 23 42 62 84 110 143 1 5 7.3Power generation 853 1 047 1 123 1 151 1 188 1 216 1 229 100 100 0.6Coal 421 469 500 479 464 433 392 45 32 !0.7Oil 47 27 17 13 9 8 7 3 1 !5.0Gas 95 205 215 228 240 255 266 20 22 1.0Nuclear 180 243 260 272 283 293 297 23 24 0.8Hydro 52 59 63 64 66 68 69 6 6 0.6Biomass and waste 41 23 29 37 48 62 76 2 6 4.8Other renewables 18 21 39 57 77 98 121 2 10 7.0Other energy sector 191 235 233 233 234 236 239 100 100 0.1Electricity 56 62 65 67 68 69 70 26 29 0.5TFC 1 547 1 788 1 917 1 920 1 922 1 946 1 975 100 100 0.4Coal 61 28 33 31 29 27 25 2 1 !0.4Oil 809 910 948 911 870 846 825 51 42 !0.4Gas 361 380 402 403 405 407 409 21 21 0.3Electricity 272 375 415 438 461 483 500 21 25 1.1Heat 3 7 8 7 7 6 5 0 0 !1.2Biomass and waste 41 86 110 124 143 166 188 5 10 3.1Other renewables 0 2 3 5 7 12 22 0 1 10.1Industry 361 345 400 405 403 398 390 100 100 0.5Coal 51 26 31 29 28 26 24 7 6 !0.3Oil 60 41 43 41 39 37 35 12 9 !0.6Gas 138 138 157 156 154 150 145 40 37 0.2Electricity 94 95 113 117 117 117 115 27 29 0.7Heat 1 6 6 6 6 5 5 2 1 !0.8Biomass and waste 17 39 50 55 59 63 66 11 17 2.0Other renewables 0 0 0 0 0 0 0 0 0 0.9Transport 562 690 731 706 685 687 697 100 100 0.0Oil 543 649 676 644 608 591 580 94 83 !0.4Electricity 1 1 2 2 2 3 3 0 0 4.4Biofuels ! 23 34 42 54 69 85 3 12 5.2Other fuels 18 17 18 19 21 24 29 3 4 2.0Buildings 460 572 591 611 635 661 689 100 100 0.7Coal 10 2 2 1 1 1 1 0 0 !2.7Oil 64 57 52 48 43 39 33 10 5 !2.0Gas 184 209 210 211 213 216 218 37 32 0.2Electricity 176 278 298 318 340 361 380 49 55 1.2Heat 2 1 1 1 1 1 1 0 0 !3.7Biomass and waste 24 24 25 27 30 33 37 4 5 1.7Other renewables 0 2 3 4 6 11 20 0 3 10.0Other 164 181 196 198 200 200 199 100 100 0.4
Energy demand (Mtoe) Shares (%)
OECD Americas: New Policies Scenario
© O
EC
D/IE
A, 2
011

Annex A - Tables for scenario projections 553
A
2020 2030 2035 2020 2030 2035CPS 450 CPS 450
TPED 2 833 2 919 2 980 2 724 2 613 2 608 100 100 0.5 !0.0Coal 568 577 583 527 242 239 20 9 0.4 !3.0Oil 994 937 919 932 732 621 31 24 !0.3 !1.8Gas 724 770 795 667 722 660 27 25 0.7 !0.0Nuclear 270 279 283 277 350 368 10 14 0.6 1.6Hydro 64 67 68 65 68 70 2 3 0.5 0.6Biomass and waste 156 201 226 182 317 383 8 15 2.9 5.0Other renewables 57 88 105 73 181 266 4 10 6.1 9.9Power generation 1 174 1 261 1 300 1 131 1 122 1 164 100 100 0.8 0.4Coal 510 520 518 476 201 197 40 17 0.4 !3.3Oil 14 8 7 11 6 6 1 0 !5.0 !5.8Gas 227 252 267 196 266 214 21 18 1.0 0.2Nuclear 270 279 283 277 350 368 22 32 0.6 1.6Hydro 64 67 68 65 68 70 5 6 0.5 0.6Biomass and waste 37 57 68 38 68 86 5 7 4.3 5.3Other renewables 53 78 89 67 162 223 7 19 5.7 9.5Other energy sector 237 245 252 224 211 202 100 100 0.3 !0.6Electricity 68 72 73 65 64 63 29 31 0.7 0.1TFC 1 944 1 987 2 025 1 876 1 813 1 786 100 100 0.5 !0.0Coal 33 31 30 28 20 18 1 1 0.3 !1.7Oil 931 888 879 874 693 593 43 33 !0.1 !1.6Gas 408 415 421 388 365 357 21 20 0.4 !0.2Electricity 442 492 515 430 460 474 25 27 1.2 0.9Heat 8 7 6 7 6 5 0 0 !0.7 !1.4Biomass and waste 119 144 158 144 249 297 8 17 2.4 4.9Other renewables 5 10 16 6 20 42 1 2 8.9 13.0Industry 407 408 405 392 372 358 100 100 0.6 0.1Coal 31 29 28 26 20 17 7 5 0.3 !1.5Oil 43 40 39 40 37 34 10 9 !0.2 !0.7Gas 158 156 154 152 138 131 38 37 0.4 !0.2Electricity 118 122 123 113 109 104 30 29 1.0 0.4Heat 6 6 6 6 5 5 1 1 !0.2 !1.0Biomass and waste 51 55 57 55 64 66 14 19 1.4 2.1Other renewables 0 0 0 0 0 0 0 0 0.9 0.9Transport 723 710 722 692 621 586 100 100 0.2 !0.6Oil 661 629 627 619 464 381 87 65 !0.1 !2.0Electricity 2 2 3 2 13 32 0 6 3.3 13.8Biofuels 41 57 67 50 117 141 9 24 4.2 7.2Other fuels 19 22 25 21 27 32 3 5 1.4 2.4Buildings 616 669 700 594 619 643 100 100 0.8 0.4Coal 2 2 2 1 1 0 0 0 !0.3 !8.7Oil 48 41 36 43 26 18 5 3 !1.7 !4.4Gas 214 221 226 198 184 179 32 28 0.3 !0.6Electricity 320 365 387 312 337 335 55 52 1.3 0.7Heat 1 1 1 1 1 1 0 0 !3.6 !4.0Biomass and waste 27 31 34 33 52 70 5 11 1.4 4.3Other renewables 4 9 15 5 18 40 2 6 9.0 13.1Other 198 199 198 199 200 200 100 100 0.4 0.4
Current Policies Scenario 450 Scenario
Energy demand (Mtoe) Shares (%) CAAGR (%)2035 2009!2035
OECD Americas: Current Policies and 450 Scenarios
© O
EC
D/IE
A, 2
011

554 World Energy Outlook 2011 - ANNEXES
CAAGR (%)
1990 2009 2015 2020 2025 2030 2035 2009 2035 2009!2035Total generation 3 819 5 090 5 584 5 881 6 169 6 432 6 636 100 100 1.0Coal 1 796 2 029 2 193 2 172 2 141 2 057 1 931 40 29 !0.2Oil 211 117 76 58 44 39 34 2 1 !4.7Gas 406 1 130 1 226 1 323 1 411 1 506 1 575 22 24 1.3Nuclear 687 931 998 1 047 1 089 1 125 1 142 18 17 0.8Hydro 602 691 730 749 769 788 802 14 12 0.6Biomass and waste 91 86 111 149 197 256 317 2 5 5.1Wind 3 79 191 284 372 464 576 2 9 7.9Geothermal 21 24 33 43 55 67 77 0 1 4.6Solar PV 0 2 19 39 62 88 118 0 2 17.4CSP 1 1 8 16 25 37 55 0 1 17.6Marine 0 0 0 0 2 5 8 0 0 23.8
CAAGR (%)
2009 2015 2020 2025 2030 2035 2009 2035 2009!2035Total capacity 1 289 1 396 1 466 1 531 1 598 1 660 100 100 1.0Coal 354 372 390 390 369 330 27 20 !0.3Oil 93 84 54 37 31 27 7 2 !4.7Gas 467 486 499 514 538 569 36 34 0.8Nuclear 121 128 134 140 144 146 9 9 0.7Hydro 193 199 205 211 216 220 15 13 0.5Biomass and waste 16 20 26 33 42 51 1 3 4.6Wind 39 85 121 152 182 216 3 13 6.8Geothermal 4 5 7 8 10 12 0 1 4.0Solar PV 2 13 26 40 56 73 0 4 15.4CSP 0 2 4 6 9 14 0 1 14.0Marine 0 0 0 1 1 2 0 0 19.3
CAAGR (%)
1990 2009 2015 2020 2025 2030 2035 2009 2035 2009!2035Total CO2 5 578 6 152 6 418 6 233 6 050 5 865 5 650 100 100 !0.3Coal 1 920 1 967 2 116 2 021 1 941 1 786 1 596 32 28 !0.8Oil 2 469 2 655 2 691 2 558 2 416 2 337 2 272 43 40 !0.6Gas 1 189 1 530 1 611 1 653 1 693 1 742 1 782 25 32 0.6Power generation 2 019 2 415 2 526 2 449 2 395 2 277 2 113 100 100 !0.5Coal 1 647 1 845 1 965 1 874 1 806 1 659 1 476 76 70 !0.9Oil 150 90 57 43 32 27 23 4 1 !5.0Gas 222 480 503 532 558 590 613 20 29 0.9TFC 3 213 3 361 3 521 3 406 3 277 3 202 3 141 100 100 !0.3Coal 269 115 138 131 123 114 105 3 3 !0.3Oil 2 115 2 369 2 456 2 344 2 220 2 149 2 091 70 67 !0.5Transport 1 585 1 899 1 980 1 885 1 781 1 732 1 698 56 54 !0.4Gas 829 877 928 931 935 939 945 26 30 0.3
CO2 emissions (Mt) Shares (%)
Electricity generation (TWh) Shares (%)
Electrical capacity (GW) Shares (%)
OECD Americas: New Policies Scenario
© O
EC
D/IE
A, 2
011

Annex A - Tables for scenario projections 555
A
2020 2030 2035 2020 2030 2035CPS 450 CPS 450
Total generation 5 931 6 556 6 847 5 763 6 102 6 252 100 100 1.1 0.8Coal 2 301 2 458 2 513 2 138 939 882 37 14 0.8 !3.2Oil 61 38 33 50 30 27 0 0 !4.7 !5.5Gas 1 305 1 466 1 547 1 148 1 605 1 236 23 20 1.2 0.3Nuclear 1 037 1 074 1 089 1 066 1 346 1 414 16 23 0.6 1.6Hydro 745 775 785 752 795 814 11 13 0.5 0.6Biomass and waste 143 231 279 153 283 360 4 6 4.6 5.7Wind 251 365 421 338 717 938 6 15 6.6 10.0Geothermal 42 57 60 46 87 111 1 2 3.6 6.1Solar PV 33 60 74 46 144 213 1 3 15.4 20.1CSP 12 27 39 27 152 249 1 4 16.1 24.6Marine 0 3 6 0 5 8 0 0 22.2 23.5
2020 2030 2035 2020 2030 2035CPS 450 CPS 450
Total capacity 1 457 1 569 1 622 1 460 1 627 1 771 100 100 0.9 1.2Coal 403 409 393 352 180 150 24 8 0.4 !3.2Oil 54 31 28 52 28 23 2 1 !4.5 !5.2Gas 497 536 567 504 579 594 35 34 0.7 0.9Nuclear 133 138 139 137 172 180 9 10 0.5 1.5Hydro 204 212 215 206 218 223 13 13 0.4 0.6Biomass and waste 25 38 45 26 46 58 3 3 4.1 5.2Wind 109 149 166 139 263 331 10 19 5.7 8.6Geothermal 7 9 9 7 13 16 1 1 3.1 5.4Solar PV 22 39 47 29 88 130 3 7 13.5 18.0CSP 3 7 10 7 39 64 1 4 12.6 20.8Marine 0 1 1 0 1 2 0 0 17.7 19.1
2020 2030 2035 2020 2030 2035CPS 450 CPS 450
Total CO2 6 438 6 405 6 414 5 950 3 759 3 017 100 100 0.2 !2.7Coal 2 153 2 169 2 146 1 975 361 164 33 5 0.3 !9.1Oil 2 622 2 472 2 443 2 445 1 870 1 562 38 52 !0.3 !2.0Gas 1 663 1 765 1 824 1 530 1 529 1 291 28 43 0.7 !0.7Power generation 2 572 2 639 2 650 2 334 818 430 100 100 0.4 !6.4Coal 1 997 2 025 2 005 1 843 277 95 76 22 0.3 !10.8Oil 45 27 23 37 21 19 1 4 !5.1 !5.8Gas 530 587 622 454 520 316 23 74 1.0 !1.6TFC 3 481 3 363 3 347 3 257 2 601 2 267 100 100 !0.0 !1.5Coal 139 129 124 117 72 57 4 2 0.3 !2.7Oil 2 401 2 275 2 251 2 245 1 718 1 431 67 63 !0.2 !1.9Transport 1 936 1 842 1 837 1 811 1 360 1 116 55 49 !0.1 !2.0Gas 941 959 972 895 810 780 29 34 0.4 !0.5
Current Policies Scenario 450 Scenario
Current Policies Scenario 450 Scenario
CO2 emissions (Mt) Shares (%) CAAGR (%)2035 2009!2035
Current Policies Scenario 450 Scenario
Electrical capacity (GW) Shares (%) CAAGR (%)2035 2009!2035
Electricity generation (TWh) Shares (%) CAAGR (%)2035 2009!2035
OECD Americas: Current Policies and 450 Scenarios
© O
EC
D/IE
A, 2
011

556 World Energy Outlook 2011 - ANNEXES
CAAGR (%)
1990 2009 2015 2020 2025 2030 2035 2009 2035 2009!2035TPED 1 915 2 160 2 285 2 264 2 257 2 262 2 265 100 100 0.2Coal 460 485 517 493 479 451 419 22 19 !0.6Oil 757 801 817 768 717 684 653 37 29 !0.8Gas 438 534 558 562 568 577 583 25 26 0.3Nuclear 159 216 230 241 249 255 257 10 11 0.7Hydro 23 24 24 25 25 26 26 1 1 0.4Biomass and waste 62 84 108 128 155 186 218 4 10 3.7Other renewables 14 16 31 47 64 84 109 1 5 7.6Power generation 750 898 957 972 997 1 012 1 013 100 100 0.5Coal 396 440 464 444 432 407 372 49 37 !0.6Oil 27 11 8 5 3 3 3 1 0 !4.9Gas 90 173 178 183 188 197 203 19 20 0.6Nuclear 159 216 230 241 249 255 257 24 25 0.7Hydro 23 24 24 25 25 26 26 3 3 0.4Biomass and waste 40 19 24 32 41 51 62 2 6 4.6Other renewables 14 15 29 43 58 73 90 2 9 7.2Other energy sector 150 173 170 163 157 151 148 100 100 !0.6Electricity 49 48 49 50 51 51 51 28 35 0.3TFC 1 294 1 463 1 562 1 551 1 542 1 553 1 569 100 100 0.3Coal 56 24 28 27 25 23 20 2 1 !0.5Oil 683 741 766 727 684 656 633 51 40 !0.6Gas 303 312 331 330 330 329 330 21 21 0.2Electricity 226 313 343 360 378 394 405 21 26 1.0Heat 2 7 7 7 6 5 5 0 0 !1.4Biomass and waste 23 65 84 97 114 135 156 4 10 3.4Other renewables 0 2 3 4 6 11 19 0 1 10.0Industry 284 259 301 301 296 288 279 100 100 0.3Coal 46 22 27 25 23 22 20 8 7 !0.4Oil 44 27 28 26 24 22 20 11 7 !1.2Gas 110 106 123 121 118 114 108 41 39 0.1Electricity 75 69 81 81 80 77 74 27 27 0.3Heat ! 5 6 5 5 5 4 2 2 !0.9Biomass and waste 9 30 37 42 46 49 52 11 19 2.2Other renewables ! 0 0 0 0 0 0 0 0 0.7Transport 488 578 610 583 560 559 564 100 100 !0.1Oil 472 540 560 526 489 470 455 94 81 !0.7Electricity 0 1 1 1 1 2 2 0 0 5.2Biofuels ! 22 33 40 51 66 82 4 15 5.2Other fuels 15 15 16 16 18 21 25 3 4 2.1Buildings 389 482 497 511 529 549 570 100 100 0.7Coal 10 2 2 1 1 1 1 0 0 !2.7Oil 48 38 33 28 23 18 13 8 2 !4.0Gas 164 183 184 183 184 186 187 38 33 0.1Electricity 152 244 262 278 296 314 329 51 58 1.2Heat 2 1 1 1 1 1 0 0 0 !4.4Biomass and waste 14 13 13 15 17 19 22 3 4 2.1Other renewables 0 1 2 4 6 10 18 0 3 10.2Other 133 144 155 157 157 157 155 100 100 0.3
Energy demand (Mtoe) Shares (%)
United States: New Policies Scenario
© O
EC
D/IE
A, 2
011

Annex A - Tables for scenario projections 557
A
2020 2030 2035 2020 2030 2035CPS 450 CPS 450
TPED 2 304 2 327 2 354 2 215 2 076 2 066 100 100 0.3 !0.2Coal 526 534 541 488 219 228 23 11 0.4 !2.9Oil 786 719 695 740 563 469 30 23 !0.5 !2.0Gas 562 573 578 520 560 495 25 24 0.3 !0.3Nuclear 238 243 244 244 306 324 10 16 0.5 1.6Hydro 25 26 26 25 26 27 1 1 0.4 0.5Biomass and waste 124 165 188 143 256 308 8 15 3.2 5.1Other renewables 44 68 82 56 146 216 3 10 6.4 10.5Power generation 991 1 048 1 070 956 924 957 100 100 0.7 0.2Coal 474 483 483 443 183 191 45 20 0.4 !3.2Oil 5 4 3 4 3 3 0 0 !4.7 !5.2Gas 178 185 188 157 223 169 18 18 0.3 !0.1Nuclear 238 243 244 244 306 324 23 34 0.5 1.6Hydro 25 26 26 25 26 27 2 3 0.4 0.5Biomass and waste 32 49 59 32 55 67 6 7 4.4 4.9Other renewables 40 59 67 51 129 177 6 19 6.0 10.1Other energy sector 166 158 158 157 135 125 100 100 !0.4 !1.3Electricity 51 53 54 49 47 46 34 37 0.4 !0.2TFC 1 573 1 583 1 604 1 515 1 446 1 419 100 100 0.4 !0.1Coal 28 26 25 23 17 14 2 1 0.2 !2.0Oil 744 692 677 700 539 455 42 32 !0.3 !1.9Gas 334 336 338 316 292 284 21 20 0.3 !0.4Electricity 363 399 415 354 375 382 26 27 1.1 0.8Heat 7 6 5 6 5 4 0 0 !0.9 !1.6Biomass and waste 93 116 129 111 202 241 8 17 2.7 5.2Other renewables 4 9 15 5 17 38 1 3 9.0 13.0Industry 302 295 289 289 267 252 100 100 0.4 !0.1Coal 27 25 24 22 16 14 8 6 0.3 !1.7Oil 27 24 23 25 22 20 8 8 !0.7 !1.3Gas 122 118 115 117 103 96 40 38 0.3 !0.4Electricity 82 81 79 78 71 66 27 26 0.5 !0.2Heat 6 5 5 5 5 4 2 2 !0.4 !1.1Biomass and waste 38 42 43 41 50 53 15 21 1.5 2.2Other renewables 0 0 0 0 0 0 0 0 0.7 0.7Transport 599 578 582 572 506 476 100 100 0.0 !0.7Oil 542 502 495 508 371 300 85 63 !0.3 !2.2Electricity 1 1 2 1 10 26 0 5 3.6 15.1Biofuels 40 55 65 44 102 121 11 25 4.2 6.7Other fuels 16 19 21 18 24 28 4 6 1.4 2.6Buildings 515 555 578 497 516 535 100 100 0.7 0.4Coal 2 2 1 1 0 0 0 0 !0.3 !9.2Oil 28 19 15 25 11 4 3 1 !3.6 !8.7Gas 186 190 193 171 157 151 33 28 0.2 !0.7Electricity 280 316 334 274 294 290 58 54 1.2 0.7Heat 1 1 0 1 1 0 0 0 !4.3 !4.7Biomass and waste 14 18 20 20 37 52 3 10 1.8 5.6Other renewables 4 9 15 4 17 38 3 7 9.2 13.2Other 156 156 155 157 157 156 100 100 0.3 0.3
Current Policies Scenario 450 Scenario
Energy demand (Mtoe) Shares (%) CAAGR (%)2035 2009!2035
United States: Current Policies and 450 Scenarios
© O
EC
D/IE
A, 2
011

558 World Energy Outlook 2011 - ANNEXES
CAAGR (%)
1990 2009 2015 2020 2025 2030 2035 2009 2035 2009!2035Total generation 3 203 4 165 4 544 4 756 4 967 5 157 5 292 100 100 0.9Coal 1 700 1 893 2 026 2 009 1 992 1 936 1 837 45 35 !0.1Oil 131 50 38 23 17 16 15 1 0 !4.6Gas 382 950 1 011 1 059 1 102 1 156 1 195 23 23 0.9Nuclear 612 830 883 927 957 980 990 20 19 0.7Hydro 273 276 278 287 295 301 306 7 6 0.4Biomass and waste 86 72 94 128 170 217 266 2 5 5.1Wind 3 74 165 242 315 388 472 2 9 7.4Geothermal 16 17 23 31 40 48 55 0 1 4.6Solar PV 0 2 18 38 58 81 106 0 2 17.2CSP 1 1 8 14 20 30 45 0 1 16.7Marine ! ! 0 0 1 3 5 ! 0 n.a.
CAAGR (%)
2009 2015 2020 2025 2030 2035 2009 2035 2009!2035Total capacity 1 083 1 162 1 213 1 260 1 307 1 342 100 100 0.8Coal 333 347 366 367 349 314 31 23 !0.2Oil 69 61 33 22 19 17 6 1 !5.2Gas 422 431 434 437 450 468 39 35 0.4Nuclear 106 112 117 121 123 124 10 9 0.6Hydro 101 104 107 110 112 114 9 8 0.5Biomass and waste 12 15 21 27 34 42 1 3 5.0Wind 35 73 102 127 151 176 3 13 6.4Geothermal 3 4 5 6 7 8 0 1 3.9Solar PV 2 13 25 37 50 64 0 5 15.1CSP 0 2 4 5 8 11 0 1 13.1Marine ! 0 0 0 1 1 ! 0 n.a.
CAAGR (%)
1990 2009 2015 2020 2025 2030 2035 2009 2035 2009!2035Total CO2 4 850 5 168 5 379 5 159 4 962 4 765 4 539 100 100 !0.5Coal 1 797 1 832 1 953 1 864 1 795 1 664 1 498 35 33 !0.8Oil 2 042 2 101 2 133 1 995 1 855 1 771 1 700 41 37 !0.8Gas 1 011 1 235 1 292 1 300 1 312 1 329 1 341 24 30 0.3Power generation 1 848 2 171 2 268 2 181 2 132 2 025 1 875 100 100 !0.6Coal 1 550 1 729 1 824 1 738 1 681 1 559 1 399 80 75 !0.8Oil 88 39 29 16 12 11 11 2 1 !4.9Gas 210 403 415 426 439 455 465 19 25 0.6TFC 2 730 2 739 2 862 2 734 2 596 2 507 2 433 100 100 !0.5Coal 245 97 118 111 102 94 85 4 3 !0.5Oil 1 788 1 920 1 976 1 858 1 729 1 650 1 584 70 65 !0.7Transport 1 376 1 580 1 639 1 539 1 432 1 375 1 331 58 55 !0.7Gas 697 723 768 765 764 763 765 26 31 0.2
CO2 emissions (Mt) Shares (%)
Electricity generation (TWh) Shares (%)
Electrical capacity (GW) Shares (%)
United States: New Policies Scenario
© O
EC
D/IE
A, 2
011

Annex A - Tables for scenario projections 559
A
2020 2030 2035 2020 2030 2035CPS 450 CPS 450
Total generation 4 794 5 233 5 427 4 667 4 878 4 956 100 100 1.0 0.7Coal 2 133 2 281 2 344 1 985 853 853 43 17 0.8 !3.0Oil 24 17 16 20 15 14 0 0 !4.4 !4.9Gas 1 024 1 072 1 089 912 1 347 975 20 20 0.5 0.1Nuclear 917 934 937 938 1 176 1 244 17 25 0.5 1.6Hydro 285 298 303 288 304 310 6 6 0.4 0.5Biomass and waste 123 204 246 131 234 292 5 6 4.8 5.5Wind 215 302 339 295 612 763 6 15 6.0 9.4Geothermal 31 43 44 32 64 82 1 2 3.8 6.2Solar PV 31 57 70 43 129 187 1 4 15.4 19.8CSP 12 25 35 23 141 232 1 5 15.6 24.3Marine 0 2 4 0 3 5 0 0 n.a. n.a.
2020 2030 2035 2020 2030 2035CPS 450 CPS 450
Total capacity 1 207 1 283 1 314 1 205 1 317 1 415 100 100 0.7 1.0Coal 379 384 369 328 162 137 28 10 0.4 !3.4Oil 33 20 18 31 16 14 1 1 !5.0 !6.0Gas 431 445 461 441 495 497 35 35 0.3 0.6Nuclear 116 118 118 118 148 156 9 11 0.4 1.5Hydro 107 111 113 108 113 115 9 8 0.4 0.5Biomass and waste 20 32 39 21 37 46 3 3 4.7 5.4Wind 92 123 135 120 223 267 10 19 5.3 8.1Geothermal 5 7 7 5 10 12 1 1 3.2 5.4Solar PV 21 37 44 27 77 111 3 8 13.5 17.6CSP 3 6 9 6 36 59 1 4 12.1 20.5Marine 0 0 1 0 1 1 0 0 n.a. n.a.
2020 2030 2035 2020 2030 2035CPS 450 CPS 450
Total CO2 5 339 5 206 5 162 4 946 2 896 2 257 100 100 !0.0 !3.1Coal 1 990 2 000 1 986 1 829 292 147 38 7 0.3 !9.2Oil 2 050 1 883 1 839 1 918 1 422 1 167 36 52 !0.5 !2.2Gas 1 300 1 322 1 336 1 199 1 182 944 26 42 0.3 !1.0Power generation 2 290 2 321 2 316 2 095 663 327 100 100 0.2 !7.0Coal 1 856 1 879 1 868 1 718 223 91 81 28 0.3 !10.7Oil 17 12 11 14 10 10 0 3 !4.7 !5.2Gas 416 430 437 363 429 226 19 69 0.3 !2.2TFC 2 799 2 642 2 601 2 618 2 030 1 746 100 100 !0.2 !1.7Coal 118 108 103 98 59 45 4 3 0.2 !2.9Oil 1 908 1 755 1 715 1 788 1 321 1 080 66 62 !0.4 !2.2Transport 1 586 1 469 1 448 1 488 1 085 880 56 50 !0.3 !2.2Gas 774 778 783 732 650 621 30 36 0.3 !0.6
Current Policies Scenario 450 Scenario
Current Policies Scenario 450 Scenario
CO2 emissions (Mt) Shares (%) CAAGR (%)2035 2009!2035
Current Policies Scenario 450 Scenario
Electrical capacity (GW) Shares (%) CAAGR (%)2035 2009!2035
Electricity generation (TWh) Shares (%) CAAGR (%)2035 2009!2035
United States: Current Policies and 450 Scenarios
© O
EC
D/IE
A, 2
011

560 World Energy Outlook 2011 - ANNEXES
CAAGR (%)
1990 2009 2015 2020 2025 2030 2035 2009 2035 2009!2035TPED 1 630 1 766 1 863 1 876 1 882 1 890 1 904 100 100 0.3Coal 452 290 294 268 242 209 185 16 10 !1.7Oil 615 617 596 572 548 523 503 35 26 !0.8Gas 260 441 495 515 528 547 551 25 29 0.9Nuclear 205 230 230 226 222 224 228 13 12 !0.0Hydro 38 44 48 50 52 54 55 3 3 0.8Biomass and waste 54 117 147 172 195 217 240 7 13 2.8Other renewables 5 26 53 73 94 117 143 1 8 6.7Power generation 626 739 775 785 794 809 823 100 100 0.4Coal 278 219 204 181 159 130 110 30 13 !2.6Oil 51 25 17 12 9 7 7 3 1 !5.0Gas 41 154 173 185 194 210 213 21 26 1.3Nuclear 205 230 230 226 222 224 228 31 28 !0.0Hydro 38 44 48 50 52 54 55 6 7 0.8Biomass and waste 9 45 58 68 78 85 92 6 11 2.8Other renewables 3 21 45 63 81 99 119 3 14 6.9Other energy sector 151 143 148 144 140 136 131 100 100 !0.4Electricity 39 44 44 43 44 44 43 30 33 !0.1TFC 1 131 1 241 1 330 1 354 1 373 1 386 1 403 100 100 0.5Coal 126 49 57 55 52 48 46 4 3 !0.2Oil 523 547 540 522 504 482 464 44 33 !0.6Gas 201 263 298 307 313 316 318 21 23 0.7Electricity 193 259 287 302 317 330 341 21 24 1.1Heat 40 47 52 55 58 60 62 4 4 1.1Biomass and waste 45 71 89 104 117 131 147 6 11 2.8Other renewables 2 5 8 10 13 18 24 0 2 6.0Industry 324 275 321 326 328 328 326 100 100 0.7Coal 71 28 36 34 33 31 29 10 9 0.1Oil 59 38 36 34 32 29 26 14 8 !1.4Gas 78 76 95 96 96 95 93 28 29 0.8Electricity 88 95 111 115 117 118 118 34 36 0.9Heat 14 15 17 17 17 17 17 6 5 0.3Biomass and waste 14 22 27 30 34 37 42 8 13 2.5Other renewables 0 0 0 0 0 0 0 0 0 7.8Transport 268 343 351 350 341 330 325 100 100 !0.2Oil 262 322 321 313 300 284 274 94 84 !0.6Electricity 5 6 8 8 9 10 12 2 4 2.4Biofuels 0 12 20 25 29 31 33 3 10 4.1Other fuels 1 2 3 3 4 5 6 1 2 3.7Buildings 406 484 518 544 570 595 619 100 100 1.0Coal 51 18 19 18 17 15 15 4 2 !0.7Oil 97 71 69 67 64 62 58 15 9 !0.8Gas 105 170 185 192 198 201 203 35 33 0.7Electricity 96 153 163 174 186 197 207 32 33 1.2Heat 24 31 35 38 40 43 45 6 7 1.4Biomass and waste 30 35 40 46 52 60 68 7 11 2.6Other renewables 2 5 7 10 13 17 23 1 4 5.9Other 133 140 139 134 133 133 132 100 100 !0.2
Energy demand (Mtoe) Shares (%)
OECD Europe: New Policies Scenario
© O
EC
D/IE
A, 2
011

Annex A - Tables for scenario projections 561
A
2020 2030 2035 2020 2030 2035CPS 450 CPS 450
TPED 1 897 1 960 1 995 1 804 1 759 1 746 100 100 0.5 !0.0Coal 302 299 280 233 133 106 14 6 !0.1 !3.8Oil 587 564 558 545 440 380 28 22 !0.4 !1.9Gas 514 563 600 479 430 395 30 23 1.2 !0.4Nuclear 215 189 178 228 274 296 9 17 !1.0 1.0Hydro 50 52 53 52 57 59 3 3 0.7 1.1Biomass and waste 164 196 213 186 270 313 11 18 2.3 3.9Other renewables 67 97 114 81 155 198 6 11 5.8 8.1Power generation 793 843 866 746 750 768 100 100 0.6 0.1Coal 213 218 202 151 64 44 23 6 !0.3 !6.0Oil 13 8 8 11 6 6 1 1 !4.2 !5.6Gas 182 215 243 164 119 89 28 12 1.8 !2.1Nuclear 215 189 178 228 274 296 21 39 !1.0 1.0Hydro 50 52 53 52 57 59 6 8 0.7 1.1Biomass and waste 64 78 85 70 98 111 10 15 2.5 3.5Other renewables 57 83 97 70 131 162 11 21 6.1 8.2Other energy sector 146 141 138 139 122 113 100 100 !0.1 !0.9Electricity 44 46 46 42 40 40 33 35 0.2 !0.4TFC 1 372 1 434 1 470 1 313 1 295 1 280 100 100 0.7 0.1Coal 56 51 49 50 41 36 3 3 0.0 !1.1Oil 536 519 515 498 405 350 35 27 !0.2 !1.7Gas 310 328 338 293 291 287 23 22 1.0 0.3Electricity 306 342 359 294 312 322 24 25 1.3 0.8Heat 56 63 66 51 50 48 4 4 1.3 0.1Biomass and waste 100 117 128 115 172 201 9 16 2.3 4.1Other renewables 9 14 17 11 24 36 1 3 4.5 7.6Industry 328 334 336 319 317 312 100 100 0.8 0.5Coal 35 32 31 33 28 26 9 8 0.3 !0.4Oil 34 30 27 33 28 25 8 8 !1.3 !1.6Gas 96 97 97 93 93 90 29 29 0.9 0.7Electricity 116 123 125 112 111 109 37 35 1.1 0.5Heat 17 17 18 16 16 15 5 5 0.5 0.0Biomass and waste 29 34 38 31 40 46 11 15 2.1 2.9Other renewables 0 0 0 0 0 0 0 0 7.8 8.5Transport 354 354 360 339 302 280 100 100 0.2 !0.8Oil 319 313 315 298 231 191 87 68 !0.1 !2.0Electricity 8 10 11 9 15 23 3 8 2.0 5.1Biofuels 24 27 29 28 48 55 8 19 3.5 6.0Other fuels 3 4 5 4 7 11 1 4 3.4 6.6Buildings 549 605 635 522 544 557 100 100 1.1 0.5Coal 18 16 16 16 11 9 2 2 !0.5 !2.7Oil 67 63 60 61 46 37 9 7 !0.6 !2.4Gas 194 211 220 182 177 172 35 31 1.0 0.0Electricity 177 204 218 169 182 186 34 33 1.4 0.8Heat 39 45 48 34 34 33 8 6 1.7 0.2Biomass and waste 44 53 58 50 72 86 9 15 1.9 3.5Other renewables 9 13 16 11 23 34 3 6 4.4 7.5Other 141 140 139 134 132 132 100 100 !0.0 !0.2
Current Policies Scenario 450 Scenario
Energy demand (Mtoe) Shares (%) CAAGR (%)2035 2009!2035
OECD Europe: Current Policies and 450 Scenarios
© O
EC
D/IE
A, 2
011

562 World Energy Outlook 2011 - ANNEXES
CAAGR (%)
1990 2009 2015 2020 2025 2030 2035 2009 2035 2009!2035Total generation 2 683 3 508 3 835 4 003 4 178 4 335 4 450 100 100 0.9Coal 1 040 897 853 764 697 575 498 26 11 !2.2Oil 216 94 62 43 32 27 26 3 1 !4.8Gas 168 831 911 966 1 023 1 094 1 057 24 24 0.9Nuclear 787 884 883 866 850 859 874 25 20 !0.0Hydro 446 515 556 584 606 622 636 15 14 0.8Biomass and waste 21 127 171 207 241 267 291 4 7 3.2Wind 1 135 310 449 567 675 784 4 18 7.0Geothermal 4 11 14 17 21 25 29 0 1 4.0Solar PV 0 14 64 90 116 139 156 0 4 9.7CSP ! 0 9 14 22 36 51 0 1 34.7Marine 1 0 1 2 5 14 47 0 1 19.1
CAAGR (%)
2009 2015 2020 2025 2030 2035 2009 2035 2009!2035Total capacity 900 1 130 1 180 1 233 1 294 1 356 100 100 1.6Coal 179 220 189 169 150 123 20 9 !1.4Oil 67 64 48 37 31 30 7 2 !3.0Gas 206 264 272 286 303 320 23 24 1.7Nuclear 138 131 126 121 122 124 15 9 !0.4Hydro 193 204 213 220 226 231 21 17 0.7Biomass and waste 21 26 32 37 41 44 2 3 3.0Wind 76 151 209 252 289 324 8 24 5.7Geothermal 2 2 3 3 4 4 0 0 3.2Solar PV 17 64 84 101 115 127 2 9 8.2CSP 0 3 4 6 10 15 0 1 20.4Marine 0 0 1 1 4 13 0 1 16.5
CAAGR (%)
1990 2009 2015 2020 2025 2030 2035 2009 2035 2009!2035Total CO2 3 964 3 778 3 841 3 712 3 555 3 374 3 229 100 100 !0.6Coal 1 713 1 132 1 130 1 019 899 749 651 30 20 !2.1Oil 1 674 1 638 1 579 1 515 1 445 1 371 1 314 43 41 !0.8Gas 578 1 008 1 132 1 179 1 211 1 254 1 264 27 39 0.9Power generation 1 398 1 337 1 301 1 210 1 113 1 011 931 100 100 !1.4Coal 1 139 896 841 740 634 500 415 67 45 !2.9Oil 164 80 55 38 27 23 21 6 2 !5.0Gas 95 361 405 432 451 488 495 27 53 1.2TFC 2 389 2 258 2 362 2 329 2 275 2 201 2 141 100 100 !0.2Coal 535 208 249 239 226 212 201 9 9 !0.1Oil 1 394 1 443 1 426 1 382 1 326 1 260 1 207 64 56 !0.7Transport 775 965 961 936 897 850 820 43 38 !0.6Gas 460 607 687 708 722 730 734 27 34 0.7
CO2 emissions (Mt) Shares (%)
Electricity generation (TWh) Shares (%)
Electrical capacity (GW) Shares (%)
OECD Europe: New Policies Scenario
© O
EC
D/IE
A, 2
011

Annex A - Tables for scenario projections 563
A
2020 2030 2035 2020 2030 2035CPS 450 CPS 450
Total generation 4 056 4 499 4 700 3 899 4 082 4 193 100 100 1.1 0.7Coal 925 1 010 982 647 262 179 21 4 0.4 !6.0Oil 45 31 32 37 23 20 1 0 !4.1 !5.7Gas 974 1 138 1 259 887 612 379 27 9 1.6 !3.0Nuclear 824 727 681 877 1 050 1 137 14 27 !1.0 1.0Hydro 576 606 616 600 658 683 13 16 0.7 1.1Biomass and waste 192 242 264 217 311 358 6 9 2.8 4.1Wind 409 568 642 495 862 1 021 14 24 6.2 8.1Geothermal 16 21 24 18 31 38 1 1 3.2 5.0Solar PV 83 118 130 99 182 231 3 6 8.9 11.4CSP 12 29 42 21 64 87 1 2 33.7 37.5Marine 1 8 28 2 25 61 1 1 16.8 20.3
2020 2030 2035 2020 2030 2035CPS 450 CPS 450
Total capacity 1 163 1 257 1 313 1 215 1 429 1 534 100 100 1.5 2.1Coal 199 180 166 180 120 81 13 5 !0.3 !3.0Oil 48 30 30 48 27 24 2 2 !3.1 !3.9Gas 277 317 347 275 303 319 26 21 2.0 1.7Nuclear 121 105 96 129 150 160 7 10 !1.4 0.6Hydro 210 220 223 218 239 248 17 16 0.6 1.0Biomass and waste 29 37 40 33 48 55 3 4 2.6 3.8Wind 194 255 279 231 363 410 21 27 5.1 6.7Geothermal 3 3 4 3 5 6 0 0 2.6 4.2Solar PV 78 100 108 91 150 189 8 12 7.5 9.8CSP 3 8 12 6 18 25 1 2 19.4 22.8Marine 0 2 8 1 7 17 1 1 14.3 17.7
2020 2030 2035 2020 2030 2035CPS 450 CPS 450
Total CO2 3 881 3 905 3 899 3 407 2 398 1 996 100 100 0.1 !2.4Coal 1 156 1 127 1 049 871 339 221 27 11 !0.3 !6.1Oil 1 548 1 484 1 468 1 441 1 128 950 38 48 !0.4 !2.1Gas 1 177 1 294 1 382 1 096 930 824 35 41 1.2 !0.8Power generation 1 337 1 398 1 395 1 026 423 251 100 100 0.2 !6.2Coal 872 871 803 611 154 69 58 28 !0.4 !9.4Oil 41 27 26 35 20 18 2 7 !4.2 !5.6Gas 425 500 566 380 249 164 41 65 1.7 !3.0TFC 2 369 2 340 2 338 2 215 1 832 1 616 100 100 0.1 !1.3Coal 244 220 211 222 151 120 9 7 0.1 !2.1Oil 1 411 1 362 1 347 1 316 1 034 869 58 54 !0.3 !1.9Transport 955 937 941 893 692 570 40 35 !0.1 !2.0Gas 714 758 780 677 646 627 33 39 1.0 0.1
Current Policies Scenario 450 Scenario
Current Policies Scenario 450 Scenario
CO2 emissions (Mt) Shares (%) CAAGR (%)2035 2009!2035
Current Policies Scenario 450 Scenario
Electrical capacity (GW) Shares (%) CAAGR (%)2035 2009!2035
Electricity generation (TWh) Shares (%) CAAGR (%)2035 2009!2035
OECD Europe: Current Policies and 450 Scenarios
© O
EC
D/IE
A, 2
011

564 World Energy Outlook 2011 - ANNEXES
CAAGR (%)
1990 2009 2015 2020 2025 2030 2035 2009 2035 2009!2035TPED 1 633 1 654 1 731 1 734 1 727 1 724 1 731 100 100 0.2Coal 455 267 260 228 198 163 140 16 8 !2.5Oil 601 575 551 524 497 469 446 35 26 !1.0Gas 295 416 468 485 498 513 515 25 30 0.8Nuclear 207 233 230 231 227 230 237 14 14 0.1Hydro 25 28 30 31 32 33 34 2 2 0.7Biomass and waste 46 115 146 171 193 214 236 7 14 2.8Other renewables 3 20 45 64 83 103 125 1 7 7.4Power generation 644 698 725 730 731 741 754 100 100 0.3Coal 286 210 191 162 135 105 85 30 11 !3.4Oil 61 26 18 12 9 7 7 4 1 !5.1Gas 54 139 158 169 177 192 194 20 26 1.3Nuclear 207 233 230 231 227 230 237 33 31 0.1Hydro 25 28 30 31 32 33 34 4 4 0.7Biomass and waste 8 44 56 66 75 82 88 6 12 2.7Other renewables 3 18 41 59 76 92 110 3 15 7.3Other energy sector 150 133 134 129 125 120 115 100 100 !0.6Electricity 39 41 40 39 39 38 37 31 33 !0.3TFC 1 124 1 155 1 230 1 247 1 258 1 262 1 271 100 100 0.4Coal 123 36 40 38 34 31 29 3 2 !0.9Oil 500 505 496 477 455 430 408 44 32 !0.8Gas 224 258 291 299 305 307 308 22 24 0.7Electricity 185 234 256 268 279 290 298 20 23 0.9Heat 54 49 54 57 59 62 64 4 5 1.0Biomass and waste 38 71 90 105 117 131 147 6 12 2.9Other renewables 1 2 3 5 7 10 15 0 1 7.8Industry 341 255 295 298 297 295 292 100 100 0.5Coal 69 23 27 26 24 22 20 9 7 !0.5Oil 57 36 34 32 30 27 24 14 8 !1.5Gas 97 74 92 93 93 92 90 29 31 0.7Electricity 85 85 98 101 102 101 101 33 34 0.7Heat 19 15 16 16 16 16 16 6 5 0.2Biomass and waste 14 22 27 30 33 37 42 9 14 2.5Other renewables ! 0 0 0 0 0 0 0 0 2.6Transport 258 322 331 329 317 301 292 100 100 !0.4Oil 252 302 301 291 275 256 241 94 83 !0.9Electricity 5 6 7 8 9 10 11 2 4 2.3Biofuels 0 12 20 26 29 31 33 4 11 4.0Other fuels 1 2 3 3 4 5 6 1 2 3.9Buildings 394 451 478 501 525 547 569 100 100 0.9Coal 50 11 11 10 8 7 7 3 1 !1.9Oil 89 64 61 60 58 55 52 14 9 !0.8Gas 107 166 179 186 191 193 195 37 34 0.6Electricity 90 139 147 155 165 176 183 31 32 1.1Heat 33 34 37 40 43 46 48 7 8 1.4Biomass and waste 23 35 40 46 53 60 69 8 12 2.6Other renewables 1 2 3 5 7 10 15 0 3 7.8Other 132 127 125 119 119 118 118 100 100 !0.3
Energy demand (Mtoe) Shares (%)
European Union: New Policies Scenario
© O
EC
D/IE
A, 2
011

Annex A - Tables for scenario projections 565
A
2020 2030 2035 2020 2030 2035CPS 450 CPS 450
TPED 1 754 1 791 1 818 1 670 1 618 1 606 100 100 0.4 !0.1Coal 257 243 221 200 114 92 12 6 !0.7 !4.0Oil 541 512 503 500 395 336 28 21 !0.5 !2.0Gas 486 530 566 450 402 367 31 23 1.2 !0.5Nuclear 219 197 188 233 273 296 10 18 !0.8 0.9Hydro 31 32 33 32 35 36 2 2 0.6 1.0Biomass and waste 162 193 209 184 265 306 12 19 2.3 3.8Other renewables 58 84 99 71 135 172 5 11 6.4 8.7Power generation 734 770 788 695 697 717 100 100 0.5 0.1Coal 190 183 165 138 63 47 21 7 !0.9 !5.6Oil 13 8 8 12 7 6 1 1 !4.5 !5.5Gas 166 197 225 147 108 80 29 11 1.9 !2.1Nuclear 219 197 188 233 273 296 24 41 !0.8 0.9Hydro 31 32 33 32 35 36 4 5 0.6 1.0Biomass and waste 62 75 81 69 94 107 10 15 2.4 3.5Other renewables 53 76 89 65 118 145 11 20 6.4 8.5Other energy sector 131 125 122 124 108 99 100 100 !0.3 !1.1Electricity 40 41 40 38 36 35 33 35 !0.0 !0.5TFC 1 266 1 311 1 339 1 210 1 182 1 165 100 100 0.6 0.0Coal 39 32 30 35 26 22 2 2 !0.7 !1.9Oil 491 469 461 455 361 307 34 26 !0.3 !1.9Gas 302 320 328 286 281 276 25 24 0.9 0.3Electricity 271 300 314 261 275 284 23 24 1.1 0.7Heat 58 65 68 52 51 50 5 4 1.3 0.1Biomass and waste 100 117 128 115 171 199 10 17 2.3 4.1Other renewables 5 8 10 6 16 27 1 2 6.0 10.1Industry 299 300 301 291 285 280 100 100 0.6 0.4Coal 26 22 20 24 20 18 7 6 !0.5 !0.9Oil 32 28 25 31 26 23 8 8 !1.4 !1.8Gas 94 94 94 90 89 87 31 31 0.9 0.6Electricity 101 106 108 97 95 93 36 33 0.9 0.4Heat 16 16 17 16 15 14 5 5 0.4 !0.1Biomass and waste 29 34 38 31 40 46 13 16 2.1 2.8Other renewables 0 0 0 0 0 0 0 0 2.6 5.3Transport 333 326 328 319 278 254 100 100 0.1 !0.9Oil 298 287 284 278 208 168 87 66 !0.2 !2.2Electricity 8 9 10 8 14 21 3 8 1.9 4.9Biofuels 24 26 28 28 48 54 8 21 3.3 6.0Other fuels 3 4 5 4 7 11 2 4 3.6 6.2Buildings 507 559 587 481 502 514 100 100 1.0 0.5Coal 10 8 8 8 4 3 1 0 !1.5 !5.6Oil 61 57 55 55 42 34 9 7 !0.6 !2.4Gas 188 203 211 175 169 163 36 32 0.9 !0.1Electricity 158 181 192 151 163 167 33 33 1.3 0.7Heat 41 48 51 36 36 35 9 7 1.7 0.2Biomass and waste 45 54 60 50 72 86 10 17 2.1 3.5Other renewables 5 8 10 6 16 26 2 5 6.0 10.1Other 127 125 124 119 118 117 100 100 !0.1 !0.3
Current Policies Scenario 450 Scenario
Energy demand (Mtoe) Shares (%) CAAGR (%)2035 2009!2035
European Union: Current Policies and 450 Scenarios
© O
EC
D/IE
A, 2
011

566 World Energy Outlook 2011 - ANNEXES
CAAGR (%)
1990 2009 2015 2020 2025 2030 2035 2009 2035 2009!2035Total generation 2 568 3 170 3 439 3 566 3 700 3 820 3 904 100 100 0.8Coal 1 050 849 783 667 581 454 373 27 10 !3.1Oil 221 96 63 42 30 26 24 3 1 !5.2Gas 191 726 800 848 903 965 920 23 24 0.9Nuclear 795 894 883 885 872 882 907 28 23 0.1Hydro 286 328 353 365 375 384 393 10 10 0.7Biomass and waste 20 124 167 201 233 257 279 4 7 3.2Wind 1 133 306 440 551 646 737 4 19 6.8Geothermal 3 6 9 12 15 18 21 0 1 5.2Solar PV 0 14 64 89 114 137 153 0 4 9.6CSP ! 0 9 14 22 36 51 0 1 34.7Marine 1 0 1 2 5 14 47 0 1 19.1
CAAGR (%)
2009 2015 2020 2025 2030 2035 2009 2035 2009!2035Total capacity 834 1 049 1 090 1 132 1 180 1 230 100 100 1.5Coal 177 215 180 158 137 108 21 9 !1.9Oil 66 61 45 33 27 26 8 2 !3.6Gas 193 246 252 263 277 292 23 24 1.6Nuclear 139 131 129 124 125 129 17 10 !0.3Hydro 146 151 156 161 165 169 17 14 0.6Biomass and waste 20 26 31 36 39 43 2 3 2.9Wind 75 150 207 248 280 307 9 25 5.6Geothermal 1 1 2 2 3 3 0 0 4.3Solar PV 17 64 83 100 114 126 2 10 8.1CSP 0 3 4 6 10 15 0 1 20.4Marine 0 0 1 1 4 13 0 1 16.5
CAAGR (%)
1990 2009 2015 2020 2025 2030 2035 2009 2035 2009!2035Total CO2 4 035 3 529 3 542 3 377 3 186 2 981 2 827 100 100 !0.8Coal 1 735 1 045 1 005 868 728 571 480 30 17 !2.9Oil 1 643 1 533 1 469 1 399 1 320 1 236 1 167 43 41 !1.0Gas 658 950 1 068 1 109 1 138 1 174 1 180 27 42 0.8Power generation 1 491 1 270 1 215 1 096 978 864 789 100 100 !1.8Coal 1 170 861 788 663 538 397 318 68 40 !3.8Oil 195 83 58 39 27 23 21 7 3 !5.1Gas 127 326 369 394 412 444 449 26 57 1.2TFC 2 372 2 093 2 172 2 133 2 066 1 981 1 909 100 100 !0.4Coal 527 159 182 171 156 141 131 8 7 !0.7Oil 1 332 1 340 1 320 1 272 1 208 1 132 1 068 64 56 !0.9Transport 744 905 902 873 824 766 723 43 38 !0.9Gas 513 594 670 689 702 708 710 28 37 0.7
CO2 emissions (Mt) Shares (%)
Electricity generation (TWh) Shares (%)
Electrical capacity (GW) Shares (%)
European Union: New Policies Scenario
© O
EC
D/IE
A, 2
011

Annex A - Tables for scenario projections 567
A
2020 2030 2035 2020 2030 2035CPS 450 CPS 450
Total generation 3 610 3 960 4 119 3 471 3 613 3 707 100 100 1.0 0.6Coal 808 839 787 579 249 183 19 5 !0.3 !5.7Oil 45 30 29 39 23 20 1 1 !4.5 !5.8Gas 862 1 016 1 133 764 529 307 28 8 1.7 !3.3Nuclear 840 757 722 893 1 045 1 136 18 31 !0.8 0.9Hydro 362 375 379 372 404 422 9 11 0.6 1.0Biomass and waste 187 233 254 211 297 339 6 9 2.8 3.9Wind 400 541 601 481 781 905 15 24 6.0 7.7Geothermal 10 15 17 12 24 29 0 1 4.3 6.6Solar PV 82 117 128 97 175 223 3 6 8.9 11.2CSP 12 29 42 20 61 82 1 2 33.7 37.2Marine 1 9 28 2 25 61 1 2 16.8 20.3
2020 2030 2035 2020 2030 2035CPS 450 CPS 450
Total capacity 1 072 1 143 1 188 1 123 1 291 1 380 100 100 1.4 2.0Coal 188 161 142 174 118 83 12 6 !0.8 !2.9Oil 45 26 26 45 23 20 2 1 !3.6 !4.5Gas 257 293 323 256 274 286 27 21 2.0 1.5Nuclear 124 109 101 131 150 161 9 12 !1.2 0.5Hydro 155 161 162 160 174 182 14 13 0.4 0.9Biomass and waste 29 36 39 32 45 52 3 4 2.5 3.7Wind 192 246 265 226 333 369 22 27 5.0 6.3Geothermal 2 2 3 2 4 4 0 0 3.5 5.5Solar PV 77 99 107 90 146 183 9 13 7.5 9.7CSP 3 8 12 6 17 24 1 2 19.4 22.6Marine 0 2 8 1 7 17 1 1 14.3 17.7
2020 2030 2035 2020 2030 2035CPS 450 CPS 450
Total CO2 3 533 3 469 3 434 3 107 2 162 1 796 100 100 !0.1 !2.6Coal 987 901 808 749 269 175 24 10 !1.0 !6.6Oil 1 435 1 351 1 325 1 333 1 017 842 39 47 !0.6 !2.3Gas 1 110 1 217 1 301 1 025 877 778 38 43 1.2 !0.8Power generation 1 209 1 208 1 189 936 400 259 100 100 !0.3 !5.9Coal 778 723 641 558 145 81 54 31 !1.1 !8.7Oil 42 27 25 37 22 19 2 7 !4.5 !5.5Gas 389 458 523 342 233 159 44 61 1.8 !2.7TFC 2 173 2 120 2 107 2 028 1 644 1 432 100 100 0.0 !1.4Coal 175 146 137 159 94 67 6 5 !0.6 !3.2Oil 1 302 1 238 1 213 1 212 928 765 58 53 !0.4 !2.1Transport 894 858 852 833 624 503 40 35 !0.2 !2.2Gas 696 736 756 658 623 600 36 42 0.9 0.0
Current Policies Scenario 450 Scenario
Current Policies Scenario 450 Scenario
CO2 emissions (Mt) Shares (%) CAAGR (%)2035 2009!2035
Current Policies Scenario 450 Scenario
Electrical capacity (GW) Shares (%) CAAGR (%)2035 2009!2035
Electricity generation (TWh) Shares (%) CAAGR (%)2035 2009!2035
European Union: Current Policies and 450 Scenarios
© O
EC
D/IE
A, 2
011

568 World Energy Outlook 2011 - ANNEXES
CAAGR (%)
1990 2009 2015 2020 2025 2030 2035 2009 2035 2009!2035TPED 631 850 906 912 913 914 912 100 100 0.3Coal 138 223 245 243 225 204 172 26 19 !1.0Oil 335 338 329 310 297 284 271 40 30 !0.8Gas 66 144 168 170 172 179 186 17 20 1.0Nuclear 66 111 120 136 157 174 197 13 22 2.2Hydro 11 10 12 12 13 13 13 1 1 1.2Biomass and waste 10 16 19 24 28 33 37 2 4 3.2Other renewables 4 7 12 16 22 28 36 1 4 6.2Power generation 241 389 424 434 440 448 451 100 100 0.6Coal 60 159 166 164 144 123 91 41 20 !2.1Oil 56 22 17 10 8 8 9 6 2 !3.6Gas 40 74 91 88 87 91 95 19 21 1.0Nuclear 66 111 120 136 157 174 197 29 44 2.2Hydro 11 10 12 12 13 13 13 3 3 1.2Biomass and waste 3 7 8 10 12 15 17 2 4 3.7Other renewables 3 6 10 14 18 23 28 2 6 5.9Other energy sector 57 68 73 74 75 74 74 100 100 0.3Electricity 11 18 20 20 20 20 19 26 26 0.4TFC 431 552 590 591 589 587 584 100 100 0.2Coal 49 39 47 46 44 42 40 7 7 0.1Oil 261 295 295 286 276 266 255 53 44 !0.6Gas 26 65 74 77 79 81 83 12 14 1.0Electricity 86 137 155 161 165 169 171 25 29 0.9Heat 0 5 5 5 5 6 6 1 1 0.6Biomass and waste 7 10 11 14 16 18 20 2 3 2.8Other renewables 2 1 2 3 4 5 8 0 1 7.6Industry 145 152 174 177 177 176 173 100 100 0.5Coal 39 36 44 43 42 40 38 24 22 0.2Oil 51 34 33 31 30 28 26 22 15 !1.0Gas 11 22 25 27 28 29 30 14 17 1.2Electricity 40 50 60 62 63 63 62 33 36 0.9Heat ! 3 3 3 3 3 3 2 1 !0.2Biomass and waste 5 7 9 10 12 13 15 5 9 2.7Other renewables 0 0 0 0 0 0 0 0 0 1.8Transport 110 139 139 132 125 119 113 100 100 !0.8Oil 109 135 134 126 119 112 104 97 92 !1.0Electricity 2 2 3 3 3 4 4 2 4 2.8Biofuels ! 0 1 1 1 1 1 0 1 2.4Other fuels 0 1 2 2 2 3 3 1 3 3.5Buildings 120 170 184 189 194 199 206 100 100 0.7Coal 10 2 2 2 2 1 1 1 1 !0.9Oil 47 38 39 39 39 39 39 23 19 0.0Gas 15 40 45 46 47 48 49 24 24 0.7Electricity 44 84 91 95 98 101 104 50 50 0.8Heat 0 2 2 3 3 3 3 1 2 1.3Biomass and waste 2 2 2 3 3 4 5 1 2 3.1Other renewables 1 1 1 2 3 4 6 1 3 7.4Other 56 91 93 93 93 92 92 100 100 0.0
Energy demand (Mtoe) Shares (%)
OECD Asia Oceania: New Policies Scenario
© O
EC
D/IE
A, 2
011

Annex A - Tables for scenario projections 569
A
2020 2030 2035 2020 2030 2035CPS 450 CPS 450
TPED 927 959 971 888 849 843 100 100 0.5 !0.0Coal 256 256 249 220 123 92 26 11 0.4 !3.3Oil 314 292 283 296 239 209 29 25 !0.7 !1.8Gas 174 183 191 168 170 161 20 19 1.1 0.4Nuclear 135 167 181 142 204 236 19 28 1.9 2.9Hydro 12 12 13 13 15 16 1 2 0.9 1.9Biomass and waste 21 26 29 29 50 63 3 8 2.1 5.3Other renewables 15 23 26 20 47 66 3 8 4.9 8.7Power generation 442 475 489 423 417 423 100 100 0.9 0.3Coal 172 164 155 145 51 22 32 5 !0.1 !7.3Oil 11 9 9 8 4 4 2 1 !3.3 !6.3Gas 90 91 95 87 87 75 19 18 1.0 0.1Nuclear 135 167 181 142 204 236 37 56 1.9 2.9Hydro 12 12 13 13 15 16 3 4 0.9 1.9Biomass and waste 9 12 14 11 17 21 3 5 3.0 4.6Other renewables 13 19 22 17 38 48 4 11 4.9 8.2Other energy sector 77 80 81 72 67 64 100 100 0.7 !0.2Electricity 21 21 21 20 19 18 26 28 0.7 0.1TFC 599 608 612 577 551 541 100 100 0.4 !0.1Coal 49 47 46 44 38 35 8 6 0.7 !0.4Oil 289 275 268 273 227 200 44 37 !0.4 !1.5Gas 78 85 89 76 78 80 14 15 1.2 0.8Electricity 165 178 185 159 162 162 30 30 1.2 0.7Heat 5 6 6 5 5 5 1 1 0.6 0.2Biomass and waste 12 13 14 18 33 42 2 8 1.4 5.7Other renewables 2 4 4 3 9 17 1 3 5.1 10.8Industry 181 185 185 174 170 167 100 100 0.8 0.3Coal 46 44 43 41 35 33 23 20 0.7 !0.4Oil 32 30 28 31 29 27 15 16 !0.7 !0.9Gas 27 30 32 27 29 30 17 18 1.4 1.2Electricity 64 68 69 61 60 58 37 35 1.3 0.6Heat 3 3 3 3 2 2 1 1 !0.2 !0.6Biomass and waste 9 10 11 11 14 16 6 10 1.3 3.0Other renewables 0 0 0 0 0 0 0 0 1.8 1.8Transport 134 125 122 128 106 94 100 100 !0.5 !1.5Oil 129 118 114 121 87 67 93 71 !0.6 !2.7Electricity 3 3 4 3 8 13 3 13 2.3 7.1Biofuels 1 1 1 1 7 11 1 11 1.5 12.9Other fuels 2 3 4 3 4 4 3 5 3.6 4.4Buildings 192 206 214 182 182 187 100 100 0.9 0.4Coal 2 2 2 2 1 1 1 1 0.3 !1.3Oil 40 40 40 35 30 28 19 15 0.2 !1.2Gas 47 50 52 44 43 44 24 24 1.0 0.3Electricity 96 105 110 93 93 90 52 48 1.1 0.3Heat 3 3 3 3 3 3 2 2 1.5 0.9Biomass and waste 2 3 3 3 5 6 2 3 1.8 4.5Other renewables 2 3 3 2 8 15 2 8 5.0 11.4Other 93 92 91 93 93 92 100 100 0.0 0.1
Current Policies Scenario 450 Scenario
Energy demand (Mtoe) Shares (%) CAAGR (%)2035 2009!2035
OECD Asia Oceania: Current Policies and 450 Scenarios
© O
EC
D/IE
A, 2
011

570 World Energy Outlook 2011 - ANNEXES
CAAGR (%)
1990 2009 2015 2020 2025 2030 2035 2009 2035 2009!2035Total generation 1 127 1 797 2 036 2 113 2 157 2 192 2 219 100 100 0.8Coal 257 695 738 737 666 577 453 39 20 !1.6Oil 270 114 85 48 41 40 41 6 2 !3.9Gas 197 400 526 537 532 540 550 22 25 1.2Nuclear 255 428 471 532 612 678 763 24 34 2.3Hydro 133 114 139 143 147 151 154 6 7 1.2Biomass and waste 12 25 33 42 50 59 67 1 3 3.8Wind ! 9 22 37 55 79 105 0 5 9.9Geothermal 4 8 10 12 14 16 18 0 1 3.3Solar PV 0 4 11 22 33 43 52 0 2 10.8CSP ! 0 1 3 4 7 10 0 0 35.3Marine ! ! 0 1 2 3 5 ! 0 n.a.
CAAGR (%)
2009 2015 2020 2025 2030 2035 2009 2035 2009!2035Total capacity 426 474 503 526 553 579 100 100 1.2Coal 104 110 109 106 102 94 25 16 !0.4Oil 57 51 32 27 25 25 13 4 !3.1Gas 115 143 166 168 174 178 27 31 1.7Nuclear 69 73 80 91 99 110 16 19 1.8Hydro 67 69 71 73 75 77 16 13 0.5Biomass and waste 4 6 7 8 10 11 1 2 3.5Wind 5 9 14 20 27 35 1 6 8.1Geothermal 1 2 2 2 2 3 0 0 3.2Solar PV 3 11 21 29 36 43 1 7 10.3CSP 0 0 1 1 2 3 0 0 32.5Marine ! 0 0 0 1 1 ! 0 n.a.
CAAGR (%)
1990 2009 2015 2020 2025 2030 2035 2009 2035 2009!2035Total CO2 1 574 2 021 2 140 2 078 1 949 1 825 1 655 100 100 !0.8Coal 521 872 955 940 841 733 577 43 35 !1.6Oil 892 805 780 728 695 664 633 40 38 !0.9Gas 161 344 406 410 413 429 445 17 27 1.0Power generation 548 911 970 931 839 750 617 100 100 !1.5Coal 280 666 702 691 604 507 362 73 59 !2.3Oil 174 67 51 30 26 25 27 7 4 !3.5Gas 94 178 217 211 209 218 228 20 37 1.0TFC 958 1 013 1 068 1 041 1 010 977 942 100 100 !0.3Coal 221 171 209 203 195 186 176 17 19 0.1Oil 676 691 687 660 632 602 572 68 61 !0.7Transport 321 396 394 372 351 329 307 39 33 !1.0Gas 61 151 172 179 183 188 194 15 21 1.0
CO2 emissions (Mt) Shares (%)
Electricity generation (TWh) Shares (%)
Electrical capacity (GW) Shares (%)
OECD Asia Oceania: New Policies Scenario
© O
EC
D/IE
A, 2
011

Annex A - Tables for scenario projections 571
A
2020 2030 2035 2020 2030 2035CPS 450 CPS 450
Total generation 2 156 2 317 2 391 2 081 2 102 2 096 100 100 1.1 0.6Coal 779 778 767 648 239 101 32 5 0.4 !7.2Oil 52 42 43 40 20 19 2 1 !3.7 !6.6Gas 552 534 537 537 528 443 22 21 1.1 0.4Nuclear 528 650 702 552 793 912 29 44 1.9 3.0Hydro 140 144 146 154 179 186 6 9 0.9 1.9Biomass and waste 36 50 56 43 69 83 2 4 3.1 4.7Wind 36 66 77 59 166 206 3 10 8.6 12.8Geothermal 11 14 16 13 21 24 1 1 2.7 4.5Solar PV 19 34 39 31 71 89 2 4 9.6 13.1CSP 2 5 7 3 13 26 0 1 33.3 40.1Marine 0 1 3 1 4 7 0 0 n.a. n.a.
2020 2030 2035 2020 2030 2035CPS 450 CPS 450
Total capacity 506 556 577 510 572 607 100 100 1.2 1.4Coal 114 118 117 105 64 51 20 8 0.4 !2.7Oil 32 26 26 31 19 17 5 3 !3.0 !4.5Gas 169 181 186 154 157 160 32 26 1.9 1.3Nuclear 80 96 102 83 114 128 18 21 1.5 2.4Hydro 70 72 73 75 86 89 13 15 0.3 1.1Biomass and waste 6 8 9 7 11 13 2 2 2.8 4.3Wind 13 23 26 22 55 66 5 11 6.9 10.8Geothermal 2 2 2 2 3 4 0 1 2.6 4.5Solar PV 19 30 33 29 59 71 6 12 9.3 12.5CSP 1 1 2 1 3 6 0 1 30.5 37.2Marine 0 0 1 0 1 2 0 0 n.a. n.a.
2020 2030 2035 2020 2030 2035CPS 450 CPS 450
Total CO2 2 148 2 071 2 024 1 927 1 229 945 100 100 0.0 !2.9Coal 989 938 889 834 334 167 44 18 0.1 !6.2Oil 741 696 678 690 535 453 33 48 !0.7 !2.2Gas 418 438 457 403 360 325 23 34 1.1 !0.2Power generation 974 932 900 829 347 172 100 100 !0.0 !6.2Coal 726 686 644 598 169 30 72 17 !0.1 !11.3Oil 32 27 28 25 13 13 3 7 !3.3 !6.2Gas 217 218 227 207 165 129 25 75 1.0 !1.2TFC 1 065 1 035 1 020 996 793 690 100 100 0.0 !1.5Coal 215 207 201 192 129 103 20 15 0.6 !1.9Oil 670 631 613 628 491 413 60 60 !0.5 !2.0Transport 378 348 335 355 257 197 33 29 !0.6 !2.6Gas 181 197 206 176 173 173 20 25 1.2 0.5
Current Policies Scenario 450 Scenario
Current Policies Scenario 450 Scenario
CO2 emissions (Mt) Shares (%) CAAGR (%)2035 2009!2035
Current Policies Scenario 450 Scenario
Electrical capacity (GW) Shares (%) CAAGR (%)2035 2009!2035
Electricity generation (TWh) Shares (%) CAAGR (%)2035 2009!2035
OECD Asia Oceania: Current Policies and 450 Scenarios
© O
EC
D/IE
A, 2
011
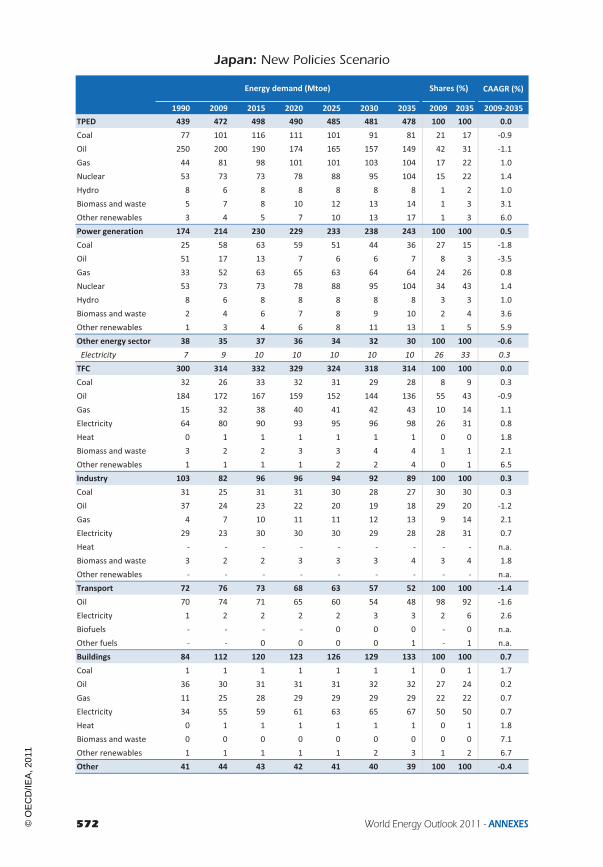
572 World Energy Outlook 2011 - ANNEXES
CAAGR (%)
1990 2009 2015 2020 2025 2030 2035 2009 2035 2009!2035TPED 439 472 498 490 485 481 478 100 100 0.0Coal 77 101 116 111 101 91 81 21 17 !0.9Oil 250 200 190 174 165 157 149 42 31 !1.1Gas 44 81 98 101 101 103 104 17 22 1.0Nuclear 53 73 73 78 88 95 104 15 22 1.4Hydro 8 6 8 8 8 8 8 1 2 1.0Biomass and waste 5 7 8 10 12 13 14 1 3 3.1Other renewables 3 4 5 7 10 13 17 1 3 6.0Power generation 174 214 230 229 233 238 243 100 100 0.5Coal 25 58 63 59 51 44 36 27 15 !1.8Oil 51 17 13 7 6 6 7 8 3 !3.5Gas 33 52 63 65 63 64 64 24 26 0.8Nuclear 53 73 73 78 88 95 104 34 43 1.4Hydro 8 6 8 8 8 8 8 3 3 1.0Biomass and waste 2 4 6 7 8 9 10 2 4 3.6Other renewables 1 3 4 6 8 11 13 1 5 5.9Other energy sector 38 35 37 36 34 32 30 100 100 !0.6Electricity 7 9 10 10 10 10 10 26 33 0.3TFC 300 314 332 329 324 318 314 100 100 0.0Coal 32 26 33 32 31 29 28 8 9 0.3Oil 184 172 167 159 152 144 136 55 43 !0.9Gas 15 32 38 40 41 42 43 10 14 1.1Electricity 64 80 90 93 95 96 98 26 31 0.8Heat 0 1 1 1 1 1 1 0 0 1.8Biomass and waste 3 2 2 3 3 4 4 1 1 2.1Other renewables 1 1 1 1 2 2 4 0 1 6.5Industry 103 82 96 96 94 92 89 100 100 0.3Coal 31 25 31 31 30 28 27 30 30 0.3Oil 37 24 23 22 20 19 18 29 20 !1.2Gas 4 7 10 11 11 12 13 9 14 2.1Electricity 29 23 30 30 30 29 28 28 31 0.7Heat ! ! ! ! ! ! ! ! ! n.a.Biomass and waste 3 2 2 3 3 3 4 3 4 1.8Other renewables ! ! ! ! ! ! ! ! ! n.a.Transport 72 76 73 68 63 57 52 100 100 !1.4Oil 70 74 71 65 60 54 48 98 92 !1.6Electricity 1 2 2 2 2 3 3 2 6 2.6Biofuels ! ! ! ! 0 0 0 ! 0 n.a.Other fuels ! ! 0 0 0 0 1 ! 1 n.a.Buildings 84 112 120 123 126 129 133 100 100 0.7Coal 1 1 1 1 1 1 1 0 1 1.7Oil 36 30 31 31 31 32 32 27 24 0.2Gas 11 25 28 29 29 29 29 22 22 0.7Electricity 34 55 59 61 63 65 67 50 50 0.7Heat 0 1 1 1 1 1 1 0 1 1.8Biomass and waste 0 0 0 0 0 0 0 0 0 7.1Other renewables 1 1 1 1 1 2 3 1 2 6.7Other 41 44 43 42 41 40 39 100 100 !0.4
Energy demand (Mtoe) Shares (%)
Japan: New Policies Scenario
© O
EC
D/IE
A, 2
011

Annex A - Tables for scenario projections 573
A
2020 2030 2035 2020 2030 2035CPS 450 CPS 450
TPED 496 502 505 474 448 442 100 100 0.3 !0.2Coal 116 113 109 98 55 42 22 10 0.3 !3.3Oil 177 163 157 165 132 117 31 26 !0.9 !2.1Gas 102 103 106 99 88 77 21 17 1.1 !0.2Nuclear 78 94 100 81 119 137 20 31 1.2 2.5Hydro 8 8 8 8 9 10 2 2 0.9 1.6Biomass and waste 8 11 12 12 19 22 2 5 2.3 4.7Other renewables 7 10 12 10 26 38 2 8 4.6 9.4Power generation 233 251 259 223 226 229 100 100 0.7 0.3Coal 62 62 60 50 13 4 23 2 0.1 !9.7Oil 7 7 7 5 2 2 3 1 !3.2 !7.7Gas 65 64 65 63 51 39 25 17 0.8 !1.1Nuclear 78 94 100 81 119 137 39 60 1.2 2.5Hydro 8 8 8 8 9 10 3 4 0.9 1.6Biomass and waste 6 8 9 7 10 11 4 5 3.1 3.8Other renewables 6 9 10 9 21 25 4 11 4.7 8.6Other energy sector 37 34 32 34 28 25 100 100 !0.3 !1.3Electricity 11 11 10 10 10 9 32 36 0.5 !0.0TFC 332 329 328 319 297 289 100 100 0.2 !0.3Coal 33 32 31 30 26 24 9 8 0.7 !0.3Oil 161 149 144 152 124 110 44 38 !0.7 !1.7Gas 40 43 44 39 40 41 14 14 1.2 0.9Electricity 94 101 104 92 92 91 32 31 1.0 0.5Heat 1 1 1 1 1 1 0 0 1.9 1.3Biomass and waste 2 2 3 4 9 11 1 4 0.3 6.0Other renewables 1 2 2 2 6 12 1 4 3.8 11.7Industry 97 96 95 93 88 85 100 100 0.5 0.1Coal 32 31 30 29 25 23 31 27 0.7 !0.3Oil 22 20 19 21 20 18 20 22 !1.0 !1.1Gas 10 12 13 11 13 14 14 16 2.2 2.3Electricity 31 31 31 29 27 26 32 31 1.1 0.5Heat ! ! ! ! ! ! ! ! n.a. n.a.Biomass and waste 2 2 2 3 4 4 3 5 0.3 2.0Other renewables ! ! ! ! ! ! ! ! n.a. n.a.Transport 69 61 57 66 52 45 100 100 !1.1 !2.0Oil 66 58 54 63 44 34 94 76 !1.2 !3.0Electricity 2 3 3 2 5 8 5 17 2.0 6.1Biofuels ! ! ! ! 2 2 ! 5 n.a. n.a.Other fuels 0 0 1 0 1 1 1 2 n.a. n.a.Buildings 125 133 137 118 117 120 100 100 0.8 0.3Coal 1 1 1 1 1 1 1 1 1.9 1.3Oil 32 33 33 27 24 23 24 19 0.4 !1.1Gas 29 30 31 27 26 26 22 22 0.8 0.3Electricity 62 67 70 60 60 57 51 47 0.9 0.1Heat 1 1 1 1 1 1 1 1 1.9 1.3Biomass and waste 0 0 0 0 0 1 0 1 2.2 14.0Other renewables 1 1 2 2 5 12 1 10 4.1 12.2Other 42 40 39 42 40 40 100 100 !0.4 !0.4
Current Policies Scenario 450 Scenario
Energy demand (Mtoe) Shares (%) CAAGR (%)2035 2009!2035
Japan: Current Policies and 450 Scenarios
© O
EC
D/IE
A, 2
011

574 World Energy Outlook 2011 - ANNEXES
CAAGR (%)
1990 2009 2015 2020 2025 2030 2035 2009 2035 2009!2035Total generation 836 1 041 1 174 1 207 1 225 1 241 1 255 100 100 0.7Coal 117 279 308 290 256 223 185 27 15 !1.6Oil 248 92 71 37 32 31 33 9 3 !3.8Gas 167 285 369 407 401 396 382 27 30 1.1Nuclear 202 280 287 308 346 373 408 27 33 1.5Hydro 89 75 89 91 94 96 99 7 8 1.0Biomass and waste 11 21 28 34 39 43 47 2 4 3.1Wind ! 3 10 18 28 41 56 0 4 12.0Geothermal 2 3 3 4 4 5 6 0 0 2.7Solar PV 0 3 9 18 26 32 37 0 3 10.5CSP ! ! ! ! ! ! ! ! ! n.a.Marine ! ! ! ! 0 1 2 ! 0 n.a.
CAAGR (%)
2009 2015 2020 2025 2030 2035 2009 2035 2009!2035Total capacity 274 300 316 327 340 351 100 100 1.0Coal 46 48 46 43 42 39 17 11 !0.7Oil 50 45 26 23 21 21 18 6 !3.2Gas 72 91 112 112 114 114 26 32 1.8Nuclear 50 49 51 57 60 65 18 18 1.0Hydro 47 48 49 50 52 53 17 15 0.4Biomass and waste 4 5 6 6 7 8 1 2 2.8Wind 2 4 7 11 15 20 1 6 9.1Geothermal 1 1 1 1 1 1 0 0 2.7Solar PV 3 9 17 24 28 31 1 9 10.0CSP ! ! ! ! ! ! ! ! n.a.Marine ! ! ! 0 0 1 ! 0 n.a.
CAAGR (%)
1990 2009 2015 2020 2025 2030 2035 2009 2035 2009!2035Total CO2 1 063 1 088 1 160 1 101 1 037 981 918 100 100 !0.7Coal 293 392 450 426 386 348 305 36 33 !1.0Oil 655 492 464 422 399 376 355 45 39 !1.2Gas 115 204 246 253 251 257 258 19 28 0.9Power generation 363 431 470 435 396 368 332 100 100 !1.0Coal 128 255 277 258 224 193 157 59 47 !1.8Oil 157 49 39 20 18 18 20 11 6 !3.4Gas 78 127 153 157 153 156 155 29 47 0.8TFC 655 616 648 627 604 578 553 100 100 !0.4Coal 150 121 153 149 144 138 131 20 24 0.3Oil 470 420 406 385 365 343 321 68 58 !1.0Transport 208 219 209 192 176 159 142 36 26 !1.6Gas 35 75 90 94 95 98 100 12 18 1.1
CO2 emissions (Mt) Shares (%)
Electricity generation (TWh) Shares (%)
Electrical capacity (GW) Shares (%)
Japan: New Policies Scenario
© O
EC
D/IE
A, 2
011

Annex A - Tables for scenario projections 575
A
2020 2030 2035 2020 2030 2035CPS 450 CPS 450
Total generation 1 223 1 295 1 329 1 187 1 184 1 164 100 100 0.9 0.4Coal 309 315 313 244 66 18 24 2 0.4 !10.1Oil 41 34 36 29 11 12 3 1 !3.6 !7.6Gas 409 382 376 400 323 234 28 20 1.1 !0.8Nuclear 308 368 392 319 466 535 29 46 1.3 2.5Hydro 91 94 96 96 109 114 7 10 0.9 1.6Biomass and waste 29 37 42 35 46 51 3 4 2.6 3.4Wind 17 33 39 35 100 123 3 11 10.4 15.4Geothermal 4 4 5 4 9 11 0 1 1.8 5.2Solar PV 16 27 30 26 53 61 2 5 9.7 12.7CSP ! ! ! ! ! ! ! ! n.a. n.a.Marine ! 0 1 ! 1 4 0 0 n.a. n.a.
2020 2030 2035 2020 2030 2035CPS 450 CPS 450
Total capacity 317 343 353 320 348 364 100 100 1.0 1.1Coal 48 49 48 44 20 17 14 5 0.2 !3.8Oil 27 22 22 25 15 14 6 4 !3.0 !4.9Gas 114 118 119 102 94 90 34 25 2.0 0.9Nuclear 51 59 62 53 72 81 18 22 0.8 1.9Hydro 49 51 52 51 57 59 15 16 0.3 0.8Biomass and waste 5 6 7 6 7 8 2 2 2.2 3.1Wind 7 13 14 14 34 41 4 11 7.8 12.2Geothermal 1 1 1 1 2 2 0 1 1.9 5.0Solar PV 16 25 27 25 46 52 8 14 9.4 12.1CSP ! ! ! ! ! ! ! ! n.a. n.a.Marine ! 0 0 ! 0 1 0 0 n.a. n.a.
2020 2030 2035 2020 2030 2035CPS 450 CPS 450
Total CO2 1 132 1 088 1 069 1 019 660 521 100 100 !0.1 !2.8Coal 448 437 425 375 155 93 40 18 0.3 !5.4Oil 431 395 381 398 303 260 36 50 !1.0 !2.4Gas 254 256 263 246 202 169 25 32 1.0 !0.7Power generation 454 444 441 385 162 86 100 100 0.1 !6.0Coal 274 270 263 217 47 4 60 5 0.1 !14.8Oil 22 20 22 15 6 6 5 7 !3.1 !7.6Gas 158 154 157 153 110 75 36 88 0.8 !2.0TFC 638 607 592 596 467 408 100 100 !0.2 !1.6Coal 154 148 144 139 93 74 24 18 0.7 !1.9Oil 390 360 344 366 285 243 58 60 !0.8 !2.1Transport 196 170 158 186 131 100 27 25 !1.2 !3.0Gas 93 100 104 91 89 91 17 22 1.2 0.7
Current Policies Scenario 450 Scenario
Current Policies Scenario 450 Scenario
CO2 emissions (Mt) Shares (%) CAAGR (%)2035 2009!2035
Current Policies Scenario 450 Scenario
Electrical capacity (GW) Shares (%) CAAGR (%)2035 2009!2035
Electricity generation (TWh) Shares (%) CAAGR (%)2035 2009!2035
Japan: Current Policies and 450 Scenarios
© O
EC
D/IE
A, 2
011

576 World Energy Outlook 2011 - ANNEXES
CAAGR (%)
1990 2009 2015 2020 2025 2030 2035 2009 2035 2009!2035TPED 4 065 6 567 8 013 8 818 9 472 10 141 10 826 100 100 1.9Coal 1 153 2 260 2 847 3 038 3 120 3 203 3 299 34 30 1.5Oil 1 157 1 700 2 025 2 153 2 287 2 421 2 551 26 24 1.6Gas 828 1 291 1 583 1 810 2 004 2 213 2 412 20 22 2.4Nuclear 74 119 185 295 374 437 490 2 5 5.6Hydro 83 166 212 250 287 316 338 3 3 2.8Biomass and waste 762 988 1 070 1 137 1 207 1 283 1 368 15 13 1.3Other renewables 8 43 91 136 194 268 368 1 3 8.7Power generation 1 269 2 397 3 020 3 480 3 854 4 239 4 667 100 100 2.6Coal 469 1 298 1 686 1 844 1 938 2 036 2 150 54 46 2.0Oil 223 192 168 154 135 116 112 8 2 !2.1Gas 405 569 660 752 839 930 1 016 24 22 2.3Nuclear 74 119 185 295 374 437 490 5 10 5.6Hydro 83 166 212 250 287 316 338 7 7 2.8Biomass and waste 7 19 36 72 116 174 244 1 5 10.2Other renewables 8 33 73 113 165 231 318 1 7 9.0Other energy sector 498 816 970 1 039 1 086 1 139 1 185 100 100 1.4Electricity 76 161 204 234 261 288 316 20 27 2.6TFC 2 984 4 419 5 422 5 935 6 362 6 790 7 213 100 100 1.9Coal 533 703 854 871 851 825 799 16 11 0.5Oil 815 1 381 1 720 1 863 2 025 2 189 2 327 31 32 2.0Gas 354 558 716 830 919 1 012 1 112 13 15 2.7Electricity 283 669 933 1 132 1 298 1 471 1 658 15 23 3.6Heat 291 194 218 225 225 223 222 4 3 0.5Biomass and waste 707 905 965 993 1 015 1 032 1 044 20 14 0.6Other renewables 0 9 17 22 29 37 50 0 1 6.8Industry 979 1 506 1 962 2 181 2 297 2 397 2 498 100 100 2.0Coal 313 550 694 714 702 687 674 37 27 0.8Oil 160 207 240 246 248 247 244 14 10 0.6Gas 134 206 287 356 396 432 467 14 19 3.2Electricity 157 340 497 604 681 751 823 23 33 3.5Heat 136 86 101 105 102 99 97 6 4 0.5Biomass and waste 79 117 142 156 168 180 192 8 8 1.9Other renewables ! 0 0 0 0 0 0 0 0 3.3Transport 440 783 1 043 1 170 1 329 1 505 1 667 100 100 2.9Oil 370 701 933 1 040 1 177 1 323 1 451 89 87 2.8Electricity 13 14 19 23 27 32 39 2 2 4.1Biofuels 6 16 29 39 52 66 81 2 5 6.4Other fuels 50 53 62 67 74 84 96 7 6 2.3Buildings 1 267 1 619 1 815 1 938 2 050 2 166 2 290 100 100 1.3Coal 170 104 109 103 96 85 73 6 3 !1.3Oil 121 161 181 183 185 185 184 10 8 0.5Gas 126 192 234 266 301 338 380 12 17 2.7Electricity 88 281 374 456 534 624 724 17 32 3.7Heat 145 105 113 117 119 121 121 6 5 0.6Biomass and waste 617 767 788 791 788 777 760 47 33 !0.0Other renewables 0 9 17 22 28 36 48 1 2 6.8Other 298 512 602 647 686 722 757 100 100 1.5
Energy demand (Mtoe) Shares (%)
Non-OECD: New Policies Scenario
© O
EC
D/IE
A, 2
011

Annex A - Tables for scenario projections 577
A
2020 2030 2035 2020 2030 2035CPS 450 CPS 450
TPED 9 091 10 903 11 887 8 404 8 941 9 254 100 100 2.3 1.3Coal 3 289 3 929 4 308 2 736 2 108 1 880 36 20 2.5 !0.7Oil 2 212 2 582 2 763 2 045 2 114 2 074 23 22 1.9 0.8Gas 1 836 2 332 2 619 1 715 1 916 1 991 22 22 2.8 1.7Nuclear 288 388 413 325 624 764 3 8 4.9 7.4Hydro 240 288 309 262 348 376 3 4 2.4 3.2Biomass and waste 1 109 1 194 1 239 1 157 1 398 1 537 10 17 0.9 1.7Other renewables 117 190 236 164 434 632 2 7 6.8 10.9Power generation 3 662 4 717 5 348 3 253 3 526 3 795 100 100 3.1 1.8Coal 2 062 2 645 3 007 1 604 1 083 900 56 24 3.3 !1.4Oil 164 132 128 141 88 80 2 2 !1.6 !3.3Gas 748 977 1 124 696 745 751 21 20 2.7 1.1Nuclear 288 388 413 325 624 764 8 20 4.9 7.4Hydro 240 288 309 262 348 376 6 10 2.4 3.2Biomass and waste 63 126 165 87 250 356 3 9 8.6 11.9Other renewables 97 161 202 139 389 568 4 15 7.2 11.5Other energy sector 1 063 1 219 1 294 994 1 007 1 007 100 100 1.8 0.8Electricity 243 314 353 221 250 265 27 26 3.1 1.9TFC 6 057 7 158 7 727 5 710 6 202 6 372 100 100 2.2 1.4Coal 894 902 898 823 726 682 12 11 0.9 !0.1Oil 1 913 2 340 2 533 1 772 1 913 1 891 33 30 2.4 1.2Gas 856 1 067 1 186 803 943 1 016 15 16 2.9 2.3Electricity 1 170 1 587 1 834 1 077 1 307 1 428 24 22 4.0 3.0Heat 232 243 247 212 198 191 3 3 0.9 !0.0Biomass and waste 974 992 996 998 1 069 1 100 13 17 0.4 0.8Other renewables 20 28 34 25 45 64 0 1 5.2 7.8Industry 2 237 2 584 2 768 2 096 2 214 2 253 100 100 2.4 1.6Coal 731 755 763 674 603 574 28 25 1.3 0.2Oil 253 266 271 240 238 230 10 10 1.0 0.4Gas 373 469 519 351 418 444 19 20 3.6 3.0Electricity 622 816 927 575 677 718 33 32 3.9 2.9Heat 108 111 111 100 92 88 4 4 1.0 0.1Biomass and waste 150 167 177 155 184 198 6 9 1.6 2.0Other renewables 0 0 0 0 1 2 0 0 3.3 13.4Transport 1 189 1 595 1 794 1 106 1 319 1 363 100 100 3.2 2.2Oil 1 068 1 432 1 600 966 1 085 1 064 89 78 3.2 1.6Electricity 22 31 36 25 43 65 2 5 3.8 6.2Biofuels 31 49 61 48 103 131 3 10 5.2 8.4Other fuels 67 84 96 67 87 103 5 8 2.3 2.6Buildings 1 974 2 239 2 385 1 867 1 964 2 022 100 100 1.5 0.9Coal 108 93 82 96 72 59 3 3 !0.9 !2.1Oil 192 199 200 175 163 156 8 8 0.8 !0.1Gas 274 353 399 248 286 309 17 15 2.9 1.9Electricity 475 672 793 428 526 578 33 29 4.1 2.8Heat 120 129 132 109 103 100 6 5 0.9 !0.2Biomass and waste 786 767 749 788 772 759 31 38 !0.1 !0.0Other renewables 20 27 32 24 42 60 1 3 5.1 7.7Other 656 740 780 641 704 734 100 100 1.6 1.4
Current Policies Scenario 450 Scenario
Energy demand (Mtoe) Shares (%) CAAGR (%)2035 2009!2035
Non-OECD: Current Policies and 450 Scenarios
© O
EC
D/IE
A, 2
011

578 World Energy Outlook 2011 - ANNEXES
CAAGR (%)
1990 2009 2015 2020 2025 2030 2035 2009 2035 2009!2035Total generation 4 190 9 649 13 219 15 884 18 136 20 457 22 946 100 100 3.4Coal 1 332 4 498 6 320 7 187 7 749 8 406 9 153 47 40 2.8Oil 640 703 610 564 503 442 433 7 2 !1.8Gas 957 1 938 2 618 3 194 3 710 4 237 4 741 20 21 3.5Nuclear 283 454 710 1 130 1 433 1 674 1 879 5 8 5.6Hydro 962 1 931 2 463 2 904 3 339 3 670 3 926 20 17 2.8Biomass and waste 7 49 110 238 390 583 822 1 4 11.4Wind 0 50 311 513 730 965 1 237 1 5 13.1Geothermal 8 25 40 58 83 112 146 0 1 7.1Solar PV 0 1 32 78 157 281 415 0 2 28.4CSP ! ! 5 19 40 87 191 ! 1 n.a.Marine ! ! ! ! 0 1 2 ! 0 n.a.
CAAGR (%)
2009 2015 2020 2025 2030 2035 2009 2035 2009!2035Total capacity 2 342 3 195 3 791 4 303 4 848 5 443 100 100 3.3Coal 943 1 274 1 445 1 546 1 668 1 805 40 33 2.5Oil 213 230 221 201 180 173 9 3 !0.8Gas 511 708 812 901 1 002 1 118 22 21 3.1Nuclear 66 99 154 194 226 252 3 5 5.3Hydro 553 680 808 936 1 031 1 102 24 20 2.7Biomass and waste 12 23 45 70 101 138 1 3 9.7Wind 39 151 238 328 422 527 2 10 10.5Geothermal 4 6 9 13 17 22 0 0 6.8Solar PV 1 23 53 103 177 257 0 5 26.9CSP ! 1 5 11 23 49 ! 1 n.a.Marine ! ! ! 0 0 1 ! 0 n.a.
CAAGR (%)
1990 2009 2015 2020 2025 2030 2035 2009 2035 2009!2035Total CO2 9 205 15 876 19 652 21 224 22 264 23 338 24 438 100 100 1.7Coal 4 160 8 483 10 737 11 443 11 658 11 860 12 125 53 50 1.4Oil 3 170 4 515 5 391 5 738 6 134 6 548 6 939 28 28 1.7Gas 1 876 2 878 3 524 4 043 4 472 4 930 5 374 18 22 2.4Power generation 3 521 7 097 8 773 9 556 10 035 10 518 11 097 100 100 1.7Coal 1 863 5 155 6 697 7 308 7 645 7 973 8 364 73 75 1.9Oil 712 608 531 487 425 368 355 9 3 !2.0Gas 946 1 334 1 545 1 761 1 965 2 177 2 377 19 21 2.2TFC 5 273 7 970 9 914 10 622 11 159 11 694 12 172 100 100 1.6Coal 2 222 3 126 3 802 3 872 3 767 3 638 3 508 39 29 0.4Oil 2 265 3 623 4 538 4 916 5 356 5 808 6 190 45 51 2.1Transport 1 101 2 083 2 774 3 094 3 500 3 936 4 318 26 35 2.8Gas 786 1 221 1 574 1 835 2 036 2 248 2 474 15 20 2.8
CO2 emissions (Mt) Shares (%)
Electricity generation (TWh) Shares (%)
Electrical capacity (GW) Shares (%)
Non-OECD: New Policies Scenario
© O
EC
D/IE
A, 2
011

Annex A - Tables for scenario projections 579
A
2020 2030 2035 2020 2030 2035CPS 450 CPS 450
Total generation 16 426 22 097 25 429 15 092 18 107 19 683 100 100 3.8 2.8Coal 8 035 10 864 12 670 6 215 4 503 3 636 50 18 4.1 !0.8Oil 593 491 483 517 322 294 2 1 !1.4 !3.3Gas 3 136 4 493 5 310 2 970 3 480 3 551 21 18 4.0 2.4Nuclear 1 105 1 488 1 582 1 246 2 393 2 932 6 15 4.9 7.4Hydro 2 793 3 350 3 597 3 042 4 044 4 369 14 22 2.4 3.2Biomass and waste 208 422 550 289 851 1 224 2 6 9.7 13.1Wind 435 718 865 594 1 591 2 155 3 11 11.6 15.6Geothermal 50 81 100 71 172 234 0 1 5.6 9.0Solar PV 60 148 192 103 506 798 1 4 24.7 31.7CSP 11 41 77 45 243 484 0 2 n.a. n.a.Marine ! 1 2 0 2 6 0 0 n.a. n.a.
2020 2030 2035 2020 2030 2035CPS 450 CPS 450
Total capacity 3 829 4 963 5 614 3 739 4 916 5 571 100 100 3.4 3.4Coal 1 560 2 054 2 354 1 289 1 075 986 42 18 3.6 0.2Oil 223 186 181 217 163 149 3 3 !0.6 !1.4Gas 824 1 075 1 234 793 974 1 039 22 19 3.5 2.8Nuclear 151 200 212 170 322 396 4 7 4.6 7.1Hydro 773 929 997 850 1 148 1 242 18 22 2.3 3.2Biomass and waste 40 74 94 54 145 203 2 4 8.1 11.3Wind 205 322 380 270 668 878 7 16 9.1 12.7Geothermal 8 12 15 11 26 34 0 1 5.3 8.6Solar PV 42 99 125 70 328 510 2 9 23.4 30.3CSP 3 11 20 13 67 131 0 2 n.a. n.a.Marine ! 0 1 0 0 2 0 0 n.a. n.a.
2020 2030 2035 2020 2030 2035CPS 450 CPS 450
Total CO2 22 442 26 951 29 543 19 476 16 222 14 416 100 100 2.4 !0.4Coal 12 428 14 704 16 097 10 237 6 541 4 804 54 33 2.5 !2.2Oil 5 913 7 053 7 609 5 417 5 580 5 450 26 38 2.0 0.7Gas 4 101 5 195 5 838 3 822 4 101 4 162 20 29 2.8 1.4Power generation 10 447 13 148 14 890 8 392 5 379 3 905 100 100 2.9 !2.3Coal 8 177 10 444 11 857 6 319 3 454 2 060 80 53 3.3 !3.5Oil 517 417 403 446 277 252 3 6 !1.6 !3.3Gas 1 753 2 288 2 630 1 627 1 647 1 593 18 41 2.6 0.7TFC 10 920 12 593 13 371 10 093 9 880 9 572 100 100 2.0 0.7Coal 3 972 3 973 3 938 3 673 2 892 2 564 29 27 0.9 !0.8Oil 5 054 6 247 6 789 4 646 4 964 4 856 51 51 2.4 1.1Transport 3 177 4 259 4 761 2 872 3 229 3 169 36 33 3.2 1.6Gas 1 894 2 373 2 644 1 774 2 024 2 152 20 22 3.0 2.2
Current Policies Scenario 450 Scenario
Current Policies Scenario 450 Scenario
CO2 emissions (Mt) Shares (%) CAAGR (%)2035 2009!2035
Current Policies Scenario 450 Scenario
Electrical capacity (GW) Shares (%) CAAGR (%)2035 2009!2035
Electricity generation (TWh) Shares (%) CAAGR (%)2035 2009!2035
Non-OECD: Current Policies and 450 Scenarios
© O
EC
D/IE
A, 2
011

580 World Energy Outlook 2011 - ANNEXES
CAAGR (%)
1990 2009 2015 2020 2025 2030 2035 2009 2035 2009!2035TPED 1 543 1 051 1 163 1 211 1 263 1 314 1 371 100 100 1.0Coal 367 193 217 213 212 211 209 18 15 0.3Oil 474 223 241 247 251 253 258 21 19 0.6Gas 602 516 574 595 627 655 683 49 50 1.1Nuclear 59 75 81 99 105 112 118 7 9 1.8Hydro 23 25 26 27 29 30 32 2 2 0.9Biomass and waste 17 18 21 24 28 34 45 2 3 3.7Other renewables 0 1 3 7 11 17 25 0 2 15.2Power generation 743 519 562 582 603 623 646 100 100 0.8Coal 197 128 142 135 133 130 126 25 19 !0.1Oil 127 21 17 15 12 10 9 4 1 !2.9Gas 333 264 287 292 304 310 315 51 49 0.7Nuclear 59 75 81 99 105 112 118 15 18 1.8Hydro 23 25 26 27 29 30 32 5 5 0.9Biomass and waste 4 5 6 7 9 14 22 1 3 5.5Other renewables 0 0 3 6 11 17 24 0 4 16.5Other energy sector 200 165 189 192 196 199 204 100 100 0.8Electricity 35 37 41 42 43 45 46 22 23 0.8TFC 1 073 675 747 787 826 865 905 100 100 1.1Coal 114 39 40 42 42 43 43 6 5 0.4Oil 281 169 187 196 205 214 223 25 25 1.1Gas 261 216 246 259 274 291 310 32 34 1.4Electricity 127 99 117 126 135 144 151 15 17 1.6Heat 277 138 143 147 150 152 154 21 17 0.4Biomass and waste 13 12 14 17 19 21 23 2 3 2.4Other renewables ! 0 0 0 0 1 1 0 0 7.1Industry 394 195 220 233 243 252 262 100 100 1.2Coal 56 28 29 31 31 32 32 14 12 0.5Oil 51 21 22 23 23 24 26 11 10 0.8Gas 85 49 61 65 69 72 76 25 29 1.7Electricity 75 44 56 61 64 67 69 23 26 1.7Heat 125 50 50 52 53 54 55 26 21 0.4Biomass and waste 0 1 2 2 3 3 4 1 1 4.2Other renewables ! 0 0 0 0 0 0 0 0 0.0Transport 171 134 160 169 179 189 200 100 100 1.6Oil 122 92 105 111 119 125 131 68 66 1.4Electricity 12 9 11 12 13 14 16 7 8 2.2Biofuels 0 1 1 2 2 3 3 1 2 5.9Other fuels 37 33 43 44 45 48 50 24 25 1.7Buildings 387 259 278 290 305 317 329 100 100 0.9Coal 56 9 9 9 9 9 8 3 3 !0.1Oil 39 15 17 17 16 15 15 6 4 !0.0Gas 111 98 106 113 121 129 137 38 42 1.3Electricity 26 42 45 48 51 55 57 16 17 1.2Heat 142 85 90 92 94 95 95 33 29 0.4Biomass and waste 12 10 11 12 13 14 15 4 5 1.7Other renewables ! 0 0 0 0 1 1 0 0 7.0Other 121 87 90 94 100 106 114 100 100 1.0
Energy demand (Mtoe) Shares (%)
E. Europe/Eurasia: New Policies Scenario
© O
EC
D/IE
A, 2
011

Annex A - Tables for scenario projections 581
A
2020 2030 2035 2020 2030 2035CPS 450 CPS 450
TPED 1 240 1 388 1 478 1 156 1 185 1 209 100 100 1.3 0.5Coal 223 239 255 195 160 142 17 12 1.1 !1.2Oil 252 262 270 238 230 223 18 18 0.7 0.0Gas 611 704 760 551 531 516 51 43 1.5 0.0Nuclear 98 111 114 109 139 159 8 13 1.6 2.9Hydro 27 30 32 30 39 41 2 3 0.9 1.9Biomass and waste 22 29 34 26 57 81 2 7 2.5 6.1Other renewables 6 11 14 8 27 46 1 4 12.5 17.9Power generation 599 672 720 554 560 575 100 100 1.3 0.4Coal 144 155 166 120 87 67 23 12 1.0 !2.4Oil 17 12 11 14 9 8 2 1 !2.3 !3.4Gas 300 342 370 265 228 203 51 35 1.3 !1.0Nuclear 98 111 114 109 139 159 16 28 1.6 2.9Hydro 27 30 32 30 39 41 4 7 0.9 1.9Biomass and waste 7 11 14 8 32 51 2 9 3.8 9.1Other renewables 6 11 13 7 27 45 2 8 13.8 19.4Other energy sector 195 210 219 185 178 175 100 100 1.1 0.2Electricity 44 49 53 40 40 40 24 23 1.4 0.3TFC 805 908 968 751 783 797 100 100 1.4 0.6Coal 43 46 47 40 39 39 5 5 0.8 0.0Oil 199 221 234 188 192 190 24 24 1.3 0.4Gas 267 304 326 244 259 268 34 34 1.6 0.8Electricity 132 161 176 122 133 138 18 17 2.2 1.3Heat 149 159 164 139 134 132 17 17 0.7 !0.2Biomass and waste 15 18 19 18 25 30 2 4 1.7 3.4Other renewables 0 0 1 0 1 1 0 0 4.9 7.9Industry 239 269 287 222 231 234 100 100 1.5 0.7Coal 31 33 33 30 29 29 12 12 0.7 0.1Oil 23 25 27 22 23 24 9 10 0.9 0.4Gas 70 79 84 61 66 67 29 29 2.1 1.2Electricity 63 76 83 58 60 60 29 26 2.4 1.2Heat 51 54 56 49 50 50 20 21 0.4 !0.0Biomass and waste 2 3 3 3 4 5 1 2 3.2 5.1Other renewables 0 0 0 0 0 0 0 0 0.0 0.0Transport 169 192 205 162 168 169 100 100 1.6 0.9Oil 113 129 139 106 107 103 68 61 1.6 0.4Electricity 12 14 15 13 16 19 7 11 2.1 3.0Biofuels 1 1 1 2 4 5 1 3 3.0 8.2Other fuels 44 47 49 41 41 41 24 24 1.6 0.9Buildings 300 338 359 275 280 283 100 100 1.3 0.3Coal 10 10 11 8 8 7 3 3 0.8 !0.6Oil 17 17 16 16 14 13 5 4 0.4 !0.6Gas 116 134 145 106 111 114 41 40 1.5 0.6Electricity 51 62 68 46 49 50 19 18 1.9 0.7Heat 95 101 104 86 81 79 29 28 0.8 !0.3Biomass and waste 11 13 14 13 16 19 4 7 1.3 2.4Other renewables 0 0 1 0 1 1 0 0 5.0 7.8Other 96 110 118 92 104 111 100 100 1.2 1.0
Current Policies Scenario 450 Scenario
Energy demand (Mtoe) Shares (%) CAAGR (%)2035 2009!2035
E. Europe/Eurasia: Current Policies and 450 Scenarios
© O
EC
D/IE
A, 2
011

582 World Energy Outlook 2011 - ANNEXES
CAAGR (%)
1990 2009 2015 2020 2025 2030 2035 2009 2035 2009!2035Total generation 1 894 1 608 1 857 1 982 2 102 2 214 2 323 100 100 1.4Coal 429 375 440 420 409 398 383 23 16 0.1Oil 271 39 26 21 14 10 9 2 0 !5.7Gas 702 611 759 810 885 929 952 38 41 1.7Nuclear 226 287 309 377 402 430 453 18 19 1.8Hydro 266 292 304 317 332 350 371 18 16 0.9Biomass and waste 0 3 7 12 20 36 65 0 3 12.6Wind ! 1 10 18 27 43 64 0 3 20.0Geothermal 0 0 3 5 10 15 21 0 1 15.8Solar PV ! 0 1 2 3 4 6 0 0 29.6CSP ! ! ! ! ! ! ! ! ! n.a.Marine ! ! ! ! 0 0 0 ! 0 n.a.
CAAGR (%)
2009 2015 2020 2025 2030 2035 2009 2035 2009!2035Total capacity 410 438 450 462 476 497 100 100 0.7Coal 103 105 98 94 87 81 25 16 !0.9Oil 25 23 18 12 8 7 6 1 !4.7Gas 147 164 170 179 186 189 36 38 1.0Nuclear 42 45 54 57 60 62 10 12 1.5Hydro 90 94 98 102 107 112 22 23 0.9Biomass and waste 1 2 2 4 6 11 0 2 9.3Wind 0 4 7 11 17 25 0 5 16.8Geothermal 0 0 1 2 2 3 0 1 14.6Solar PV 0 1 2 3 4 5 0 1 23.9CSP ! ! ! ! ! ! ! ! n.a.Marine ! ! ! 0 0 0 ! 0 n.a.
CAAGR (%)
1990 2009 2015 2020 2025 2030 2035 2009 2035 2009!2035Total CO2 3 997 2 476 2 705 2 749 2 827 2 883 2 945 100 100 0.7Coal 1 336 769 821 802 796 783 769 31 26 0.0Oil 1 257 550 593 610 624 638 656 22 22 0.7Gas 1 404 1 158 1 291 1 337 1 407 1 462 1 519 47 52 1.1Power generation 1 982 1 222 1 322 1 299 1 309 1 299 1 290 100 100 0.2Coal 799 535 592 563 554 539 521 44 40 !0.1Oil 405 66 57 50 40 34 31 5 2 !2.9Gas 778 620 673 686 715 727 738 51 57 0.7TFC 1 901 1 124 1 241 1 302 1 362 1 421 1 485 100 100 1.1Coal 526 217 214 223 226 228 231 19 16 0.3Oil 784 427 477 500 523 541 561 38 38 1.1Transport 361 270 308 328 350 368 386 24 26 1.4Gas 591 480 549 579 614 651 692 43 47 1.4
CO2 emissions (Mt) Shares (%)
Electricity generation (TWh) Shares (%)
Electrical capacity (GW) Shares (%)
E. Europe/Eurasia: New Policies Scenario
© O
EC
D/IE
A, 2
011

Annex A - Tables for scenario projections 583
A
2020 2030 2035 2020 2030 2035CPS 450 CPS 450
Total generation 2 069 2 465 2 695 1 913 2 038 2 095 100 100 2.0 1.0Coal 462 509 558 368 254 165 21 8 1.5 !3.1Oil 22 11 9 20 8 6 0 0 !5.3 !6.9Gas 860 1 095 1 223 716 577 456 45 22 2.7 !1.1Nuclear 376 426 435 416 532 608 16 29 1.6 2.9Hydro 316 352 373 348 452 475 14 23 0.9 1.9Biomass and waste 12 29 39 17 98 166 1 8 10.4 16.7Wind 15 30 43 20 88 171 2 8 18.1 24.6Geothermal 5 9 10 6 21 34 0 2 12.7 18.0Solar PV 2 3 4 3 7 11 0 1 27.4 32.8CSP ! ! ! ! ! ! ! ! n.a. n.a.Marine ! 0 0 0 0 1 0 0 n.a. n.a.
2020 2030 2035 2020 2030 2035CPS 450 CPS 450
Total capacity 467 514 543 448 503 560 100 100 1.1 1.2Coal 103 101 103 90 60 55 19 10 !0.0 !2.4Oil 18 8 7 18 8 7 1 1 !4.9 !4.8Gas 185 218 232 159 164 161 43 29 1.8 0.4Nuclear 53 59 59 59 74 84 11 15 1.3 2.6Hydro 97 107 112 106 135 141 21 25 0.9 1.8Biomass and waste 2 5 7 3 17 27 1 5 7.3 13.2Wind 7 13 17 8 35 69 3 12 15.1 21.4Geothermal 1 2 2 1 3 5 0 1 12.0 16.6Solar PV 1 3 3 3 6 10 1 2 21.7 27.2CSP ! ! ! ! ! ! ! ! n.a. n.a.Marine ! 0 0 0 0 0 0 0 n.a. n.a.
2020 2030 2035 2020 2030 2035CPS 450 CPS 450
Total CO2 2 841 3 134 3 337 2 549 2 184 1 995 100 100 1.2 !0.8Coal 843 895 946 730 504 397 28 20 0.8 !2.5Oil 624 669 698 584 562 541 21 27 0.9 !0.1Gas 1 374 1 570 1 692 1 235 1 119 1 056 51 53 1.5 !0.4Power generation 1 360 1 479 1 585 1 167 831 665 100 100 1.0 !2.3Coal 601 639 682 499 311 219 43 33 0.9 !3.4Oil 56 40 36 47 30 28 2 4 !2.3 !3.3Gas 703 801 867 621 489 418 55 63 1.3 !1.5TFC 1 332 1 484 1 571 1 239 1 209 1 186 100 100 1.3 0.2Coal 227 240 247 216 178 163 16 14 0.5 !1.1Oil 508 564 595 478 474 457 38 39 1.3 0.3Transport 332 381 408 312 316 304 26 26 1.6 0.4Gas 597 680 730 545 557 565 46 48 1.6 0.6
Current Policies Scenario 450 Scenario
Current Policies Scenario 450 Scenario
CO2 emissions (Mt) Shares (%) CAAGR (%)2035 2009!2035
Current Policies Scenario 450 Scenario
Electrical capacity (GW) Shares (%) CAAGR (%)2035 2009!2035
Electricity generation (TWh) Shares (%) CAAGR (%)2035 2009!2035
E. Europe/Eurasia: Current Policies and 450 Scenarios
© O
EC
D/IE
A, 2
011

584 World Energy Outlook 2011 - ANNEXES
CAAGR (%)
1990 2009 2015 2020 2025 2030 2035 2009 2035 2009!2035TPED 880 648 719 744 771 799 833 100 100 1.0Coal 191 95 115 116 119 119 117 15 14 0.8Oil 264 138 148 150 151 150 153 21 18 0.4Gas 367 350 384 393 407 422 435 54 52 0.8Nuclear 31 43 49 57 61 67 71 7 9 2.0Hydro 14 15 15 15 16 18 19 2 2 0.9Biomass and waste 12 6 6 7 9 12 19 1 2 4.2Other renewables 0 0 2 4 8 12 18 0 2 15.7Power generation 444 344 376 390 404 418 435 100 100 0.9Coal 105 64 78 79 82 82 81 19 19 0.9Oil 62 13 12 11 9 7 7 4 2 !2.4Gas 228 204 217 219 222 223 224 59 52 0.4Nuclear 31 43 49 57 61 67 71 13 16 2.0Hydro 14 15 15 15 16 18 19 4 4 0.9Biomass and waste 4 4 4 4 6 9 15 1 4 5.4Other renewables 0 0 2 4 8 12 18 0 4 15.7Other energy sector 127 101 120 121 123 125 128 100 100 0.9Electricity 21 25 28 28 30 31 32 25 25 1.0TFC 625 423 460 478 498 517 538 100 100 0.9Coal 55 18 18 18 18 17 17 4 3 !0.4Oil 145 106 112 116 120 123 128 25 24 0.7Gas 143 129 146 153 161 170 181 30 34 1.3Electricity 71 59 70 75 80 85 90 14 17 1.6Heat 203 109 112 114 116 118 118 26 22 0.3Biomass and waste 8 2 2 3 3 3 3 1 1 1.4Other renewables ! ! 0 0 0 0 0 ! 0 n.a.Industry 209 124 134 140 145 151 158 100 100 0.9Coal 15 14 13 13 13 13 13 11 8 !0.2Oil 25 16 14 14 15 15 16 12 10 0.1Gas 30 29 35 36 38 41 43 24 27 1.5Electricity 41 27 34 37 39 41 43 22 27 1.9Heat 98 39 38 38 39 41 42 31 27 0.3Biomass and waste ! 0 1 1 1 1 1 0 1 4.0Other renewables ! ! ! ! ! ! ! ! ! n.a.Transport 116 90 107 111 116 120 127 100 100 1.3Oil 73 55 61 64 67 69 72 61 57 1.0Electricity 9 7 9 9 10 11 13 8 10 2.4Biofuels ! ! ! ! ! ! ! ! ! n.a.Other fuels 34 28 37 38 39 40 42 31 33 1.7Buildings 228 147 160 166 172 175 178 100 100 0.7Coal 40 4 5 4 4 4 3 3 2 !1.3Oil 12 6 8 7 7 6 5 4 3 !0.7Gas 57 44 49 53 57 60 64 30 36 1.4Electricity 15 24 25 27 29 30 31 16 17 1.0Heat 98 67 71 73 74 74 73 45 41 0.3Biomass and waste 7 2 2 2 2 2 2 1 1 0.3Other renewables ! ! 0 0 0 0 0 ! 0 n.a.Other 72 61 60 62 65 70 75 100 100 0.8
Energy demand (Mtoe) Shares (%)
Russia: New Policies Scenario
© O
EC
D/IE
A, 2
011

Annex A - Tables for scenario projections 585
A
2020 2030 2035 2020 2030 2035CPS 450 CPS 450
TPED 759 849 908 706 708 722 100 100 1.3 0.4Coal 121 134 142 105 77 67 16 9 1.5 !1.3Oil 151 153 158 145 138 136 17 19 0.5 !0.1Gas 403 460 497 361 334 318 55 44 1.4 !0.4Nuclear 57 66 70 65 84 96 8 13 1.9 3.1Hydro 16 18 19 17 23 24 2 3 1.0 1.8Biomass and waste 7 11 13 9 31 48 1 7 2.8 8.1Other renewables 4 7 9 5 20 33 1 5 12.6 18.5Power generation 399 451 486 368 370 381 100 100 1.3 0.4Coal 83 95 103 68 46 38 21 10 1.8 !2.0Oil 11 7 7 11 7 7 1 2 !2.4 !2.5Gas 224 249 268 198 164 144 55 38 1.1 !1.3Nuclear 57 66 70 65 84 96 14 25 1.9 3.1Hydro 16 18 19 17 23 24 4 6 1.0 1.8Biomass and waste 5 8 10 5 25 40 2 11 3.5 9.3Other renewables 4 7 9 5 20 33 2 9 12.6 18.5Other energy sector 123 132 138 116 109 106 100 100 1.2 0.2Electricity 29 34 37 27 27 27 27 26 1.6 0.4TFC 489 547 583 454 460 464 100 100 1.2 0.4Coal 18 19 19 17 14 13 3 3 0.1 !1.2Oil 117 126 133 111 112 111 23 24 0.9 0.2Gas 157 180 193 143 148 153 33 33 1.6 0.7Electricity 78 96 107 72 78 80 18 17 2.3 1.2Heat 115 123 127 107 102 99 22 21 0.6 !0.4Biomass and waste 3 3 4 3 6 7 1 2 1.6 4.6Other renewables 0 0 0 0 0 0 0 0 n.a. n.a.Industry 144 164 176 134 138 140 100 100 1.4 0.4Coal 13 13 13 13 11 10 8 7 !0.1 !1.0Oil 14 16 17 14 14 15 10 10 0.4 !0.2Gas 40 47 50 35 37 39 28 28 2.1 1.1Electricity 38 47 52 35 37 37 29 27 2.6 1.3Heat 38 41 43 37 37 37 24 27 0.4 !0.2Biomass and waste 1 1 1 1 1 2 1 1 3.8 6.1Other renewables ! ! ! ! ! ! ! ! n.a. n.a.Transport 111 121 128 106 107 108 100 100 1.4 0.7Oil 64 70 75 61 60 58 58 53 1.2 0.2Electricity 9 11 12 10 13 15 10 14 2.3 3.1Biofuels ! ! ! ! 1 2 ! 1 n.a. n.a.Other fuels 38 40 41 35 33 33 32 31 1.5 0.7Buildings 171 191 201 154 147 143 100 100 1.2 !0.1Coal 5 5 5 4 3 3 2 2 0.4 !2.1Oil 8 7 6 7 5 4 3 3 0.0 !1.5Gas 54 63 69 48 49 49 34 34 1.7 0.4Electricity 29 35 38 25 25 25 19 17 1.8 0.1Heat 75 79 81 67 62 59 40 41 0.7 !0.5Biomass and waste 2 2 2 2 3 4 1 3 1.1 3.2Other renewables 0 0 0 0 0 0 0 0 n.a. n.a.Other 63 71 77 60 68 74 100 100 0.9 0.7
Current Policies Scenario 450 Scenario
Energy demand (Mtoe) Shares (%) CAAGR (%)2035 2009!2035
Russia: Current Policies and 450 Scenarios
© O
EC
D/IE
A, 2
011

586 World Energy Outlook 2011 - ANNEXES
CAAGR (%)
1990 2009 2015 2020 2025 2030 2035 2009 2035 2009!2035Total generation 1 082 990 1 148 1 219 1 295 1 368 1 443 100 100 1.5Coal 157 164 218 221 230 226 225 17 16 1.2Oil 129 16 13 11 7 3 2 2 0 !8.4Gas 512 469 551 572 601 624 631 47 44 1.1Nuclear 118 164 186 217 234 255 273 17 19 2.0Hydro 166 174 169 179 191 205 218 18 15 0.9Biomass and waste 0 3 4 7 12 23 46 0 3 11.6Wind ! 0 4 8 12 20 30 0 2 41.0Geothermal 0 0 2 4 8 12 17 0 1 14.9Solar PV ! ! 0 0 1 1 1 ! 0 n.a.CSP ! ! ! ! ! ! ! ! ! n.a.Marine ! ! ! ! ! ! ! ! ! n.a.
CAAGR (%)
2009 2015 2020 2025 2030 2035 2009 2035 2009!2035Total capacity 225 243 249 257 265 277 100 100 0.8Coal 47 50 48 47 43 41 21 15 !0.5Oil 6 6 5 3 2 1 3 0 !7.3Gas 101 107 108 110 113 113 45 41 0.5Nuclear 23 27 31 33 35 37 10 13 1.8Hydro 48 49 51 54 58 61 21 22 1.0Biomass and waste 1 1 2 2 4 8 0 3 8.4Wind 0 1 3 4 7 11 0 4 28.4Geothermal 0 0 1 1 2 3 0 1 13.7Solar PV ! 0 1 1 1 2 ! 1 n.a.CSP ! ! ! ! ! ! ! ! n.a.Marine ! ! ! ! ! ! ! ! n.a.
CAAGR (%)
1990 2009 2015 2020 2025 2030 2035 2009 2035 2009!2035Total CO2 2 179 1 517 1 655 1 687 1 730 1 756 1 787 100 100 0.6Coal 687 405 444 451 464 461 457 27 26 0.5Oil 625 327 348 352 353 354 362 22 20 0.4Gas 866 785 863 884 914 941 968 52 54 0.8Power generation 1 162 799 879 885 900 896 894 100 100 0.4Coal 432 278 331 336 350 349 346 35 39 0.8Oil 198 41 39 36 30 24 22 5 2 !2.3Gas 532 480 509 513 520 524 525 60 59 0.3TFC 960 652 701 726 750 774 804 100 100 0.8Coal 253 121 108 109 108 107 105 19 13 !0.5Oil 389 251 272 278 285 291 300 39 37 0.7Transport 217 162 180 187 196 203 212 25 26 1.0Gas 318 280 322 338 357 377 399 43 50 1.4
CO2 emissions (Mt) Shares (%)
Electricity generation (TWh) Shares (%)
Electrical capacity (GW) Shares (%)
Russia: New Policies Scenario
© O
EC
D/IE
A, 2
011

Annex A - Tables for scenario projections 587
A
2020 2030 2035 2020 2030 2035CPS 450 CPS 450
Total generation 1 269 1 532 1 692 1 171 1 237 1 272 100 100 2.1 1.0Coal 240 282 315 187 111 83 19 6 2.5 !2.6Oil 9 2 1 10 2 1 0 0 !9.1 !8.8Gas 604 748 834 507 383 283 49 22 2.2 !1.9Nuclear 217 254 266 246 323 366 16 29 1.9 3.1Hydro 181 210 226 196 270 279 13 22 1.0 1.8Biomass and waste 7 18 25 10 77 132 1 10 9.1 16.2Wind 6 10 15 9 52 96 1 8 37.2 47.4Geothermal 4 8 9 5 17 28 1 2 11.9 17.1Solar PV 0 0 1 1 2 3 0 0 n.a. n.a.CSP ! ! ! ! ! ! ! ! n.a. n.a.Marine ! ! ! ! 0 0 ! 0 n.a. n.a.
2020 2030 2035 2020 2030 2035CPS 450 CPS 450
Total capacity 261 290 308 246 279 306 100 100 1.2 1.2Coal 51 51 55 42 23 20 18 7 0.6 !3.2Oil 5 2 1 5 2 1 0 0 !7.6 !7.4Gas 117 134 140 101 96 91 46 30 1.3 !0.4Nuclear 31 35 36 35 45 50 12 16 1.7 3.0Hydro 52 59 63 56 75 78 21 25 1.1 1.9Biomass and waste 2 3 4 2 13 22 1 7 6.1 12.7Wind 2 4 6 3 20 37 2 12 25.2 34.4Geothermal 1 1 1 1 3 4 0 1 11.1 15.8Solar PV 0 1 1 1 2 4 0 1 n.a. n.a.CSP ! ! ! ! ! ! ! ! n.a. n.a.Marine ! ! ! ! 0 0 ! 0 n.a. n.a.
2020 2030 2035 2020 2030 2035CPS 450 CPS 450
Total CO2 1 732 1 915 2 046 1 551 1 232 1 102 100 100 1.2 !1.2Coal 470 525 561 401 230 172 27 16 1.3 !3.2Oil 355 364 379 338 314 302 19 27 0.6 !0.3Gas 907 1 026 1 106 811 688 627 54 57 1.3 !0.9Power generation 914 1 015 1 093 788 520 412 100 100 1.2 !2.5Coal 354 407 441 290 154 109 40 26 1.8 !3.5Oil 36 24 23 35 23 22 2 5 !2.3 !2.5Gas 525 584 629 464 343 282 58 68 1.0 !2.0TFC 740 811 857 689 638 617 100 100 1.1 !0.2Coal 111 113 114 106 72 59 13 10 !0.2 !2.7Oil 281 300 315 267 255 245 37 40 0.9 !0.1Transport 188 207 220 179 175 170 26 27 1.2 0.2Gas 349 398 428 316 312 313 50 51 1.6 0.4
Current Policies Scenario 450 Scenario
Current Policies Scenario 450 Scenario
CO2 emissions (Mt) Shares (%) CAAGR (%)2035 2009!2035
Current Policies Scenario 450 Scenario
Electrical capacity (GW) Shares (%) CAAGR (%)2035 2009!2035
Electricity generation (TWh) Shares (%) CAAGR (%)2035 2009!2035
Russia: Current Policies and 450 Scenarios
© O
EC
D/IE
A, 2
011

588 World Energy Outlook 2011 - ANNEXES
CAAGR (%)
1990 2009 2015 2020 2025 2030 2035 2009 2035 2009!2035TPED 1 591 3 724 4 761 5 341 5 775 6 226 6 711 100 100 2.3Coal 697 1 942 2 484 2 669 2 744 2 826 2 929 52 44 1.6Oil 311 794 991 1 083 1 188 1 307 1 416 21 21 2.2Gas 71 293 437 565 657 761 877 8 13 4.3Nuclear 10 35 92 177 239 283 325 1 5 9.0Hydro 24 74 108 135 161 178 188 2 3 3.7Biomass and waste 471 549 575 603 634 670 712 15 11 1.0Other renewables 7 37 76 110 151 201 264 1 4 7.8Power generation 331 1 413 1 937 2 311 2 599 2 897 3 236 100 100 3.2Coal 229 1 101 1 462 1 621 1 714 1 816 1 939 78 60 2.2Oil 45 47 33 27 22 20 19 3 1 !3.5Gas 16 122 163 213 253 303 365 9 11 4.3Nuclear 10 35 92 177 239 283 325 2 10 9.0Hydro 24 74 108 135 161 178 188 5 6 3.7Biomass and waste 0 6 18 47 83 126 177 0 5 14.2Other renewables 7 29 62 92 128 171 224 2 7 8.2Other energy sector 162 412 500 537 559 584 610 100 100 1.5Electricity 24 83 115 138 159 180 201 20 33 3.5TFC 1 223 2 451 3 137 3 492 3 761 4 037 4 319 100 100 2.2Coal 393 636 778 793 773 747 721 26 17 0.5Oil 240 686 893 992 1 105 1 229 1 340 28 31 2.6Gas 32 129 218 294 345 397 452 5 10 4.9Electricity 85 404 613 771 898 1 030 1 174 17 27 4.2Heat 14 55 74 78 75 71 68 2 2 0.8Biomass and waste 460 532 546 545 541 533 524 22 12 !0.1Other renewables 0 8 14 19 24 30 40 0 1 6.2Industry 397 978 1 338 1 512 1 594 1 661 1 731 100 100 2.2Coal 236 502 640 657 645 630 617 51 36 0.8Oil 54 100 119 121 122 121 118 10 7 0.7Gas 9 55 102 155 181 202 222 6 13 5.6Electricity 51 237 369 461 527 587 649 24 37 4.0Heat 11 36 51 54 50 46 42 4 2 0.6Biomass and waste 36 48 58 64 70 76 82 5 5 2.0Other renewables ! 0 0 0 0 0 0 0 0 3.3Transport 114 331 480 566 676 806 933 100 100 4.1Oil 100 315 458 536 635 750 858 95 92 3.9Electricity 1 4 7 10 13 17 22 1 2 6.6Biofuels ! 2 7 11 16 22 31 1 3 10.7Other fuels 12 10 8 10 12 17 23 3 2 3.3Buildings 600 863 983 1 051 1 108 1 169 1 239 100 100 1.4Coal 111 87 92 86 79 69 57 10 5 !1.6Oil 33 91 101 101 102 101 99 11 8 0.3Gas 5 36 63 83 103 126 152 4 12 5.8Electricity 24 140 208 267 321 384 454 16 37 4.6Heat 3 19 23 24 25 26 26 2 2 1.1Biomass and waste 423 482 482 471 455 435 412 56 33 !0.6Other renewables 0 8 14 18 23 29 39 1 3 6.3Other 112 279 336 363 383 401 416 100 100 1.5
Energy demand (Mtoe) Shares (%)
Non-OECD Asia: New Policies Scenario
© O
EC
D/IE
A, 2
011

Annex A - Tables for scenario projections 589
A
2020 2030 2035 2020 2030 2035CPS 450 CPS 450
TPED 5 543 6 785 7 478 5 081 5 411 5 653 100 100 2.7 1.6Coal 2 901 3 498 3 855 2 392 1 815 1 621 52 29 2.7 !0.7Oil 1 111 1 375 1 510 1 040 1 158 1 180 20 21 2.5 1.5Gas 554 765 896 560 747 849 12 15 4.4 4.2Nuclear 171 245 266 197 430 532 4 9 8.1 11.1Hydro 127 153 164 143 198 214 2 4 3.1 4.2Biomass and waste 585 607 620 617 743 819 8 14 0.5 1.6Other renewables 94 141 168 132 319 439 2 8 6.0 9.9Power generation 2 456 3 289 3 782 2 143 2 333 2 531 100 100 3.9 2.3Coal 1 822 2 381 2 727 1 401 933 784 72 31 3.5 !1.3Oil 32 26 24 25 17 15 1 1 !2.6 !4.2Gas 187 278 346 207 296 350 9 14 4.1 4.2Nuclear 171 245 266 197 430 532 7 21 8.1 11.1Hydro 127 153 164 143 198 214 4 8 3.1 4.2Biomass and waste 40 87 115 59 178 250 3 10 12.3 15.7Other renewables 77 118 141 111 281 386 4 15 6.3 10.5Other energy sector 553 633 675 513 514 516 100 100 1.9 0.9Electricity 144 196 225 129 152 163 33 32 3.9 2.6TFC 3 571 4 268 4 641 3 366 3 686 3 822 100 100 2.5 1.7Coal 814 820 814 748 655 613 18 16 1.0 !0.1Oil 1 015 1 295 1 435 951 1 085 1 111 31 29 2.9 1.9Gas 309 426 491 297 393 442 11 12 5.3 4.8Electricity 798 1 111 1 298 728 898 986 28 26 4.6 3.5Heat 83 84 83 74 64 60 2 2 1.6 0.3Biomass and waste 534 509 495 547 554 558 11 15 !0.3 0.2Other renewables 17 23 27 21 37 53 1 1 4.6 7.3Industry 1 554 1 803 1 934 1 452 1 530 1 555 100 100 2.7 1.8Coal 674 695 702 619 552 524 36 34 1.3 0.2Oil 123 125 126 117 116 112 7 7 0.9 0.4Gas 165 223 252 164 216 234 13 15 6.1 5.8Electricity 475 636 728 437 524 560 38 36 4.4 3.4Heat 58 57 55 51 42 38 3 2 1.7 0.2Biomass and waste 59 66 70 64 77 85 4 5 1.4 2.2Other renewables 0 0 0 0 1 2 0 0 3.3 13.4Transport 580 852 1 001 543 720 792 100 100 4.3 3.4Oil 550 799 930 505 626 655 93 83 4.3 2.9Electricity 10 16 20 11 23 38 2 5 6.3 8.9Biofuels 10 19 26 15 45 62 3 8 10.0 13.8Other fuels 10 19 25 11 25 37 3 5 3.6 5.2Buildings 1 071 1 203 1 279 1 010 1 042 1 067 100 100 1.5 0.8Coal 90 74 63 80 57 44 5 4 !1.3 !2.6Oil 107 111 110 97 87 82 9 8 0.7 !0.4Gas 87 131 156 75 100 116 12 11 5.9 4.6Electricity 280 414 498 247 310 344 39 32 5.0 3.5Heat 25 27 27 22 22 21 2 2 1.3 0.3Biomass and waste 465 424 398 468 431 411 31 38 !0.7 !0.6Other renewables 16 22 26 21 35 49 2 5 4.6 7.2Other 367 409 428 362 394 408 100 100 1.7 1.5
Current Policies Scenario 450 Scenario
Energy demand (Mtoe) Shares (%) CAAGR (%)2035 2009!2035
Non-OECD Asia: Current Policies and 450 Scenarios
© O
EC
D/IE
A, 2
011
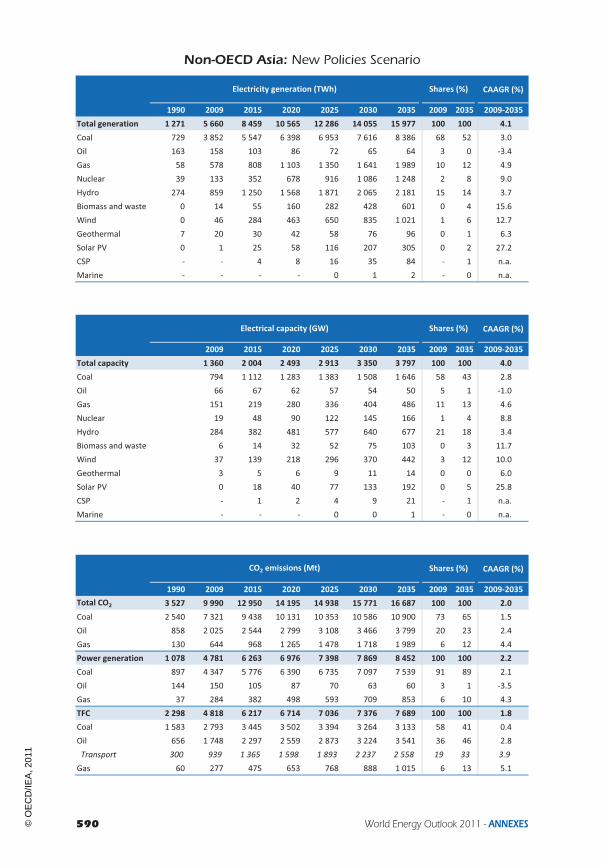
590 World Energy Outlook 2011 - ANNEXES
CAAGR (%)
1990 2009 2015 2020 2025 2030 2035 2009 2035 2009!2035Total generation 1 271 5 660 8 459 10 565 12 286 14 055 15 977 100 100 4.1Coal 729 3 852 5 547 6 398 6 953 7 616 8 386 68 52 3.0Oil 163 158 103 86 72 65 64 3 0 !3.4Gas 58 578 808 1 103 1 350 1 641 1 989 10 12 4.9Nuclear 39 133 352 678 916 1 086 1 248 2 8 9.0Hydro 274 859 1 250 1 568 1 871 2 065 2 181 15 14 3.7Biomass and waste 0 14 55 160 282 428 601 0 4 15.6Wind 0 46 284 463 650 835 1 021 1 6 12.7Geothermal 7 20 30 42 58 76 96 0 1 6.3Solar PV 0 1 25 58 116 207 305 0 2 27.2CSP ! ! 4 8 16 35 84 ! 1 n.a.Marine ! ! ! ! 0 1 2 ! 0 n.a.
CAAGR (%)
2009 2015 2020 2025 2030 2035 2009 2035 2009!2035Total capacity 1 360 2 004 2 493 2 913 3 350 3 797 100 100 4.0Coal 794 1 112 1 283 1 383 1 508 1 646 58 43 2.8Oil 66 67 62 57 54 50 5 1 !1.0Gas 151 219 280 336 404 486 11 13 4.6Nuclear 19 48 90 122 145 166 1 4 8.8Hydro 284 382 481 577 640 677 21 18 3.4Biomass and waste 6 14 32 52 75 103 0 3 11.7Wind 37 139 218 296 370 442 3 12 10.0Geothermal 3 5 6 9 11 14 0 0 6.0Solar PV 0 18 40 77 133 192 0 5 25.8CSP ! 1 2 4 9 21 ! 1 n.a.Marine ! ! ! 0 0 1 ! 0 n.a.
CAAGR (%)
1990 2009 2015 2020 2025 2030 2035 2009 2035 2009!2035Total CO2 3 527 9 990 12 950 14 195 14 938 15 771 16 687 100 100 2.0Coal 2 540 7 321 9 438 10 131 10 353 10 586 10 900 73 65 1.5Oil 858 2 025 2 544 2 799 3 108 3 466 3 799 20 23 2.4Gas 130 644 968 1 265 1 478 1 718 1 989 6 12 4.4Power generation 1 078 4 781 6 263 6 976 7 398 7 869 8 452 100 100 2.2Coal 897 4 347 5 776 6 390 6 735 7 097 7 539 91 89 2.1Oil 144 150 105 87 70 63 60 3 1 !3.5Gas 37 284 382 498 593 709 853 6 10 4.3TFC 2 298 4 818 6 217 6 714 7 036 7 376 7 689 100 100 1.8Coal 1 583 2 793 3 445 3 502 3 394 3 264 3 133 58 41 0.4Oil 656 1 748 2 297 2 559 2 873 3 224 3 541 36 46 2.8Transport 300 939 1 365 1 598 1 893 2 237 2 558 19 33 3.9Gas 60 277 475 653 768 888 1 015 6 13 5.1
CO2 emissions (Mt) Shares (%)
Electricity generation (TWh) Shares (%)
Electrical capacity (GW) Shares (%)
Non-OECD Asia: New Policies Scenario
© O
EC
D/IE
A, 2
011

Annex A - Tables for scenario projections 591
A
2020 2030 2035 2020 2030 2035CPS 450 CPS 450
Total generation 10 948 15 193 17 704 9 959 12 198 13 351 100 100 4.5 3.4Coal 7 172 9 873 11 586 5 498 3 971 3 264 65 24 4.3 !0.6Oil 99 80 75 82 58 55 0 0 !2.8 !4.0Gas 940 1 436 1 796 1 079 1 664 1 999 10 15 4.5 4.9Nuclear 656 942 1 020 756 1 651 2 040 6 15 8.1 11.1Hydro 1 475 1 785 1 903 1 659 2 307 2 491 11 19 3.1 4.2Biomass and waste 138 296 386 202 613 867 2 6 13.7 17.3Wind 387 622 732 537 1 313 1 638 4 12 11.3 14.8Geothermal 35 53 64 53 119 155 0 1 4.7 8.2Solar PV 43 97 121 74 390 598 1 4 22.8 30.5CSP 3 10 18 18 110 243 0 2 n.a. n.a.Marine ! 1 2 ! 1 3 0 0 n.a. n.a.
2020 2030 2035 2020 2030 2035CPS 450 CPS 450
Total capacity 2 509 3 396 3 886 2 444 3 327 3 726 100 100 4.1 4.0Coal 1 388 1 866 2 153 1 138 952 863 55 23 3.9 0.3Oil 63 56 52 62 53 48 1 1 !0.9 !1.2Gas 270 388 469 282 414 466 12 13 4.5 4.4Nuclear 87 125 135 101 220 274 3 7 7.9 10.9Hydro 451 548 585 510 721 781 15 21 2.8 4.0Biomass and waste 28 53 68 39 106 146 2 4 9.9 13.2Wind 186 284 328 247 556 668 8 18 8.7 11.7Geothermal 5 8 10 8 18 23 0 1 4.4 7.9Solar PV 31 67 81 52 259 394 2 11 21.7 29.3CSP 1 2 4 5 29 62 0 2 n.a. n.a.Marine ! 0 1 ! 0 1 0 0 n.a. n.a.
2020 2030 2035 2020 2030 2035CPS 450 CPS 450
Total CO2 15 165 18 617 20 651 12 945 10 388 9 111 100 100 2.8 !0.4Coal 11 041 13 209 14 525 9 025 5 756 4 238 70 47 2.7 !2.1Oil 2 885 3 682 4 097 2 669 3 000 3 064 20 34 2.7 1.6Gas 1 239 1 726 2 029 1 251 1 633 1 809 10 20 4.5 4.1Power generation 7 733 10 101 11 600 6 051 3 702 2 579 100 100 3.5 !2.3Coal 7 192 9 369 10 713 5 487 2 988 1 787 92 69 3.5 !3.4Oil 103 83 77 81 54 50 1 2 !2.6 !4.1Gas 437 649 810 483 660 742 7 29 4.1 3.8TFC 6 909 7 951 8 457 6 411 6 229 6 082 100 100 2.2 0.9Coal 3 595 3 580 3 537 3 315 2 595 2 292 42 38 0.9 !0.8Oil 2 628 3 415 3 817 2 438 2 777 2 836 45 47 3.0 1.9Transport 1 641 2 383 2 774 1 505 1 868 1 956 33 32 4.3 2.9Gas 687 956 1 103 658 856 955 13 16 5.5 4.9
Current Policies Scenario 450 Scenario
Current Policies Scenario 450 Scenario
CO2 emissions (Mt) Shares (%) CAAGR (%)2035 2009!2035
Current Policies Scenario 450 Scenario
Electrical capacity (GW) Shares (%) CAAGR (%)2035 2009!2035
Electricity generation (TWh) Shares (%) CAAGR (%)2035 2009!2035
Non-OECD Asia: Current Policies and 450 Scenarios
© O
EC
D/IE
A, 2
011

592 World Energy Outlook 2011 - ANNEXES
CAAGR (%)
1990 2009 2015 2020 2025 2030 2035 2009 2035 2009!2035TPED 872 2 271 3 002 3 345 3 522 3 687 3 835 100 100 2.0Coal 534 1 525 1 925 2 004 1 988 1 976 1 974 67 51 1.0Oil 113 383 533 586 638 686 703 17 18 2.4Gas 13 78 165 251 306 363 420 3 11 6.7Nuclear ! 18 63 142 188 221 249 1 6 10.6Hydro 11 53 78 96 109 115 118 2 3 3.1Biomass and waste 200 204 202 210 216 224 238 9 6 0.6Other renewables 0 10 36 56 78 102 134 0 3 10.3Power generation 181 920 1 319 1 568 1 719 1 867 2 022 100 100 3.1Coal 153 822 1 093 1 182 1 213 1 249 1 294 89 64 1.8Oil 16 7 8 7 6 5 5 1 0 !1.5Gas 1 16 44 72 97 127 157 2 8 9.3Nuclear ! 18 63 142 188 221 249 2 12 10.6Hydro 11 53 78 96 109 115 118 6 6 3.1Biomass and waste ! 1 9 30 50 72 98 0 5 18.2Other renewables 0 2 23 39 57 77 101 0 5 15.3Other energy sector 94 295 352 367 365 362 360 100 100 0.8Electricity 12 54 74 85 93 101 108 18 30 2.7TFC 668 1 441 1 914 2 122 2 233 2 328 2 400 100 100 2.0Coal 316 519 621 610 573 532 491 36 20 !0.2Oil 86 340 484 539 595 646 669 24 28 2.6Gas 9 50 104 160 189 215 241 3 10 6.2Electricity 43 267 425 539 616 687 761 19 32 4.1Heat 13 55 73 77 74 70 67 4 3 0.8Biomass and waste 200 202 193 180 166 152 140 14 6 !1.4Other renewables 0 8 13 17 20 25 32 1 1 5.6Industry 242 682 939 1 042 1 066 1 073 1 081 100 100 1.8Coal 178 406 505 497 469 440 411 59 38 0.0Oil 21 49 60 59 59 57 54 7 5 0.4Gas 3 16 42 80 91 97 101 2 9 7.4Electricity 30 175 282 352 397 435 473 26 44 3.9Heat 11 36 51 53 49 45 42 5 4 0.6Biomass and waste ! ! ! ! ! ! ! ! ! n.a.Other renewables ! 0 0 0 0 0 0 0 0 3.3Transport 38 163 276 331 393 457 496 100 100 4.4Oil 28 155 268 318 374 430 458 95 92 4.3Electricity 1 3 5 7 10 14 18 2 4 7.4Biofuels ! 1 2 5 8 12 16 1 3 10.5Other fuels 10 4 0 1 1 2 3 2 1 !0.2Buildings 316 443 521 559 579 599 621 100 100 1.3Coal 96 68 69 63 55 45 33 15 5 !2.7Oil 7 46 52 51 48 44 39 10 6 !0.6Gas 2 25 49 65 81 98 116 6 19 6.0Electricity 9 77 125 165 193 223 253 17 41 4.7Heat 2 19 22 24 24 24 25 4 4 1.0Biomass and waste 200 201 191 175 158 140 123 45 20 !1.9Other renewables 0 8 13 16 20 25 32 2 5 5.6Other 71 153 178 190 195 199 201 100 100 1.0
Energy demand (Mtoe) Shares (%)
China: New Policies Scenario
© O
EC
D/IE
A, 2
011

Annex A - Tables for scenario projections 593
A
2020 2030 2035 2020 2030 2035CPS 450 CPS 450
TPED 3 465 4 068 4 361 3 186 3 148 3 152 100 100 2.5 1.3Coal 2 149 2 431 2 596 1 817 1 283 1 074 60 34 2.1 !1.3Oil 595 717 751 563 607 588 17 19 2.6 1.7Gas 248 365 431 260 377 434 10 14 6.8 6.8Nuclear 135 188 201 159 323 396 5 13 9.7 12.6Hydro 93 107 112 99 117 121 3 4 2.9 3.2Biomass and waste 199 188 186 223 278 310 4 10 !0.4 1.6Other renewables 47 71 84 65 162 229 2 7 8.4 12.6Power generation 1 658 2 140 2 403 1 463 1 485 1 543 100 100 3.8 2.0Coal 1 305 1 627 1 816 1 039 667 527 76 34 3.1 !1.7Oil 8 6 6 6 4 4 0 0 !0.9 !2.5Gas 60 108 139 75 137 169 6 11 8.8 9.6Nuclear 135 188 201 159 323 396 8 26 9.7 12.6Hydro 93 107 112 99 117 121 5 8 2.9 3.2Biomass and waste 26 51 66 39 105 140 3 9 16.4 19.8Other renewables 32 52 62 46 132 186 3 12 13.2 18.1Other energy sector 379 401 413 352 310 291 100 100 1.3 !0.1Electricity 89 112 124 80 83 82 30 28 3.3 1.7TFC 2 169 2 485 2 621 2 043 2 099 2 090 100 100 2.3 1.4Coal 623 581 552 575 453 397 21 19 0.2 !1.0Oil 548 680 721 517 568 554 28 27 2.9 1.9Gas 169 235 269 167 220 244 10 12 6.7 6.3Electricity 559 750 857 510 591 624 33 30 4.6 3.3Heat 82 83 81 73 63 58 3 3 1.5 0.2Biomass and waste 173 136 120 184 173 170 5 8 !2.0 !0.7Other renewables 15 19 22 19 31 43 1 2 3.9 6.7Industry 1 076 1 189 1 245 1 003 977 949 100 100 2.3 1.3Coal 507 483 466 468 371 329 37 35 0.5 !0.8Oil 60 59 57 58 57 52 5 6 0.6 0.2Gas 86 113 125 92 119 125 10 13 8.3 8.2Electricity 364 478 541 334 386 403 43 42 4.4 3.3Heat 57 57 55 51 42 38 4 4 1.7 0.2Biomass and waste ! ! ! ! ! ! ! ! n.a. n.a.Other renewables 0 0 0 0 1 2 0 0 3.3 13.4Transport 335 480 534 318 418 442 100 100 4.7 3.9Oil 324 456 501 300 361 357 94 81 4.6 3.3Electricity 7 13 17 9 18 29 3 7 7.1 9.5Biofuels 4 9 12 8 30 40 2 9 9.2 14.3Other fuels 1 2 4 1 8 15 1 3 0.3 5.6Buildings 566 612 634 534 512 507 100 100 1.4 0.5Coal 66 49 37 58 37 25 6 5 !2.3 !3.8Oil 52 46 42 49 37 32 7 6 !0.3 !1.4Gas 68 102 119 59 74 84 19 17 6.1 4.7Electricity 173 243 282 153 172 177 44 35 5.1 3.3Heat 24 26 26 22 21 20 4 4 1.2 0.2Biomass and waste 169 127 107 176 143 129 17 25 !2.4 !1.7Other renewables 15 19 21 18 29 41 3 8 4.0 6.6Other 191 204 208 188 192 192 100 100 1.2 0.9
Current Policies Scenario 450 Scenario
Energy demand (Mtoe) Shares (%) CAAGR (%)2035 2009!2035
China: Current Policies and 450 Scenarios
© O
EC
D/IE
A, 2
011

594 World Energy Outlook 2011 - ANNEXES
CAAGR (%)
1990 2009 2015 2020 2025 2030 2035 2009 2035 2009!2035Total generation 650 3 735 5 812 7 264 8 249 9 169 10 100 100 100 3.9Coal 471 2 941 4 156 4 704 4 976 5 281 5 631 79 56 2.5Oil 49 17 18 15 12 12 11 0 0 !1.5Gas 3 62 204 355 499 673 843 2 8 10.6Nuclear ! 70 241 544 721 850 956 2 9 10.6Hydro 127 616 909 1 112 1 266 1 337 1 375 16 14 3.1Biomass and waste ! 2 30 109 178 250 339 0 3 21.1Wind 0 27 237 388 526 642 735 1 7 13.6Geothermal ! 0 1 3 6 10 14 0 0 19.1Solar PV 0 0 14 29 54 89 127 0 1 25.9CSP ! ! 3 6 11 26 67 ! 1 n.a.Marine ! ! ! ! 0 1 1 ! 0 n.a.
CAAGR (%)
2009 2015 2020 2025 2030 2035 2009 2035 2009!2035Total capacity 931 1 379 1 728 1 970 2 179 2 378 100 100 3.7Coal 650 859 984 1 044 1 099 1 159 70 49 2.3Oil 15 15 14 12 12 12 2 1 !0.9Gas 33 73 107 135 169 204 4 9 7.2Nuclear 9 32 71 94 111 125 1 5 10.7Hydro 197 270 330 376 397 408 21 17 2.8Biomass and waste 1 6 20 32 44 58 0 2 17.1Wind 26 114 180 236 280 312 3 13 10.1Geothermal 0 0 0 1 1 2 0 0 18.1Solar PV 0 10 20 36 58 81 0 3 24.0CSP ! 1 2 3 6 16 ! 1 n.a.Marine ! ! ! 0 0 0 ! 0 n.a.
CAAGR (%)
1990 2009 2015 2020 2025 2030 2035 2009 2035 2009!2035Total CO2 2 244 6 877 9 065 9 727 9 920 10 113 10 253 100 100 1.5Coal 1 914 5 751 7 332 7 638 7 547 7 456 7 398 84 72 1.0Oil 305 958 1 366 1 522 1 681 1 833 1 900 14 19 2.7Gas 26 169 367 566 693 824 955 2 9 6.9Power generation 652 3 324 4 467 4 872 5 027 5 200 5 404 100 100 1.9Coal 598 3 262 4 336 4 679 4 779 4 884 5 021 98 93 1.7Oil 52 25 27 24 20 19 17 1 0 !1.6Gas 2 36 103 168 227 298 367 1 7 9.3TFC 1 507 3 289 4 280 4 516 4 562 4 578 4 510 100 100 1.2Coal 1 265 2 315 2 790 2 741 2 562 2 369 2 174 70 48 !0.2Oil 225 863 1 257 1 411 1 571 1 722 1 789 26 40 2.8Transport 83 463 798 949 1 115 1 279 1 365 14 30 4.2Gas 17 110 233 364 429 487 548 3 12 6.4
CO2 emissions (Mt) Shares (%)
Electricity generation (TWh) Shares (%)
Electrical capacity (GW) Shares (%)
China: New Policies Scenario
© O
EC
D/IE
A, 2
011

Annex A - Tables for scenario projections 595
A
2020 2030 2035 2020 2030 2035CPS 450 CPS 450
Total generation 7 537 10 023 11 407 6 858 7 840 8 216 100 100 4.4 3.1Coal 5 194 6 766 7 749 4 079 2 808 2 127 68 26 3.8 !1.2Oil 16 13 11 14 10 9 0 0 !1.4 !2.4Gas 286 541 704 379 763 962 6 12 9.8 11.1Nuclear 520 723 772 611 1 238 1 519 7 18 9.7 12.6Hydro 1 079 1 249 1 302 1 146 1 364 1 402 11 17 2.9 3.2Biomass and waste 95 183 231 138 366 491 2 6 19.3 22.8Wind 318 492 560 441 977 1 168 5 14 12.4 15.6Geothermal 2 5 7 3 14 22 0 0 15.8 21.0Solar PV 23 43 53 35 222 340 0 4 21.7 30.7CSP 3 8 16 13 77 175 0 2 n.a. n.a.Marine ! 1 2 ! 0 1 0 0 n.a. n.a.
2020 2030 2035 2020 2030 2035CPS 450 CPS 450
Total capacity 1 764 2 294 2 563 1 687 2 120 2 280 100 100 4.0 3.5Coal 1 072 1 364 1 532 886 711 616 60 27 3.4 !0.2Oil 15 13 12 14 12 11 0 0 !0.8 !1.3Gas 103 164 201 113 184 206 8 9 7.2 7.3Nuclear 68 94 101 80 161 198 4 9 9.8 12.6Hydro 320 370 386 340 405 416 15 18 2.6 2.9Biomass and waste 18 32 40 25 63 83 2 4 15.5 18.8Wind 151 223 249 201 411 476 10 21 9.1 11.9Geothermal 0 1 1 0 2 3 0 0 15.2 19.8Solar PV 17 30 36 25 151 230 1 10 20.2 29.0CSP 1 2 4 3 19 41 0 2 n.a. n.a.Marine ! 0 0 ! 0 0 0 0 n.a. n.a.
2020 2030 2035 2020 2030 2035CPS 450 CPS 450
Total CO2 10 314 12 014 12 897 8 921 6 398 4 979 100 100 2.4 !1.2Coal 8 207 9 254 9 862 6 882 3 994 2 539 76 51 2.1 !3.1Oil 1 549 1 931 2 053 1 453 1 590 1 548 16 31 3.0 1.9Gas 558 829 981 585 814 893 8 18 7.0 6.6Power generation 5 339 6 699 7 507 4 278 2 329 1 243 100 100 3.2 !3.7Coal 5 172 6 423 7 161 4 082 2 019 899 95 72 3.1 !4.8Oil 26 22 20 22 15 13 0 1 !0.9 !2.6Gas 140 253 327 174 295 331 4 27 8.8 8.9TFC 4 622 4 946 5 004 4 319 3 788 3 469 100 100 1.6 0.2Coal 2 803 2 594 2 453 2 596 1 823 1 504 49 43 0.2 !1.6Oil 1 436 1 816 1 938 1 345 1 482 1 440 39 42 3.2 2.0Transport 964 1 358 1 493 894 1 076 1 065 30 31 4.6 3.3Gas 384 536 613 378 482 524 12 15 6.8 6.2
Current Policies Scenario 450 Scenario
Current Policies Scenario 450 Scenario
CO2 emissions (Mt) Shares (%) CAAGR (%)2035 2009!2035
Current Policies Scenario 450 Scenario
Electrical capacity (GW) Shares (%) CAAGR (%)2035 2009!2035
Electricity generation (TWh) Shares (%) CAAGR (%)2035 2009!2035
China: Current Policies and 450 Scenarios
© O
EC
D/IE
A, 2
011

596 World Energy Outlook 2011 - ANNEXES
CAAGR (%)
1990 2009 2015 2020 2025 2030 2035 2009 2035 2009!2035TPED 319 669 810 945 1 092 1 256 1 464 100 100 3.1Coal 106 280 363 434 490 544 618 42 42 3.1Oil 61 159 178 202 237 288 356 24 24 3.1Gas 11 49 63 82 100 124 154 7 11 4.5Nuclear 2 5 12 17 29 38 48 1 3 9.2Hydro 6 9 13 18 25 29 30 1 2 4.7Biomass and waste 133 165 176 184 195 208 220 25 15 1.1Other renewables 0 2 5 9 16 25 36 0 2 12.2Power generation 73 253 317 392 471 553 657 100 100 3.7Coal 58 203 248 292 327 360 412 80 63 2.8Oil 4 11 9 7 5 5 4 4 1 !3.6Gas 3 23 28 44 56 72 91 9 14 5.4Nuclear 2 5 12 17 29 38 48 2 7 9.2Hydro 6 9 13 18 25 29 30 4 5 4.7Biomass and waste ! 1 3 7 15 26 38 0 6 14.4Other renewables 0 2 5 8 14 23 33 1 5 12.5Other energy sector 20 59 79 98 118 140 166 100 100 4.1Electricity 7 18 27 36 46 57 69 30 42 5.4TFC 252 435 528 604 690 794 923 100 100 2.9Coal 42 60 89 107 119 131 143 14 16 3.4Oil 53 129 149 176 214 264 331 30 36 3.7Gas 6 21 29 31 35 42 51 5 6 3.5Electricity 18 60 88 113 141 173 212 14 23 4.9Heat ! ! ! ! ! ! ! ! ! n.a.Biomass and waste 133 164 173 177 180 181 182 38 20 0.4Other renewables 0 0 1 1 1 2 4 0 0 10.6Industry 70 132 183 219 251 285 321 100 100 3.5Coal 29 45 72 91 103 116 130 34 40 4.1Oil 10 23 28 30 32 33 34 18 11 1.4Gas 0 7 9 9 12 15 18 5 6 4.0Electricity 9 28 42 56 69 85 102 21 32 5.1Heat ! ! ! ! ! ! ! ! ! n.a.Biomass and waste 23 29 31 33 35 37 38 22 12 1.1Other renewables ! ! ! ! ! ! ! ! ! n.a.Transport 27 51 57 74 104 147 211 100 100 5.6Oil 24 48 52 68 95 134 192 94 91 5.4Electricity 0 1 2 2 2 2 3 2 1 3.5Biofuels ! 0 1 2 3 5 8 0 4 16.1Other fuels 2 2 2 3 4 6 9 4 4 6.1Buildings 137 195 214 227 242 257 276 100 100 1.3Coal 11 15 16 16 16 15 14 7 5 !0.2Oil 11 24 27 29 32 36 40 12 14 2.0Gas 0 0 1 1 2 4 5 0 2 23.3Electricity 4 21 29 38 48 62 78 11 28 5.2Heat ! ! ! ! ! ! ! ! ! n.a.Biomass and waste 111 136 141 142 142 140 136 69 49 0.0Other renewables 0 0 1 1 1 2 3 0 1 9.9Other 17 56 74 85 94 104 114 100 100 2.8
Energy demand (Mtoe) Shares (%)
India: New Policies Scenario
© O
EC
D/IE
A, 2
011

Annex A - Tables for scenario projections 597
A
2020 2030 2035 2020 2030 2035CPS 450 CPS 450
TPED 1 000 1 372 1 622 877 1 078 1 223 100 100 3.5 2.3Coal 489 680 804 372 349 365 50 30 4.1 1.0Oil 214 312 388 196 254 289 24 24 3.5 2.3Gas 77 118 146 75 122 145 9 12 4.3 4.3Nuclear 17 33 41 20 66 90 3 7 8.5 11.9Hydro 14 20 23 20 40 48 1 4 3.6 6.6Biomass and waste 181 196 205 183 211 230 13 19 0.8 1.3Other renewables 7 13 16 12 36 57 1 5 8.7 14.2Power generation 432 633 767 342 420 495 100 100 4.4 2.6Coal 343 481 578 238 174 169 75 34 4.1 !0.7Oil 10 9 8 6 3 3 1 1 !1.2 !4.8Gas 35 61 78 38 70 83 10 17 4.8 5.0Nuclear 17 33 41 20 66 90 5 18 8.5 11.9Hydro 14 20 23 20 40 48 3 10 3.6 6.6Biomass and waste 5 18 26 9 32 50 3 10 12.8 15.6Other renewables 7 11 14 11 33 52 2 11 8.7 14.5Other energy sector 100 147 175 92 127 147 100 100 4.3 3.6Electricity 38 61 75 33 49 59 43 40 5.7 4.7TFC 621 833 977 581 733 822 100 100 3.2 2.5Coal 110 143 160 100 124 136 16 17 3.8 3.2Oil 185 284 358 171 234 269 37 33 4.0 2.9Gas 34 46 56 30 41 50 6 6 3.8 3.3Electricity 115 180 223 104 152 182 23 22 5.1 4.3Heat ! ! ! ! ! ! ! ! n.a. n.a.Biomass and waste 176 178 178 174 179 180 18 22 0.3 0.4Other renewables 1 2 2 1 3 4 0 1 8.9 11.3Industry 222 295 335 206 268 301 100 100 3.6 3.2Coal 93 127 146 86 112 126 43 42 4.6 4.0Oil 30 34 35 28 31 32 10 11 1.5 1.2Gas 11 16 19 9 13 16 6 5 4.2 3.6Electricity 56 85 103 52 75 88 31 29 5.1 4.5Heat ! ! ! ! ! ! ! ! n.a. n.a.Biomass and waste 31 32 33 32 37 39 10 13 0.5 1.2Other renewables ! ! ! ! ! ! ! ! n.a. n.a.Transport 81 164 234 74 129 166 100 100 6.0 4.6Oil 74 150 213 67 111 138 91 84 5.9 4.1Electricity 2 2 2 2 4 6 1 3 3.3 6.7Biofuels 2 5 8 2 7 11 3 7 15.9 17.6Other fuels 3 7 10 3 7 10 4 6 6.6 6.5Buildings 233 269 292 217 233 242 100 100 1.6 0.8Coal 17 16 15 15 12 10 5 4 !0.0 !1.3Oil 31 40 46 27 31 34 16 14 2.5 1.3Gas 1 4 6 1 3 4 2 2 23.9 22.5Electricity 40 67 86 34 50 60 29 25 5.6 4.1Heat ! ! ! ! ! ! ! ! n.a. n.a.Biomass and waste 143 141 138 140 134 130 47 54 0.1 !0.2Other renewables 1 1 2 1 2 4 1 1 8.6 10.5Other 85 106 117 84 103 113 100 100 2.9 2.7
Current Policies Scenario 450 Scenario
Energy demand (Mtoe) Shares (%) CAAGR (%)2035 2009!2035
India: Current Policies and 450 Scenarios
© O
EC
D/IE
A, 2
011

598 World Energy Outlook 2011 - ANNEXES
CAAGR (%)
1990 2009 2015 2020 2025 2030 2035 2009 2035 2009!2035Total generation 289 899 1 319 1 723 2 162 2 671 3 264 100 100 5.1Coal 192 617 898 1 080 1 231 1 431 1 716 69 53 4.0Oil 10 26 24 19 14 13 12 3 0 !2.9Gas 10 111 148 243 319 418 536 12 16 6.2Nuclear 6 19 44 65 110 145 184 2 6 9.2Hydro 72 107 147 208 290 338 352 12 11 4.7Biomass and waste ! 2 7 19 47 83 122 0 4 17.2Wind 0 18 41 63 98 139 183 2 6 9.3Geothermal ! ! 0 0 1 1 2 ! 0 n.a.Solar PV ! 0 9 23 49 94 140 0 4 39.0CSP ! ! 1 2 5 9 15 ! 0 n.a.Marine ! ! ! ! 0 0 1 ! 0 n.a.
CAAGR (%)
2009 2015 2020 2025 2030 2035 2009 2035 2009!2035Total capacity 176 303 390 498 636 779 100 100 5.9Coal 92 174 201 221 267 325 52 42 5.0Oil 7 8 8 8 8 7 4 1 !0.0Gas 20 34 50 67 85 108 11 14 6.7Nuclear 4 7 10 17 22 28 2 4 7.6Hydro 39 49 68 95 111 115 22 15 4.2Biomass and waste 2 3 4 9 14 20 1 3 9.6Wind 11 23 33 49 67 85 6 11 8.2Geothermal ! 0 0 0 0 0 ! 0 n.a.Solar PV 0 7 15 31 58 85 0 11 27.9CSP ! 0 1 1 3 4 ! 1 n.a.Marine ! ! ! 0 0 0 ! 0 n.a.
CAAGR (%)
1990 2009 2015 2020 2025 2030 2035 2009 2035 2009!2035Total CO2 593 1 548 1 924 2 286 2 618 3 004 3 535 100 100 3.2Coal 406 1 043 1 347 1 599 1 789 1 969 2 227 67 63 3.0Oil 166 401 443 508 610 758 961 26 27 3.4Gas 21 105 134 179 219 277 347 7 10 4.7Power generation 245 873 1 056 1 256 1 414 1 578 1 824 100 100 2.9Coal 226 785 961 1 131 1 268 1 396 1 598 90 88 2.8Oil 11 33 29 23 15 14 13 4 1 !3.6Gas 8 54 66 102 130 168 212 6 12 5.4TFC 330 625 808 958 1 122 1 327 1 594 100 100 3.7Coal 175 255 382 459 512 562 617 41 39 3.5Oil 146 330 373 440 542 681 871 53 55 3.8Transport 74 145 156 204 285 404 577 23 36 5.4Gas 9 40 54 59 68 85 106 6 7 3.8
CO2 emissions (Mt) Shares (%)
Electricity generation (TWh) Shares (%)
Electrical capacity (GW) Shares (%)
India: New Policies Scenario
© O
EC
D/IE
A, 2
011

Annex A - Tables for scenario projections 599
A
2020 2030 2035 2020 2030 2035CPS 450 CPS 450
Total generation 1 769 2 796 3 449 1 586 2 335 2 790 100 100 5.3 4.4Coal 1 229 1 878 2 312 910 754 731 67 26 5.2 0.7Oil 25 23 22 16 10 9 1 0 !0.7 !4.0Gas 192 351 460 212 429 512 13 18 5.6 6.1Nuclear 67 126 156 75 253 346 5 12 8.5 11.9Hydro 168 235 267 234 466 558 8 20 3.6 6.6Biomass and waste 15 56 82 27 104 163 2 6 15.3 18.5Wind 58 87 99 78 178 242 3 9 6.8 10.5Geothermal 0 1 1 1 2 5 0 0 n.a. n.a.Solar PV 15 40 50 28 108 159 1 6 33.5 39.6CSP 0 0 1 5 31 65 0 2 n.a. n.a.Marine ! 0 1 ! 0 1 0 0 n.a. n.a.
2020 2030 2035 2020 2030 2035CPS 450 CPS 450
Total capacity 362 574 699 380 629 763 100 100 5.5 5.8Coal 200 313 386 168 164 166 55 22 5.7 2.3Oil 8 8 7 8 7 7 1 1 !0.0 !0.4Gas 45 80 102 50 97 115 15 15 6.5 6.9Nuclear 10 19 23 12 38 51 3 7 6.8 10.2Hydro 55 77 88 77 153 184 13 24 3.1 6.1Biomass and waste 4 10 14 6 18 27 2 3 7.9 10.7Wind 30 42 47 39 77 96 7 13 5.7 8.7Geothermal 0 0 0 0 0 1 0 0 n.a. n.a.Solar PV 10 26 32 19 66 96 5 13 23.2 28.6CSP 0 0 0 1 9 21 0 3 n.a. n.a.Marine ! 0 0 ! 0 0 0 0 n.a. n.a.
2020 2030 2035 2020 2030 2035CPS 450 CPS 450
Total CO2 2 523 3 581 4 320 2 012 2 040 2 159 100 100 4.0 1.3Coal 1 812 2 485 2 933 1 362 1 121 1 093 68 51 4.1 0.2Oil 545 836 1 061 487 652 750 25 35 3.8 2.4Gas 166 260 327 163 267 317 8 15 4.5 4.4Power generation 1 444 2 034 2 446 1 028 798 771 100 100 4.0 !0.5Coal 1 331 1 865 2 239 921 627 575 92 75 4.1 !1.2Oil 31 27 24 19 10 9 1 1 !1.2 !4.8Gas 82 142 183 88 161 187 7 24 4.8 4.9TFC 1 004 1 443 1 750 914 1 153 1 287 100 100 4.0 2.8Coal 471 608 681 432 484 506 39 39 3.9 2.7Oil 467 742 954 425 586 678 55 53 4.2 2.8Transport 222 451 641 201 335 417 37 32 5.9 4.1Gas 66 93 115 57 82 102 7 8 4.1 3.7
Current Policies Scenario 450 Scenario
Current Policies Scenario 450 Scenario
CO2 emissions (Mt) Shares (%) CAAGR (%)2035 2009!2035
Current Policies Scenario 450 Scenario
Electrical capacity (GW) Shares (%) CAAGR (%)2035 2009!2035
Electricity generation (TWh) Shares (%) CAAGR (%)2035 2009!2035
India: Current Policies and 450 Scenarios
© O
EC
D/IE
A, 2
011

600 World Energy Outlook 2011 - ANNEXES
CAAGR (%)
1990 2009 2015 2020 2025 2030 2035 2009 2035 2009!2035TPED 208 589 705 775 856 936 1 000 100 100 2.1Coal 1 1 2 2 2 2 2 0 0 1.9Oil 133 299 360 383 407 418 428 51 43 1.4Gas 72 287 336 376 425 483 520 49 52 2.3Nuclear ! ! 2 5 8 11 13 ! 1 n.a.Hydro 1 1 3 3 4 4 5 0 0 5.6Biomass and waste 0 1 1 2 4 6 10 0 1 10.7Other renewables 0 0 2 4 6 12 23 0 2 21.0Power generation 60 194 207 233 264 298 328 100 100 2.0Coal 0 0 0 0 1 1 1 0 0 5.8Oil 27 79 79 78 73 65 65 41 20 !0.8Gas 32 113 122 144 172 204 218 58 66 2.5Nuclear ! ! 2 5 8 11 13 ! 4 n.a.Hydro 1 1 3 3 4 4 5 1 1 5.6Biomass and waste ! 0 1 1 2 5 8 0 2 37.3Other renewables 0 0 0 2 4 9 19 0 6 30.2Other energy sector 21 67 86 99 110 126 139 100 100 2.9Electricity 4 13 16 19 22 24 27 19 19 2.8TFC 147 393 494 540 594 641 678 100 100 2.1Coal 0 0 0 1 1 1 1 0 0 2.2Oil 102 214 276 296 323 342 350 55 52 1.9Gas 29 126 149 163 176 189 204 32 30 1.9Electricity 15 52 66 78 90 104 118 13 17 3.2Heat ! ! ! ! ! ! ! ! ! n.a.Biomass and waste 0 1 1 1 1 1 2 0 0 4.2Other renewables 0 0 1 2 2 3 4 0 1 13.9Industry 43 110 133 143 150 157 163 100 100 1.5Coal 0 0 0 1 1 1 1 0 0 2.3Oil 20 41 48 50 50 48 47 37 29 0.5Gas 20 58 70 76 82 87 92 53 56 1.8Electricity 3 10 13 16 19 21 24 9 15 3.2Heat ! ! ! ! ! ! ! ! ! n.a.Biomass and waste 0 0 0 0 0 0 0 0 0 1.4Other renewables ! 0 0 0 0 0 0 0 0 3.3Transport 47 111 153 168 193 210 219 100 100 2.7Oil 47 107 149 164 187 204 211 97 96 2.6Electricity ! 0 0 0 0 0 0 0 0 0.9Biofuels ! ! ! ! ! ! ! ! ! n.a.Other fuels ! 3 4 5 5 7 8 3 4 3.6Buildings 33 100 118 132 146 162 178 100 100 2.2Coal ! ! ! ! ! ! ! ! ! n.a.Oil 17 21 23 23 23 23 22 21 12 0.1Gas 3 40 44 48 53 57 63 40 35 1.7Electricity 12 39 49 58 67 78 88 38 50 3.2Heat ! ! ! ! ! ! ! ! ! n.a.Biomass and waste 0 0 0 1 1 1 1 0 1 5.3Other renewables 0 0 1 2 2 3 4 0 2 14.0Other 23 72 90 97 104 111 118 100 100 2.0
Energy demand (Mtoe) Shares (%)
Middle East: New Policies Scenario
© O
EC
D/IE
A, 2
011
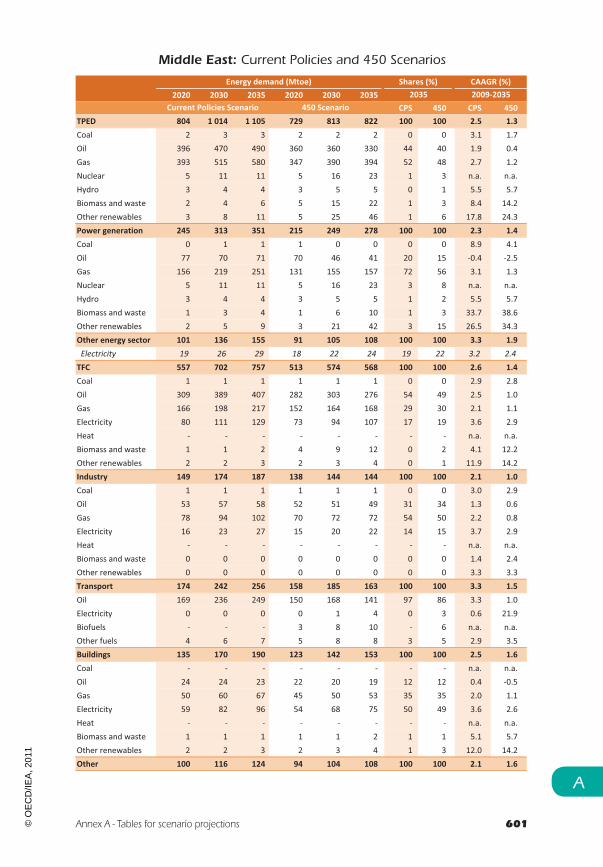
Annex A - Tables for scenario projections 601
A
2020 2030 2035 2020 2030 2035CPS 450 CPS 450
TPED 804 1 014 1 105 729 813 822 100 100 2.5 1.3Coal 2 3 3 2 2 2 0 0 3.1 1.7Oil 396 470 490 360 360 330 44 40 1.9 0.4Gas 393 515 580 347 390 394 52 48 2.7 1.2Nuclear 5 11 11 5 16 23 1 3 n.a. n.a.Hydro 3 4 4 3 5 5 0 1 5.5 5.7Biomass and waste 2 4 6 5 15 22 1 3 8.4 14.2Other renewables 3 8 11 5 25 46 1 6 17.8 24.3Power generation 245 313 351 215 249 278 100 100 2.3 1.4Coal 0 1 1 1 0 0 0 0 8.9 4.1Oil 77 70 71 70 46 41 20 15 !0.4 !2.5Gas 156 219 251 131 155 157 72 56 3.1 1.3Nuclear 5 11 11 5 16 23 3 8 n.a. n.a.Hydro 3 4 4 3 5 5 1 2 5.5 5.7Biomass and waste 1 3 4 1 6 10 1 3 33.7 38.6Other renewables 2 5 9 3 21 42 3 15 26.5 34.3Other energy sector 101 136 155 91 105 108 100 100 3.3 1.9Electricity 19 26 29 18 22 24 19 22 3.2 2.4TFC 557 702 757 513 574 568 100 100 2.6 1.4Coal 1 1 1 1 1 1 0 0 2.9 2.8Oil 309 389 407 282 303 276 54 49 2.5 1.0Gas 166 198 217 152 164 168 29 30 2.1 1.1Electricity 80 111 129 73 94 107 17 19 3.6 2.9Heat ! ! ! ! ! ! ! ! n.a. n.a.Biomass and waste 1 1 2 4 9 12 0 2 4.1 12.2Other renewables 2 2 3 2 3 4 0 1 11.9 14.2Industry 149 174 187 138 144 144 100 100 2.1 1.0Coal 1 1 1 1 1 1 0 0 3.0 2.9Oil 53 57 58 52 51 49 31 34 1.3 0.6Gas 78 94 102 70 72 72 54 50 2.2 0.8Electricity 16 23 27 15 20 22 14 15 3.7 2.9Heat ! ! ! ! ! ! ! ! n.a. n.a.Biomass and waste 0 0 0 0 0 0 0 0 1.4 2.4Other renewables 0 0 0 0 0 0 0 0 3.3 3.3Transport 174 242 256 158 185 163 100 100 3.3 1.5Oil 169 236 249 150 168 141 97 86 3.3 1.0Electricity 0 0 0 0 1 4 0 3 0.6 21.9Biofuels ! ! ! 3 8 10 ! 6 n.a. n.a.Other fuels 4 6 7 5 8 8 3 5 2.9 3.5Buildings 135 170 190 123 142 153 100 100 2.5 1.6Coal ! ! ! ! ! ! ! ! n.a. n.a.Oil 24 24 23 22 20 19 12 12 0.4 !0.5Gas 50 60 67 45 50 53 35 35 2.0 1.1Electricity 59 82 96 54 68 75 50 49 3.6 2.6Heat ! ! ! ! ! ! ! ! n.a. n.a.Biomass and waste 1 1 1 1 1 2 1 1 5.1 5.7Other renewables 2 2 3 2 3 4 1 3 12.0 14.2Other 100 116 124 94 104 108 100 100 2.1 1.6
Current Policies Scenario 450 Scenario
Energy demand (Mtoe) Shares (%) CAAGR (%)2035 2009!2035
Middle East: Current Policies and 450 Scenarios
© O
EC
D/IE
A, 2
011

602 World Energy Outlook 2011 - ANNEXES
CAAGR (%)
1990 2009 2015 2020 2025 2030 2035 2009 2035 2009!2035Total generation 219 743 947 1 115 1 293 1 483 1 669 100 100 3.2Coal ! 0 1 2 3 2 2 0 0 7.3Oil 101 300 302 302 290 265 267 40 16 !0.5Gas 106 430 598 732 881 1 036 1 126 58 67 3.8Nuclear ! ! 7 18 31 41 52 ! 3 n.a.Hydro 12 13 32 40 47 51 54 2 3 5.6Biomass and waste ! 0 2 4 8 16 26 0 2 37.1Wind 0 0 3 6 13 27 56 0 3 23.5Geothermal ! ! ! ! ! ! ! ! ! n.a.Solar PV ! ! 2 6 12 24 38 ! 2 n.a.CSP ! ! ! 4 9 20 50 ! 3 n.a.Marine ! ! ! ! ! ! ! ! ! n.a.
CAAGR (%)
2009 2015 2020 2025 2030 2035 2009 2035 2009!2035Total capacity 205 295 327 347 369 414 100 100 2.7Coal 0 0 0 1 0 0 0 0 2.2Oil 65 79 81 78 70 68 32 17 0.2Gas 127 197 216 226 237 251 62 61 2.7Nuclear ! 1 2 4 6 7 ! 2 n.a.Hydro 12 15 20 23 25 26 6 6 2.8Biomass and waste 0 0 1 1 2 4 0 1 21.5Wind 0 1 2 5 11 22 0 5 23.4Geothermal ! ! ! ! ! ! ! ! n.a.Solar PV ! 1 3 6 13 20 ! 5 n.a.CSP ! ! 1 3 6 15 ! 4 n.a.Marine ! ! ! ! ! ! ! ! n.a.
CAAGR (%)
1990 2009 2015 2020 2025 2030 2035 2009 2035 2009!2035Total CO2 557 1 510 1 778 1 925 2 089 2 238 2 333 100 100 1.7Coal 1 4 5 8 9 9 9 0 0 3.5Oil 392 856 1 026 1 081 1 144 1 168 1 186 57 51 1.3Gas 163 650 746 836 936 1 061 1 139 43 49 2.2Power generation 159 513 534 584 637 685 717 100 100 1.3Coal 0 1 2 4 6 5 5 0 1 5.6Oil 85 247 246 243 230 204 203 48 28 !0.8Gas 74 265 286 336 401 476 509 52 71 2.5TFC 346 843 1 058 1 142 1 244 1 321 1 371 100 100 1.9Coal 1 1 2 2 2 2 2 0 0 2.1Oil 281 566 731 785 858 906 924 67 67 1.9Transport 141 318 441 485 555 604 624 38 46 2.6Gas 64 275 325 355 384 413 444 33 32 1.9
CO2 emissions (Mt) Shares (%)
Electricity generation (TWh) Shares (%)
Electrical capacity (GW) Shares (%)
Middle East: New Policies Scenario
© O
EC
D/IE
A, 2
011

Annex A - Tables for scenario projections 603
A
2020 2030 2035 2020 2030 2035CPS 450 CPS 450
Total generation 1 142 1 584 1 829 1 047 1 337 1 514 100 100 3.5 2.8Coal 2 4 5 2 1 1 0 0 10.5 5.1Oil 302 288 294 272 182 165 16 11 !0.1 !2.3Gas 766 1 150 1 357 684 853 853 74 56 4.5 2.7Nuclear 18 41 41 18 62 88 2 6 n.a. n.a.Hydro 38 50 52 40 53 55 3 4 5.5 5.7Biomass and waste 4 9 13 5 19 32 1 2 33.5 38.3Wind 6 15 23 8 76 139 1 9 19.3 27.9Geothermal ! ! ! ! ! ! ! ! n.a. n.a.Solar PV 4 14 19 8 37 69 1 5 n.a. n.a.CSP 3 14 24 10 54 112 1 7 n.a. n.a.Marine ! ! ! ! ! 0 ! 0 n.a. n.a.
2020 2030 2035 2020 2030 2035CPS 450 CPS 450
Total capacity 326 383 427 327 408 485 100 100 2.9 3.4Coal 0 1 1 0 0 0 0 0 4.8 !0.1Oil 82 74 74 79 58 51 17 11 0.5 !0.9Gas 217 260 294 215 247 262 69 54 3.3 2.8Nuclear 2 6 6 2 8 12 1 2 n.a. n.a.Hydro 18 24 25 19 25 26 6 5 2.8 2.9Biomass and waste 1 1 2 1 3 5 0 1 18.4 22.6Wind 2 6 9 3 32 58 2 12 19.0 28.0Geothermal ! ! ! ! ! ! ! ! n.a. n.a.Solar PV 2 8 10 4 19 36 2 7 n.a. n.a.CSP 1 4 7 3 16 34 2 7 n.a. n.a.Marine ! ! ! ! ! 0 ! 0 n.a. n.a.
2020 2030 2035 2020 2030 2035CPS 450 CPS 450
Total CO2 1 996 2 464 2 659 1 795 1 822 1 714 100 100 2.2 0.5Coal 8 12 15 10 8 8 1 0 5.6 2.8Oil 1 112 1 320 1 372 1 013 987 884 52 52 1.8 0.1Gas 875 1 131 1 271 771 828 822 48 48 2.6 0.9Power generation 612 740 819 533 495 478 100 100 1.8 !0.3Coal 4 8 11 7 4 3 1 1 8.7 3.9Oil 242 220 222 219 143 129 27 27 !0.4 !2.5Gas 365 512 587 307 348 346 72 72 3.1 1.0TFC 1 181 1 474 1 563 1 078 1 139 1 055 100 100 2.4 0.9Coal 2 3 3 2 3 3 0 0 2.9 2.5Oil 817 1 038 1 085 744 794 708 69 67 2.5 0.9Transport 501 699 738 444 496 417 47 39 3.3 1.0Gas 362 434 474 331 343 344 30 33 2.1 0.9
Current Policies Scenario 450 Scenario
Current Policies Scenario 450 Scenario
CO2 emissions (Mt) Shares (%) CAAGR (%)2035 2009!2035
Current Policies Scenario 450 Scenario
Electrical capacity (GW) Shares (%) CAAGR (%)2035 2009!2035
Electricity generation (TWh) Shares (%) CAAGR (%)2035 2009!2035
Middle East: Current Policies and 450 Scenarios
© O
EC
D/IE
A, 2
011

604 World Energy Outlook 2011 - ANNEXES
CAAGR (%)
1990 2009 2015 2020 2025 2030 2035 2009 2035 2009!2035TPED 391 665 739 790 835 878 915 100 100 1.2Coal 74 106 119 125 129 130 126 16 14 0.7Oil 89 151 167 171 173 173 178 23 19 0.6Gas 30 83 94 109 119 129 136 13 15 1.9Nuclear 2 3 3 3 8 14 15 1 2 6.1Hydro 5 8 10 13 16 19 23 1 3 3.9Biomass and waste 190 312 342 362 379 394 407 47 45 1.0Other renewables 0 1 3 6 12 19 30 0 3 12.5Power generation 69 138 157 178 198 216 233 100 100 2.0Coal 39 63 72 77 78 76 73 46 31 0.5Oil 11 20 18 16 13 10 9 14 4 !2.8Gas 11 41 48 58 65 68 70 30 30 2.0Nuclear 2 3 3 3 8 14 15 2 7 6.1Hydro 5 8 10 13 16 19 23 6 10 3.9Biomass and waste 0 1 3 5 7 11 15 0 7 13.1Other renewables 0 1 3 6 11 18 28 1 12 12.5Other energy sector 60 91 98 102 105 109 111 100 100 0.8Electricity 6 10 12 13 15 16 17 11 15 1.9TFC 289 491 550 587 619 650 680 100 100 1.3Coal 20 19 23 23 23 23 22 4 3 0.6Oil 70 122 142 150 158 166 174 25 26 1.4Gas 9 28 29 32 34 37 41 6 6 1.5Electricity 21 45 54 63 72 82 92 9 14 2.8Heat ! ! ! ! ! ! ! ! ! n.a.Biomass and waste 169 277 302 318 330 341 349 56 51 0.9Other renewables 0 0 0 0 1 1 2 0 0 13.4Industry 60 84 99 105 109 115 121 100 100 1.4Coal 14 10 13 13 13 13 13 12 11 0.9Oil 14 12 13 14 14 14 14 15 12 0.5Gas 5 14 15 17 18 20 22 16 18 1.7Electricity 12 20 23 26 27 29 30 23 25 1.7Heat ! ! ! ! ! ! ! ! ! n.a.Biomass and waste 16 28 34 36 37 39 41 33 34 1.5Other renewables ! ! ! ! ! ! ! ! ! n.a.Transport 36 79 93 99 106 112 117 100 100 1.5Oil 36 77 91 96 103 108 113 98 96 1.5Electricity 0 0 1 1 1 1 1 1 1 2.0Biofuels ! ! 1 1 1 1 1 ! 1 n.a.Other fuels 0 1 1 1 1 2 2 2 2 2.2Buildings 178 302 331 352 372 390 407 100 100 1.1Coal 3 8 8 8 8 8 8 3 2 !0.0Oil 13 17 21 23 24 25 27 6 7 1.7Gas 1 6 6 7 7 8 9 2 2 1.5Electricity 8 23 28 34 41 49 57 8 14 3.6Heat ! ! ! ! ! ! ! ! ! n.a.Biomass and waste 152 248 267 280 291 300 305 82 75 0.8Other renewables 0 0 0 0 0 1 1 0 0 11.1Other 15 26 28 30 32 33 35 100 100 1.2
Energy demand (Mtoe) Shares (%)
Africa: New Policies Scenario
© O
EC
D/IE
A, 2
011

Annex A - Tables for scenario projections 605
A
2020 2030 2035 2020 2030 2035CPS 450 CPS 450
TPED 799 897 945 765 815 838 100 100 1.4 0.9Coal 132 148 154 120 105 91 16 11 1.4 !0.6Oil 173 177 184 157 138 131 19 16 0.8 !0.5Gas 112 137 147 100 99 90 16 11 2.2 0.3Nuclear 3 8 9 3 21 33 1 4 3.8 9.2Hydro 12 18 21 13 20 24 2 3 3.6 4.1Biomass and waste 361 394 408 363 397 412 43 49 1.0 1.1Other renewables 6 14 22 8 35 58 2 7 11.2 15.5Power generation 185 225 250 171 197 214 100 100 2.3 1.7Coal 83 91 97 73 56 43 39 20 1.7 !1.5Oil 17 11 10 16 10 9 4 4 !2.5 !2.9Gas 61 75 79 51 43 29 32 14 2.5 !1.3Nuclear 3 8 9 3 21 33 4 15 3.8 9.2Hydro 12 18 21 13 20 24 8 11 3.6 4.1Biomass and waste 3 9 14 6 14 20 5 9 12.7 14.3Other renewables 5 13 21 8 34 56 8 26 11.2 15.5Other energy sector 103 112 115 100 103 103 100 100 0.9 0.5Electricity 14 17 18 13 15 15 16 15 2.2 1.5TFC 591 661 696 570 606 622 100 100 1.4 0.9Coal 23 23 23 22 20 19 3 3 0.7 !0.1Oil 152 171 181 137 131 127 26 20 1.5 0.1Gas 32 38 42 31 36 40 6 6 1.6 1.4Electricity 65 86 98 62 77 85 14 14 3.1 2.5Heat ! ! ! ! ! ! ! ! n.a. n.a.Biomass and waste 318 343 351 318 341 349 50 56 0.9 0.9Other renewables 0 1 1 0 1 2 0 0 11.7 14.8Industry 106 118 125 102 107 111 100 100 1.5 1.1Coal 13 13 13 13 11 10 11 9 1.0 !0.2Oil 14 15 16 12 11 11 13 10 0.9 !0.5Gas 17 19 21 16 18 20 17 18 1.7 1.5Electricity 27 31 33 25 27 28 27 26 2.1 1.4Heat ! ! ! ! ! ! ! ! n.a. n.a.Biomass and waste 36 39 41 36 39 41 33 37 1.5 1.6Other renewables ! ! ! ! ! ! ! ! n.a. n.a.Transport 99 113 120 90 86 82 100 100 1.6 0.2Oil 97 110 117 85 78 71 97 87 1.6 !0.3Electricity 1 1 1 1 1 2 1 2 1.4 5.3Biofuels 0 0 0 2 5 6 0 7 n.a. n.a.Other fuels 1 2 2 2 2 3 2 4 2.4 3.8Buildings 355 396 414 348 380 394 100 100 1.2 1.0Coal 8 8 8 8 7 7 2 2 0.1 !0.3Oil 23 26 28 22 24 25 7 6 1.9 1.5Gas 7 9 10 6 8 9 2 2 1.8 1.3Electricity 35 51 60 33 45 51 14 13 3.8 3.2Heat ! ! ! ! ! ! ! ! n.a. n.a.Biomass and waste 281 302 308 278 296 300 74 76 0.8 0.7Other renewables 0 0 1 0 1 1 0 0 9.4 13.0Other 30 34 36 30 33 35 100 100 1.3 1.2
Current Policies Scenario 450 Scenario
Energy demand (Mtoe) Shares (%) CAAGR (%)2035 2009!2035
Africa: Current Policies and 450 Scenarios
© O
EC
D/IE
A, 2
011

606 World Energy Outlook 2011 - ANNEXES
CAAGR (%)
1990 2009 2015 2020 2025 2030 2035 2009 2035 2009!2035Total generation 316 630 762 885 999 1 124 1 259 100 100 2.7Coal 165 250 291 321 328 330 327 40 26 1.0Oil 41 79 73 67 55 45 41 13 3 !2.5Gas 45 186 245 294 329 355 380 29 30 2.8Nuclear 8 13 13 13 32 53 59 2 5 6.1Hydro 56 98 120 148 183 222 266 16 21 3.9Biomass and waste 0 1 7 15 24 36 50 0 4 17.4Wind ! 2 6 10 16 25 41 0 3 13.1Geothermal 0 1 2 4 7 10 14 0 1 9.3Solar PV ! 0 2 6 13 24 38 0 3 32.3CSP ! ! 1 6 13 24 45 ! 4 n.a.Marine ! ! ! ! ! ! ! ! ! n.a.
CAAGR (%)
2009 2015 2020 2025 2030 2035 2009 2035 2009!2035Total capacity 141 185 210 238 272 313 100 100 3.1Coal 41 48 55 59 62 68 29 22 1.9Oil 24 28 27 23 20 18 17 6 !1.1Gas 47 69 74 80 86 91 33 29 2.6Nuclear 2 2 2 4 7 8 1 3 5.8Hydro 25 31 39 47 57 68 18 22 4.0Biomass and waste 1 2 3 5 6 8 1 3 9.0Wind 1 3 5 7 11 17 1 6 12.7Geothermal 0 0 1 1 2 2 0 1 10.0Solar PV 0 2 4 8 14 21 0 7 32.7CSP ! 0 2 3 6 11 ! 4 n.a.Marine ! ! ! ! ! ! ! ! n.a.
CAAGR (%)
1990 2009 2015 2020 2025 2030 2035 2009 2035 2009!2035Total CO2 545 928 1 054 1 127 1 154 1 165 1 170 100 100 0.9Coal 235 322 369 392 384 365 337 35 29 0.2Oil 248 426 481 500 513 527 545 46 47 1.0Gas 62 179 203 234 257 274 288 19 25 1.8Power generation 212 405 449 487 485 464 438 100 100 0.3Coal 152 246 279 299 292 272 246 61 56 !0.0Oil 35 62 57 51 41 33 30 15 7 !2.8Gas 25 97 113 136 151 159 163 24 37 2.0TFC 302 485 558 589 616 644 672 100 100 1.3Coal 83 76 90 91 91 90 89 16 13 0.6Oil 201 349 405 428 451 473 493 72 73 1.3Transport 105 230 270 287 305 322 337 47 50 1.5Gas 18 60 63 69 74 81 90 12 13 1.6
CO2 emissions (Mt) Shares (%)
Electricity generation (TWh) Shares (%)
Electrical capacity (GW) Shares (%)
Africa: New Policies Scenario
© O
EC
D/IE
A, 2
011

Annex A - Tables for scenario projections 607
A
2020 2030 2035 2020 2030 2035CPS 450 CPS 450
Total generation 912 1 181 1 341 863 1 051 1 157 100 100 3.0 2.4Coal 345 402 440 307 246 181 33 16 2.2 !1.2Oil 70 48 44 67 44 40 3 3 !2.2 !2.6Gas 307 402 439 265 236 177 33 15 3.4 !0.2Nuclear 13 32 34 13 81 126 3 11 3.8 9.2Hydro 142 206 245 154 232 277 18 24 3.6 4.1Biomass and waste 10 30 45 18 45 66 3 6 16.9 18.7Wind 10 21 28 12 48 97 2 8 11.5 16.9Geothermal 4 8 11 4 14 22 1 2 8.5 11.2Solar PV 6 18 27 10 39 61 2 5 30.6 34.8CSP 4 15 28 14 66 109 2 9 n.a. n.a.Marine ! ! ! ! 0 0 ! 0 n.a. n.a.
2020 2030 2035 2020 2030 2035CPS 450 CPS 450
Total capacity 214 282 323 216 298 369 100 100 3.3 3.8Coal 59 74 85 53 55 61 26 17 2.8 1.5Oil 27 20 18 27 20 18 6 5 !1.0 !1.0Gas 78 100 109 74 81 81 34 22 3.3 2.1Nuclear 2 4 5 2 11 17 1 5 3.5 8.8Hydro 37 53 63 40 60 72 19 19 3.6 4.2Biomass and waste 2 5 8 4 8 11 2 3 8.6 10.1Wind 5 9 12 5 21 42 4 11 11.1 16.6Geothermal 1 1 2 1 2 3 1 1 9.7 11.8Solar PV 4 11 16 6 22 34 5 9 31.2 35.2CSP 1 4 7 4 19 30 2 8 n.a. n.a.Marine ! ! ! ! 0 0 ! 0 n.a. n.a.
2020 2030 2035 2020 2030 2035CPS 450 CPS 450
Total CO2 1 165 1 284 1 352 1 045 818 675 100 100 1.5 !1.2Coal 415 448 468 372 198 98 35 15 1.4 !4.5Oil 508 545 570 458 418 400 42 59 1.1 !0.2Gas 241 292 313 215 202 177 23 26 2.2 !0.0Power generation 517 563 591 453 249 118 100 100 1.5 !4.6Coal 321 353 374 283 123 29 63 24 1.6 !7.9Oil 54 35 32 51 32 29 5 25 !2.5 !2.9Gas 142 175 185 119 94 61 31 51 2.5 !1.8TFC 595 661 697 543 520 508 100 100 1.4 0.2Coal 92 92 91 88 74 68 13 13 0.7 !0.4Oil 434 487 515 388 368 353 74 69 1.5 0.0Transport 288 328 347 253 230 212 50 42 1.6 !0.3Gas 69 82 91 67 78 87 13 17 1.6 1.4
Current Policies Scenario 450 Scenario
Current Policies Scenario 450 Scenario
CO2 emissions (Mt) Shares (%) CAAGR (%)2035 2009!2035
Current Policies Scenario 450 Scenario
Electrical capacity (GW) Shares (%) CAAGR (%)2035 2009!2035
Electricity generation (TWh) Shares (%) CAAGR (%)2035 2009!2035
Africa: Current Policies and 450 Scenarios
© O
EC
D/IE
A, 2
011

608 World Energy Outlook 2011 - ANNEXES
CAAGR (%)
1990 2009 2015 2020 2025 2030 2035 2009 2035 2009!2035TPED 333 538 644 700 743 787 829 100 100 1.7Coal 15 18 26 28 32 34 32 3 4 2.3Oil 150 233 266 268 268 269 271 43 33 0.6Gas 52 112 142 166 176 186 197 21 24 2.2Nuclear 2 6 7 11 14 17 18 1 2 4.6Hydro 30 58 65 71 78 84 91 11 11 1.8Biomass and waste 82 109 131 146 162 178 194 20 23 2.2Other renewables 1 3 6 9 13 19 26 1 3 8.6Power generation 66 134 157 175 190 206 225 100 100 2.0Coal 3 5 10 11 13 13 12 4 5 3.0Oil 14 26 22 18 14 11 10 20 5 !3.6Gas 14 29 38 45 45 46 49 22 22 2.0Nuclear 2 6 7 11 14 17 18 4 8 4.6Hydro 30 58 65 71 78 84 91 43 40 1.8Biomass and waste 2 8 9 12 15 18 23 6 10 4.2Other renewables 1 3 5 8 11 17 23 2 10 8.6Other energy sector 56 81 97 110 116 120 122 100 100 1.6Electricity 8 18 20 22 23 24 25 22 21 1.4TFC 253 410 493 530 562 598 630 100 100 1.7Coal 7 9 12 12 12 12 12 2 2 1.1Oil 122 189 223 229 233 238 240 46 38 0.9Gas 24 59 74 82 89 98 106 14 17 2.2Electricity 35 69 83 93 102 112 123 17 19 2.2Heat ! ! ! ! ! ! ! ! ! n.a.Biomass and waste 65 83 101 112 124 136 146 20 23 2.2Other renewables ! 0 1 1 2 2 3 0 1 8.4Industry 85 139 172 188 201 212 221 100 100 1.8Coal 6 9 11 12 12 12 11 6 5 1.0Oil 20 32 37 39 39 40 39 23 18 0.8Gas 15 30 39 43 47 51 55 22 25 2.4Electricity 16 29 36 41 44 47 50 21 23 2.1Heat ! ! ! ! ! ! ! ! ! n.a.Biomass and waste 27 40 49 54 58 62 65 28 29 1.9Other renewables ! ! ! ! ! ! ! ! ! n.a.Transport 71 128 158 166 175 187 198 100 100 1.7Oil 65 109 131 133 133 136 138 85 70 0.9Electricity 0 0 0 0 0 0 1 0 0 3.3Biofuels 6 13 21 26 33 40 46 10 23 4.9Other fuels 0 5 6 7 9 11 12 4 6 3.3Buildings 70 94 105 113 120 128 137 100 100 1.4Coal 0 0 0 0 0 0 0 0 0 2.1Oil 17 17 19 20 20 21 21 18 16 0.9Gas 6 12 14 15 16 18 19 12 14 2.0Electricity 17 38 44 49 54 60 66 41 48 2.1Heat ! ! ! ! ! ! ! ! ! n.a.Biomass and waste 29 27 28 28 28 27 27 28 19 !0.0Other renewables ! 0 1 1 2 2 3 0 2 8.4Other 27 49 58 63 67 71 74 100 100 1.6
Energy demand (Mtoe) Shares (%)
Latin America: New Policies Scenario
© O
EC
D/IE
A, 2
011

Annex A - Tables for scenario projections 609
A
2020 2030 2035 2020 2030 2035CPS 450 CPS 450
TPED 705 820 881 672 718 731 100 100 1.9 1.2Coal 31 41 41 26 26 24 5 3 3.3 1.2Oil 279 297 309 250 226 210 35 29 1.1 !0.4Gas 166 212 237 156 149 141 27 19 2.9 0.9Nuclear 11 12 13 11 17 18 2 2 3.5 4.7Hydro 71 82 88 72 86 92 10 13 1.6 1.8Biomass and waste 138 160 171 146 185 203 19 28 1.8 2.4Other renewables 8 16 21 11 29 43 2 6 7.7 10.6Power generation 177 217 245 171 187 197 100 100 2.3 1.5Coal 12 16 17 9 7 6 7 3 4.5 0.1Oil 20 13 12 15 6 5 5 3 !3.0 !6.0Gas 45 64 78 42 24 11 32 6 3.9 !3.5Nuclear 11 12 13 11 17 18 5 9 3.5 4.7Hydro 71 82 88 72 86 92 36 47 1.6 1.8Biomass and waste 11 15 18 12 21 26 7 13 3.4 4.7Other renewables 7 14 19 9 26 39 8 20 7.8 10.8Other energy sector 112 127 131 105 107 106 100 100 1.9 1.0Electricity 22 25 27 21 22 23 21 22 1.7 1.0TFC 533 619 665 509 551 563 100 100 1.9 1.2Coal 13 13 14 12 11 11 2 2 1.6 0.8Oil 238 264 276 214 202 187 41 33 1.5 !0.0Gas 82 100 111 79 91 98 17 17 2.4 2.0Electricity 94 119 133 91 105 112 20 20 2.5 1.9Heat ! ! ! ! ! ! ! ! n.a. n.a.Biomass and waste 105 121 129 112 139 151 19 27 1.7 2.3Other renewables 1 2 3 1 2 4 0 1 7.3 9.0Industry 189 220 235 182 203 209 100 100 2.0 1.6Coal 12 13 13 11 11 11 6 5 1.6 0.8Oil 40 43 45 37 37 36 19 17 1.3 0.4Gas 43 54 60 41 46 50 25 24 2.7 2.0Electricity 41 50 55 39 45 47 23 23 2.5 1.9Heat ! ! ! ! ! ! ! ! n.a. n.a.Biomass and waste 53 60 63 53 63 66 27 32 1.8 2.0Other renewables ! ! ! ! ! ! ! ! n.a. n.a.Transport 167 196 213 153 160 157 100 100 2.0 0.8Oil 139 157 166 120 107 94 78 60 1.6 !0.6Electricity 0 0 1 1 1 2 0 1 3.1 7.9Biofuels 20 28 34 26 41 48 16 31 3.6 5.0Other fuels 7 11 12 8 11 13 6 8 3.3 3.5Buildings 113 132 143 111 120 125 100 100 1.6 1.1Coal 0 0 0 0 0 0 0 0 2.3 1.9Oil 20 22 23 19 18 18 16 14 1.1 0.1Gas 15 18 20 15 17 18 14 14 2.2 1.7Electricity 50 63 71 48 54 57 49 46 2.4 1.6Heat ! ! ! ! ! ! ! ! n.a. n.a.Biomass and waste 28 27 27 28 28 28 19 22 !0.0 0.2Other renewables 1 2 3 1 2 4 2 3 7.3 9.0Other 63 71 75 62 69 72 100 100 1.7 1.5
Current Policies Scenario 450 Scenario
Energy demand (Mtoe) Shares (%) CAAGR (%)2035 2009!2035
Latin America: Current Policies and 450 Scenarios
© O
EC
D/IE
A, 2
011

610 World Energy Outlook 2011 - ANNEXES
CAAGR (%)
1990 2009 2015 2020 2025 2030 2035 2009 2035 2009!2035Total generation 489 1 009 1 194 1 337 1 456 1 581 1 717 100 100 2.1Coal 9 20 41 46 57 60 55 2 3 3.9Oil 64 127 106 87 71 57 53 13 3 !3.3Gas 45 135 208 254 265 276 294 13 17 3.1Nuclear 10 21 28 44 54 64 68 2 4 4.6Hydro 354 669 757 830 905 980 1 054 66 61 1.8Biomass and waste 7 32 38 46 56 68 81 3 5 3.7Wind ! 2 9 16 24 37 55 0 3 14.0Geothermal 1 3 5 7 9 12 16 0 1 6.5Solar PV ! 0 2 7 13 21 28 0 2 40.6CSP ! ! ! ! 2 7 12 ! 1 n.a.Marine ! ! ! ! ! ! ! ! ! n.a.
CAAGR (%)
2009 2015 2020 2025 2030 2035 2009 2035 2009!2035Total capacity 227 273 311 344 380 422 100 100 2.4Coal 4 7 8 10 11 10 2 2 3.2Oil 33 34 34 32 28 29 14 7 !0.5Gas 40 60 72 79 89 100 17 24 3.6Nuclear 3 4 6 7 9 9 1 2 4.5Hydro 142 157 172 187 203 218 62 52 1.7Biomass and waste 5 6 7 8 10 12 2 3 3.8Wind 1 4 6 9 14 20 0 5 12.6Geothermal 1 1 1 1 2 2 0 1 5.7Solar PV 0 2 5 9 14 18 0 4 74.2CSP ! ! ! 1 2 3 ! 1 n.a.Marine ! ! ! ! ! ! ! ! n.a.
CAAGR (%)
1990 2009 2015 2020 2025 2030 2035 2009 2035 2009!2035Total CO2 578 972 1 165 1 229 1 255 1 281 1 303 100 100 1.1Coal 47 67 104 110 116 117 110 7 8 1.9Oil 415 658 746 749 745 749 753 68 58 0.5Gas 116 247 316 370 394 415 440 25 34 2.2Power generation 90 176 205 211 207 200 199 100 100 0.5Coal 15 26 48 51 58 59 53 15 27 2.8Oil 44 82 67 55 44 35 32 47 16 !3.6Gas 32 68 90 105 105 107 114 39 57 2.0TFC 426 700 841 876 900 932 956 100 100 1.2Coal 29 39 52 53 53 53 52 6 5 1.1Oil 342 532 629 644 651 664 670 76 70 0.9Transport 193 326 390 396 397 406 412 47 43 0.9Gas 54 129 161 179 196 215 233 18 24 2.3
CO2 emissions (Mt) Shares (%)
Electricity generation (TWh) Shares (%)
Electrical capacity (GW) Shares (%)
Latin America: New Policies Scenario
© O
EC
D/IE
A, 2
011

Annex A - Tables for scenario projections 611
A
2020 2030 2035 2020 2030 2035CPS 450 CPS 450
Total generation 1 354 1 674 1 859 1 310 1 483 1 567 100 100 2.4 1.7Coal 54 77 81 39 31 25 4 2 5.5 0.9Oil 99 64 60 77 31 27 3 2 !2.9 !5.8Gas 264 410 495 226 150 65 27 4 5.1 !2.7Nuclear 42 47 51 43 67 70 3 4 3.5 4.7Hydro 823 957 1 023 841 1 000 1 072 55 68 1.6 1.8Biomass and waste 44 58 67 47 76 92 4 6 2.9 4.2Wind 16 31 40 17 65 110 2 7 12.5 17.0Geothermal 7 11 14 7 17 23 1 1 6.1 8.1Solar PV 5 16 21 8 34 60 1 4 39.1 44.7CSP ! 3 7 4 13 20 0 1 n.a. n.a.Marine ! ! ! ! 0 2 ! 0 n.a. n.a.
2020 2030 2035 2020 2030 2035CPS 450 CPS 450
Total capacity 312 389 434 304 379 431 100 100 2.5 2.5Coal 10 13 13 8 7 7 3 2 4.5 1.7Oil 34 29 29 31 25 25 7 6 !0.5 !1.1Gas 75 109 130 63 68 69 30 16 4.7 2.2Nuclear 6 7 7 6 9 9 2 2 3.5 4.7Hydro 170 198 212 174 207 222 49 52 1.6 1.7Biomass and waste 7 9 10 7 11 14 2 3 3.1 4.3Wind 6 11 14 7 24 41 3 9 11.1 15.7Geothermal 1 2 2 1 2 3 0 1 5.3 7.2Solar PV 4 11 15 6 21 36 3 8 72.6 78.8CSP ! 1 2 1 3 5 0 1 n.a. n.a.Marine ! ! ! ! 0 0 ! 0 n.a. n.a.
2020 2030 2035 2020 2030 2035CPS 450 CPS 450
Total CO2 1 275 1 451 1 545 1 143 1 010 921 100 100 1.8 !0.2Coal 121 140 143 101 75 63 9 7 2.9 !0.3Oil 783 837 871 693 614 560 56 61 1.1 !0.6Gas 372 475 532 349 320 298 34 32 3.0 0.7Power generation 226 265 296 189 102 64 100 100 2.0 !3.8Coal 59 75 76 44 28 21 26 33 4.3 !0.8Oil 63 39 37 48 18 16 12 26 !3.0 !6.0Gas 104 150 183 97 56 26 62 42 3.9 !3.6TFC 903 1 023 1 083 822 784 741 100 100 1.7 0.2Coal 56 59 60 52 43 38 6 5 1.7 !0.1Oil 668 742 777 598 552 503 72 68 1.5 !0.2Transport 415 468 494 357 319 280 46 38 1.6 !0.6Gas 179 221 246 173 189 201 23 27 2.5 1.7
Current Policies Scenario 450 Scenario
Current Policies Scenario 450 Scenario
CO2 emissions (Mt) Shares (%) CAAGR (%)2035 2009!2035
Current Policies Scenario 450 Scenario
Electrical capacity (GW) Shares (%) CAAGR (%)2035 2009!2035
Electricity generation (TWh) Shares (%) CAAGR (%)2035 2009!2035
Latin America: Current Policies and 450 Scenarios
© O
EC
D/IE
A, 2
011

612 World Energy Outlook 2011 - ANNEXES
CAAGR (%)
1990 2009 2015 2020 2025 2030 2035 2009 2035 2009!2035TPED 138 237 300 336 364 393 421 100 100 2.2Coal 10 11 16 16 16 15 14 5 3 1.0Oil 59 95 113 116 115 116 116 40 28 0.8Gas 3 17 34 50 59 66 76 7 18 5.9Nuclear 1 3 4 6 9 11 12 1 3 5.1Hydro 18 34 37 40 42 45 47 14 11 1.3Biomass and waste 48 76 95 106 121 135 147 32 35 2.6Other renewables ! 1 1 2 3 5 7 0 2 10.8Power generation 22 50 65 75 83 93 104 100 100 2.9Coal 1 3 6 5 5 4 4 5 4 1.5Oil 1 3 3 2 2 2 2 6 2 !2.1Gas 0 2 9 13 14 16 21 5 20 8.5Nuclear 1 3 4 6 9 11 12 7 12 5.1Hydro 18 34 37 40 42 45 47 68 46 1.3Biomass and waste 1 4 6 7 9 11 12 9 12 4.2Other renewables ! 0 1 1 2 3 5 0 5 16.3Other energy sector 26 40 51 62 67 68 69 100 100 2.1Electricity 3 9 10 11 12 12 13 21 19 1.8TFC 112 191 237 259 279 303 326 100 100 2.1Coal 4 5 6 6 7 7 7 3 2 1.3Oil 53 86 103 106 106 107 108 45 33 0.9Gas 2 10 15 18 23 28 34 5 10 5.0Electricity 18 35 43 48 53 58 65 18 20 2.4Heat ! ! ! ! ! ! ! ! ! n.a.Biomass and waste 34 55 70 79 90 102 112 29 34 2.7Other renewables ! 0 1 1 1 1 2 0 1 5.9Industry 40 71 91 102 113 123 133 100 100 2.4Coal 4 5 6 6 6 6 6 7 5 1.3Oil 8 12 15 15 15 16 16 17 12 1.0Gas 1 7 11 14 17 21 25 10 19 5.2Electricity 10 16 20 23 25 27 30 23 22 2.4Heat ! ! ! ! ! ! ! ! ! n.a.Biomass and waste 17 31 39 44 49 52 56 44 42 2.2Other renewables ! ! ! ! ! ! ! ! ! n.a.Transport 33 63 80 85 91 98 106 100 100 2.0Oil 27 48 59 60 59 59 59 76 55 0.8Electricity 0 0 0 0 0 0 0 0 0 4.4Biofuels 6 13 19 22 29 36 42 21 40 4.6Other fuels 0 2 2 2 3 4 5 3 5 3.9Buildings 23 34 37 40 43 47 50 100 100 1.6Coal 0 ! ! ! ! ! ! ! ! n.a.Oil 6 7 7 7 8 8 8 21 17 0.7Gas 0 0 1 1 1 1 1 1 3 5.1Electricity 8 17 21 23 25 28 32 52 63 2.3Heat ! ! ! ! ! ! ! ! ! n.a.Biomass and waste 9 8 8 8 8 8 7 25 15 !0.5Other renewables ! 0 1 1 1 1 2 1 4 5.9Other 16 24 29 31 33 35 37 100 100 1.8
Energy demand (Mtoe) Shares (%)
Brazil: New Policies Scenario
© O
EC
D/IE
A, 2
011

Annex A - Tables for scenario projections 613
A
2020 2030 2035 2020 2030 2035CPS 450 CPS 450
TPED 337 403 434 323 354 365 100 100 2.4 1.7Coal 18 18 17 15 11 10 4 3 1.7 !0.5Oil 119 130 134 108 93 84 31 23 1.3 !0.5Gas 52 81 95 45 48 49 22 13 6.8 4.2Nuclear 6 8 9 6 12 13 2 3 3.9 5.2Hydro 39 44 46 40 46 48 11 13 1.2 1.4Biomass and waste 101 119 127 106 139 153 29 42 2.0 2.7Other renewables 2 4 5 2 6 9 1 3 9.6 11.9Power generation 75 97 111 73 83 88 100 100 3.1 2.2Coal 6 6 5 5 1 1 5 1 2.8 !4.7Oil 2 2 2 2 1 1 2 1 !1.4 !4.2Gas 14 26 35 11 7 5 31 5 10.6 2.3Nuclear 6 8 9 6 12 13 8 14 3.9 5.2Hydro 39 44 46 40 46 48 42 55 1.2 1.4Biomass and waste 7 8 9 8 12 14 8 15 3.1 4.6Other renewables 1 3 4 1 5 7 4 9 14.9 17.8Other energy sector 63 72 72 58 60 59 100 100 2.3 1.5Electricity 11 13 14 11 11 12 20 20 2.0 1.2TFC 259 308 334 250 277 289 100 100 2.2 1.6Coal 7 7 8 6 6 6 2 2 1.8 0.6Oil 109 120 125 99 86 77 37 27 1.5 !0.4Gas 19 29 36 18 25 30 11 10 5.2 4.5Electricity 48 61 68 47 54 58 20 20 2.6 2.0Heat ! ! ! ! ! ! ! ! n.a. n.a.Biomass and waste 75 90 96 79 104 116 29 40 2.1 2.9Other renewables 1 1 2 1 1 2 0 1 5.4 6.1Industry 103 125 137 100 119 126 100 100 2.5 2.2Coal 6 7 7 6 6 5 5 4 1.8 0.6Oil 16 17 18 15 15 14 13 11 1.5 0.6Gas 14 22 27 14 19 22 20 18 5.4 4.7Electricity 23 28 31 22 26 28 23 22 2.6 2.1Heat ! ! ! ! ! ! ! ! n.a. n.a.Biomass and waste 44 51 54 44 53 56 39 45 2.1 2.3Other renewables ! ! ! ! ! ! ! ! n.a. n.a.Transport 84 99 107 78 81 82 100 100 2.1 1.1Oil 62 69 72 54 41 33 68 41 1.6 !1.3Electricity 0 0 0 0 0 1 0 1 4.2 7.7Biofuels 19 26 29 22 37 44 28 53 3.1 4.7Other fuels 2 4 5 2 3 4 5 5 4.0 3.3Buildings 41 48 53 40 42 44 100 100 1.8 1.0Coal ! ! ! ! ! ! ! ! n.a. n.a.Oil 7 8 9 7 6 6 16 13 0.9 !0.8Gas 1 1 2 1 1 1 3 3 5.3 4.4Electricity 23 30 34 23 25 27 64 61 2.6 1.6Heat ! ! ! ! ! ! ! ! n.a. n.a.Biomass and waste 8 8 7 8 8 8 14 19 !0.4 0.1Other renewables 1 1 2 1 1 2 3 4 5.4 6.1Other 31 36 37 31 35 37 100 100 1.8 1.7
Current Policies Scenario 450 Scenario
Energy demand (Mtoe) Shares (%) CAAGR (%)2035 2009!2035
Brazil: Current Policies and 450 Scenarios
© O
EC
D/IE
A, 2
011

614 World Energy Outlook 2011 - ANNEXES
CAAGR (%)
1990 2009 2015 2020 2025 2030 2035 2009 2035 2009!2035Total generation 223 466 573 647 709 781 866 100 100 2.4Coal 5 10 25 23 22 19 17 2 2 2.2Oil 5 15 12 10 9 8 9 3 1 !1.9Gas 1 13 59 85 94 107 136 3 16 9.4Nuclear 2 13 15 25 33 43 47 3 5 5.1Hydro 207 391 427 460 492 523 552 84 64 1.3Biomass and waste 4 23 29 34 40 45 50 5 6 3.0Wind ! 1 5 8 13 20 31 0 4 13.1Geothermal ! ! ! ! ! ! ! ! ! n.a.Solar PV ! ! 1 4 8 13 18 ! 2 n.a.CSP ! ! ! ! 0 3 6 ! 1 n.a.Marine ! ! ! ! ! ! ! ! ! n.a.
CAAGR (%)
2009 2015 2020 2025 2030 2035 2009 2035 2009!2035Total capacity 108 130 150 169 191 216 100 100 2.7Coal 2 4 4 4 4 4 2 2 2.0Oil 6 7 8 8 8 8 5 4 1.4Gas 9 18 25 31 37 48 8 22 6.7Nuclear 2 2 3 4 6 6 2 3 4.7Hydro 86 93 100 107 113 119 80 55 1.3Biomass and waste 3 4 4 5 6 7 3 3 3.4Wind 1 2 3 5 7 11 1 5 11.9Geothermal ! ! ! ! ! ! ! ! n.a.Solar PV ! 1 3 5 9 12 ! 6 n.a.CSP ! ! ! 0 1 1 ! 1 n.a.Marine ! ! ! ! ! ! ! ! n.a.
CAAGR (%)
1990 2009 2015 2020 2025 2030 2035 2009 2035 2009!2035Total CO2 194 338 452 493 510 525 545 100 100 1.9Coal 29 38 63 61 60 56 53 11 10 1.3Oil 159 261 310 316 315 317 318 77 58 0.8Gas 6 39 79 115 135 152 174 12 32 5.9Power generation 12 30 62 65 65 66 74 100 100 3.5Coal 8 14 32 29 26 23 20 47 27 1.4Oil 4 10 8 6 5 5 6 33 8 !2.1Gas 0 6 22 30 33 38 48 19 65 8.5TFC 167 280 346 363 372 387 401 100 100 1.4Coal 18 21 27 29 30 30 30 8 7 1.3Oil 144 237 284 292 291 293 294 85 73 0.8Transport 81 143 176 180 176 176 176 51 44 0.8Gas 4 22 34 42 52 64 78 8 19 5.0
CO2 emissions (Mt) Shares (%)
Electricity generation (TWh) Shares (%)
Electrical capacity (GW) Shares (%)
Brazil: New Policies Scenario
© O
EC
D/IE
A, 2
011

Annex A - Tables for scenario projections 615
A
2020 2030 2035 2020 2030 2035CPS 450 CPS 450
Total generation 651 817 917 637 727 772 100 100 2.6 2.0Coal 28 26 25 20 5 3 3 0 3.6 !4.0Oil 10 10 11 8 5 5 1 1 !1.2 !3.9Gas 92 174 230 70 46 28 25 4 11.6 2.9Nuclear 24 31 35 25 45 48 4 6 3.9 5.2Hydro 455 510 536 464 530 559 59 72 1.2 1.4Biomass and waste 32 38 40 35 49 55 4 7 2.2 3.4Wind 8 16 20 9 24 41 2 5 11.3 14.4Geothermal ! ! ! ! ! ! ! ! n.a. n.a.Solar PV 3 10 14 5 16 24 2 3 n.a. n.a.CSP ! 2 4 1 6 9 0 1 n.a. n.a.Marine ! ! ! ! 0 1 ! 0 n.a. n.a.
2020 2030 2035 2020 2030 2035CPS 450 CPS 450
Total capacity 150 192 218 145 176 194 100 100 2.7 2.3Coal 5 4 4 4 3 3 2 1 2.6 0.8Oil 8 8 8 7 6 6 4 3 1.5 0.1Gas 26 47 61 19 19 19 28 10 7.7 3.0Nuclear 3 4 5 3 6 6 2 3 3.7 4.9Hydro 99 111 116 101 115 121 53 62 1.2 1.3Biomass and waste 4 5 5 4 6 7 2 4 2.4 3.8Wind 3 6 7 3 9 15 3 8 10.0 13.0Geothermal ! ! ! ! ! ! ! ! n.a. n.a.Solar PV 2 7 10 3 11 15 5 8 n.a. n.a.CSP ! 0 1 0 1 2 0 1 n.a. n.a.Marine ! ! ! ! 0 0 ! 0 n.a. n.a.
2020 2030 2035 2020 2030 2035CPS 450 CPS 450
Total CO2 516 611 657 453 380 343 100 100 2.6 0.1Coal 68 68 66 57 31 26 10 8 2.1 !1.5Oil 327 358 373 293 243 212 57 62 1.4 !0.8Gas 121 184 217 103 106 105 33 31 6.8 3.9Power generation 74 98 117 56 26 18 100 100 5.4 !2.0Coal 34 31 28 26 6 4 24 22 2.7 !4.8Oil 6 6 7 5 3 3 6 18 !1.4 !4.2Gas 33 61 81 25 17 11 70 60 10.6 2.3TFC 375 431 461 339 300 277 100 100 1.9 !0.0Coal 30 33 34 28 22 19 7 7 1.8 !0.4Oil 302 332 346 271 225 195 75 70 1.5 !0.7Transport 188 207 216 162 123 100 47 36 1.6 !1.3Gas 43 66 82 41 54 63 18 23 5.2 4.1
Current Policies Scenario 450 Scenario
Current Policies Scenario 450 Scenario
CO2 emissions (Mt) Shares (%) CAAGR (%)2035 2009!2035
Current Policies Scenario 450 Scenario
Electrical capacity (GW) Shares (%) CAAGR (%)2035 2009!2035
Electricity generation (TWh) Shares (%) CAAGR (%)2035 2009!2035
Brazil: Current Policies and 450 Scenarios
© O
EC
D/IE
A, 2
011

© O
EC
D/IE
A, 2
011

Annex B - Policies and measures by scenario 617
ANNEX B
POLICIES AND MEASURES BY SCENARIO
TheWorld Energy Outlook-2011 presents projections for three scenarios. The Current PoliciesScenario includesall policies inplaceandsupported throughenactedmeasuresasofmid-2011.Anumber of the policy commitments andplans thatwere included in theNewPolicies Scenario inWEO-2010 have since been enacted, so are now included in the Current Policies Scenario in thisOutlook. Someof the policiesmodelled under the Current Policies Scenario include:
! China’s 12th Five-Year Plan for the period 2011 to 2015;
! a new scheme that enables trading of renewable energy certificates and a newprogramme of support for alternative fuel vehicles in India;
! new European Union (EU) directives covering the energy performance of buildings andemissions standards for light-commercial vehicles;
! new appliance standards in the United States;
! early retirement of all nuclear plants in Germany by the end of 2022;
! no lifetime extension for existing nuclear plants and no new ones in Switzerland;
! and an emissions trading scheme (ETS) in New Zealand from 2010.
The New Policies Scenario is based on broad policy commitments and plans that havebeen announced by countries around the world to address energy security, climate changeand local pollution, and other pressing energy-related challenges, even where the specificmeasures to implement these commitments have yet to be announced. More specifically,the New Policies Scenario takes into account all policies and measures included in theCurrent Policies Scenario, as well as the following:
! Cautious implementation of recently announced commitments and plans, including theCancun Agreements.
! Continuation of an ETS in Europe and New Zealand; introduction of CO2 pricing throughtaxes/ETS in Australia from mid-2012, in Korea from 2015 and in China from 2020.Shadow price of carbon adopted from 2015 in Canada, Japan and the United States,influencing solely new investment decisions in power generation. Access to internationaloffset credits is assumed for all countries participating in an ETS.
! Phase-out of fossil-fuel consumption subsidies in all net-importing regions by 2020 (and,as in the Current Policies Scenario, in net-exporting regions where specific policies havealready been introduced).
© O
EC
D/IE
A, 2
011

618 World Energy Outlook 2011 - ANNEXES
! Extension by five years of the nuclear plant lifetimes assumed in the Current PoliciesScenario, in those countries that have confirmed their intention to continue or expandthe use of nuclear energy, accounting for about 50% of the plants currently in operation.
! Extended support for renewables-based electricity-generation technologies and biofuelsfor transport.
! Heavy-duty vehicle fuel efficiency standards in the United States; light-commercialvehicle and passenger light-duty vehicle (PLDV) emissions per kilometre targets in theEuropean Union; PLDV fuel efficiency standards in India and China.
! For 2020 to 2035, additional measures that maintain the pace of the global declinein carbon intensity – measured as emissions per dollar of gross domestic product, inpurchasing power parity terms – established in the period 2009 to 2020.
The 450 Scenario sets out an energy pathway that is consistent with a 50% chance ofmeeting the goal of limiting the increase in average global temperature to 2°C comparedwith pre-industrial levels. For the period to 2020, the 450 Scenario assumes more vigorouspolicy action to implement fully the Cancun Agreements than is assumed in the NewPoliciesScenario (which assumes cautious implementation). After 2020, OECD countries andother major economies are assumed to set economy-wide emissions targets for 2035 andbeyond that collectively ensure an emissions trajectory consistent with stabilisation of thegreenhouse-gas concentration at 450 parts per million. In addition, the 450 Scenario alsoincludes the following specific policies:
! Implementation of the high-end of the range of the commitments arising from theCancun Agreements, where they are expressed as ranges.
! Strengthening of the ETS in Europe, and staggered introduction of CO2 pricing throughtaxes or ETS, at latest by 2025 in all OECD countries and, from 2020, in China (withhigher CO2 pricing than the New Policies Scenario), Russia, Brazil and South Africa.Access to international offset credits is assumed for all countries participating in an ETS.
! International sectoral agreements for the iron and steel, and the cement industries.
! International agreements on fuel-economy standards for PLDVs, aviation and shipping.
! National policies and measures, such as efficiency standards for buildings and labellingof appliances.
! The complete phase-out of fossil-fuel consumption subsidies in all net-importing regionsby 2020 (at the latest) and in all net-exporting regions by 2035 (at the latest), except for theMiddle Eastwhere it is assumed that the average subsidisation rate declines to 20%by 2035.
! Extension by five years of the nuclear plant lifetimes assumed in the New PoliciesScenario, in those countries that have confirmed their intention to continue or expandthe use of nuclear energy, accounting for about 75% of the plants currently in operation.
! Further strengthening (compared to the New Policies Scenario) of support forrenewables-based electricity-generation technologies and biofuels for transport.
© O
EC
D/IE
A, 2
011

Annex B - Policies and measures by scenario 619
B
The specific policies adopted for different sectors by selected countries and regions forthe Current Policies, New Policies and 450 Scenarios are outlined below. The policies arecumulative. That is, measures listed under the New Policies Scenario supplement thoseunder the Current Policies Scenario andmeasures listed under the 450 Scenario supplementthose under the New Policies Scenario.
© O
EC
D/IE
A, 2
011

620
World
EnergyO
utlook2011
-ANN
EXES
Table B.1 " Power sector policies and measures as modelled by scenario in selected regions
Current Policies Scenario New Policies Scenario 450 Scenario
OECD
United States – State-level support for renewables.– American Recovery and Reinvestment Act (2009): taxcredits for renewable and other clean energy sources,prolonged over the entire projection period.
– Lifetimes of US nuclear plants extended beyond60 years.
– Shadow price of carbon adopted for investmentdecisions from 2015.
– EPA regulations including Maximum Achievable ControlTechnology (MACT) for mercury and other pollutants.
– Extension of support for nuclear, including loanguarantees.
– Funding for CCS (demonstration-scale).
– Shadow price for investment decisions from 2015 to2019; CO2 pricing implemented from 2020.
– Extended support to renewables, nuclear and CCS.
Japan – Support for renewable generation.– Decommissioning of units 1-4 and no construction ofnew units at the Fukushima Daiichi site.
– Strategic Energy Plan1:– Increasing share of renewable energy to 10% by 2020;– Shift to more advanced coal power generationtechnologies.
– Shadow price of carbon adopted for investmentdecisions from 2015.
– Shadow price for investment decisions from 2015 to2019; CO2 pricing implemented from 2020.
– Strategic Energy Plan1:– Share of low-carbon electricity generation to increaseby 2020 and expand further by 2030;
– Expansion of renewables support;– Introduction of CCS to coal-fired power generation.
European Union – Climate and Energy Package:– Emissions Trading System;– Support for renewables sufficient to reach 20% share ofenergy demand in 2020;
– Financial support for CCS, including use of credits fromthe ETS New Entrants’ Reserve;
– Early retirement of all nuclear plants in Germany by theend of 2022.
– Extended support to renewable-based electricity-generation technologies.
– Emissions Trading System strengthened in line withthe 2050 roadmap.
– Reinforcement of government support in favour ofrenewables.
– Expanded support measures for CCS.
Notes: CCS = carbon capture and storage; FiT = feed-in tariffs.
1. Following the Great East Japan Earthquake, Japan is undertaking a full review of its Strategic Energy Plan with results expected in 2012.
© OECD/IEA, 2011

AnnexB
-Policiesand
measures
byscenario
62
1
B
Table B.1 " Power sector policies and measures as modelled by scenario in selected regions (continued)
Current Policies Scenario New Policies Scenario 450 Scenario
Non-OECD
Russia – Competitive wholesale electricity market. – State support to the nuclear and hydropower sectors;a support mechanism for non-hydro renewablesintroduced from 2014.
– CO2 pricing implemented from 2020.– Stronger support for nuclear power and renewables.
China – Implementation of measures in 12th Five-Year Plan; solaradditions of 5 GW by 2015; wind additions of 70 GW by2015 and start construction of 120 GW of hydropowerby 2015. Delays in nuclear capacity additions resultingfrom the temporary suspension of approval for newprojects.
– A 15% share of non-fossil energy in total energy supplyby 2020.
– CO2 pricing implemented from 2020.– Nuclear capacity target of 70 to 80 GW by 2020.– 100 GW installed wind capacity by 2015, 150 GWinstalled wind capacity by 2020.
– Subsidies for building-integrated photovoltaic (PV)projects.
– Solar FiT for utility-scale solar PV plants.– Local pollution reduction goals.
– Higher CO2 pricing.– Enhanced support for renewables.– Continued support to nuclear capacity additions post2020.
– Deployment of CCS from around 2020.
India – Renewable Energy Certificate trade for all eligible grid-connected renewable-based electricity-generationtechnologies.
– Achievement of the national solar mission phase oneand phase two targets (an additional 4 GW by 2017).
– Increased use of supercritical coal technology.
– Various renewable energy support policies and targets,including small hydro.
– Achievement of the national solar mission target of20 GW of solar PV capacity by 2022.
– Renewables (excluding large hydro) to reach 15% ofinstalled capacity by 2020.
– Support to renewables, nuclear and efficient coal.– Deployment of CCS from around 2020.
Brazil – Increase of wind, biomass, solar and hydro (small andlarge) capacity.
– Enhanced deployment of renewables technologies. – CO2 pricing implemented from 2020.– Further increases of generation from renewable sources.
© OECD/IEA, 2011

622
World
EnergyO
utlook2011
-ANN
EXES
Table B.2 " Transport sector policies and measures as modelled by scenario in selected regions
- Current Policies Scenario New Policies Scenario 450 Scenario
OECD OECD
United States – CAFE standards: 35.5 miles-per-gallon for PLDVs by2016, and further strengthening thereafter.
– Renewable Fuel Standard.
– New heavy-duty vehicle standards for eachmodel year from 2014 to 2018.
– Renewable Fuel Standard.– Support to natural gas in road freight.– Increase of ethanol blending mandates.
On-road emission targets forPLDVs in 2035
Light-commercial vehicles
Medium- and heavy-freighttraffic
Aviation
Other sectors such asmaritime and rail
Fuels
Alternative clean fuels
65 g CO2/km
Full technology spill-over fromPLDVs.
20% more efficient by 2035 thanin NPS.
45% efficiency improvements by2035 (compared to 2010) andsupport for the use of biofuels.
National policies and measures.
Retail fuel prices kept at a levelsimilar to Current Policies Scenario.
Enhanced support to alternative fuels.
Japan – Top Runner Program: improvement in fuel efficiencyof PLDVs by 23.5% by 2015 compared to 2004.
– Promotion of demand-side measures such asintelligent transport systems and modal shifts.
– Fiscal incentives for hybrid and electric vehicles.
– Promotion of modal shift.– Target shares of new car sales according toNext Generation Vehicle Strategy 2010:
2020 2030
ConventionalICE vehicles 50%-80% 30%-50%
Hybrid vehicles 20%-30% 30%-40%
Electric vehiclesand plug-in hybrids 15%-20% 20%-30%
Fuel cell vehicles <1% <3%
Clean diesel vehicles <5% 5%-10%
EuropeanUnion
– Climate and Energy Package: renewable energy toreach 10% share of transport energy demand in2020.
– Emissions Trading System to include aviation from2012.
– Climate and Energy Package: CO2 emission standardsfor PLDVs by 2020 (120 to 130 g CO2/km).
– Support to biofuels.
– Emissions Trading System.–More stringent emission target for PLDVs(95 g CO2/km by 2020), and furtherstrengthening post 2020.
– Emission target for light-commercialvehicles (135 g CO2/km by 2020), and furtherstrengthening post 2020.
– Road map on transport: CO2-free citylogistics in major urban centres by 2030.
– Enhanced support to alternative fuels.
© OECD/IEA, 2011

AnnexB
-Policiesand
measures
byscenario
62
3
B
Table B.2 " Transport sector policies and measures as modelled by scenario in selected regions (continued)
- Current Policies Scenario New Policies Scenario 450 Scenario
Non-OECD Non-OECD
China – Subsidies for hybrid and electric vehicles.– Promotion for fuel efficient cars.– Ethanol blending mandates 10% in selectedprovinces.
– Fuel economy standard for PLDVs(7 litres/100 km) by 2015, and furtherstrengthening post 2015.
– Extended subsidies on the purchaseof alternative vehicles.
– Increased biofuels blending.
On-road emission targetsfor PLDVs in 2035
Light-commercial vehicles
Medium- andheavy-freight vehicles
Aviation
Other sectors such asmaritime and rail
Fuels
Alternative clean fuels
100 g CO2/km
Full technology spill-over from PLDVs.
20% more efficient by 2035 thanin NPS.
45% efficiency improvements by2035 (compared to 2010) andsupport for the use of biofuels.
National policies and measures.
Retail fuel prices kept at a levelsimilar to Current Policies Scenario.
Enhanced support for alternativefuels.
India – Support for alternative fuel vehicles. – Extended support for alternative fuelvehicles.
– Proposed auto fuel efficiency standards.– Increased utilisation of natural gas in roadtransport.
Brazil – Ethanol targets in road transport 20% to 25%. – Increase of ethanol blending mandates.
Notes: CAFE = corporate average fuel economy; PLDVs = passenger light-duty vehicles; ICE = internal combustion engines.
© OECD/IEA, 2011

624
World
EnergyO
utlook2011
-ANN
EXES
Table B.3 " Industry sector policies and measures as modelled by scenario in selected regions
Current Policies Scenario New Policies Scenario 450 Scenario
OECD OECD
United States – Support for high-energy efficiency technologies. – Tax reduction and funding for efficient technologies.– R&D in low-carbon technologies.
– CO2 pricing introduced from 2025, at the latest, in allcountries.
– International sectoral agreements with targets for iron,steel and cement industries.
– Enhanced energy efficiency standards.– Policies to support the introduction of CCS in industry.
Japan – Long-Term Outlook on Energy Supply and Demand (2009),including reforms in steel manufacturing and chemicalindustry technology.
–Maintenance and strengthening of top-end/low-carbonefficiency standards by:– Higher efficiency combined heat and power systems;– Promotion of state-of-the-art technology and fasterreplacement of aging equipments;
– Fuel switching to gas.EuropeanUnion – Emissions Trading System. – Directive on energy end-use efficiency and energy efficiency,
including the development of:– Inverters for electric motors;– High-efficiency co-generation;–Mechanical vapour compression;– Innovations in industrial processes.
© OECD/IEA, 2011

AnnexB
-Policiesand
measures
byscenario
62
5
B
Table B.3 " Industry sector policies and measures as modelled by scenario in selected regions (continued)
Current Policies Scenario New Policies Scenario 450 Scenario
Non-OECD Non-OECD
Russia – Competitive wholesale electricity market price forindustry.
– Improvements in energy efficiency.– Industrial gas prices reach the equivalent of export prices(minus taxes and transportation) in 2020.
– Elaboration of comprehensive federal and regionallegislation on energy savings.
– CO2 pricing introduced as of 2020 in Russia, China, Braziland South Africa.
–Wider hosting of international offset projects.– International sectoral agreements with targets for iron,steel and cement industries.
– Enhanced energy-efficiency standards.– Policies to support the introduction of CCS in industry.China – Priority given to gas use to 2015 (12th Five-Year plan).
– Scrapping of small, energy-inefficient plants.– CO2 pricing implemented from 2020.– Contain the expansion of energy-intensive industries.– Enhanced use of Energy Service Companies and energyperformance contracting.
India – National Mission for Enhanced Energy Efficiency, targetinga 5% reduction in energy use by 2015 (compared to 2010).
– Further implementation of National Mission for EnhancedEnergy Efficiency recommendations including:– Enhancement of cost-effective improvements in energyefficiency in energy-intensive large industries andfacilities, through certification of energy savings thatcould be traded;
– Creation of mechanisms that would help financedemand-side management programmes by capturingfuture energy savings;
– Development of fiscal instruments to promote energyefficiency.
Brazil – Encourage investment and R&D in energy efficiency. –More use of charcoal in iron production to substitute forcoal.
– Implementation of measures included in the 2010 energyefficiency state programme.
Note: R&D = research and develpment.
© OECD/IEA, 2011

626
World
EnergyO
utlook2011
-ANN
EXES
Table B.4 " Buildings sector policies and measures as modelled by scenario in selected regions
Current Policies Scenario New Policies Scenario 450 Scenario
OECD
United States – AHAM-ACEEE Multi-Product Standards Agreement.– American Recovery and Reinvestment Act (2009): Fundingenergy efficiency and renewables.
– Energy Star: Federal Tax Credits for Consumer EnergyEfficiency; new appliance efficiency standards.
– Energy Improvement and Extension Act of 2008.
– Extensions to 2025 of tax credit for energy-efficientequipment (including furnaces, boilers, air conditioners,air and ground source heat pumps, water heaters andwindows), and for solar PV and solar thermal waterheaters.
– Budget proposals 2011: institute programmes to makecommercial buildings 20% more efficient by 2020; taxcredit for renewable energy deployment.
–More stringent mandatory building codes by 2020.– Extension of energy-efficiency grants to end of projectionperiod.
– Zero-energy buildings initiative.
Japan – Long-Term Outlook on Energy Supply and Demand (2009):Energy savings using demand-side management.
– Basic Energy Plan 2010: Promotion of energy efficientappliances and equipment.
– Strategic Energy Plan:2– Environmental Efficiency (CASBEE) for all buildings by 2030;– High-efficiency lighting: 100% of purchases by 2020;100% in use by 2030;
– Deployment of high-efficiency heating, cooling and waterheating systems;
– Net zero-energy buildings by 2030 for new construction;– Increased introduction of gas and renewable energy;
– Net zero-energy buildings by 2025 for new construction.–Mandatory standards for high-efficiency heating, coolingand water heating systems.
European Union – Energy Performance of Buildings Directive.– New EU-US Energy Star Agreement: energy labelling ofappliances.
– Nearly zero-energy buildings standards mandatory for newpublic buildings in the EU after 2018 and all new homesand offices from 2020.
– Zero-carbon footprint for all new buildings as of 2018.– Enhanced energy efficiency in all existing buildings.
Notes: AHAM = Association of Home Appliance Manufacturers; ACEEE = American Council for an Energy-Efficient Economy; CASBEE = Comprehensive Assessment System for Built EnvironmentEfficiency.
2. Following the Great East Japan Earthquake, Japan is undertaking a full review of its Strategic Energy Plan with results expected in 2012.
© OECD/IEA, 2011

AnnexB
-Policiesand
measures
byscenario
62
7
B
Table B.4 " Buildings sector policies and measures as modelled by scenario in selected regions (continued)
Current Policies Scenario New Policies Scenario 450 Scenario
Non-OECD
Russia – Implementation of 2009 energy efficiency legislation. – Gradual above-inflation increase in residential electricityand gas prices.
– New building codes, meter installations and refurbishmentprogrammes, leading to efficiency gains in space heating(relative to Current Policies Scenario).
– Efficiency standards for appliances.
– Faster liberalisation of gas and electricity prices.– Extension and reinforcement of all measures included inthe 2010 energy efficiency state programme; mandatorybuilding codes by 2030 and phase out inefficient lightingequipment and appliances by 2030.
China – Civil Construction Energy Conservation Design Standard.–Minimum Energy Performance Standards for selecteddevices.
– Civil Construction Energy Conservation Design Standard:heating energy consumption per unit area of existingbuildings to be reduced by 65% in cold and very coldregions; 50% in hot-in-summer and cold-in-winter regionscompared to 1980/1981 level; new buildings to have 65%improvement in all regions.
– Energy Price Policy (reform heating price to be based onactual consumption, rather than on living area supplied).
–Mandatory energy efficiency labels for refrigerators andair conditioners.
–More stringent implementation of Civil ConstructionEnergy Conservation Design Standard.
–Mandatory energy efficiency labels for all appliances andalso for building shell.
India –Measures under national solar mission. –Mandatory minimum efficiency requirements and labellingrequirements for all equipment and appliances by 2035.
– Phase out of incandescent light bulbs by 2025.
–Mandatory energy conservation standards and labellingrequirements for all equipment and appliances by 2030.
– Increased penetration of energy-efficient lighting.
© OECD/IEA, 2011

© O
EC
D/IE
A, 2
011

Annex C - Units, definitions, regional and country groupings, abbreviations and acronyms 629
ANNEX C
UNITS, DEFINITIONS, REGIONAL AND COUNTRYGROUPINGS, ABBREVIATIONS AND ACRONYMS
This annex provides general information on terminology used throughout WEO-2011including: units and general conversion factors; definitions on fuels, processes and sectors;regional and country groupings; and, abbreviations and acronyms.
UnitsArea Ha hectare
GHa giga-hectare (1 hectare x 109)
km2 square kilometre
Coal Mtce million tonnes of coal equivalent
Emissions ppm parts per million (by volume)
Gt CO2-eq gigatonneof carbon-dioxideequivalent (using100-yearglobal warming potentials for different greenhousegases)
kg CO2-eq kilogramme of carbon-dioxide equivalent
g CO2/km grammes of carbon dioxide per kilometre
g CO2/kWh grammes of carbon dioxide per kilowatt-hour
Energy Mtce million tonnes of coal equivalent (equals 0.7 Mtoe)
boe barrel of oil equivalent
Mboe million barrels of oil equivalent
toe tonne of oil equivalent
Mtoe million tonnes of oil equivalent
MBtu million British thermal units
kcal kilocalorie (1 calorie x 103)
Gcal gigacalorie (1 calorie x 109)
MJ megajoule (1 joule x 106)
GJ gigajoule (1 joule x 109)
TJ terajoule (1 joule x 1012)
PJ petajoule (1 joule x 1015)
kWh kilowatt-hour
MWh megawatt-hour
© O
EC
D/IE
A, 2
011

630 World Energy Outlook 2011 - ANNEXES
GWh gigawatt-hour
TWh terawatt-hour
Gas mcm million cubic metres
bcm billion cubic metres
tcm trillion cubic metres
scf standard cubic foot
Mass kg kilogramme (1 000 kg = 1 tonne)
kt kilotonne (1 tonne x 103)
Mt million tonnes (1 tonne x 106)
Gt gigatonne (1 tonne x 109)
Monetary $ million 1 US dollar x 106
$ billion 1 US dollar x 109
$ trillion 1 US dollar x 1012
Oil b/d barrels per day
kb/d thousand barrels per day
mb/d million barrels per day
mpg miles per gallon
Power W watt (1 joule per second)
kW kilowatt (1Watt x 103)
MW megawatt (1Watt x 106)
GW gigawatt (1Watt x 109)
GWth gigawatt thermal (1Watt x 109)
TW terawatt (1Watt x 1012)
General conversion factors for energyConvert tooo: TJ Gcal Mtoe MBtu GWh
From: multiply by:
TJ 1 238.8 2.388 x 10⁻⁵ 947.8 0.2778
Gcal 4.1868 x 10⁻³ 1 10-7 3.968 1.163 x 10⁻³
Mtoe 4.1868 x 10⁴ 107 1 3.968 x 10⁷ 11 630
MBtu 1.0551 x 10⁻³ 0.252 2.52 x 10⁻⁸ 1 2.931 x 10⁻⁴
GWh 3.6 860 8.6 x 10⁻⁵ 3 412 1
© O
EC
D/IE
A, 2
011

Annex C - Units, definitions, regional and country groupings, abbreviations and acronyms 631
C
Definitions
Advanced biofuels
Advanced biofuels comprise different emerging and novel conversion technologies that arecurrently in the research and development, pilot or demonstration phase. This definitiondiffers from the one used for “Advanced Biofuels” in the US legislation, which is based on aminimum 50% lifecycle greenhouse-gas reduction and which, therefore, includes sugar caneethanol.
Advanced biomass cookstoves
Advanced biomass cookstoves are biomass gasifier-operated cooking stoves that run onsolid biomass, such as wood chips and briquettes. These cooking devices have significantlylower emissions and higher efficiencies than the traditional biomass cookstoves (three-stonefires) currently used largely in developing countries.
Agriculture
Agriculture includes all energy used on farms, in forestry and for fishing.
Biodiesel
Biodiesel is a diesel-equivalent, processed fuelmade from the transesterification (a chemicalprocess which removes the glycerine from the oil) of both vegetable oils and animal fats.
Biofuels
Biofuels are fuels derived from biomass or waste feedstocks and include ethanol andbiodiesel. They can be classified as conventional and advanced biofuels according to thetechnologies used to produce them and their respective maturity.
Biogas
Biogas is amixture ofmethane and CO2 produced by bacterial degradation of organicmatterand used as a fuel.
Biomass and waste
Biomassandwaste includes solidbiomass, gasand liquidsderived frombiomass, industrialwasteand the renewable part ofmunicipalwaste. Includes both traditional andmodern biomass.
Biomass-to-liquids
Biomass-to-liquids (BTL) refers to a process featuring biomass gasification into syngas (amixture of hydrogen and carbon monoxide) followed by synthesis of liquid products (suchas diesel, naphtha or gasoline) from the syngas using Fischer-Tropsch catalytic synthesis ora methanol-to-gasoline reaction path. The process is similar to those used in coal-to-liquidsor gas-to-liquids.
© O
EC
D/IE
A, 2
011

632 World Energy Outlook 2011 - ANNEXES
Brown coal
Brown coal includes lignite and sub-bituminous coal where lignite is defined asnon-agglomerating coal with a gross calorific value less than 4 165 kilocalories perkilogramme (kcal/kg) and sub-bituminous coal is defined as non-agglomerating coal with agross calorific value between 4 165 kcal/kg and 5 700 kcal/kg.
Buildings
Buildings includes energy used in residential, commercial and institutional buildings. Buildingenergy use includes space heating and cooling, water heating, lighting, appliances andcooking equipment.
Bunkers
Bunkers includes both international marine bunkers and international aviation bunkers.
Capacity credit
Capacity credit refers to the proportion of capacity that can be reliably expected to generateelectricity during times of peak demand in the grid to which it is connected.
Clean coal technologies
Clean coal technologies (CCTs) are designed to enhance the efficiency and the environmentalacceptability of coal extraction, preparation and use.
Coal
Coal includes both primary coal (including hard coal and brown coal) and derived fuels(including patent fuel, brown-coal briquettes, coke-oven coke, gas coke, gas-works gas,coke-oven gas, blast-furnace gas and oxygen steel furnace gas). Peat is also included.
Coalbed methane
Coalbedmethane (CBM), found in coal seams, is a source of unconventional natural gas.
Coal-to-liquids
Coal-to-liquids (CTL) refers to the transformation of coal into liquid hydrocarbons. It can beachieved through either coal gasification into syngas (a mixture of hydrogen and carbonmonoxide), combined with Fischer-Tropsch or methanol-to-gasoline synthesis to produceliquid fuels, or through the less developed direct-coal liquefaction technologies inwhich coalis directly reacted with hydrogen.
© O
EC
D/IE
A, 2
011

Annex C - Units, definitions, regional and country groupings, abbreviations and acronyms 633
C
Coking coal
Coking coal is a type of hard coal that can be used in the production of coke, which is capableof supporting a blast furnace charge.
Condensates
Condensates are liquid hydrocarbonmixtures recovered from associated or non-associatedgas reservoirs. They are composed of C5 and higher carbon number hydrocarbons andnormally have an API gravity between 50° and 85°.
Conventional biofuels
Conventional biofuels include well-established technologies that are producing biofuelson a commercial scale today. These biofuels are commonly referred to as first-generationand include sugar cane ethanol, starch-based ethanol, biodiesel, Fatty Acid Methyl Esther(FAME) and Straight Vegetable Oil (SVO). Typical feedstocks used in thesemature processesinclude sugar cane and sugar beet, starch bearing grains, like corn and wheat, and oil crops,like canola and palm, and in some cases animal fats.
Electricity generation
Electricity generation is defined as the total amount of electricity generated by power onlyor combined heat and power plants including generation required for own use. This is alsoreferred to as gross generation.
Ethanol
Although ethanol can be produced from a variety of fuels, in this book, ethanol refers tobio-ethanol only. Ethanol is produced from fermenting any biomass high in carbohydrates.Today, ethanol is made from starches and sugars, but second generation technologies willallow it to bemade from cellulose and hemicellulose, the fibrousmaterial thatmakes up thebulk of most plant matter.
Gas
Gas includes natural gas, both associated and non-associated with petroleum deposits, butexcludes natural gas liquids.
Gas-to-liquids
Gas-to-liquids (GTL) refers to a process featuring reaction ofmethanewith oxygen or steamto produce syngas (a mixture of hydrogen and carbon monoxide) followed by synthesis ofliquid products (such as diesel and naphtha) from the syngas using Fischer-Tropsch catalyticsynthesis. The process is similar to those used in coal-to-liquids or biomass-to-liquids.
© O
EC
D/IE
A, 2
011

634 World Energy Outlook 2011 - ANNEXES
Hard coal
Hard coal is coal of gross calorific value greater than 5 700 kilocalories per kilogramme on anash-free butmoist basis. Hard coal can be further disaggregated into anthracite, coking coaland other bituminous coal.
Heat energy
Heat energy is obtained from the combustionof fuels, nuclear reactors, geothermal reservoirs,capture of sunlight, exothermic chemical processes and heat pumpswhich can extract it fromambient air and liquids. It may be used for heating or cooling, or converted into mechanicalenergy for transport vehicles or electricity generation. Commercial heat sold is reportedundertotal final consumptionwith the fuel inputs allocated under power generation.
Heavy petroleum products
Heavy petroleum products include heavy fuel oil.
Hydropower
Hydropower refers to the energy content of the electricity produced in hydropower plants,assuming 100% efficiency. It excludes output from pumped storage and marine (tide andwave) plants.
Industry
Industry includes fuel used within the manufacturing and construction industries. Keyindustry sectors include iron and steel, chemical and petrochemical, non-metallic minerals,and pulp and paper. Use by industries for the transformation of energy into another form orfor the production of fuels is excluded and reported separately under other energy sector.Consumption of fuels for the transport of goods is reported as part of the transport sector.
International aviation bunkers
International aviation bunkers includes the deliveries of aviation fuels to aircraft forinternational aviation. Fuels used by airlines for their road vehicles are excluded. Thedomestic/international split is determined on the basis of departure and landing locationsand not by the nationality of the airline. For many countries this incorrectly excludes fuelsused by domestically owned carriers for their international departures.
International marine bunkers
International marine bunkers covers those quantities delivered to ships of all flags that areengaged in international navigation. The international navigation may take place at sea, oninland lakes andwaterways, and in coastalwaters. Consumptionby ships engaged in domesticnavigation is excluded. The domestic/international split is determined on the basis of port of
© O
EC
D/IE
A, 2
011

Annex C - Units, definitions, regional and country groupings, abbreviations and acronyms 635
C
departure and port of arrival, and not by the flag or nationality of the ship. Consumption byfishing vessels and by military forces is also excluded and included in residential, services andagriculture.
Light petroleum products
Light petroleum products include liquefied petroleum gas (LPG), naphtha and gasoline.
Lower heating value
Lower heating value is the heat liberated by the complete combustion of a unit of fuel whenthe water produced is assumed to remain as a vapour and the heat is not recovered.
Middle distillates
Middle distillates include jet fuel, diesel and heating oil.
Modern biomass
Modern biomass includes all biomass with the exception of traditional biomass.
Modern renewables
Modern renewables includes all types of renewables with the exception of traditionalbiomass.
Natural decline rate
Natural decline rate is the base production decline rate of an oil or gas field withoutintervention to enhance production.
Natural gas liquids
Natural gas liquids (NGLs) are the liquid or liquefied hydrocarbons produced in themanufacture, purification and stabilisation of natural gas. These are those portions ofnatural gas which are recovered as liquids in separators, field facilities, or gas processingplants. NGLs include but are not limited to ethane, propane, butane, pentane, naturalgasoline and condensates.
Non-energy use
Non-energy use refers to fuels used for chemical feedstocks and non-energy products.Examples of non-energy products include lubricants, paraffin waxes, coal tars and oils astimber preservatives.
© O
EC
D/IE
A, 2
011

636 World Energy Outlook 2011 - ANNEXES
Nuclear
Nuclear refers to the primary heat equivalent of the electricity produced by a nuclear plantwith an average thermal efficiency of 33%.
Observed decline rate
Observed decline rate is the production decline rate of an oil or gas field after all measureshave been taken tomaximise production. It is the aggregation of all the production increasesand declines of new andmature oil or gas fields in a particular region.
Oil
Oil includes crude oil, condensates, natural gas liquids, refinery feedstocks and additives,other hydrocarbons (including emulsified oils, synthetic crude oil, mineral oils extractedfrom bituminousminerals such as oil shale, bituminous sand and oils from coal liquefaction)and petroleum products (refinery gas, ethane, LPG, aviation gasoline, motor gasoline, jetfuels, kerosene, gas/diesel oil, heavy fuel oil, naphtha, white spirit, lubricants, bitumen,paraffin waxes and petroleum coke).
Other energy sector
Other energy sector covers the use of energy by transformation industries and the energylosses in converting primary energy into a form that can be used in the final consumingsectors. It includes losses by gas works, petroleum refineries, coal and gas transformationand liquefaction. It also includes energy used in coal mines, in oil and gas extraction and inelectricity and heat production. Transfers and statistical differences are also included in thiscategory
Power generation
Power generation refers to fuel use in electricity plants, heat plants and combined heat andpower (CHP) plants. Both main activity producer plants and small plants that produce fuelfor their own use (autoproducers) are included.
Renewables
Renewable includes biomass and waste, geothermal, hydropower, solar PV, concentratingsolar power (CSP), wind and marine (tide and wave) energy for electricity and heatgeneration.
Total final consumption
Total final consumption (TFC) is the sum of consumption by the different end-use sectors.TFC is broken down into energy demand in the following sectors: industry (including
© O
EC
D/IE
A, 2
011

Annex C - Units, definitions, regional and country groupings, abbreviations and acronyms 637
C
manufacturing and mining), transport, buildings (including residential and services) andother (including agriculture and non-energy use). It excludes international marine andaviation bunkers, except at world level where it is included in the transport sector.
Total primary energy demand
Total primary energy demand (TPED) represents domestic demand only and is broken downinto power generation, other energy sector and total final consumption.
Traditional biomass
Traditional biomass refers to the use of fuelwood, charcoal, animal dung and agriculturalresidues in stoves with very low efficiencies.
Transport
Transport refers to fuels and electricity used in the transport of goods or persons within thenational territory irrespective of the economic sector within which the activity occurs. Thisincludes fuel and electricity delivered to vehicles using public roads or for use in rail vehicles;fuel delivered to vessels for domestic navigation; fuel delivered to aircraft for domesticaviation; and energy consumed in the delivery of fuels through pipelines. Fuel deliveredto international marine and aviation bunkers is presented only at the world level and isexcluded from the transport sector at the domestic level.
Regional and country groupings
Africa
Algeria, Angola, Benin, Botswana, Cameroon, Congo, Democratic Republic of Congo, Côted’Ivoire, Egypt, Eritrea, Ethiopia, Gabon, Ghana, Kenya, Libya, Morocco, Mozambique,Namibia, Nigeria, Senegal, South Africa, Sudan, United Republic of Tanzania, Togo, Tunisia,Zambia, Zimbabwe and other African countries (Burkina Faso, Burundi, Cape Verde, CentralAfrican Republic, Chad, Comoros, Djibouti, Equatorial Guinea, Gambia, Guinea, Guinea-Bissau, Lesotho, Liberia, Madagascar, Malawi, Mali, Mauritania, Mauritius, Niger, Reunion,Rwanda, Sao Tome and Principe, Seychelles, Sierra Leone, Somalia, Swaziland and Uganda).
Annex I Parties to the United Nations Framework Conventionon Climate Change
Australia, Austria, Belarus, Belgium, Bulgaria, Canada, Croatia, Czech Republic, Denmark,Estonia, Finland, France, Germany, Greece, Hungary, Iceland, Ireland, Italy, Japan, Latvia,Liechtenstein, Lithuania, Luxembourg, Monaco, Netherlands, New Zealand, Norway,Poland, Portugal, Romania, Russian Federation, Slovak Republic, Slovenia, Spain, Sweden,Switzerland, Turkey, Ukraine, United Kingdom and United States.
© O
EC
D/IE
A, 2
011

638 World Energy Outlook 2011 - ANNEXES
ASEAN
Brunei Darussalam, Cambodia, Indonesia, Laos,Malaysia,Myanmar, Philippines, Singapore,Thailand and Vietnam.
Caspian
Armenia, Azerbaijan, Georgia, Kazakhstan, Kyrgyz Republic, Tajikistan, Turkmenistan andUzbekistan.
China
Refers to the People’s Republic of China, including Hong Kong.
Developing countries
Non-OECD Asia, Middle East, Africa and Latin America regional groupings.
Eastern Europe/Eurasia
Albania, Armenia, Azerbaijan, Belarus, Bosnia and Herzegovina, Bulgaria, Croatia, Georgia,Kazakhstan, Kyrgyz Republic, Latvia, Lithuania, Former Yugoslav Republic of Macedonia,Republic of Moldova, Romania, Russian Federation, Serbia1, Tajikistan, Turkmenistan,Ukraine and Uzbekistan. For statistical reasons, this region also includes Cyprus, GibraltarandMalta.
European Union
Austria, Belgium, Bulgaria, Cyprus, Czech Republic, Denmark, Estonia, Finland, France,Germany, Greece, Hungary, Ireland, Italy, Latvia, Lithuania, Luxembourg,Malta, Netherlands,Poland, Portugal, Romania, Slovak Republic, Slovenia, Spain, Sweden and United Kingdom.
G-8
Canada, France, Germany, Italy, Japan, Russian Federation, United Kingdom and UnitedStates.
G-20
G-8 countries and Argentina, Australia, Brazil, China, India, Indonesia, Mexico, Saudi Arabia,South Africa, Korea, Turkey and the European Union.
1. Serbia includes Montenegro un!l 2004 and Kosovo un!l 1999.
© O
EC
D/IE
A, 2
011

Annex C - Units, definitions, regional and country groupings, abbreviations and acronyms 639
C
Latin America
Argentina, Bolivia, Brazil, Chile, Colombia, Costa Rica, Cuba, Dominican Republic, Ecuador,El Salvador, Guatemala, Haiti, Honduras, Jamaica, Netherlands Antilles, Nicaragua, Panama,Paraguay, Peru, Trinidad and Tobago, Uruguay, Venezuela and other Latin American countries(Antigua and Barbuda, Aruba, Bahamas, Barbados, Belize, Bermuda, British Virgin Islands,Cayman Islands,. Dominica, Falkland Islands, French Guyana, Grenada, Guadeloupe, Guyana,Martinique, Montserrat, St. Kitts and Nevis, Saint Lucia, Saint Pierre et Miquelon, St. Vincentand the Grenadines, Suriname and Turks and Caicos Islands).
Middle East
Bahrain, Islamic Republic of Iran, Iraq, Jordan, Kuwait, Lebanon, Oman, Qatar, Saudi Arabia,Syrian Arab Republic, United Arab Emirates and Yemen. It includes the neutral zone betweenSaudi Arabia and Iraq.
Non-OECD Asia
Bangladesh, Brunei Darussalam, Cambodia, China, Chinese Taipei, India, Indonesia,Democratic People’s Republic of Korea, Malaysia, Mongolia, Myanmar, Nepal, Pakistan,Philippines, Singapore, Sri Lanka, Thailand, Vietnam and other non-OECD Asian countries(Afghanistan, Bhutan, Cook Islands, East Timor, Fiji, French Polynesia, Kiribati, Laos,Macau, Maldives, New Caledonia, Papua New Guinea, Samoa, Solomon Islands, Tongaand Vanuatu).
North Africa
Algeria, Egypt, Libya, Morocco and Tunisia.
OECD2
Includes OECD Europe, OECD Americas and OECD Asia Oceania regional groupings.
OECD Americas
Canada, Chile, Mexico and United States.
OECD Asia Oceania
Includes OECD Asia, comprising Japan and Korea, and OECD Oceania, comprising Australiaand New Zealand.
2. Chile, Estonia, Israel and Slovenia joined the OECD in 2010, and in the WEO-2011, unlike previous edi!ons, thesecountries are included in the OECD.
© O
EC
D/IE
A, 2
011

640 World Energy Outlook 2011 - ANNEXES
OECD Europe
Austria, Belgium, Czech Republic, Denmark, Estonia, Finland, France, Germany, Greece,Hungary, Iceland, Ireland, Italy, Luxembourg, Netherlands, Norway, Poland, Portugal, SlovakRepublic, Slovenia, Spain, Sweden, Switzerland, Turkey and United Kingdom. For statisticalreasons, this region also includes Israel.
OPEC
Algeria, Angola, Ecuador, Islamic Republic of Iran, Iraq, Kuwait, Libya, Nigeria, Qatar, SaudiArabia, United Arab Emirates and Venezuela.
Other Asia
Non-OECD Asia regional grouping excluding China and India.
Sub-Saharan Africa
Africa regional grouping excluding the North African regional grouping and South Africa.
Abbreviations and Acronyms
APEC Asia-Pacific Economic Cooperation
API American Petroleum Institute
ASEAN Association of Southeast Asian Nations
BTL biomass-to-liquids
CAAGR compound average annual growth rate
CAFE corporate average fuel economy (standards in the United States)
CBM coalbed methane
CER Certified Emission Reduction
CCGT combined-cycle gas turbine
CCS carbon capture and storage
CDM Clean DevelopmentMechanism (under the Kyoto Protocol)
CFL compact fluorescent lamp
CH4 methane
CHP combined heat and power; the term co-generation is sometimes used
CMM coal mine methane
© O
EC
D/IE
A, 2
011

Annex C - Units, definitions, regional and country groupings, abbreviations and acronyms 641
C
CNG compressed natural gas
CO carbonmonoxide
CO2 carbon dioxide
CO2-eq carbon-dioxide equivalent
COP Conference of Parties (UNFCCC)
CPC Caspian Pipeline Consortium
CSP concentrating solar power
CSS cyclic steam stimulation
CTL coal-to-liquids
CV calorific value
E&P exploration and production
EDI Energy Development Index
EOR enhanced oil recovery
EPA Environmental Protection Agency (United States)
ESCO energy service company
EU European Union
EUA European Union allowances
EU ETS European Union Emissions Trading System
EV electric vehicle
FAO Food and Agriculture Organization (United Nations)
FDI foreign direct investment
FFV flex-fuel vehicle
FOB free on board
GCV gross calorific value
GDP gross domestic product
GHG greenhouse gases
GTL gas-to-liquids
HDI Human Development Index
HDV heavy-duty vehicles
HIV/AIDS human immunodeficiency virus/acquired immune deficiency syndrome
IAEA International Atomic Energy Agency
© O
EC
D/IE
A, 2
011

642 World Energy Outlook 2011 - ANNEXES
ICE internal combustion engine
IGCC integrated gasification combined-cycle
IMF International Monetary Fund
IOC international oil company
IPCC Intergovernmental Panel on Climate Change
IPP independent power producer
LCV light-commercial vehicle
LDV light-duty vehicle
LHV lower heating value
LNG liquefied natural gas
LPG liquefied petroleum gas
LRMC long-run marginal cost
LULUCF land use, land-use change and forestry
MER market exchange rate
MDGs Millennium Development Goals
MEPS minimum energy performance standards
N2O nitrous oxide
NCV net calorific value
NEA Nuclear Energy Agency (an agency within the OECD)
NGL natural gas liquids
NGV natural gas vehicle
NOC national oil company
NOx nitrogen oxides
OCGT open-cycle gas turbine
OECD Organisation for Economic Co-operation and Development
OPEC Organization of the Petroleum Exporting Countries
PHEV plug-in hybrid electric vehicle
PLDV passenger light-duty vehicle
PM particulate matter
PM2.5 particulate matter with a diameter of 2.5 micrometres or less
PPP purchasing power parity
© O
EC
D/IE
A, 2
011

Annex C - Units, definitions, regional and country groupings, abbreviations and acronyms 643
C
PSA production-sharing agreement
PV photovoltaic
RD&D research, development and demonstration
RDD&D research, development, demonstration and deployment
SAGD steam-assisted gravity drainage
SCO synthetic crude oil
SO2 sulphur dioxide
SRMC short-run marginal cost
T&D transmission and distribution
TFC total final consumption
TPED total primary energy demand
TPES total primary energy supply
UAE United Arab Emirates
UCG underground coal gasification
UN United Nations
UNDP United Nations Development Programme
UNEP United Nations Environment Programme
UNFCCC United Nations Framework Convention on Climate Change
UNIDO United Nations Industrial Development Organization
US United States
USC ultra-supercritical
USGS United States Geological Survey
WEO World Energy Outlook
WEM World EnergyModel
WHO World Health Organization
WTI West Texas Intermediate
WTO World Trade Organization
WTW well-to-wheel
© O
EC
D/IE
A, 2
011

© O
EC
D/IE
A, 2
011

Annex D - References 645
ANNEX D
REFERENCES
PART A: Global energy trends
Chapter 1: Context and analytical framework
IEA (Interna onal Energy Agency) (2010a), World Energy Outlook 2010, OECD/IEA, Paris.
— (2010b), Energy Technology Perspec ves 2010, OECD/IEA, Paris.
— (2011), Medium-Term Oil and Gas Markets 2011, OECD/IEA, Paris.
IMF (Interna onal Monetary Fund) (2011), World Economic Outlook: Slowing Growth, Risks Ahead, IMF, Washington, DC, September.
OECD (Organisa on for Economic Co-opera on and Development) (2011), OECD Economic Outlook No. 89, OECD, Paris, May.
UNPD (United Na ons Popula on Division) (2011), World Popula on Prospects: The 2010 Revision, United Na ons, New York.
Chapter 2: Energy projections to 2035
BGR (Bundesanstalt für Geowissenscha en und Rohstoff e – German Federal Ins tute for Geosciences and Natural Resources) (2010), Energierohstoff e 2010, Reserven, Ressourcen, Verfügbarkeit, Tabellen [Energy Resources 2010, Reserves, Resources, Availability, Tables], BGR, Hannover, Germany.
Cedigaz (2010), Natural Gas in the World, Ins tut Français du Pétrole, Rueil-Malmaison, France.
IEA (Interna onal Energy Agency) (2007), World Energy Outlook 2007, OECD/IEA, Paris.
IIASA (Interna onal Ins tute for Applied Systems Analysis) (2011), Emissions of Air Pollutants for the World Energy Outlook 2011 Energy Scenarios, report prepared for the IEA using the GAINS model, IIASA, Laxenberg, Austria, www.worldenergyoutlook.org.
NEA (Nuclear Energy Agency, OECD) and IAEA (Interna onal Atomic Energy Agency) (2010), Uranium 2009: Resources, Produc on and Demand, OECD, Paris.
O&GJ (Oil and Gas Journal) (2010), “Worldwide Look at Reserves and Produc on”, Oil and Gas Journal, Pennwell Corpora on, Oklahoma City, United States, December.
Chapter 3: Oil market outlook
API (American Petroleum Ins tute) (2011), The Economic Impacts of the Oil and Natural Gas Industry on the U.S. Economy in 2009, Discussion Paper No. 119, API, Washington, DC.
© O
EC
D/IE
A, 2
011

646 World Energy Outlook 2011 - ANNEXES
APICORP (Arab Petroleum Investment Corpora on) (2011), Economic Commentary, APICORP, Vol. 6, No. 3, Dammam, Saudi Arabia.
BGR (Bundesanstalt für Geowissenscha en und Rohstoff e – German Federal Ins tute for Geosciences and Natural Resources) (2010), Energierohstoff e 2010, Reserven, Ressourcen, Verfügbarkeit, Tabellen [Energy Resources 2010, Reserves, Resources, Availability, Tables], BGR, Hannover, Germany.
BH (Baker Hughes) (2011), Rig Count Database, www.gis.bakerhughesdirect.com/Reports/StandardReport.aspx, accessed June 2011.
BP (2011), BP Sta s cal Review of World Energy 2011, BP, London.
CGES (Centre for Global Energy Studies) (2011), Commentary: Saudi Arabia’s Target Oil Price in 2011, www.cges.co.uk, accessed March 2011.
Credit Suisse (2011), Commodity Prices: How Much of a Threat?, Equity Research, 1 March, Credit Suisse, London.
Deutsche Bank (2011), European Oils Weekly, 20 June, Deutsche Bank, London.
GGFRP (Global Gas Flaring Reduc on Partnership) (2010), “Es mated Flared Volumes from Satellite Data, 2006-2010”, US Na onal Oceanographic and Atmospheric Administra on, Washington, DC, h p://www.go.worldbank.org/D03ET1BVD0, accessed June 2011.
Greene, D. (2010), Why the Market for New Passenger Cars Generally Undervalues Fuel Economy, Discussion Paper No. 2010-6, Interna onal Transport Forum, OECD, Paris.
ILO (Interna onal Labour Organisa on) (2010), Saudi Arabia Labour Sta s cs, G-20 Mee ng of Labour and Employment Ministers, 20-21 April 2010, Washington, DC.
IMF (Interna onal Monetary Fund) (2011), Kuwait – 2011 Ar cle IV Consulta on Concluding Statement, www.imf.org/external/np/ms/2011/050911.htm, accessed July 2011.
IMOO (Iraq Ministry of Oil) (2011), Iraq Crude Oil Export Sta s cs, www.oil.gov.iq/EXPORT%20CAPACITIES.php, accessed July 2011.
IEA (Interna onal Energy Agency) (2008), World Energy Outlook 2008, OECD/IEA, Paris.
— (2010), World Energy Outlook 2010, OECD/IEA, Paris.
— (2011a), “Are We Entering a Golden Age of Gas?”, World Energy Outlook 2011 Special Report, OECD/IEA, Paris.
— (2011b), Technology Roadmap – Electric and Plug-in Hybrid Electric Vehicles, OECD/IEA, Paris.
— (2011c), Medium Term Oil & Gas Markets Report, OECD/IEA, Paris.
— (2011d), Oil Market Report, OECD/IEA, Paris, August.
NDSG (North Dakota State Government) (2011), 2011 Monthly Sta s cal Update, Industrial Commission of North Dakota Oil & Gas Division, www.dmr.nd.gov/oilgas/stats/ 2011monthlystats.pdf, accessed September 2011.
© O
EC
D/IE
A, 2
011

Annex D - References 647
D
O&GJ (Oil and Gas Journal) (2010), Worldwide Look at Reserves and Produc#on, PennwellCorpora!on, Oklahoma City, United States, December.
OICA (Interna!onal Organiza!on of Motor Vehicle Manufacturers), (2011), World MotorVehicle Produc#on, OICA Correspondents’ Survey, OICA, Paris.
Otkri!e (2011), Oil and Gas Yearbook 2011, Otkri!e Capital, Moscow, Russia.
OPEC (Organiza!on of Petroleum Expor!ng Countries) (2011), Annual Sta#s#cal Bulle#n2010/2011 Edi#on, OPEC, Vienna.
PFC (PFC Energy) (2011), OPEC Members’ Breakeven Price Con#nues to Rise, Press Release,27 April, PFC Energy, Washington, DC.
Rosstat (Russian Federa!on Federal State Sta!s!cs Service) (2010), Russian EmploymentSta#s#cs,www.gks.ru, accessed July 2011.
RRC (Railroad Commission of Texas) (2011), Eagle Ford Informa!on on Produc!on, RRC,www.rrc.state.tx.us/eagleford/index.php, accessed July 2011.
SA (Saudi Aramco) (2011), Saudi Aramco Annual Review, Dhahran, Saudi Arabia.
US DOE/EIA (US Department of Energy/Energy Informa!on Agency) (2010), Summary:US Crude Oil Natural Gas and Natural Gas Liquids Proved Reserves 2009, US DOE,Washington, DC.
— (2011a), Review of Emerging Resources: US Shale Gas and Shale Oil Plays, US DOE,Washington, DC.
— (2011b), Oil Well Drilling Count, www.eia.gov/dnav/ng/ng_enr_wellend_s1_a.htm,accessed June 2011.
— (2011c), Producing Oil Well Count, www.eia.gov/pub/oil_gas/petrosystem/us_table.html, accessed June 2011.
USGS (United States Geological Survey) (2000), World Petroleum Assessment, USGS,Boulder, Colorado.
— (2008a), “Circum-Arc!c Resource Appraisal: Es!mates of Undiscovered Oil and Gas Northof the Arc!c Circle”, Fact Sheet 2008-3049, USGS, Boulder, Colorado.
— (2008b), “Assessment of Undiscovered Oil Resources in the Devonian-MississippianBakken Forma!on, Williston Basin Province, Montana and North Dakota”, Fact Sheet 2008–3021, USGS, Boulder, Colorado.
— (2009a), “An Es!mate of Recoverable Heavy Oil Resources of the Orinoco Oil Belt,Venezuela”, Fact Sheet 2009-3028 - October, USGS, Boulder, Colorado.
— (2009b), “Assessment of In-place Oil Shale Resources of the Green River Forma!on,Piceance Basin,Western Colorado”, Fact Sheet 2009-3012 -March, USGS, Boulder, Colorado.
— (2010), “Assessment of In-place Oil Shale Resources of the Green River Forma!on, UintaBasin, Utah and Colorado”, Fact Sheet 2010-3010 - May, USGS, Boulder, Colorado.
© O
EC
D/IE
A, 2
011

648 World Energy Outlook 2011 - ANNEXES
Chapter 4: Natural gas market outlook
BGR (Bundesanstalt für Geowissenscha$en und Rohstoffe – German Federal Ins!tute forGeosciences and Natural Resources) (2010), Energierohstoffe 2010, Reserven, Ressourcen,Verfügbarkeit, Tabellen [Energy Resources 2010, Reserves, Resources, Availability, Tables],BGR, Hannover, Germany.
Cedigaz (2010), Natural Gas in the World, Ins!tut Français du Pétrole, Rueil-Malmaison,France.
IEA (Interna!onal Energy Agency) (2011), “Are We Entering a Golden Age of Gas?”, WorldEnergy Outlook 2011 Special Report, OECD/IEA, Paris.
US DOE/EIA (US Department of Energy/Energy Informa!on Administra!on) (2011), WorldShale Gas Resources: An Ini#al Assessment of 14 Regions Outside the United States, US DOE,Washington, DC.
USGS (United States Geological Survey) (2000), World Petroleum Assessment, USGS,Boulder, Colorado.
— (2008), “Circum-Arc!c Resource Appraisal: Es!mates of Undiscovered Oil and Gas Northof the Arc!c Circle”, Fact Sheet 2008-3049, USGS, Boulder, Colorado.
Chapter 5: Power and renewables outlook
ABS Energy Research (2010),Global Transmission & Distribu#on Report Ed. 9-2010, London.
Dena (Deutsche Energie Agentur) (2010), dena Grid Study II – Integra#on of RenewableEnergy Sources in the German Power Supply System from 2015-2020 with an Outlook to2025, Dena, Berlin.
ECF (EuropeanClimateFounda!on) (2010),Roadmap2050:APrac#calGuide toaProsperousLow-Carbon Europe. Volume 1 – Technical and Economic Analysis, ECF, The Hague.
ENTSO-E (European Network of Transmission System Operators for Electricity) (2011),European Network of Transmission and System Operators for Electricity: Factsheet 2011,Brussels.
Heide, D., et al. (2010), “Seasonal Op!mal Mix of Wind and Solar Power in a Future, HighlyRenewableEurope”,RenewableEnergy, Vol. 35,pp.2483-2589,dataprovided to IEAbySiemens.
IEA (Interna!onal Energy Agency) (forthcoming), System Effects of Variable RenewableEnergies to Thermal Power Plants, IEA Working Paper, OECD/IEA, Paris.
— (2011a), Harnessing Renewables: A Guide to the Balancing Challenge, OECD/IEA, Paris.
— (2011b), Technology Roadmap – Smart Grids, OECD/IEA, Paris.
IPCC (Intergovernmental Panel on Climate Change) (2011). Special Report on RenewableEnergy Sources and Climate Change Mi#ga#on, IPCC, Geneva.
NREL (Na!onal Renewable Energy Laboratory) (2010),Western Wind and Solar Integra#onStudy, prepared by GE Energy, NREL, Golden, United States.
© O
EC
D/IE
A, 2
011

Annex D - References 649
D
— (2011a), Eastern Wind Integra#on and Transmission Study, prepared by EnerNexCorpora#on, NREL, Golden, United States.
— (2011b), Na#onal Solar Radia#on Base, 1991-2005 Update, h%p://rredc.nrel.gov/solar,accessed July 2011.
World Wind Atlas (2011), Sander + Partner GmbH: Global wind speed database,www.sander-partner.ch/en/atlas.html, accessed October 2011.
Chapter 6: Climate Change and the 450 Scenario
Anderson, K. and A. Bows (2011), “Beyond ‘Dangerous’ Climate Change: Emission Scenarios fora NewWorld”, Philosophical Transac#ons of the Royal Society, Vol. 369, No. 1934, pp. 20-44.
Davis, S., K. Caldeira andH.Ma$hews (2010), “Future CO2 Emissions and Climate Change fromExis!ng Energy Infrastructure”, Science, Vol. 329, No. 5997,Washington, DC, pp. 1330-1333.
Hansen, J., et al. (2008), “Target Atmospheric CO2: Where Should Humanity Aim?”, TheOpen Atmospheric Science Journal, Vol. 2, pp. 217-231.
IEA (Interna!onal Energy Agency) (2010a),World Energy Outlook 2010, OECD/IEA, Paris.
— (2010b), Energy Technology Perspec#ves 2010, OECD/IEA, Paris.
— (2011), IEA Scoreboard 2011: Implemen#ng Energy Efficiency Policy: Progress andchallenges in IEA Member Countries, OECD/IEA, Paris.
IIASA (Interna!onal Ins!tute for Applied SystemsAnalysis) (2011), Emissions of Air Pollutantsfor the World Energy Outlook 2011 Energy Scenarios, report prepared for the IEA using theGAINS model, IIASA, Laxenberg, Austria,www.worldenergyoutlook.org.
IPCC (Intergovernmental PanelonClimateChange) (2007a), “ClimateChange2007: SynthesisReport”, contribu!on of Working Groups I, II, and III to the Fourth Assessment Report of theIPCC, R. Pachauri and A. Reisinger (eds.), IPCC, Geneva.
— (2007b), “Climate Change 2007: Impacts, Adapta!on and Vulnerability”, contribu!onof Working Group II to the Fourth Assessment Report of the IPCC, M. Parry et al. (eds.),Cambridge University Press, Cambridge, United Kingdom.
Lenton, T., et al. (2008), “Tipping Elements in the Earth’s Climate System”, Proceedings of theNa#onal Academy of Sciences, Vol. 105, No. 6, Washington, DC.
Lewis, S.,et al. (2011), “The2010AmazonDrought”, Science, Vol. 331,No. 6017,Washington,DC, pp. 554.
Meinshausen, M., et al. (2009), “Greenhouse Gas Emissions Targets for Limi!ng GlobalWarming to 2°C, Nature, Vol. 458, No. 7242, pp. 1158-1162.
Parry, M., et al. (2009), Assessing the Costs of Adapta#on to Climate Change: A Reviewof the UNFCCC and Other Recent Es#mates, Interna!onal Ins!tute for Environment andDevelopment, London.
Rockström, J., et al. (2009), “A Safe Opera!ng Space for Humanity”, Nature, Vol. 461, pp.472-475.
© O
EC
D/IE
A, 2
011

650 World Energy Outlook 2011 - ANNEXES
Schaefer, K., et al. (2011), Amount and Timing of Permafrost Carbon Release in Response toClimateWarming, Tellus B, Vol. 63, No. 2, Interna!onalMeteorological Ins!tute, Stockholm,pp. 165-180.
Smith, J., et al. (2009), “Assessing Dangerous Climate Change through an Update of theIntergovernmental Panel on Climate Change ‘Reasons for Concern’”, Proceedings of theNa#onal Academy of Sciences, Vol. 106, No.11, Washington, DC.
Stern, N. (2006), Stern Review: Economics of Climate Change, Cambridge University Press,Cambridge, United Kingdom.
UNEP (United Na!ons Environment Programme) (2010), The Emissions Gap Report, UNEP,Paris.
PART B: Outlook for Russian energyChapter 7: Russian domestic energy prospects
Bashmakov, I. (2011), Energy Efficiency Policies and Developments in Russia, Centre forEnergy Efficiency, Moscow.
CENEF (Centre for Energy Efficiency) (2008), Resource of Energy Efficiency in Russia: Scale,Costs and Benefits, CENEF, Moscow.
Government of Russia (2008), Transport Strategy of Russia for the Period to 2030,Government of Russia, Moscow (in Russian).
— (2009), Energy Strategy of Russia for the Period to 2030, Government of Russia, Moscow.
— (2010), State Programme on Energy Savings and Increased Energy Efficiency in the Periodto 2020, Government of Russia, Moscow (in Russian).
— (2011), Climate Doctrine Ac#on Plan, Government of Russia, Moscow (in Russian).
IAEA (Interna!onal Atomic Energy Agency) (2011), PRIS Database,ww.iaea.org/ programmes/a2/, accessed August 2011.
IMF (Interna!onal Monetary Fund) (2011a), Concluding Statement for the 2011 Ar#cle IVConsulta#onMission, Moscow, June, www.imf.org/external/np/ms/2011/ 061411b.htm.
— (2011b),World Economic Outlook, IMF, Washington, DC, April.
Ins!tuteofEnergyStrategy (2010),RussianEnergy;AViewto theFuture:BackgroundMaterialsto the Energy Strategy of Russia to 2030, Ins!tute of Energy Strategy, Moscow (in Russian).
IEA (Interna!onal Energy Agency) (2006), Op#mising Russian Natural Gas, OECD/IEA, Paris.
— (2009), Implemen#ng Energy Efficiency Policies – Are IEA Member Countries on Track?,OECD/IEA, Paris.
— (2010), Energy Technology Perspec#ves 2010, OECD/IEA, Paris.
— (2011), Development of Energy Efficiency Indicators in Russia, IEA Working Paper, OECD/IEA, Paris.
© O
EC
D/IE
A, 2
011

Annex D - References 651
D
RosHydroMet (2011), Report on Clima#c Condi#ons in Russia in 2010, Federal Servicefor Hydrometeorology and Environmental Monitoring (RosHydroMet), Moscow(in Russian).
Russian Academy of Sciences (2009),Development of EconomicMechanisms for S#mula#ngInvestment in Energy Efficient Technologies, Ins!tute of Energy Research of the RussianAcademy of Sciences, Moscow (in Russian).
Solanko L. (2011), How to Succeed with a Thousand TWh Reform?, FIIA Working Paper, TheFinnish Ins!tute of Interna!onal Affairs, Helsinki.
Transparency Interna!onal (2010), Corrup#on Percep#ons Index, Berlin,www.transparency.org/policy_research/surveys_indices/cpi/2010, accessed July 2011.
UNIDO (United Na!ons Industrial Development Organisa!on) (2010), Global IndustrialEnergy Efficiency Benchmarking, An Energy Policy Tool, UNIDOWorking Paper, Vienna.
WorldBank (2008),EnergyEfficiency inRussia:UntappedReserves,WorldBank,Washington,DC.
— (2010), Lights Out: the Outlook for Energy in Eastern Europe and the Former Soviet Union,World Bank, Washington, DC.
— (2011), Ease of Doing Business Index, World Bank,www.doingbusiness.org/rankings.
World Steel Associa!on (2000), Steel Sta#s#cal Yearbook 2000, World Steel Associa!on,Brussels.
— (2010), Steel Sta#s#cal Yearbook 2010, World Steel Associa!on, Brussels.
Chapter 8: Russian resources and supply potential
BGR (Bundesanstalt für Geowissenscha$en und Rohstoffe – German Federal Ins!tute forGeosciences and Natural Resources) (2010), Energierohstoffe 2010, Reserven, Ressourcen,Verfügbarkeit, Tabellen [Energy Resources 2010, Reserves, Resources, Availability, Tables],BGR, Hannover, Germany.
BP (2011), BP Sta#s#cal Review of World Energy 2011, BP, London.
Cedigaz (2011), Natural Gas in the World, 2010 Edi#on, Cedigaz, Rueil-Malmaison, France.
Efimov, A., et al. (2009), Accelera#ng the Development of the Hydrocarbon ResourceBase in Eastern Siberia and the Republic of Sakha, First Break 27, European Associa!on ofGeoscien!sts and Engineers, Houten, The Netherlands, pp. 69.
Evere$, M. (2010), Characterizing the Pre-Cambrian Petroleum Systems of Eastern Siberia:Evidence from Geochemistry and Basin Modelling, SPE 136334, SPE (Society of PetroleumEngineers), Richardson, United States.
Gerasimov, Y. and T. Karjalainen (2011), “Energy Wood Resources in Northwest Russia”,Biomass and Bioenergy, Vol. 35, Elsevier, Amsterdam, pp. 1655-1662.
© O
EC
D/IE
A, 2
011
652 World Energy Outlook 2011 - ANNEXES
GGFRP (Global Gas Flaring Reduc!on Partnership) (2010), “Es!mated Flared Volumes fromSatellite Data, 2006-2010”, US Na!onal Oceanographic and Atmospheric Administra!on,Washington, DC, h%p://go.worldbank.org/D03ET1BVD0, accessed June 2011.
Government of Russia (2008), Concept of Long-term Social and Economic Development ofthe Russian Federa#on for the Period to 2020, Government of Russia, Moscow (in Russian).
— (2009), Energy Strategy of Russia for the Period to 2030, Government of Russia, Moscow.
— (2010), State Programme on Energy Saving and Increased Energy Efficiency in the Periodto 2020, Government of Russia, Moscow (in Russian).
— (2011), Climate Doctrine Ac#on Plan, Government of Russia, Moscow (in Russian).
Henderson, J. (2010), Non-Gazprom Gas Producers in Russia, Oxford Ins!tute for EnergyStudies, Oxford, United Kingdom.
IEA (Interna!onal Energy Agency) (2003), Renewables in Russia, OECD/IEA, Paris.
— (2008),World Energy Outlook 2008, OECD/IEA, Paris.
— (2009),World Energy Outlook 2009, OECD/IEA, Paris.
— (2010a),World Energy Outlook 2010, OECD/IEA, Paris.
— (2010b), Natural Gas Informa#on, OECD/IEA, Paris.
Kontorovich, A., et al. (2010), “Geology and Hydrocarbon Resources of the Con!nentalShelf in Russian Arc!c Seas and the Prospects of their Development”, Russian Geology andGeophysics, Vol. 51, Elsevier, Amsterdam, pp. 3-11.
Ministry of Energy of the Russian Federa!on (2011), Approval of the General Scheme forDevelopment of the Oil Industry to 2020, www.minenergo.gov.ru/ press/min_news/7473.html, accessed September 2011 (in Russian).
Ministry of Natural Resources and Environment of the Russian Federa!on (2010),5th Na#onal Communica#on to the UNFCCC, www.unfccc.int/na#onal_reports/annex_i_natcom/submi%ed_natcom/items/4903.php, accessed June 2011 (in Russian).
— (2011), On the State and Use of Mineral Resources in the Russian Federa#on in 2009,www.mnr.gov.ru/part/?act=more&id=6555&pid=153, accessed May 2011 (in Russian).
O&GJ (Oil and Gas Journal) (2010), “Worldwide Look, at Reserves and Produc!on” Oil andGas Journal, Pennwell Corpora!on, Oklahoma City, United States, December.
PFCEnergy (2007),UsingRussia’sAssociatedGas, report for theGlobalGas FlaringReduc!onPartnership and the World Bank, PFC, Washington, DC.
Piskarev, A. and M. Shkatov (2009), Probable Reserves and Prospects for Explora#on andDevelopment of Oil and Gas Deposits in the Russian Arc#c Seas, IPTC-13290, SPE (Society ofPetroleum Engineers), Richardson, United States.
© O
EC
D/IE
A, 2
011

Annex D - References 653
D
Popel, O., et al., (2010), An Atlas of the Solar Energy Resource in Russia, United Ins!tute ofHigh Temperatures of the Russian Academy of Sciences, Moscow (in Russian).
Ragner, C. (2008), The Northern Sea Route, in T. Hallberg (ed.), Barents – e$ gränsland iNorden, Arena Norden, Stockholm, pp. 114-127.
Rogner, H. (1997), “An Assessment of World Hydrocarbon Resources”, Annual Reviews ofEnergy and Environment, Vol. 22, Palo Alto, United States, pp. 217-262.
Shakhova, N. and I. Semiletov (2010), “Methane Release from the East SiberianArc!c Shelf and the Poten!al for Abrupt Climate Change”, presented at the US DoDPartners in Environmental Technology Symposium, Washington, DC, 30 November,h%p://symposium2010.serdp-estcp.org/Technical-Sessions/1A, accessed July 2011.
South Stream (2011), “South Stream” project presenta!on, Brussels, 25 May,www.south-stream.info/index.php?id=28&L=1, accessed July 2011.
USGS (United States Geological Survey) (2000), World Petroleum Assessment, USGS,Boulder, Colorado.
WEC (World Energy Council) (2010), 2010 Survey of Energy Resources,World Energy Council,London.
Chapter 9: Implications of Russia’s energy development
Government of Russia (2008), Concept of Long-term Social and Economic Development ofthe Russian Federa#on for the Period to 2020, Government of Russia, Moscow (in Russian).
Gurvich, E. (2010), “Oil and Gas Rent in the Russian Economy”, Ques#ons of Economics, Vol.11, Russian Academy of Sciences, Moscow (in Russian).
IIASA (Interna!onal Ins!tute for Applied SystemsAnalysis) (2011), Emissions of Air Pollutantsfor the World Energy Outlook 2011 Energy Scenarios, report prepared for the IEA using theGAINS model, IIASA, Laxenburg, Austria,www.worldenergyoutlook.org.
IEA (Interna!onal Energy Agency) (2010),World Energy Outlook 2010, OECD/IEA, Paris.
— (2011a),Medium-Term Oil and Gas Market Report, OECD/IEA, Paris.
— (2011b), Are We Entering a Golden Age of Gas?, World Energy Outlook 2011 SpecialReport, OECD/IEA, Paris.
Kuboniwa M., S. Tabata and N. Us!nova (2005), “How Large is the Oil and Gas Sector ofRussia?” Eurasian Geography and Economics, Vol. 46, No. 1, pp. 68-76.
OECD (Organisa!on for Economic Co-opera!on and Development) (2011), Economic Surveyof Russia, OECD, Paris, forthcoming.
World Bank (2005), From Transi#on to Development, A Country EconomicMemorandum forthe Russian Federa#on, World Bank, Moscow.
© O
EC
D/IE
A, 2
011

654 World Energy Outlook 2011 - ANNEXES
PART C: Outlook for coal markets
Chapter 10: Coal demand prospects
GCCSI (Global CCS Ins!tute) (2011), TheGlobal Status of CCS: 2011,GCCSI, Canberra, Australia.
IEA (Interna!onal Energy Agency) (2009), Technology Roadmap – Carbon Capture andStorage, OECD/IEA, Paris.
— (2010a), Power Genera#on from Coal, OECD/IEA, Paris.
— (2010b), Energy Technology Perspec#ves 2010, OECD/IEA, Paris.
— (2010c),World Energy Outlook 2010, OECD/IEA, Paris.
Chapter 11: Coal supply and investment prospects
ABARES (2011), Minerals and Energy: Major Development Projects – April 2011 Lis#ng,Australian Bureau of Agricultural and Resource Economics and Sciences, Canberra.
Barry Rogliano Salles (2011), “Outlook for the Bulk Carrier Market”, presentedat the IEA Workshop on Outlook for Coal Industry and Markets, Beijing, 14 April,www.iea.org/work/2011/ WEO_Coal/04_02_FIKKERS_XING.pdf.
Baruya, P. (2009), Prospects for Coal and Clean Coal Technologies in Indonesia, IEA CleanCoal Centre, London.
BGR (Bundesanstalt für Geowissenscha$en und Rohstoffe – German Federal Ins!tute forGeosciences and Natural Resources) (2010), Energierohstoffe 2010, Reserven, Ressourcen,Verfügbarkeit, Tabellen [Energy Resources 2010, Reserves, Resources, Availability, Tables],BGR, Hannover, Germany.
BP (2011), BP Sta#s#cal Review of World Energy 2011, BP, London.
DnB NOR (2010), Dry Bulk Outlook: Iron Ore and Coal, DnB NOR, Norway.
Eberhard, A. (2011), The Future of South African Coal: Market, Investment and PolicyChallenges, Freeman Spogli Ins!tute for Interna!onal Studies at Stanford University,Working Paper No. 100, Stanford, United States.
IEA (Interna!onal Energy Agency) (2011), Medium-Term Coal Market Report 2011, OECD/IEA, Paris, forthcoming.
McCloskey (2007-2011), McCloskey Coal Reports 2007 to 2011, McCloskey Group,h%p://cr.mccloskeycoal.com/.
Meister,W. (2008), “Cost Trends inMining”, presented atMcCloskey European Coal OutlookConference, Nice, France, 18-19 May.
Mills, J. (2007), Prospects for Coal and Clean Coal Technologies in India, IEA Clean CoalCentre, London.
Minchener, A. (2007), Coal Supply Challenges for China, IEA Clean Coal Centre, London.
© O
EC
D/IE
A, 2
011

Annex D - References 655
D
Morse, R. and G. He (2010), The World’s Greatest Coal Arbitrage: China’s Coal ImportBehaviour and Implica#on for the Global Coal Market, Freeman Spogli Ins!tute forInterna!onal Studies at Stanford University, Working Paper No. 94, Stanford, United States.
NBS (Na!onal Bureau of Sta!s!cs of China) (2010), China Energy Sta#s#cal Yearbook 2010,NBS, Beijing.
NSW (New South Wales) Department of Primary Industries (2011), Summary of NSW CoalSta#s#cs, Government of New SouthWales,www.dpi.nsw.gov.au/minerals/resources/coal/summary-of-nsw-coal-sta#s#cs, accessed July 2011.
Paulus, M. and J. Trüby (2011), “Coal Lumps vs. Electrons: How do Chinese Bulk EnergyTransport Decisions Affect the Global Steam Coal Market?” Energy Economics, forthcoming.
Queensland Department of Mines and Energy (2011), Coal Industry Review 2009-2010Sta#s#cal Tables, Government of Queensland, h%p://mines.industry.qld.gov.au/mining/coal-sta#s#cs.htm, accessed July 2011.
Rademacher, M. and R. Braun (2011), “The Impact of the Financial Crisis on the GlobalSeaborne Hard Coal Market: Are there Implica!ons for the Future?”, Zeitschri$ fürEnergiewirtscha$, Vol. 35, No. 2, Wiesbaden, Germany, pp. 89-104.
Rui, H., R. Morse and G. He (2010), Remaking theWorld’s Largest Coal Market: The Quest toDevelop Large Coal-Power Bases in China, Freeman Spogli Ins!tute for Interna!onal Studiesat Stanford University Working Paper No. 98, Stanford, United States.
Schiffer, H. (2011), “Rolle der Kohle im weltweiten Energiemix” [The Role of Coal in theGlobal Energy Mix], Zeitschri$ für Energiewirtscha$, Vol. 35, No. 1, Wiesbaden, Germany,pp. 1-13 (in German).
Trüby, J. and M. Paulus (2011), Market Structure Scenarios in Interna#onal Steam CoalTrade, Ins!tute of Energy Economics, Working Paper Series 11/02, University of Cologne,Cologne, Germany.
Tu, J. (2010), Industrial Organiza#on of the Chinese Coal Industry, Freeman Spogli Ins!tute forInterna!onal Studies at Stanford University, Working Paper No. 103, Stanford, United States.
US DOE/EIA (United States Department of Energy/Energy Informa!on Administra!on)(2011), Annual Energy Review 2009, US DOE, Washington, DC.
VDKI (Verein der Kohlenimporteure – German Hard Coal Importer’s Associa!on) (2010),Annual Report 2010 – German Hard Coal Importer’s Associa#on, VDKI, Hamburg, Germany.
Wang, H. and N. Horii (2008), Chinese Energy Market & Reform on Pricing Mechanisms –Case Study and Analysis of Shanxi’s Experiment, Ins!tute of Developing Economies, Chiba,Japan.
World Coal Ins!tute (2005), The Coal Resource: A Comprehensive Overview of Coal, WorldCoal Ins!tute, London.
© O
EC
D/IE
A, 2
011

656 World Energy Outlook 2011 - ANNEXES
PART D: SPECIAL TOPICS
Chapter 12: The implications of less nuclear power
IAEA (Interna!onal Atomic Energy Agency) (2011), PRIS Database,www.iaea.org/ programmes/a2/, accessed August 2011.
IEA (Interna!onal Energy Agency) (2010), Technology Roadmap – Nuclear Energy, OECD/IEA, Paris.
NEI (NuclearEnergy Ins!tute) (2010),Factsheet:Nuclear Industry’sComprehensiveApproachDevelops Skilled Work Force for the Future, NEI, Washington, DC, September.
ORISE (Oak Ridge Ins!tute for Science and Educa!on) (2010), Nuclear EngineeringEnrolments and Degrees Survey, 2009 Data, ORISE, Knoxville, United States.
WNA (World Nuclear Associa!on) (2011), Nuclear Power in the USA, WNA, London, June.
Chapter 13: Energy for all
ADB (Asia Development Bank) (2009), Energy for All: Vietnam: Boos#ng Biogas, ADB,Manila.
AFD (Agence Française de Développement) (2011), “The Paris-Nairobi Climate Ini!a!ve:Access to Clean Energy for All in Africa and Countries Vulnerable to Climate Change”,background document to Clean Energy for All Conference, Paris, 21 April.
AGECC (Secretary-General’s Advisory Group on Energy and Climate Change) (2010), Energyfor a Sustainable Future Summary Report and Recommenda#ons, UnitedNa!ons, New York.
ARE (Alliance for Rural Electrifica!on) (2011a), Hybrid Mini-Grid for Rural Electrifica#on:Lessons Learned, ARE, Brussels.
— (2011b) Rural Electrifica#on with Renewable Technologies, Quality Standards andBusiness Models, ARE, Brussels.
Ashden Awards (2006), Case Study: Biogas Sector Partnership, Ashden Awards, London.
— (2008), Grameen Shak#, Bangladesh: Rapidly Growing Solar Installer Provides CleanCooking as Well, Ashden Awards, London.
— (2010), Case Study Summary: Ministry of Agriculture and Rural Development (MARD),Vietnam and Netherlands Development Organisa#on (SNV), Ashden Awards, London.
Budya, H. andM. Yasir Arofat (2011), “Providing Cleaner Energy Access in Indonesia throughthe Mega-project of Kerosene Conversion to LPG”, Energy Policy, Elsevier, Amsterdam,pp. 1-12.
Government of India (2008),Household Consumer Expenditure in India, 2006-07,Ministry ofSta!s!cs and Programme Implementa!on, Government of India, New Delhi.
— (2011), Key Indicators of Household Consumer Expenditure in India, 2009-10, Ministry ofSta!s!cs and Programme Implementa!on, Government of India, New Delhi.
© O
EC
D/IE
A, 2
011

Annex D - References 657
D
GPOBA (Global Partnership on Output-Based Aid) (2007), “Output-Based Aid in Senegal –Designing Technology-Neutral Concessions for Rural Electrifica!on”, OBApproaches NoteNo. 14, GPOBA, Washington, DC.
— (2009), “Output-Based Aid in Ethiopia: Dealing with the ‘Last Mile’ Paradox in RuralElectrifica!on”, OBApproaches Note No. 27, GPOBA, Washington, DC.
IEA (Interna!onal Energy Agency) (2006),World Energy Outlook 2006, OECD/IEA, Paris.
— (2010),World Energy Outlook 2010, OECD/IEA, Paris.
— (2011), Advantage Energy, Emerging Economies, Developing Countries and thePrivate-Public Sector Interface, OECD/IEA, Paris.
IFC (Interna!onal Finance Corpora!on) (forthcoming), Energy Access Business Models:Leveraging the Private Sector to Serve the Poor, IFC, Washington, DC, forthcoming.
IFC and World Bank (2010), “Solar Ligh!ng for the Base of the Pyramid – Overview of anEmerging Market”, Ligh#ng Africa Report, IFC andWorld Bank, Washington, DC.
IJHD (Interna!onal Journal of Hydropower and Dams) (2010), Interna#onal Journal ofHydropower and Dams World Atlas and Industry Guide, Aqua Media Interna!onal Ltd,Wallington, United Kingdom.
IPCC (Interna!onal Panel on Climate Change) (2011), “Hydropower”, Special Report onRenewable Energy Sources and Climate Change Mi#ga#on, IPCC, Geneva.
Lamech, R. and K. Saeed (2003), “What Interna!onal Investors Look for When Inves!ng inDeveloping Countries: Results from a Survey of Interna!onal Investors in the Power Sector”,Energy and Mining Sector Board Discussion Paper, No. 6, World Bank, Washington, DC.
Liu, H., and X. Hu (2010), “The Development and Prac!ce of Small Hydropower CleanDevelopment Mechanism Project in China”, China Water Power and Electrifica#on, Vol. 69,No. 9, pp. 8-14.
Marrey, C. and R. Bellanca (2010), GTZ-HERA Cooking Energy Compendium, GTZ-HERA,Eschborn, Germany.
Mathers, C. and D. Loncar (2006), “Projec!ons of Global Mortality and Burden of Diseasefrom 2002 to 2030”, PLoS Medicine, Vol. 3, No. 11, 28 November, Public Library of Science,Cambridge, United Kingdom.
Morris, E., et al. (2007),UsingMicrofinance to ExpandAccess to Energy Services: Summary ofFindings, Small Enterprise Educa!on and Promo!on Network (SEEP) Network, Washington,DC.
Phuangpornpitak, N. and S. Kumar (2007), “PV Hybrid Systems for Rural Electrifica!on inThailand”, Renewable and Sustainable EnergyReviews, Vol. 11, Asian Ins!tute of Technology,Klong Luang, Thailand, pp. 1530-1543.
Sanchez, T. (2010), The Hidden Energy Crisis: How Policies Are Failing the World’s Poor,Prac!cal Ac!on Publishing, London.
© O
EC
D/IE
A, 2
011

658 World Energy Outlook 2011 - ANNEXES
SNV Netherlands Development Organisa!on (2011), “Domes#c Biogas Newsle%er”, Issue 5,September, SNV, The Hague, Netherlands.
Smith, K., S. Mehta and M. Feuz (2004), “Indoor Air Pollu#on from Household Use ofSolid Fuels” in M. Ezza! et al. (eds.), Compara#ve Quan#fica#on of Health Risks: Globaland Regional Burden of Disease A%ributable to Selected Major Risk Factors, World HealthOrganiza!on, Geneva.
UNEP (United Na!ons Environment Programme) (2007), FinancingMechanisms and Public/Private Risk Sharing Instruments for Financing Small-Scale Renewable Energy Equipmentand Projects, UNEP, Paris.
UNDP (United Na!ons Development Programme) (2009), Bringing Small-Scale Finance tothe Poor for Modern Energy Services: What is the Role of Government?, UNDP, New York.
UNDP and World Health Organiza!on (2009), The Energy Access Situa#on in DevelopingCountries–AReviewon theLeastDevelopedCountriesandSub-SaharanAfrica,UNDP,NewYork.
UNDP, AEPC (Alterna!ve Energy Promo!on Centre) and Prac!cal Ac!on (2010), CapacityDevelopment for Scaling Up Decentralised Energy Access Programmes: Lessons from Nepalon its Role, Costs, and Financing, Prac!cal Ac!on Publishing, Rugby, United Kingdom.
WHO (World Health Organiza!on) (2004), “Indoor Smoke from Solid Fuel Use: Assessing theEnvironmental Burden of Disease”, Environmental Burden of Disease Series, No. 4, WHO,Geneva.
— (2008), The Global Burden of Disease: 2004 Update, WHO, Geneva.
World Bank (2008), Designing Sustainable Off-Grid Rural Electrifica#on Projects: Principlesand Prac#ces, World Bank, Washington, DC.
— (2009a), Africa Electrifica#on Ini#a#ve Workshop, proceedings of conferenceheld 9-12 June, Maputo, Mozambique, World Bank, Washington, DC.
— (2009b) “Africa’s Infrastructure, a Time for Transforma!on”, World Bank AfricaInfrastructure Country Diagnos#c, World Bank, Washington, DC.
— (2011), State and Trends of the Carbon Market 2011, World Bank, Washington, DC.
Yadoo, A. and H. Cruickshank (2010), “The Value of Co-opera!ves in Rural Electrifica!on”,Energy Policy, Vol. 38, No. 6, Elsevier, Amsterdam, pp. 2941-2947.
Chapter 14: Developments in energy subsidies
Arze del Granado, J., D. Coady and R. Gillingham (2010), “The Unequal Benefits of FuelSubsidies: A Review of Evidence for Developing Countries”, IMF Working Paper No. 10/202,Interna!onal Monetary Fund, Washington, DC, pp. 1-23.
IEA (Interna!onal Energy Agency) (2008), “Deploying Renewables, Principles for Effec!vePolicies”, OECD/IEA, Paris.
— (2010),World Energy Outlook 2010, OECD/IEA, Paris.
© O
EC
D/IE
A, 2
011

Annex D - References 659
D
IEA, OECD (Organisa!on for Economic Co-opera!on and Development), World Bank andOPEC (Organiza!on of the Petroleum Expor!ng Countries) (2011), Joint Report by IEA, OPEC,OECD and World Bank on Fossil-Fuel and Other Energy Subsidies: An Update of the G-20Pi%sburgh and Toronto Commitments, prepared for the G-20 Mee!ng of Finance Ministersand Central Bank Governors, Cannes, France.
F.O. Lichts (2011), “Revamping Brazil’s Sugar and Ethanol Industry Will Require Pa!ence”,World Ethanol and Biofuels Report, Vol. 9, No. 21.
GSI (Global Subsidies Ini!a!ve) (2010), Defining Fossil-Fuel Subsidies for the G-20: WhichApproach is Best, Global Subsidies Ini!a!ve of the Interna!onal Ins!tute for SustainableDevelopment, Geneva.
OECD (2011), Inventory of Es#mated Budgetary Support and Tax Expenditures Rela#ng toFossil Fuels in Selected OECD Countries, OECD, Paris.
REN21 (2011), Renewables 2011 Global Status Report, REN21, Paris.
Shenoy, B. (2010), Lessons Learned from A%empts to Reform India’s Kerosene Subsidy,Interna!onal Ins!tute for Sustainable Development, Winnipeg, Canada.
Tumiwa, F., et al. (2011), “A Ci!zen’s Guide to Energy Subsidies in Indonesia”, GlobalSubsidies Ini!a!ve of the Interna!onal Ins!tute for Sustainable Development, Geneva, andthe Ins!tute for Essen!al Services Reform, Jakarta.
Wagner, A. (2010), “ThreeDimensions of Fuel Pricing: Poli!cal Steps and Principles of Se#ngEffec!ve Fuel PricingMechanisms”, presented at theGSI-UNEPConference on Increasing theMomentum of Fossil-Fuel Subsidy Reform, Geneva, 14-15 October, www.globalsubsidies.org/files/assets/ffs_gsiunepconf_sess3_awagner.pdf.
© O
EC
D/IE
A, 2
011

© O
EC
D/IE
A, 2
011

© O
EC
D/IE
A, 2
011

© O
EC
D/IE
A, 2
011

© O
EC
D/IE
A, 2
011

IEA PUBLICATIONSPRINTED IN FRANCE BY SOREGRAPH, November 2011
(61 2011 24 1P1) ISBN: 978 92 64 12413 4
Cover design: IEA. Photo credits: © Image100/GraphicObsession
The paper used for this document and the forest from which it comes have receivedFSC certification for meeting a set of strict environmental and social standards.
The FSC is an international, membership-based, non-profitorganisation that supports environmentally appropriate, socially beneficial,
and economically viable management of the world’s forests.
FSC® C031289
© O
EC
D/IE
A, 2
011