
World Bank Documentdocuments.worldbank.org/curated/en/658101468740215… · ·...
108
WORLD BANK DISCUSSION PAPER NO. 359 Work in progress for public discussion Fe& b. I The Demand for Oil Products in Developing Countries I)e,,,lot Catvh, tShanel 1S. krtc,it, Public Disclosure Authorized Public Disclosure Authorized Public Disclosure Authorized Public Disclosure Authorized Public Disclosure Authorized Public Disclosure Authorized Public Disclosure Authorized Public Disclosure Authorized
-
Upload
vuongthien -
Category
Documents
-
view
214 -
download
1
Transcript of World Bank Documentdocuments.worldbank.org/curated/en/658101468740215… · ·...

WORLD BANK DISCUSSION PAPER NO. 359
Work in progress
for public discussion Fe& b. I
The Demand for OilProducts in DevelopingCountries
I)e,,,lot Catvh,tShanel 1S. krtc,it,
Pub
lic D
iscl
osur
e A
utho
rized
Pub
lic D
iscl
osur
e A
utho
rized
Pub
lic D
iscl
osur
e A
utho
rized
Pub
lic D
iscl
osur
e A
utho
rized
Pub
lic D
iscl
osur
e A
utho
rized
Pub
lic D
iscl
osur
e A
utho
rized
Pub
lic D
iscl
osur
e A
utho
rized
Pub
lic D
iscl
osur
e A
utho
rized

Recent World Bank Discussion Papers
No. 291 Transforming Payment Systems: Meeting the Needs of Emerging Market Economies. Setsuya Sato and David BurrasHumphrey
No. 292 Reguelated Deregutlation of the Financial System in Korea. Ismail Dalla and Deena KhatkhateNo. 293 Design Issutes in Ruiral Finance. Orlando J. Sacay and Bikki K. RandhawaNo. 294 Financing Health Services Throuigh User Fees and Insurance: Case Stuidiesfrom Sub-Saharan Africa. R. Paul Shaw and
Martha Ainsworth
No. 295 The Participation of Nongovernmental Organizations in Poverty Alleviation: The Case Study of the Honduiras SocialInvestment Fund Project. Anna Kathryn Vandever Webb, Kye Woo Lee, and Anna Maria Sant'Anna
No. 296 Reforming the Energy Sector in Transition Economies: Selected Experience and Lessons. Dale Gray
No. 297 Assessing Sector Institutions: Lessons of Experiencefrom Zambia's l dutcation Sector. Rogerio F. Pinto and Angelous J.Mrope
No. 298 Uganda's AIDS Crisis: Its Implicationsfor Development. Jill Armstrong
No. 299 Towards a Payments System Lawfor Developing and Transition Economies. Raj Bhala
No. 300 Africa Can Compete! Export Opporttunities and Challengesfor Garnients and Home Products in the European Market.Tyler Biggs, Margaret Miller, Caroline Otto, and Gerald Tyler
No. 301 Review and Olutlookfor the World Oil Market. Shane S. StreifelNo. 302 The Broad Sector Approach to Investment Lending: Sector Investmenit Programs. Peter Harrold and Associates
No. 303 Institutional Adjuistment and Adjusting to Instituitions. Robert Klitgaard
No. 304 Plutting Institutional Economics to Work: From Participation to Governance. Robert PicciottoNo. 305 Pakistan's Puiblic Agricultutral Enterprises: Inefficiencies, Market Distortions, and Proposalsfor Reform. Rashid Faruqee,
Ridwan Ali, and Yusuf Choudhry
No. 306 Grameen Bank: Performance and Stability. Shahidur R. Khandker, Baqui Khalily, and Zahed Khan
No. 307 The Uruguay Rouend and the Developing Economies. Edited by Will Martin and L. Alan Winters
No. 308 Bank Governance Contracts: Establishing Goals and Accouintability in Bank Restruictuiring. Richard P. RoulierNo. 309 Putblic and Private Secondary Education in Developing Couintries: A Comparative Stuidy. Emmanuel Jimenez and
Marlaine E. Lockheed with contributions by Donald Cox, Eduardo Luna, Vicente Paqueo, M. L. de Vera, andNongnuch Wattanawaha
No. 310 Practical Lessonsfor Africafrom East Asia in Industrial and Trade Plolicies. Peter Harrold, Malathi Jayawickrama, andDeepak Bhattasali
No. 311 The Impact of the Uruiguay Round on Africa. Peter Harrold
No. 312 Procuirement and Disbursement Manutalfor Projects with Community Participation. Gita Gopal
No. 313 Harnessing Information for Development: A Proposalfor a World Bank Grouip Strategy. Eduardo Talero and PhilipGaudette
No. 314 Colombia's Pension Reform: Fiscal and Macroeconomic Effects. Klaus Schmidt-Hebbel
No. 315 Land Quiality Indicators. Christian Pieri, Julian Dumanski, Ann Hamblin, and Anthony YoungNo. 316 Sustainability of a Government Targeted Credit Program: Evidence from Bangladesh. Shahidur R. Khandker, Zahed
Khan, and Baqui Khalily
No. 317 Selected Social Safety Net Programs in the Philippines: Targeting, Cost-Effectiveness, and Optionsfor Reform. KalanidhiSubbarao, Akhter U. Ahmed, and Tesfaye Teklu
No. 318 Private Sector Development During Transition: The Visegrad Couintries. Michael S. Borish and Michel Noel
No. 319 Edutcation Achievements and School Efficiency in Rural Bangladesh. Shahidur R. Khandker
No. 320 Houisehold and Intrahouisehold Impacts of the Grameen Bank and Similar Targeted Credit Programs in Bangladesh. MarkM. Pitt and Shahidur R. Khandker
No. 321 Clearance and Settlement Systemsfor Securities: Critical Design Choices in Emerging Market Economies. Jeff Stehm
No. 322 Selecting Development Projectsfor the World Bank. Jean Baneth
No. 323 Evalu(ating Pueblic Spending: A Frameworkfor Pueblic Expenditure Reviews. Sanjay Pradhan
No. 324 The Bangladesh Rural Advancement Committee's Credit Programs. Performance and Sustainability. Shahidur R.Khandker and Baqui Khalily
No. 325 Institutional and Entrepreneuirial Leadership in the Brazilian Science and Technology Sector:Setting a New Agenda.Edited by Lauritz Holm-Nielsen, Michael Crawford, and Alcyone Saliba
(Continuted on the inside back cover)

WORLD BANK DISCUSSION PAPER NO. 359
The Demand for OilProducts in DevelopingCountries
Dermot GatelyShane S. Streifel
The World BankWashington, D.C.

Copyright (D 1997The International Bank for Reconstructionand Development/THE WORLD BANK1818 H Street, N.W.Washington, D.C. 20433, U.S.A.
All rights reservedManufactured in the United States of AmericaFirst printing February 1997
Discussion Papers present results of country analysis or research that are circulated to encouragediscussion and comment within the development community To present these results with the leastpossible delay, the typescript of this paper has not been prepared in accordance with the proceduresappropriate to formal printed texts, and the World Bank accepts no responsibility for errors. Some sourcescited in this paper may be informal documents that are not readily available.
The findings, interpretations, and conclusions expressed in this paper are entirely those of the author(s)and should not be attributed in any manner to the World Bank, to its affiliated organizations, or tomembers of its Board of Executive Directors or the countries they represent. The World Bank does notguarantee the accuracy of the data included in this publication and accepts no responsibility whatsoeverfor any consequence of their use. The boundaries, colors, denominations, and other information shown onany map in this volume do not imply on the part of the World Bank Group any judgment on the legalstatus of any territory or the endorsement or acceptance of such boundaries.
The material in this publication is copyrighted. Requests for permission to reproduce portions of itshould be sent to the Office of the Publisher at the address shown in the copyright notice above. TheWorld Bank encourages dissemination of its work and will normally give permission promptly and, whenthe reproduction is for noncommercial purposes, without asking a fee. Permission to copy portions forclassroom use is granted through the Copyright Clearance Center, Inc., Suite 910, 222 Rosewood Drive,Danvers, Massachusetts 01923, U.S.A.
ISSN: 0259-210X
Dermot Gately is a professor of economics at New York University. Shane S. Streifel is an energyeconomist in the Commodity Policy and Analysis Unit of the World Bank's International EconomicsDepartment.
Library of Congress Cataloging-in-Publication Data
Gately, Dermot, 1943-The demand for oil products in developing countries / Dermot
Gately, Shane S. Streifel.p. cm. - (World Bank discussion paper ; 359)
Includes bibliographical references, (p. ).ISBN 0-8213-3891-91. Petroleum industry and trade-Developing countries.
I. Streifel, Shane S. II. Title. III. Series: World Bankdiscussion papers ; 359.HD9578.D44G38 1997338.2'7282'091724-dc2l 97-4242
CIP

Contents
FOREWORD . viiABSTRACT . ............................................... ixACKNOWLEDGMENTS ......................................... xiABBREVIATIONS AND ACRONYMS ................................ xii1. Introduction and Summary ........................................... 1
..1 Oil Demand in the Developing Countries 1971-93 .................... l1.2 Econometric Results and Implications ............................ 31.3 Organization of the Paper .................................... 5
2. World Data, by Region: Population, Income, Energy, and Oil Consumption ......... . 63. Data for 37 Developing Countries: Income, Population,
Energy, and Total Oil Consumption ........... .. ................ 123.1 1993 Snapshots: Heterogeneity across Countries ..................... 12
3.1.1 Income and Population: 1993 Snapshot ...................... 143.1.2 Energy Consumption and Population: 1993 Snapshot .... ......... 143.1.3 Oil Consumption and Population: 1993 Snapshot ................ 153.1.4 Oil's Share of Energy Consumption and Electric Power Generation:
1993 Snapshots ...................................... 173.2 Changes from 1971 to 1993: Per-Capita Income, Energy and Oil
Consumption--Heterogeneity across 37 Developing Countries,and in Comparison with OECD Countries .................... 21
3.2.1 Per-Capita Income: Changes from 1971 to 1993 ................ 233.2.2 Per-Capita Energy Consumption: Changes from 1971 to 1993 .... ... 243.2.3 Per-Capita Oil Consumption: Changes from 1971 to 1993 .... ...... 253.2.4 Oil's Share of Energy Consumption and Electric Power Generation ... . 26
3.3 Demand Changes Relative to Income Changes, 1971-93 ...... .......... 293.3.1 Energy Demand Changes vs. Income Changes, 1971-93 .... ....... 313.3.2 Oil Demand Changes vs. Income Changes, 1971-93 .... .......... 32
4. Consumption of Eight Major Oil Products: Data for 37 Developing Countries ... 334.1 1993 Snapshots ............. 33
4.1.1 Oil Products' Shares of Total Oil Consumption: 1993 Snapshots ... ... 334.1.2 Ratios of Oil Product Demand to Income: 1993 Snapshots .... ...... 36
4.2 Oil Products' Shares of Oil Consumption: Changes from 1971 to 1993 .. ..... 394.3 Changes in Individual Oil Product Demand vs. Changes in Income,
1971 to 1993 .......... ............................. 405. Important Phenomena Affecting Oil Demand .... 49
5.1 The Importance of Income Growth . ............ 495.2 Asymmetric Response to Income Decline in Oil-Exporting Countries .. ...... 495.3 Oil Demand Response to Oil Price Increases ........ .. .............. 515.4 Oil Demand Response to Oil Price Cuts ............ ............... 515.5 The Importance of Indigenous Energy Resources ....... .. ............ 545.6 Domestic Energy Policies ................ .................... 555.7 The Transition from Traditional Fuels to Modern Fuels ....... .......... 57
iii

Contents continued
6. Econometric Analysis of Demand for Eight Oil Products ........ .. ............. 606.1 Specifications of Per-Capita Oil Product Demand Equations .... .......... 606.2 Estimated Elasticities of Oil Product Demand with Respect to
Price and Income .................................... 627. Projections of Oil Product Demand .. 748. Conclusions .. 80
Appendix A: Supplementary Tables ...... 84
References ....... 87
List of Figures
1. Population, 1971-93 .............................................. 62. Real Income, Energy and Oil Consumption, 1971-93: Total and Per-Capita .... ...... 83. Energy Consumption vs. Income, Per-Capita, 1971-93 ....................... 94. Oil Consumption vs. Income, Per-Capita, 1971-93 .......................... 105. Energy Consumption by Fuel: 1971-93 ................................. It6. Income vs. Population, 1993 ................ ........................ 147. Energy Consumption vs. Population, 1993 ............................... 148. Oil Consumption vs. Population, 1993 ................................ 159. Oil Consumption, 1993 and 1971 ................................. 1610. Fuel Shares of Modern Energy, 1993 .................................. 1811. Fuel Shares of Energy including Biomass, 1993 ............ ................ 1912. Fuel Shares of Electric Power, 1993 ................................... 2013. Average Annual Growth in Per-Capita Income, 1971-93
vs. Standard Deviation of Annual Growth ................................ 2314. Per-Capita Energy Consumption, 1993 vs. 1971 ........................... 2415. Per-Capita Oil Consumption, 1993 vs. 1971 .............................. 2516. Oil's Share of Energy Consumption, 1993 vs. 1971 ......................... 2617. Oil's Share of Electric Power Generation, 1993 vs. 1971 ...................... 2718. Ratios, 1993/1971: Per-Capita Energy Demand vs. Per-Capita Income .... ......... 3119. Ratios, 1993/1971: Per-Capita Oil Demand vs. Per-Capita Income ............... 3220. Oil Product Shares of Oil Consumption, 1993 ............................. 3421. Dispersion across Countries of 1993 Oil/GDP Ratios, for Total Oil
and Eight Products ............. .................................. 3822. Shares of Eight Oil Products, 1993 vs. 1971 .............................. 3923. Ratios, 1993/1971: Per-Capita Gasoline Demand vs. Per-Capita Income .... ........ 4024. Ratios, 1993/1971: Per-Capita Diesel Demand vs. Per-Capita Income ... ..... 4125. Ratios, 1993/1971: Per-Capita Jet Fuel Demand vs. Per-Capita Income .... ........ 4226. Ratios, 1993/1971: Per-Capita Heavy Fuel Oil Demand vs. Per-Capita Income ... .... 4327. Ratios, 1993/1971: Per-Capita Kerosene Demand vs. Per-Capita Income .... ....... 4428. Ratios, 1993/1971: Per-Capita LPG Demand vs. Per-Capita Income .... .......... 4529. Ratios, 1993/1971: Per-Capita Naphtha Demand vs. Per-Capita Income .... ........ 47
iv

Figures continued
30. Ratios, 1993/1971: Per-Capita Other Oil Demand vs. Per-Capita Income .... ....... 4831. Oil Demand vs. Income, Per-Capita, 1971-93: India, Peru,
South Korea, and Saudi Arabia ....................................... 5032. World Price of Crude Oil, 1971-93 .................................... 5133. Energy and Oil Demand vs. Income, Per Capita, 1971-93: South Korea and OECD ... . 5234. Oil Price vs. Oil's Fuel Share of Energy, 1971-93: South Korea and OECD .... ..... 5335. Oil's Fuel Share of Modern Energy, 1971-93: South Korea, OECD, and India .. ..... 5436. Indonesia: Energy and Oil Demand vs. Income, Per-Capita, 1971-93 .... .......... 5737. South Korea: Fuel Use in Residential and Commercial Sectors, 1971-93 .... ........ 5838. Indonesia: Fuel Use in Residential and Commercial Sectors, 1971-93 .... .......... 5839. Biomass Share of Energy, 1993 vs. 1971 ................................ 5940. Total Oil Consumption vs Real Income: History 1971-93 and Projections to 2010--
China, Other Asia, Other LDC, OPEC & Mexico .7841. Oil Consumption vs. Income, Per-Capita: History 1971-93 and Projections
to 2010 -- China, Other Asia, Other LDC, OPEC & Mexico ................... 79
List of Tables
1. Levels for Oil and Energy Consumption, Income, and Population for 1993 .... ...... 132. Per-Capita Levels of Oil and Energy Consumption, and of Income,
for 1971 and for 1993 ............................................. 223. Oil's Share of Energy and of Electric Power, 1971 and 1993 ................... 284. 1993/1971 Ratios for Per-Capita Values of Income, Energy, Oil, and
Oil Product Consumption . .......................................... 305. Oil Product Consumption, 1993 ..................................... 356. Oil/GDP Ratios for Total Oil and Eight Products, 1993 ....................... 377. Gasoline Demand Equations: Long-run Elasticities ............ ........... 668. Diesel Demand Equations: Long-run Elasticities ........................... 679. Jet Fuel Demand Equations: Long-run Elasticities .......................... 6810. Heavy Fuel Oil Demand Equations: Long-run Elasticities ..................... 6911. LPG Demand Equations: Long-run Elasticities ............................ 7012. Kerosene Demand Equations: Long-run Elasticities ......................... 7113. Naphtha Demand Equations: Long-run Elasticities .......................... 7214. Other Oil Product Demand Equations: Long-run Elasticities ................ 7315. Long-run Elasticities of Regional Oil Product Demand with Respect to
Income and Crude Oil Price .............. .......................... 7516. Historical and Projected Growth Rates and Oil Product Shares .................. 76
Appendix Tables
Table Al. Per-Capita Oil, Energy and Income:Absolute Change 1971-93, and Average Annual Growth .................. 85
Table A2. Average Annual Growth Rate of Oil Consumption, 1971-93 ..... ........... 86
v


FOREWORD
Oil and energy markets have experienced dramatic changes over the past two decades, but there
remains considerable uncertainty about future developments in the world oil market. High prices in the
1970s and 1980s induced significant improvements in energy efficiency and substitution from oil to
alternative fuels. Since the decline in prices in 1986 oil demand growth has rebounded, but at a much
slower rate than prior to the major oil price increases of 1970s. In addition, large declines in the former
Soviet Union and Eastern Europe have reduced the aggregate level of world demand. However, oil
demand is now set to rise in all main regions led by rising incomes, population, industrialization,
investment and trade. Most of the growth is generally expected to occur in the developing countries.
This study examines the growth in demand for eight major oil products for 37 developing countries
over the 1971-1993 period. It analyzes the relationships and changes over time for income, population,
energy and oil product demand for each of these developing countries. The paper shows the extreme
heterogeneity among these countries, not only among themselves but compared with the relative
homogeneity of the developed countries. Some of the important phenomena that affect oil demand are
examined, and income and price elasticities are calculated for each of the products in all countries. Based
on these results, it appears that the medium-term future will be like the past, with oil demand growing
about as fast as income.
Rapidly rising oil demand in the developing countries has significant implications for the petroleum
industry, governments and the world oil market. The increasing concentration of oil demand in the
developing countries could alter crude oil trade flows, requiring more oil from the Middle East. Greater
dependence on oil from the Middle East due to higher demand does not necessarily imply higher oil prices.
Much will depend on trends in non-OPEC supplies, OPEC's share of the world oil market, and the pricing
policies of key oil exporting countries.
This study is part of ongoing efforts of the International Economics Department of the World Bank
to evaluate and project developments in world markets of major commodities. The analysis and
conclusions of this report should provide a basis for further public debate on these issues.
Masood Ahmed
Director
International Economics Department
vii


ABSTRACT
This paper examines the growth in oil product demand over the 1971-1993 period for 37
developing countries (outside the former Soviet Union and Eastern Europe). These countries represent
90% of oil demand for the developing countries, and nearly 70% of the world's population. Relationships
and changes over time for energy and total oil demand with respect to income and population are examined
for each of the countries and presented graphically. The paper then focuses on the 8 major petroleum
products--liquefied petroleum gases (LPG), naphtha, gasoline, jet fuel, kerosene, diesel (gasoil), heavy fuel
oil, and other products--which are similarly examined and presented. Some of the important phenomena
that affect oil demand are analyzed. Income and price elasticities are calculated for each of the eight major
oil products in all 37 countries. Based on these results, projections of oil demand to 2010 are presented.
Over the 1971-1993 period, world oil demand increased by 18.3 million barrels per day or 37%.
Over three quarters of the net growth occurred in the developing countries, rising at an average rate of 5 %
p.a. Oil demand in the developing countries nearly tripled over this period, and its share of world oil
demand rose from 15 % to nearly one third. Despite the growth of per-capita oil demand in the developing
countries, the level is still only about one-tenth as great in the developing countries as in the OECD.
The 37 countries are extremely heterogeneous in many dimensions, not only among themselves
but compared with the relative homogeneity of the developed countries. Oil's share of energy varies
widely, from less than 20% in China and South Africa to more than 90% in Singapore and Jamaica. Over
the 1971-1993 period, oil's share of energy demand declined, as in the developed countries, but for some
countries oil's share has not changed, while in others it has increased, e.g. oil-exporting countries. Oil's
share in power generation is relatively high, varying as widely as possible across countries--from zero in
South Africa to 100% in Singapore. There are also significant differences across countries in the
composition of oil demand, especially for the shares of heavy oil, naphtha and kerosene. The share of
transportation products ranges from one-fourth in Singapore, to one-half in China, two-thirds in Brazil,
and four-fifths in South Africa. Oil/income ratios vary widely across countries for most products, and
changes in demand have also varied widely, both absolutely and relative to changes in income.
OECD oil consumption has been affected more by oil price changes than by income changes, and
more by oil price increases than by price cuts. In the 37 developing countries, there has been a much
greater demand response to income growth than to changes in oii prices. Moreover, there has been greater
demand response to the oil price cuts of the 1980s, in contrast to the OECD where there has been relatively
ix

little demand response to the price cuts. For many oil-exporting countries, oil consumption has responded
asymmetrically to changes in income: increasing rapidly when income is growing, and continuing to
increase--albeit more slowly--even when income is declining.
Although the growth of oil demand is primarily influenced by income growth, there has been
substantial fuel-switching in response to the oil price increases of the 1970s--especially in power
generation. However, since the oil price decline in 1986, there has been a significant rebound in oil-use
to generate electricity in some countries. Other factors affecting oil demand are a country's endowment
of domestic energy resources, and the transition to modern fuels from traditional energy sources.
Overall, the econometric results of the eight major oil products were fairly good for gasoline,
diesel, LPG, and "other oil" products. Results were mixed for jet fuel and heavy oil, and quite
unsatisfactory for naphtha and kerosene. Income was the most important explanatory variable, and the oil-
exporting countries often displayed an asymmetric response to income increases and decreases. In only
about a third of the cases was the price of crude oil significant, and the estimated elasticities were small
relative to the income elasticity. The evidence on whether demand responded symmetrically to oil price
increases and decreases was mixed: some products in some countries appeared to respond symmetrically,
and others asymmetrically.
The econometric results and analysis suggest that the medium term future will be like the past.
With continued growth in real income in the developing countries, oil demand should grow about as fast
as income. This implies a doubling of their oil demand by year 2010, relative to their 1993 levels. The
largest growth will continue to be in Asia. However different oil demand patterns may unfold given many
uncertainties with respect to technology, industrialization, urbanization, penetration of alternative fuels,
macroeconomic and financial performance, and government policies.
Rising oil demand in the developing countries has significant implications for the world oil market,
governments and industry. The increasing concentration of oil demand in the developing countries could
alter all crude oil trade flows, and require more oil from the Middle East. Greater dependence on oil from
the Middle East due to higher demand does not necessarily imply higher oil prices; much will depend on
non-OPEC supplies, OPEC's share of the world oil market, and pricing policies of key oil exporting
countries. Higher demand for petroleum products will necessitate greater refining capacity. Should the
demand barrel become lighter, and the supply barrel heavier as generally expected, greater upgrading
capacity will be required to produce transport fuels and other light products. Much will depend on trends
in heavy fuel oil consumption, especially in power generation. While higher oil demand is associated with
higher incomes and rising standards of living, it can also mean greater emissions, pollution and congestion
from oil use. Government policies can greatly influence these trends through pricing and other initiatives.
x
ACKNOWLEDGMENTS
The views expressed in this paper are solely those of the authors. Critical conmments are gratefully
acknowledged from Taka Akiyama, Clive Armstrong, Douglas Barnes, Carol Dahl, Peter Davies, Thuvara
Nayar, William Porter, Joerg-Uwe Richter, and Jayant Sathaye. Any errors or omissions are the
responsibilities of the authors.
The authors thank Jean Jacobson for assisting in preparation of the final report.
xi

ABBREVIATIONS AND ACRONYMS
FSU & EE Former Soviet Union and Eastern Europe
GDP Gross Domestic Product
HFO Heavy Fuel Oil
I EA Internationial Energy Agency
LDC Less Developed Countries
LPG Liquefied Petroleum Gas
mb/d million barrels per day
MTOE Million Tons of Oil Equivalent
OECD Organization of Economic Cooperation and Development
OPEC Organization of Petroleum Exporting Countries
UAE United Arab Emirates
xii

1. Introduction and Summary
This paper analyzes the growth in oil product demand since 1971 in the developing countries, defined
as those countries outside the Organization for Economic Cooperation and Development (OECD), the former
Soviet Union and Eastern Europe (FSU & EE). Much of the growth in world demand over the past two
decades has occurred in the developing countries. Over the 1971-1993 period, world oil demand increased
by 18.3 million barrels per day (mb/d) or 37%. Of this increase, 14.2 mb/d occurred in the developing
countries, where oil demand grew at an average annual rate of 5 %. OECD oil demand was only moderately
higher, as consumer behavior was severely impacted by the large oil price increases in 1973-74 and 1979-80.
Demand in the FSU & EE also was only modestly higher, having been affected by the enormous economic
and political transformations in recent years.
Oil demand in the developing countries nearly tripled over the 1971-93 period, and its share of world
oil demand more than doubled, from 15 % to nearly one-third. Since most of the future growth in oil demand
is generally expected to occur in the developing countries, it is important to understand where its growth has
occurred, the main driving forces, and what the implications are for future patterns of oil consumption in these
countries. Expected growth in oil demand has significant implications for both oil-importing and oil-exporting
countries, the refining industry, government policies, and for the world oil market, including oil prices.
The analysis focuses on the 37 largest oil-consuming developing countries, which represent 90% of
oil demand for this group, and nearly 70% of the world's population. For each of these countries we analyze
the relationships and changes over time for income, population, energy and oil demand. We then focus on
the 8 major petroleum products -- liquefied petroleum gases (LPG), naphtha, gasoline, jet fuel, kerosene,
diesel (gasoil), heavy fuel oil (HFO), and "other" oil products -- and analyze some of the important
phenomena that explain many of the changes in demand for these products. Income and price elasticities are
calculated for each of the eight major oil products in all 37 countries. Based partly on these econometric
results, projections of future demand are presented. The main conclusions of the paper follow.
1.1 Oil Demand in the Developing Countries 1971-93
The paths of per-capita oil consumption for the different regions of the world have varied widely since
1971. In the OECD, per-capita oil consumption declined after oil prices increased, especially after the
1979-80 price increase, but has remained flat since the early 1980s. In China, it has grown at a slower rate
than income, while in the rest of Asia it risen about as rapidly as income. Consumption in the oil-exporting
countries once surged when their income grew, and it has continued to grow -- albeit more slowly -- even
though per-capita incomes have been stagnant or declining. In the other developing countries and in
I

FSU & EE, per-capita consumption once increased in proportion to income growth but over the last decade
has decreased in proportion to income decline.
The 37 developing countries are extremely heterogeneous in many dimensions, not only among
themselves but compared with the relative homogeneity of the developed countries. For example, the 1993
levels of per-capita income, energy and oil consumption for the 37 countries range across two orders of
magnitude. Oil's share of energy varies widely: from less than 20 % in China and South Africa to more than
90% in Singapore and Jamaica. Over the 1971-1993 period, oil's share of energy demand has declined in most
developing countries, as it has in the OECD countries, but it has increased in a few oil-exporting countries.
Oil's share of power generation is relatively high in the developing countries, although it ranges as widely as
possible -- from zero in South Africa to 100% in Singapore.
There are also significant differences across countries in the composition of the demand barrel
consumed, especially for the shares of heavy fuel oil, naphtha and kerosene. Similarly, there is a wide range
in the share of transportation products: from one-fourth in Singapore, to one-half in China, two-thirds in
Brazil, and four-fifths in South Africa. Oil/income ratios vary widely across countries for most products, and
changes in demand over the 1971-93 period have also varied widely, both absolutely and relative to changes
in income.
Despite the growth of per-capita oil demand in the developing countries and its reduction in the
OECD, the level is still only one-tenth as great (on average) in the developing countries as in the OECD.
Thus there remains enormous potential for large demand growth in these countries, depending on the structure
and pace of economic development.
A number of important phenomena affecting oil demand were analyzed, in an attempt to explain the
changes in consumption over the period. Since 1971, OECD oil consumption has been affected more by oil
price changes than by income changes, and more by oil price increases than by price cuts. In the 37
developing countries, in contrast, there has been a much greater demand response to income growth than to
changes in oil prices. Moreover, there has been greater demand response to the oil price cuts of the 1980s,
in contrast to the OECD where there has been relatively little demand response to the price cuts.
For many oil-exporting countries, oil consumption has responded asymmetrically to changes in
income: increasing rapidly when income is growing, and continuing to increase -- albeit more slowly -- even
when income is declining.
Although the growth of energy and oil demand is primarily influenced by income growth, there has
been substantial fuel-switching away from oil in response to the oil price increases of the 1970s, as well as
some increase in fuel efficiency. The fuel-switching is most obvious in electric power generation. However,
in a few countries there has been a significant rebound in oil-use in power generation since the 1986 collapse
in world oil prices, notably in South Korea, Taiwan and Thailand.
2

A country' s endowment of domestic energy resources is an important factor in understanding some
countries' demand for oil and energy. This is most obvious for the oil-exporting countries, which have
abundant reserves of oil and natural gas. Some oil importing countries have other energy resources, e.g., coal
in China, India, and South Africa, and hydroelectric power in most South American countries, and they
consume large amounts of these resources.
Governments intervene in energy markets in a number of ways but mainly through pricing policies,
access to markets, and import policies. Some governments have subsidies on most or all petroleum products,
particularly in oil-producing countries. At the other extreme, many countries have moved to market prices,
or are nearly there. However, a large number of countries have subsidies on household fuels, notably LPG
and kerosene (and electricity); these are sometimes accompanied by import controls and rationing, which leads
to supply deficiencies and a array of market problems. In many countries these prices are cross-subsidized
with taxes on transport fuels and other oil products. While subsidies are set so as to provide modern fuels to
lower income households and lessen the impact on biomass resources and the environment, governments face
difficult decisions trying to meet diverse objectives simultaneously. Nevertheless, government polices can
greatly affect consumption patterns of all fuels, modern and traditional.
The transition from traditional, biomass fuels to modern fuels has an important influence on the growth
of demand for oil products, especially in the residential sector. During the transition phase, the growth of
modem fuels is driven by income growth and also by substitution for traditional fuels. This transition has been
virtually completed in South Korea which will slow its rapid growth of modern fuel use, but this transition has
a long way to go in many other countries.
1.2 Econometric Results and Implications
For each of the products and each of the countries, we examined several alternative equation
specifications of per-capita oil product demand as a function of per-capita real income and the real price of
crude oil. Overall, the results were fairly good for gasoline, diesel, LPG, and "other" oil products. Results
were mixed for jet fuel and heavy fuel oil, and quite unsatisfactory for naphtha and kerosene. Income was
the most important explanatory variable, and the oil-exporting countries often displayed an asymmetric
response to income increases and decreases. In only about a third of the cases was the price of crude oil
significant, and the estimated elasticities were small relative to the income elasticity. The evidence on whether
demand responded symmetrically to oil price increases and decreases was mixed, at best: some products in
some countries appeared to respond symmetrically, and others asymmetrically.
Analysis based on the econometric results suggests that the medium-term future will be like the past.
With continued growth in real income in the developing countries, oil demand should grow about as fast as
income. This implies a doubling of their oil demand by the year 2010, relative to their 1993 levels. The
3

largest growth will continue to be in Asia.
In developing countries where per-capita income is growing, oil demand should continue growing at
about the same rate as income. But where per-capita income is declining, per-capita oil demand will also
decline -- except in the oil-exporting countries, where oil consumption continues to increase despite declining
per-capita income.
Transportation oil demand (about half of the barrel consumed, on average) ought to grow at least as
fast as income, in virtually all developing countries. The growth of demand for heavy fuel oil and naphtha
are less easily predicted, and are more dependent on government policies regarding electric power generation
and expansion of the petrochemical industry, respectively. Kerosene in most countries appears to be an
inferior good, whose use declines as it is replaced by higher quality fuels as incomes rise, and these fuels
become available or affordable, or both. Government policies and prices can greatly affect demand for this
fuel. For LPG, consumption is also influenced by government policies regarding taxes and subsidies in the
residential sector; its demand could grow at least as rapidly as income, especially in those countries where the
transition to modem fuels is an important phenomenon. Demand for "other" oil products could also grow as
rapidly as income.
However there are many uncertainties that may result in different oil demand patterns unfolding, e.g.,
technology changes, the degree of industrialization, urbanization, penetration of alternative fuels notably
natural gas, macroeconomic performance, and government policies with respect to subsidies, taxation,
traditional fuel use and other issues. At some point there will be saturation effects and a slowdown in energy
demand growth, as already being witnessed in South Korea. Given the extreme heterogeneity of the
developing countries, it is difficult to predict when turning points may occur or how long-term economic and
energy developments will proceed in the various regions.
Rapidly rising oil demand in the developing countries has significant implications for the petroleum
industry, governments and the world oil market. Obviously, greater product demand will require greater
refining capacity. Countries have the choice of building refineries for domestic use or export, or importing
oil products. Should the demand barrel become lighter (and the supply barrel become heavier) as is generally
expected, it means that greater upgrading capacity will be required to supply transport fuels and other light
products. However, much could depend on trends in heavy fuel oil consumption, especially in power
generation.
The increasing concentration of oil demand in developing countries, and in Asia in particular, could
alter trade flows of crude oil. More crude (and possibly products) will be required from the Middle East to
supply growing demand in Asian and other markets. Greater dependence on Middle East oil does not
necessarily imply higher oil prices, although higher demand will add upward pressure, all else equal.
However, much will depend on trends in non-OPEC supplies, OPEC's share of the world oil market, and the
4

pricing policies of key oil-exporting countries.
Higher oil demand has obvious benefits and costs in those countries where demand is rising rapidly.
Greater oil (and energy) demand is associated with higher incomes and raised standards of living. However,
it can also mean greater emissions, pollution and congestion from higher oil use. Government policies can
influence these trends through pricing and other policies. Subsidized prices distort markets and send improper
signals to consumers, causing even greater consumption. On the other hand, excessively taxed products can
adversely affect economic activity and consumer welfare.
1.3 Organization of the Paper
The paper is organized in the following manner. In Section 2 we summarize the world's growth by
main geographical region or grouping over the 1971-1993 period, for population, income, energy and oil
consumption. In Section 3 we focus on these same variables for the 37 developing countries. With so many
countries and variables, we attempt to synthesize the data and changes over time graphically, e.g., 1993
snapshots of the data; per-capita changes over time; and per capita changes versus income changes over the
period. We describe the extreme heterogeneity of these countries, both among themselves, and also compared
with the relative homogeneity of the OECD.
In Section 4, we similarly analyze demand for the 8 major oil products in the 37 countries. Section
5 describes some of the important phenomena that explains some the changes that have occurred in the demand
for the individual petroleum products.
Several specifications of the demand equation are presented in Section 6, and income and price
elasticities are calculated for the 8 products for each of the 37 countries. Based on these results, the
implications for oil demand growth to the year 2010 are projected in Section 7. Finally, the summary and
conclusions are presented in Section 8.
5

2. World Data, by Region:
Population, Income, Energy, and Oil Consumption
First we summarize graphically the world's data since 1971 for population, real income, energy and
oil consumption, both total and per-capita levels. We divide the world into six regions:
* Organization for Economic Cooperation and Development (OECD);'
* the Former Soviet Union and Eastern Europe (FSU & EE);
* OPEC and Mexico2 , the major oil exporters (OPEC & Mexico);
* China;
* Other Asia (excluding Japan, China, and Indonesia); and
* Other Less Developed Countries3 (LDC): excluding all countries already identified.
The source of our energy and oil data is the International Energy Agency (IEA), Energy Statistics and
Balances of Non-OECD Countries. Population data and data on real income are from the World Bank
(income is measured in 1987 US $, using 1987 exchange rates for all years).
In each of these first few graphs, the igure 1. Population (millions), 1971-93
vertical scales are logarithmic, to allow easy 2000 r --
comparison of the slopes of various regions' other 4>ia
curves, which measure their annual growth Ch'
rates. We show first the population of these six .... .°°°.......-.-.
regions in Figure 1. World population grew 0' - _____
from 3.5 billion in 1971 to 5.1 billion in 1993, E 700 -5_600 Othe LD -- ~
at an average rate of 1.74% per year. The X2
fastest growth rate has been in Other LDC 0. , -6' OPEC & Mexico00.400 f - __ __ ,,,, __ _ _ _
(2.71%), followed closely by OPEC & Mexico ,-400
(2.62%), then Other Asia (2.17%) and China 300
(1.54%). Much slower population growth has
been experienced in the OECD (0.76%), and in 200 1 1r1971 1976 1981 186 1991
FSU & EE (0.72%).
Not included in our "OECD" group are three new OECD members, the Czech Republic, Hungary,and Mexico.
2 Mexico was combined with OPEC because of its size as an oil exporter, and because its oilconsumption behavior is similar to that of most OPEC members.
3 The term "LDC" is used only for convenience.
6

In Figure 2 we show:
* Real income (billions 1987$), and real income per capita (1987 $/person)
* Energy consumption (MTOE: million tons oil-equivalent), and energy consumption per capita
(tons of oil-equivalent/person); only modern energy is included: traditional, biomass energy
consumption is not included
* Oil consumption (MT: million tons), and oil consumption per capita (tons/person)4
We see the steady growth of real income in the OECD and Other Asia, and the rapid but irregular growth of
China. In other regions, income has been stagnant, as in OPEC & Mexico after 1978, and in the Other LDC
in the 1980s. In FSU & EE, growth slowed in the early 1980s and total income actually declined since the
late 1980s.
Total energy consumption (modern energy only5) generally has moved together with income, except
in regions such as OPEC & Mexico and Other LDC, where income has been stagnant but energy has continued
to grow. Per-capita energy consumption has also been increasing in most regions, except in Other LDC tor
more than a decade and in FSU & EE since the late 1980s.
Oil consumption has moved closely with income in some regions such as Other Asia and China, but
its growth in the OECD was affected dramatically by the oil price increases of the 1970s. In per-capita terms,
oil consumption has taken several different paths, especially since the 1979-80 oil price increases. It has
increased rapidly in China and Other Asia, but from very low levels. In OPEC & Mexico, its growth has
slowed dramatically. In the other three regions -- the OECD, Other LDC, and FSU & EE -- per-capita oil
consumption has declined substantially.
4 One million tons of oil per year equals approximately 20,000 barrels of oil per day.
5 Traditional biomass fuels such as fuel wood are important in many countries. Their fuel share isincluded in Figure 11, and their importance is discussed in Section 5.7.
7

Figure 2. Real Income, Energy and Oil Consumption, 1971-93: Total and Per-Capita
20000 -- _20000 - j__o__t_Per CReal Income OC12aia(197;
7000 000soo._ seoo _ _ .
.0@0 _ _ . 50004000 4000
3000 3000 _Eastern Europe & Fonrmerovietjnion
2000 2000
Eastern Europe & . .... OPEC & MexicoOPEC & Mexico Former Soviet Union
7O -7 0 - - DC0
s00 500O
400 400 . .............~. 50300 i Other0 LDC 300 Other Asia
200 C 200
70 701971 1976 1981 1986 1991 1971 1976 1981 1986 1991
5o00 Energy Consumption (MTOE) - 5 Energy Per Capita (toe/person) OECD
4000 4
3000 OEasern Europe & Former Soviet Uni
2000 - Eastern Europe & Form n 2
1000 _O_P1 EC & Mexjco900 X00
700 7600 0.6 Other LDC
500~~~~~~~~~~~~~~~~~~~~~~~~.
4004
OPEC & Mexico
100 0.1 '1971 1976 1981 1986 1991 1971 1978 1901 1998 1991
2000 3 Oil Per Capita (tons/person)Oil ConsumptionOECD 2
(million tons)1000900S00700 tEastern Europe & Former Soviet U0
600 07
400 060.5 OPEC & Mexi ------ -.----------'
300 04OPEC&M,xIco- **. . 04o
… -~~~~~~~~0200 Other LD
Other Asia Ch 0.2 OtherAsia
100
70 -0.09
60 = ___ °0.°0°8 . 0.050 007.06
40 0.051971 1976 1981 1906 1991 1971 1976 1901 1906 1991

However, simple comparisons across regions within a single graph in Figure 2 can be misleading.
For example, within the graphs of per-capita energy or oil consumption, two regions may appear to have quite
similar consumption patterns over time. However, relative to income growth, their consumption patterns may
be quite different between regions.
To highlight such differences, we plot in Figure 3 the 1971-93 time-paths of per-capita energy
consumption vs. income, for each of the six regions; the circular marker depicts the 1993 values. Figure 4
is a similar graph for per-capita oil consumption vs. income. The axes are scaled logarithmically, which
allows for the two order-of-magnitude differences among regions. Logarithmic scales also facilitate
percentage comparisons across regions of oil and/or income growth. Movement parallel to the dashed,
diagonal lines indicates equi-proportional changes in oil and income.
In all regions except OPEC & Figure 3. Energy Consumption vs. Income, Per-Capita,
Mexico, energy consumption has 1971-935
increased in rough proportion to 4 OECDin China where ~~E.Eur. OC
income growth, except in China where 3 & FSU
it has increased more slowly than , 2
income. When income declines, '2
energy consumption decreases in rough ' .s)1 ~~~~~~~OIPEC
proportion; this is most obvious in FSU 0 9Mex.
& EE, as well as in Other LDC. In 06 Chfna LDCOtC~~~~LC
OPEC & Mexico, energy consumption J 05 / f /.9 04 other
has increased continuously, almost Asia
regardless of income growth or decline. CL
The effects of the 1973-74 and 1979-80 02
oil price increases are obvious only in
the OECD, where we see the effects of 01
energy conservation after the 1979-80 per-capita income, 1971-93 (1987 S)
oil price increases. __---Relative to their income levels, China and FSU & EE have extremely high levels of energy
consumption, indicating relatively high energy intensity. China's 1993 income equals that of Other Asia in
1971, but its energy consumption is three times as great. Likewise, energy consumption levels in FSU & EE
are comparable to those in the OECD even though their income levels are only one-fifth as large.
9

In Figure 4 the differences Figure 4. Oil Consumption vs. Income, Per-Capita, 1971 93
across regions in the oil consumption 3 . OECD
vs. income relationship are similar to 2-
those in Figure 3 for energy. Oil
consumption in Other Asia has grown , . U7E.Eur. f90 &FSU
about as rapidly as income during _ 0.706 NCOPEC
1971-93. Similarly, in both Other a,> 0.5 &rt &Mex. p0.4~~~~~~1LDC and in FSU & EE there have been h-eC
03 ~~~~LDCyears when oil consumption has 0
~02oteincreased in rough proportion to . Other
income growth; but more recently, 0- Chhina010
there have been periods when oil 0 0 X0.7
conrsumption has declined in proportion 0 06
0 05
to income declines. In contrast to those 004 DN |
reductions in oil consumption when , v /per-capita income, 1971-93 (1987 $)
income declines, OPEC & Mexico __ _ _ _ _ _ ._
have continued to increase oil
consumption in spite of declining income. For the OECD, there has been slow but steady growth in income,
with sharp declines in oil demand after the 1979-80 price increase; these demand reductions were not reversed
by the oil price collapse of the 1980s. At the other extreme, in terms of low income and oil consumption, is
China; its income has grown rapidly for nearly two decades but oil consumption has not increased nearly as
fast.
We next show the fuel composition of modern energy consumption (oil, natural gas, coal, nuclear,
hydro) for each of these six regions (Figure 5). We see that the various regions' energy consumption show
quite different fuel shares. OPEC & Mexico have the highest shares for oil and for natural gas, which is not
surprising given their natural resources. China has the highest share of coal in energy consumption, also
reflecting its resource base. Other regions' energy consumption is more diversified. Nuclear power is
important in the OECD, and hydro power is important in only a few countries, primarily in South America.
10

Figure 5. Energy Consumption by Fuel: 1971-93 (million tons oil equivalent)
5000 2000
hydro hi nuclear OECD 7 hyer EE & FSU
coal * coal4000 g.: gas
oil o1500 oi
3000
w uJ0 . 01000
E~~~~~~~~~~. E .
2000
1000 OIL 5 OIL
I 0~~~~~~~~~~~~~~~~I
ol T| r .| L 1|1971 1976 1981 1986 1991 1971 1976 1981 1986 1991
600 1 - 800 r_
hy hydro
5 nuclear OPEC & Mexico 700uclear5oo E coal Ucoal C in
M gas 9 C igasnoil 600 oil
400 5500
w ul0 300 0 400
200 300[ "
OIL 200
100100
1971 1976 1981 1986 1991 1971 1976 1981 1986 1991
700 400 -- _ __ _ ______ ___
hydro~~~~~~~~~~~~~~~~~~-r6 dr/2 39 h hd; Other LDC<H nu.clear 350 5nuclear
600 M coal c.
gas gas
500 oil Other Asi 300
250
400
0 0 200
300
150
20000 ~~~~~~~~~~~~~~~~~~100 OIL
100 f,,., - OIL so50
0 0 '6 ' '1 '1971 1976 1981 1986 1991 1971 1976 1981 1986 1991

3. Data for 37 Developing Countries:
Income, Population, Energy, and Total Oil Consumption
In this section we describe data for 37 developing countries, for the period 1971-93. We first present
1993 snapshots of income, energy consumption, and oil consumption -- each relative to population. We then
compare changes from 1971 to 1993 in income, energy consumption, oil consumption, and in oil's share of
energy and of electricity generation. Finally we compare across countries the changes in income with the
changes in energy consumption from 1971 to 1993, and then with the changes in oil consumption. We find
that these 37 countries are extremety heterogeneous, especially in comparison with the industrialized countries'
relative homogeneity.
These 37 countries had the largest oil consumption levels in 1993 outside the OECD and FSU & EE.
They represented 69% of the world's population in 1993; the ten largest constituted 58%, and the twenty
largest constituted 66%. Given that future growth of energy and oil demand will be driven primarily by
growth in population and income, and given that these 37 countries have relatively high growth rates for both
variables, it is important to focus on them. Of course, large changes in end-use prices could significantly
affect demand.
3.1 1993 Snapshots: Heterogeneity across Countries
First we present 1993 "snapshots" of the main variables of concern for these 37 countries: income,
population, energy consumption, and oil consumption. The data are presented in Table 1. As we see in the
graphs below, these 37 countries are a very heterogeneous group. Their per-capita levels of the key variables
-- income, energy consumption, and oil consumption -- vary by two orders of magnitude.
12

Table 1. Levels for Oil and Energy Consumption, Income, and Population for 1993
Oil Energy Income Population(million (million tons (billions (millions)
l tons) oil-equivalent) 1987 US $)ALG: Algeria 8 27 66 27
ARG: Argentina 22 49 126 34
BAN: Bangladesh 2 13 22 115
BRA: Brazil 70 155 299 156
CHI: Chile 7 15 32 14
CHN: China 141 785 425 1178
COL: Colombia 12 27 46 36
ECU: Ecuador 5 7 13 11
EGY: Egypt 20 35 40 56
HON: Hong Kong 7 14 63 6
IND: India 63 273 346 898
INS: Indonesia 38 104 112 187
IRA: Iran 56 92 179 64
IRQ: Iraq 20 21 16 19
ISR: Israel 9 14 52 5
JAM: Jamaica 3 3 4 2
JOR: Jordan 4 4 7 4
KEN: Kenya 2 11 9 25
KUW: Kuwait 6 11 14 2
LIB: Libya 7 14 5
MAY: Malaysia 16 34 52 19
MEX: Mexico 82 120 164 90
MOR: Morocco 6 8 22 26
NIG: Nigeria 12 43 38 105
PAK: Pakistan 13 37 46 123
PER: Peru 6 12 23 23
PHI: Philippines 14 27 40 65
SAF: South Africa 14 92 85 41
SAR: Saudi Arabia 48 82 98 17
SIN: Singapore 15 19 33 3
SKO: South Korea 77 124 214 44
SYR: Syria 11 14 15 14
TAI: Taiwan 29 58 149 21
THA: Thailand 25 58 90 58
TUN: Tunisia 4 6 12 9
UAE 7 23 32 2
VEN: Venezuela 17 47 57 21
13
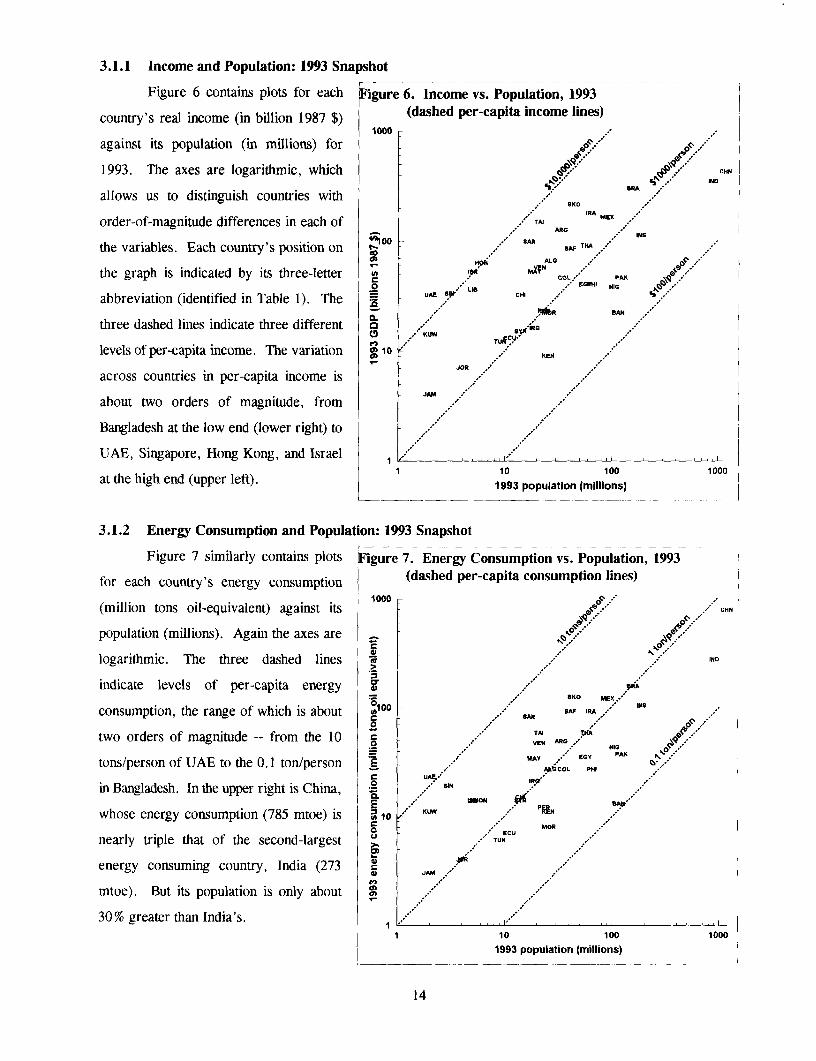
3.1.1 Income and Population: 1993 Snapshot
Figure 6 contains plots for each Figure 6. Income vs. Population, 1993
country's real income (in billion 1987 $) (dashed per-capita income lines)1000 .:.
against its population (in millions) for
1993. The axes are logarithmic, which cirn iBRA
allows us to distinguish countries with SKO HA,
order-of-magnitude differences in each of _A.I ;
'~~~'1O0 . B~~~~AR G
the variables. Each country's position on S A, THmACD ~~~~~~~~~ALG
the graph is indicated by its three-letter to COL. PAK/ IG /
UAE SrLIS CHIi N*.abbreviation (identified in Table 1). The _UAE L
6L R.4k BANthree dashed lines indicate three different A
4., G~~~~~~TIC'
levels of per-capita income. The variation 10 - KEN
JOR
across countries in per-capita income isJAM
about two orders of magnitude, from
Bangladesh at the low end (lower right) to
UAE, Singapore, Hong Kong, and Israel ____*_,_l_,_l__
at the high end (upper left). 1 10 100 10001993 population (millions)
3.1.2 Energy Consumption and Population: 1993 Snapshot
Figure 7 similarly contains plots Figure 7. Energy Consumption vs. Population, 1993
for each country's energy consumption (dashed per-capita consumption lines)
(million tons oil-equivalent) against its 1000 -s, .. CHN
population (millions). Again the axes are
logarithmic. The three dashed lines IND
indicate levels of per-capita energy ,pAe
consumption, the range of which is about IA1 0 0 . S SA IRA INS
two orders of magnitude -- from the 10 C . VEH ARr, NAPVEN R~~~~IG
tons/person of UAE to the 0. 1 ton/person |E .- aklCOL PHI:*
in Bangladesh. In the upper right is China, l SIN
whose energy consumption (785 mtoe) is 10 KUW "INC . MOR
42 ~~~~~~~/ECUnearly triple that of the second-largest
energy consuming country, India (273 X
mtoe). But its population is only about ;
30% greater than India's. ;.1 10 100 1000
1993 population (millions)
14

3.1.3 Oil Consumption and Population: 1993 Snapshot
Figure 8 contains plots for each Figure 8. Oil Consumption vs. Population, 1993
country's 1993 oil demand (in million (dashed per-capita consumption lines)
tons) with its 1993 population (in CHN
millions). Again, the axes are 100 /
logarithmic. The four dashed lines BIRA M IND
indicate four different levels of per- o * /
capita consumption. The variation TAJ / TM
across countries in per-capita oil ES% EGY / \2
.2 SIN IAP A PI
consumption is more than two orders of C. / .P °
magnitude, from Bangladesh at the EIRO UAE LIEl1YP Cl,i
lower right to Singapore at the upper o KLW PNR ,
China, the largest country in
both population and total oil i / .Jam
consumption, has relatively low per- ____ l_lo____ ___
capita oil demand. Bangladesh has 1993 populatIon(millions)
even lower per-capita oil demand; it has
the 7th largest population in this group of 37 countries, but its per-capita oil demand is so low that it ranks 36th
in terms of total oil consumption. At the other extreme, Singapore has a very small population (less than 3
million) but a high level of per-capita oil consumption. Singapore's per-capita oil consumption is more than
twice the average for the OECD; this is due to the fact that oil is the only primary fuel consumed in Singapore
-- they consume no coal, no natural gas, no hydro and no nuclear power.
Another view of these 37 countries' total oil consumption in 1993 is presented in Figure 9. It orders
the countries according to their total oil consumption for 1993. Also shown are the countries' 1971 levels of
oil consumption, which indicates quite varied growth across countries between 1971 and 1993. The top eight
countries stand out, representing nearly two-thirds of total demand for these countries in 1993, and about 18 %
of total world oil demand. The largest growth has been in some Asian countries and in some oil-exporting
countries. The weakest growth has been in Latin American countries and such countries as South Africa and
the Philippines, due to economic and political difficulties.
15

Figure 9. Oil Consumption, 1993 and 1971
(with countries ordered by 1993 oil consumption)
150
125
100
750
E(A 1993 Oi Consu ption
(50
25
0
16

3.1.4 Oil's Share of Energy Consumption and Electric Power Generation: 1993 Snapshots
We now focus on oil's share of energy consumption -- of total modern energy consumption and then
of total energy consumption including biomass -- in the 37 countries, and then oil's share in electric power
generation.
Figure 10 compares the various countries' 1993 fuel-shares of modern energy consumption: coal,
hydro, nuclear, natural gas, and oil. Excluded (until Figure 11) are traditional, biomass fuels such as fuel
wood. The countries are ordered from top to bottom by their oil-share of total modern energy. At the top are
those countries that are the most dependent on oil: Singapore, Jamaica, Jordan, and Ecuador. At the bottom
are those with the lowest oil-share of energy: South Africa, China, Bangladesh, UAE, and India.
It may be surprising that UAE (United Arab Emirates) has such a low oil-share of energy
consumption. However, like many of OPEC's largest oil-producing countries, it consumes substantial amounts
of natural gas, which is not as easily exported as oil, and which helps free-up oil for export. Other such OPEC
members are Algeria, Venezuela, Saudi Arabia, Iran, Kuwait, and Libya.
Several other countries with low oil-shares are heavily dependent on coal, such as South Africa, China
and India; each of these countries have substantial amounts of domestic coal resources. Hydroelectric power
is important in many South American countries, while nuclear power is important in only a few countries, such
as South Korea and Taiwan.
Figure 11 shows an analogous graph of fuel shares of total energy including biomass.6 The countries
are listed in the same order as in Figure 10, which allows us to spot the "outliers". Several of the lowest-
income countries are still heavily reliant on such fuels: Nigeria, Kenya, Bangladesh. China and India are
much less reliant on biomass than are many other low-income countries; they use coal for much of their total
energy: 76% and 60% respectively. Nevertheless, the volume of biomass use in these two countries is
significant.
The third graph of this type, Figure 12, shows 1993 fuel shares of energy used in electric power
generation. The countries are ordered by their 1993 oil-share in electric power. Here we see the special
importance of domestic energy alternatives to oil: coal in South Africa, India, and China; natural gas in
Algeria, Bangladesh, Venezuela; hydro power in Brazil, Venezuela, Colombia, and Chile. In a few coal-
importing countries, such as Hong Kong and Israel, electric power had been generated almost entirely from
oil in 1971, but they shifted to coal-fired electric power generation in the 1980s. Nevertheless, oil is still an
important input for power generation in many developing countries.
6 Given the nature of traditional biomass fuels, the data are only approximated, and are undoubtedlyless accurately measured than the data for modern fuels. Although much biomass consumption bypassesthe market economy, the commercial markets for such fuels can be substantial; for example, their marketsize has been estimated by the World Bank at $5 billion for Africa.
17

Figure 10. Fuel Shares of Modern Energy, 1993
(with countries ordered by 1993 oil share)
* coal 11111 hydro X nuclear E gas II oil
Singapore __ . 7_ Jamaica =_ -- = - _ -=
JordanEcuador
Philippines _________ ________Iraq
Kenya _WIIIIIIIIIIUIIIill -_--1--__--=-Morocco ___ ____= ___7]
Syria _Peru UBUBUIIII U B __ _ = = =
Tunisia . . .
IsraelMexicomi:..
Libya.____ _ ___
Nigeriael ____ _ _ _Egypt .. .... __ __ _____ j
Kuwait iIi......l.lIIlIl.....l.... ___ _ ______
Brazil _111111 Thailand i .=
Iran 1 - ---_ __-- - = ===- -Indonesia 11 __ .-..
Saudi ArabiaChile __
South KoreaMalaysia ..... .................................. ...... .....Colombia ____________________ __ =_ -- 71]
Hong Kong __=__ ___ =Taiwan I _=_ _=
Argentina lIlIX = _ == _ -===177
Pakistan _11111111111; ' * .. = _.________
Aenezuela lIljllljIIllII[._ _:: ::__ -- 11 - -Algeria * ..... .. ......... ..... ..... ... : : ..........
India ; ___=___---__UAE
Bangladesh n lI.. _ _ _China =
South Africa _ I
0 20 40 60 80 1001993 fuel share of modern energy (%)
18

Figure 11. Fuel Shares of Energy including Biomass, 1993
(with countries ordered by 1993 oil share of modern energy)
1 biomass U coal 1111 hydro E nuclear LI gas O oil
Singapore ._ _ _ _ _ ]Jamaica . _ I _
JordanEcuador ____---_--_ - _ ___
Philippines _ - = - -~~ Iraq I _
Kenya I ----_- 7Morocco
Syria 1!1IIPeru flII l__IIIiI LIII .
Tunisia I _ = _Israel fl-I--Zh------ _ _ ]
Mexico 1l -. .=_ _Libya -
NigeriaE-gypt l11[T= _
Kuwait . .. ... ....---.--.-Brazil ll _ ___-= _I
ThailandIra n .. ..... . . ...... ...... .. .. .. f .f .
Indonesia .. 1.17Saudi Arabia ; . ._ =_
Chile =- -------------------
South KoreaMalaysia ii -- - _ - -- == . - 7
Colombia - IIlI-lIlIlI-ILI- ...I1I.....; .___ .--- = -. _ Hong Kong __ __ .i_
Taiwan = - i _i__
ArgentinaPakistan
VenezuelaAlgeria . . -____
IndiaUAE
BangladeshChina
South Africa I __i
0 20 40 60 80 1001993 fuel share of energy including biomass (%)
19

Figure 12. Fuel Shares of Electric Power, 1993
(with countries ordered by 1993 oil share of electric power)
Legend| coal U11 hydro X nuci W gas C oil
Singapore _ _Libya _ I
Jamaica I _ _
Iraq IJordan . =__ J
Philippines lllIlllIlllNlllll 7]Morocco :___
Saudi Arabia , _ _
Mexico EMIDIDIUDlllID, .. ...-Syria iilIlIIIIIiII [____________.__-_ -_ ._ == -
Indonesia -_ _ _ _-Tunisia.._._........
Ecuador _j-l ]Egypt IIIIlIIlI. ::. 1 ... .. !7711i17 .IsraelPeru _ _ _ _ _ _ _ _ _ _ _ _ 7 7 ]Iran .11111 ........ . .... . -=
Pakistan .......................... _____________________________________-__
UE....... ... .. ...... .. .. . . .. ..... ........ ., .... . ...... ...... .. .. . .. _._ . .L
Malaysia . .i . --]Thailand 1 .................. __
Kenya III IIIIIIILIII __Taiwan -- _ X
South Korea o uh wK a i .. . .. . . ... -.-- . .. ..... . ... . .
Nigeria 1.1 .! ... iArgentina IIIIIIIIflIlI lIlIlIlIllH.............. .. ........:
Chile Colombia _l.lluii!ll'll.ii!iiiiiiiiiiiiiiiiiill.ill --
Venezuela .l ..II .....IChina
Bangladesh 11Brazil __ __
AlgeriaHong Kong
India ____________________________X____________
South Africa ',9
0 20 40 60 80 100
1993 fuel share of electric power (%)
20

From these last three graphs, we see the importance of oil in total energy consumption, particularly
with respect to modem fuels. Large amourts of biomass are still consumed in many developing countries, and
the transition to modern fuels is an important consideration for future demand growth. Although oil is less
dominant in power generation, its share is substantially above that for many developed countries.
3.2 Changes from 1971 to 1993: Per-Capita Income, Energy and Oil Consumption --
Heterogeneity across 37 Developing Countries, and in Comparison with OECD Countries
In this section we now focus on the changes over time for these major variables, and observe the
extreme heterogeneity among countries. We summarize the changes between 1971 and 1993 for each of the
37 developing countries in per-capita income, per-capita energy consumption, and per-capita oil consumption.
The data are listed in Table 2, and graphed in several figures below. Each graph plots the 37 countries' 1993
per-capita value against its 1971 per-capita value. Analogous graphs compare the experience of the OECD
countries over this same time period. These graphs -- Figures 13, 14, and 15 -- clearly show the extreme
heterogeneity among developing countries and the relative homogeneity among the OECD countries.
Table Al of Appendix A presents related data for each of the countries: the absolute changes from
1971 to 1993, and the average annual growth rates for per-capita values of income, energy consumption, and
oil consumption.
21

Table 2. Per-Capita Levels of Oil and Enerzy Consumption, and of Income, for 1971 and for 1993
per-capita values of:
Oil (tons/person) EneM. (tons/person) Income ('87$/person)
1971 0 1993 1971 1993 1971 199319711993199
ALG: Algeria 0.14 0 0.31 0.28 0 1.03 1880 0 2456
ARG: Argentina 0.96 0 0.65 1.41 i 1.46 3580 0 3721
BAN: Bangladesh 0.01 0 0.02 0.09 1 0.12 151 i 193I I~~~~~~~~~~~~~~~~~~~~~~~~~~~~~~~~~~~~~~~~~~~~~~~~~~~~~~~~~
BRA: Brazil 0.28 0 0.45 0.74 1 0.99 1244 1909
CHI: Chile 0.51 0.52 0.83 1.09 1499 2302
CHN: China 0.05 0 0.12 0.32 0.67 93 I 361I~~~~~~ .
COL: Colombia 0.28 I 0.34 0.59 1 0.77 826 1277
ECU: Ecuador 0.20 0.43 0.38 0.61 692 I 1215
EGY: Egypt 0.17 0.36 0.22 I 0.61 323 713
HON: Honp Kong 0.85 0 1.14 0.86 2.35 3100 10839
IND: India 0.04 0 0.07 0.18 0.30 240 386I. .
INS: Indonesia 0.06 0.21 0.25 0 0.55 232 596
IRA: Iran 0.36 0.87 0.76 1.44 3511 2793
IRQ: Iraq 0.37 0 1.00 0.47 1.10 4644 818
ISR: Israel 1.75 1.82 2.09 2.71 6311 9887
JAM: Jamaica 1.03 I 1.07 1.14 0 1.30 1579 1466
JOR: Jordan 0.32 0 0.86 0.34 i 0.95 1324 i 1714
KEN: Kenya 0.10 I 0.08 0.46 0.44 291 371
KUW: Kuwait 2.14 3.58 7.26 I 6.36 36458 0 7907
LIB: Libya 0.30 1.46 0.80 T 2.70 16411 i 0
MAY: Malaysia 0.39 0 0.84 0.56 I 1.79 1025 0 2752
MEX: Mexico 0.46 0.91 0.72 1.34 1374 1826
MOR: Morocco 0.12 0.24 0.16 ! 0.32 593 857
NIG: Nigeria 0.03 , 0.11 0.26 ! 0.41 378 I 361
PAK: Pakistan 0.05 I 0.11 0.10 i 0.30 202 371
PER: Peru 0.34 0 0.25 0.69 ! 0.53 1231 ! 996
PHI: Philippines 0.20 ! 0.22 0.38 0.42 508 0 610
SAF: South Africa 0.38 0.34 2.10 ! 2.26 2450 0 2097
SAR: Saudi Arabia 0.59 2.80 1.06 4.79 7328 5717
SIN: Singapore 1.10 I 5.29 1.40 i 6.82 3042 11961
SKO: South Korea 0.31 1.74 0.63 2.81 1058 4859
SYR: Syria 0.35 0.78 0.42 ! 1.03 676 1127
TAI: Taiwan 0.45 1.39 0.71 ! 2.76 1744 0 7146
THA: Thailand 0.16 0 0.43 0.36 1.00 497 I 1554
TUN: Tunisia 0.24 ! 0.41 0.35 j 0.67 776 I 1401
UAE 0.80 , 3.85 4.18 r 12.66 35256 17832
VEN: Venezuela 0.71 1 0.83 2.07 i 2.25 3197 2742
22

3.2.1 Per-Capita Income: Changes from 1971 to 1993
For each of the 37 developing Figure 13. Average Annual Growth in Per-Capita Income,countries in Figure 13 we plot on th~e 1971-93, vs. Standard Deviation of Annual Growth
1o% - standard deviation ofhorizontal axis the average annual rate annual growth of
per-capita income of growth in per-capita income from UAE ecA incom
SRY
1971 to 1993, and on the vertical axis BAR 8% JO
ion
the standard deviation of annual growth LDCin per-capita income. A similar graph ECU
PER 8
% cmecontains plots of the same variables for MG
the OECD countries. , mu CHNN
In contrast to the modest but VEN MOR TUNE HON4% v EKO
KEN G
steady income growth of the OECD ItO MAY SIN
countries, the income performance of lamT
the 37 developing countries has been 2% cot Pe
very mixed. Their growth rates and
standard deviation of growth rates are I l l-4% -2% 0% 2% 4% 6% 8%
widely dispersed. One-third of them j average annual growth, per-capita income
have negative growth in per-capita
income. The standard deviation of 10% standard deviation ofannual growth of
their annual growth rates ranges per-capita income
widely, from 2% to 10%.8%
In contrast, the OECD
countries in the bottom graph are
clustered together. The countries have e%
each experienced steady growth in per-
capita income: average annual growth
of about 1-3 %, and a standard deviation 4% ict OECDof the annual growth rate of 2-4%. 2% Tur
SP40SAR ~~Ire2% SVE N?~orJpnl
I [ I II I4% -2% 0% 2% 4% 6% 8%
average annual growth, per-capita income
23
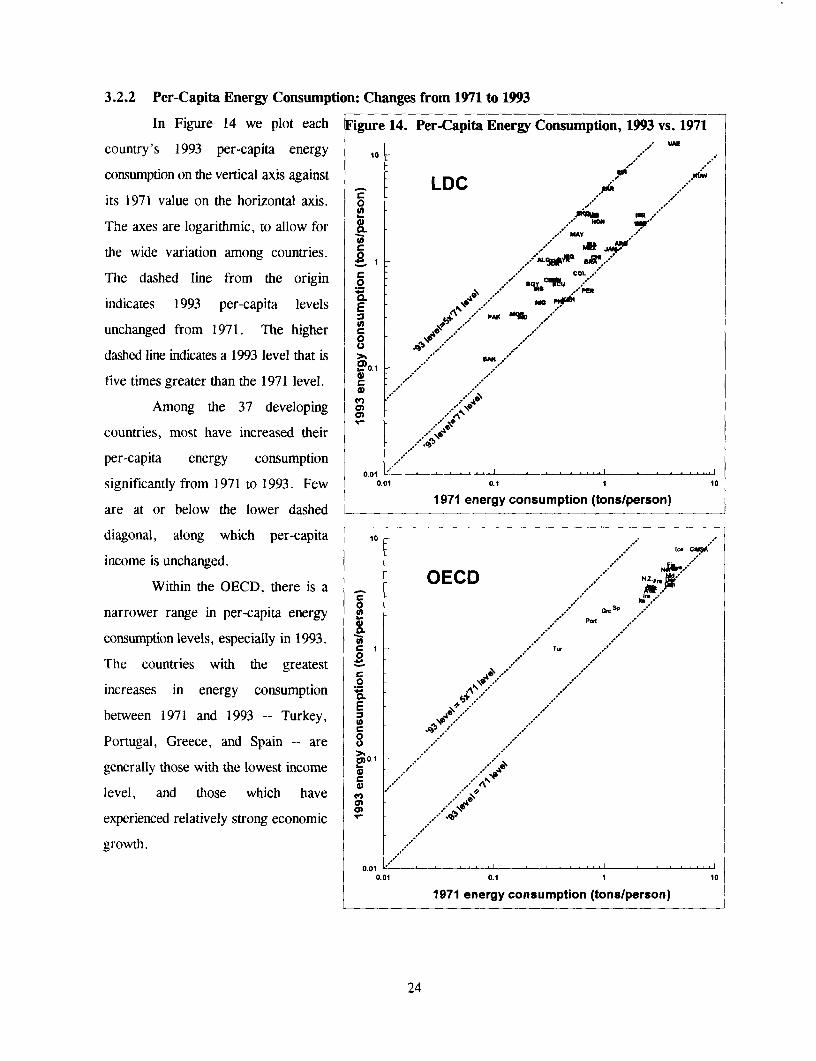
3.2.2 Per-Capita Energy Consumption: Changes from 1971 to 1993
In Figure 14 we plot each Figure 14. Per-Capita Energy Consumption, 1993 vs. 1971
country's 1993 per-capita energy .O : UN
consumption on the vertical axis against LDC .'f
its 1971 value on the horizontal axis. o
The axes are logarithmic, to allow for Wm
the wide variation among countries. A *WM J*JAq
The dashed line from the origin o -C/"
indicates 1993 per-capita levels E
unchanged from 1971. The higher -
dashed line indicates a 1993 level that is c.MM
five times greater than the 1971 level. r_
Among the 37 developing av
countries, most have increased their
per-capita energy consumption001
significantly from 1971 to 1993. Few 0.01 01 1 10are aorblwtelw1971 energy consumption (tons/person)
are at or below the lower dashed l _________ ____ ____________
diagonal, along which per-capita 10 -
income is unchanged. _ ,
Within the OECD, there is a O0.narrower range in per-capita energy G'f ,,3p ff
consumption levels, especially in 1993. o
0The countries with the greatest _ e4i,f
increases in energy consumption tE
between 1971 and 1993 -- Turkey, 0Portugal, Greece, and Spain -- are o
generally those with the lowest income 2' ,4i
level, and those which have
experienced relatively strong economic
growth.
0.01 . .,.0.01 0.1 10
1971 energy consumption (tons/person)
24

3.2.3 Per-Capita Oil Consumption: Changes from 1971 to 1993
Analogously, in Figure 15 we Figure 15. Per-Capita Oil Consumption, 1993 vs. 1971
plot the changes in per-capita oilKIM
consumption (total oil products) from LDC1971 to 1993. For most countries, per- c
capita oil consumption has increased. 2' lqrN.
In several countries, it has increased A .
nearly fivefold. Some of these _ THAEc4uRA,
.2 p. RO c.Acountries are oil exporters, such as E MoR PH ER
ESaudi Arabia and UAE, but others are
oil importing countries that have ° 0.1
0experienced rapid economic growth, o
such as South Korea and Singapore. -
For those countries whose per-
capita demand has not increased0.01
between 1971 and 1993, most have 00.1971 oil consumption (tons/person)
experienced stagnant or declinng per-
capita income: Kenya, Peru, 10
Argentina.
Within the OECD, in contrast, OECDper-capita oil consumption has 0 jin je
generally remained constant or .
declined. Only in Turkey, Portugal, o.",
Greece, and Spain (again, as for C.2~
energy) has per-capita oil consumption EIn~~~C
increased significantly. These are the o001
countries within the OECD where o
incomes are lowest and the economies ,.
less developed.
0.01 .10.01 0.1 1 10
1971 oil consumption (tons/person)
25

3.2.4 Oil's Share of Energy Consumption and Oil's Share of Electric Power Generation
Figure 16 compares oil's share Figure 16. Oil's Share of Energy Consumption, 1993 vs. 1971
of (modern) energy consumption in 1AOR
1993 vs. 1971, first for the 37 M -R Es MORRQ . KEN
developing countries and then for the
OECD countries. LDC T.N49R
Among the LDC there is > KUW A"' ETy
substantial dispersion, both in oil's 20-.MC6)CO MAY
1971 share and also in the change in o ,/ TAI HON
oil's share from 1971 to 1993. Some XPA
countries were very dependent on oil in EN ALC
1971 but much less dependent by 1993: o5 .A BAN
Hong Kong, Malaysia, Argentina and 0.2
Bangladesh. Some were as dependent
in 1993 as in 1971: Singapore, Jordan,0
Jamaica. In some oil-exporting 0 0o2 0.4 0.8 0.8 I
I ~~~~~oil's share of energy, 1971countries, oil's share of energy [increased (Libya, Kuwait). In others it
declined (Algeria, Venezuela,
Indonesia), perhaps the result of |
OPEC's quotas applying to production
and not exports. In the two most 0. OECDpopulated countries, China and India, C P.a
oil's share was low in 1971 and has z ... t
remained low. S Jp Swz
In contrast, the OECD Tu *'fiN
C) ,,,. A'ria Den
countries are relatively homogeneous, 0.4 USAJK Fra
both in oil's 1971 share of energy, and NZ. Fin Swe
in the reduction of oil's share by 1993.0.2 -
In virtually all these countries, oil's
share was in the range of 40% to 80%
in 1971. By 1993 it was reduced by0 0.2 0.4 0.6 0.8 1
about one-third, to the range of 30% to oil's share of energy, 1971
60%.
26

The LDC thus exhibits greater dispersion across countries, in all dimensions: the shares in 1971, the
shares in 1993, and the changes from 1971 to 1993 -- in both direction and magnitude.
Figure 17 compares oil's share Figure 17. Oil's Share of Electric Power Generation,
of electric power production in 1993 1993 vs. 1971
vs. 1971. There has been, and/ JOR
continues to be, wide variation across
countries, largely due to different 0.8 LDC PHI
0'endowments of other energy resources _- MOR
such as coal, natural gas, and 3.a o.e MEX ,YR
hydroelectric. There has been ."
substantial movement away from oil E
0 ~~~~~~~~ECU TU
between 1971 and 1993. Some 0.4- Y AIS
countries have shifted toward imported PAX UAE
coal (Hong Kong, Taiwan, Israel), o.- KEN THA
some toward hydroelectric (Brazil, 0.2 Ki AR
Argentina), and some toward nuclear , DH
(Taiwan, South Korea, Argentina). IND
0 0.2 0.4 0.6 0o.
Many oil exporters have shifted to oil's share of electric power, 1971
natural gas for electricity generation
(Algeria, UAE, Saudi Arabia, 1
Malaysia).
The OECD countries show
much less dependence on oil for ,0.8 OECD '4.-
electricity generation, especially in "lb
1971. None of the OECD countries .0.e'
had oil shares for electric power above
80% in 1971, and most were below °.
o 0.4 Pf40%. This is almost the exact opposite 0
co
from the 37 developing countries in 1
In~~~~~~~~~~~~~p
1971, most of which generated at least ° 0.2 Grc
80 % of their electricity from oil, with Tur eA'ri'a
few below 40%. By 1993 virtually all Nt UKd Sp Den
. I"I 'Fr I I Ithe OECD countries had substantially 0 0.2 0.4 0.6 0.8 I
oil's share of electric power, 1971
27

Table 3. Oil's Share of Energy and of Electric Power, 1971 and 1993
Oil Share of Energy Oil Share of Electric Power
1971 1993 1971 1993
ALG. Algeria 62% 36% 49% 6%
ARG: Argentina 79% 49% 78% 14%
BAN: Bangladesh 66% 28% 49% 8%
BRA: Brazil 82% 66% 26% 7%
CHI: Chile 75% 64% 50% 13%
CHN: China 17% 20% 8% 9%
COL: Colombia 64% 58% 23% 11%
ECU: Ecuador 97% 91% 83% 44%
EGY: Egypt 88% 67% 69% 41%
HON: HongKong 99% 51% 100% 5%
IND: India 35% 31% 10% 3%
INS: Indonesia 96% 64% 90% 51%
IRA: Iran 60% 65% 82% 38%
IRQ: Iraq 83% 87% 99% 99%
ISR: Israel 98% 75% 99% 39%
JAM: Jamaica 99 % 99% 98% 99%
JOR: Jordan 100% 97% 100% 90%
KEN: Kenya 94% 86% 73% 23%
KUW: Kuwait 51% 67% 0% 18%
LIB: Libya 42% 71% 100% 100%
MAY: Malaysia 96% 59% 87% 31%
MEX: Mexico 66% 73% 46% 61%
MOR: Morocco 81% 86% 39% 71%
NIG: Nigeria 80% 70% 38% 17%
PAK: Pakistan 51% 45% 7% 33%
PER: Peru 85% 78% 54% 38%
PHI: Philippines 98% 91% 91% 78%
SAF: South Africa 23% 8% 0% 0%
SAR: Saudi Arabia 78% 64% 100% 67%
SIN: Singapore 100% 100% 100% 100%
SKO: South Korea 64% 62% 84% 21%
SYR: Syria 100% 84% 99% 59%
TAI: Taiwan 65% 50% 78% 22%
THA: Thailand 96% 66% 73% 27%
TUN: Tunisia 95% 75% 99% 44%
UAE: UAE 20% 30% 100% 33%
VEN: Venezuela 54% 37% 21% 11%
28

reduced their use of oil in electric power generation; the only exceptions were Portugal and Italy. Most OECD
countries had oil shares for electricity generation below 10 % by 1993.
The LDC data for these graphs comparing oil's share of energy and of electric power generation in
1971 and 1993 are listed in Table 3.
3.3 Demand Changes Relative to Income Changes, 1971-93
Having reviewed individually the changes in per-capita income, energy and oil consumption between
1971 and 1993, we next compare the changes in per-capita energy and oil consumption with the changes in
per-capita income. Again, we contrast the experience of the 37 developing countries with that of the OECD
countries.
For each of the 37 developing countries, Table 4 presents the 1993/1971 ratio for several per-capita
variables: income, energy consumption, total oil consumption, and consumption for eight oil products (which
will be discussed in Section 4 below). For example, the first row of the table indicates that Algeria's
1993/1971 ratio for per-capita income was 1.3: that is, its 1993 per-capita income was 1 .3 times its 1971 per-
capita income. In 1993 its per-capita energy consumption was 3.7 times that in 1971, and its per-capita oil
.onsumption was 2.2 times its 1971 level.
29
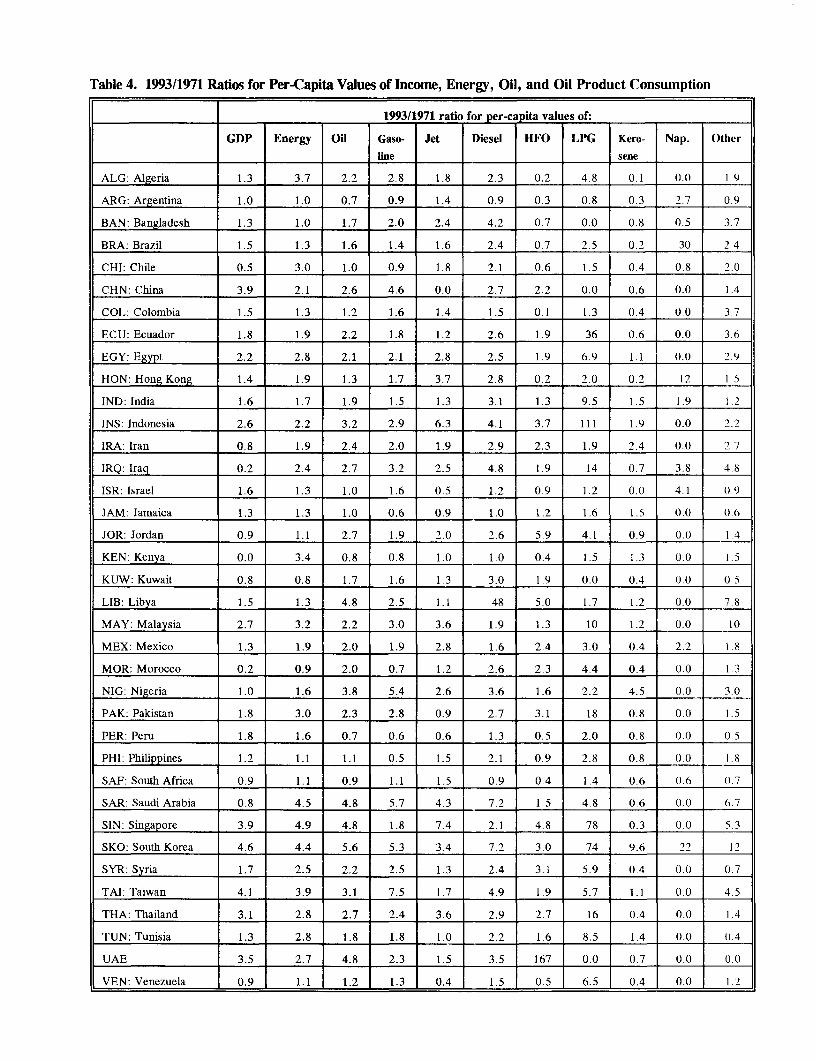
Table 4. 1993/1971 Ratios for Per-Capita Values of Income, Energy, Oil, and Oil Product Consumption
1993/1971 ratio for per-capita values of: l
GDP Energy Oil Gaso- Jet Diesel HFO LPG Kero- Nap. Other
l__ ___ ___ ___ __ ___ __ _ _f line sene _ l
ALG: Algeria 1.3 3.7 2.2 2.8 1.8 2.3 0.2 4.8 0.1 0.0 1 9
ARG: Argentina 1.0 1.0 0.7 0.9 1.4 0.9 0.3 0.8 0.3 2.7 0.9
BAN: Bangladesh 1.3 1.0 1.7 2.0 2.4 4.2 0.7 0.0 0.8 0.5 3.7
BRA: Brazil 1.5 1.3 1.6 1.4 1.6 2.4 0.7 2.5 0.2 30 2.4
CHI: Chile 0.5 3.0 1.0 0.9 1.8 2.1 0.6 1.5 0.4 0.8 2.0
CHN: China 3.9 2.1 2.6 4.6 0.0 2.7 2.2 0.0 0.6 0.0 1.4
COL: Colombia 1.5 1.3 1.2 1.6 1.4 1.5 0.1 1.3 0.4 0.0 3.7
ECU: Ecuador 1.8 1.9 2.2 1.8 1.2 2.6 1.9 36 0.6 0.0 3.6
EGY: Egypt 2.2 2.8 2.1 2.1 2.8 2.5 1.9 6.9 1.1 0.0 2.9
HON: Hong Kong 1.4 1.9 1.3 1.7 3.7 2.8 0.2 2.0 0.2 12 1.5
IND: India 1.6 1.7 1.9 1.5 1.3 3.1 1.3 9.5 1.5 1.9 1.2 l
INS: Indonesia 2.6 2.2 3.2 2.9 6.3 4.1 3.7 111 1.9 0.0 2.2
IRA: Iran 0.8 1.9 2.4 2.0 1.9 2.9 2.3 1.9 2.4 0.0 2.7
IRQ: Iraq 0.2 2.4 2.7 3.2 2.5 4.8 1.9 14 0.7 3.8 4.8
ISR: Israel 1.6 1.3 1.0 1.6 0.5 1.2 0.9 1.2 0.0 4.1 0.9
JAM: Jamaica 1.3 1.3 1.0 0.6 0.9 1.0 1.2 1.6 1.5 0.0 0.6
JOR: Jordan 0.9 1.1 2.7 1.9 2.0 2.6 5.9 4.1 0.9 0.0 1.4
KEN: Kenya 0.0 3.4 0.8 0.8 1.0 1.0 0.4 1.5 1.3 0.0 1. 5
KUW: Kuwait 0.8 0.8 1.7 1.6 1.3 3.0 1.9 0.0 0.4 0.0 0.5
LIB: Libya 1.5 1.3 4.8 2.5 1.1 48 5.0 1.7 1.2 0.0 7.8
MAY: Malaysia 2.7 3.2 2.2 3.0 3.6 1.9 1.3 10 1.2 0.0 10
MEX: Mexico 1.3 1.9 2.0 1.9 2.8 1.6 2.4 3.0 0.4 2.2 1.8
MOR: Morocco 0.2 0.9 2.0 0.7 1.2 2.6 2.3 4.4 0.4 0.0 1.3
NIG: Nigeria 1.0 1.6 3.8 5.4 2.6 3.6 1.6 2.2 4.5 0.0 3.0
PAK: Pakistan 1.8 3.0 2.3 2.8 0.9 2.7 3.1 18 0.8 0.0 1.5
PER: Peru 1.8 1.6 0.7 0.6 0.6 1.3 0.5 2.0 0.8 0.( 0.5
PHI: Philippines 1.2 1.1 1.1 0.5 1.5 2.1 0.9 2.8 0.8 0.0 1.8
SAF: South Africa 0.9 1.1 0.9 1.1 1.5 0.9 0.4 1.4 0.6 0.6 0.7
SAR: Saudi Arabia 0.8 4.5 4.8 5.7 4.3 7.2 1.5 4.8 0.6 0.0 6.7
SIN: Singapore 3.9 4.9 4.8 1.8 7.4 2.1 4.8 78 0.3 0.0 5.3
SKO: South Korea 4.6 4.4 5.6 5.3 3.4 7.2 3.0 74 9.6 22 12
SYR: Syria 1.7 2.5 2.2 2.5 1.3 2.4 3.1 5.9 0.4 0.( (1.7
TAI: Taiwan 4.1 3.9 3.1 7.5 1.7 4.9 1.9 5.7 1.1 0.0 4.5
THA: Thailand 3.1 2.8 2.7 2.4 3.6 2.9 2.7 16 0.4 0.0 1.4
TUN: Tunisia 1.3 2.8 1.8 1.8 1.0 2.2 1.6 8.5 1.4 0.0 (1.4
UAE 3.5 2.7 4.8 2.3 1.5 3.5 167 0.0 0.7 0.0 0.0
VEN: Venezuela 0.9 1.1 1.2 1.3 0.4 1.5 0.5 6.5 0.4 0.0 1 2
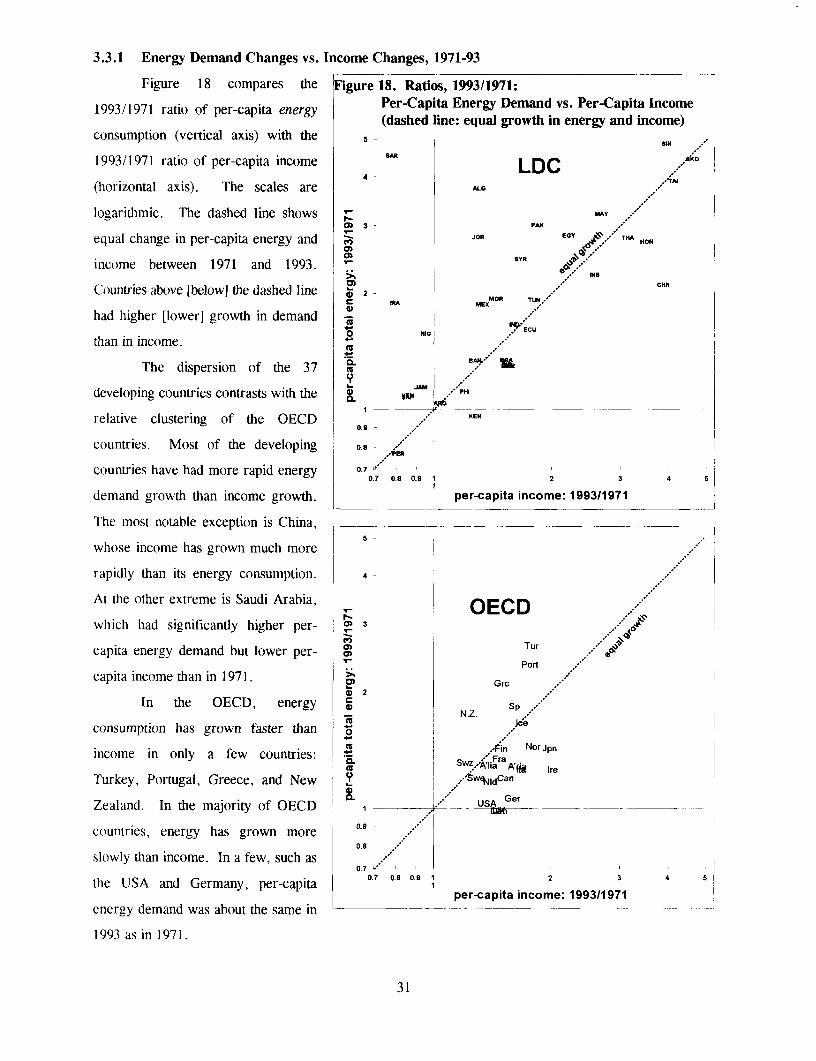
3.3.1 Energy Demand Changes vs. Income Changes, 1971-93
Figure 18 compares the Figure 18. Ratios, 1993/1971:
1993/1971 ratio of per-capita energy Per-Capita Energy Demand vs. Per-Capita Income(dashed line: equal growth in energy and income)
consumption (vertical axis) with the 5- SIN
1993/1971 ratio of per-capita income LDC .zko(horizontal axis). The scales are ALG
logarithmic. The dashed line shows MAY0) 3 - PAK '
equal change in per-capita energy and JOR EGY TH HON
income between 1971 and 1993. SYR
CNNCountries above [below] the dashed line @ 2 - ,-C
had higher [lower] growth in demand X
than in income. I N Ecu
The dispersion of the 37JAMdeveloping countries contrasts with the ¢ PHI
KENrelative clustering of the OECD 0.9 "
countries. Most of the developing 0.9 -
countries have had more rapid energy 0.70.7 0.8 0.9 1 2 3 4 5
demand growth than income growth. per-capita income: 1993/1971
The most notable exception is China,
whose income has grown much more
rapidly than its energy consumption. 4 - ,
At the other extreme is Saudi Arabia, OECDwhich had significantly higher per- 3
capita energy demand but lower per- 0 TurPort
capita income than in 1971. Grc
03 In the OECD, energy Sp N.Z Sp
consumption has grown faster than 7
income in only a few countries: * fl NorJpnI to ~~~~S 74:1 Fra A(jIre
Turkey, Portugal, Greece, and New |wqNIdcan
Zealand. In the majority of OECD CL __ USA Ger __ _
countries, energy has grown more 00.8 -
slowly than income. In a few, such as0.7 08 0.9 1 2 3 4 5the USA and Germany, per-capita p i 3 49S
per-capita income: 1993/1971energy demand was about the same in ___
1993 as in 1971.
31

3.3.2 Oil Demand Changes vs. Income Changes, 1971-93
Figure 19 plots analogous data Figure 19. Ratios, 1993/1971:
for per-capita oil demand vs. income: Per-Capita Oil Demand vs. Per-Capita Income(dashed line: equal growth in oil and income, 1971-93)
the 1993/1971 ratio of per-capita total e
oil consumption on the vertical axis, LDC S
and the 1993/1971 ratio for per-capita4 -
income on the horizontal axis. NIG
The LDC graph shows much 3 TAI
more dispersion than that for the cm *.."T
OECD. In the upper right are South AG SYRP^AK
Korea and Singapore, which X2 MD
experienced rapid growth in per-capita X0.~~~~e
income and even more rapid growth in Y MON
per-capita oil demand. In the upper left JEN VN -
are several oil-exporting countries I ' I{- ~0.9 - ;
which had large growth in per-capita 0.9 .
oil demand but declines in per-capita 0.7 PER 2 0.7 8 0.9 1 2 3 4 5
income. In the middle right are a few per-capita income: 1993/1971
countries that have been able to achieve _ _5-
growth in per-capita income but a much
smaller increase in per-capita oil 4 -
demand: Taiwan, China, and especially OECDHong Kong. In the lower middle are a 3 -
03
few countries that have experienced a.03 Port
little or no income growth, and have o
reduced their per-capita oil demand: XTyO Grc/
Argentina and Kenya. G
For the OECD countries there Sp
is much less (horizontal) variation in a
income growth. And although several I. - NZ A'rjia_pn
countries have experienced substantial 0. S Ger Ire0.8-
growth in per-capita oil demand 0.7 NIa
0.7 0.8 0.9 1 2 3 4 5(Portugal, Turkey, Greece, Spain), per-capita income: 1993/1971
most have reduced or kept constant
their per-capita demand.
32

4. Consumption of Eight Major Oil Products:
Data for 37 Developing Countries
We now turn our attention to consumption of the eight major oil product groups, for each of the 37
developing countries. As in the previous section, we first present snapshots of the 1993 data: the individual
oil product shares of total oil consumed, and the ratios of oil product demand to income. We then compare
demand changes for each individual product from 1971 to 1993, and finally relate those demand changes to
income changes for all countries.
The actual consumption data for 1993, in million tons, are listed in Table 5 for total oil and for each
of the eight products, with countries listed in order of total oil consumption.
4.1 1993 Snapshots
4.1.1 Oil Products' Shares of Total Oil Consumption: 1993 Snapshots
Figure 20 shows for each of 37 countries the 1993 oil product shares of total oil consumption. The
countries are ordered from top to bottom by total oil consumption. Products are ordered from side to side not
according to density as is customary, but are displayed with transport fuels on the left, and heavy fuel oil on
the right. Thus the two largest products -- diesel and heavy fuel oil -- are at the extremes, in order to facilitate
product-share comparisons across countries for these two products. The ordering of the products corresponds
to that in Table 5.
The share of heavy fuel oil out of total oil consumed is closely related to oil's share of electricity
generation. In Singapore and Jamaica, where virtually all electricity is generated from oil, more than half of
all the oil used by the country is heavy fuel oil. By contrast, Algeria and Colombia have very low shares of
heavy fuel oil, below 5 %; their oil share of electric power generation is similarly low.
Likewise, there are large variations across countries in shares of the main transportation oil products:
diesel, gasoline, and jet fuel. In Singapore, these three constitute only one-fourth of the barrel (with much of
this being jet fuel), in China nearly half, in Brazil about two-thirds, in Algeria nearly three-fourths, and South
Africa more than four-fifths.
There are similarly wide variations in the shares of other oil products. The share of jet fuel is
extraordinarily high in Hong Kong, Singapore, and Kenya. Naphtha, used in the petrochemical industry, is
important in only a few countries: South Korea, Taiwan, Singapore, Libya, China, and Brazil. There are also
wide variations in the share of kerosene, with relatively high shares in India, Iran, Indonesia, Nigeria, Peru,
and Bangladesh.
33

Figure 20. Oil Product Shares of Oil Consumption, 1993
(with countries ordered by total 1993 oil consumption)
Legend0 Diesel D Gasoline M Jet U LPG 1111 Ker. X Nap. M Other M HFO
China .Mexico:
South Korea.BrazilBrazi . ....... . . . . 0 _ IndiaIran
Saudi Arabia . . -Indonesia.... .. __-
Taiwan.-__...._._._.________i_i_'__Thailand . . .. ...... __
Argentina =__= _
EgyptI raq
Venezuela . - -_ = = 0 2 _ =. .. : . .
Malaysia *. . . . __ __= =SingaporePhilippines
South AfricaPakistan
ColombiaNigeria ; = _
Syria ._=_Israel .
Algeria.. __ -
Libya.-_ _Chile -~==~- _20C h iE . .... .. .. .. ... ..... .. .. . .UAE :
Hong Kong --_---_-- -----Morocco
Kuwait _ inPeru ..... ._ == .__
Ecuador : 0 X= _ .nETunisiaJordan
Jamaica .. ::
Bangladesh . .
Kenya. . _ _ I11I T - - T I
0 20 40 60 80 1001993 oil product shares (%)
34

Table S. Oil Product Consumption, 1993(million tons; countries ordered by total oil consumption)
Total Diesel Gaso- Jet LPG Kero- Naph- Other HFOOil line Fuel sene tha Oil
CHN: Chinia 141.5 36.2 28.9 1.6 3.4 2.7 11.5 20.1 37.1
MEX: Mexico 81.8 12.5 22.4 2.1 11.5 1.1 1.3 4.1 27.0
SKO: South Korea 77.0 18.5 5.0 1.6 5.1 5.6 12.8 3.2 25.2
BRA: Brazil 69.7 22.9 17.6 1.9 5.2 0.2 5.0 6.3 10.7
IND: India 62.7 26.7 3.8 1.7 3.0 8.6 3.3 4.7 11.0
IRA: Iran 55.6 18.5 5.8 1.3 1.7 8.8 0.0 3.7 15.7
SAR: Saudi Arabia 47.9 16.6 8.5 2.4 0.7 0.2 0.0 15.0 4.5
INS: Indoncsia 38.4 15.0 5.5 1.4 0.5 7.0 1.1 1.7 6.3
TAI: Taiwan 29.0 4.4 5.2 1.1 1.4 0.0 2.4 2.6 11.8
THA: Thailand 25.0 9.9 3.6 2.3 1.2 0.1 0.0 0.9 6.9
ARG: Argeitina 21.9 7.5 5.3 0.7 1.2 0.4 0.6 2.8 3.5
EGY: Egypt 20.0 4.7 1.9 0.5 1.1 1.7 0.0 1.7 8.5
IRQ: Ira(q 19.6 5.3 2.7 0.4 1.2 0.9 0.5 2.9 5.7
VEN: Venezuela 17.5 3.3 7.7 0.2 2.0 0.3 0.0 2.5 1.5
MAY: Malaysia 16.1l 5.2 3.4 0.8 1.0 0.1 0.0 1.6 3.9
SIN: Singapore 14.8 1.0 0.5 2.2 0.4 0.0 1.5 1.1 8.1
PHI: Philippines 14.4 5.3 1.7 0.6 0.6 0.6 0.0 0.8 4.8
SAF: South Africa 13.7 4.1 6.5 0.9 0.3 0.6 0.1 0.3 1.1
PAK: Pakistan 13.1 5.5 1.3 0.6 0.1 0.6 0.0 0.5 4.4
COL: Colombia 12.0 2.2 5.4 0.6 0.6 0.3 0.0 2.7 0.3
NIG: Nigleria: 11.8 3.0 5.1 0.4 0.1 1.8 0.0 0.6 0.9
SYR: Syna 10.7 4.2 1.1 0.2 0.3 0.2 0.1 0.3 4.3
ISR: Israel 9.5 1.5 1.7 0.5 0.2 0.2 0.5 0.7 4.2
ALG: Algeria 8.4 3.4 2.3 0.3 1.6 0.0 0.0 0.7 0.1
LIB: Libya 7.5 1.9 1.3 0.2 0.2 0.2 0.9 0.6 2.2
CHI: Chile 7.2 2.3 1.7 0.4 0.7 0.3 0.1 0.3 1.5
UAE 7.0 2.7 1.1 0.2 0.4 0.0 0.0 0.3 2.3
HON: Hong Kong 6.6 2.6 0.3 2.4 0.1 0.1 0.5 0.1 0.5
MOR: Morocco 6.3 2.2 0.4 0.2 0.7 0.0 0.0 0.3 2.5
KUW: Kuwait 6.3 0.9 1.2 0.3 0.1 (.0 0.0 0.3 3.5
PER: Peni 5.7 1.9 1.2 0.2 0.2 0.7 0.0 0.1 1.4
ECU: Ecuador 4.8 1.4 1.3 0.2 0.4 0.1 0.0 0.2 1.2
TUN: Tunisia 3.6 1.2 0.3 0.2 0.3 0.2 0.0 0.0 1.4
JOR Jordan 3.5 0.8 0.4 0.2 0.1 0.2 0.0 0.1 1.5
JAM: Jamaica 2.6 0.3 0.3 0.2 0.1 0.0 0.0 0.1 I.7
BAN: Bangladesh 2.1 0.9 0.1 0.1 0.0 0.4 0.0 0.2 0.2
KEN: Kenya 2.0 0.5 0.3 0.4 0.0 0.1 0.0 0.2 0.3
35

4.1.2 Ratios of Oil Product Demand to Income: 1993 Snapshots
Given the wide range across countries in levels of per-capita income and oil product demand, it is
useful to employ summary measures that would allow some rough comparisons across countries. To this end,
we first examine the ratios of per-capita oil demand to per-capita income for each of the 37 countries, for both
total oil demand and for each of the 8 oil products, for the year 1993. The oil/GDP ratios are listed in
Table 6; the units are tons per million dollars of GDP (1987 $).
The ratios are graphed in the "box and whisker" plots7 of Figure 21. For each product and for total
oil demand, country abbreviations indicate the values for each country; for this type of dispersion presentation
it is not necessary to be able to read all the country abbreviations. The vertical scale is logarithmic, which
allows easy comparison of the relative dispersion across products. The product with the smallest dispersion
is diesel: the height of its box is well below one order of magnitude; this means that the various countries'
diesel/GDP ratios are relatively similar, compared with much more dispersed oil/GDP ratios for other
products. For example, much greater dispersions exist for heavy fuel oil (HFO), for kerosene, and especially
for naphtha (which is consumed by only half the countries): the height of those boxes greatly exceed one order
of magnitude.
These oil/GDP ratios show extreme dispersion, of one to two orders of magnitude. Although the use
of oil/GDP ratios might be expected to minimize the apparent differences between countries of widely varying
income levels, these countries' ratios are dramatically dispersed.
Moreover, adjacent countries at the extremes are themselves quite different from each other. For
example, consider the countries at the low end for the ratio Total Oil/GDP: Algeria, Hong Kong, and
Bangladesh. The income level of Bangladesh is lower than all others in the group, but even relative to its
income level, its oil use is extraordinarily low. Algeria is resource rich, and has a relatively high income, but
its consumption of natural gas allows it to consume surprisingly little oil. Hong Kong, with a high income and
virtually no natural resources, consumes relatively little oil even including its use of jet fuel (at a level that is
eight times that of gasoline -- which is just the reverse of consumption patterns in the USA). In contrast to
Hong Kong is a similar city-state, Singapore, whose oil/GDP ratio is five times higher, mostly because
Singapore generates all its electricity from oil, whereas Hong Kong switched from oil to coal in the mid 1980s.
7 For each product, the median value of the Oil/GDP ratio is shown by the middle, "waistline" of itsrespective box. The top and bottom of each box measures the 90th and 10th percentile respectively, whilethe upper notch and lower notch measure the 75th and 25th percentile. The top and bottom "whiskers"indicate the 95th and 5th percentiles.
36

Table 6. Oil/GDP Ratios for Total Oil and Eight Products, 1993(tons per million dollars of income, 1987 US $; countries ordered by total oil consumption)
Total HFO Diesel Gaso- Other Nap. LPG kero- JetOil line Oil sene Fuel
CHN: China 333 87.1 85.1 68.0 47.3 27.0 8.1 6.4 3.7
MEX: Mexico 498 164.5 75.8 136.0 24.7 7.9 69.8 6.6 12.5
SKO: South Korea 359 117.5 86.3 23.2 14.9 59.6 23.9 26.1 7.6
BRA: Brazil 233 35.9 76.6 58.8 20.9 16.7 17.4 0.6 6.3
IND: India 181 31.8 77.0 10.9 13.6 9.5 8.8 24.8 4.9
IRA: Iran 310 87.8 103.3 32.5 20.9 0.0 9.4 49.4 7.1
SAR: Saudi Arabia 490 45.9 169.9 86.5 152.8 0.0 7.1 2.4 24.9
INS: Indonesia 344 56.1 134.3 49.3 14.9 9.8 4.5 63.1 12.2
TAI: Taiwan 195 79.0 29.6 34.8 17.6 16.3 9.2 0.3 7.7
THA: Thailand 277 76.6 110.0 40.2 10.4 0.0 13.6 1.0 25.2
ARG: Argentina 174 28.0 59.4 42.1 22.0 4.4 9.5 2.9 5.7
EGY: Egypt 498 211.7 117.1 46.8 41.4 0.0 28.4 41.3 11.4
IRO: Iraq 1228 358.0 329.7 172.1 182.7 31.4 74.2 55.6 24.2
VEN: Venezuela 304 25.8 57.6 134.6 42.9 0.0 34.2 5.8 3.7
MAY: Malaysia 306 73.9 100.0 65.4 30.0 0.0 18.7 2.7 15.6
SIN: Singapore 442 241.7 28.7 14.8 32.5 45.9 12.3 1.2 65.1
PHI: Philippines 364 120.6 133.1 43.3 21.1 0.0 14.0 15.1 16.3
SAF: South Africa 161 13.0 47.5 76.5 3.0 0.6 3.2 6.8 10.4
PAK: Pakistan 287 95.9 120.6 29.2 11.6 0.0 2.9 14.0 13.2
COL: Colombia 264 7.1 47.9 117.5 60.1 0.0 12.2 6.3 12.4
NIG: Nigeria 313 23.8 79.4 133.9 16.6 0.0 1.3 47.7 9.9
SYR: Syria 696 278.9 269.5 73.9 22.5 3.4 18.7 15.0 13.9
ISR: Israel 184 80.6 29.3 33.3 12.9 8.7 4.3 4.5 10.0
ALG: Algeria 127 1.2 51.3 35.6 10.9 0.0 23.6 0.2 4.7
CHI: Chile 228 46.9 73.3 52.5 10.3 1.7 23.2 8.4 11.4
UAE: UAE 216 71.2 82.9 34.0 9.3 0.0 10.9 1.1 6.5
HON: Hong Kong 106 8.5 42.1 4.3 2.3 7.4 2.1 1.1 37.7
MOR: Morocco 284 110.5 99.7 18.0 14.1 0.0 29.9 2.1 10.0
KUW: Kuwait 453 249.0 66.2 86.7 19.0 0.0 9.0 1.9 21.5
PER: Peru 251 61.6 81.8 50.6 5.7 0.0 9.0 32.7 9.9
ECU: Ecuador 356 87.0 101.2 100.7 15.2 0.0 33.7 4.1 14.2
TUN: Tunisia 295 113.1 99.5 24.7 3.1 0.0 23.3 13.5 17.5
JOR: Jordan 503 221.3 117.5 58.2 20.4 0.0 21.2 32.3 32.6
JAM: Jamaica 731 476.7 95.5 75.9 14.4 0.0 14.1 11.9 42.8
BAN: Bangladesh 92 11.2 42.5 6.4 10.1 1.3 0.4 16.9 3.5
KEN: Kenya 210 36.0 57.3 35.4 23.7 0.0 2.8 13.1 41.3
37
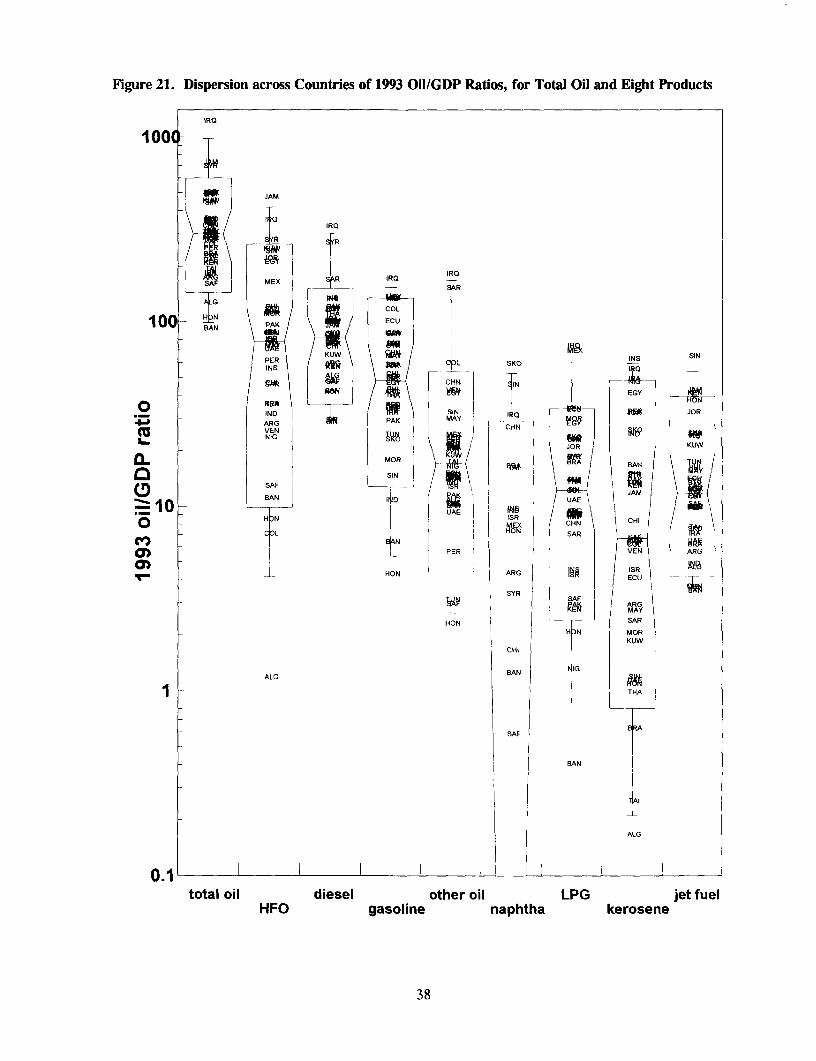
Figure 21. Dispersion across Countries of 1993 Oil/GDP Ratios, for Total Oil and Eight Products
IRO
1000
JAM
IRQ
R SR
; E R AR IRQ IRQ
100 HN PAK ECUBAN ~ ~ ~ ~ ~ ~ ~~A
PER KUW \E / CPLSO INS SININS CXSKO INSSI
CHN I_| N EGY
HONINDO SIN JOR
1VEN I ARG PAK MAY QVEN Cl-IN
1.. HON ~ I ARGJOR KUW
0.. MOR KUW rA BAN
SAF NA1 0 ~~~~BAN DIUAE JAM
-10 HN ~~~~~~~~~~~~~~~~~~~~UAEIS
0 ~~~~~~LMEX CHN CHI
HON CHN "AR8N
PCR ~ ~ ~ ~ ~ ~ ~ yNAR
__ HON ~~~~~~~~~~~~~ARG ISR
HON IYR ~~~~~~~~~~ECUTN SYR [AF
HON SARH:N MOR
KUWCHI
ALG BAN MG
TA
SAFA
BAN
ALG
total oil diesel other oil LPG jet fuelHFO gasoline naphtha kerosene
38

4.2 Oil Products' Shares of Oil Consumption: Changes from 1971 to 1993
We now examine changes in Figure 22. Shares of Eight Oil Products, 1993 vs. 1971
demand for each oil product over the (averages weighted by countries' total oil demand)
1971-93 period. Figure 22 shows the oil prducsshare of barel, 1993
change in the composition of oil DAel .,0'
demand between 1971 and 1993. Oil 0.0
products whose share of oil O oin.
consumption declined were heavy fuel o.D -6
oil and kerosene -- due respectively to LPG .
0.05 ~0 0 0fuel substitution in power generation, Naphtha ,'Kessne
and the shift to LPG in the household
sector. Products with increasing shares 0.0,
were diesel, LPG, and naphtha; this .70.01
refected, respectively, the growing ... -
multi-use importance of diesel, and the 0.005
growth in "new" users of naphtha 0.005 0.01 0.02 0.05 0.1 0.2 0.4
(petrochemicals) and LPG (urban oilproductsshareofbanel, 19|1
households). Shares of gasoline, jet
fuel, and "other" oil remained roughly constant.
The average annual growth rates in demand, for each of the products and for total oil consumption
in each of the countries, from 1971-93 are presented in Table A2 of Appendix A.
39

4.3 Changes in Individual Oil Product Demand vs. Changes in Income, 1971 to 1993
Gasoline iure 23. Ratios, 1993/1971: |
In all but a few countries, per- Per-Capita Gasoline Demand vs. Per-Capita Income(dashed line: equal growth in gasoline and income)
capita gasoline demand has increased 10 _____
since 1971. This has occurred not only a - TAI
in the majority of countries in which 7
6
per-capita income has increased, but SAR
also in countries such as the oil - CHN
4
exporters where per-capita income has .)
declined. 3 -I.G
With growing income, gasoline _ ,YR ".- TMA
demand generally grows at least as . 2 - MASIN
Cu H~~~~~~~~~~~~~~~~~ONrapidly. There are, of course, 'cH
CD BRA
exceptions. The city-states of Hong VEN
Kong and Singapore have had gasoline 1 SAP e " ____ __ _
demand growing only half as fast as 0-KEN
income; this is primarily due to 0.7" MO, I 2IO0.7 0.8 0.9 1 2 3 4
restrictions to control the number of per-capita income: 1993/1971
vehicles.
Several countries with higher per-capita income have reduced their per-capita gasoline demand
significantly. Chile, Morocco, and Kenya are shown on Figure 23, and even greater reductions were
experienced by Jamaica, Peru, and the Philippines (not shown on Figure 23: see Table 5). In the cases of
Chile and Morocco over this period, growth in diesel fuel was almost twice as rapid as income growth; this
could reflect the importance of diesel in highway transportation fuels. Many countries also tax gasoline at a
much higher rate than diesel which encourages substitution from gasoline to diesel-fueled vehicles.
In some of the oil-exporting countries, gasoline has been heavily subsidized; this would at least partly
account for the high rates of growth in these countries.
40

Diesel
Diesel fuel demand has grown Figure 24. Ratios, 1993/1971:
most consistently of all fuels, at least as Per-Capita Diesel Demand vs. Per-Capita Income(dashed line: equal growth in diesel and income)
rapidly as income, in virtually all 9_
countries. Only in Singapore, Israel, ,
and Kenya has demand grown
substantially less than income5- ~~~~~~~~~~~~~~~~~~~~~~~~TAU
(Figure 34). Growth has been 4 I_
significant and there appears to be little Na
responsiveness to oil price changes. 3 -MA
JOR MORDiesel fuel has a larger share ._ EAYRY
of total demand than gasoline in most of L 2 - CH TN
the countries (this also true for many MCX
OECD countries outside North PER
America). The exceptions appear to be JAM ' _ _ _
mainly oil-exporting countries (Figure o .-
20). Diesel's main use is in transport, 0.7 2 3 4 0.7 0.9 0.9 234 5
but in many countries it is consumed in per-capita income: 199311971
stationary processes, mainly in the
industrial sector but also in a number of other sectors including power generation. For example, in the Asian
countries in this study excluding China, diesel fuel for transport accounted for 61 % of total diesel demand in
1993 -- the industrial sector 17 %, agriculture 6 %, residential 6 %, power generation 4 %, commercial 1 %,
and all other 4% (totals do not add due to rounding). Diesel fuel can be used in a number of applications; a
small portion is even used for petrochemical feedstock.
In many countries diesel prices are set substantially below the price of gasoline, often to lessen the tax
burden on commercial transport (similar to the rationale in many OECD countries). Large price differentials
that favor diesel over gasoline encourage the use of diesel-fueled vehicles over those powered by gasoline.
A number of countries have heavily subsidized diesel fuel prices, mainly oil-exporting countries, which could
partly account for rapid growth in these countries. However, gasoline prices are also heavily subsidized in
these countries.
The structure of both the economy and the transport sector are important factors in determining diesel
transport demand (and gasoline), e.g., share of trucks, mode of passenger travel, etc. In most countries,
diesel use has grown faster than gasoline consumption over the period: see Table 4, or Table A2 in the
Appendix. Table A2 also shows the consistently strong growth of diesel relative to other fuels -- in only two
41

countries has growth been less than 2% p.a., and the vast majority of countries have recorded growth rates
above 5 % .
Diesel demand in non-transport sectors is also important for understanding consumption patterns for
this multi-use fuel. Sometimes diesel prices are subsidized for agricultural, residential, and commercial users,
and to rural power generators. However, in many instances, diesel prices reflect costs or are taxed to help
cross-subsidize other household fuels. Often a portion of the subsidized fuels,-e.g. LPG and kerosene, wind
up being substituted for diesel in transport and other uses.
Jet Fuel
Similarly to diesel, jet fuel Figure 25. Ratios, 1993/1971:
demand has grown in response to Per-Capita Jet Fuel Demand vs. Per-Capita Income(dashed line: equal growth in jet fuel and income)
income growth, with little evidence of 10 - _
9-price-responsiveness. But its demand .
growth seems much less predictable -
than either gasoline or diesel. For a
few countries, jet fuel demand grew C XN
much faster than income: Singapore, h u TH HON. . ? BAa
Indonesia, Malaysia (Figure 25). It 'a 3 MEX EOY *.
grew less rapidly in South Korea and .- -
Taiwan. In some countries, it declined . 2 - ionco ALO TA
despite income growth: Pakistan, Wrl
a C ~~kR COLIsrael. Growth has been rapid for 6. M,r CyR
LEmany of the oil-exporting countries, * - Ti_ _
partly reflecting the rise in oil income. 0. _P0.8 -
Jet fuel consumption includes 0.7 0` CHt07 09a 0.9 1 2 3 4 6
usage for international aviation and for per-capita income: 1993/1971
domestic air transport -- commercial,
private and military. To fully understand consumption patterns one needs to examine domestic and
international aviation travel, and the other variables that influence jet fuel demand, e.g. vehicle fleet, miles
traveled, fuel efficiency: see Gately (1988) for an analysis of US jet fuel demand.
Figure 20 and Table 5 show that two of the largest consuming countries of jet fuel, which also have
two of the highest jet fuel shares, are Hong Kong and Singapore. Both of these countries are major
international air travel hubs. International traffic likely accounts for a large share for many other countries,
particularly those which are relatively small in geographic size.
42

Heavy Fuel Oil
Of all the oil products, heavy Figure 26. Ratios, 1993/1971: 1fuel oil has shown the most price- Per-Capita HFO Demand vs. Per-Capita Income
fuelponsiveness, although there is great(dashed line: equal growth in HFO and income)responsiveness, although there is great 1-0 _--
variation across countries. 7 J
6 - jolt
In several countries, demand Li SN
has grown faster than income 4 INS3- SYE PAK ., OeK
CD T~~~~~~~~~~~~~~~~~HA(Figure 26). Generally these are either % MWR
0) 2- ECU.EYTIM
oil-exporting countries or countries ,, TUA
such as Singapore, Libya, Jordan, and .5
Jamaica whose electric power is still X .... B" BRA~0.8 - BN R
generated entirely or almost entirely by .! 0.6 - CEE
0.065 yE
oil. 04 - gmKEN
But in most countries, per- &0.3- RG
capita heavy-fuel-oil demand has either 0.2 - ALCHON
decreased absolutely, or has grown COL
much more slowly than income. This 0.1 0.8 01350. .. 1 2 3 4
has resulted mainly from price-induced per-capita income: 1993/1971
fuel-substitution away from oil in
electric power generation. Countries have shifted to various fuels to generate electricity:
hydro: virtually all of South America: Brazil, Chile, Venezuela, Ecuador, Colombia
coal: Hong Kong, Israel, Indonesia
natural gas: Malaysia, Thailand, most of North Africa and the Middle East
nuclear: South Korea, Taiwan, Argentina
Some countries have switched away from oil-generated electricity almost completely, such as Hong Kong, and
some like Singapore have not switched away from oil.at all. But this does not imply a similar response in the
future; it implies the opposite: the greater the past switching away from oil-generated electricity, the less will
be possible in the future, but the greater are the possibilities for switching back to oil if oil prices were to
decline, or if supply constraints or policies necessitated a return to oil. Hong Kong has switched almost
completely from oil to coal for generating electricity, while Singapore continues to generate all its electricity
from oil. In the event of an oil price increase, we would expect little further reduction in heavy fuel oil
demand in Hong Kong but we might witness substantial demand reductions if Singapore were to switch away
from oil-fired electricity generation. Conversely, an oil price reduction might induce Hong Kong to switch
back to oil for electricity generation, but it would have no fuel-switching effect in Singapore. The potential
43

(or lack thereof) for hydro, natural gas, and nuclear, plus increasing environmental concerns, could
significantly affect the use of oil in power generation in the future.
Finally, it should be noted that heavy fuel oil has experienced not only demand reductions in response
to oil price increases, but also demand increases in response to the 1986 oil price collapse, most notably in
South Korea, Thailand, and Taiwan.
Kerosene
Kerosene is the only oil igure27. Ratios, 1993/1971:
product (other than heavy fuel oil) for Per-Capita Kerosene Demand vs. Per-Capita Income(dashed line: equal growth in kerosene and income)
which per-capita demand has been flat _ I .__
or declining in most countries 7
(Figure 27). Much of this decline in
kerosene is attributable to the rapid
growth of LPG (primarily propane), VA
which is being substituted for kerosene 2
in cooking. C ., MA TY
Kerosene is primarily a 0 PAXu'' I.,I 0.7CN
household fuel, and is used for cooking ec 0. - ECu CHN0L.0.
and lighting. In the Asian countries y 04- VEN Monx TCA
examined in this study excluding China, &O.O - K am
94% of kerosene consumption in 1993 0.2 - MA MON
was in the residential sector. In a
number of countries, household fuels -- 0. __- ' , ,__. 0.9 0.9 1 2 3 4 5
mainly LPG and kerosene -- are per-capita income: 1993/1971
subsidized in order to provide these
modern fuels to lower-income consumers, and to reduce the use of fuel wood, particularly around urban
centers. While a large subsidy encourages kerosene use, it is an inferior fuel to LPG and electricity (although
for lower-income consumers it may be preferable because of the lower cost for fuel, containers and
appliances). Kerosene for cooking is less desirable than the other fuels because it is used in small stoves and
is oily, dirty and smelly. For lighting, kerosene lamps are greatly inferior to lighting from electric bulbs.
As such, kerosene is an inferior good, which partly explains its sluggish growth relative to other
products. However its use as a transitional fuel could continue to expand to new consumers. Two billion
people in developing countries are without modern fuels; they use fuel wood and other biomass resources for
cooking. This fuel substitution of kerosene for biomass would be offset to some degree by switching of current
44

consumers of kerosene to superior fuels.
However the transition towards the use of modern fuels is complicated and varies between countries.
Pricing policies can hasten or slow the transition to use of a particular fuel. Kerosene subsidies will encourage
the use of kerosene use among the poor, but it will also delay higher-income consumers from switching to LPG
or electricity. Thus, relative prices of all household fuels are important in understanding kerosene
consumption patterns. Often subsidized prices are accompanied with rationing and import restrictions, e.g.
in India, which further influences total consumption of kerosene and other fuels. Constrained supplies of
kerosene diverts consumers to continued use of biomass.
Not all countries subsidize kerosene prices. Some countries tax household fuels along with all other
products, which dampens its use. Often this occurs in the poorest of countries, e.g. in Africa, because of
foreign exchange constraints and revenue needs.
To better understand kerosene consumption patterns in developing countries, one needs to consider
government policies, pricing for all household fuels including fuel wood, import controls, and market access.
In addition, one needs to examine households' state of transition with respect to fuel use, both urban and rural
-- from biomass to kerosene to LPG to natural gas or electricity; see Barnes et. al. (1994).
LPG
In most countries, LPG Figure28. Ratios, 1993/1971:
demand has grown nuch faster than Per-Capita LPG Demand vs. Per-Capita Income(dashed line: equal growth in LPG and income)
income, sometimes ten times as fast (or INS100 --
even faster in Indonesia, Singapore, 80 - SIN SKO70-60-
and South Korea). Demand has grown so-
more slowly than income in only a few 40 gCU
30 -
countries: Hong Kong, Israel, and r_ 20- PAK
Colombia (Figure 28). THA
Such rapid LPG growth is 1 0 -N - . _ ___a. 9 TUN
partly driven by fuel substitution in the 7 - VEN EGY6 SYR TAI
household sector from traditional fuels | 5 SAR o MOAG
Y 4 - ~~~~~JOB .... 4
like fuel wood and other biomass, as PHI
BRA
well as from a less-preferred oil 2N- Mo [ HON
product, kerosene. But such SAF KEN
ISR
extraordinarily rapid growth in LPG o -___
would not be sustainable for long as 0.7 - BAN CHN
0.7 089 0.9 1 2 3 4 5
substitution possibilities dissipate. per-capita income: 1993/1971
45

As previously mentioned, LPG prices are subsidized along with kerosene in many countries to provide
modern fuels to residential consumers, and to reduce consumption of fuel wood. These subsidies have
obviously contributed to the rapid growth in LPG demand, but income and availability have also been
important factors. LPG is primarily used in urban settings and mainly by middle- and upper-income
consumers. It is preferred to kerosene for cooking because it is a cleaner burning fuel. However, LPG use
has additional costs of larger containers (to purchase or leave deposit for) and more expensive equipment,
making it economically less attractive to lower-income households.
Relative prices of household fuels are also important. As indicated, lower-priced kerosene can delay
higher-income consumers from switching to LPG. Availability is also an issue, as with kerosene. Consumers
may be prevented from purchasing LPG because of limited supplies, consumer waiting lists, import controls,
inefficient distribution systems, etc. Some countries tax LPG along with other fuels -- often the poorest of
countries -- which also tends to dampen demand.
In the fuel-choice transition, LPG consumers may ultimately switch to electricity or natural gas,
potentially limiting LPG growth. However, there are many low-income consumers of kerosene, fuel wood
and other biomass that may be able to switch to LPG, given rising incomes and supply availability. It may
also be possible for consumers to move from kerosene directly to electricity or natural gas if supply networks,
incomes and prices allow.
46

Naphtha
Naphtha, used primarily as a Figure 29. Ratios, 1993/1971:
r (dashed line: equal growth in naphtha and income)was consumed in less than a dozen of
100 _
these countries in 1971. Even by 1993 8060-
it was still not consumed at all in nearly 50
half of the countries. A few of the 0 lr- 30- BRA|
significant consumers are not shown on SKOcM20 -
Figure 29 because consumption in 1971 oii M~~~~~~~~~~~~~~~~ON
was zero, e.g., Libya, Singapore, and so __ -- -- iO 8
Taiwan. Those countries with w 7
significant shares of naphtha L S -
consumption in 1993 can be clearly 90 OR
seen in Figure 20 (also see Table 5). 2 -2MEX NO "'""'
Of all the countries which
consume naphtha, demand has grown - -- --
0.8-much more rapidly than income in 0.7LS inoNENJg PH 0 MOEOLSYE1 EGY INFAY THA C_Al
07 08 09 1 23 4
virtually all cases. But the growth rate per-capita income: 199311971
is highly variable and it might not easily
be explained econometrically. Demand growth for naphtha in many of these individual countries has clearly
been a function of new petrochemical capacity -- in addition to petrochemical demand. We can expect this
to continue.
47

Other Oil Products
The growth of "other" oil igure 30. Ratios, 1993/1971:
products has been extremely variable, Per-Capita Other Oil Demand vs. Per-Capita Income(dashed line: equal growth in other oil and income)
relative to income growth. In a few 10
countries with increasing incomes, its
use has declined, such as Israel and SAR
Syria. In other countries, it has grown
much less rapidly than income: China, _ TA
BAN COL.Hong Kong, Thailand, India and k ECU B L
Pakistan (Figure 30). Yet in many | 3 NC EGY
countries, demand has grown twice as B BRA
rapidly as income: South Korea, X 2 Cm ,"i
Malaysia, Bangladesh, and Brazil, .G ~~~~J°O. 1i0R THAamong others. , 'N IND
"Other" products refers to all . _____ _ ____
petroleum products outside of the seven 0 - ISR
0.8~~~~~~~~~Y
major products included above. It is a 0 R70 Ar SYROA0.7 0.8 0.8 1 2 4
diverse set of products which includes per-capita income: 1993/1971
bitumen, petroleum coke, lubricants,
waxes, white spirits, tar, sulfur, aromatics, olefins, paints, grease, and a large number of other petroleum-
based products. It is difficult to determine why consumption of this "group" moves the way it does, even
when examining OECD data. But, as with many of the major products already discussed, consumption in
developing countries seems to be driven largely by income growth.
Sometimes the data in this category is the least reliable, given its "catch-all" character. Consumption
of some of the seven major products could be omitted from the data for that product, and can inadvertently
wind up in this "other" category.
It is sometimes difficult to know why consumption of this group of products moves the way it does.
For many countries, changes in consumption of "other" products are similar to changes in most of the major
products (see Table 4 or Table A2). However in some cases they move quite differently, e.g. Colombia,
Kuwait, Syria and Tunisia. Of these four countries, only Colombia has a significant share of "other" products
(see Table 5). One would have to examine in depth the quality of the data and the end-use structure of these
products to more fully explain consumption patterns of this group.
48

5. Important Phenomena Affecting Oil Demand
This section makes some generalizations about important phenomena for understanding the
determinants of oil product demand in these 37 countries. We focus on the importance of income and
population growth, and the lesser importance of changes in oil prices. We also describe some interesting
asymmetries in the response of oil demand to increases and decreases in income, as well as to increases and
decreases in price. Finally, we discuss the importance of indigenous energy resources, domestic energy
policies, and the impact of the transition to modern fuels from traditional fuels such as fuel wood.
5.1 The Importance of Income Growth
When explaining changes in oil demand in the developing countries, the most important factor is
income growth. The demand response to the dramatic changes in crude oil prices since 1973 has been
relatively modest, especially in comparison with that of the OECD countries. This was illustrated in Figure 4,
Figure 19, and in Dargay-Gately (1995b). It will also be evident in the econometric results presented below.
The importance of income growth was illustrated in Figure 19, which contrasted the OECD and
developing countries' 1993/1971 ratios of per-capita oil demand to their 1993/1971 ratios of per-capita income.
For the OECD countries, the expected positive relationship between oil demand growth and income growth
is not obvious, because of the magnitude of their demand response to the 1973-74 and 1979-80 oil price
increases. On the other hand, in the developing countries there is clearly a positive relationship (but certainly
not a perfect one): the greater the growth in income, the greater the growth in oil demand. The relationship
is even stronger if we separate the OPEC countries from the non-OPEC developing countries. Within OPEC,
oil demand has risen even in the face of declining per-capita income. In the non-OPEC developing countries,
oil demand has increased about as fast as income, except in a few countries that have been able to diversify
their energy sources in response to the oil price increases of the 1970s, for example Hong Kong. The sources
of such diversification away from oil could be either from having domestic resources of natural gas and coal,
or by having sufficient foreign exchange earnings to finance alternate fuel imports.
5.2 Asymmetric Response to Income Decline in Oil-Exporting Countries
In many developing countries, declining per-capita income has been an important phenomenon, i.e.,
where income growth has been slower than population growth. In the case of some oil-exporting countries,
when oil prices fell sharply in the 1980s, there were declines in total income, not just in per-capita income.
It is not necessarily true that oil demand responds symmetrically to income growth and decline; oil
demand increases caused by income growth need not be reduced proportionately by income decline. When
we examine the data, we see that a country's oil demand response to declining per-capita income sometimes
49

depends upon whether it is an oil importer or an oil exporter. In oil importing countries, declines in per-capita
income are accompanied by roughly proportional declines in per-capita oil consumption; this symmetric
response to income growth and decline is embodied in conventional demand equations. But in the oil-exporting
countries, it has often been the case that as income declines oil consumption continues to increase, albeit more
slowly than when income had been increasing.
Figure 31 illustrates the Figure 31. Oil Demand vs. Income, Per-Capita, 1971-93:
heterogeneity of oil demand response to India, Peru, South Korea, and Saudi Arabia
income growth, in per-capita terms 3 Saudi2 ~ ~ ~ ~ ~ /Arabiaover the period 1971-93, in four 2
countries: India, Peru, South Korea, _ S '.,
and Saudi Arabia. It is similar to the ° 0 Korea0.8
six-region graphs of Figures 3 and 4; c? 0'IO~0.6the circular markers denote 1993. 05 /
0.4/
India shows moderate and o
steady growth in income, together with . / Peru ;
roughly proportional growth in oil X e f
demand. Moving in the oppositea01
direction is Peru, where both income 0°08 India0 07
and oil consumption have declined, by 0006
about the same proportion. 0.04.
$100 $1,000 $10,000
In South Korea, we observe not per-capita income, 1971-93 (1987 $)
only very rapid income growth over the
entire period, but also three quite different responses of oil demand: rough proportionality in growth until the
1979-80 price increase; then flat oil demand with continuing income growth until the 1986 oil price collapse;
and finally a surge of oil demand, growing much faster than income since 1987.
The experience of Saudi Arabia is representative of many OPEC members which are rich in natural
resources. Their initial rapid growth in both per-capita income and oil demand in the early 1970s is followed
by a period of stagnant per-capita income but increasing oil consumption in the late 1970s (the vertical
segment). But since the early 1980s, per-capita income has declined significantly but oil consumption has
remained relatively flat, except for a drop in 1984.
50

5.3 Oil Demand Response to Oil Price Increases
The dramatic changes in world crude Figure 32. World Price of Crude Oil, 1971-93
oil prices are depicted in Figure 32: the two $60
sharp price increases, in 1973-74 and 1979-80,='$50-
and the 1986 price collapse. S
Although the oil-demand response to the X$40-
oil-price increases of the 1970s is more apparent
within the OECD, many developing countries cS0_S 30-
have responded significantly as well. As was
observed in Figure 16, many developing , S20
countries' oil share of energy was much lower .l
0in 1993 than in 1971. Undoubtedly, some of 3 $10
this response was due to conservation and
improvements in fuel efficiency. However, the $019l 71 19L76 1991I 19L86 1991
nature of our data does not allow us to measure | __I
this directly.
Price-induced fuel-substitution away from oil is most important in electricity generation, where
alternative fuels exist. Figure 17 showed how countries' oil shares of electricity generation had changed
between 1971 and 1993. Depending upon the country, the primary alternatives to oil-generated electricity have
varied. Hydro power has been the main alternative in virtually all of South America. Coal has been the
substitute fuel for electricity generation in Hong Kong, Israel, and Indonesia. Natural gas has been the
substitute in Malaysia, Thailand, most of North Africa, and the Middle East. Only a few countries moved
significantly to nuclear power generation: South Korea, Taiwan, and Argentina.
5.4 Oil Demand Response to Oil Price Cuts
In contrast to the OECD, where there has been little demand increase in response to the 1986 oil price
collapse,8 there are several developing countries in which there has been a substantial increase in oil's share
of total energy. The most dramatic reversal has occurred in South Korea, where oil's share of energy in 1993
has almost returned to its previous maximum of the late 1970s.
8 See Dargay-Gately (1994) for an overview of this issue, Dargay-Gately (1995) for an analysis ofnon-transportation oil, and Dargay-Gately (1996) for transportation oil.
51
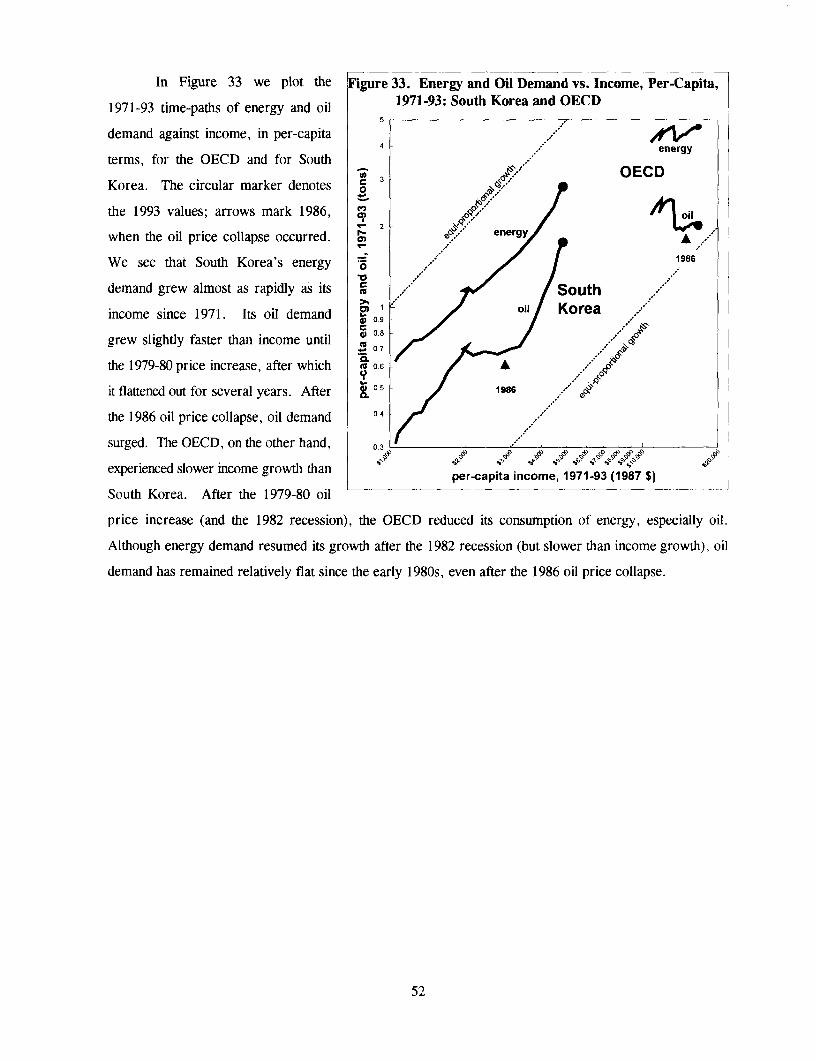
In Figure 33 we plot the Figure 33. Energy and Oil Demand vs. Income, Per-Capita,
1971-93 time-paths of energy and oil 1971-93: South Korea and OECD5
demand against income, in per-capita 4
4 ~~~~~~~~~~~~energyterms, for the OECD and for South OECDKorea. The circular marker denotes c
the 1993 values; arrows mark 1986, . 2 I9<°o/ when the oil price collapse occurred. y energy 4
We see that South Korea's energy o . 1986
demand grew almost as rapidly as its c Southincome since 1971. Its oil demand o oil Korea4) 0.9
grew slightly faster than income until 0 0.
the 1979-80 price increase, after which y 06 ,
it flattened out for several years. After . 0 5 1986 ,.
the 1986 oil price collapse, oil demand 04
surged. The OECD, on the other hand, 0 3L
experienced slower income growth than per-capita income, 1971-93 (1987 $)
South Korea. After the 1979-80 oil
price increase (and the 1982 recession), the OECD reduced its consumption of energy, especially oil.
Although energy demand resumed its growth after the 1982 recession (but slower than income growth), oil
demand has remained relatively flat since the early 1980s, even after the 1986 oil price collapse.
52
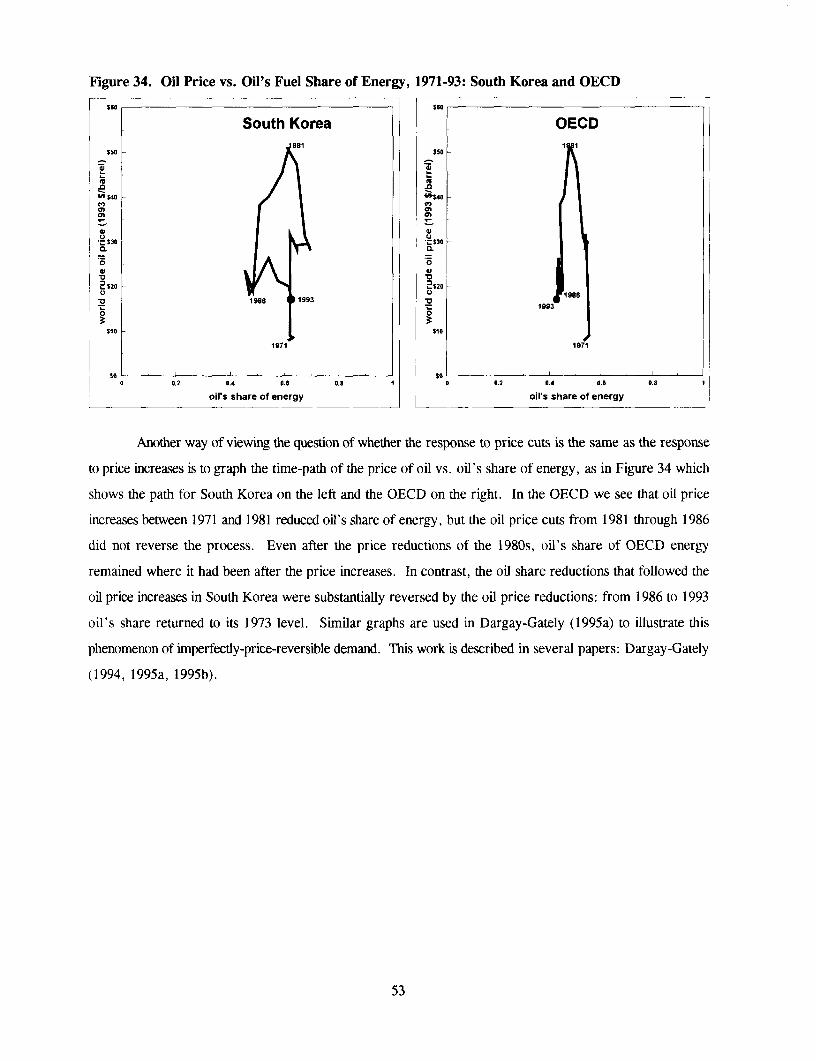
Figure 34. Oil Price vs. Oil's Fuel Share of Energy, 1971-93: South Korea and OECD
$ea $e0
South Korea OECD
a 0.2 54 o.e J 1 D 02 0.9815 1 1
$50- $50
.0 .0
$30-~~~~~~~~~~~~~~~~~~~~~~0
Xs oi' hr f nryolsshrfeeg
0. 0.
2$20- 2520-o 0~~~~~~~~~~~~~~ 1986
1993 ~~~~~~~~~~~~~1993
$10- $10
1971 1971
0 0.2 9~~.4 0.6 0.8 1 00.2 0A 0.00.
oil's share of energy oil's share of energy
Another way of viewing the question of whether the response to price cuts is the same as the response
to price increases is to graph the time-path of the price of oil vs. oil's share of energy, as in Figure 34 which
shows the path for South Korea on the left and the OECD on the right. In the OECD we see that oil price
increases between 1971 and 1981 reduced oils share of energy, but the oil price cuts from 1981 through 1986
did not reverse the process. Even after the price reductions of the 1980s, oil's share of OECD energy
remained where it had been after the price increases. In contrast, the oil share reductions that followed the
oil price increases in South Korea were substantially reversed by the oil price reductions: from 1986 to 1993
oil's share returned to its 1973 level. Similar graphs are used in Dargay-Gately (1995a) to illustrate this
phenomenon of imperfectly-price-reversible demand. This work is described in several papers: Dargay-Gately
(1994, 1995a, 1995b).
53
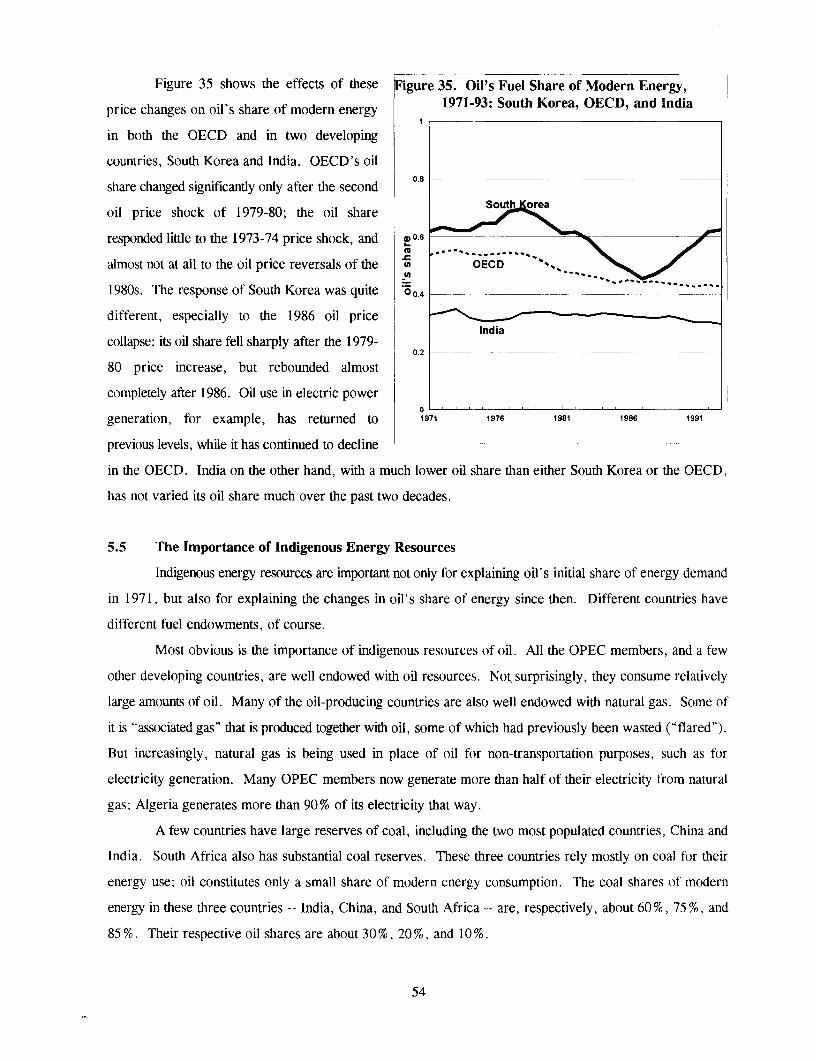
Figure 35 shows the effects of these Figure 35. Oil's Fuel Share of Modern Energy,
price changes on oil's share of modern energy 1971-93: South Korea, OECD, and India
in both the OECD and in two developing
countries, South Korea and India. OECD's oil
share changed significantly only after the second
oil price shock of 1979-80; the oil share _
responded little to the 1973-74 price shock, and 00.6
almost not at all to the oil price reversals of the X OECD
1980s. The response of South Korea was quite 0O.4 _ _
different, especially to the 1986 oil price
collapse: its oil share fell sharply after the 1979- l
80 price increase, but rebounded almost
completely after 1986. Oil use in electric power
generation, for example, has returned to 1971 1976 1981 1986 1991
previous levels, while it has continued to decline
in the OECD. India on the other hand, with a much lower oil share than either South Korea or the OECD,
has not varied its oil share much over the past two decades.
5.5 The Importance of Indigenous Energy Resources
Indigenous energy resources are important not only for explaining oil's initial share of energy demand
in 1971, but also for explaining the changes in oil's share of energy since then. Different countries have
different fuel endowments, of course.
Most obvious is the importance of indigenous resources of oil. All the OPEC members, and a few
other developing countries, are well endowed with oil resources. Not surprisingly, they consume relatively
large amounts of oil. Many of the oil-producing countries are also well endowed with natural gas. Some of
it is "associated gas" that is produced together with oil, some of which had previously been wasted ("flared").
But increasingly, natural gas is being used in place of oil for non-transportation purposes, such as for
electricity generation. Many OPEC members now generate more than half of their electricity from natural
gas; Algeria generates more than 90% of its electricity that way.
A few countries have large reserves of coal, including the two most populated countries, China and
India. South Africa also has substantial coal reserves. These three countries rely mostly on coal for their
energy use; oil constitutes only a small share of modern energy consumption. The coal shares of modern
energy in these three countries -- India, China, and South Africa -- are, respectively, about 60 %, 75 %, and
85 %. Their respective oil shares are about 30 %, 20 %, and 10 %.
54

Some countries, especially those in South America, have substantial hydrpelectic resources. Brazil
generates nearly 90% of its electricity from hydro power. Chile, Ecuador, and Peru receive more than half,
and Colombia and Venezuela obtain more than a third from hydro power. Outside South America, only a few
countries get as much as 20% of their electricity from hydro: 75% in Kenya, and about 20% in Pakistan,
Syria, and Nigeria.
5.6 Domestic Energy Policies
Domestic government policies can have a pronounced affect on oil and energy consumption.
Governments can intervene in energy markets in a number of ways -- directly and indirectly -- but the three
main interventions that governments have taken are through pricing policies, access to markets, and import
policies.
In many developing countries, governments have complex, inconsistent and distorting pricing policies.
And these policies are changing over time. Some governments have subsidies on most or all petroleum
products, particularly in oil-producing countries which possess vast crude oil resources. Due to budgetary
pressures many of these large oil-producing countries have recently begun raising consumer prices to at least
cover costs, but in some countries petroleum products remain heavily subsidized, e.g., Venezuela and Nigeria.
At the other extreme, many countries have moved to market prices, e.g. Argentina, or are nearly there, e.g.,
Thailand, which liberalized all oil product prices in 1991 except for retaining a subsidy on LPG.
A large number of countries in between have complex pricing policies which distort markets in several
ways. Many countries have subsidies on household fuels, notably LPG and kerosene (and electricity). Often
these subsidies are targeted for the poor but wind up providing much of their benefits to middle- and high-
income households. In addition, a subsidized multi-use fuel such as kerosene can be diverted to other uses
(e.g., industry and transport), or to black markets and exported to neighboring countries (e.g. from Ecuador
and Nigeria). In many instances, subsidies are set to encourage consumers to switch away from fuel wood
and other biomass resources, especially in urban settings. However if subsidies are accompanied by rationing,
e.g. in India, then the pressures on fuel wood use and associated environmental problems can continue.
Subsidies on major fuels also have the effect of bringing down the prices of alternative fuels such as fuel wood,
which can slow the decline in fuel wood usage.
In many developing countries, price subsidies on household fuels are cross-subsidized with taxes on
transport fuels and other products. Often the objective is to minimize the net financial cost to the government.
But of course, there can be significant economic and social costs from large subsidies on some products and
high taxes on other products.
In some countries, there are large taxes on LPG and kerosene, in addition to high taxes on transport
fuels. Often these are in the poorest countries which have little resources and must import fuels, for example
55

in Haiti and in many African countries such as Burkino Faso and Mauritania (these countries not in this study).
Foreign exchange constraints or revenue needs sometimes are the main factors determining such countries'
policies. Generally, high taxes on modern fuels will result in more people using traditional fuels. In Cape
Verde, where fuel wood resources are scarce, even poor people use a significant amount of expensive
imported modern fuels because there are few alternatives.
In addition to absolute levels of petroleum prices, relative prices -- as determined by government tax
policies -- can also affect consumption patterns significantly. A lower price for kerosene relative to LPG can
delay middle and upper income households from switching to LPG, a superior fuel. In a great many countries
(including some OECD countries) taxes on diesel fuel are well below those for gasoline. Often the rationale
is to lower the costs for commercial transporters, but this can provide a large incentive to switch to diesel-
fueled vehicles. In some countries, diesel use in transport is a relatively small share of total diesel
consumption, but the tax differential vis a vis gasoline exists nonetheless. Prices for kerosene, LPG and diesel
which are mis-aligned due to taxes can divert fuels away from their intended use, e.g., lower priced kerosene
and LPG into transport. In addition, petroleum product prices that are mis-aligned with competing fuels due
to tax policies, can also distort consumption patterns of all fuels concerned.
Import controls on petroleum products can result in unmet demand. Often governments will ration
import controlled products, e.g. kerosene in India. Markets are further distorted if rationing is coupled with
subsidies, as is the case in India. Foreign exchange constraints might be the cause of import controls and
rationing policies in many countries.
In countries that do not deliberately restrict access to markets, inefficiencies caused by state-controlled
monopolies, import tariffs, licensing procedures, regulations on fuel distribution and marketing (and on
containers and equipment), etc., can influence consumption patterns of petroleum products and other forms
of energy. In rural areas, modern household fuels are either not available or the supply systems are not
reliable.
Many countries are in various stages of transition with respect to urbanization (typically rapid),
incomes and industrialization. Government policies can hasten or slow the transition with respect to
consumption of modern fuels. Choosing appropriate policies can be difficult for countries that want to provide
modern fuels to lower income households, but have unsustainable wood and other biomass resources.
Subsidies on kerosene and LPG, for example, continue to be used to make these fuels more widely available
and to prevent deforestation and associated environmental problems. In many instances -- rural and urban --
price may not be the determining factor in fuel choice, but rather availability. However, at every stage of the
transition, fuel price does impact the level of consumption: see Barnes et. al. (1994).
In sum, the varied policies on petroleum products and competing fuels can significantly alter
consumption patterns for these fuels. These need to be examined to better understand changes in energy
56

consumption patterns.
5.7 The Transition from Traditional Fuels to Modern Fuels
In many developing countries, traditional biomass fuels such as fuel wood constitute a significant share
of total energy, especially for residential consumption in the rural areas. With urbanization and increasing per-
capita income, there is fuel-substitution away from these traditional fuels, toward modern fuels (oil products,
coal, natural gas, and electricity).
Using Indonesia as an example, we Figure 36. Indonesia: Energy and Oil Demand vs.
graph in Figure 36 the 1971-93 time-paths of Income, Per-Capita, 1971-930.9per-capita energy demands (tons/person) on the 0.80.7.
vertical axis -- for oil, biomass, total modern 0.6 Xo",' total
fuels, and total energy -- against per-capita 0. °.- ee;0.4
income on the horizontal axis. The scales are 0.3
logarithmic. Rightward movement parallel to2' 0.2 biomass
the lighter, diagonal lines indicates demand . . . . . . . .
growth that is proportional to income growth; . /i 1993
steeper increase [less steep] indicates that &os.
demand is growing faster [slower] than income. 0.07 . ,,.
Per-capita consumption of total energy 0o05 19710.04 .....
has grown almost as rapidly as income, but . .
0.03.modern fuels have grown much more rapidly. $200 $300 $400 $500 $600 $700
per-capita income (1987 $)
This faster growth of modern fuels is due partly __ __ X
to fuel substitution away from biomass, as the process of urbanization and development continues. The growth
of oil consumption has varied over time, but it has grown roughly in proportion to income. Biomass
consumption has remained roughly constant in per-capita terms, but this could be a result of how the data were
estimated. In 1971 modem fuels constituted less than 30% of total energy (0.07 out of 0.25 tons/person); but
by 1993 their share had increased to more than 60% of total energy (0.36 out of 0.60 tons/person).
The growth of modern fuels -- including oil -- is thus partly attributable to substitution away from
traditional, biomass fuels. To the degree that the market penetration of modern fuels approaches completion,
the growth of modern fuels will decelerate. Not surprisingly, this process is at different stages in various
developing countries. In South Korea this process has been virtually completed within the past two decades,
but in Indonesia substitution away from biomass fuels still has a long way to go.
57

The transition away from biomass is igure 37. South Korea: Fuel Use in
best illustrated by Figure 37, which presents Residential and Commercial Sectors, 1971-9330000
South Korean energy consumption in the
residential and commercial sectors.9 It shows 25000 -
not only the growth of total energy use, but also lectricity
the transition away from biomass (and away t 20000 -a s
from coal after the 1986 oil-price collapse), . ,al
toward oil and electricity. The transition away °- 15000 , - . sc.
0 Visc.oilfrom biomass is now almost complete. Hence X rI%*
the growth of modern fuels will no longer be ' 10 f * iesel
propelled by both income growth and fuel
substitution away from biomass, but solely by S0o0 .rosene
income growth. Similarly, the rapid substitution .. = =PG
of oil products for coal after the 1986 oil price 1971 1070 108 188log 191
collapse seems likely to continue, until coal is
completely replaced by more convenient fuels: igure 38. Indonesia: Fuel Use in|gul Residential and Commercial Sectors, 1971-93|
oil, natural gas, and electricity. But eventually, 50000
the rapid growth of oil products must L
decelerate, as the fuel substitution of oil for coal
slows down. [350008.-
In contrast with South Korea's near of
completion of the transition to modern fuels, .30000.... .. - ... ..- 250*0 .-.. ..... :::: .... -:.:.-.:.::. !:.-:-
Figure 38 shows that Indonesia still has a long 200. ; ;-- ; :jj.......... F, j : j: -. i ..*-- ;;..;.
way to go in the transition to modern fuels in t 20000 *.,
the residential and commercial sectors.
The speed at which modern fuels ooo0.; . . M.: .r .~ ~~~~-a
displace traditional fuels will depend on manyOil
factors: urbanization, income growth, D_, _ ._ l_ .___|
industrialization, rural development, and l X
government policies including those on taxes,
subsidies, and market controls. Different countries are at different stages in this process.
9 The IEA statistics do not provide a sectoral breakdown of traditional fuel use, only an aggregateestimate. We have simply assumed that traditional fuels are used in the Residential and Commercialsectors, and that none are used in Transportation, Industry, or Electric Power.
58

Figure 39 compares each Fiure 39. Biomass Share of Energy, 1993 vs. 1971
country's 1993 biomass share of total
energy with its 1971 share. Virtually BAN
afl countries have lower biomass shares THABRA INS
in 1993 than in 1971: they are below J AM ,P0)~~~~~~~~~~~~~. TUN
the dashed line that indicates unchangedCHN MAY
share. A few countries still have C
ARG
relatively high shares of biomass: 0) - EGY
among the highest are Kenya, Nigeria, ' 9 -\L
and Bangladesh. Other countries have i
relatively low shares; among these is IRA
China, which gets most of its energy
from coal and less than 5 % from
biomass, according to published IEA
data. However, there are other ° '> o
biomass share of energy, 1971(%estimates of China's biomass share that a s o er 1
are much higher (World Bank 1996).
Many countries have significantly reduced the energy share of such fuels since 1971. The most
obvious is South Korea: in 1971 its energy was about 20% from biomass; by 1993 such fuels constituted less
than 1 % of total energy. Many other countries have also reduced their biomass share between 1971 and 1993:
Indonesia from 71 % to 34%, Pakistan from 50% to 20%, India from 39% to 22%, Bangladesh from 79% to
46 %, Nigeria from 85 % to 60 %, and Ecuador from 47 % to 16%.
59

6. Econometric Analysis of Demand for Eight Oil Products
In this section we describe our econometric results. For each of the products and each of the
countries, using annual data for 1971-93, we examined several alternative equation specifications of per-capita
oil product demand as a function of per-capita real income and the real price of crude oil.
6.1 Specifications of Per-Capita Oil Product Demand Equations
Given the heterogeneity of oil demand response to change in income and prices, both across countries
and oil products, it is necessary to examine several specifications of the demand equation. Each of the
following specifications works well for some countries or products, but no equation works well for all. There
are four general types of specifications for which results are shown in tables below. In each case, the demand
and income variables are measured in per-capita terms, and logarithms of all variables are used. Our notation
is the following:
D, logarithm of per-capita oil demand
GDP, logarithm of per-capita real income
Pt logarithm of the real international price of crude oil
The four specifications are the following:
1. Demand as a function of income only, with no price variable; demand responds symmetrically to income
increases and decreases. We assume that demand is a Koyck-lag function of income, that is, there are
geometrically declining weights on past levels of income:
D, = a + y (GDP, + X GDP,- + A2 GDP,, + X3 GDP,3 + ... + X'GDPt, +...)
We expect 0< X < 1.
The function actually estimated is the standard Koyck-lag specification:
(1) Dt = c + y GDPt + X D,_,
2. Demand as a Koyck-lag function of income only, with no price variable, but the response to income
increases could be different from the response to income decreases; hence we decompose income (actually,
the logarithm of income) into increasing income and decreasing income, in order to test whether the response
is symmetric:
(2) Dt = a + yi.., GDPincr,t + Ydecr GDPdecr.t + ). D,1
For the cases in which this specification was preferred, a Wald test of the hypothesis:
Yincr = Ydecr
allowed us to reject a symmetric response to income increases and decreases.
60

3. Demand as a function of income (symmetric for income increases and decreases) and price (symmetric for
price increases and decreases). Following Dargay-Gately (1995a) and Johnston (1984), we assume
geometrically-declining lagged weights, that are separately estimated for income (O < (Iy < 1) and for price
(O< < 1):
(3) D, = a + P£_i=o (0 ki p' + y_,=O 4Y' GDPti
The actual demand equation estimated is:
D,= a(l-4p)(I-ty) + (4p+ 4 y) Dt, - (4p(4y) D.2 + , P, - fyo PH, + y GDP, - 4>py GDP,-
There are two special cases of this specification:
3a) Koyck-lag specification, in which the income and price lag coefficients are assumed to be equal:
(I)Y=fP
This specification can be simplified to its standard form:
Dt = a + 3 PP + y GDP, + X D,_1
3b) specification with no income lag: 4Py=0 (i.e. instantaneous adjustment of demand to income changes):
Dt = a + _i=O. _(Ppi p,-i + y GDP,
4. Demand as a function of income (symmetric) and price (asymmetric: with possibly different responses to
increases in the maximum historical price, to price cuts, and to price recoveries), with separately estimated
geometrically-declining lagged weights on income and price:
(4) D, = a + Pm>i=O..Pi Pmax,t-i + pcEi=O.._ki Pcut,t-i + PlrEi=O..4P Prec,t-i + Y_i=O.(_)y GDPt_i
This specification was also used previously in Dargay-Gately (1995a). Again, there are two special cases of
this specification:
4a) Koyck-lag specification, in which the income and price lag coefficients are assumed to be equal:
=¢ 'p
This specification can be simplified to its standard form:
Dt = a + Pm Ptnax,t + Pc Pcut,t + P, Prec.t+ y GDPt + X D,,
4b) specification with no income lag: = =O (i.e. instantaneous adjustment of demand to income changes):
D, = a + mi=O..*i P.a -i + p=.P.,t-i + PE,=. .gi Prct-i + y GDPt
61
6.2 Estimated Elasticities of Demand with Respect to Price and Income
The following 8 tables summarize, for each of the 8 products respectively, the best econometric results
for each of the 37 countries (best in the sense that the coefficients had the expected signs and were statistically
significant'e). Regressions were done separately for each country for each product, except for countries which
did not consume a particular product: primarily naphtha, which is consumed by only about half of the
countries. For each product, there were a few countries where there was no reasonable econometric
specification; such countries are omitted from that product's table.
When results for the Koyck-lag specification are shown in the tables below, the country name is
followed by "Koyck". Similarly, when results for the zero-income-lag specification are used, the country
name is followed by "GDP-lag=O".
In all cases shown, the price used was the real price of crude oil. It would have been preferable, of
course, to have been able to use end-use prices. Unfortunately, product price data were not generally available
for all years back to 1971, or for all products. For several countries, primarily in Asia, product prices were
available for the main products, at least back to 1973. However, the econometric results using these product
prices were disappointing, and not qualitatively different from the results for crude oil prices.
Let us attempt some generalizations about the econometric results. For most oil products, the most
important variable in explaining the change in product demand was the change in income. For about half of
the countries, income was the only important explanatory variable; changes in crude oil price were not useful
in explaining changes in demand.
For the majority of the countries, demand responded symmetrically to income changes. However,
OPEC members' oil demand often responded asymmetrically to income changes. When income grew, oil
demand increased rapidly; however when income fell, oil demand did not fall proportionately, but often
continued to increase, albeit more slowly.
For those cases in which the price of crude oil was statistically significant, the price elasticity was
often small relative to the income elasticity. In most cases, demand appeared to be perfectly price-reversible --
responding symmetrically to price increases and decreases. In contrast, OECD oil demand has been much
more responsive to the price increases of the 1970s, but it has been less responsive to the price decreases of
the 1980s; it has also been less responsive to income growth over this period.
Next we provide some generalizations about the results for each of the products, which appear in
Tables 7 through 14.
'° Statistical significance is measured at the 5 % level.
62

Gasoline
Relative to most other oil products, the econometric results for gasoline were reasonably good. Yet
in half of the countries, only income growth mattered: changes in crude oil prices were not statistically
significant determinants of gasoline demand.
Estimated income elasticities varied widely. Although several countries' income elasticities were about
1.0, which is about what might be expected, several countries yielded implausibly large values. Many of the
highest estimates were from oil-exporting countries, where there was often evidence of asymmetric response
to income changes: gasoline demand surged when income grew, but demand continued to increase (at a slower
rate) when income declined.
For those countries where price was significant, its effect most often appeared to be symmetric for
price increases and decreases. In a few cases, most notably South Korea, there was evidence of an
asymmetric response to price changes: a large response to increases in the maximum historical price (the price
increases of 1973-74 and 1979-80), but little response to either price cuts or price recoveries.
Diesel
The econometric results for diesel were similar to those for gasoline, and relatively good compared
to some products' results. Yet, in two-thirds of the countries with meaningful econometric results, only
income growth mattered: crude oil price was not statistically significant. The oil-exporting countries again
evidenced an asymmetric demand response to income increases and decreases; demand continued increasing
even when income was declining.
Income elasticities were less dispersed across countries. Many estimates were greater than 1.0, which
ought not be surprising give the growing share of diesel in the oil barrel consumed.
There was somewhat more evidence of imperfect price-reversibility: a lesser response to price cuts
than to the price increases of the 1970s.
Jet Fuel
The results were similar to those for gasoline and diesel, although not as good. As with diesel, in two-
thirds of the countries with meaningful econometric results, only income growth was an important explanatory
variable. Yet, even in many of these cases in which income had the expected positive coefficient, it was not
statistically significant; the elasticity estimates varied widely across countries. Again, the oil-exporting
countries exhibited asymmetric response to income growth and decline.
In only a few countries was there any evidence of price effects, and these elasticities were quite small.
This should not be surprising, given the fuel-efficiency improvements, often exogenous to the oil price
increases of the 1970s, that have characterised air travel for the past three decades; these are analyzed for the
63

US in Gately (1988b).
Heavy Fuel Oil
Of the major oil products, the econometric results for heavy fuel oil were the worst. In relatively few
countries was the price of crude oil statistically significant, and the estimated income elasticities varied widely
across countries. This absence of a price effect is surprising, given the fuel-switching away from oil in
electricity generation which occurred in many countries. It could be attributable to the variety of substitute
fuels for heavy fuel oil in its main use, electricity generation, whose use is often determined by the endowment
of domestic resources such as coal, natural gas, and hydroelectric power -- none of which was incorporated
in our equation specification. Government policies can also be an important factor.
Additional work is clearly needed on the demand for this product, employing what data is available
on the domestic prices of substitute fuels, and the domestic price of heavy fuel oil itself rather than the world
price of crude oil.
LPG
The demand for LPG has grown rapidly in many countries, as is evidenced by large income elasticities
that are estimated. The econometric results are relatively good for most countries. Income is the most
important explanatory variable, with many oil-exporting countries displaying an asymmetric response to
income increases and decreases. In some countries there is evidence of demand response to crude oil price
increases, but the elasticities are relatively small.
As a fuel for cooking, LPG (primarily propane) is preferable to kerosene, for which it is often
substituted. Yet rapid demand growth of LPG could be somewhat temporary, eventually being replaced by
the wider availability of more preferred sources of energy, such as electricity and natural gas. However, there
are still two billion people without modern fuels, some of whom will make the transition from biomass into
modern fuels.
More work needs to be done on LPG, dealing explicitly with fuel substitution: for kerosene, coal, and
biomass at the low end in terms of consumer preference and income, and natural gas and electricity at the high
end -- all of which have been ignored in our equation specification.
Kerosene
In most countries, per-capita consumption of kerosene has declined since 1971. Not surprisingly, the
estimated income elasticities are often negative (which the footnotes to Table 12 characterize as the "wrong"
sign). This implies that kerosene is an inferior good: as income increases, its demand decreases.
There are a few exceptions, such as South Korea. There we see (from Figure 37) that kerosene has
64

been substituted in the household sector for coal, an even more inferior fuel than kerosene.
But in general the econometric results are not very good. As with LPG, more work is needed, dealing
explicitly with fuel substitution possibilities, relative end-use prices, and government policies with regard to
household fuels.
Naphtha
Only about half of the 37 countries consume naphtha, which is an input into the petrochemical
industry. For these countries, the econometric results are very weak: price is never statistically significant,
and income is statistically significant in only a few cases.
An alternative specification ought to be examined, using not income as the main explanatory variable
but rather the activity level of the petrochemical industry.
Other Oil Products
The econometric results for this category of oil products are generally good, and similar to those for
gasoline and diesel. Income is the most important explanatory variable, and many oil exporters display an
asymmetric response to income changes. The price is significant for a few countries, but with a much smaller
elasticity. In a few cases, the price effect appears to be asymmetric but the relative magnitudes of the price
change coefficients are puzzling and not very convincing.
In summary, the econometric results for the different products are reasonably good for gasoline,
diesel, LPG, and "other" oil products. For jet fuel and heavy fuel oil, the results are mixed: reasonable for
some countries but not for many. For kerosene and naphtha, the econometric results are very weak.
65

Table 7. Gasoline Demand Equations: Long-run Elasticities
GASOLINE IF Income Elasticity Price elasticit Ad.specification: income only, no price variable: euation (1)
CHN: China 0.84 0.98
INS: Indonesia 1.01 0.98
ARG: Argentina 2.01 0.75
EGY: Egypt 0.98 0.95
VEN: Venezuela 5.58 0.98
PAK: Pakistan 1.36 | 0.95
HON: Hong Kong 0.48 ' _ r 0.86LIB: Libya 0.33 _ 0.92
JOR: Jordan 0.48 _ 0.83
JAM: Jamaica 1.29 __ 0.86
specification: income and price, both symmetic: eQuation (3)
MEX: Mexico 2.70 -0.29 0.92
TAI: Taiwan 0.78 -1.16 0.99
THA: Thailand 0.59 -1.00 0.97
MAY: Malaysia Koyck 1.31 -0.07 ' 0.97
PHI: Philippines 0.41' -1.05 0.94
SAF: South Africa -0. 14 b -0.12 0.55
COL: Colombia Koyck 0.17a -0.04 ' 0.94
CHI: Chile GDP-Iag=° 0.70 -0.13 ' 0.84
ECU: Ecuador Koyck 1.55 -0.07 0.81
TUN: Tunisia Koyck 0.89 -0.10 0.88
BAN: Bangladesh Koyck 2.34 -0.23 0.73
specification: income and asymmetric price: equation (3)
P max P rec P cut
SKO: South Korea 1.94' -1.26 0.39 b -0.16' 0.98
BRA: Brazil GDP-lag=0 0.27 a -0.19 -0.49 -0.38 0.81
IND: India 2.36 -0.27 -0.06' 0.06 b 0.99
ISR: Israel 1.58' -0.23 0.00 -0.09' 0.97
PER: Peru Koyck 2.64 -0.37 0.91 0.12 0.91
specification: asymmetric income response; n price variaibe: equation ) _
GDP incr. GDP decr.
IRA: Iran 1.84 0.68 ' 0.77
SAR: Saudi Arabia 9.54 3.61 ' 0.99
IRQ: Iral 1.53 0.24 ' 0.96
NIG: Nigeria 5.17 3.17' 0.98
ALG: Algeria 2.64 0.66' 0.99
UAE: lJAE 2.51' 0.92 0.83
KUW: Kuwait 1.65 0.59 C 0.85
Notes: a. correct sign but not statistically significantb. wrong sign but not statistically significantc. wrong sign and statistically significant
66
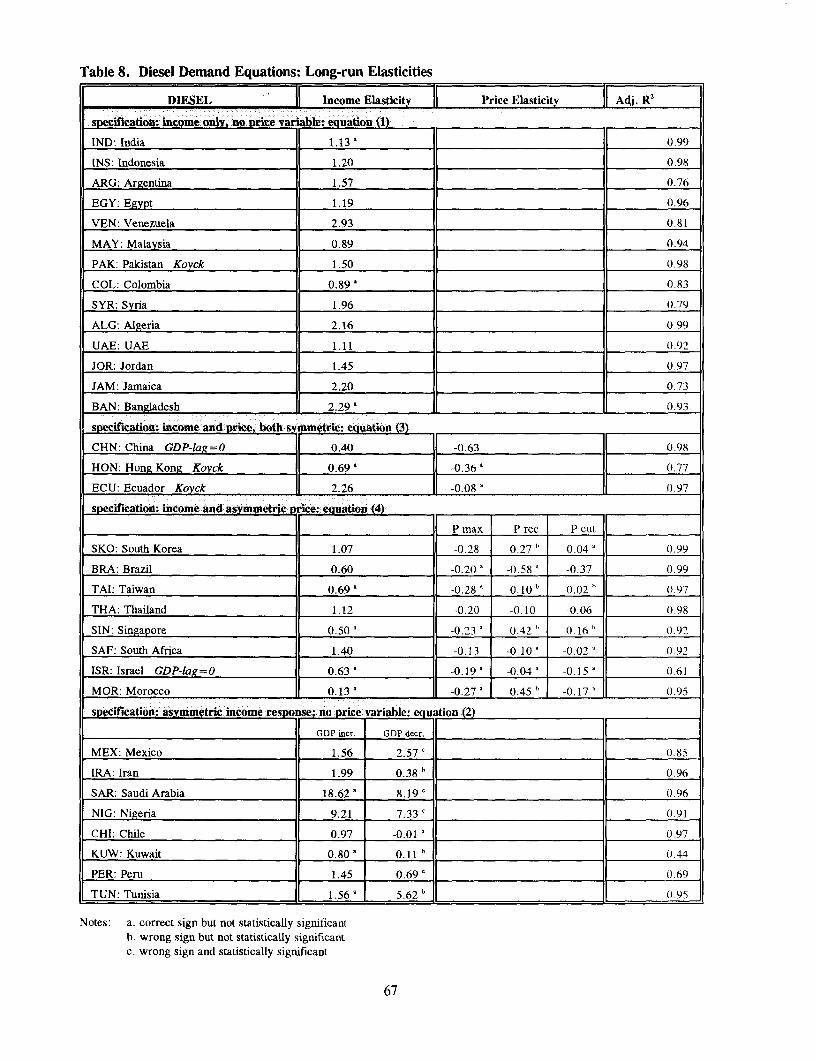
Table 8. Diesel Demand Equations: Long-run Elasticities
DIESEL Income Elasticity Price Elasticity Adj. R2
specification income only, no price variable: eouation (1)
IND: India 1.13' 0_ (99
INS: Indonesia 1.20 0.98
ARG: Argentina 1.57 0.76
EGY: Egypt 1.19 0.96
VEN: Venezuela 2.93 0.81
MAY: Malaysia 0.89 0.94
PAK: Pakistan Koyck 1.50 0.98
COL: Colombia 0.89' 0.83
SYR: Syria 1.96 0.79
ALG: Algeria 2.16 0.99
UAE: UAE 1.11 __ (.92
JOR: Jordan 1.45 0 0.97JAM: Jamaica 2.20 _ 0.73BAN: Bangladesh 2.29' _ 0.93
specification- income and price. both metric: eQuation (3)
CHN: China GDP-lag=O 0.40 -0.63 0.98
HON: Hong Kong Koyck 0.69 -0.36' 0.77
ECU: Ecuador Koyck i 2.26 -0.08X 0.97
specification: income and asymmetric prirce: equation (4)
P max P rec P cut |
SKO: South Korea 1.07 -0.28 0.27 b -0.04 a 0.99
BRA: Brazil 0.60 -0.20a| -0.58 a -0.37 0.99
TAI: Taiwan 0.69' -0.28 a 0.10 b 0.02 b 0.97
THA: Thailand 1.12 -0.20 -0.10 -0.06 (.98
SIN: Singapore 0.50 a -0.23 0.42 0. 16 ' 0.92
SAF: South Africa 1.40 -0.13 -0.10 a -0 02 0.92
ISR: Israel GDP-lag=O 0.63 ' -0.19 -0.04 a -().15 a 0.61
MOR: Morocco 0.13 ' -0.27 0.45 b 00.17 a 0.95
specification: asymmetric income resp onse no price variable: eouation (2)
GDP incr. GDP decr. __ 11
MEX: Mexico 1.56 2.57 ' __ 0.85IRA: Iran 1.99 0.38 b _ _ _ _ _ 0.96
SAR: Saudi Arabia 18.62' 8.19 _ |_ 0.96
NIG: Nigeria 9.21 7.33 ' || (.91
CHI: Chile 0.97 -0.01a ( .97KUW: Kuwait 0.80' 0.11 b 0.44
PER: Peru 1.45 0.69' _ || 069TUN: Tunisia 1.56 ' 5.62 b IL0 95
Notes: a. correct sign but not statistically significantb. wrong sign but not statistically significantc. wrong sign and statistically significant
67

Table 9. Jet Fuel Demand Equations: Long-run Elasticities
JET FUEL - < Income Elasticity Price Elasticit| Adj. R2
specification: income only, no price variable. equation (1)CHN: China 1.23 0.93
INS: Indonesia 1.36' _ 0.89
ARG: Argentina 4.88 0.67
EGY: Egypt 1.04 0.82
VEN: Venezuela 5.30 0.63
SIN: Singapore 1.06' 0.95
SAF: South Africa -1.16 b _ 0.70
PAK: Pakistan -0.26 b' 0.64
COL: Colombia -0.85 b 0.75
NIG: Nigeria 3.19 _ 0.85
ISR: Israel -2.47' _ 0.91
CHI: Chile 1.32 0.91
UAE: UAE 4.13 0.82
PER: Peru 3.14 I 0.87
JOR: Jordan 1.69' 0.83
BAN: Bangladesh 0.89' 0.91
specification: income and price, both symmetric: equation (3)
SKO: South Korea Koyck 0.89 -0.09' 0.90
IRA: Iran 1.67 0.01 b 0.82
TAI: Taiwan Koyck 0.08 -0.39 0.35
THA: Thailand GDP-lag=O 0.89 -0.26 0.94
MAY: Malaysia Koyck 1.34 -0.09' 0.90
HON: Hong Kong Koyck 1.38 -0.0 so 0.95
specification: income and asymmetric price: e'uation (4)
_ .__________|____ Pmax P rec | P cut
IND: India 0.05 -0.28 -0.96 -0.04 jj| 0.94
PHI: Philippines Koyck 0.78 | -0.11 4 0.21 b 4 0.09' 0.58
ECU: Ecuador Koyck 5.75 -1.28 -0.03' -0.41' 0.48
specification: asymmetric income response; noprice variable: equation 2)
C| GDP incr. CGDP decr.
MEX: Mexico 2.09 1.24' 0.87
BRA: Brazil 1.27 1.94' 0.78
SAR: Saudi Arabia 3.16' 0.53 b 0.83
IRO: Iraq 1.43 0.43 ' 0.54
ALG: Algeria 2.51 3.50 ' || 0.88
KUW: Kuwait 1.65 0.78 ' 0.31
JAM: Jamaica 1.90' 0.86b 0.61
Notes: a. correct sign but not statistically significantb. wrong sign but not statistically significantc. wrong sign and statistically significant
68
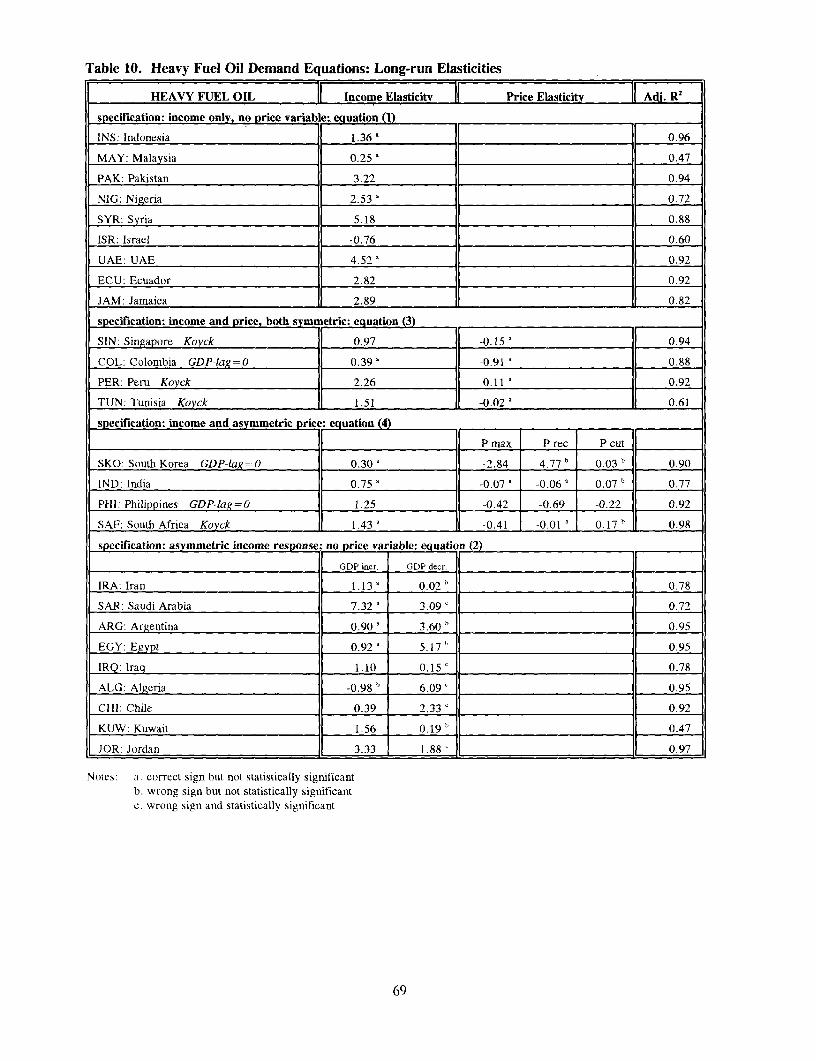
Table 10. Heavy Fuel Oil Demand Equations: Long-run Elasticities
HEAVY FUEL OIL Income Elasticity Price Elasticity Adj. R2
specification: income only, no price variable: equation (1)
INS: Indonesia 1.36 ' 0.96
MAY: Malaysia 0.25 a 0.47
PAK: Pakistan 3.22 0.94
NIG: Nigeria 2.53 a 0.72
SYR: Syria 5.18 0.88
ISR: Israel -0.76 0.60
UAE: UAE 4.52 a 0.92
ECU: Ecuador 2.82 0.92
JAM: Jamaica 2.89 0.82
specification: income and price, both sym etric: equation (3)
SIN: Singapore Koyck 0.97 -0. 15 0.94
COL: Colombia GDP-lag=O 0.39 ' -0.91 0.88
PER: Peru Koyck 2.26 -0.11 0.92
TUN: Tunisia Koyck 1.51 -0.02 J 0.61
specification: income and asymmetric price equation (4)
P max P rec P cut
SKO: South Korea GDP-lag=O 0 30 a -2.84 4.77 b 0 03 b 0.90
IND: India 0.75 ' -0.07 -0.06 0|07b 0.77
PHI: Philippines GDP-lag=O 1 25 -0.42 -0.69 -0 22 0.92
SAF: South Africa Koyck 1 43 ' -0.41 -0.01 ' 0 17 b 0.98
specification: asymmetric income response no price variable: equati,n (2)
GDP incr. (GDP deer.
IRA: Iran 1.13 ' 0.02h 0.78
SAR: Saudi Arabia 7.32 ' 3.09 0.72
ARG: Argentina 0.90 D 3.60 0.95
EGY: Egypt 0.92 ' 5.17" 0.95
IRQ: Iraq 1.10 0.15' 0.78
ALG: Algcria -0.98 b 6.09 0.95
CHI: Chile | 0.39 2.33 0.92
KUW: Kuwait 1.56 0.19 ' 0.47
JOR: Jordan 3.33 1.88 ' _ 0.97
Notes: a. correct sign but not statistically significantb. wrong sign but not statistically significantc. wrong sign and statistically significant
69

Table 11. LPG Demand Equations: Long-run Elasticities
LPG Income Elasticity Price Elasticity Adj. RW
specification: income only, no price variable: equation (1)
CHN: China 1.14 0.96
SKO: South Korea 2.64' 0.99
THA: Thailand 0.69 a 0.99
SIN: Singapore 2.58 0.85
PAK: Pakistan 2.59 0.94
SYR: Syria 5.25 ' 0.89
HON: Hong Kong 0.53 ' 0.82
KUW: Kuwait 0.37 ' 0.57
TUN: Tunisia 3.50 _ 0.95
KEN: Kenya 0.61 a 0.39
specification: income and price, both syv imetric: equation (3)
IND: India Koyck 4.39 -0.03 a 0.99
INS: Indonesia Koyck 3.04 -0.32 0.99
TAI: Taiwan Koyck 0.50 | -0.21 0.99
ARG: Argentina Koyck 1.08 -0.02 a 0.60
EGY: Egypt Koyck 1.87 -0.08 a 0.96
MAY: Malaysia Koyck 3.50 -0.14 0.96
ISR: Israel GDP-lag=O 0.83 -0.22 0.66
JAM: Jamaica Koyck 1.10 -0. 15a 0.75
specification: income and asymmetric price: equation (4)
_________________ Pmax P rec P cut _ _
MEX: Mexico Koyck 12.20 -1.39 -2.94 -1.42 0.99
BRA: Brazil Koyck 5.25 -0.95 ' 0.14 b 0.14 b 0.99
PHI: Philippines GDP-lag=O 0.96 -0.53 -0.25 ' -0.97 0.95
COL: Colombia Koyck 1.11 -0.61 0.21 b -0.08' 0.72
CHI: Chile Koyck 1.94 -0.34 ' -0.27 -0.08 0.76
BAN: Bangladesh GDP-lag=O 2.63 -5.38 ' -1.37 a -0.51 a 0.70
specification: asymmetric income response; no price variable: equation (2)
________ GDP incr. GDP decr.
IRA: Iran 1.10 -0.18 ' 0.64
SAR: Saudi Arabia 4.79 1.66 ' 0.98
IRQ: Iraq 2.53 0.44 0.80
ALG: Algeria 3.34 0.15 b 0.97
MOR: Morocco 2.15 1.14 b _________ 0.98
PER: Peru 1.10 0.13 __|| || 0.77
ECU: Ecuador 2.85 0 -0.70 a |.99
JOR: Jordan L 1.61 _0|06_ 0.6_ | 0.97
Notes: a. correct sign but not statistically significantb. wrong sign but not statistically significantc. wrong sign and statistically significant
70

Table 12. Kerosene Demand Equations: Long-run Elasticities
KEROSENE | Income Elasticity Price Elasticity Ad. R
specification: income only, fio price var ible: equation (1)
CHN: China -0.37 b 0.86
BRA: Brazil -9.27 b 0.92
IND: India 1.47 0.95
SAR: Saudi Arabia 0.61 0.57
INS: Indonesia -0.41 b 0.93
TAI: Taiwan -0.43 b 0.70
THA: Thailand -1.61 0.81
ARG: Argentina 7.39 0.90
EGY: Egvpt 2.25 _ 0.79
IRQ: Iraq 0.23 0.80
MAY: Malaysia -3.63' 0.94
SIN: Singapore -0.56' 0.77
PHI: Philippines -2.26 b 0.83
SAF: South Africa -4.94 b 0.87
PAK: Pakistan -0.44 b 0.37
COL: Colombia -1.32 ' 0.92
NIG: Nigeria 6.49 ' 0.98
ISR: Israel -2.41 b| 0.46
ALG: Algeria -32.83 b 0.96
UAE: UAE 0.45 0.51
HON: Hong Kong _1.11 b 0.95
KUW: Kuwait 0.50 0.78
TUN: Tunisia 0.34' 0.80
JOR: Jordan -0.20 b 0.45
JAM: Jamaica -0.69 b 0.42
BAN: Bangladesh -0.54 b 0.40
KEN: Kenya -1.03 b 0.73
specification: income and price, both svmmetric: equation (3)
SKO: South Korea Koyck 2.07 2 I -0.12' jj 0.93
specification: income and asymmetric price: e4luation (4)II ___________||__ _ P max I P rcc P cut ||
SYR: Syria Koyck jj 1.11' -. 47' 0. 19 b 030' 0.61
specification: asymmetric income response; no price variable: equation (2)
GDP incr. GDP decr.
MEX: Mexico 0.27' 5.62 ' 0.93
IRA: Iran 3.72 1.62' 0.71
VEN: Venezuela -0.28 b 1.69' || 0.99
CHI: Chile 1.12 ' 5.05 ' 0.90
MOR: Morocco -1.75 ' 0.03 b 0.93
PER: Peru 2.85 1.97' 0.81
ECU: Ecuador _2.30' 15.45 ' || 0.81
Notes: a. correct sign but not statistically significantb. wrong sign but not statistically significantc. wrong sign and statistically significant 71

Table 13. Naphtha Demand Equations: Long-run Elasticities
NAPHTHA Income Elasticity Price Elasticity Adj. W
specification: income only, no price variable quation () _
CHN: China 1.77 ' 0.96
MEX: Mexico 5.43 ' 0.90
SKO: South Korea 1.50 0.96
IND: India 0.19 0.76
ARG: Argentina 3.57 ' 0.77
SIN: Singapore 3.82 0.91
PHI: Philippines -15.61 b 0.62
SAF: South Africa -14.32 b 0.99
COL: Colombia -0.17 " 0.55
ISR: Israel 3.35 ' 0.67
CHI: Chile 0.17' 0.70
HON: Hong Kong 2.06 0.97
ECU: Ecuador 27.77 0.77
TUN: Tunisia 0.53' 0.05
BAN: Bangladesh 1.27' 0.23
specification: asyvmmetric income response; .o rice variable: equation ) I
GDP incr. GDP decr.
BRA: Brazil 1.68 -1.75 0.96
IRQ: Iraq 2.75 0.22 .o84
Notes: a. correct sign but not statisticaly significantb. wrong sign but not statistically significantc. wrong sign and statistically significant
72

Table 14. Other Oil Demand Equations: Long-run Elasticities
OTHER OIL PRODUCTS Income Elasticity Price Elasticity Adj. R2
specification: income only, no price varia le: equation (1)
CHN: China -0.55 0.83
BRA: Brazil 2.11 0.87
TAI: Taiwan 1.41 0.90
EGY: Egypt 1.59 . 0.98
SAF: South Africa 2.75 0.63
PAK: Pakistan 0.75 0.61
NIG: Nigeria 2.25 0.60
ISR: Israel 5.41 0.74
ALG: Algeria 2.36 0.71
CHI: Chile 0.52 0.57
UAE: UAE -1.51 0.86
HON: Hong Kong 0.31 0.37
MOR: Morocco 0.42 0.39
ECU: Ecuador 1.33 0.82
JAM: Jamaica 2.82 0.61
BAN: Bangladesh 3.20 _ 0.77
KEN: Kenya -1.40 F _ 0.08
specification: income and price, both sy metric: equation (3)
INS: Indonesia Koyck 0.63 -0.87 0.44
ARG: Argentina Koyck 0.79 -0.09 0.22
SIN: Singapore Koyck 0.84 -0.36 0.74
PHI: Philippines Koyck 11.02 -2.26 0.78
COL: Colombia Koyck 2.09 -0.49 0.71
specification: income and asymmetric price: equation (4)
P max P rec P cut .
SKO: South Korea Koyck 2.32 -0.49 -0.69 -0.24 0.96
IND: India GDP-lag=O 0.93 -0.19 0.20 0.03 0.83
MAY: Malaysia Koyck 4.89 -0.46 -1.16 0.36 .1 0.90
specification: asymmetric income respons n rice vriable: eua n (2) __
_ _ _ __ 2 GDP incr. L GDP decr. | _____
MEX: Mexico 1.07 -0.53 ' 0.66
IRA: Iran 1.45 0O01 b _ 0.69
SAR: Saudi Arabia 2.73 -1.35 '_ _ 0.94
IRQ: Iraq 1.42 0.07b _ 0.88
VEN: Venezuela 1.26 0.28 b 0.18
SYR: Syria 0.88 1.75 ' 0.36
KUW: Kuwait -19.16 -5.87 0.87
PER: Peru 1.43 2.11' __ 0.90
TUN: Tunisia 1.71 18.42' 0.89
JOR: Jordan 2.13 1.60' _ 0.72
Notes: a. correct sign but not statistically significantb. wrong sign bul not statistically significantc. wrong sign and statistically significant 73

7. Projections of Oil Product Demand
In this section we generate projections to the year 2010 of oil product demand for these countries, and
summarize the results.
Given the relatively poor econometric results in many countries for various oil product demand
equations, we decided not to use such equations in an attempt to provide representative oil demand projections.
Instead, we chose a simpler approach in which we aggregate the 37 countries into four groups and the eight
products into four categories. The 37 countries were divided as follows:
China;
OPEC & Mexico: Algeria, Ecuador, Indonesia, Iran, Iraq, Kuwait, Libya, Mexico, Nigeria,
Saudi Arabia, UAE, and Venezuela;
Other Asia: Bangladesh, Hong Kong, India, Malaysia, Pakistan, Philippines, Singapore,
South Korea, Taiwan, and Thailand;
Other LDC: Argentina, Brazil, Chile, Colombia, Egypt, Israel, Jamaica, Jordan, Kenya,
Morocco, Peru, South Africa, Syria, and Tunisia.
It is important to treat China separately, given its size and its rapid economic growth, its energy mix, and its
relatively slow growth of energy and oil consumption. OPEC and Mexico have also exhibited unique patterns
of income and oil demand growth, so that their demand projections should be done separately from other
countries. The two final groups were determined along regional lines: Other Asia, and Other LDC. These
tour groupings include only the 37 countries that we have analyzed, not all the countries that are included in
the more comprehensive global regional summary in Section 2 above.
With respect to oil products, we have aggregated the 8 oil products into four groups: transportation
oil (gasoline, diesel," jet fuel); heavy fuel oil; naphtha; and miscellaneous oil (LPG, kerosene, and "other"
oil products). The transportation oil products (about one-half of the barrel consumed) have similar
characteristics: few practical substitute fuels, and an income elasticity close to 1.0. Naphtha is unique, given
its role in the petrochemical industry; in addition, it is a product consumed by less than half of our 37
countries. Heavy fuel oil (about one-fourth of the barrel consumed) is the product with the greatest substitution
possibilities, especially in electricity generation; this means that its consumption can decline (or expand)
relatively quickly. Finally, the miscellaneous category includes two products that are often substitutes for each
other in the residential sector, LPG and kerosene, whose demand is difficult to project separately -- as well
as the "other" oil products.
" Although diesel has many uses in developing countries, its main use is for transportation, and henceit has been put in this category.
74

For each of these four categories and for each of the four country-groups, we ran regressions for
several equation specifications. That which yielded the best results in general was the relatively simple
regression of the logarithm of total demand on the logarithm of world crude oil price, the logarithm of total
income, and the logarithm of lagged demand:
(5) D, = a + P P, + y GDP, + A Dt,
This is the Koyck-lag, perfectly-price-reversible specification of demand; it is the same equation as (3) above,
except that the equation is for demand levels not demand per-capita as was (3).
The results varied across the four regional groups and, to a lesser degree, across the four product
categories. For China, Other Asia, and Other LDC, the basic specification yielded good econometric results,
with plausible elasticities for income and price. These estimated elasticities are shown in Table 15, tor those
regions and product categories for which good results were obtained; for elasticities not shown, good results
were not achieved. For OPEC and Mexico, none of the equations yielded satisfactory results -- although for
these aggregated groupings, we did not examine specifications in which income was decomposed into
increasing and decreasing income variables.
Table 15. Long-run Elasticities of Regional Oil Product Demandwith Respect to Income and Crude Oil Price
China Other Other OP'ECAsia LDC & Mexico
Transportation Oil: Gasoline, Diesel, Jet Fuel
income elasticity 0.62 1.16 1.03
price elasticity -0.29 -0.11 -0.07
Misc. Oil: LPG, Kerosene, Other Oil
income elasticity 0.14 1.04 1.18
price elasticity -0.09 -0.04
Heavy Fuel Oil
income elasticity 0.13 0.17
price elasticity
Naphtha
income elasticity 1.64 2.17
price elasticity -0.03
Income elasticities are lower in China than in Other Asia and Other LDC. This is not surprising,
given the graphs shown earlier (Figures 4, 15, 19, and 23-30). Price elasticities are small relative to income
elasticities, and smaller than estimated price elasticities for the OECD.'2
See Dargay-Gately (1994) and Dargay-Gately (1995b).
75
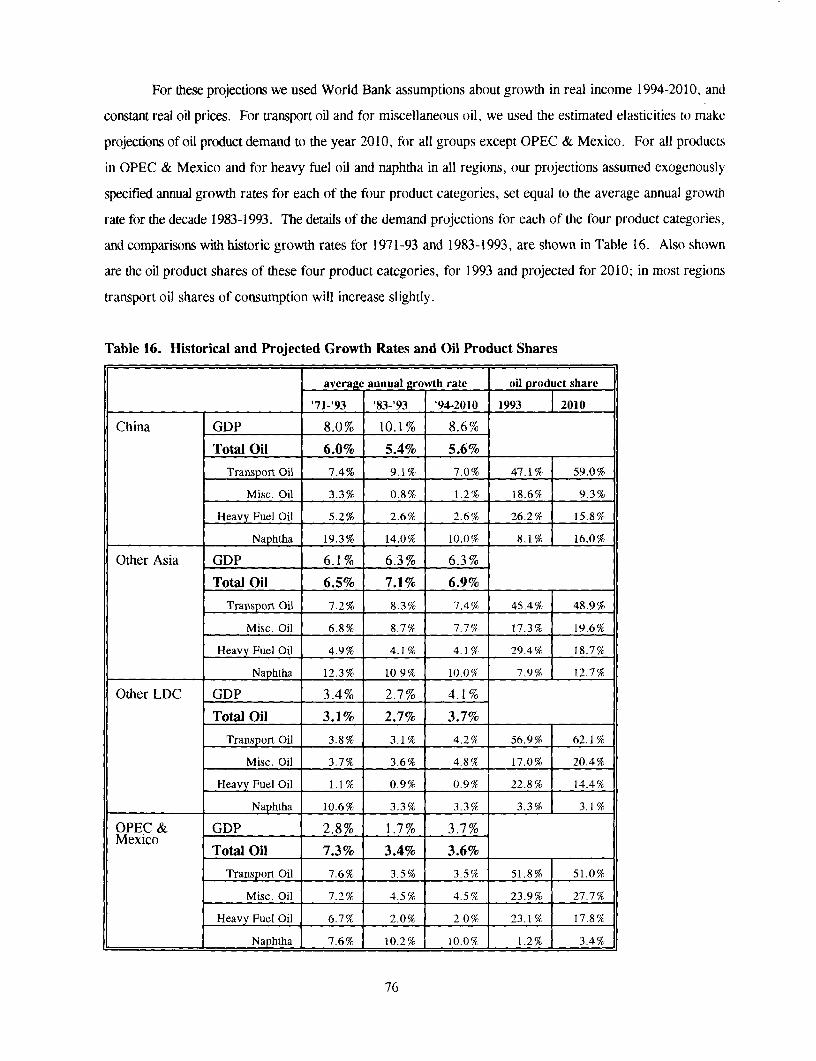
For these projections we used World Bank assumptions about growth in real income 1994-2010, and
constant real oil prices. For transport oil and for miscellaneous oil, we used the estimated elasticities to make
projections of oil product demand to the year 201 0, for all groups except OPEC & Mexico. For all products
in OPEC & Mexico and for heavy fuel oil and naphtha in all regions, our projections assumed exogenously
specified annual growth rates for each of the four product categories, set equal to the average annual growth
rate for the decade 1983-1993. The details of the demand projections for each of the four product categories,
and comparisons with historic growth rates for 1971-93 and 1983-1993, are shown in Table 16. Also shown
are the oil product shares of these four product categories, for 1993 and projected for 2010; in most regions
transport oil shares of consumption will increase slightly.
Table 16. Historical and Projected Growth Rates and Oil Product Shares
average annual growth rate oil product share
'71-'93 '83-'93 '94-2010 1993 2010
China GDP 8.0% 10.1 % 8.6%
Total Oil 6.0% 5.4% 5.6%
Transport Oil 7.4% 9.1% 7.0% 47.1% 59.0%
Misc. Oil 3.3% 0.8% 1.2% 18.6% 9.3%
Heavy Fuel Oil 5.2% 2.6% 2.6% 26.2% 15.8%
l____________ Naphtha 19.3% 14.0% 10.0% 8.1% 16.0%
Other Asia GDP 6.1 % 6.3% 6.3%
Total Oil 6.5% 7.1% 6.9% _
Transport Oil 7.2% 8.3% 7.4% 45.4% 48.9%
Misc. Oil 6.8% 8.7% 7.7% 17.3% 19.6%
Heavy Fuel Oil 4.9% 4.1% 4. 1 29.4% 18.7%
Naphtha 12.3% 10.9% 10.0 7.9% 12.7%
Other LDC GDP 3.4% 2.7% 4.1 %
Total Oil 3.1% 2.7% 3.7%37
Transport Oil 3.8% 3.1% 4.2 % 56.9% | 62.1%
Misc. Oil 3.7% 3.6% 4.8% 17.0% 20.4%
Heavy Fuel Oil 1.1% 0.9% 0.9% 22.8% 14.4%
Naphtha 10.6% 3.3% 3.3% 3.3% 3.1 %
OPEC & GDP 2.8% 1.7% 3.7%Mexico
Total Oil 7.3% 3.4% 3.6%
Transport Oil 7.6% 3.5% 3.5% 51.8% 51.0%
Misc. Oil 7.2% 4.5 % 4.5 % 23.9% 27.7%
Heavy Fuel Oil 6.7% 2.0% 2.0% 23.1 % 17.8%
Naphtha 7.6% 10.2% 10.0% 1.2% 3.4%
76

For OPEC & Mexico, the projections assume that oil product demand will grow in the future at the
same average annual rate as 1983-93; this is undoubtedly a lower bound, given that the assumed growth rate
for income is expected to be higher (3.7% vs. 1.7% in 1983-93). For China, with relatively modest growth
in heavy fuel oil, naphtha, and miscellaneous oil, but with transport oil growing almost as rapidly as the high
growth rate for income, we project that total oil demand will grow by 5.6% annually. For Other Asia, oil
demand is projected to grow at 6.9% annually, which is slightly faster than income. In Other LDC, oil
demand is projected to grow at 3.7 % annually, somewhat more slowly than income growth.
Over a 15-year period, these annual growth rates would yield levels of oil demand that are
approximately 1.7 times higher in Other LDC and in OPEC & Mexico, 2.3 times higher in China, and 2.7
times higher in Other Asia. For all 37 countries, oil demand in year 2010 will be 2.1 times its level in 1993.
These oil demand increases are consistent with historical experience since 1971, given the assumptions
underlying our projections: flat oil prices, and continuing income growth.
In Figure 40 we plot oil demand vs. real income for each of the country groupings, both historical
levels 1971-93 (the circular marker indicates 1993) and projections to the year 2010. Figure 41 contains
analogous data in per-capita terms: per-capita oil demand vs. per-capita real income. China has the highest
income growth rate (rightward movement), but its oil demand does not increase as rapidly as income: its
projected growth is less steep than the diagonal lines that indicate equi-proportional growth. Other Asia has
the second highest income growth rate, and oil demand grows slightly faster than income: slightly steeper
projected growth than the equi-proportional growth lines. The other two regions, Other LDC and OPEC &
Mexico, have more modest income growth; their oil demand increases roughly in proportion to income.
Although such growth rates in per-capita oil demand may appear high, they should be put in context.
Even if China's oil demand increases to 0.27 ton/person by year 2010, that will be still be less than the 1971
level of South Korea's per-capita oil demand, and less than one-sixth of South Korea's per-capita demand in
1993.
If, instead of assuming a constant real oil price, we had assumed that the real price would increase
gradually, at an annual rate of 4.73 % starting in 1996 so that by 2010 it would be double its 1995 level, the
demand projections would be reduced only slightly. The average annual growth in oil demand to the year 2010
for these 37 countries would be reduced from 5.1 % to 4.8%. Note that such a price doubling would only
increase price back to its 1974 level; it would be only 61 % of its 1981 peak, and 80% of its level in 1985
before the 1986 price collapse. Note also that our estimated price elasticities of demand are relatively low.
However there are a great many uncertainties that may result in different demand patterns unfolding,
e.g., technology changes, urbanization, the degree of industrialization, penetration of alternative fuels notably
natural gas, macroeconomic and financial performance, prices, and government policies with respect to
subsidies, taxation, traditional fuel use and other issues. At some point there will be a slowdown in energy
77

demand growth, as already being witnessed in South Korea according to more recent data. Developments in
China could also have a profound impact on the way oil consumption patterns evolve in that country, including
government policies. Thus the above projections only reflect our econometric analysis and other assumptions
to provide indicative projections of our results.
Figure 40. Total Oil Consumption vs. Real Income: History 1971-93 and Projections to 2010 --
China, Other Asia, Other LDC, OPEC & Mexico
1000 / 0 /f low-
00 00
[0~ -200.q2tf / -20 Other
cl, -p:>w ggv S I E - Asia
° / China / °60//
10 0
I 00 SO 100 sooo 100I10 IN Iwo INN
total income (billions 1987 Sl total income (billions 1987 S)
0^ 4i/ ,7' 1=;- 2/ ttt04
°, / °7:f X E g~~~~~~OPECJ
0 ~~~~~~~~~~~~~~~~0
0 ~ ~ ~ 0
0o a10
total income (billions 1987 $) total income (billions 1987 $)
78

per-capita oil (tons) per-capita oil (tons) Z
I (~~~~~~D
0 0~~~~~~~~~~~~0'
4 -4~~~~~~~~~~~~~~~
w m~~~~~~ 0 m~~~~~~~~~~~I-
-4 ~ ~ ~ ~ ~ ~ ~ ~ ~ ~ ~ ~ ~ ~ ~ ~ ~ ~ ~ .~~~~~~~~~~~~-

8. Conclusions
This paper examined the changes in oil product demand in the 37 largest oil-consuming developing
countries over the 1971-93 period, focusing on the eight major petroleum products. Following is a summary.
Heterogeneity. There are large differences in oil (and energy) consumption between different regions
of the world -- both in absolute levels and in changes over the 1971-93 period. In addition to wide differences
between the developing countries and the industrialized countries, the 37 developing countries are themselves
extremely heterogeneous in many dimensions: geographic, social, economic, and stage of development. In
contrast to the relative homogeneity among the industrialized countries, these 37 developing countries differ
dramatically with respect to the following:
oil's share of energy consumption varies widely -- from less than 20% in China and South
Africa to more than 90% in Singapore, Jamaica, and Jordan;
* oil's share of energy has declined substantially in many of these countries since 1971 (as it
has in many OECD countries), but in some countries oil's share has not changed much over
time, while in others it has actually increased, e.g., some oil-exporting countries;
* oil's share of electricity generation is relatively high in many of the countries; however it also
varies as widely as possible: from zero in South Africa to 100% in Singapore;
* over the 1971-93 period, per-capita income growth has been rapid and consistent in some
countries, highly variable in others, and consistently negative in a few; similar patterns have
occurred in per-capita energy and oil consumption in many, but not all, of these countries;
X there are large differences across countries in the composition of total oil products consumed,
especially in the shares of heavy fuel oil, naphtha, and kerosene; the share of transportation
oil products (gasoline, diesel, jet fuel) ranges widely: from one-fourth in Singapore, to one-
half in China, two-thirds in Brazil, three-fourths in Algeria, and four-fifths in South Africa.
Despite the growth of per-capita oil demand in the developing countries and its reduction in the
OECD, the level in the developing countries is still only one-tenth as great (on average) as in the OECD.
Thus there remains enormous potential for large demand growth in these countries, depending on the structure
and pace of economic development and government policies.
Important Phenomena. Since 1971, OECD oil consumption has been affected more by oil price
changes than by income changes, and more by oil price increases than by price cuts. In the 37 developing
countries, there has been much greater oil demand response to income growth than to changes in oil prices.
Moreover, there has been greater demand response to the oil price cuts of the 1980s in several developing
80

countries, in contrast to the OECD where there has been relatively little demand response to the price cuts.
For many oil-exporting countries, oil consumption has responded asymmetrically to changes in income:
increasing rapidly when income was growing, and continuing to increase--albeit more slowly--even when
income is declining.
Although the growth of energy and oil demand is primarily influenced by income growth, there has
been substantial fuel-switching away from oil in response to the oil price increases of the 1970s, as well as
some increase in fuel efficiency. The fuel-switching is most obvious in electric power generation, where many
countries have shifted to alternative fuels: natural gas, coal, hydro, and even to nuclear power.
A country's endowment of domestic indigenous energy resources is important in understanding
different countries' demands for energy and petroleum products. This is most obvious for the oil exporting
countries, which have large reserves of oil and natural gas. Some countries have an abundance of other energy
resources, e.g., coal in China, India, and South Africa; and hydro resources in South America. Having these
resources can greatly affect government policies.
The transition from traditional, biomass fuels to modern fuels enhances the growth of demand for oil
products, especially in the household sector. This transition has been virtually completed in South Korea
within the past two decades but the transition has a long way to go in many other countries. When the
transition to modern fuels is completed, growth of these fuels will be driven by income growth only and not
also by substitution for traditional fuels.
Government policies with respect to pricing, access to markets, and imports can greatly influence
consumption patterns of all fuels including biomass. As many couritries are in various stages of transition with
respect to urbanization, industrialization, and rising incomes, government policies can hasten or slow the transition
to modern fuel use.
Econometric Analysis. For each of the products and each of the countries, we examined several
alternative equation specifications of per-capita oil product demand as a function of per-capita real income and
the real price of crude oil. Overall, the results were fairly good for gasoline, diesel, LPG, and "other oil"
products. Results were mixed for jet fuel and heavy fuel oil, and quite unsatisfactory for naphtha and
kerosene. Income was the most important explanatory variable, and the oil-exporting countries often displayed
an asymmetric response to income increases and decreases. In only about a third of the cases was the price
of crude oil significant, and the estimated elasticities were small relative to the income elasticity. The evidence
on whether demand responded symmetrically to oil price increases and decreases was mixed, at best: some
products in some countries appeared to respond symmetrically, and others asymmetrically.
81

Sample Projections. The econometric results and analysis suggest the future to be like the past. With
continued growth in real income in the developing countries, oil demand should grow about as fast as income.
This implies a doubling of their oil demand by year 2010, relative to their 1993 levels. The largest growth
will continue to be in Asia.
Transportation oil demand (on average about half of the barrel consumed) ought to grow at least as
fast as income, in virtually all developing countries. Demands for heavy fuel oil and naphtha are less easily
predicted, and are more dependent on government policies regarding electric power generation and expansion
of the petrochemical industry, respectively. Demand for LPG and kerosene is influenced by government
policies regarding subsidies, taxes, and market access for all household fuels. Kerosene is an inferior good,
thus its use could decline in favor of more attractive household fuels, as incomes rise and it becomes available
or affordable, or both. Demand for both of these products could grow as rapidly as income, even faster in
the case of LPG, especially in those countries where the transition to commercial fuels is an important
phenomenon. "Other" oil products could also grow as fast as income.
However there are a great many uncertainties that may result in different oil demand patterns
unfolding, e.g., technology changes, the degree of industrialization, urbanization, penetration of alternative
fuels notably natural gas, macroeconomic and financial performance, and government policies with respect
to subsidies, taxation, traditional fuel use and other issues. At some point there will be a slowdown in energy
demand growth, as is already being witnessed in South Korea.
Implications for the World Oil Market. Rapidly rising oil demand in the developing countries has
significant irnplications for the petroleum industry, governments and the world oil market. Obviously, greater
product demand will require greater refining capacity. Should the demand barrel become lighter, as is
generally expected, it means that greater upgrading capacity will be required to supply transport fuels and other
light products. However, much will depend on trends in heavy fuel oil consumption, especially in power
generation.
The increasing concentration of oil demand in the developing countries, and Asia in particular, could
alter crude oil trade flows. More crude (and possibly products) will be required from the Middle East to
supply these growing markets, and will partly depend on demand trends in developed countries and in non-
OPEC crude oil supplies.
Greater dependence on Middle East oil due to growing demand does not necessarily imply higher oil
prices. Much will depend on trends in non-OPEC supplies, OPEC's share of the world oil market, and the
pricing policies of key oil exporting countries.
Finally, rising oil demand has obvious benefits and costs to those countries where demand is rising
rapidly. Higher oil (and energy) demand is associated with higher incomes and rising standards of living.
82

However, it can also mean greater emissions, pollution and congestion from higher oil use. Government
policies can greatly influence these trends through pricing and other initiatives. The growing trend of
deregulation, liberalization and privatization will have both positive and negative affects on the levels of oil
demand.
Suggestions for Further Work. The most important limitation of our work was the necessity to use
world crude oil prices rather than product prices paid by consumers. This was necessary given that domestic
oil product prices (extending back at least to the first oil price shock in 1973) were available for only a handful
of countries. Although some econometric work was conducted for those countries and products where such
prices were available, the results were not substantially different from using world crude oil prices.
The demand for oil products used in the residential sector (LPG and kerosene) could be better modeled
with a more sophisticated framework that allowed for choice among alternative fuels, including biomass.
Similarly, the demand for heavy oil--especially for electricity generation--ought to be modeled within a fuel-
choice model, explicitly modeling the fuel substitution process between coal, natural gas, oil, and any other
competing fuels.
Additional work might also be done along sectoral lines, to the extent that the quality of the data will
support such work. In particular, it would be important to understand better the growth of demand for
transportation fuels, the industrial use of energy, and energy use in the residential and commercial sectors.
Obviously one can only fully understand consumer behavior by performing detailed analysis on how
consumers use energy and make economic decisions, i.e., how they transport themselves to work, how they
heat their homes, cook their food, etc. While such work yields obvious important insights, there are often data
limitations, and of course problems still remain on how to transform the results into meaningful projections.
Finally, the policy framework in individual countries needs to be addressed with respect to pricing,
market access, supply constraints, and the broader objectives of macroeconomic growth, industrial structure,
urbanization, infrastructure development, liberalization and privatization.
83

Appendix A: Supplementary Tables
84

Table Al. Per-Capita Oil, Energy and Income:Absolute Change 1971-93, and Average Annual Growth
Oil (tons /person) Enerzv (tc s/verson) Income (17$/person)
Change % Chanpe % Change %
ALG: Algeria 0.17 3.6% 0.75 6.2% $576 1.2%
ARG: Argentina -0.31 -1.8% 0.05 0.2% $141 0.2%
BAN: Bangladesh 0.01 2.3% 0.03 1.3% $42 1.1%
BRA: Brazil 0.16 2.1% 0.25 1.3% $665 2.0%
CHI: Chile 0.02 0.1 % 0.26 1.2% $803 2.0%
CHN: China 0.07 4.4% 0.35 3.4% $267 6.3%
COL: Colombia 0.06 0.9% 0.17 1.2% $451 2.0%
ECU: Ecuador 0.23 3.6% 0.23 2.2% $523 2.6%
EGY: Egypt 0.18 3.4% 0.4 4.8% $390 3.7%
HON: Hong Kong 0.29 1.3% 1.48 4.7% $7,739 5.9%
IND: India 0.03 3.0% 0.12 2.3% $146 2.2%
INS: Indonesia 0.14 5.5% 0.31 3.7% $365 4.4%
IRA: Iran 0.5 4.0% 0.67 2.9% ($719) -1.0%
IRQ: Iraq 0.63 4.6% 0.63 4.0% ($3,826) -7.6%
ISR: Israel 0.06 0.2% 0.62 1.2% $3,576 2.1%
JAM: Jamaica 0.05 0.2% 0.16 0.6% ($113) -0.3 %
JOR: Jordan 0.54 4.6% 0.61 4.8% $391 1.2%
KEN: Kenya -0.02 -1.2% -0.02 -0.2% $79 1.1 %
KUW: Kuwait 1.44 2.4% -0.9 -0.6% ($28,551) -6.7%
LIB: Libya 1.16 7.4% 1.9 5.7% ($9,299) -3.7%
MAY: Malaysia 0.46 3.6% 1.23 5.4% $1,727 4.6%
MEX: Mexico 0.45 3.2% 0.62 2.9% $452 1.3%
MOR: Morocco 0.12 3.2% 0.15 3.0% $264 1.7%
NIG: Nigeria 0.08 6.2% 0.15 2.1% ($18) -0.2%
PAK: Pakistan 0.06 3.8% 0.2 5.1% $170 2.8%
PER: Peru -0.09 -1.4% -0.16 -1.2% ($235) -1.0%
PHI: Philippines 0.02 0.5% 0.04 0.5% $102 0.8%
SAF: South Africa -0.04 -0.5% 0.16 0.3% ($352) -0.7%
SAR: Saudi Arabia 2.21 7.4% 3.73 7.1% ($1,611) -1. 1 %
SIN: Singapore 4.19 7.4% 5.42 7.5% $8,920 6.4%
SKO: South Korea 1.43 8.1% 2.18 7.0% $3,801 7.2%
SYR: Syria 0.43 3.7% 0.61 4.2% $451 2.4%
TAI: Taiwan 0.94 5.3% 2.05 6.4% $5,403 6.6%
THA: Thailand 0.27 4.7% 0.64 4.8% $1 057 5.3%
TUN: Tunisia 0.18 2.6% 0.32 3.0% $625 2.7%
UAE 3.05 7.4% 8.48 5.2% ($17,424) -3.1%
VEN: Venezuela 0.12 0.7% 0.18 0.4% ($455) -0.7%
85

Table A2. Average Annual Growth Rate of Oil Consumption, 1971-93
Total Oil Diesel Gaso- Jet LPG Kerosene Naph- Other Oil HFO________________ ________ ~line Fuel _ _ __ _ _ _ __ tha_ _ _ _ _ _ _ _ _
China: CHN 6.0% 6.3% 8.9% -0.4% 3.2% 5.2%
Mexico: MEX 5.8% 4.7% 5.6% 7.5% 7.7% -1.7% 6.2% 5.2% 6.6%
South Korea: SKO 9.6% 10.9% 9.4% 7.2% 23.3% 12.4% 16.6% 13.5% 6.6%
Brazil: BRA 4.3% 6.2% 3.7% 4.4% 6.5% -4.6% 19.3% 6.3% 0.6%
India: IND 5.2% 7.5% 4.1% 3.4% 13.1% 4.0% 5.1% 3.1% 3.2%
Iran: IRA 7.8% 8.8% 7.0% 6.7% 6.7% 7.7% 8.4% 7.6%
Saudi Arabia: SAR 12.6% 14.7% 13.5% 12.1% 12.6% 2.6% 14.3% 6.9%
Indonesia: INS 7.5% 8.6% 7.0% 10.8% 26.2% 5.0% 5.6% 8.2%
Taiwan: TAI 6.9% 9.2% 11.3% 4.2% 9.9% 1.9% 8.7% 4.5%
Thailand: THA 6.9% 7.1% 6.3% 8.2% 15.7% -2.4% 3.5% 6.8%
Argentina: ARG -0.3% 1.1 % 1.2% 3.0% 0.7% -3.4% 6.1% 1.2% -4.2%
Egypt: EGY 5.5% 6.3% 5.6% 7.0% 11.4% 2.4% 7.2% 5.1%
Iraq: IRQ 8.0% 10.9% 8.9% 7.7% 16.4% 1.4% 9.7% 10.9% 6.3%
Venezuela: VEN 3.7% 4.9% 4.1% -0.9% 12.0% -1.6% 3.9% -0.4%
Malaysia: MAY 6.2% 5.5% 7.8% 8.7% 13.9% 3.2% 13.9% 3.9%
Singapore: SIN 8.8% 4.6% 3.9% 11.0% 23.5% -4.3% 9.2% 8.8%
Philippines: PHI 2.9% 5.8% -0.4% 4.4% 7.2% 1.6% 5.3% 1.7%
South Africa: SAF 2.1% 2.1% 2.9% 4.6% 4.3% 0.4% 0.0% 1.1% -1.3%
Pakistan: PAK 6.7% 7.5% 7.7% 2.3% 17.3% 1.9% 4.7% 8.1%
Colombia: COL 3.1% 4.1% 4.6% 3.8% 3.3% -1.9% 8.6% -6.9%
Nigeria: NIG 9.3% 9.0% 11.0% 7.5% 6.7% 10.1% 8.1% 5.0%
Syria: SYR 7.3% 7.7% 8.0% 4.9% 12.2% -0.2% 2.0% 8.9%
Israel: ISR 2.6% 3.1% 4.8% -0.6% 3.2% 9.3% 1.7% 1.9%
Algeria: ALG 6.7% 6.9% 7.8% 5.7% 10.5% -8.8% 5.9% -4.6%
Libya: LIB 11.9% 24.2% 8.6% 4.7% 6.9% 5.0% 14.4% 12.1 %
Chile: CHI 1.8% 5.2% 1.0% 4.5% 3.4% -2.0% 0.7% 4.9% -0.6%
UAE 17.2% 15.6% 13.3% 11.3% 7.2% 37.7%
Hong Kong 3.0% 6.5% 4.0% 7.9% 4.9% -4.9% 14.0% 3.5% -5.5%
Morocco: MOR 5.6% 6.8% 0.9% 3.2% 9.4% -2.3% 3.7% 6.3%
Kuwait: KUW 6.2% 9.0% 6.0% 5.0% -0.6% 0.3% 6.7%
Peru: PER 0.9% 3.6% -0.3% -0.2% 5.6% 1.6% -1.0% -0.6%
Ecuador: ECU 6.3% 7.3% 5.4% 3.7% 20.8% 0.4% 8.8% 5.7%
Tunisia: TUN 5.0% 6.1% 5.2% 2.5% 12.8% 3.8% -2.3% 4.6%
Jordan: JOR 9.2% 9.1% 7.5% 7.8% 11.3% 3.7% 6.0% 13.2%
Jamaica: JAM 1.4% 1.4% -0.8% 0.6% 3.5% 3.1% . -0.9% 2.0%
Bangladesh: BAN 4.8% 9.3% 5.6% 6.6% . 1.6% -1.1% 8.7% 0.9%
Kenya: KEN 2.2% 3.6% 2.4% 3.4% 5.5% 4.6% 5.3% -1.3%
86

References
Barnes, Douglas F., and Liu Qian, "Urban Interfuel Substitution, Energy use, and Equity in DevelopingCountries: Some Preliminary Results", World Bank, Energy Series Paper No. 53, 1992.
Barnes, Douglas F., "Understanding Fuel Wood Prices in Developing Nations",World Bank Energy Series Paper No. 56, 1992.
Barnes, Douglas F., Jeffrey Dowd, Liu Qian, Kerry Krutilla, William Hyde,"Urban Energy Transitions, Poverty, and the Environment: Understanding the Role of the UrbanHousehold Energy in Developing Countries", World Bank, 1994.
Bhatia, Ramesh, "Energy Demand Analysis in Developing Countries: A Review"Energy Journal, 1987, vol. 8, Special Issue on LDC, pp. 1-33.
Dahl, Carol, "Survey of Energy Demand Elasticities in Developing Countries",in EMF 1991, pp. 231-81.
"Survey of Oil Demand Elasticities for Developing Countries",OPEC Review, Winter 1993, pp. 399-419.
-----, "Survey of Oil Product Demand Elasticities for Developing Countries",OPEC Review, Spring 1994, pp. 47-86.
Dargay, Joyce, and Dermot Gately, "Oil Demand in the Industrialized Countries",Energy Journal, Vol. 15, Special Issue, 1994, pp. 39-67.
----, "The Imperfect Price-Reversibility of Non-Transportation Oil Demand in the OECD",Energy Economics, 1995, Vol. 17, No. 1, pp. 59-71.
-----, -The Response of World Energy and Oil Demand to Income Growth and Changes in Oil Prices",Annual Review of Energy and the Environment, Vol. 20, 1995, pp. 145-178.
"The Demand for Transportation Fuels: Imperfect Price-Reversibility?",Transportation Research, forthcoming 1996.
Energy Modeling Forum, "International Oil Supplies and Demands: Summary Report",Stanford University, Energy Modeling Forum (EMF), 1991.
Gately, Dermot, "A Ten-Year Retrospective on OPEC and the World Oil Market",Journal of Economic Literature, Sept. 1984, pp. 1100-14.
----- -"Lessons from the 1986 Oil Price Collapse",Brookings Papers on Economic Activity, 2:1986, pp. 237-284.
-----, "Taking Off: The US Demand for Air Travel and Jet Fuel", Energy Journal, 1988-----, -The US Demand for Highway Travel and Motor Fuel", Energy Journal, 1990
---, "Imperfect Price-Reversibility of U.S. Gasoline Demand:Asymmetric Responses to Price Increases and Declines",Energy Journal, Vol. 13, No. 4, 1992, pp. 179-207.
-----, -Oil Demand in the US and Japan: Why the demand reductions caused by the price increasesof the 1970s won't be reversed by the price declines of the 1980s",Japan and the World Economy, 1993, Vol. 5, No. 4.
"The Imperfect Price-Reversibility of World Oil Demand", Energy Journal, Vol. 14, No. 4, 1993.-----, -Strategies for OPEC's Pricing Decisions -- Revisited,"
Energy Journal, 1995, Vol. 16, No. 3, pp. 1-38.Griffin, James M., Energy Consumption in the OECD: 1980-2000,
Ballinger Publishing Co., Cambridge MA, 1979.Hawdon, David, editor, Energy Demand: Evidence and Expectations,Surrey University, 1992Hogan, William W., "Dimensions of Energy Demand", in Hans Landsberg, editor,
Selected Studies on Energy: Background Papers for "Energy: The Next Twenty Years ",Ballinger, Cambridge, Mass., 1980, pp. 1-92.
-----, "Patterns of Energy Use", in John C. Sawhill and Richard Cotton, eds.,Energy Conservation, The Brookings Institution, Washington, DC, 1986.
-----, "A Dynamic Putty/Semi-Putty Model of Aggregate Energy Demand",Energy Economics, Vol. 11, No. 1, 1989, pp. 53-69.
87

, "OECD Oil Demand Dynamics: Trends and Asymmetries",The Energy Journal, Vol. 14, No. 1, 1993, pp. 125-157.
Ibrahim, Ibrahim B., and Christopher Hurst,"Estimating Energy and Oil Demand Functions: A Study of Thirteen Developing Countries"Energy Econonics, April 1990, pp. 93-102.
Institute of Energy and Environmental Studies,"Patterns and Trends of Energy Use in An Indian Metropolis",A World Bank Sponsored Research Study, Hyderabad, India, 1994.
International Energy Agency, Energy Statistics and Balances of Non-OECD Countries 1992-93,OECD, Paris, 1995.
-----, World Energy Outlook, 1996.Ishiguro, Masayasu, and Takamasa Akiyama,
"Energy Demand in Five Major Asian Countries: Structure and Prospects",World Bank, 1995.
Johnston, John, Econometric Methods, 3rd edition, McGraw Hill, New York, 1984.Krapels, Edward N.,
"Implementing Efficient Petroleum Product Pricing Programs in Developing Countries",Energy Journal, 1987, vol. 8, 1, pp. 39-52.
Malhotra, Anil K., P.Sinsukprasert, P. Eglington, Asia Energy Profile: Energy Sector Performance,World Bank, November 1994.
Malhotra, Anil K., Olivier Keonig, P.Sinsukprasert, A Survey of Asia's Energy Prices,Technical Paper Number 248, World Bank, 1994.
Pesaran, M. H., "Energy Demand in Asian Developing Economies:Structure, Trends, Impacts, Prospects, and Strategies", World Bank, March 1994.
Pindyck, Robert, The Structure of World Energy Denand, MIT Press, Cambridge, Mass., 1979.Sathaye, Jayant, Andre Ghirardi, and Lee Schipper,
"Energy Demand in Developing Countries: A Sectoral Analysis of Recent Trends",Annual Review of Energy, 1987, vol. 12, pp. 253-81.
Schipper, Lee and Stephen Myers, Energy Efficiency and Human Activity: Past Trends, Future Prospects,Cambridge University Press, 1992.
Streifel, Shane, "Review and Outlook for the World Oil Market", World Bank, 1995.World Bank, Argentina Energy Sector Study, 1990.-----, Bolivia: Household Rural Energy Strategy, Report 162/94, 1994.
----, China: Energy for Rural Development in China, Report No. 183/96, 1996.-----, Ecuador: Energy Pricing, Poverty and Social Mitigation, Report No. 12831 -EC, 1994.-----, Ecuador: Energy Pricing, Subsidies and Interfuel Substitution, Report No. I 1798-EC, 1994.-----, India Transport Sector, Report 13192-IN, 1995.-----, Indonesia: Urban Household Energy Strategy Study, Report No. 107A/90, 1990.-----, Jam aica: Energy Sector Strategy and Investment Planning Study, Report No. 135A/92, 1992.-----, Morocco: Energy Sector Institutional Development Study, Report No. 173/95, 1995.-----, Peru. Study of Energy Taxation and Liberalization of the Hydrocarbons Sector,
Report No. 159/93, 1993.-----, Philippines: Defining an Energy Strategy for the Household Sector, 1992.-----, Rural Energy and Development: Improving Energy Supplies for Two Billion People, 1996.-----, Thailand Fuel Option Study, Report No. 11948-TH, 1993.
88


COLOMBIA HONG KONG., MACAO JAMAICA NIGERIA RUSSIAN FEDERATION ADECO Van Diermen EdihorrsL istributors of Intoenlace Ltda. Asia 2000 Ltd. Ian Randl Pubishers Ltd. University Press Limited Isdatelstvo <Ves Mir> Techniques
W orld Bank Carrera 6 No. 51-21 Sales & Circulation Department 206 Old Hope Road Three Crowns Building Jericho 9a, Lolpachnry Pereulok Ch. de Lacuez 41Apartado Aareoo34270 Seabird House, unsi 1101-02 Kingston 6 PIrvate Mail Bag 5095 Moscow 101831 CH1807 Blonay
Publications Santate de Bogota, D.C. 22-28 Wyndham Street Central Tel: 809-927-2085 lbadan Tel: (7095)9178749 Tel: (41 21) 943 2673Prices and credit terms vary Tel: (57 1) 285-2798 Hong Kong Fax: 809-977-0243 Tel: (234 22) 41-1356 Fax: (7 095) 917 92 59 Fax: (41 21) 943 3605from country to country. Faa: (57 1)285-2798 Tel: (852)2530-1409 E-mail: [email protected] Fax: (234 22)41-2056 SINGAPORE TAIWAN TANZANIA
Faa: (852) 2526-1107SIGPR,TrA ANNAConoult your local distributor CYPRUS E-mail: salesOasia2000.com.hk JAPAN NORWAY MYANMAR, BRUNEI Oxford Universry Pressbefore placing an order. Center for Applied Research URL: htt/www.asia2000.com.hk Eastern Book Service NIC Into ABS Asahgate Publishing Asia Maktaba Street
Cyprus College 3-13 Hongo 3-chome, Bunkyo-ku Book Department Pacific Pte. Ltd. PO BoxS 52996, Diogenes Street, Engomi INDIA Tokyo 113 PO. Box 6125 Eterstad 41 Kallang Pudding Road 404-03 DaresSalaam
ARGENTINA PO. Box 2006 Allied Publishers Ltd. Tel: (81 3) 3818-0961 N-0602 Oslo 6 Golden Wheel Building Tel: (255 51) 29209Oticina del Lbro Internacional Nicosia 751 Mount Road Fax: (81 3 3818-0864 Tel: (47 22) 57-3300 Singapore 349316 Fax: (255 51) 46822Av. Cordoba 1877 Tel: (3572) 441730 Madras -600 002 E-maii: s1t-ebs§ppp.bekkoame.or.p Fax: (47 22) 66-1901 Tel: (65) 741-51661120 Suenos Aires Fax: (3572) 46-2051 Tel: (91 44)852-3938 URL: htopi/rwwwbekkoame.or.p/-svn-ebs Fax: (65) 742-9356 THAILANDTel: (54 1)815-8354 Fax: (91 44) 852-0649 PAKISTAN E-mail: asagarte0asianconnect.com Central Books DistibutionFax: (54 1)610-8156 CZECH REPUBLiC KENYA Mirza Book Agency 306 Silom Road
National Inlormation Center INDONESIA Africa Book Sevoce (E.A.) Ltd. 65, Shahrah-e-Quaid-e-Azam SLOVENIA Bangkok 10500AUSTRALUA, FIJI, PAPUA NEW GUINEA, prodejna, Konviktska S Pt. Indira Limited Quaran House, Mlangano Street Lahore 54000 Gospodarski Vestnik Publishing Group Tel: (66 2) 235-5400SOLOMON ISLANDS, VANUATU, AND CS - 113 57 Prague I Jalan Borobudur 20 PQ. Box 45245 Tel: (92 42) 735 3601 Dunajska cesta 5 Fax: (66 2) 237-8321WESTERN SAMOA Tel: (42 2) 2422-9433 PO. Box 181 Nairobi Fax: (92 42) 758 5283 1000 LjubljanaDOA. Information Services Fax: (422)2422-1484 Jakarta 10320 Tel: (2542)223641 Tel: (386 61) 1338347;1321230 TRINIDAD&TOBAGO,648 Whitenorse Road URL: hntp://wwwnis.cz/ Tal: (62 21)390-4290 Fax: (2542)330272 Qxtord Universry Press Fax: (386 61)133 8030 AND THE CARRIBBEANMitcham 3132 Fax: (62 21) 421-4289 5 Bangalore Town E-mail: belicdcgvestniksi Systematics Studies UnitVictoria DENMARK KOREA, REPUBLIC OF Sharae Faisal 9 Wans StreerTel: (61) 3 9210 7777 SamfundsLitteratur IRAN Daeton Trading Co. Ltd. PO Box 13033 SOUTH AFRICA, BOTSWANA CurepeFax: (61)392107788 Posenoerns AlA 11 Ketab Sara Co. Publishers PO. Box 34, Youida Karachi-75350 Forsingle ntlesr Trinidad, Wesa IndiesE-mail: seoviceidadinect.com.au DK-1970 Frederiksberg C Khaled Eslamboli Ave., 706 Seoun Bldg Tel: (9221)446307 Otord UnNersity Press Tel: (809) 662-5654URL: http://www.dadirecLcom.au Tel: (45 31) 351942 6th Street 44-6 Youido-Dong. Yeongchengpo-Ku Fax: (92 21) 4547640 Southern Africa Fax: (809) 662-5654
Fax: (45 31) 357822 Kusheh Delafrooz No. U Seoul E-mail: oupo0up.klhi.um.com.pur0. Boa 1141 E-mail: tobeltrinidad.netAUSTRIA PQ. Box 15745-733 Te: (822)78St63tl4 Cape Town 8000Gerold and Co. EGYPT, ARAB REPUBUC OF Tehran Fax (822) 7840315 Pak Book Corporation Tel: (2721)40-7266 UGANDAWeihburggasse 26 A Ahram Distribution Agency Tea: (98 21) 8717819: 8716104 Aziz Chambers 21 Fax: (27 21) 4-7265 Gustro Ltd.A-tO11 Wien A Galaa Street Fax: (9821)8712479 MALAYSIA Queens Road PQBox 9997Tel: (431)512-47-31-0 Cairo E-mail: ketab-saraaneda.net.ir University ol Malaya Cooperahve Lahore Forsubscripbon orders: Madhvani BuildingFax: (43 1) 512-47-31-29 Tel (20 2) 570-6083 Bookshop, Limited Tel: (92 42) 636 3222; 636 0885 Internabonal Subscription Service Plot 1614 Jinja Rd.URL: htpi)/awww.gerold.co/atonline Fax: (202)578-6833 Kowkab Pablishers P0. Boo 1127 Fax: (9242)6362329 P.. Box 41395 Kampala
PO. Box 19570-511 Jalan Pantai Saru E-maii [email protected] Craighal! Tel: (25641)254763BANGLADESH The Middle East Obsenver Tehran 59700 Kuala Lumpur Johannesburg 2024 Fax: (256 41) 251 468Micro Industries Development 41. Sherd Street Tel: (98 21)258-3723 Tel: (603)756-5000 PERU Tel: (27 1t) 880-1448
Assistance Society (MIDAS) Cairo Fas. (98 21) 258-3723 Fax: 60 3) 755-4424 Editorial Desarrollo SA oax: (27 11) 880-6248 UNITED KINGDOMHouse 5, Road 16 Tel: (202) 393-9732 Aparado 3824 E-mail isstis.co.za Microinto Ltd.Dhanmondi RWArea Fax: (20 2) 393-9732 IRELAND MEXICO L ma 1 PO Box 3Dnaka 1209 Governmreni Supples Agency INFOTEC Tel: 51 14) 285380 SPAtN Aton, Hampshire GU34 2PGTol: (a80 2) 326427 FINLAND OCiig an tSolathair Av. San Fernando No. 37 Fax: (51 14) 2e6626 Mund,,Prensa Lbros S A EnglandFax (8802)811188 Akateeminen Kirjakauppa 4-5 Harcour Road Col. Toriello Guerra '.astello37 e j44 1420) 86848
PC Sox .28 Jludon 2 14050 Mexico, D.F PHIUPPINES 28001 Madrid Fax: (44 1420) 89889BELGIUM FlN-00101 Hedsinh Tel l353)1(66-3111 Tel j525)624-2800 nternalional BooksourceCeorer nc. Tol: 3481)431-3399 E-mail: [email protected] De Lannoy Tel (35800)12141 Fax: (3531)475-2670 Fax: (525)624-2822 1127-A Antipolo St. Fax (34 1)570-3998 JRL: htp://wwwrmicroinfocouk
Av. d Roi 202 Fax: (3580) 121-4441 E-mail: [email protected] Barangay Venezuela E-mail: [email protected] Brussets URL: hnpi)booknetcultneu.daka) ISRAEL URL: hnp:J/rOn.netmx Makati Cy URL: hnpJtwwwmundipr:ensa.e VENEZUELATel: (32 2) 538-5169 Yozmot Literature Ltd. Tel: (63 2) 896 6501; 6505: 6507 Teoni-Ciencia Libros, S.A.Fax: (32 2) 538-0841 FRANCE PO. Box 56055 NEPAL Fax: (63 2) 896 174t Mundi-Prensa Barcelona Centro Cuidad Comercial Tamanco
World Bank Publications 3 Yohanan Hasandlar Street Everest Media Internahonal Consetl de Cent 391 N ve< C2BRA7tL 66. avenue dolena Tel Aviv 61560 Services (P) Ltd POLAND 08009 Barcelona CaracasPublicacdoesTecnicas Internacionais 75116 Paris Tea: (972 3) 5285-397 GPS Box 5443 International Publishing Servce Tei: (343)466-3492 Tel: (562)9595547:5035; 0016
Ltda. Tel: (33 1)40-69-30-56157 Fax: (972 3) 5285-397 Kathmandu Ul Piekna 3107 Fax: (34 3)487-7659 Fax: (582) 959 5636Rua Peixoto Gomide. 209 Fax: (33 1)40-69-30-68 Tel: (977 1)472 152 00-677 Warzawa01409 Sao Paulo, SP R OY International Fax: (977 1)224431 Tel: (482) 628-6089 SRI LANKA, THE MALDIVES ZAMBIATel: (55 11) 259-6644 GERMANY PO Box 13056 Fax: (48 2) 621-7255 Lake House Bookshop Unlversrty BookshopFax: (S 11) 258-6990 UNO-Verlag Tel Aviv 61130 NETHERLANDS E-mail: books%[email protected] 100, Sir Chroampalam Gardiner Mawatha Unrversity ofZarbiaE-mail' [email protected] Foppel5dotler AUee 55 Tel: (972 3)5461423 De Lindeboor/lnrr-Publikatles URL: httpJlwwwv.psCg.waw.pVipsleoporh Colomw 2 Great East Road CampusURL: http.www.uol.br 53115 Bonn Fax: (9723)5461442 FQ. Box 202 Tel: (941)32105 P.. Box 32379
Tel: (49228)212940 E-marl: royflOnetvision.netil 7408AE Haaksbergen PORTUGAL Fax: (941)432104 LusakaCANADA Fax: (49228)217492 Tel: (31 53) 574-0004 Lertaria Portugal Tel: (20 1)252 576Renout Publishing Co. Ltd. Palestinian Authorry/Middle East Fax (31 53) 572-9296 Apartado 268t SWEDEN Fax: (260 1) 253 9525369 Canotek Road GREECE Index Intormation Services E-mail: lindeboooworbdonline.nl Rua Do Camio 70-74 Wennergren-Williams ABOtawa, OnLario KtJ 9J3 Papasotiriou S.A. FO.S. 19502 Jerusalem URL: hpJ/ww.worldonline.nl-lindeboo 1200 Lisbon P. . box 1305 ZIMBABWETel: (613)740-2665 35, Stournara Str. Tel: (9722)6271219 Tel: (1)3474982 S-171 25 Solna Longman Zimbabwe (Pte.)Ltd.Fax: (613) 740-7660 10682 Athens Fax: (9722)6271634 NEW ZEALAND Fax: (1)347-0264 Tel: (468)705-97-50 Toure Road, ArdbennieE-mail: renouftfox.rnstn.ca Tel: (30 1) 364-18a6 EBSCO NZ Ltd. Fax (46 8) 27-00-71 PO. Box ST125URL: hnpt/rew.tox.nstn.cau-renout Fax (301) 364-8254 ITALY Prvate Mail Bag 99914 ROMANIA Southenlon
Licosa Commissionaria Sansoni SPA New Market Corrpani De Librarii Bucuresti S.A SWItZRLAND HarareCHINA HAIM Via Duca Di Calabria, 1/1 Aucldand SIr Lpscani no. 26, sector 3 Librairie Payol Tel: (263 4) 8216617Chioa FinarcalI & Economic Cuature Dittusion Caselae Postale 552 Tel: (64 9) 524-8119 Bucharest Service lnstituboonnel Fax: (263 4) 621670Publishing House 5, Rue Capois 50125 Firenze Fax: (64 9)524-8067 Tel: (40 1) 613 9645 Cotes-de-Mortbenon 308, Da Fo Si Donrg Jie C.P 257 Tel: (55)645-415 Fax: (401)312 4000 1002 LausanneBeijing Port-au-Prince Fax: (55) 641-257 Tel: (41 21) 341-3229Tel: (6610)6333E257 Tat: (5091)39260 E-mail: licsahftccit Fao (41 21) 341-3235Fax (86 10) 6401-7365 Url: htItpJ(wwwfx;cc.itbIcosa


Recent World Bank Discussion Papers (continued)
No. 326 The East Asian Miracle and Information Technology: Strategic Managemient of Technological Learning. Nagy Hanna,Sandor Boyson, and Shakuntala Gunaratne
No. 327 Agricultuhral Reform in Russia: A Viewfrom the Farm Level. Karen Brooks, Elmira Krylatykh, Zvi Lerman,Aleksandr Petrikov, and Vasilii Uzun
No. 328 Insutring Sovereign Debt Against Default. David F. Babbel
No. 329 Managing Transbouindary Stocks of Small Pelagic Fish: Problems and Options. Max Aguero and Exequiel Gonzalez
No. 330 China: Issutes and Options in Greenhotuse Gas Emissions Control. Edited by Todd M. Johnson, Junfeng Li,Zhongxiao Jiang, and Robert P. Taylor
No. 331 Case Studies in War-to-Peace Transition: The Demobilization and Reintegration of Ex-Combatants in Ethiopia, Namibia,and Uganda. Nat J. Colletta, Markus Kostner, Ingo Wiederhofer, with the assistance of Emilio Mondo, TaimiSitari, and Tadesse A. Woldu
No. 332 Power Supply in Developing Countries: Will Reform Work? Edited by John E. Besant-Jones
No. 333 Participation in Practice: The Experience of the World Bank and Other Stakeholders. Edited by Jennifer Rietbergen-McCracken
No. 334 Managing Price Risk in the Pakistan Wheat Market. Rashid Faruqee and Jonathan R. Coleman
No. 335 Policy Optionsfor Reform of Chinese State-Owned Enterprises. Edited by Harry G. Broadman
No. 336 Targeted Credit Programs and Rural Poverty in Bangladesh. Shahidur Khandker and Osman H. Chowdhury
No. 337 The Role of Family Planning and Targeted Credit Programs in Demographic Change in Bangladesh. Shahidur R.Khandker and M. Abdul Latif
No. 338 Cost Sharing in the Social Sectors of Suib-Saharan Africa: Impact on tihe Poor. Arvil Van Adams and TeresaHartnett
No. 339 Public and Private Roles in Health: Theory and Financing Patterns. Philip Musgrove
No. 340 Developing the Nonfarm Sector in Bangladesh: Lessonsfrom Other Asian Coutntries. Shahid Yusuf and PraveenKumar
No. 341 Beyond Privatization: The Second Wave of Telecommulnications Reforms in Mexico. Bjorn Wellenius and GregoryStaple
No. 342 Economic Integration and Trade Liberalization in Souithern Africa: Is Tlhere a Rolefor Souith Africa? Merle Holden
No. 343 Financing Private Infrastructutre in Developing Couintries. David Ferreira and Karman Khatami
No. 344 Transport and the Village: Findingsfrom African Village-Level Travel and Transport Suirveys and Related Stldies. IanBarwell
No. 345 On the Road to EU Accession: Financial Sector Developrment in Central Europe. Michael S. Borish, Wei Ding, andMichel Noel
No. 346 Structural Aspects of Manutfacturing in Suib-Saharan Africa: Findingsfrom a Seven Couintry Enterprise Survey.Tyler Biggs and Pradeep Srivastava
No. 347 Health Reform in Africa: Lessonsfrom Sierra Leone. Bruce Siegel, David Peters, and Sheku Kamara
No. 348 Did External Barriers Cauise the Marginalization of Sub-Saharan Africa in World Trade? Azita AmjadiUlrich Reincke, and Alexander J. Yeats
No. 349 Suirveillance of Agricultutral Price and Trade Policy in Latin America during Major Policy Reforms. Alberto Valdes
No. 350 Who Benefitsfrom Putblic Education Spending in Malawi: Resulltsfrom the Recent Edlucation Reform. FlorenciaCastro-Leal
No. 351 From Universal Food Subsidies to a Self-Targeted Program: A Case Study in Tutnisian Reform. Laura Tuck and KathyLindert
No. 352 China's Urban Transport Development Strategy: Proceedings of a Symposiuim in Beijing, November 8-10, 1995.Edited by Stephen Stares and Liu Zhi
No. 353 Telecommutnications Policiesfor Sub-Saharan Africa. Mohammad A. Mustafa, Bruce Laidlaw, and Mark Brand
No. 354 Saving across the World: Putzzles and Policies. Klaus Schmidt-Hebbel and Luis Serven
No. 355 Agricultutre and German Relunification. Ulrich E. Koester and Karen M. Brooks
No. 356 Evalutating Health Projects: Lessonsfrom the Literature. Susan Stout, Alison Evans, Janet Nassim, and Laura Raney,with substantial contributions from Rudolpho Bulatao, Varun Gauri, and Timothy Johnston
No. 357 Innovations and Risk Taking: The Engine of Reform in Local Government in Latin America and the Caribbean.Tim Campbell
No. 358 China's Non-Bank Financial Institlutions:Trust and Investment Companies. Anjali Kumar, Nicholas Lardy, WilliamAlbrecht, Terry Chuppe, Paula Perttunen, Susan Selwyn, and Tao Zhang

(am
THE WORLD BANK
1818 II Sti-.,t. N.X.
\VIshiilolont>l, D).(. 21)433 V'S.\
ITlephlic: 2(12-477-1234
FIcsimilc: 2102-477-6391
I k*. I*MCI 6414\ 6 I4A)I1\Nk
NICI 248423 WORIA)IIANk
(I;,Ihl.\Ldd,-ess: I.NTBAF.\1RAD
\\:\SI IING''()INID)(C
\Vr-kl \\ idc \\.: http:'/ .X .worIdhaiik.org
I -nm.iil: hb ks(, \ \rklhdbnmk .mrg
9 780821 338919
ISBN 0-8213-3891-9