workplace strategies Data driven - OpenSensors
16
opensensors.com Data driven workplace strategies
Transcript of workplace strategies Data driven - OpenSensors

opensensors.com
Data driven workplace strategies

Engineering the future of smart buildings
In today’s session we’ll cover
Yulia Pak
Workplace Strategy Lead
➔ How automated utilisation monitoring can help you
create a future proof workplace that balances real
estate costs and productivity
➔ Techniques on how to translate the data into tangible
solutions
➔ How you can add value to your organisation by using
objective workplace performance data
➔ Highlight the key takeaways
➔ Q&As

Engineering the future of smart buildings
Drivers for change
Business drivers
Technology and
Connectivity
People and Culture
A pressure to innovate & retain talent
Rising real estate costs
40-50% utilised office space
Casualisation of work
Flexible and Collaborative working
Generational changes
Mobility
Digitalisation & Cloud
Smart buildings & iOT
Organisations learn to use data to drive portfolio planning and workplace strategies
opensensors.com
How data supports workplace planning and management
Future proof and support growth
Data driven business cases
Optimise flexibility and control costs
Enable workplace change
Employee wellness and productivity
WORK
TECHNOLOGY
SPACE
PEOPLE
DATA

Engineering the future of smart buildings
What data to gather and analyse
Utilisation distribution and dynamics
Average and peak utilisation
Most and least used assets
Peak and off peak times and day
CO2 levels
Humidity
Temperature
Desk
Private offices
Meeting rooms
Shared spaces
Entrances | Stairs | Elevators
Wo
rksp
ace
Met
ric
Uti
lisat
ion
Dat
a
En
able
r
Utilisation data Environmental data Types of spaces
Static and dynamic
workspace density
Sq ft by person
Sq ft by workpoint
Consistent monitoring
High quality analytics platform
Target Utilisation %
Desk sharing ratio
by department
Assigned vs
Free-address seats
ABW / Alternative setting
Collaboration area by type of
space
Maximum capacity

opensensors.com
Before you start - Tag your data right
List properties | assets | locations
Enables search and aggregation
Formulate questions
Smart tagging Bookable
Departm
ent
Site
Contractor
Assigned
Shared workspace
Country
Location
Area 54
Floor
Desk 1
Neighbourhood
Sales team
Phone boothMeeting room
1

opensensors.com
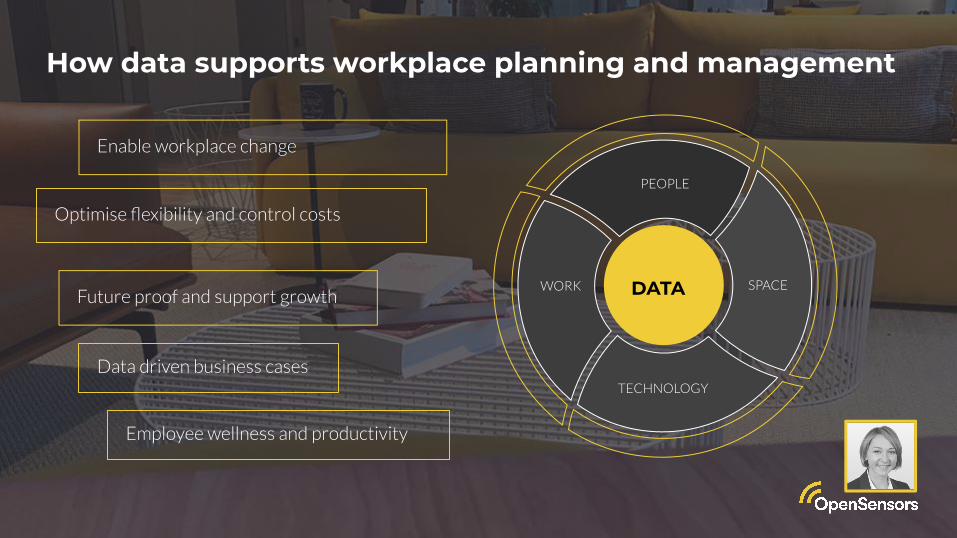
Example 1: Rightsizing meeting roomsThe challenges
Mismatch between room capacity and meeting sizes
Lack of visibility into which rooms need to have which
infrastructure
Common challenges Adverse Impacts
Meeting rooms and other types of collaborative spaces make up to 40% of net leasable area
Average size of the meeting is usually < 60% of meeting room capacity
Up to 30% of space regularly underutilised
Productivity
Collaboration
Occupancy costs

opensensors.com
Example 1: Rightsizing meeting roomsData-driven optimisation solutions
Key steps
1. Quantify meeting space requirements
How many rooms | What capacity
2. Rightsize meeting rooms
Space fit for purpose with YOUR
organisation in mind
3. Continue to monitor space
Performance = balanced cost of office
space with productivity
Source: https://www.linkedin.com/pulse/power-data-corporate-real-estate-strategy-xavier-perrin/
opensensors.com
Address wrong size and number
of meeting rooms
Make sure collaborative space is
productive and fit for purpose
Example 1: Rightsizing meeting roomsData-driven optimisation solutions

opensensors.com
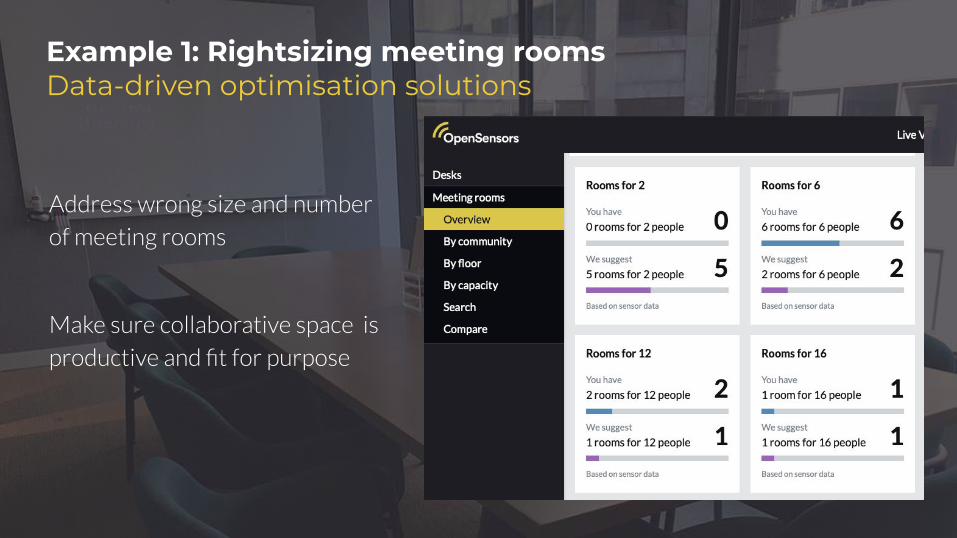
Example 2: Leveraging space utilisation data for meeting space managementThe challenges
95% of the time meeting rooms are fully
booked but
38% no shows
Difficult to find a room at short notice
Common challenges Adverse Impacts
Lack of utilisation visibility means incorrect perceptions about space usage
Meeting productivity
Ability to host clients is compromised
opensensors.com
Real time availability displays
(Live view monitors | Apps)
Example 2: Leveraging space utilisation data for meeting space managementData-driven optimisation solutions

opensensors.com
API integration with meeting
room booking systems.
Bookings control and penalties
for repeated no show with no
cancellation.
Example 2: Leveraging space utilisation data for meeting space managementData-driven optimisation solutions

opensensors.com
Data-driven solutions to desk sharing programs
Evidence-based planning for agile working
programs and change management
Dynamic occupancy models supported by data
Objective and indisputable data take the politics
out of decision making
Is my desk sharing
ratio off?
How am I doing compared to other
organisations?
How do I account for
specific space needs of
different teams ?
How can I rightsize and be in full
control over real estate occupancy
expenses going forward?
Can I grow my
headcount without
growing my footprint?
How can I validate a new stacking plan?
I am under a lot of pressure from
stakeholders and feel resistance
from employees
Example 3: Agile working and desk sharing ratiosCommon questions our clients ask

Engineering the future of smart buildings
Example 3: Agile working and desk sharing ratios
Method 1: Customise sharing ratios by using Average Daily Peak Utilisation
Method 2: Build staff mobility profiles
Headcount and allocated desks
Current ratio
Average Peak Utilisation
Target utilisation
Target number of desks for department
New sharing ratio
Dept 1 120 staff / 100 desks 1:1.2
70% 85% 70 / 85%= 83 120 pax / 83 desks = 1:1.45
Dept 2210 staff / 175 desks
1:1.2 50% 85% 88 / 85% =104 210 staff / 104 desks = 1:2
Anchored > 80% utilisation = NO SHARING
Semi-Agile 50%-80% utilisation = Sharing up to 1: 1.2
Agile < 50% utilisation = Up to 1:2

Engineering the future of smart buildings
Takeaways: Use data to design & navigate the change
1. Put data at the center of relationships
between Work, Space, People and Technology
2. Formulate your questions for workspace
utilisation data to answer
3. Monitoring and analysis: Identify workspace
usage patterns specific to a department /
company / country
4. Use objective data to support internal
communication and stakeholder conversations
5. Rightsizing and optimisation: Strike the right
balance between space productivity and
employee productivity
6. Keep monitoring your space utilisation:
Attaining ideal desk sharing ratios is a moving
target!
… And have fun!

Engineering the future of smart buildings