With Brad Cooper, CEO US Corporate Wellness, Inc..
53
With Brad Cooper, CEO US Corporate Wellness, Inc.
-
Upload
blaze-kelly -
Category
Documents
-
view
218 -
download
2
Transcript of With Brad Cooper, CEO US Corporate Wellness, Inc..
With Brad Cooper, CEO
US Corporate Wellness, Inc.


Effective Employee Wellness
and Insurance?
Effective Employee Wellness
and Insurance? Helps keep claims costs under control Enhances value of other benefits and insurance-
based programming already in place (if done well) Offers some good news that can be shared with
clients (& employees) during annual meetings Provides additional revenue stream and/or
additional value proposition for you/your firm (and another reason to reach out to clients/potential clients)
Low maintenance, high value for HR and/or Benefits Team and you
Helps keep claims costs under control Enhances value of other benefits and insurance-
based programming already in place (if done well) Offers some good news that can be shared with
clients (& employees) during annual meetings Provides additional revenue stream and/or
additional value proposition for you/your firm (and another reason to reach out to clients/potential clients)
Low maintenance, high value for HR and/or Benefits Team and you

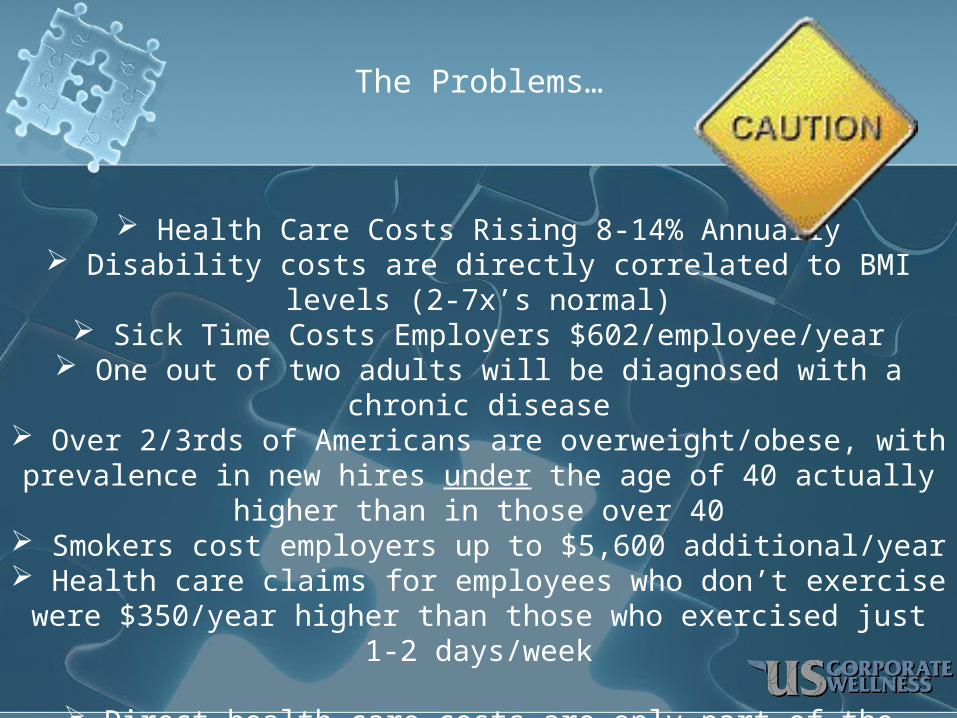
The Problems…
Health Care Costs Rising 8-14% Annually Disability costs are directly correlated to BMI levels (2-7x’s
normal) Sick Time Costs Employers $602/employee/year
One out of two adults will be diagnosed with a chronic disease
Over 2/3rds of Americans are overweight/obese, with prevalence in new hires under the age of 40 actually higher
than in those over 40 Smokers cost employers up to $5,600 additional/year
Health care claims for employees who don’t exercise were $350/year higher than those who exercised just 1-2 days/week
Direct health care costs are only part of the picture. Health related productivity costs are estimated to be equal to 3-4x’s
direct costs.

Obesity Trends* Among U.S. Adults1994
Obesity Trends* Among U.S. Adults1994
(*BMI ≥30, or ~ 30 lbs. overweight for 5’ 4” person)
<10% 10%–14 15%–19%
Source – CDC Behavioral Risk Factor Surveillance System

Obesity Trends* Among U.S. Adults1995
Obesity Trends* Among U.S. Adults1995
(*BMI ≥30, or ~ 30 lbs. overweight for 5’ 4” person)
<10% 10%–14% 15%–19%
Source – CDC Behavioral Risk Factor Surveillance System

Obesity Trends* Among U.S. Adults1996
Obesity Trends* Among U.S. Adults1996
(*BMI ≥30, or ~ 30 lbs. overweight for 5’ 4” person)
<10% 10%–14% 15%–19%
Source – CDC Behavioral Risk Factor Surveillance System

Obesity Trends* Among U.S. Adults1997
Obesity Trends* Among U.S. Adults1997
(*BMI ≥30, or ~ 30 lbs. overweight for 5’ 4” person)
<10% 10%–14% 15%–19% ≥20%
Source – CDC Behavioral Risk Factor Surveillance System
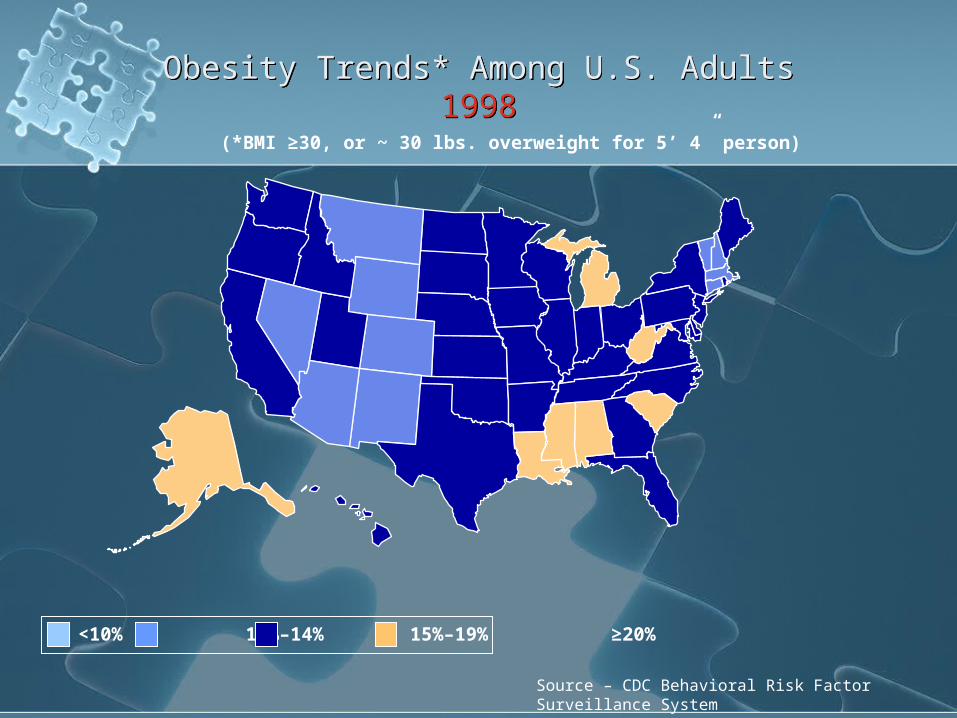
Obesity Trends* Among U.S. Adults1998
Obesity Trends* Among U.S. Adults1998
(*BMI ≥30, or ~ 30 lbs. overweight for 5’ 4” person)
<10% 10%–14% 15%–19% ≥20%
Source – CDC Behavioral Risk Factor Surveillance System

Obesity Trends* Among U.S. Adults1999
Obesity Trends* Among U.S. Adults1999
(*BMI ≥30, or ~ 30 lbs. overweight for 5’ 4” person)
<10% 10%–14% 15%–19% ≥20%
Source – CDC Behavioral Risk Factor Surveillance System

Obesity Trends* Among U.S. Adults2000
Obesity Trends* Among U.S. Adults2000
(*BMI ≥30, or ~ 30 lbs. overweight for 5’ 4” person)
<10% 10%–14% 15%–19% ≥20%
Source – CDC Behavioral Risk Factor Surveillance System

Obesity Trends* Among U.S. Adults2001
Obesity Trends* Among U.S. Adults2001
(*BMI ≥30, or ~ 30 lbs. overweight for 5’ 4” person)
<10% 10%–14% 15%–19% 20%–24% ≥25%
Source – CDC Behavioral Risk Factor Surveillance System

(*BMI ≥30, or ~ 30 lbs. overweight for 5’ 4” person)
Obesity Trends* Among U.S. Adults2002
<10% 10%–14% 15%–19% 20%–24% ≥25%
Source – CDC Behavioral Risk Factor Surveillance System
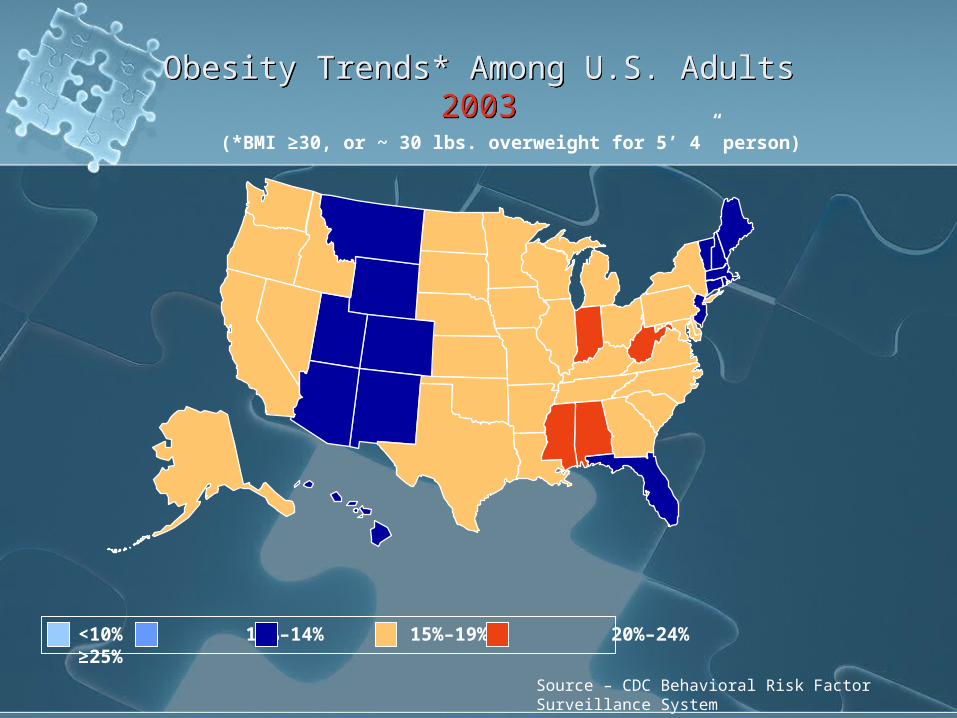
Obesity Trends* Among U.S. Adults2003
Obesity Trends* Among U.S. Adults2003
(*BMI ≥30, or ~ 30 lbs. overweight for 5’ 4” person)
<10% 10%–14% 15%–19% 20%–24% ≥25%
Source – CDC Behavioral Risk Factor Surveillance System
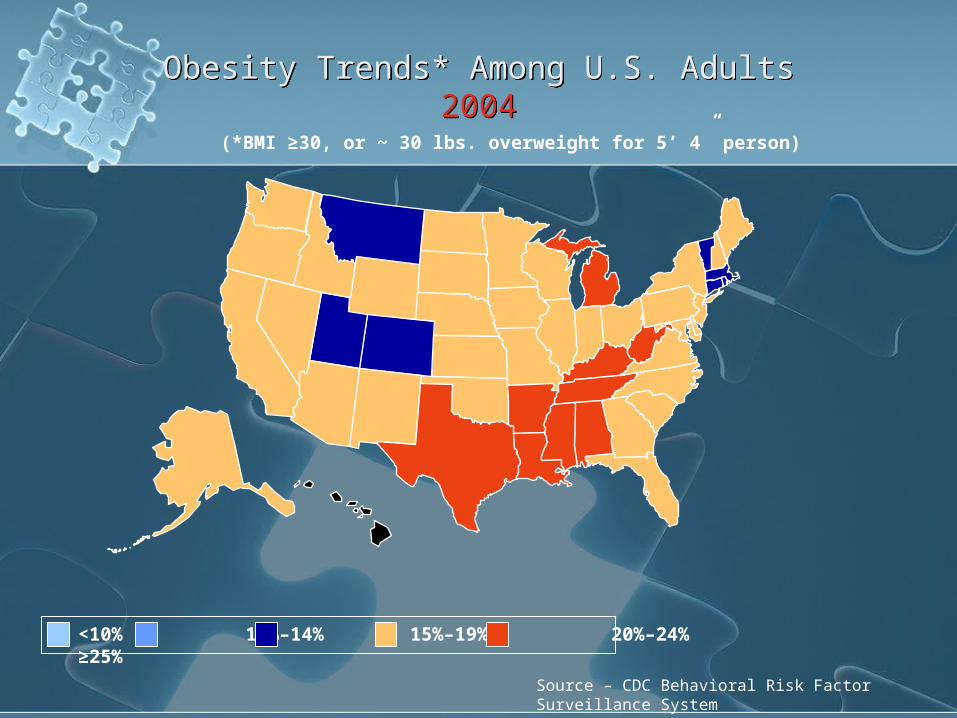
Obesity Trends* Among U.S. Adults2004
Obesity Trends* Among U.S. Adults2004
(*BMI ≥30, or ~ 30 lbs. overweight for 5’ 4” person)
<10% 10%–14% 15%–19% 20%–24% ≥25%
Source – CDC Behavioral Risk Factor Surveillance System
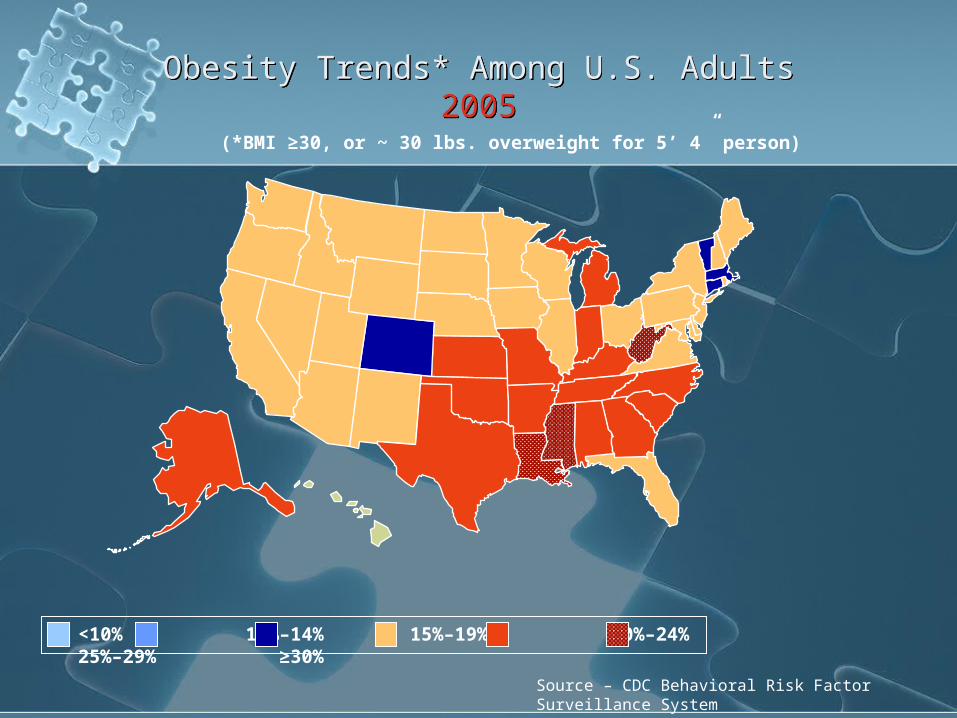
Obesity Trends* Among U.S. Adults2005
Obesity Trends* Among U.S. Adults2005
(*BMI ≥30, or ~ 30 lbs. overweight for 5’ 4” person)
<10% 10%–14% 15%–19% 20%–24% 25%–29% ≥30%
Source – CDC Behavioral Risk Factor Surveillance System

Obesity Trends* Among U.S. Adults2006
Obesity Trends* Among U.S. Adults2006
(*BMI ≥30, or ~ 30 lbs. overweight for 5’ 4” person)
<10% 10%–14% 15%–19% 20%–24% 25%–29% ≥30%
Source – CDC Behavioral Risk Factor Surveillance System

Obesity Trends* Among U.S. Adults2007
Obesity Trends* Among U.S. Adults2007
(*BMI ≥30, or ~ 30 lbs. overweight for 5’ 4” person)
<10% 10%–14% 15%–19% 20%–24% 25%–29% ≥30%
Source – CDC Behavioral Risk Factor Surveillance System

Obesity Trends* Among U.S. Adults2008
Obesity Trends* Among U.S. Adults2008
(*BMI ≥30, or ~ 30 lbs. overweight for 5’ 4” person)
<10% 10%–14% 15%–19% 20%–24% 25%–29% ≥30%
Source – CDC Behavioral Risk Factor Surveillance System

Source – Archives of Internal Medicing (Duke University – 11,700 people in sample size)
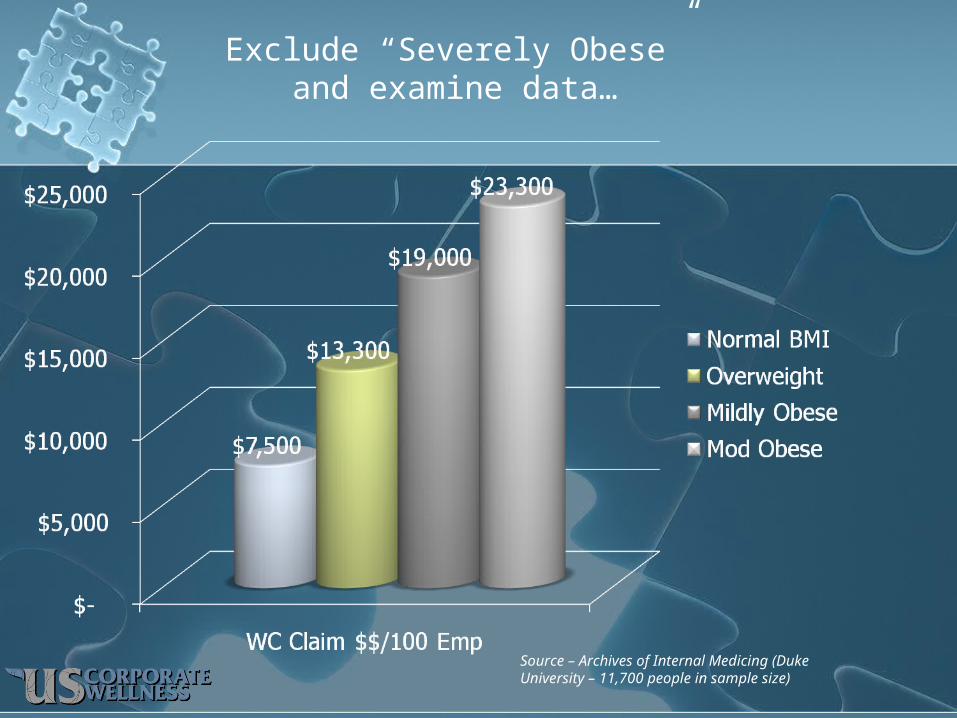
How about Disability Costs?
Source – Archives of Internal Medicing (Duke University – 11,700 people in sample size)
Exclude “Severely Obese” and examine data…

Source – Archives of Internal Medicing (Duke University – 11,700 people in sample size)
One more step (“overweight” category only)
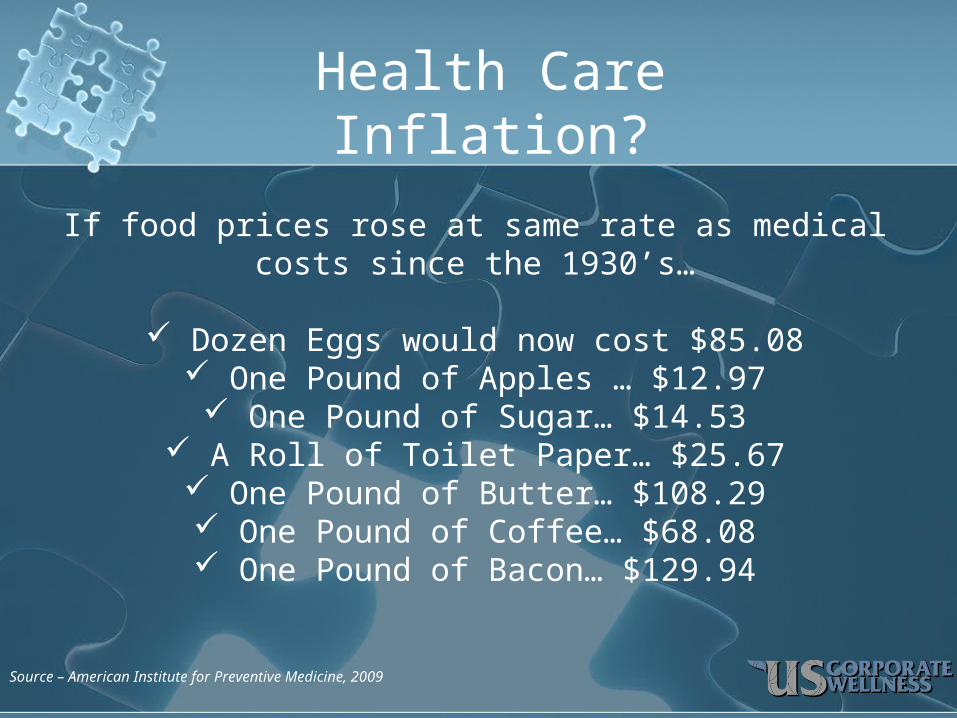
Source – American Institute for Preventive Medicine, 2009
If food prices rose at same rate as medical costs since the 1930’s…
Dozen Eggs would now cost $85.08 One Pound of Apples … $12.97 One Pound of Sugar… $14.53
A Roll of Toilet Paper… $25.67 One Pound of Butter… $108.29 One Pound of Coffee… $68.08 One Pound of Bacon… $129.94
Health Care Inflation?
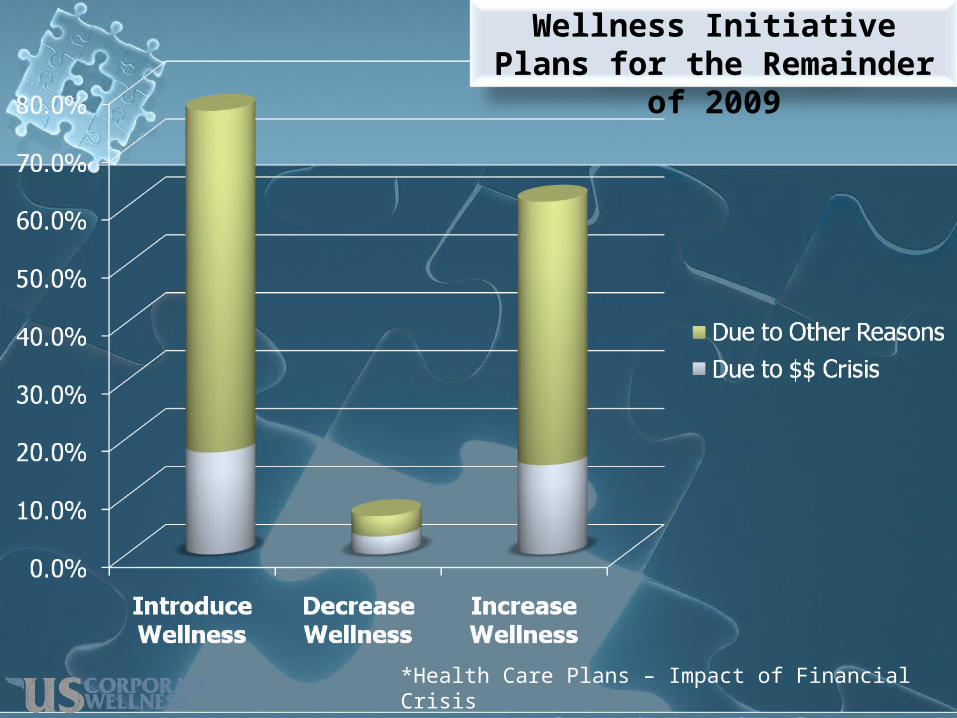
Wellness Initiative Plans for the Remainder of 2009
*Health Care Plans – Impact of Financial CrisisInternational Foundation of Employee Benefit Plans, 2009

Wellness 1.0 … Group Activities
Wellness 2.0… Disease Management
Wellness 3.0… Web Tools
Wellness 4.0… Generic Call Center Added
Wellness 5.0… Personalized Approach
A Little History Lesson
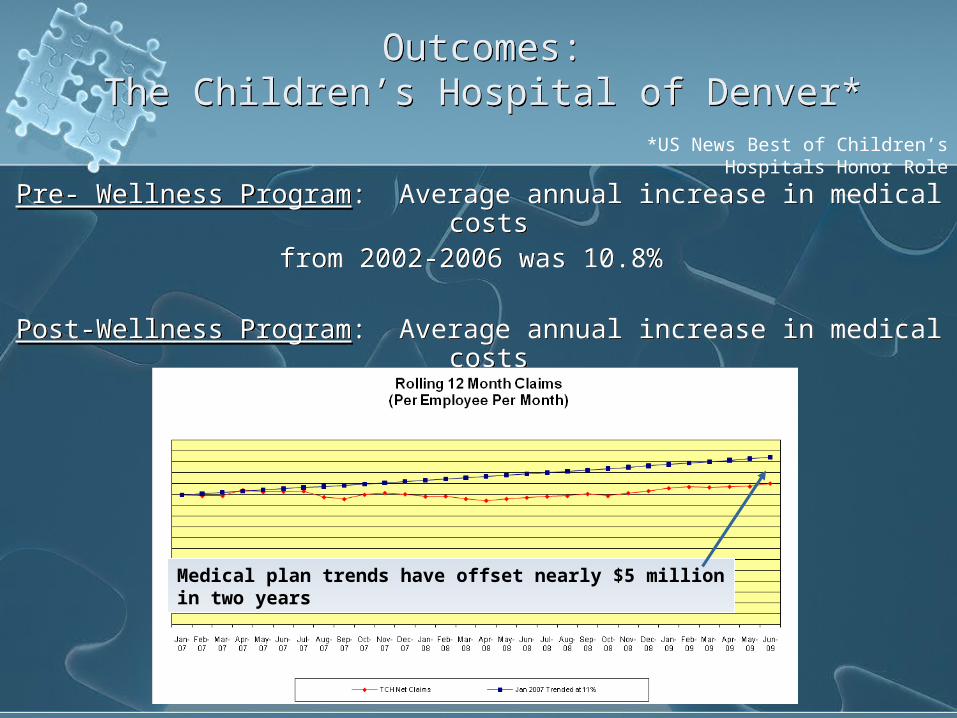
Outcomes:The Children’s Hospital of Denver*
Outcomes:The Children’s Hospital of Denver*
Pre- Wellness Program: Average annual increase in medical costs from 2002-2006 was 10.8%
Post-Wellness Program: Average annual increase in medical costs from 2007-2010 was 4.6%
Pre- Wellness Program: Average annual increase in medical costs from 2002-2006 was 10.8%
Post-Wellness Program: Average annual increase in medical costs from 2007-2010 was 4.6%
Medical plan trends have offset nearly $5 million in two years
*US News Best of Children’s Hospitals Honor Role


Beware the “Token” Wellness Effort
“If you look at people after coronary-artery bypass grafting two years later, ninety (90!) percent of them
have not changed their lifestyle.”-Alan DeutschmanChange or Die
(Note: Lifestyle changes don’t just happen because they’re “important.” Must involve pattern of Relate…
Repeat… Reframe)

1. “Most experts believed that effective coaching is essential to improving health behaviors.”
2. "Some employers focus coaching efforts solely on high-risk individuals, but there appears to be increasing recognition among employers of the importance of making health coaching available to a broader population.”
3. There is a great deal of variation between HRAs. However, the research was clear on this: "What most experts do agree on is that HRAs can be a valuable screening tool, but only if they are followed up by effective health coaching and wellness activities.”
4. "One-size-fits-all programs purchased off-the-shelf from health plans and wellness vendors are unlikely to make a significant impact. Least likely… are programs consisting only of online HRAs and Web-based educational tools, with no individualized follow-up activities to engage employees."
Let’s take a look at the literature…(Research brief from National Institute for Health Care Reform on Effectiveness of Employee Wellness Initiatives, 2010, covered by
the Wall Street Journal)

Where is your trend line heading?
Where is your trend line heading?
Total Health Care and Disability Costs = ______Annual Increase of 10% (?) = ______
What if that annual increase were diminished by 2%? 4%? 8%?
And then there’s productivity, retention, sick time, stress reduction…
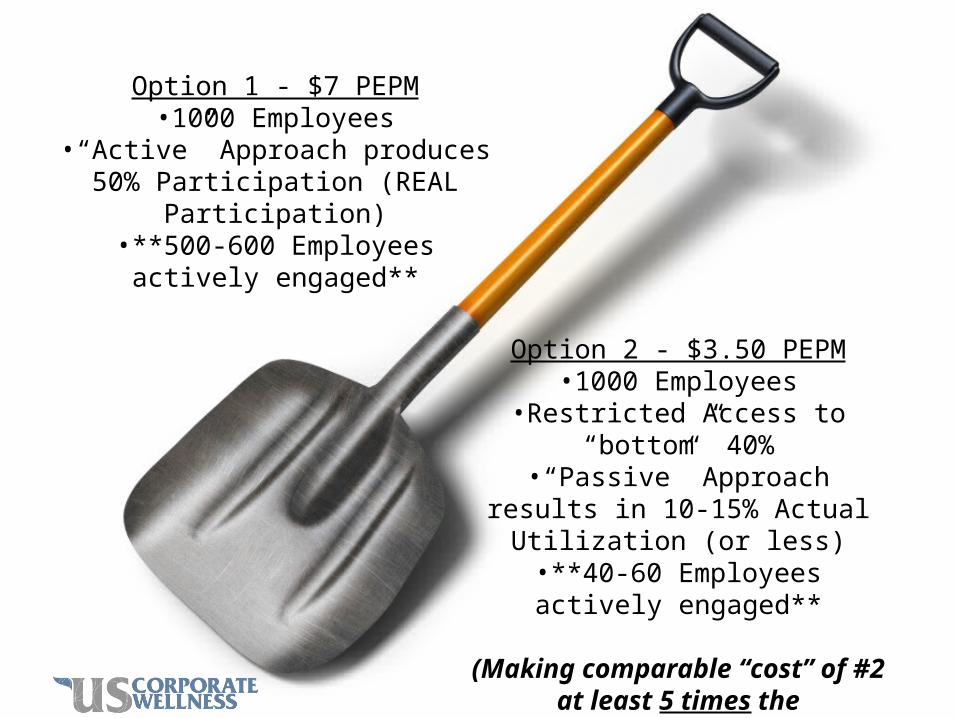
When Comparing Programs…
Option 2 - $3.50 PEPM•1000 Employees
•Restricted Access to “bottom” 40%
•“Passive” Approach results in 10-15% Actual Utilization (or
less)•**40-60 Employees actively
engaged**
(Making comparable “cost” of #2 at least 5 times the
cost/employee of #1)
Option 1 - $7 PEPM•1000 Employees
•“Active” Approach produces 50% Participation (REAL
Participation)•**500-600 Employees actively
engaged**

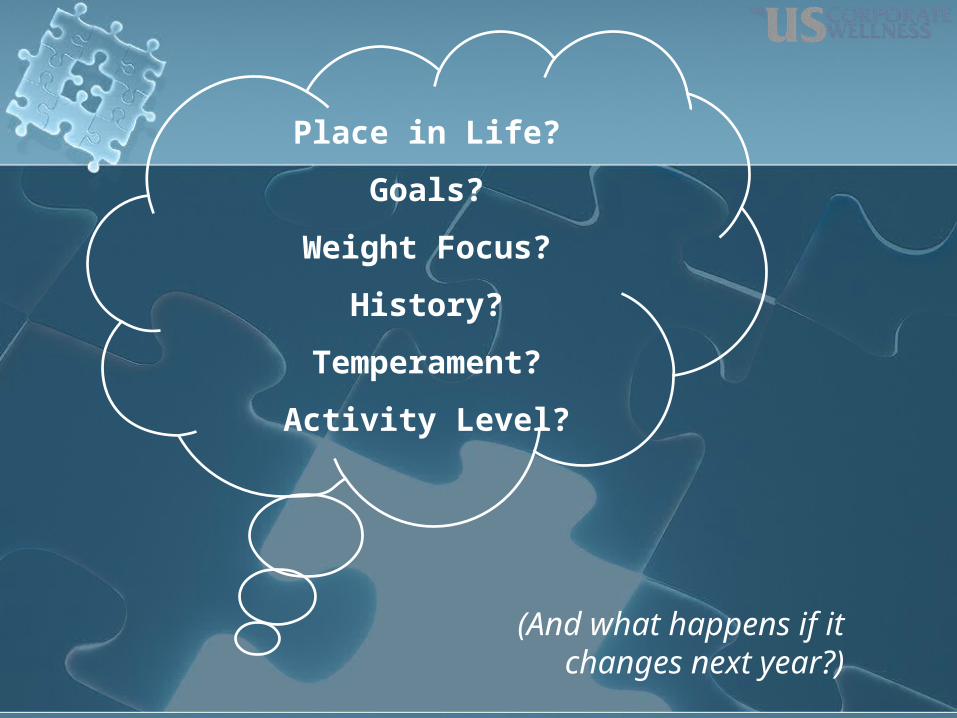
Place in Life?
Goals?
Weight Focus?
History?
Temperament?
Activity Level?
(And what happens if it changes next
year?)

(Or – painting the stick orange)

Incentives*
• Usually (always) necessary in some format (varies by industry)• Research indicates $200-300/yr is effective in most organizations• Can be “cost neutral” (ie, balanced out by increase in deductible)• Tie to pursuit vs. achievement is recommended• Various forms available (note tax implications for each):
• Cash• Time Off• Drawing for prize (among participants)• Gift Certificates• Reduced Insurance Premium• Goodies (shirts, water bottles, exercise equipment…)• Health Saving Account tie-in
* Note - Laws vary by state – confirm legal issues with counsel


Only one in twenty adults consistently engage in the five most important health behaviors:
•Regular exercise
•Healthy levels and types of fat intake•Five daily servings of fruits and vegetables
•Moderate drinking•Non-smoking

Source – Institute for the Future, Center for Disease Control and Prevention; Midwest Business Group on Health; Annals of Internal Medicine, 2002

The Tipping
Point The Rule ofSeven


Costs for a sample organization…(based on 11,000 benefit eligible employees)
The above CDC Data includes only BMI-Related Medical and Work Loss Costs. How about Disability Costs?
Turnover?Inadequate Sleep?Poor Eating Habits?
Presenteeism/Lack of Energy?

Cigna, Women >49 Years old, Mammogram
45.50%
63.25%
45.28%
0.00% 10.00% 20.00% 30.00% 40.00% 50.00% 60.00% 70.00%
Non Participants
Participants
Normative
Outcomes:Sample Client
Outcomes:Sample Client
Wellness program participants are more compliant with recommended preventative care
Wellness program participants are more compliant with recommended preventative care

Likelihood of EIB Claim at The Children’s HospitalLikelihood of EIB Claim
at The Children’s Hospital
Wellness Program
Participant
Non-Participant

Additional ROI Data for Sample Client
Additional ROI Data for Sample Client
The difference in total EIB hours was 2.85/employee, translating to over $185,000 (Estimated at double if sick
time separate)
10% improvement in BMI produced $100,000 in savings
8% increase in exercise levels correlated to $96,000 saved
7.7% in blood pressure translates to over $60,000 saved
Impact on Depression, Smoking and Immunizations produced an additional $240,000 in annual savings
Note that Edington assigns a value of $350/year/employee who has been kept from moving into higher risk category


Cutting through the Noise of Options…
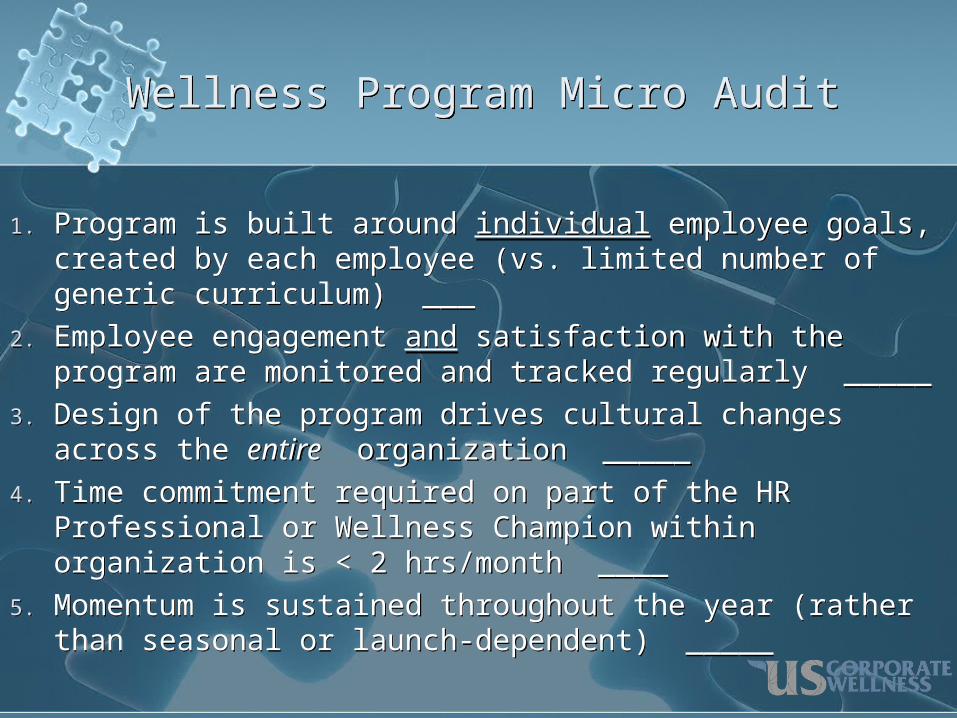
Wellness Program Micro AuditWellness Program Micro Audit
1. Program is built around individual employee goals, created by each employee (vs. limited number of generic curriculum) ___
2. Employee engagement and satisfaction with the program are monitored and tracked regularly _____
3. Design of the program drives cultural changes across the entire organization _____
4. Time commitment required on part of the HR Professional or Wellness Champion within organization is < 2 hrs/month ____
5. Momentum is sustained throughout the year (rather than seasonal or launch-dependent) _____

6. Wellness Coaching offers a variety of options in terms of unique personalities, preferences, goals, etc _____
7. Employee participation expands (not shrinks) over time _____
8. The program adjusts with each employee as their wellness pursuits change or develop _____
9. If employees are not initiating activity, the program regularly provides process to re-engage with them _____
10. You personally enjoy participating in the program _____
Wellness Program Micro Audit (cont.)Wellness Program Micro Audit (cont.)

Benefits Broker Micro-AuditBenefits Broker Micro-Audit
1. Which of your clients are seeing escalating health care and/or disability costs?
2. Which of these clients want to do something meaningful and ROI-based to change the trend?
3. Are generic options making a difference for these clients?
4. Would it be beneficial to have a new value proposition to bring to your clients?
5. Do the wellness programs being provided make YOU look good?

Thank You!Thank You!
For more information specific to your organization, please contact Brad directly at
[email protected] or 303-521-1570
Or, visit
www.USCorporateWellness.com