Wine Industry Benchmarking and Insights 2018
24
February 2019 Growing Smarter Wine industry benchmarking and insights 2018 New Zealand
Transcript of Wine Industry Benchmarking and Insights 2018
February 2019
Growing SmarterWine industry benchmarking and insights 2018New Zealand

Peter FelsteadPartner, Deloitte
Philip GreganCEO, New Zealand Winegrowers
John BennettGeneral Manager Central Region, ANZ Commercial & Agri
It is with great pleasure to present the 2018
results of our annual benchmarking survey in
conjunction with ANZ and New Zealand
Winegrowers. The New Zealand wine industry
continues to perform well on the back of
profitability for wineries of all sizes, strengthening
balance sheets and a healthy propensity for
innovation. We would like to express our sincere
thanks to those who provided data for the survey
and wish you all the best for the year ahead.
New Zealand Winegrowers seeks to provide high
quality data to assist informed discussion and
decision making about the industry by our
members and stakeholders. We are pleased to
partner with Deloitte and ANZ in this winery
benchmarking which continues to provide a
wealth of industry data and insights. Best wishes
for a successful and prosperous 2019.
With strong profitability and balance sheets this
report makes for positive reading. But with plenty
of challenges on the horizon, notably around
environment changes and staffing pressure,
growing smarter through innovation is particularly
relevant. We look forward to further discussion on
these themes with businesses in the year ahead.
Contents
Key findings 2
Featured insight #1: Innovation impact 3
Survey insights: Profitability 5
Survey insights: Balance sheet 6
Survey insights: Key ratios 7
Survey insights: Return on assets 8
Industry insights: Supply & demand 9
Industry insights: Key markets 10
Featured insight #2: Customer connections 11
About and further information 12
Appendix / Survey benchmark tables 14
1
Wine industry benchmarking and insights 2018 | Contents and foreword

Stronger balance sheets (pages 6 and 16)
Equity levels (as a percentage of total assets) for the wider survey
group have been steadily increasing over the last 10 years.
These equity levels ranged from 54% ($20m+ turnover) to 72%
($5-$10m turnover).
Connecting to customers(pages 11 and 18)
Connecting directly with customers
is increasingly important to build trust, brand reputation and
profitable sales.
Supply and demand (page 9)
2018 saw a 1.8% lift in average prices
received by Kiwi wineries after sales outstripped supply in the previous year.
Prices per litre ranged from $3.96/l for bulk export wine, $8.47/l for packaged
exports and $10.34/l for supply into the domestic market.
Return on assets(pages 8 and 17)
Return on assets (EBIT/Assets) varied
across the different tiers in the survey from 2.4% ($1.5-$5m turnover) to
8.4% ($20m+ turnover).
2
Wine industry benchmarking and insights 2018 | Key Findings
Key findings
Profitability stable (pages 5 and 15)
Positive profitability was achieved
across all tiers but as with previous years we saw smaller
wineries generally achieving lower returns with far greater
variability amongst respondents.
Innovation impact (pages 3 and 4)
Survey results indicate a positive correlation between innovation and
financial performance of wineries. Respondents report digital tools are
proving most beneficial in terms of improving business decision making
and customer experiences.
Investing in developing
equipment technologies is important to 94% of
survey respondents.
#3
56%The average sale price
per litre received by wineries in 2018.
86%
In 2018 the
combined turnover
of wineries in New
Zealand was
estimated at $2.3
billion, with $1.7
billion of this
coming from export
earnings.
2018 survey
respondents account
for approximately
44% of the New
Zealand wine
industry by litres of
wine produced and
35% by export sales
revenue generated
for the 2018 year.
Vintage-2018-
8.1%
94%
The combined total
Return on assets (EBIT/Assets) from
survey dataset.
Total equity as a
percentage of total assets from survey dataset.
$7.33/l
For only the third time in
the history of the survey all tiers achieved
profitable results.
Direct to consumer sales
via cellar door or online are undertaken by 86%
of survey respondents.

Larger wineries are more likely to
prioritise innovation spending
Emerging technologies in the winery
are receiving investment priority from
larger wineries. These same
companies also tended to generate
stronger profits and return on assets
than other wineries.
Improving quality in the winery
drives most investment
This is followed by productivity driven
improvements in the vineyard. For
larger wineries, winery productivity
investments take precedent which is
unsurprising given the successful focus
on cost of production amongst larger
wineries.
Stronger returns are being
achieved by wineries that
prioritise innovation spending
Survey data indicates a positive link
between innovation spending and
returns, as illustrated in the following
chart. Are financially strong wineries
able to prioritise investment because
they have more cash to invest, or do
they have more to invest as the result
of the innovations already applied?
The answer is likely a combination of
both factors along with other factors
unique to every business.
Smaller wineries have the
strongest intentions to increase
innovation spending
There are many reasons why smaller
wineries may not have invested as
much into innovative technologies.
The most likely rationale is the
relatively weaker cash flows and
retained earnings experienced by
these companies, which can render
costs as prohibitive. Furthermore,
some types of plant and equipment
become comparatively more cost
effective as scale increases. This can
make some investment decisions
difficult to justify for smaller wineries.
Problem solving
Strong investment intentions suggest
potentially cost effective and
innovative solutions are on the horizon
for the myriad of challenges wineries
are facing. Such challenges include
staff availability and cost, Health &
Safety, and optimising or overcoming
biophysical (including water) factors in
the winery and vineyard.
Featured insight #1 – Innovation impact
Kiwi wineries are increasing investment in new plant and equipment technologies
3
Wine industry benchmarking and insights 2018 | Featured insight
0%
10%
20%
30%
40%
50%
60%
<0% 0-10% 10-20% 20%+% o
f re
spondents
prioritisin
g
innovation investm
ent
Net profit grouping (% of total revenue)
Linking innovation investment priorities with net profit performance
In the chart above we have grouped responses by net profit (as a percentage of total revenue). We then mapped the percentage of respondents in each group that identified innovation investment as a priority. The positive correlation aligns with the earlier finding that larger wineries, who tend to achieve stronger profitability, are more likely to prioritise innovation investment.
Survey findings supported by other
research
A 2018 ANZ report, focussed on innovation in
the New Zealand manufacturing sector, found
a correlation between investment in
innovation and the achievement of
productivity gains. The data showed those
who invested in innovation had a stronger
return on invested capital than those who
didn’t, and sales revenue grew faster.
Innovative technologies in plant and
equipment – 2018 Survey questions
Respondents were asked to describe their
investment approach and opportunities in
terms of different parts of the business. They
were also asked about their investment
intentions and how they prioritise spending in
regards to technological advancements in
plant and equipment. 94% of respondents
reported that investing in developing
technologies is important.

Survey results indicate that wineries
are adopting digital tools for a range
of reasons , the top three being:
1. Improving customer experience &
engagement
2. Improving business decision making
3. Improving staff experience and engagement
Larger wineries are leading with a
broader range of digital tools
The Internet of Things (IoT) uptake is a
great example of larger wineries leading
the adoption as they use IoT technology
far more than smaller companies.
Furthermore, across all tiers of digital
tools, larger wineries have the strongest
intentions to increase adoption and
engagement with digital tools.
Cloud based applications, mobile and
social media are most used
technologies
Use of most digital tools appears to
increase with scale, with the exception of
social media which appears to be well
used by wineries of all sizes.
Smaller wineries are also leveraging
technology
Many smaller wineries are maintaining
competitiveness in a tight market by
leveraging technology to connect and
engage with customers. All for a relatively
low cost investment.
Survey findings supported by other
research
Studies by Deloitte internationally have
supported our findings that a benefit of
digital tools is an improved customer
experience.
Digital tools change the way customers
engage with businesses and provide an
opportunity to strengthen customer
relationships. They help businesses target
more customers in new markets.
In with the new but don’t throw out
the old just yet!
Digital tools are becoming easier to use,
and the value of them is becoming better
understood. But it appears these tools are
not yet seen as transformative to
business. In other words they are
primarily seen as complementary, rather
than replacements for processes and tools
already in place.
Recommendation
For wine businesses, use this report as a
prompt to think about where you are at in
terms of investing in innovative
technologies. Remember also that
innovation isn’t necessarily about financial
investment. It’s very much about a way of
thinking, of doing things differently and
better. What can you do to foster a
culture which drives innovation?
You don’t have to reinvent the wheel,
think about what you can learn from other
businesses who are innovating and using
digital tools.
Digital tools – 2018 Survey questions
Respondents were asked about the range
of digital tools used in their business and
the benefits associated with increased
adoption of those tools. Finally they were
asked about their intentions in relation to
adoption and engagement of digital tools.
Further reading:
Deloitte - Tech Trends 2018: The
symphonic enterprise
Deloitte - The digital transformation of
customer services
ANZ - Innovation & Productivity Report
2018
“By using the latest technology we’re able to make good decisions more quickly, to reduce our environmental footprint and produce the finest quality wines for our customers.”
Emma Marris, Marisco Vineyards
4
Wine industry benchmarking and insights 2018 | Featured insight
Growing smarter with digital tools

All tiers reported positive profit
for only the third time in the
history of the survey
On averaging the results for each
turnover category we found they all
recorded a positive profit before tax
result for only the third time in the
twelve year history of the survey
(2014, 2016 and 2018).
Consistent performance amongst
larger wineries
The $20m+ category once again
achieved the largest average profit
after tax at 18.7%. Total expenses at
19.3% of sales were lowest amongst
this group. This reinforces the results
of previous surveys showing that
generally profitability increases with
size due to economies of scale.
Cost challenges amongst smaller
wineries
At the other end of the scale the two
smallest tiers of wineries had the
highest levels of expenses and the
lowest profitability as a percentage of
sales.
Income diversification and
variability are features of small to
mid-size wineries
The variability of profit margins
amongst smaller wineries is evident in
the bottom two charts. The black line
indicates the median (or ‘middle’)
profit margin with the shaded bars
capturing the profit margins of the
‘middle’ 50% of participants.
Furthermore, smaller wineries
typically generate 10-15% of revenue
through means other than wine sales.
Grape and hospitality sales feature
amongst other sources of revenue.
Impact on balance sheet
One consequence of volatile and weak
profitability generally experienced by
smaller wineries is the inability to
accumulate retained earnings. This is
in contrast to larger wineries which
are generally able to build up strong
reserves. Retained earnings offer
businesses flexibility and options.
The full survey results and further profit and loss analysis can be found on page 15 of the report.
Survey insights – Profitability
Positive profit across all tiers of surveyed wineries suggest 2018 was a good year
5
Wine industry benchmarking and insights 2018 | Survey insights
(25%)
(15%)
(5%)
5%
15%
25%
2013 2014 2015 2016 2017 2018
Profit before tax - $0- 1.5m
turnover
(as a % of sales; quartile range)
2013 2014 2015 2016 2017 2018
Profit before tax - $1.5m- 20m+
(as a % of sales; quartile range)
(40%)
(30%)
(20%)
(10%)
0%
10%
20%
30%
40%
2006 2007 2008 2009 2010 2011 2012 2013 2014 2015 2016 2017 2018
Profit before tax – All wineries
(as a % of sales; average by turnover band)
$0-1.5m $1.5-5m $5-10m $10-20m $20m+

Equity ratios have strengthened
across the survey group
It is also pleasing to see all tiers
reporting average levels of equity
above 50% in proportion to total
assets. The chart above right uses
linear trend lines to illustrate equity
ratio improvements over the last ten
years.
Smaller wineries most reliant on
shareholder funding
For the purposes of benchmarking,
shareholder loans have been treated
as ‘quasi equity’ as they reflect
shareholder capital. This has propped
up equity levels for this tier.
Another feature of smaller winery
balance sheets is reflected in the
chart to the bottom right of the page.
Here we see working capital (being
current assets less current liabilities)
peaking at the $1.5-5m tier at 50%
of assets.
This is mostly driven by higher levels
of inventory than the other tiers. Of
course varietal mix could well play a
role here, with some varietals being
retained on the balance sheet
significantly longer than the dominant
Sauvignon Blanc varietal.
Larger wineries achieve largest
equity lift and apply tight working
capital processes
From 2017 to 2018 equity levels lifted
most dramatically in the $10m+ tiers,
off the back of reductions in debt
levels.
On the working capital front we can
see that relative levels (including
inventory) tend to reduce as winery
scale increases.
Aside from the influence of varietal
mix (as noted above), this is likely a
result of the larger operators
maintaining more sophisticated and
efficient processes, and procedures to
manage lower levels of working
capital than their smaller
counterparts.
The full survey results and further profit and loss analysis can be found on page 16 of the report.
Survey insights – Balance sheet
Balance sheets strong as equity levels rise in 2018
6
Wine industry benchmarking and insights 2018 | Survey insights
30%
35%
40%
45%
50%
55%
60%
65%
70%
75%
80%
2009 2010 2011 2012 2013 2014 2015 2016 2017 2018
Total equity
(as a % of total assets)
Linear ($0-1.5m) Linear ($1.5-5m) Linear ($5-10m)
Linear ($10-20m) Linear ($20m+)
44%50%
47%
32%
21%
5% 6%9%
3% 2%
0%
10%
20%
30%
40%
50%
60%
$0-1.5m $1.5-5m $5-10m $10-20m $20m+
Median working capital
(as a % of total assets)
Working capital Working capital (excluding inventory)
72%
54%
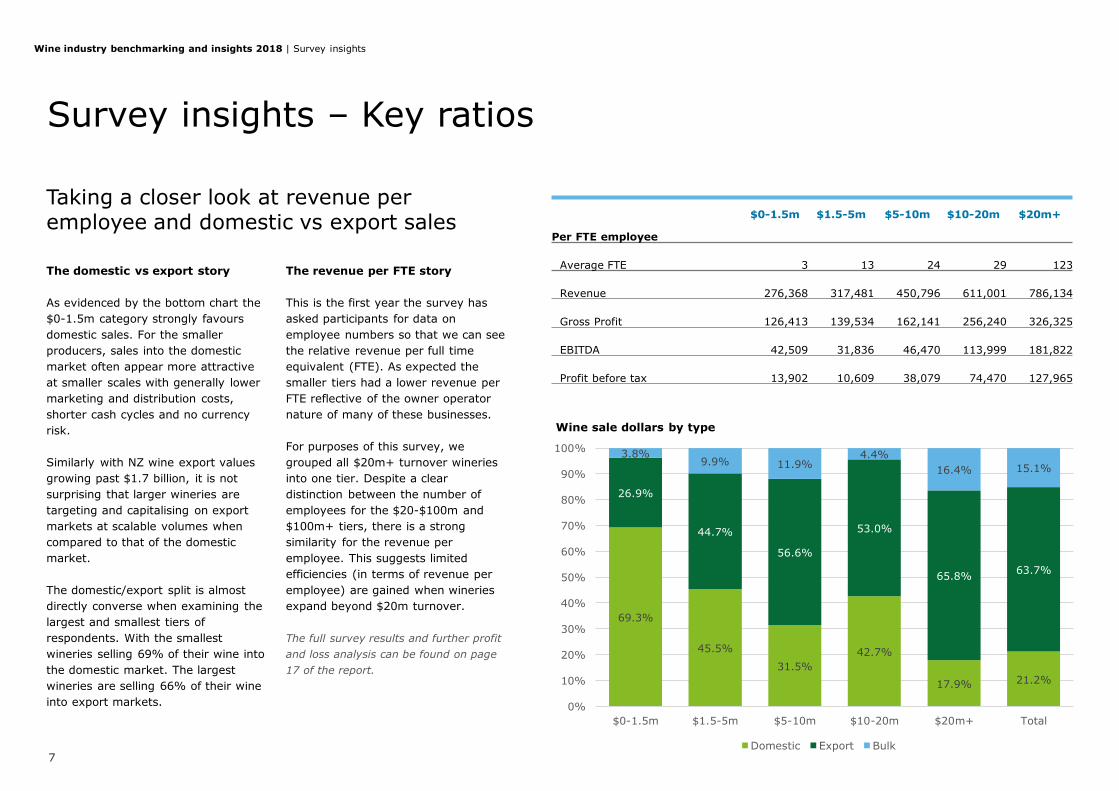
The domestic vs export story
As evidenced by the bottom chart the
$0-1.5m category strongly favours
domestic sales. For the smaller
producers, sales into the domestic
market often appear more attractive
at smaller scales with generally lower
marketing and distribution costs,
shorter cash cycles and no currency
risk.
Similarly with NZ wine export values
growing past $1.7 billion, it is not
surprising that larger wineries are
targeting and capitalising on export
markets at scalable volumes when
compared to that of the domestic
market.
The domestic/export split is almost
directly converse when examining the
largest and smallest tiers of
respondents. With the smallest
wineries selling 69% of their wine into
the domestic market. The largest
wineries are selling 66% of their wine
into export markets.
The revenue per FTE story
This is the first year the survey has
asked participants for data on
employee numbers so that we can see
the relative revenue per full time
equivalent (FTE). As expected the
smaller tiers had a lower revenue per
FTE reflective of the owner operator
nature of many of these businesses.
For purposes of this survey, we
grouped all $20m+ turnover wineries
into one tier. Despite a clear
distinction between the number of
employees for the $20-$100m and
$100m+ tiers, there is a strong
similarity for the revenue per
employee. This suggests limited
efficiencies (in terms of revenue per
employee) are gained when wineries
expand beyond $20m turnover.
The full survey results and further profit
and loss analysis can be found on page
17 of the report.
Survey insights – Key ratios
Taking a closer look at revenue per employee and domestic vs export sales
$0-1.5m $1.5-5m $5-10m $10-20m $20m+
Per FTE employee
Average FTE 3 13 24 29 123
Revenue 276,368 317,481 450,796 611,001 786,134
Gross Profit 126,413 139,534 162,141 256,240 326,325
EBITDA 42,509 31,836 46,470 113,999 181,822
Profit before tax 13,902 10,609 38,079 74,470 127,965
7
Wine industry benchmarking and insights 2018 | Survey insights
69.3%
45.5%
31.5%
42.7%
17.9% 21.2%
26.9%
44.7%
56.6%
53.0%
65.8%63.7%
3.8%9.9% 11.9%
4.4%
16.4% 15.1%
0%
10%
20%
30%
40%
50%
60%
70%
80%
90%
100%
$0-1.5m $1.5-5m $5-10m $10-20m $20m+ Total
Wine sale dollars by type
Domestic Export Bulk

An important and useful
comparative measure
Return on assets (RoA) is an important
measure of the performance of any
business’ assets, especially capital-
intensive businesses such as integrated
wineries.
Whilst there are a number of ways to
measure this return, we have opted for
earnings before interest and tax (EBIT)
divided by total assets.
The 2018 Survey shows an average
return range from 5.7% for our $0-
1.5m participants to 8.4% for those
with revenue in excess of $20m.
Revenue per litre and RoA
A negative correlation exists between
levels of revenue per litre and returns
on assets as evidenced by the chart
(below right). As winery size increases,
the revenue per litre tends to decrease
due to the sales mix in terms of
varietal, and export mix of bulk and
packaged formats. We note larger
wineries selling a higher proportion of
bulk wine which is at the lowest price
point.
Conversely we see return on assets
generally increasing with winery scale.
As noted earlier, larger wineries are
generally more profitable. Again many
factors play a role here, most notably
economies of scale where resource
capacity is maximised comparative to
smaller wineries.
Surveyed winery returns compared
to Marlborough grower only model
As a comparison, we have included in
the chart (above right) the RoA from
the 2018 Marlborough Vineyard
Benchmarking Report produced by New
Zealand Winegrowers and Ministry for
Primary Industries. The 5.2% RoA
figure is based on EBIT/total assets for
the Marlborough Vineyard Model. This
is indicative of returns achieved in
2018 by Marlborough based
winegrowers that sell grapes to
wineries.
Winegrowers can access further
information on viticulture benchmarking
by visiting NZ Wine or MPI.
Results reveal significant variation, with larger wineries generally achieving greater returns
Source: Deloitte, NZ Wine, MPI, Colliers International
Survey insights – Return on assets
8
Wine industry benchmarking and insights 2018 | Survey insights
5.7%
2.4%
7.0%
6.0%
8.4%
5.2%
0%
1%
2%
3%
4%
5%
6%
7%
8%
9%
$0-1.5m $1.5-5m $5-10m $10-20m $20m+ Marlborough
Comparison of returns on assets
Winery (2018 survey results) 2018 Grower (Collier / MPI)
0.0%
1.0%
2.0%
3.0%
4.0%
5.0%
6.0%
7.0%
8.0%
9.0%
$0
$2
$4
$6
$8
$10
$12
$14
$16
$0-1.5m $1.5-5m $5-10m $10-20m $20m+
Retu
rn o
n a
ssets
Revenue p
er
litr
e
Revenue per litre vs return on assets
Revenue per litre Return on assets
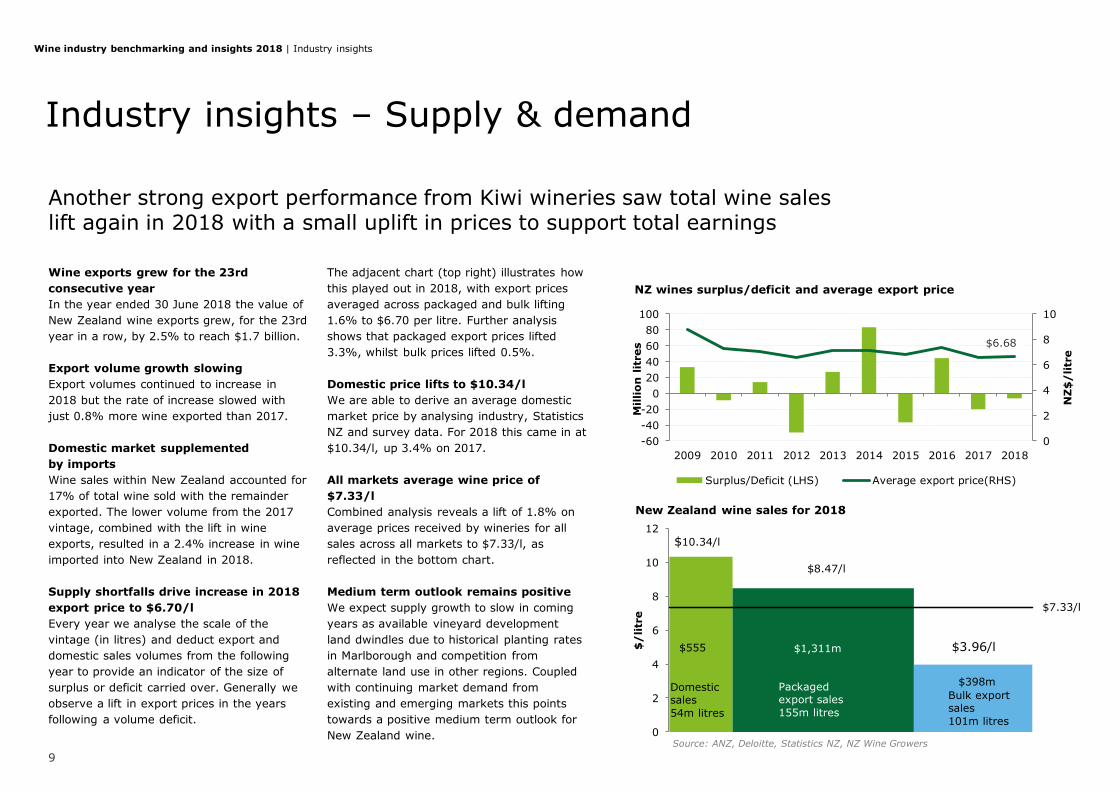
Industry insights – Supply & demand
Another strong export performance from Kiwi wineries saw total wine sales lift again in 2018 with a small uplift in prices to support total earnings
Source: ANZ, Deloitte, Statistics NZ, NZ Wine Growers
9
Wine industry benchmarking and insights 2018 | Industry insights
Wine exports grew for the 23rd
consecutive year
In the year ended 30 June 2018 the value of
New Zealand wine exports grew, for the 23rd
year in a row, by 2.5% to reach $1.7 billion.
Export volume growth slowing
Export volumes continued to increase in
2018 but the rate of increase slowed with
just 0.8% more wine exported than 2017.
Domestic market supplemented
by imports
Wine sales within New Zealand accounted for
17% of total wine sold with the remainder
exported. The lower volume from the 2017
vintage, combined with the lift in wine
exports, resulted in a 2.4% increase in wine
imported into New Zealand in 2018.
Supply shortfalls drive increase in 2018
export price to $6.70/l
Every year we analyse the scale of the
vintage (in litres) and deduct export and
domestic sales volumes from the following
year to provide an indicator of the size of
surplus or deficit carried over. Generally we
observe a lift in export prices in the years
following a volume deficit.
The adjacent chart (top right) illustrates how
this played out in 2018, with export prices
averaged across packaged and bulk lifting
1.6% to $6.70 per litre. Further analysis
shows that packaged export prices lifted
3.3%, whilst bulk prices lifted 0.5%.
Domestic price lifts to $10.34/l
We are able to derive an average domestic
market price by analysing industry, Statistics
NZ and survey data. For 2018 this came in at
$10.34/l, up 3.4% on 2017.
All markets average wine price of
$7.33/l
Combined analysis reveals a lift of 1.8% on
average prices received by wineries for all
sales across all markets to $7.33/l, as
reflected in the bottom chart.
Medium term outlook remains positive
We expect supply growth to slow in coming
years as available vineyard development
land dwindles due to historical planting rates
in Marlborough and competition from
alternate land use in other regions. Coupled
with continuing market demand from
existing and emerging markets this points
towards a positive medium term outlook for
New Zealand wine.
0
2
4
6
8
10
-60
-40
-20
0
20
40
60
80
100
2009 2010 2011 2012 2013 2014 2015 2016 2017 2018
NZ
$/
litr
e
Millio
n l
itre
s
NZ wines surplus/deficit and average export price
Surplus/Deficit (LHS) Average export price(RHS)
$10.34/l
Domestic sales
54m litres
$8.47/l
Packaged export sales
155m litres
Bulk export sales
101m litres
$3.96/l
$7.33/l
0
2
4
6
8
10
12
$/
litr
e
New Zealand wine sales for 2018
$555 $1,311m
$398m
$6.68

$7.00
$8.44
$8.05
$10.36 $7.67 $14.79
$3.62 $4.64
$3.75
$3.33$3.91
0m
10m
20m
30m
40m
50m
60m
70m
80m
UK US Australia Canada Netherlands China
Exports to main markets & average export prices in 2018
Packaged Bulk
Industry insights – Key markets
With export sales already looking healthy we ask if the value of New Zealand’s wine exports could improve by further market diversification?
10
Wine industry benchmarking and insights 2018 | Industry insights
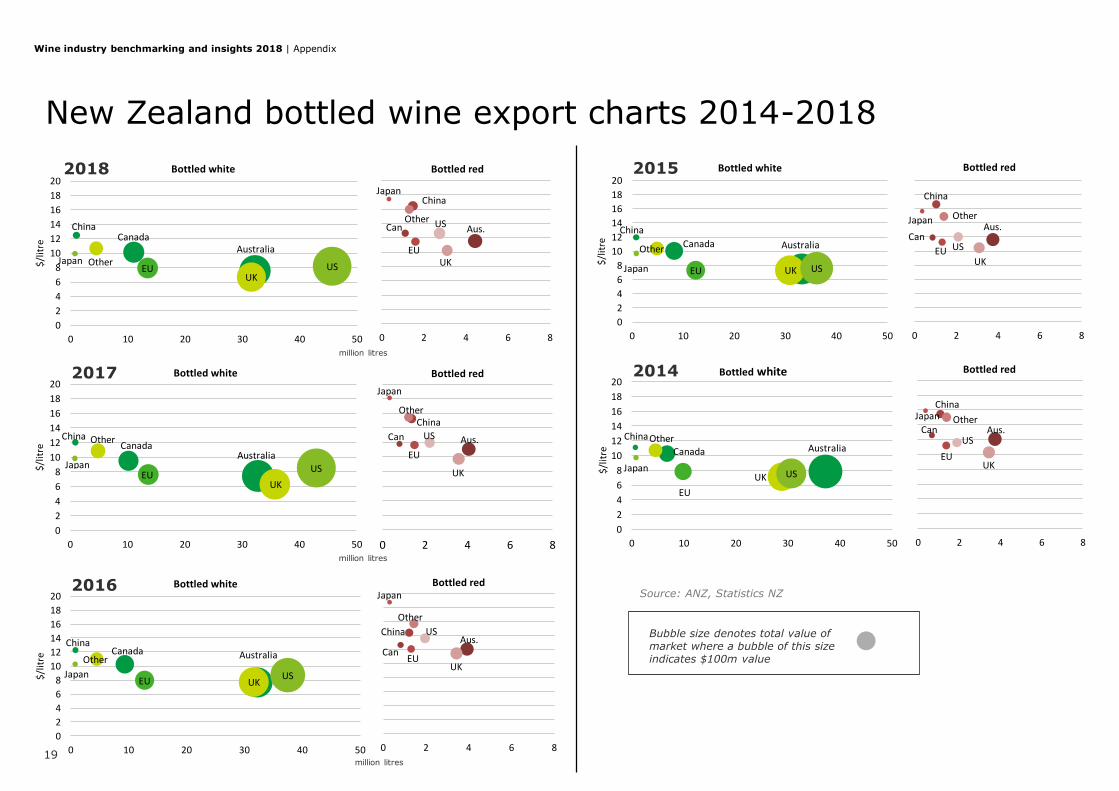
US remains most valuable market
Eighty percent of the wine exported
from NZ is bought by just three
markets: United States, UK, and
Australia. The US is second only to the
UK in terms of volume but with strong
bottled and bulk pricing it is the
number one market by value for New
Zealand wine. A review of the export
market for bottled wine exports (refer
to p.19, Appendix) reveals the
impressive growth story of the US
market. Undoubtedly further growth
opportunities exist in the US but there
are some question marks over
whether price points can be
maintained.
Asian markets deliver higher
returns
The price obtained for New Zealand
wine exported to the Asian markets of
China, Hong Kong, Singapore, and
Japan is twice the average export
price. These Asian markets account for
just 2.5% of NZ’s wine exports
indicating significant growth potential.
Other markets where returns are at
least 25% higher than average include
Canada, Norway and Finland.
Trade agreements bring
opportunity
With reduced tariffs brought about by
the CPTPP Canada (already our 4th
largest export market) and Japan
(10th) are shaping as top candidates
for growth opportunities.
Sauvignon dominates but other
varietals offer opportunities
Sauvignon Blanc remains the mainstay
amongst export markets (86% by
volume) which is unlikely to change
any time soon. That said, strong
growth in export volumes has been
recorded over the last five years with
two styles standing out - particularly
Pinot Gris and Rose.
Bottled wine export prices, volumes and values 2018
“Spreading our international sales across multiple markets and carefully managing key relationships allows us to grow sales profitably in a competitive environment. We are now planning for 3 – 5 years ahead on how to manage industry and operational pricing increases while lifting sales volumes.”
Daniel Nelson, Hãhã Wines Bubble size denotes total market value, where a bubble of this size indicates $100m value
Source: ANZ, StatisticsNZ
AustraliaCanada
China
EUJapan Other
UKUS
0
2
4
6
8
10
12
14
16
18
20
0 10 20 30 40 50
$/litre
Bottled white
Aus.Can
China
EU
Japan
Other
UK
US
0 2 4 6 8
Bottled red
million litres
Standing out in a crowded
marketplace
All wineries have a need to connect
directly with existing and potential
customers. Markets are crowded with
competition coming from other wine
growing regions as well as other luxury
beverages and consumables.
The majority of New Zealand’s wineries
produce less than 25,000 cases annually
with quite limited resources to support a
broad range of sales channels. Many of
these wineries are finding different and
relatively inexpensive ways to connect with
customers to drive patronage and
direct sales.
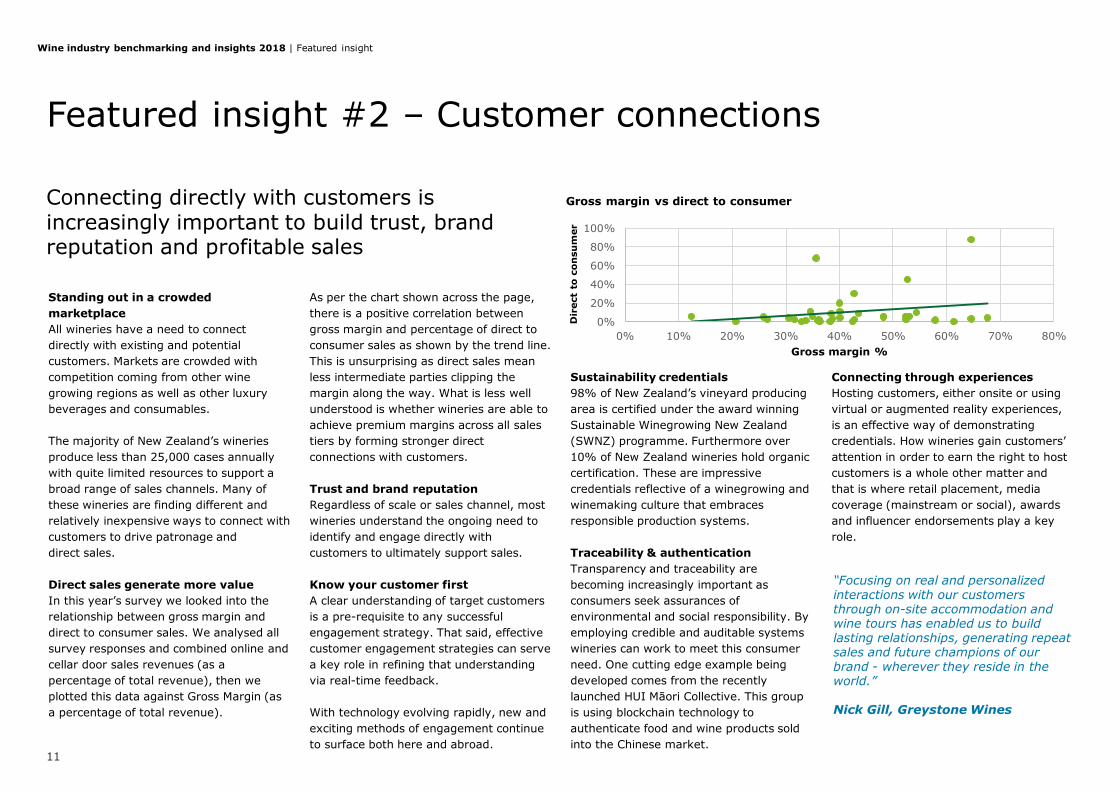
Direct sales generate more value
In this year’s survey we looked into the
relationship between gross margin and
direct to consumer sales. We analysed all
survey responses and combined online and
cellar door sales revenues (as a
percentage of total revenue), then we
plotted this data against Gross Margin (as
a percentage of total revenue).
As per the chart shown across the page,
there is a positive correlation between
gross margin and percentage of direct to
consumer sales as shown by the trend line.
This is unsurprising as direct sales mean
less intermediate parties clipping the
margin along the way. What is less well
understood is whether wineries are able to
achieve premium margins across all sales
tiers by forming stronger direct
connections with customers.
Trust and brand reputation
Regardless of scale or sales channel, most
wineries understand the ongoing need to
identify and engage directly with
customers to ultimately support sales.
Know your customer first
A clear understanding of target customers
is a pre-requisite to any successful
engagement strategy. That said, effective
customer engagement strategies can serve
a key role in refining that understanding
via real-time feedback.
With technology evolving rapidly, new and
exciting methods of engagement continue
to surface both here and abroad.
Sustainability credentials
98% of New Zealand’s vineyard producing
area is certified under the award winning
Sustainable Winegrowing New Zealand
(SWNZ) programme. Furthermore over
10% of New Zealand wineries hold organic
certification. These are impressive
credentials reflective of a winegrowing and
winemaking culture that embraces
responsible production systems.
Traceability & authentication
Transparency and traceability are
becoming increasingly important as
consumers seek assurances of
environmental and social responsibility. By
employing credible and auditable systems
wineries can work to meet this consumer
need. One cutting edge example being
developed comes from the recently
launched HUI Māori Collective. This group
is using blockchain technology to
authenticate food and wine products sold
into the Chinese market.
Connecting through experiences
Hosting customers, either onsite or using
virtual or augmented reality experiences,
is an effective way of demonstrating
credentials. How wineries gain customers’
attention in order to earn the right to host
customers is a whole other matter and
that is where retail placement, media
coverage (mainstream or social), awards
and influencer endorsements play a key
role.
Featured insight #2 – Customer connections
Connecting directly with customers is increasingly important to build trust, brand reputation and profitable sales
11
Wine industry benchmarking and insights 2018 | Featured insight
“Focusing on real and personalized interactions with our customers through on-site accommodation and wine tours has enabled us to build lasting relationships, generating repeat sales and future champions of our brand - wherever they reside in the world.”
Nick Gill, Greystone Wines
0%
20%
40%
60%
80%
100%
0% 10% 20% 30% 40% 50% 60% 70% 80%
Dir
ect
to c
on
su
mer
Gross margin %
Gross margin vs direct to consumer

All participants receive a customised benchmarking report,
comparing their own results to others of similar revenue size.
Deloitte has conducted this annual financial benchmarking Survey in conjunction with ANZ
Bank New Zealand Limited (ANZ) and New Zealand Winegrowers . The Survey was conducted
between September 2018 and December 2018 and is based upon the 2018 financial
statements. The Survey is designed to assist wine businesses by providing an insight into the
relative efficiency and financial performance of their business – information to aid decision-
making, to support and sustain growth, or assist capital raising initiatives.
Survey questionnaires were sent to all members of New Zealand Winegrowers. Comments
made in this report are based on the responses of 36 Survey participants, which account for
approximately 44% of the New Zealand wine industry by litres of wine produced and 35% by
export sales revenue generated for the 2018 year. Respondents either own or lease 39% of
the 37,969 producing hectares currently under vine in New Zealand. To assist the comparison
of different sized wineries, respondents have been categorised into five tiers based on total
annual revenue as follows:
• $0-$1.5m
• $1.5m-$5m
• $5m-$10m
• $10m-$20m
• $20m+
Participant information is treated with high confidentiality. The results are reported in
aggregate form with no disclosure of the names of the individual participants, nor how many
participants existed in each category. Where appropriate we have also commented on the
results. Though the Survey response level is reasonable this Survey cannot be considered
completely representative of the whole of the New Zealand wine industry. Care must
therefore be taken when analysing the state of the industry based on the information set out
in this Survey, although we believe it does provide an indication of industry performance and
trends. Figures presented have not been adjusted to eliminate rounding variances. The survey
is not advice. You should seek professional advice relevant to your individual circumstances.
New Zealand Wine Benchmarking Industry Report 2018 co-authors and contributors:
• Josh Hawkey, Rob Simcic, Susan Kilsby, Anteni Schalken, Murphy Turner, Philip Gregan,
Peter Felstead, Andrew Gibbs, John Bennett, Kyle Uerata, Briar McCormack.
About and further information
Wine Survey 2018
12
Wine industry benchmarking and insights 2018 | Further information
Deloitte New Zealand brings together more than 1300 specialist professionals providing audit, tax, technology and systems, strategy and performance
improvement, risk management, corporate finance, business recovery, forensic and accounting services.
Our dedicated professionals are passionate about the sector and enjoy
providing a range of services to wineries. We are proud to have been producing our annual wine industry financial benchmarking survey since 2005.
For more information about Deloitte in New Zealand, go to our website
www.deloitte.co.nz.
The leading teams in the business of wine
13
Wine industry benchmarking and insights 2018 | Further information
I provide tax planning and compliance advice to a wide range of
corporate clients. In particular I advise large exporters, including in the agri sector on international tax and supply chain
matters and have assisted non-residents with structuring their investments into New Zealand.
Peter Felstead
Managing PartnerTax & Private
I co-lead our Primary Industry team which is predominant
focussed on working with the sector to address their growth and regulatory challenges. I have wide experience in investigation,
project management and advisory work performed in connection with feasibility studies, business change and planning in the
public and private sectors.
Andrew GibbsHead of Primary Industries & Partner
Corporate Finance
ANZ is proudly New Zealand’s largest financial services provider, with almost
half of all New Zealanders having a banking relationship with us.
We have dedicated Wine Sector Specialist Relationship Managers located across the country. Our team aspires to make business easier for our winery
customers by providing access to knowledge, insights and connections.
For more information about ANZ, visit our website www.anz.co.nz and to learn
more about our insights visit ANZ Business Insights
I am responsible for the Central region of Commercial & Agri. I
have over 20 years’ banking experience in the UK and New Zealand across markets, trade and asset finance, Institutional,
Commercial and Agri banking. I am proud to have supported numerous wineries over the years with structured lending
solutions and value add connections.
John BennettGeneral Manager – Central Region
Commercial & Agri
I lead our Food & Beverage sector support strategy. I provide
insights and connect businesses through our regional, national and global network. I have over 15 years’ banking experience
supporting the agri-food sector and live on a small Sauvignon Blanc vineyard in Marlborough.
Rob Simcic
Head of Food & Beverage, Commercial & Agri

Appendix
14
Wine industry benchmarking and insights 2018 | Appendix

Profitability
15
Wine industry benchmarking and insights 2018 | Appendix
Consistent with last year we see
domestic sales featuring highest
and export sales featuring lowest
for the $0-1.5m tier at 58.1%
and 12.2% respectively. This is
expected as the domestic market
is a safer game for the smaller
operators due to the lower
distribution costs, shorter cash
cycles and no currency risks.
Similarly, we see export and
bulk sales featuring highly in the
larger tiers. With the domestic
market in New Zealand ranging
between $500-600 million and
wine exports exceeding $1.7
billion there is no surprise the
larger operators are tapping into
this larger international market.
Other revenue includes grape
sales, hospitality and ‘other’.
Combined, these occupy a
greater portion of smaller winery
tiers revenue than larger winery
tiers. This diversification of
revenue is unsurprising as
smaller wineries may look to
diversify with shorter cash cycle
revenue flows and supplement
their overall wine sales. While
the larger wineries generally run
a model focussed almost solely
on wine sales.
We normally expect to see cost
of goods sold (as a proportion of
sales) decrease with larger
operators in reflection of
economies of scale. This year we
note the $0-1.5m had the lowest
cost of goods sold percentage
which is a first for this survey
however we note that ‘other
expenses’ were significantly
higher for this tier which might
suggest variance in accounting
treatment of expenses.
Interest expense as a
percentage of sales has reduced
across all tiers against last year
reflective of the decreased levels
of long term debt reported and
the continued low interest rates
currently on offer.
Income statement 2018
$0-1.5m $1.5-5m $5-10m $10-20m $20m+ Total
Wine sales
Domestic wine sales 58.1% 43.2% 27.4% 39.2% 17.4% 20.4%
Export sales (own label) 12.2% 40.4% 48.9% 45.2% 61.6% 58.9%
Export sales (buyers label) 10.4% 1.4% 0.3% 3.6% 2.5% 2.4%
Bulk wine sales 3.2% 4.2% 10.4% 4.0% 16.0% 14.4%
Total wine sales 83.9% 89.2% 86.9% 92.0% 97.4% 96.1%
Other revenue
Other operating revenue 7.1% 5.0% 5.2% 3.0% 1.8% 2.2%
Grape sales 9.0% 5.6% 4.9% 0.7% 0.6% 1.0%
Hospitality revenue 0.0% 0.2% 3.0% 4.3% 0.2% 0.7%
Total revenue 100.0% 100.0% 100.0% 100.0% 100.0% 100.0%
Cost of sales
Less cost of goods sold 51.7% 55.8% 61.0% 60.1% 54.2% 55.1%
Gross profit 48.3% 44.2% 39.0% 39.9% 45.8% 44.9%
Other expenses
Sales and marketing 13.7% 19.0% 10.3% 10.7% 12.2% 12.1%
Other expenses 18.5% 15.6% 10.3% 12.1% 7.1% 7.9%
Total expenses 32.3% 34.6% 20.6% 22.8% 19.3% 20.0%
EBITDA 16.1% 9.6% 18.4% 17.1% 26.5% 24.9%
Net profit/(loss)
Less depreciation (4.5%) (5.6%) (1.4%) (2.7%) (4.6%) (4.2%)
Less interest expense (5.3%) (2.7%) (2.7%) (4.8%) (5.1%) (4.9%)
Other income 0.7% 0.4% 2.1% 2.3% 1.9% 1.9%
Profit before tax 7.0% 1.7% 16.4% 11.8% 18.7% 17.7%
Balance sheet
Wine industry benchmarking and insights 2018 | Appendix
16
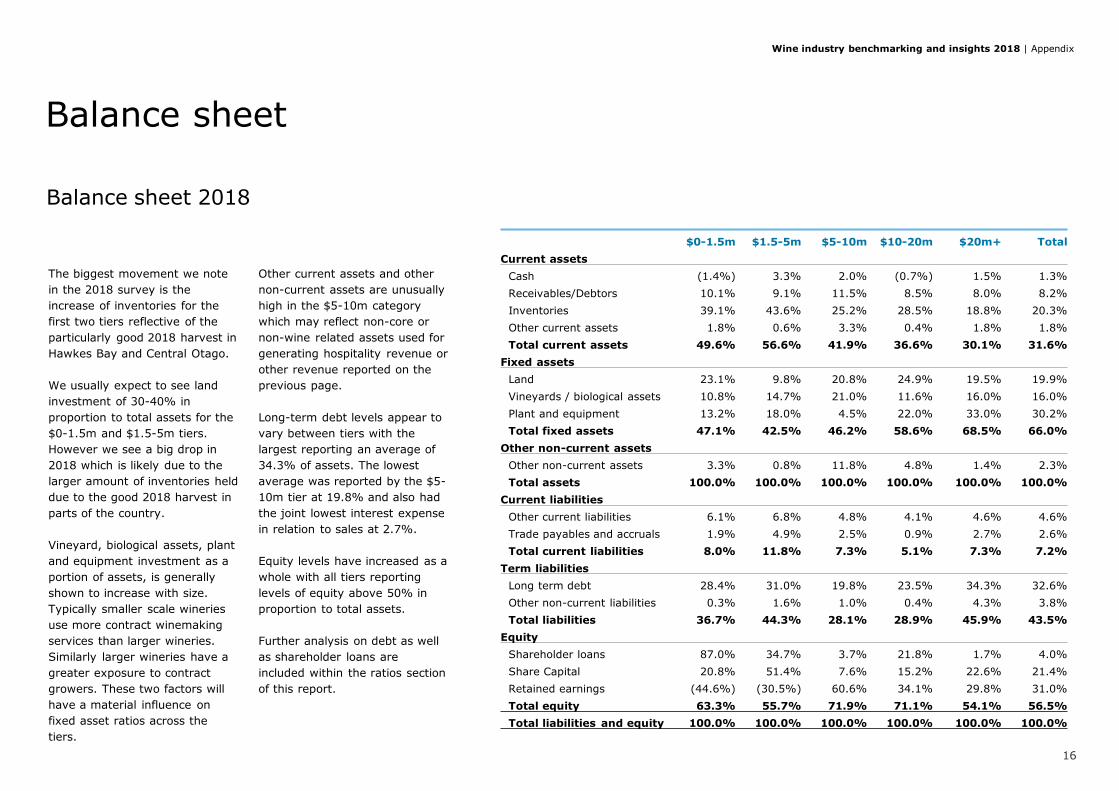
The biggest movement we note
in the 2018 survey is the
increase of inventories for the
first two tiers reflective of the
particularly good 2018 harvest in
Hawkes Bay and Central Otago.
We usually expect to see land
investment of 30-40% in
proportion to total assets for the
$0-1.5m and $1.5-5m tiers.
However we see a big drop in
2018 which is likely due to the
larger amount of inventories held
due to the good 2018 harvest in
parts of the country.
Vineyard, biological assets, plant
and equipment investment as a
portion of assets, is generally
shown to increase with size.
Typically smaller scale wineries
use more contract winemaking
services than larger wineries.
Similarly larger wineries have a
greater exposure to contract
growers. These two factors will
have a material influence on
fixed asset ratios across the
tiers.
Other current assets and other
non-current assets are unusually
high in the $5-10m category
which may reflect non-core or
non-wine related assets used for
generating hospitality revenue or
other revenue reported on the
previous page.
Long-term debt levels appear to
vary between tiers with the
largest reporting an average of
34.3% of assets. The lowest
average was reported by the $5-
10m tier at 19.8% and also had
the joint lowest interest expense
in relation to sales at 2.7%.
Equity levels have increased as a
whole with all tiers reporting
levels of equity above 50% in
proportion to total assets.
Further analysis on debt as well
as shareholder loans are
included within the ratios section
of this report.
Balance sheet 2018
$0-1.5m $1.5-5m $5-10m $10-20m $20m+ Total
Current assets
Cash (1.4%) 3.3% 2.0% (0.7%) 1.5% 1.3%
Receivables/Debtors 10.1% 9.1% 11.5% 8.5% 8.0% 8.2%
Inventories 39.1% 43.6% 25.2% 28.5% 18.8% 20.3%
Other current assets 1.8% 0.6% 3.3% 0.4% 1.8% 1.8%
Total current assets 49.6% 56.6% 41.9% 36.6% 30.1% 31.6%
Fixed assets
Land 23.1% 9.8% 20.8% 24.9% 19.5% 19.9%
Vineyards / biological assets 10.8% 14.7% 21.0% 11.6% 16.0% 16.0%
Plant and equipment 13.2% 18.0% 4.5% 22.0% 33.0% 30.2%
Total fixed assets 47.1% 42.5% 46.2% 58.6% 68.5% 66.0%
Other non-current assets
Other non-current assets 3.3% 0.8% 11.8% 4.8% 1.4% 2.3%
Total assets 100.0% 100.0% 100.0% 100.0% 100.0% 100.0%
Current liabilities
Other current liabilities 6.1% 6.8% 4.8% 4.1% 4.6% 4.6%
Trade payables and accruals 1.9% 4.9% 2.5% 0.9% 2.7% 2.6%
Total current liabilities 8.0% 11.8% 7.3% 5.1% 7.3% 7.2%
Term liabilities
Long term debt 28.4% 31.0% 19.8% 23.5% 34.3% 32.6%
Other non-current liabilities 0.3% 1.6% 1.0% 0.4% 4.3% 3.8%
Total liabilities 36.7% 44.3% 28.1% 28.9% 45.9% 43.5%
Equity
Shareholder loans 87.0% 34.7% 3.7% 21.8% 1.7% 4.0%
Share Capital 20.8% 51.4% 7.6% 15.2% 22.6% 21.4%
Retained earnings (44.6%) (30.5%) 60.6% 34.1% 29.8% 31.0%
Total equity 63.3% 55.7% 71.9% 71.1% 54.1% 56.5%
Total liabilities and equity 100.0% 100.0% 100.0% 100.0% 100.0% 100.0%

Ratios and returns
17
Wine industry benchmarking and insights 2018 | Appendix
Consistent with previous
surveys, average litres sold are
exponentially higher for the
larger tiers. We notice this year
that the litres sold for the $10-
20m category has almost halved
however this appears just due to
a mix of participants given that
gross margin per litre is mostly
in line with previous years’
results for this category.
Revenue per litre for labelled
wine continues to indicate that
larger participants experience
lower selling prices than
smaller-sized participants.This
will be due to a range of factors
including how sales are made up
in terms of varietal, sales
channel, and export volumes in
terms of bulk and packaged
format.
The current ratios for all tiers
have improved against last year
reflective of the strong balance
sheet positions this year. This
indicates a strong ability to pay
debts as they fall due. A current
ratio of 6.2x means that the $0-
1.5m category has $6.20 of
current assets to repay every $1
of current liabilities. This does
assume that inventory is 100%
saleable and we did note the
balance sheets showing the $0-
1.5m category with increased
levels of inventory for 2018.
Inventory turnover is calculated
as the cost of goods sold divided
by the closing inventory figure
on the balance sheet. An
inventory turnover level of less
than one shows increasing
inventory levels. Wineries would
be expected to have a turnover
of less than one during periods
of increased production or
supply as wine stock is held over
to drive sales growth for the
future.
Ratios and returns
$0-1.5m $1.5-5m $5-10m $10-20m $20m+ Total
Litres
Litres sold 63,137 183,315 655,751 1,097,114 13,085,911 3,657,604
Revenues and expenses per L
Revenue per L (labelled) $15.27 $15.93 $12.17 $11.73 $7.68 $8.19
Revenue per L (bulk) $3.26 $4.42 $3.76 $3.72 $4.68 $4.60
Revenue per L (total) $13.41 $14.20 $9.61 $10.72 $6.95 $7.33
Gross margin per L $7.73 $7.05 $4.31 $4.65 $3.27 $3.43
Profit / (loss) per L $1.11 $0.27 $1.81 $1.38 $1.33 $1.35
Sales expenses per L $2.20 $3.03 $1.14 $1.25 $0.87 $0.92
Other expenses per L $2.96 $2.49 $1.14 $1.41 $0.51 $0.60
Solvency ratios
Current ratio 6.2x 4.8x 5.7x 7.2x 4.1x 4.4x
Debtors to sales ratio 0.2x 0.2x 0.3x 0.2x 0.2x 0.2x
Interest cover ratio 2.2x 1.5x 6.3x 3.0x 4.3x 4.2x
Efficiency ratios
Inventory turnover 0.7x 0.8x 1.0x 0.9x 1.1x 1.1x
Fixed asset turnover 1.1x 1.4x 0.9x 0.7x 0.6x 0.6x
Asset turnover 0.5x 0.6x 0.4x 0.4x 0.4x 0.4x
Profitability ratios
EBIT margin 11.5% 4.1% 17.0% 14.3% 22.0% 20.7%
EBIT to assets 5.7% 2.4% 7.0% 6.0% 8.4% 8.1%
EBT to equity 5.5% 1.8% 9.4% 6.9% 13.3% 12.3%
EBT to net wine sales 8.3% 1.9% 18.9% 12.8% 19.2% 18.4%

Conversations with wine businesses
are often focused on the topic of
distribution channels. It is the means
by which product is sold as well as a
key determinant of both profit
margins and trade terms (with
varying distributor margins, trade
terms and customer markets).
As expected supermarkets and other
retail represent the majority of the
$20m+ category as this is the
biggest market but it is interesting to
see the largest proportion for the
$1.5-5m and $5-10m to come
through the ‘other / on premise’
channel reflective of the higher
revenue per litre in these tiers.
We note for the first time that online
sales have overtaken cellar door
sales with the exception of the $1.5-
5m category reflecting the growth of
digital as a legitimate sales channel.
It is also interesting to note that
100% of respondents in the $0-
$1.5m and $1.5-5m categories had
at least some direct to consumer
sales, either by cellar door or online.
Overall across the survey, 86% of
respondents made direct to
consumer sales showing the
importance of connecting directly
with customers to build their brand.
Distribution channels
18
Wine industry benchmarking and insights 2018 | Appendix
46.8%
34.7%
21.7%
41.1%
67.9%
21.6% 46.6%
45.4%
32.2%
6.7%
17.6%
10.6%
20.0%11.0%
22.8%
10.8%3.4%
11.0%9.9%
2.0%3.2% 4.7% 3.0%5.9%
0.7%
0%
10%
20%
30%
40%
50%
60%
70%
80%
90%
100%
$0-1.5m $1.5-5m $5-10m $10-20m $20m+
Method of distribution
Supermarkets and other retail Other (including on-premise)
Liquor specialists E-commerce / Online
Cellar door
Online sales overtake cellar door sales for the first time
AustraliaCanadaChina
EUJapan
Other
UKUS
0
2
4
6
8
10
12
14
16
18
20
0 10 20 30 40 50
$/litre
Bottled white
Aus.Can
China
EU
Japan
Other
UK
US
0 2 4 6 8
Bottled red
AustraliaCanada
China
EUJapan Other
UKUS
0
2
4
6
8
10
12
14
16
18
20
0 10 20 30 40 50
$/litre
Bottled white
Aus.Can
China
EU
Japan
Other
UK
US
0 2 4 6 8
Bottled red
Aus.Can
China
EU
Japan
Other
UK
US
0 2 4 6 8
Bottled red
AustraliaCanada
China
EUJapan
Other
UK
US
0
2
4
6
8
10
12
14
16
18
20
0 10 20 30 40 50
$/litre
Bottled white
Aus.Can
China
EU
Japan Other
UK
US
0 2 4 6 8
Bottled red
AustraliaCanada
China
EUJapan
Other
UK US
0
2
4
6
8
10
12
14
16
18
20
0 10 20 30 40 50
$/litre
Bottled white
Aus.Can
China
EU
Japan Other
UK
US
0 2 4 6 8
Bottled red
AustraliaCanada
China
EU
Japan
Other
UK US
0
2
4
6
8
10
12
14
16
18
20
0 10 20 30 40 50
$/litre
Bottled white
New Zealand bottled wine export charts 2014-2018
19
2015
2014
Bubble size denotes total value of market where a bubble of this size indicates $100m value
Wine industry benchmarking and insights 2018 | Appendix
2017
2016
2018
Source: ANZ, Statistics NZ
million litres
million litres
million litres
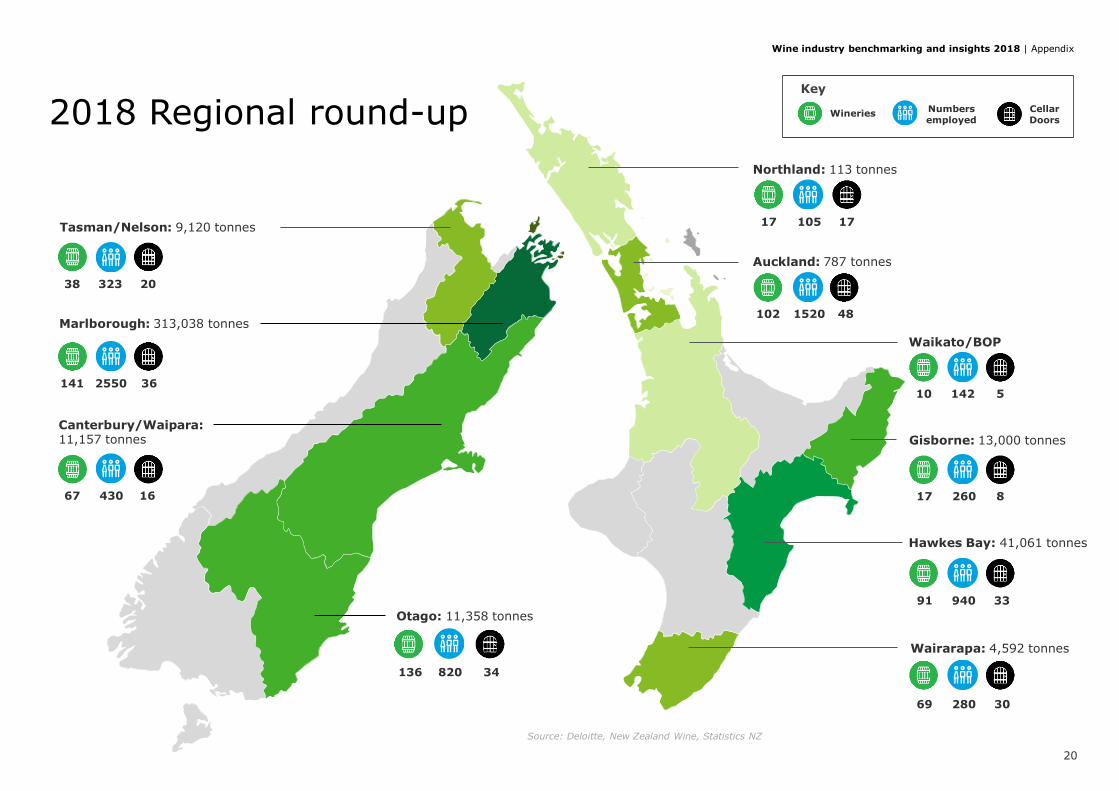
2018 Regional round-up
Source: Deloitte, New Zealand Wine, Statistics NZ
Key
Numbersemployed
Cellar Doors
Northland: 113 tonnes
Auckland: 787 tonnes
Gisborne: 13,000 tonnes
Hawkes Bay: 41,061 tonnes
Wairarapa: 4,592 tonnes
Waikato/BOP
17 105 17
Wineries
102 1520 48
17 260 8
91 940 33
69 280 30
10 142 5
Canterbury/Waipara:11,157 tonnes
Otago: 11,358 tonnes
Tasman/Nelson: 9,120 tonnes
Marlborough: 313,038 tonnes
38 323 20
141 2550 36
67 430 16
136 820 34
20
Wine industry benchmarking and insights 2018 | Appendix


Deloitte refers to one or more of Deloitte Touche Tohmatsu Limited (“DTTL”), its global network of member firms, and their related entities. DTTL (also referred to as “Deloitte Global”) and each of its member firms are legally separate and independent entities. DTTL does not provide services to clients. Please see www.deloitte.com/about to learn more.
Deloitte is a leading global provider of audit and assurance, consulting, financial advisory, risk advisory, tax and related services. Our network of member firms in more than 150 countries and territories serves four out of five Fortune Global 500® companies. Learn how Deloitte’s approximately 286,000 people make an impact that matters at www.deloitte.com.
Deloitte New Zealand brings together more than 1300 specialist professionals providing audit, tax, technology and systems, strategy and performance improvement, risk management, corporate finance, business recovery, forensic and accounting services. Our people are based in Auckland, Hamilton, Rotorua, Wellington, Christchurch, Queenstown and Dunedin, serving clients that range from New Zealand’s largest companies and public sector organisations to smaller businesses with ambition to grow. For more information about Deloitte in New Zealand, look to our website www.deloitte.co.nz.
This communication contains general information only, and none of Deloitte Touche Tohmatsu Limited, its member firms, or their related entities (collectively, the “Deloitte Network”) is, by means of this communication, rendering professional advice or services. Before making any decision or taking any action that may affect your finances or your business, you should consult a qualified professional adviser. No entity in the Deloitte Network shall be responsible for any loss whatsoever sustained by any person who relies on this communication.
© 2019. For information, contact Deloitte Touche Tohmatsu Limited.
ANZ Bank New Zealand Limited Disclaimer
This document has been prepared by ANZ Bank New Zealand Limited for informational purposes only. It is a necessarily brief and general summary of the subjects covered and does not constitute advice. You should seek professional advice relevant to your individual circumstances.
While the information contained in this document is from sources perceived by ANZ to be reliable and accurate, ANZ cannot warrant its accuracy, completeness or suitability for intended use. ANZ shall not be obliged to update any such information after the date of this document.
To the extent permitted by law, neither ANZ nor any other person involved in the preparation of this document accepts any responsibility or liability for any opinions or information (including the accuracy or completeness thereof) contained in it, or for any consequences flowing from its use.