Substations August 19-21, 2015 Minneapolis, MN 2015 Transmission & Distribution Benchmarking...
44
Substations August 19-21, 2015 Minneapolis, MN 2015 Transmission & Distribution Benchmarking Community Insights Conference
-
Upload
loreen-kelly -
Category
Documents
-
view
214 -
download
0
Transcript of Substations August 19-21, 2015 Minneapolis, MN 2015 Transmission & Distribution Benchmarking...
Substations
August 19-21, 2015
Minneapolis, MN
2015 Transmission & Distribution BenchmarkingCommunity Insights Conference

2
Agenda - Substations
◼ Overview
◼ Performance Results Profiles and Trends Financial Performance Measures
◼ Process Model – Context
◼ Practices
3
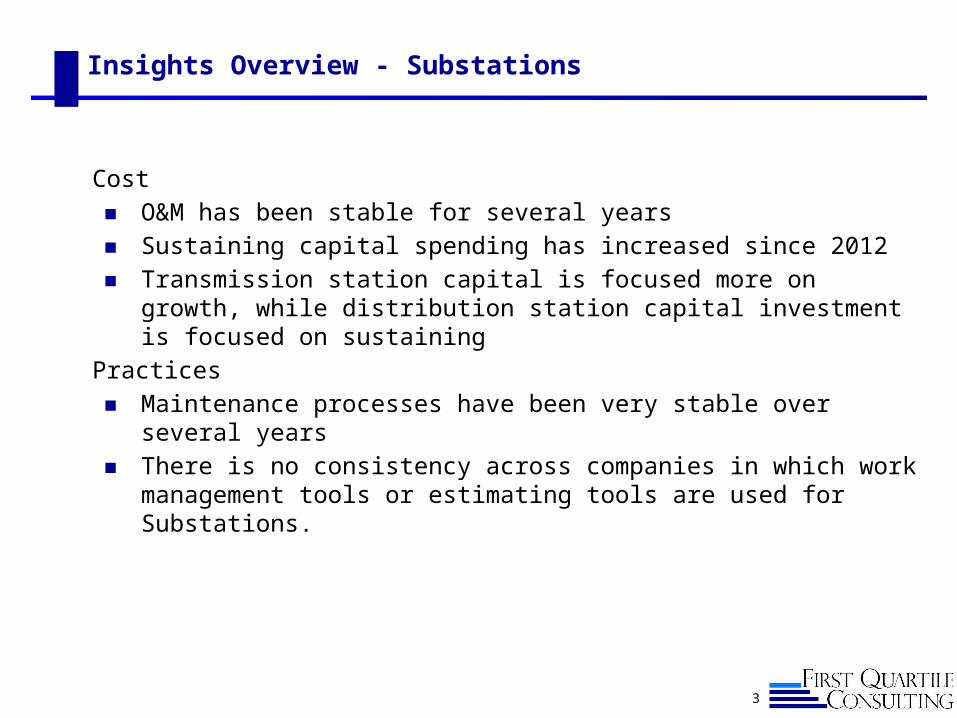
Insights Overview - Substations
Cost◼ O&M has been stable for several years◼ Sustaining capital spending has increased since 2012◼ Transmission station capital is focused more on growth, while distribution
station capital investment is focused on sustaining
Practices◼ Maintenance processes have been very stable over several years◼ There is no consistency across companies in which work management
tools or estimating tools are used for Substations.

2014YE 2013YE
Min Mean Max
# of Bars Min Mean Max
# of Bars
Organizational DemographicsWage Rate: Substation Journey Level Electrician $31.93 $39.40 $46.38 13 $33.24 $38.21 $41.97 12Substation Staffing: FTEs per $100M Substation Assets 8.41 13.17 18.95 10 8.46 15.83 32.94 13Demographics: DistributionDistribution Substations per 100 Distribution structure mile 0.65 1.62 2.52 9 0.64 2.16 3.86 7Distribution Substations Transformer Banks by Voltage Level• 5kV class = >1kV, <=9kV 0.0% 18.6% 76.2% 16 0.0% 22.7% 76.2% 15• 15kV class = >9kV, <=15kV 16.9% 66.9% 98.9% 16 16.9% 64.3% 99.1% 15• 25kV class = >15kV to <=26kV 0.0% 8.0% 61.7% 16 0.0% 6.1% 60.4% 15• 35kV class = >26kV to <=36kV 0.0% 6.5% 29.3% 16 0.0% 6.5% 27.3% 15• 44kV class = >36kV to <=44kV 0.0% 0.0% 0.0% 16 0.0% 0.5% 6.5% 15Installed MVA Capacity per 1000 Customers: Distribution 3.67 10.90 15.53 14 10.06 17.40 63.24 13Average Substation Transformer Loading: Distribution 45% 59% 106% 11 28% 52% 91% 11Percent of Switches outside the substation remotely operated 0% 20% 74% 9 0% 11% 62% 11Financial - DemographicsDistribution Substation Assets per MVA $27,160 $54,558 $130,516 12 $7,902 $35,687 $60,146 13
Distribution Substation demographics
4
Basic system demographics are stable for individual companies. Changes are driven mostly by modifications of the community.
2014YE 2013YE
Min Mean Max
# of Bars Min Mean Max
# of Bars
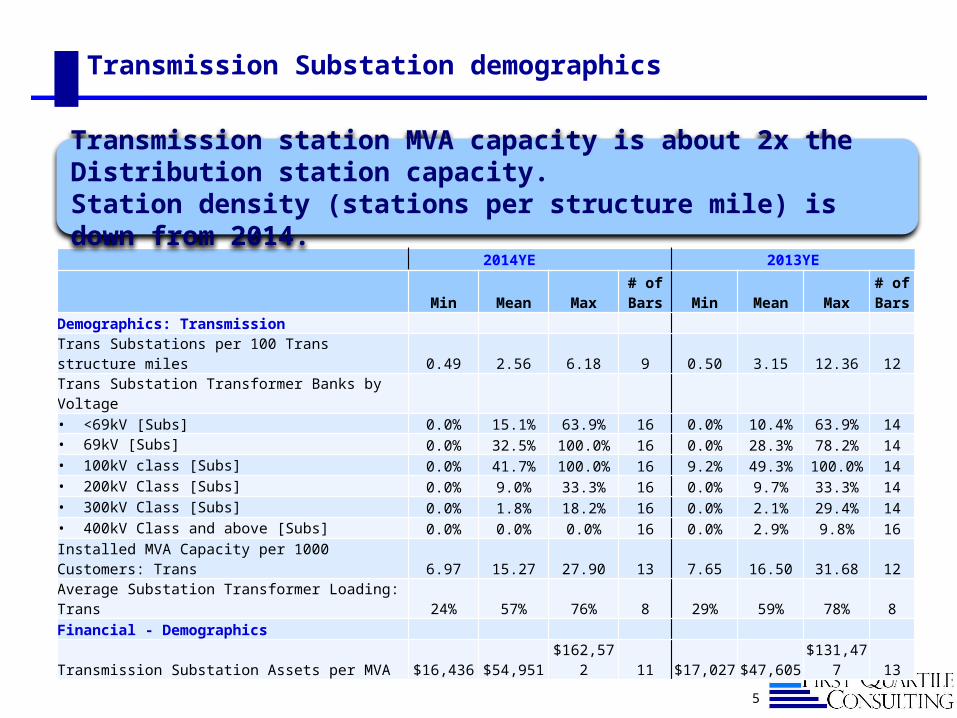
Demographics: Transmission
Trans Substations per 100 Trans structure miles 0.49 2.56 6.18 9 0.50 3.15 12.36 12
Trans Substation Transformer Banks by Voltage
• <69kV [Subs] 0.0% 15.1% 63.9% 16 0.0% 10.4% 63.9% 14• 69kV [Subs] 0.0% 32.5% 100.0% 16 0.0% 28.3% 78.2% 14• 100kV class [Subs] 0.0% 41.7% 100.0% 16 9.2% 49.3% 100.0% 14• 200kV Class [Subs] 0.0% 9.0% 33.3% 16 0.0% 9.7% 33.3% 14• 300kV Class [Subs] 0.0% 1.8% 18.2% 16 0.0% 2.1% 29.4% 14• 400kV Class and above [Subs] 0.0% 0.0% 0.0% 16 0.0% 2.9% 9.8% 16
Installed MVA Capacity per 1000 Customers: Trans 6.97 15.27 27.90 13 7.65 16.50 31.68 12
Average Substation Transformer Loading: Trans 24% 57% 76% 8 29% 59% 78% 8
Financial - Demographics
Transmission Substation Assets per MVA $16,436 $54,951 $162,572 11 $17,027 $47,605 $131,477 13
Transmission Substation demographics
5
Transmission station MVA capacity is about 2x the Distribution station capacity. Station density (stations per structure mile) is down from 2014.

Substation Cost Profile
6
2014YE 2013YE Mean Q1 Q2 Q3 Bars Mean Q1 Q2 Q3 Bars
O&M T&D Substation O&M per Customer $14.09 $12.68 $13.21 $15.90 13 $12.13 $7.94 $12.66 $14.00 13Distribution Substation O&M per Customer $29.29 $4.63 $6.99 $9.41 16 $53.27 $3.39 $5.99 $14.27 16T&D Substation O&M per Installed MVA $639 $392 $510 $656 11 $502 $243 $380 $511 11Transmission Substations O&M per Installed MVA $414 $295 $363 $514 11 $428 $239 $379 $595 11Distribution Substations O&M per Installed MVA $819 $365 $529 $1,152 12 $509 $246 $369 $490 12T&D Substation O&M per Total T&D Substation Assets 1.24% 0.95% 1.07% 1.44% 12 1.17% 0.96% 1.11% 1.46% 12Transmission Subs O&M Expense per Trans Sub Asset 1.22% 0.61% 0.90% 1.13% 13 0.95% 0.58% 0.96% 1.26% 13Distribution Subs O&M Expense per Dist Sub Asset 1.41% 1.02% 1.30% 1.77% 13 1.45% 0.74% 1.29% 2.24% 13Capital T&D Subs Capital Additions per Asset [FERC] 7.39% 9.88% 7.47% 4.14% 12 5.23% 5.41% 4.89% 4.66% 12
Dist Subs Capital Additions per Asset [FERC] 5.02% 6.69% 5.91% 2.87% 14 4.44% 5.19% 3.62% 2.92% 14Trans Subs Capital Additions per Asset [FERC] 9.13% 12.82% 7.99% 6.19% 13 7.32% 13T&D Subs Capital Spending less Serve New, Expand per Asset [Activity Based]
3.03% 4.17% 3.07% 1.91% 11 3.01% 4.23% 2.53% 1.83% 11
Dist Subs Capital Spending less Serve New, Expand per Asset [Activity Based]
3.49% 4.22% 3.24% 1.73% 13 3.40% 4.51% 2.88% 2.24% 13
Trans Subs Capital Spending less Serve New, Expand per Asset [Activity Based]
2.81% 4.09% 2.73% 1.74% 12 3.13% 12
Per-Asset O&M spending is almost unchanged from last year.Median replacement capital investment is up 20% from last year.
Profile values and counts may differ from report values and counts due to the exclusion of companies who did not provide complete data sets.
7
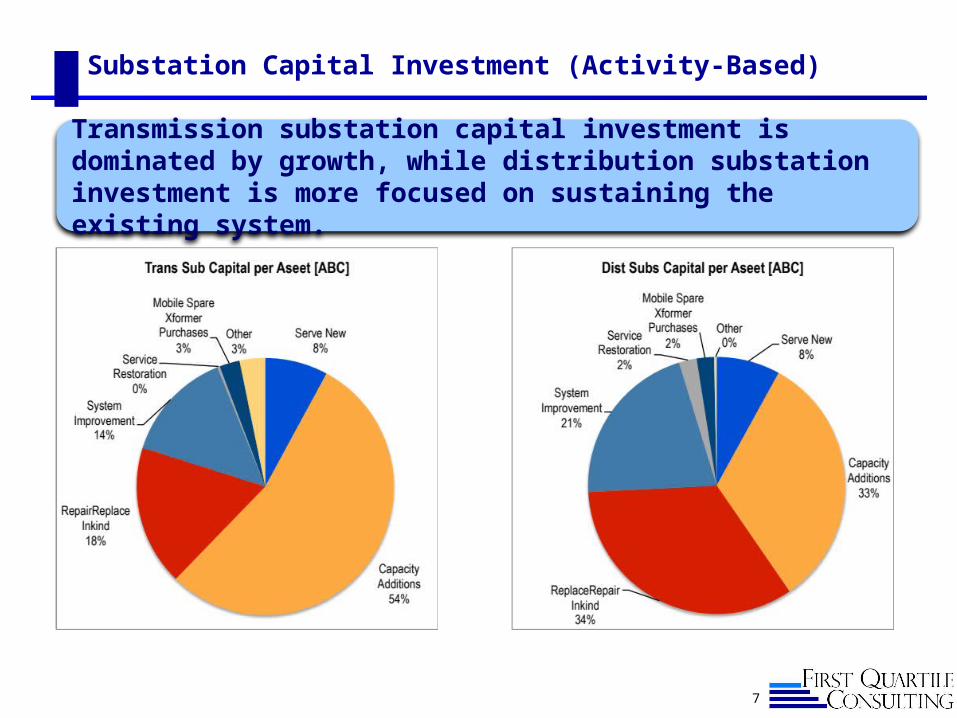
Substation Capital Investment (Activity-Based)
Transmission substation capital investment is dominated by growth, while distribution substation investment is more focused on sustaining the existing system.

8
Substation O&M Spending (Activity-Based)
Distribution spending has a much greater focus on service restoration and “other” than is true for transmission.
9
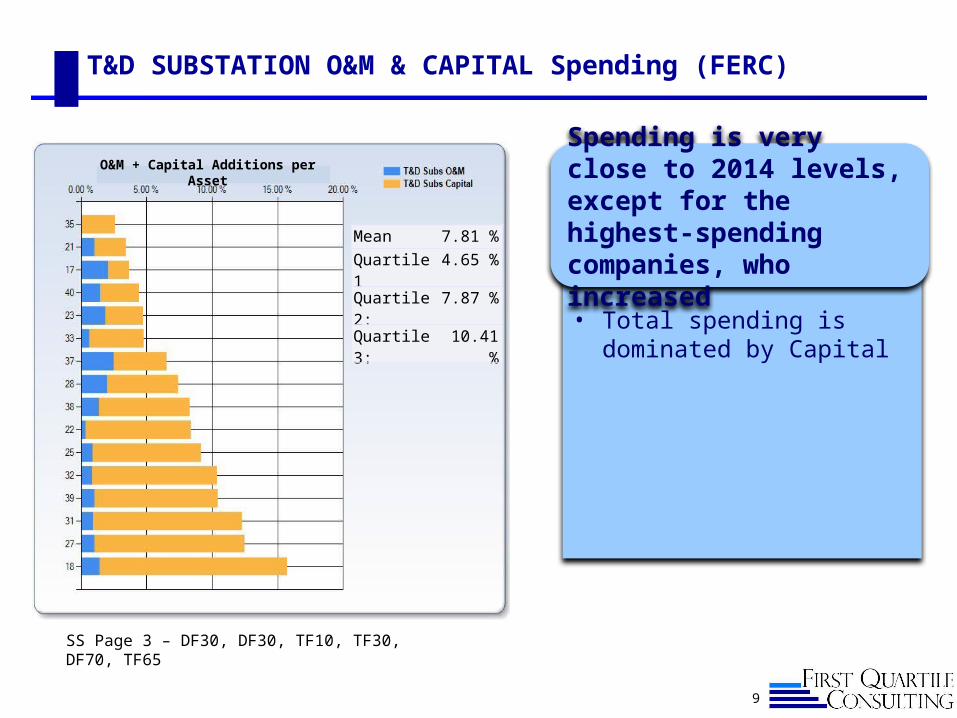
T&D SUBSTATION O&M & CAPITAL Spending (FERC)
• Total spending is dominated by Capital
Spending is very close to 2014 levels, except for the highest-spending companies, who increased
SS Page 3 – DF30, DF30, TF10, TF30, DF70, TF65
Mean 7.81 %
Quartile 1 4.65 %
Quartile 2: 7.87 %
Quartile 3: 10.41 %
O&M + Capital Additions per Asset
10
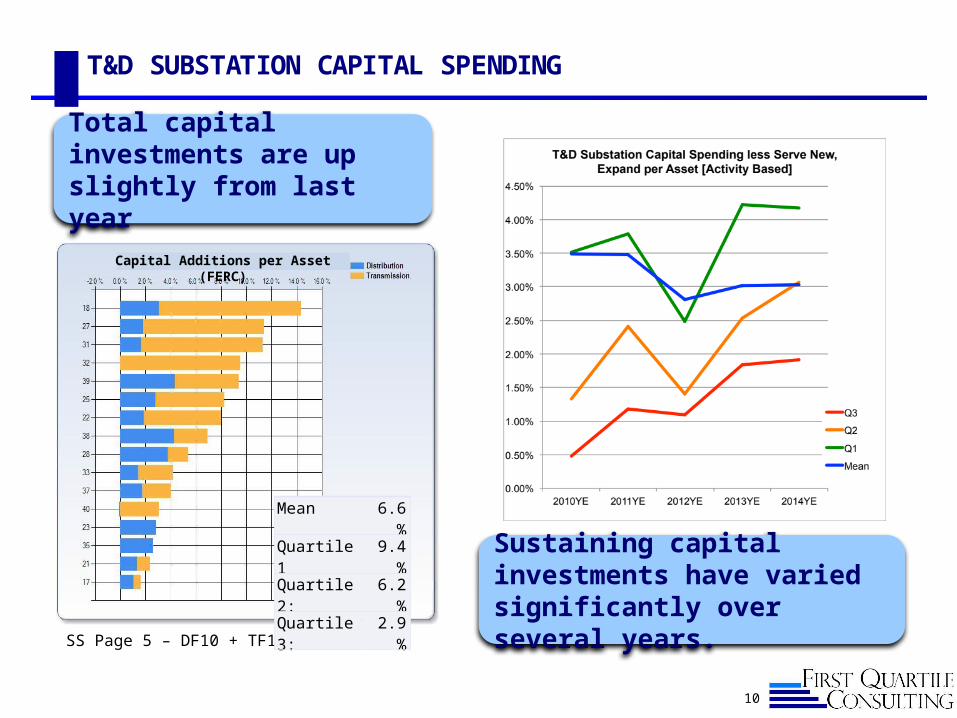
T&D SUBSTATION CAPITAL SPENDING
Total capital investments are up slightly from last year
SS Page 5 – DF10 + TF10 / DF70, TF65
Mean 6.6 %
Quartile 1 9.4 %
Quartile 2: 6.2 %
Quartile 3: 2.9 %
Capital Additions per Asset (FERC)
Sustaining capital investments have varied significantly over several years.

11
T&D SUBSTATION O&M EXPENSE [FERC]
O&M spending has been stable for several years
SS Page 7 – DF30 TF 30
Mean 1.314 %
Quartile 1 0.925 %
Quartile 2: 1.068 %
Quartile 3: 1.685 %
O&M per Asset
12
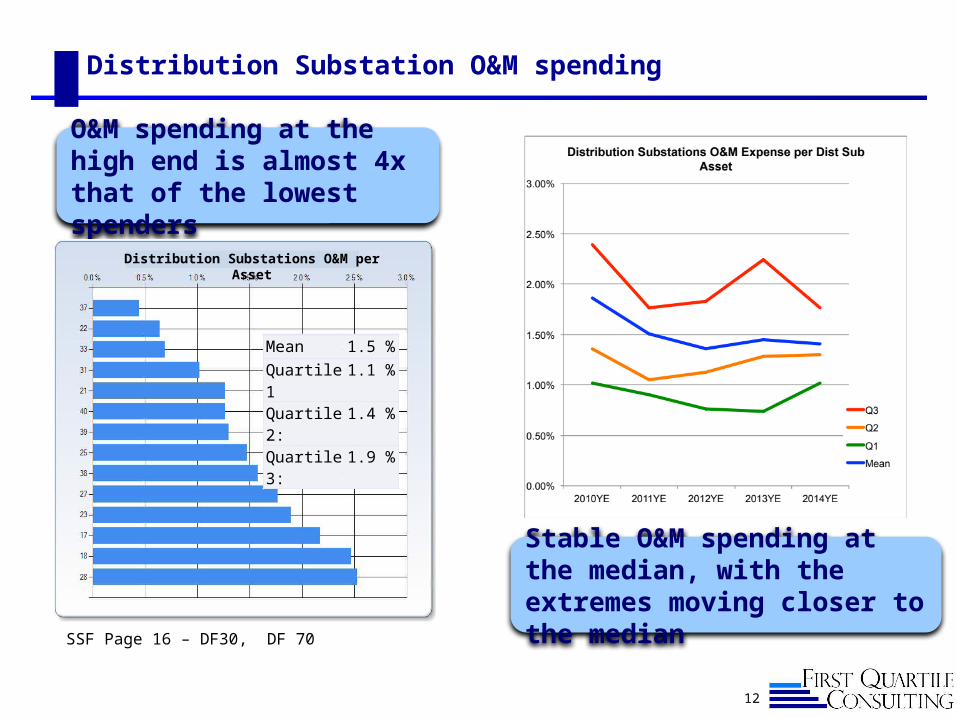
Distribution Substation O&M spending
Stable O&M spending at the median, with the extremes moving closer to the median
O&M spending at the high end is almost 4x that of the lowest spenders
Mean 1.5 %
Quartile 1 1.1 %
Quartile 2: 1.4 %
Quartile 3: 1.9 %
SSF Page 16 – DF30, DF 70
Distribution Substations O&M per Asset
13
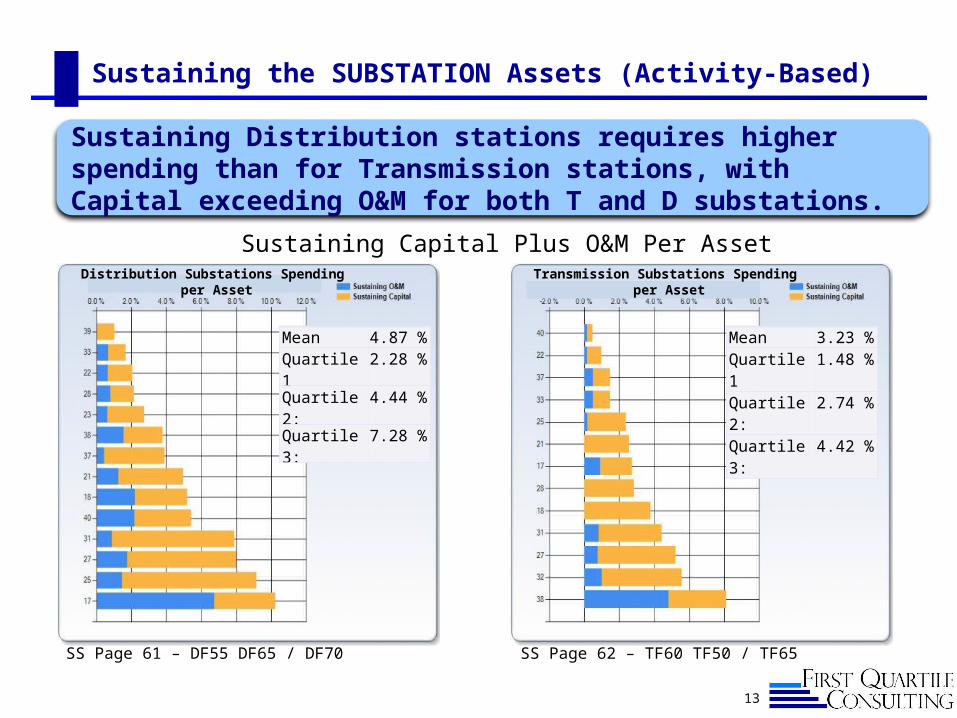
Sustaining the SUBSTATION Assets (Activity-Based)
Sustaining Distribution stations requires higher spending than for Transmission stations, with Capital exceeding O&M for both T and D substations.
Mean 3.23 %Quartile 1 1.48 %Quartile 2: 2.74 %Quartile 3: 4.42 %
SS Page 61 – DF55 DF65 / DF70 SS Page 62 – TF60 TF50 / TF65
Mean 4.87 %Quartile 1 2.28 %Quartile 2: 4.44 %Quartile 3: 7.28 %
Distribution Substations Spending per Asset Transmission Substations Spending per Asset
Sustaining Capital Plus O&M Per Asset

14
Distribution Substation Capital Investment
Sustaining capital is increasing for D Substations.
Total capital investment is significantly higher for D substations.
SSF Page 15 – DF10, DF 70
Mean 4.84 %
Quartile 1 6.64 %
Quartile 2: 5.41 %
Quartile 3: 2.72 %
Distribution Subs - Total Capital per Asset
15
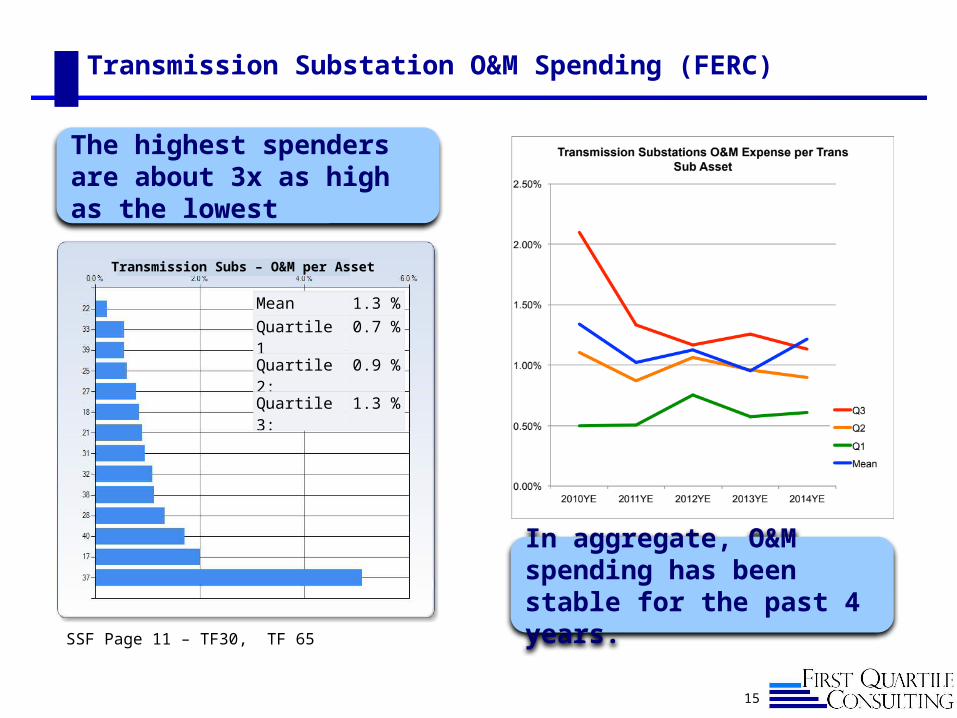
Transmission Substation O&M Spending (FERC)
In aggregate, O&M spending has been stable for the past 4 years.
The highest spenders are about 3x as high as the lowest
SSF Page 11 – TF30, TF 65
Mean 1.3 %
Quartile 1 0.7 %
Quartile 2: 0.9 %
Quartile 3: 1.3 %
Transmission Subs – O&M per Asset
16
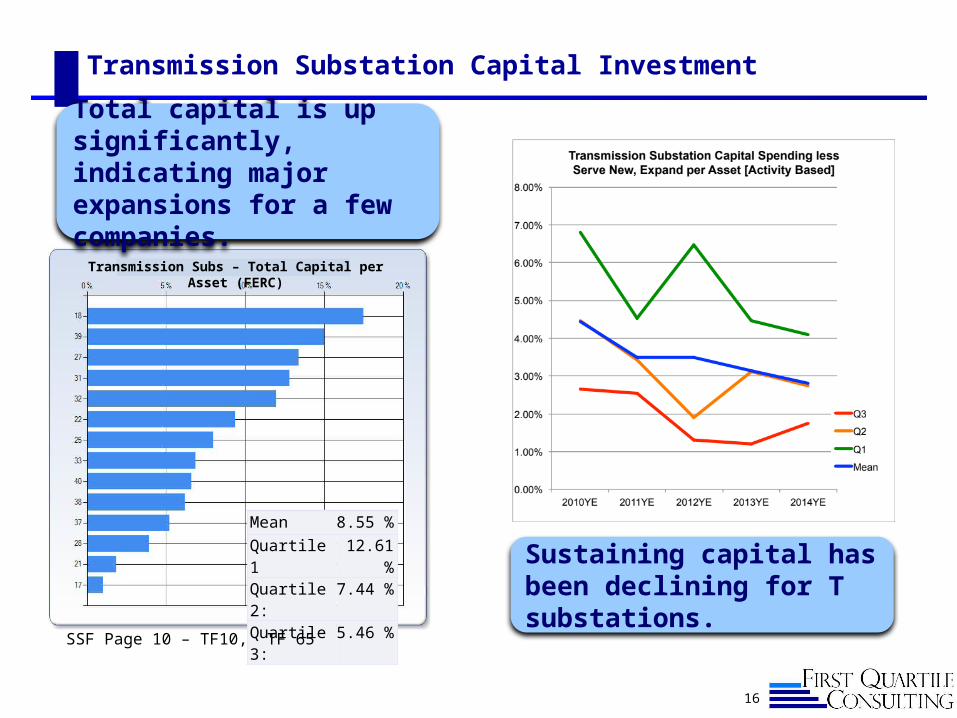
Transmission Substation Capital Investment
Mean 8.55 %
Quartile 1 12.61 %
Quartile 2: 7.44 %
Quartile 3: 5.46 %
Total capital is up significantly, indicating major expansions for a few companies.
SSF Page 10 – TF10, TF 65
Transmission Subs – Total Capital per Asset (FERC)
Sustaining capital has been declining for T substations.

17
DISTRIBUTION SUBSTATION SUSTAINING CAPITAL SPENDING VERSUS DEPRECIATION EXPENSE [ACTIVITY-BASED]
• Indicates that on average, companies are reinvesting enough to replace the aging assets.
Median Sustaining Capital spending is just over the depreciation expense
SS Page 24 – DF30 / DF80
Mean $1.70Quartile 1 $2.02Quartile 2: $1.13Quartile 3: $0.69
Spending per Depreciation Expense
18
Substation Practices

Develop System Strategy
Develop and Approve Asset Plans
Project/Portfolio Management
Expand System
A Process Model for Managing the T&D Business
19
Operate System
Sustain System
Indicates separate D, S, T components
Add New Customers
Respond to Emergencies
The Practice Modules that we will be discussing today fall within the Expand System and Sustain System processes

20
Scope of 2015 Questions – Substation Practices
Expand System◼ Planning, Engineering, and Design◼ Serve New◼ Construction Contractor Management
Sustain System◼ Maintain System
During 2015 we went back and expanded some areas of inquiry that hadn’t been covered in depth in the past couple of years.
21
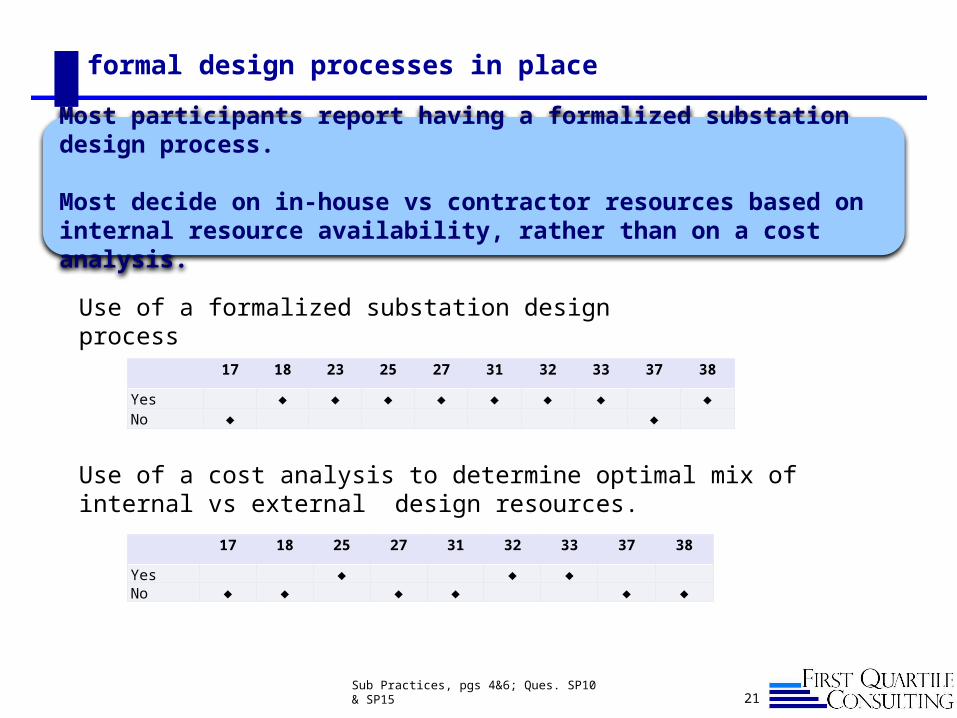
formal design processes in place
Most participants report having a formalized substation design process.
Most decide on in-house vs contractor resources based on internal resource availability, rather than on a cost analysis.
17 18 23 25 27 31 32 33 37 38
Yes ♦ ♦ ♦ ♦ ♦ ♦ ♦ ♦No ♦ ♦
Sub Practices, pgs 4&6; Ques. SP10 & SP15
17 18 25 27 31 32 33 37 38
Yes ♦ ♦ ♦No ♦ ♦ ♦ ♦ ♦ ♦
Use of a formalized substation design process
Use of a cost analysis to determine optimal mix of internal vs external design resources.

22
substation Project estimating
Most companies use Excel-based in-house estimating tools
All responding companies noted that Construction is involved at some point of the job estimating process.
Company Response
38 Prior to project start
32 as required based on complexity of project
23 During the second phase of estimate development
31 Construction is involved in reviewing the CMH for the substation projects coming up within the next two years. They review the scopes documents for the project and estimate Construction is involved in reviewing the CMH for the substation projects coming up within the next two years. They review the scopes documents for the project and estimate
17 The Design and Construction group are always involved in developing and reviewing job estimates, from the beginning of the project. Construction goes on the initial site visits, participates in scoping and peer review meetings, and provides input on the construction schedule.
Tools used in the estimating process Excel - 5 SAP - 1 Internal proprietary - 1
Sub Practices, pgs 8 & 9, Ques. SP20 & SP 25
Example responses – Construction involvement

23
Improving the Design-to-Delivery process
Broad-scale process improvement
32 streamlined the process flow
27 Creation and improvement in many internal substation design processes
31We have documented job roles and responsibilities for the Project Engineer, Project Manager, and Construction Manager. This was done to clarify roles in order to help the process. A flowchart/design process was also created to assist with this.
18Improved reference documentation including 'Anatomy of Design Process' and standard RFP documents
17We have recently implemented more formal project management practices and our capital management process.
Technology Application
38 Developed a custom application in SAP to track projects
25Leveraged the resource loading functionality of Primavera in planning our engineering work. Developed a 5 year resource view by engineering discipline.
Sub Practices, pg 11; ques. SP35
Improvement Initiatives focus on overall process redesign, resource management, and technology applications

24
Engineering & design performance Measurement
Schedule Adherence and Design Quality are the key metrics used to track success in Engineering/Design.
Measure # of Responses Companies
Schedule adherence 6 32, 27, 33, 18, 31, 25
Design quality 4 27, 37, 25, 18
Budget/Cost 2 32, 33
Stakeholder feedback 2 33, 17
SAP custom application 1 38
Sub Practices; pg 12; ques. SP40
25
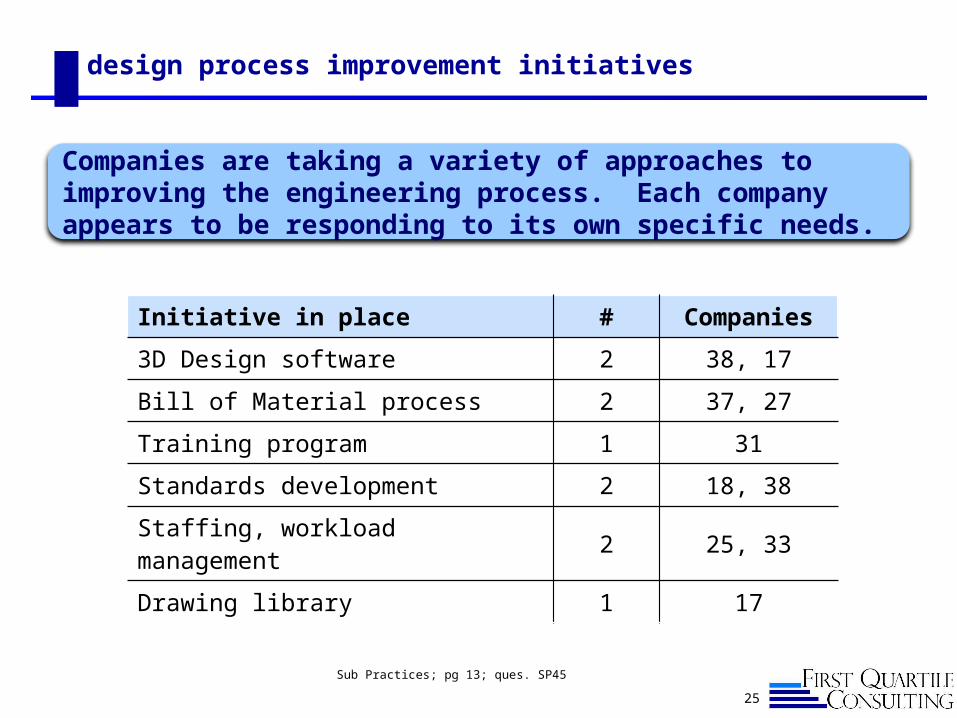
design process improvement initiatives
Companies are taking a variety of approaches to improving the engineering process. Each company appears to be responding to its own specific needs.
Initiative in place # Companies
3D Design software 2 38, 17
Bill of Material process 2 37, 27
Training program 1 31
Standards development 2 18, 38
Staffing, workload management 2 25, 33
Drawing library 1 17
Sub Practices; pg 13; ques. SP45
26
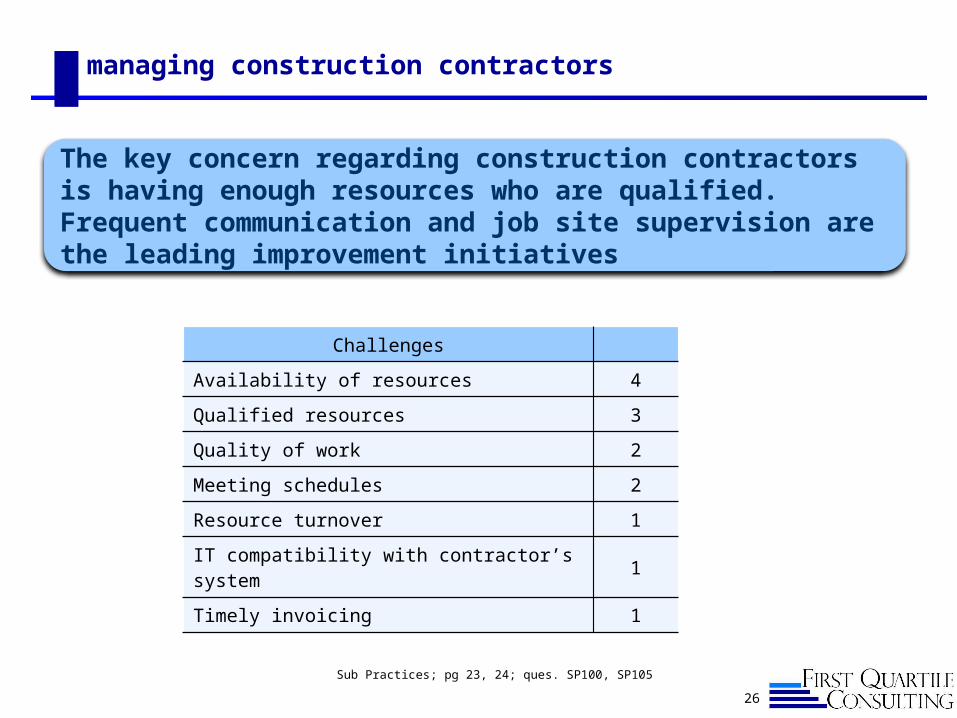
managing construction contractors
The key concern regarding construction contractors is having enough resources who are qualified.Frequent communication and job site supervision are the leading improvement initiatives
Challenges
Availability of resources 4
Qualified resources 3
Quality of work 2
Meeting schedules 2
Resource turnover 1
IT compatibility with contractor’s system 1
Timely invoicing 1
Sub Practices; pg 23, 24; ques. SP100, SP105
27
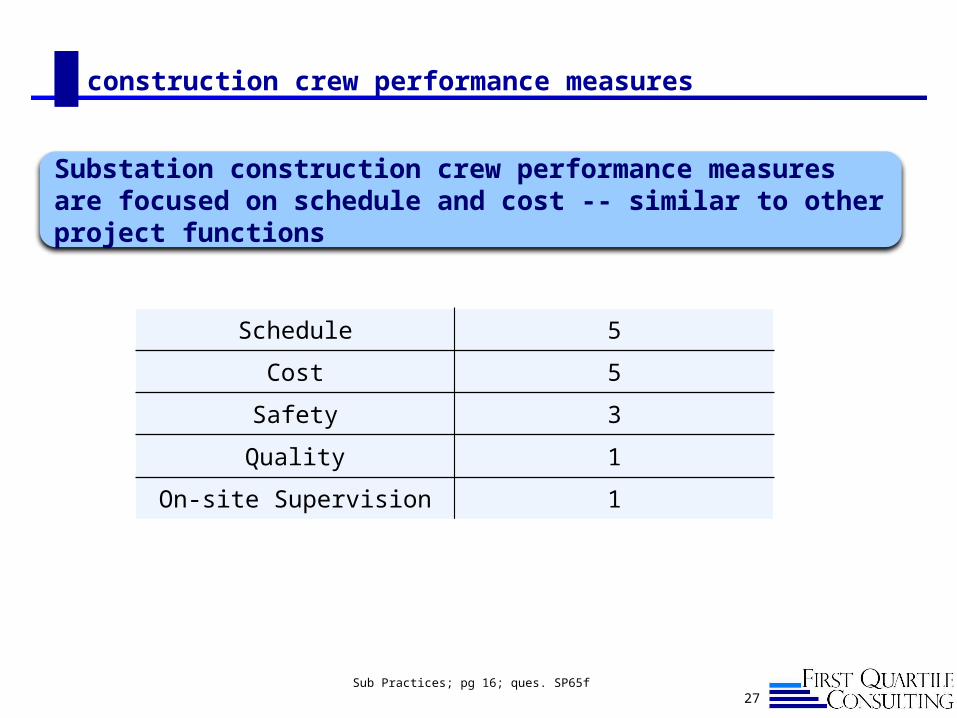
construction crew performance measures
Substation construction crew performance measures are focused on schedule and cost -- similar to other project functions
Schedule 5
Cost 5
Safety 3
Quality 1
On-site Supervision 1
Sub Practices; pg 16; ques. SP65f

28
construction contractor performance measures
Contractor performance is measured by more than half of respondents.
Contract Performance Measured Measured ContractuallyYes 6 5
No 5 5
And performance measurers are the same as those used to manage internal crews.
Schedule Cost Safety Quality On-Site supervision
Company 38 response:Contractor safety performance meeting acceptable criteria. Contractor price competitiveness in both unit rates and bid submissions. Contractor meeting construction start/complete schedules and meeting system outage schedules. Comparison of contractor project costs to internal estimates and to internal crew costs.
Sub Practices; pgs 18-21; ques. SP75, 80, 85 & 90

29
substation crew productivity improvements
• Centralized planning and scheduling• Condition-based maintenance• Improved work processes
Companies are implementing substation productivity improvement initiatives.
• Additional training of crews• Job-site reporting and the use of 4-10’s• Use of Equipment monitoring
technologies
Companies also have adjusted crew locations or made other workforce changes to optimize work time
Job site reporting 4
Satellite work centers 2
Utilize 10 hour days 1
Increased staffing 1
Sub Practices; pgs 29 & 30; ques. SP 125 & 135
30
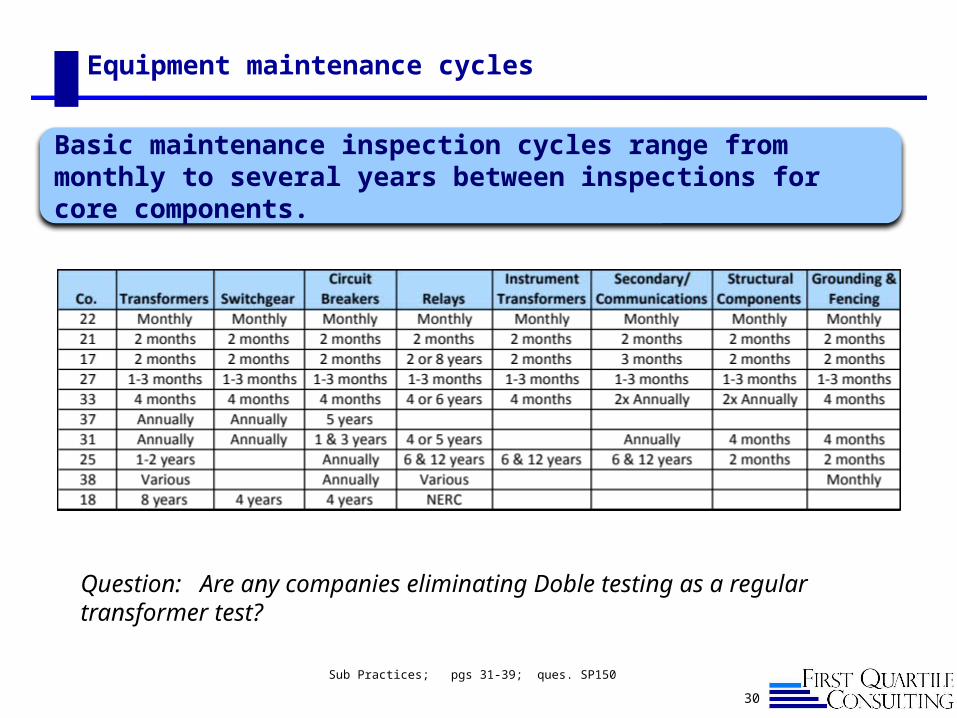
Equipment maintenance cycles
Question: Are any companies eliminating Doble testing as a regular transformer test?
Sub Practices; pgs 31-39; ques. SP150
Basic maintenance inspection cycles range from monthly to several years between inspections for core components.
31
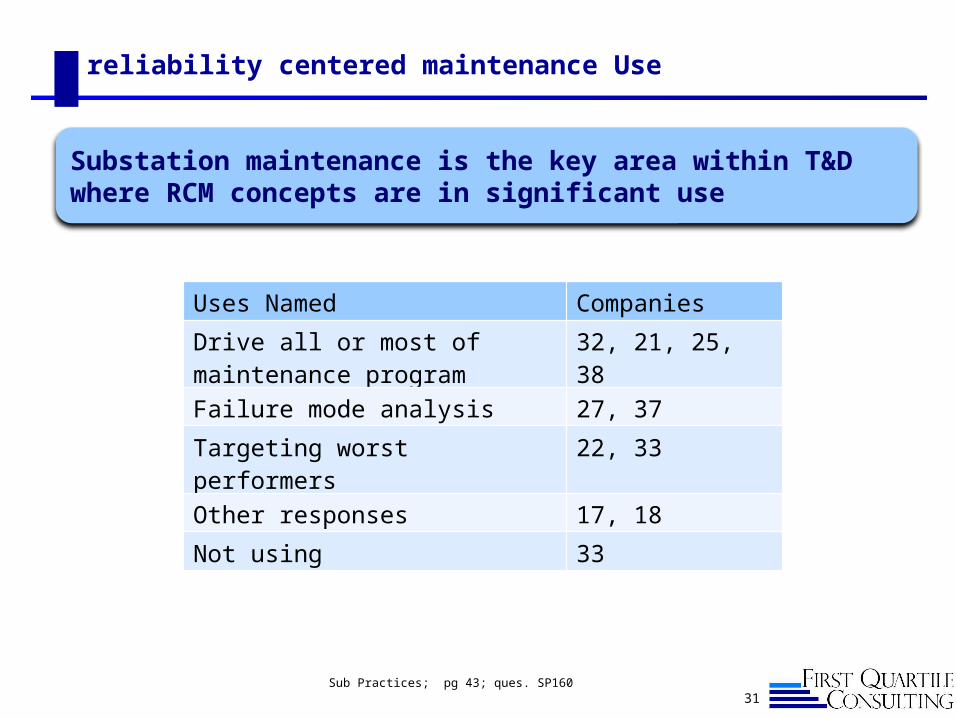
reliability centered maintenance Use
Substation maintenance is the key area within T&D where RCM concepts are in significant use
Sub Practices; pg 43; ques. SP160
Uses Named Companies
Drive all or most of maintenance program
32, 21, 25, 38
Failure mode analysis 27, 37
Targeting worst performers 22, 33
Other responses 17, 18
Not using 33
32
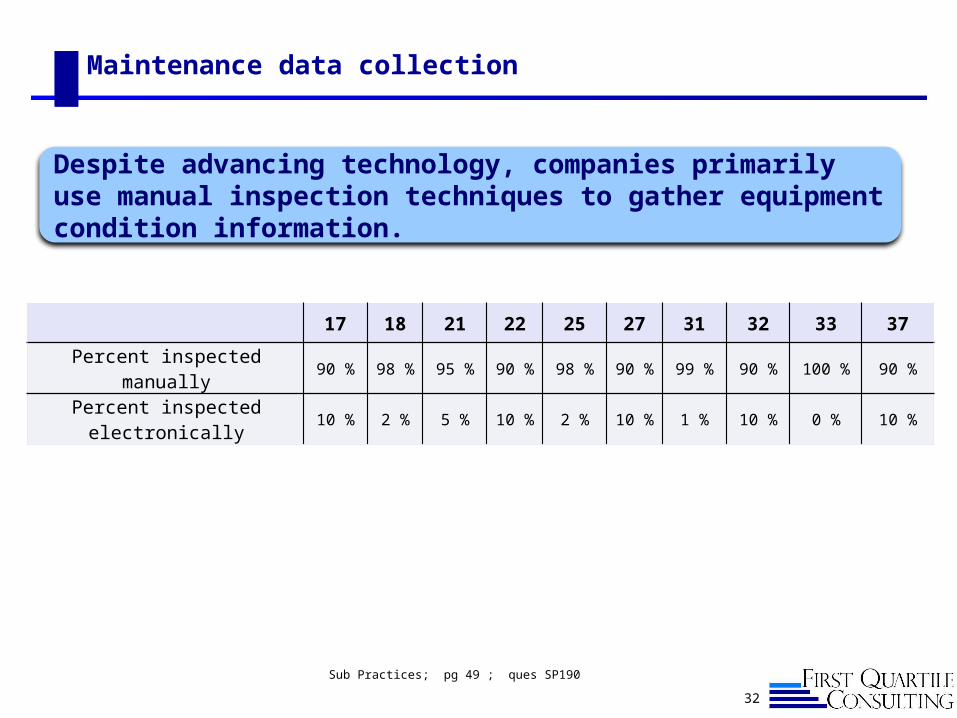
Maintenance data collection
Despite advancing technology, companies primarily use manual inspection techniques to gather equipment condition information.
17 18 21 22 25 27 31 32 33 37
Percent inspected manually 90 % 98 % 95 % 90 % 98 % 90 % 99 % 90 % 100 % 90 %
Percent inspected electronically 10 % 2 % 5 % 10 % 2 % 10 % 1 % 10 % 0 % 10 %
Sub Practices; pg 49 ; ques SP190
33
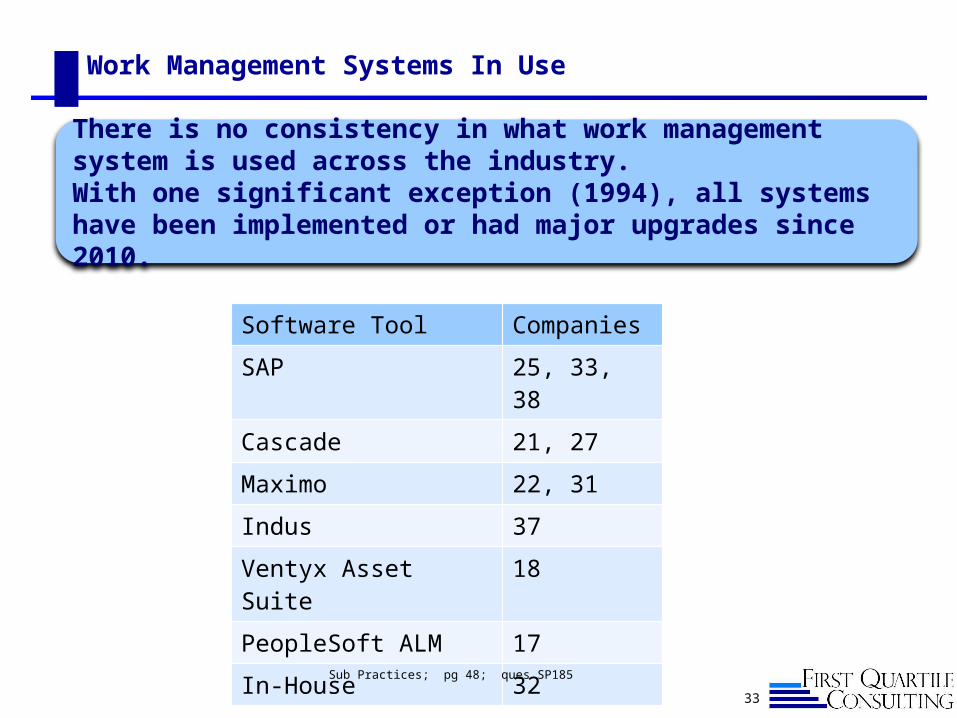
Work Management Systems In Use
There is no consistency in what work management system is used across the industry.With one significant exception (1994), all systems have been implemented or had major upgrades since 2010.
Software Tool Companies
SAP 25, 33, 38
Cascade 21, 27
Maximo 22, 31
Indus 37
Ventyx Asset Suite 18
PeopleSoft ALM 17
In-House 32
Sub Practices; pg 48; ques SP185

34
Impacts from Deferring or Reducing Maintenance
Relatively few companies have stretched maintenance cycles. Of those, about half have experienced some maintenance problems as a result.
Changes Causing No problems Changes Causing Problems
21
23 Increased cycles for ACBs, CCVTs & disconnects
27
37 15Kv Breakers
31 LTC & OCB
18Stretched cycles on older vacuums breakers, and beginning to see more unplanned maintenance requirements
25
17'None of the changes we have implemented have resulted in problems. Shortened cycles for several items, and extended Doble testing for non-type U bushings.
33 Indoor Switchgear
Sub Practices; pgs 45 & 46 ; ques. SP 170 & 175
35
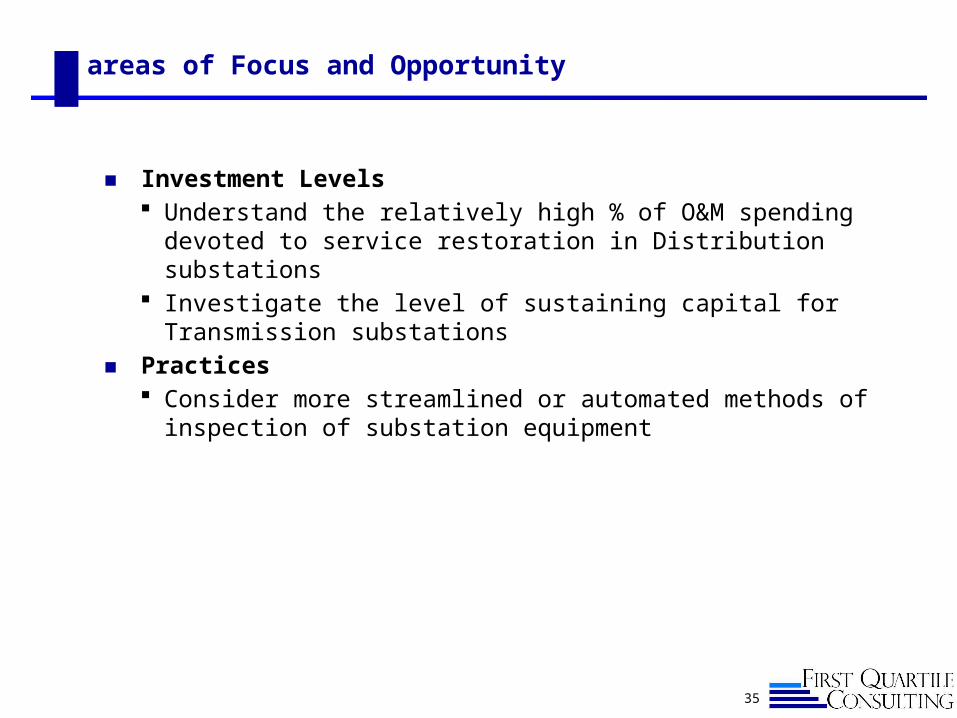
areas of Focus and Opportunity
◼ Investment Levels Understand the relatively high % of O&M spending devoted to service
restoration in Distribution substations Investigate the level of sustaining capital for Transmission substations
◼ Practices Consider more streamlined or automated methods of inspection of
substation equipment
Thank you for your Input and Participation!
36
Corporate Offices
California
400 Continental Blvd. Suite 600El Segundo, CA 90245(310) 426-2790
Maryland
3 Bethesda Metro Center Suite 700Bethesda, MD 20814
Ken Buckstaff [email protected]
Debi McLain [email protected]
New York | Texas | Wyoming | Wisconsin
Dave [email protected]
Dave [email protected]
Your Presenters
First Quartile Consulting is a utility-focused consultancy providing a full range of consulting services including continuous process improvement, change management, benchmarking and more. You can count on a proven process that assesses and optimizes your resources, processes, leadership management and technology to align your business needs with your customer’s needs.
Visit us at www.1stquartileconsulting.com | Follow our updates on LinkedIn
About 1QC
Satellite Offices
Dave [email protected]
37
Appendix

38
changes to substation maintenance
Few changes have been made to the inspections conducted at substations.Company New/Added
InspectionChanges to existing Discontinued
38 --- Monthly (<100Kv None
22 None None None
33 None Battery grounds & animal protections None
21 Animal fencing/alarms --- ---
27 None --- Fire extinguishers
37 SF6 leak & corona cameras None None
31 None None ---
18 None Planned inspection increased to quarterly None
25 None Extended cycles for transformers & breakers None
17 None Added new triggers to MWO generation criteria None
Sub Practices; pgs 40-42; ques. SP 155
39
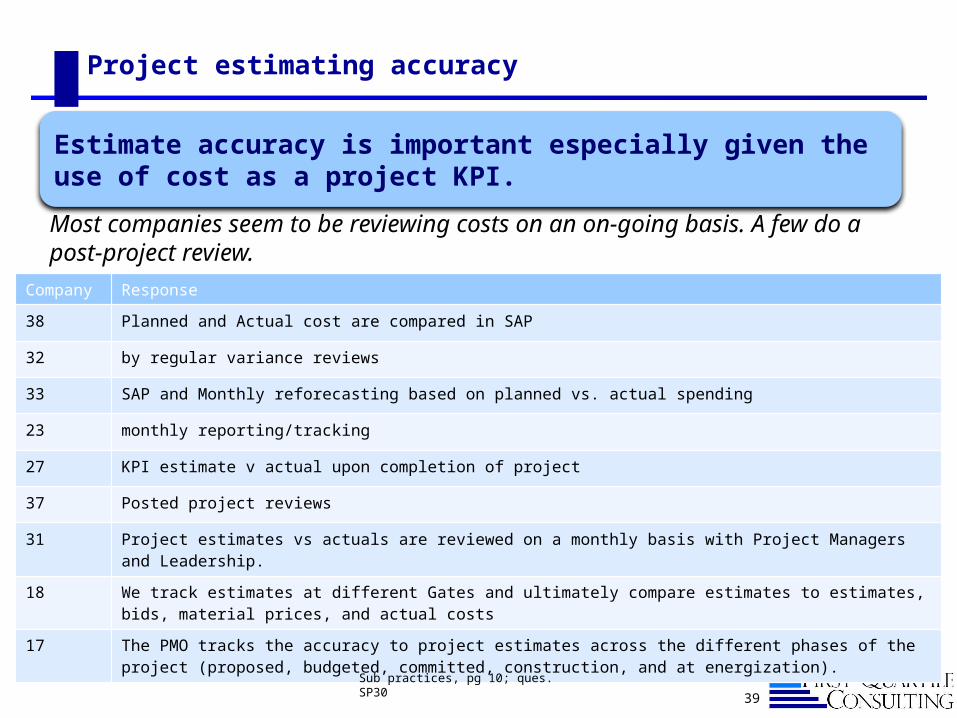
Project estimating accuracy
Most companies seem to be reviewing costs on an on-going basis. A few do a post-project review.
Estimate accuracy is important especially given the use of cost as a project KPI.
Company Response
38 Planned and Actual cost are compared in SAP
32 by regular variance reviews
33 SAP and Monthly reforecasting based on planned vs. actual spending
23 monthly reporting/tracking
27 KPI estimate v actual upon completion of project
37 Posted project reviews
31 Project estimates vs actuals are reviewed on a monthly basis with Project Managers and Leadership.
18 We track estimates at different Gates and ultimately compare estimates to estimates, bids, material prices, and actual costs
17 The PMO tracks the accuracy to project estimates across the different phases of the project (proposed, budgeted, committed, construction, and at energization).
Sub practices, pg 10; ques. SP30

40
wrench-time metrics
Wrench-time metrics are used to develop maintenance estimates and schedules. Job performance metrics are used to identify improvement opportunities.
Yes No
Use wrench-time metrics 7 6
Use metrics for productivity improvement 11 2
Company 24 commented:Crew productivity metrics that are below standard point to areas that require improvement. T&S monitors productivity metrics on a monthly basis, performs analysis to identify the drivers behind productivity that is not meeting or exceeding standard then makes adjustments to crew complement and/or work processes as needed. Annually, T&S performs analysis on productivity data to identify improvement opportunities. One or more initiatives are developed, stretch goals are determined, and adjustments to work processes, teams, and/or tools are made to increase productivity in areas identified as needing improvement.
Sub Practices; pgs 27 & 28; Ques. SP 115 & 120
41
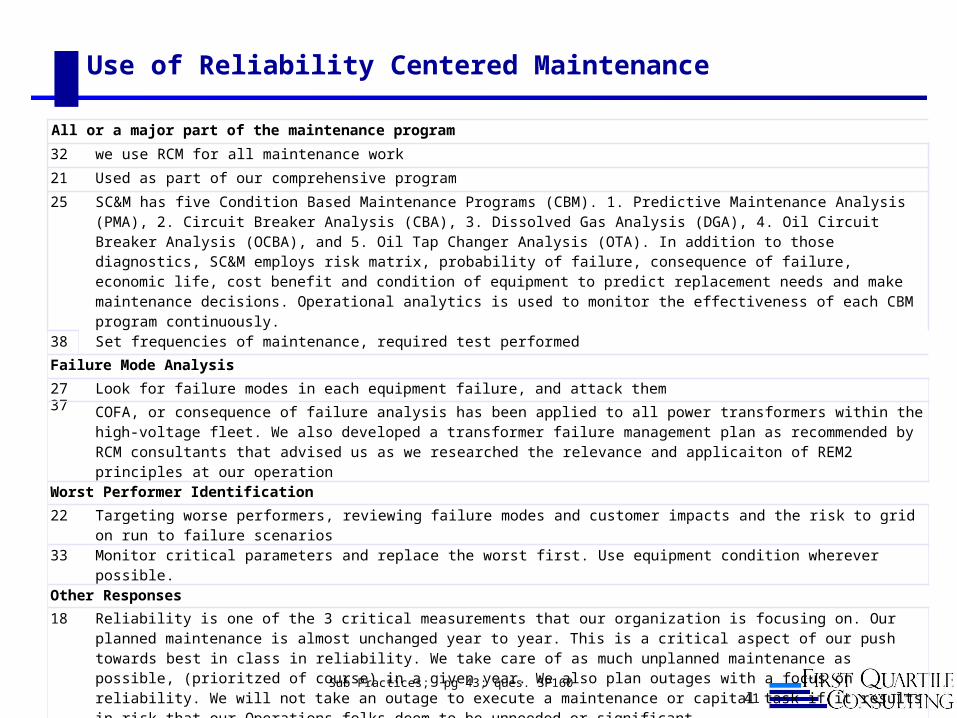
Use of Reliability Centered Maintenance
All or a major part of the maintenance program
32 we use RCM for all maintenance work
21 Used as part of our comprehensive program
25 SC&M has five Condition Based Maintenance Programs (CBM). 1. Predictive Maintenance Analysis (PMA), 2. Circuit Breaker Analysis (CBA), 3. Dissolved Gas Analysis (DGA), 4. Oil Circuit Breaker Analysis (OCBA), and 5. Oil Tap Changer Analysis (OTA). In addition to those diagnostics, SC&M employs risk matrix, probability of failure, consequence of failure, economic life, cost benefit and condition of equipment to predict replacement needs and make maintenance decisions. Operational analytics is used to monitor the effectiveness of each CBM program continuously.
38 Set frequencies of maintenance, required test performed
Failure Mode Analysis
27 Look for failure modes in each equipment failure, and attack them37 COFA, or consequence of failure analysis has been applied to all power transformers within the high-voltage fleet. We also
developed a transformer failure management plan as recommended by RCM consultants that advised us as we researched the relevance and applicaiton of REM2 principles at our operation
Worst Performer Identification
22 Targeting worse performers, reviewing failure modes and customer impacts and the risk to grid on run to failure scenarios
33 Monitor critical parameters and replace the worst first. Use equipment condition wherever possible.
Other Responses
18 Reliability is one of the 3 critical measurements that our organization is focusing on. Our planned maintenance is almost unchanged year to year. This is a critical aspect of our push towards best in class in reliability. We take care of as much unplanned maintenance as possible, (prioritzed of course) in a given year. We also plan outages with a focus on reliability. We will not take an outage to execute a maintenance or capital task if it results in risk that our Operations folks deem to be unneeded or significant.
17 For Voltage regulators; Company has moved away from performing maintenance based on number of operations to using DGA results.
31 AM recently started and these concepts have not yet been applied.
Sub Practices; pg 43; ques. SP160
42
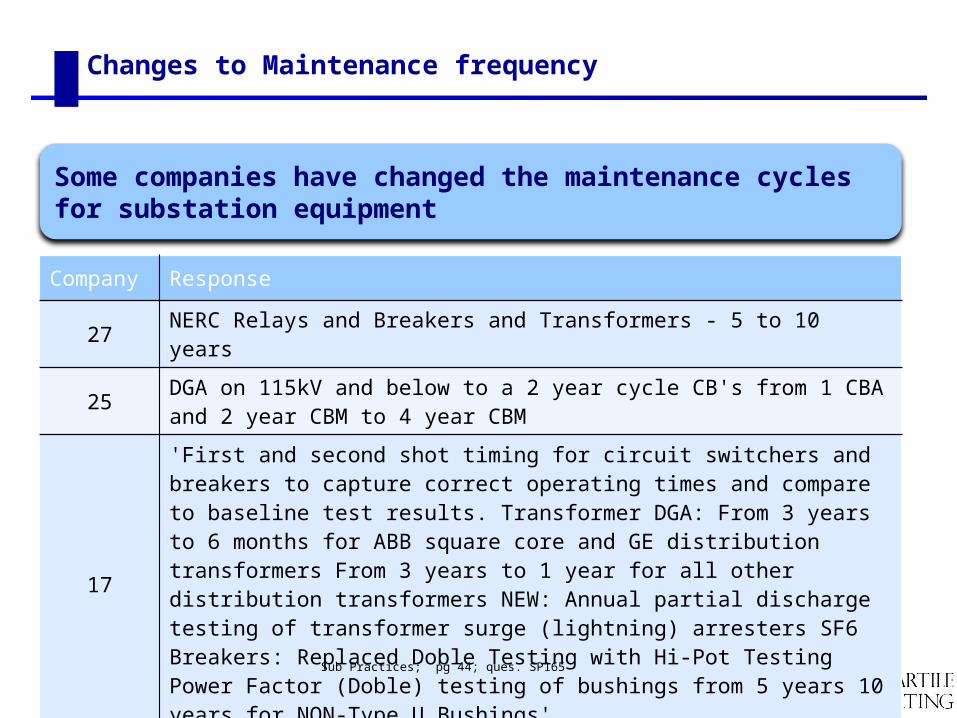
Changes to Maintenance frequency
Some companies have changed the maintenance cycles for substation equipment
Company Response
27 NERC Relays and Breakers and Transformers - 5 to 10 years
25 DGA on 115kV and below to a 2 year cycle CB's from 1 CBA and 2 year CBM to 4 year CBM
17
'First and second shot timing for circuit switchers and breakers to capture correct operating times and compare to baseline test results. Transformer DGA: From 3 years to 6 months for ABB square core and GE distribution transformers From 3 years to 1 year for all other distribution transformers NEW: Annual partial discharge testing of transformer surge (lightning) arresters SF6 Breakers: Replaced Doble Testing with Hi-Pot Testing Power Factor (Doble) testing of bushings from 5 years 10 years for NON-Type U Bushings'
Sub Practices; pg 44; ques. SP165
43
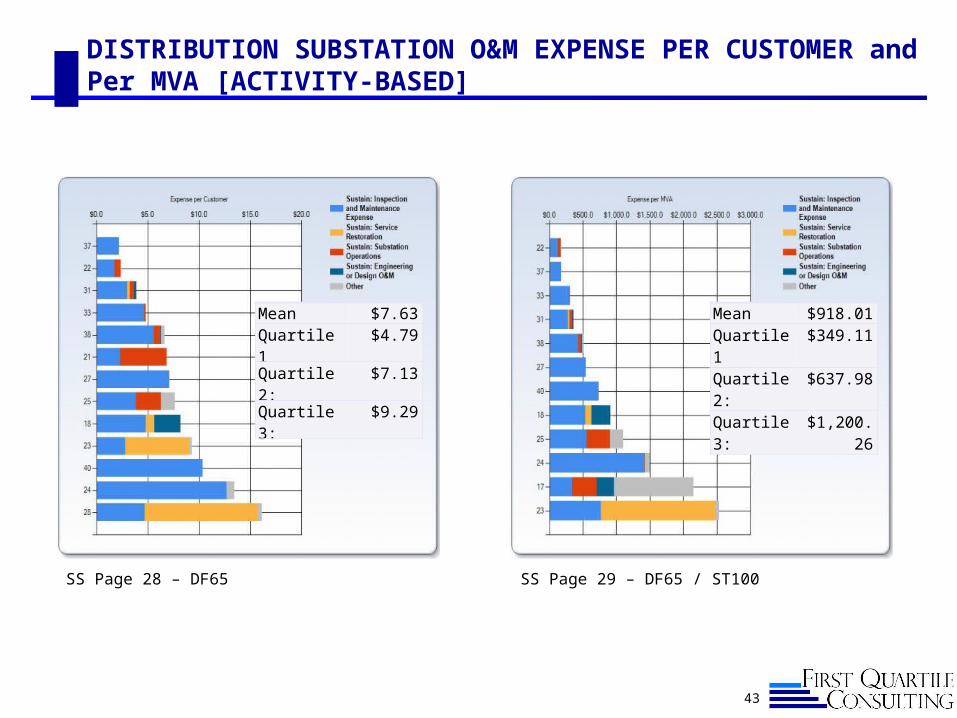
DISTRIBUTION SUBSTATION O&M EXPENSE PER CUSTOMER and Per MVA [ACTIVITY-BASED]
Mean $918.01Quartile 1 $349.11Quartile 2: $637.98Quartile 3: $1,200.26
SS Page 28 – DF65 SS Page 29 – DF65 / ST100
Mean $7.63Quartile 1 $4.79Quartile 2: $7.13Quartile 3: $9.29

44
TRANSMISSION SUBSTATION CAPITAL SPENDING PER INSTALLED MVA [ACTIVITY-BASED]
Mean $3,507Quartile 1 $4,782Quartile 2: $3,166Quartile 3: $1,983
SS Page 32 – TF10 / ST105 SS Page 35 – TF50 / ST105
Mean $4,349Quartile 1 $6,472Quartile 2: $4,695Quartile 3: $1,780