William K. Terry, editor - Massachusetts Institute of...
111
INEEL/EXT-01-01623 MODULAR PEBBLE-BED REACTOR PROJECT LABORATORY-DIRECTED RESEARCH AND DEVELOPMENT PROGRAM FY 2001 ANNUAL REPORT IDAHO NATIONAL ENGINEERING AND ENVIRONMENTAL LABORATORY and THE MASSACHUSETTS INSTITUTE OF TECHNOLOGY William K. Terry, editor INEEL: David A. Petti, Hans D. Gougar, J. Stephen Herring, Steve Keller, (Georgia Tech), John T. Maki, Brad J. Merrill, Gregory K. Miller, Richard L. Moore, Chang H. Oh, Abderrafi M. Ougouag, Farzad Rahnema (Georgia Tech), William K. Terry, Dominic Varacalle, and Kevan D. Weaver MIT: Andrew C. Kadak, Ronald G. Ballinger, Michael J. Driscoll, Walter Kato, Julian Lebenhaft, Heather MacLean, Hee Cheon No, Chunyun Wang, Jing Wang, Sidney Yip, and Tieliang Zhai December 2001 Idaho National Engineering and Environmental Laboratory Bechtel BWXT Idaho, LLC
Transcript of William K. Terry, editor - Massachusetts Institute of...
INEEL/EXT-01-01623
MODULAR PEBBLE-BED REACTOR PROJECT
LABORATORY-DIRECTED RESEARCH AND DEVELOPMENT PROGRAM FY 2001 ANNUAL REPORT
IDAHO NATIONAL ENGINEERING AND
ENVIRONMENTAL LABORATORY and
THE MASSACHUSETTS INSTITUTE OF TECHNOLOGY
William K. Terry, editor INEEL: David A. Petti, Hans D. Gougar, J. Stephen Herring, Steve Keller, (Georgia Tech), John T. Maki, Brad J. Merrill, Gregory K. Miller, Richard L. Moore, Chang H. Oh, Abderrafi M. Ougouag, Farzad Rahnema (Georgia Tech), William K. Terry, Dominic Varacalle, and Kevan D. Weaver MIT: Andrew C. Kadak, Ronald G. Ballinger, Michael J. Driscoll, Walter Kato, Julian Lebenhaft, Heather MacLean, Hee Cheon No, Chunyun Wang, Jing Wang, Sidney Yip, and Tieliang Zhai December 2001 Idaho National Engineering and Environmental Laboratory Bechtel BWXT Idaho, LLC
INEEL/EXT-2001-1623
MODULAR PEBBLE-BED REACTOR PROJECT
LABORATORY-DIRECTED RESEARCH AND DEVELOPMENT PROGRAM
FY 2001 ANNUAL REPORT
IDAHO NATIONAL ENGINEERING AND ENVIRONMENTAL LABORATORY
and THE MASSACHUSETTS INSTITUTE OF TECHNOLOGY
William K. Terry, editor INEEL: David A. Petti, Hans D. Gougar, J. Stephen Herring, Steve Keller, (Georgia Tech), John T. Maki, Brad J. Merrill, Gregory K. Miller, Richard L. Moore, Chang H. Oh, Abderrafi M. Ougouag, Farzad Rahnema (Georgia Tech), William K. Terry, Dominic Varacalle, and Kevan D. Weaver MIT: Andrew C. Kadak, Ronald G. Ballinger, Michael J. Driscoll, Walter Kato, Julian Lebenhaft, Heather MacLean, Hee Cheon No, Chunyun Wang, Jing Wang, Sidney Yip, and Tieliang Zhai
December 2001
Idaho National Engineering and Environmental Laboratory
Idaho Falls, Idaho 83415
Prepared for the U.S. Department of Energy
Assistant Secretary for Environmental Management Under DOE Idaho Operations Office
Contract DE-AC07-99ID13727

ii
iii
Table of Contents 1.0 Introduction 1 2.0 Gas Reactor Fuel Performance Studies 2 2.1 Studies at the INEEL 2 2.1.1 Stress Model Development and Approach 3 2.1.1.1 Basic Particle Behavior 3 2.1.1.2 Material Properties 3 Creep 4 Shrinkage 4 Weibull Parameters 5 Elastic Properties 6 2.1.1.3 Evaluation of Shrinkage Cracks in the IPyC 6 2.1.1.4 Basic Approach Used in Fuel Performance Model 6 Structural Models 6 Statistical Evaluations 8 2.1.1.5 Cracked Particle Model and Results for NPR Experiments 9 2.1.1.6 Standard Particle Model and Results for EU High-Burnup Case 11 2.1.1.7 Effects of Thermal Cycling 13 2.1.1.8 Effects of Varying Poisson’s Ratio in Creep for the Pyrocarbons 14 2.1.1.9 Calculating Particle Batch Failure Probabilities Using an Integral Formulation 14 2.1.2 Fission Gas Release, CO Production and Fission Product Chemistry 15 2.1.2.1 Fission Gas and CO Release Model 15 2.1.2.2 Fission Product Chemistry Module 17 2.2 Studies at MIT 20 2.2.1 In-Core Environment: Simulation of Core Fueling 21 2.2.2 Chemical Model 21 2.2.3 Mechanical Model Development 21 2.2.3.1 Benchmarking the Stress Analysis Model 21 Simulations of NPR-type and HTTR-type Fuel Particles 23 2.2.3.2 Fuel Failure Probability 28 2.2.4 Conclusions and Future Work 28 References for Section 2 28 3.0 Reactor Physics Research 30 3.1 INEEL Work 30 3.1.1 Introduction 30 3.1.2 Advances in the Development of PEBBED 31 3.1.2.1 PEBBED 2.0 – the FORTRAN Version of PEBBED 31 3.1.2.2 Expanded Isotopics Tracking 31 3.1.2.3 Multigroup Energy Treatment 31 3.1.2.4 Enhancements to the Geometric Modeling Capability 31 3.1.2.5 Ex-Core Radionuclide Decay 32 3.1.2.6 The Matrix Approach to Recirculation Analysis 32 Nuclide Flow in Recirculating Cores 32 3.1.3 Application of PEBBED to the Analysis of Pebble-Bed Reactors 34 3.1.3.1 Evaluation of Peak Neutron Flux and Core Eigenvalue of HTR Modul 200 and Eskom PBMR 34 3.1.3.2 Support of Planning for Testing of Eskom PBMR Fuel in the Advanced Test Reactor 36 3.1.4 Study of the Potential for PBRs to be Diverted for Production of Material for Nuclear Weapons 39

iv
3.1.4.1 Introduction 39 3.1.4.2 Methodology 39 3.1.4.3 Results 40 3.1.4.4 Conclusions 40 3.1.5 Progress at Georgia Institute of Technology on the Development of a Method to Compute Diffusion Parameters 41 3.1.6 Analysis of Plutonium Concentration and Isotopics Based on the Reactivity-Limited Burnup of Pebble-Bed Reactor Fuel Using Various Enrichments 42 3.1.6.1 Introduction 42 3.1.6.2 Modeling Methods 42 3.1.6.3 Reactivity-Limited Burnup 43 3.1.6.4 Plutonium Isotopics 44 3.1.6.5 Conclusions 44 3.1.7 Summary and Outlook 45 3.2 MIT Work 45 3.2.1 Introduction 45 3.2.2 Modeling Considerations 46 3.2.3 HTR-PROTEUS 47 3.2.4 HTR-10 49 3.2.5 ASTRA 50 References for Section 3 53 4.0 Reactor Safety and Thermal Hydraulics Modeling 55 4.1 INEEL Research 55 4.1.1 ATHENA Code Simulation 55 4.1.1.1 ATHENA Model 55 4.1.1.2 Results 59 4.1.1.3 Conclusions 62 4.1.2 Scoping Analyses 62 4.1.3 MELCOR Modeling 62 4.1.3.1 MELCOR Model 62 4.1.3.2 Oxidation Model 64 4.1.3.3 Results 65 4.1.3.4 Conclusions 68 4.2 MIT Research 68 4.2.1 The Loss-of-Coolant Accident with Depressurization 68 4.2.1.1 Introduction 68 4.2.1.2 Description of the Model 68 4.2.1.3 Decay Heat Generation 75 4.2.1.4 Boundary Conditions 76 4.2.1.5 The Calculation and the Sensitivity Analysis 77 4.2.1.6 Conclusions and Recommendations 80 4.2.2 The Air Ingress Accident 82 4.2.2.1 Introduction 82 4.2.2.2 The Physical Process of the Accident 82 4.2.2.3 Main Reactions 83 Important Parameters Governing these Reactions 83 4.2.2.4 The Pressure Drop 84 4.2.2.5 The Model 84 The Main Assumptions 84 4.2.2.6 Calculation Procedures 87 4.2.2.7 Results 87

v
4.2.2.8 Conclusions and Future Work 92 References for Section 4 93 5.0 Conclusions 94 Fuel Performance Model Development 94 Core Neutronics 94 Safety Analysis 94 Appendix: Air Ingress Analyses on a High Temperature Gas-Cooled Reactor (paper published in Proceedings of 2001 ASME International Mechanical Engineering Congress and Exposition) 95

vi
1
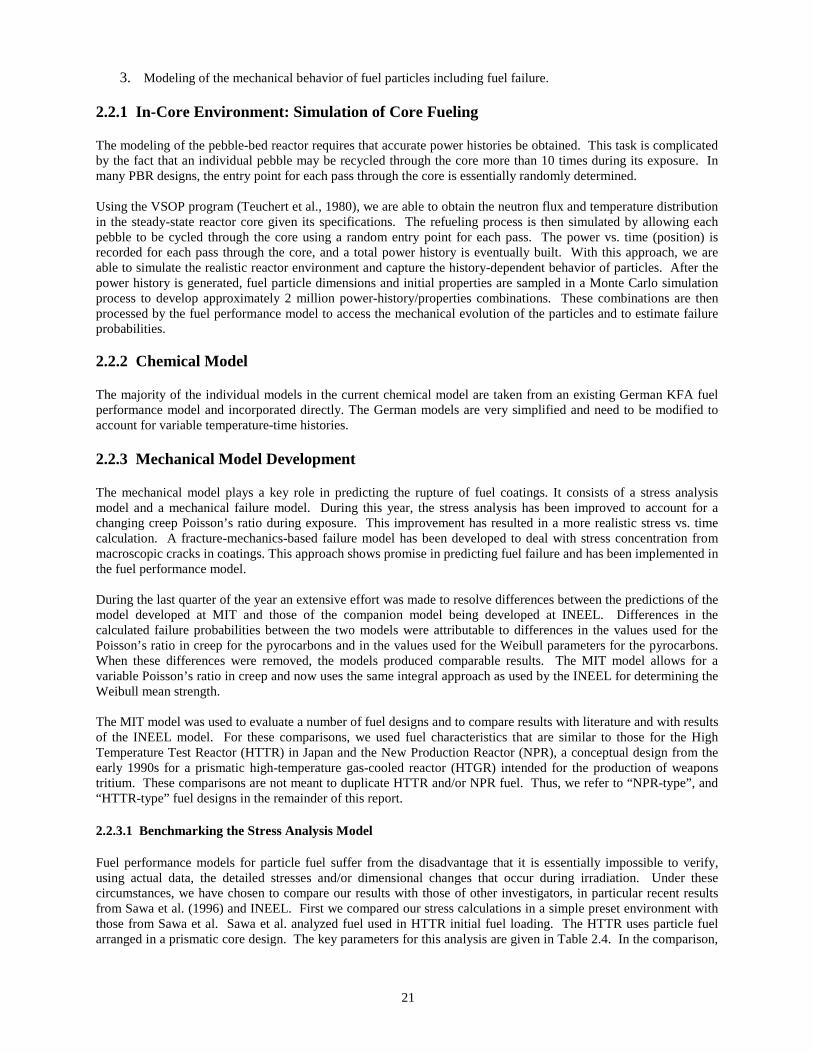
1.0 Introduction The Modular Pebble-Bed Reactor (MPBR) is an advanced reactor concept that can meet the energy and environmental needs of future generations as defined under DOE’s Generation IV initiative. Preliminary research has concluded that this technology has an excellent opportunity to satisfy the safety, economic, proliferation, and waste disposal concerns that face all nuclear electric generating technologies. During Fiscal Year 2001, in collaboration with the Massachusetts Institute of Technology (MIT), we have pursued a greater understanding of the potential for the MPBR to address these concerns. Formerly supported under the University Research Consortium program, this collaboration was supported during Fiscal Year 2001 by the INEEL’s Laboratory-Directed Research and Development (LDRD) program. Our work directly supports INEEL’s missions as co-lead NE laboratory. Our work in collaboration with MIT is focused on developing, benchmarking, and applying core design tools in the areas of neutronics, thermal hydraulics, fuel performance, and safety analysis. This strategy will allow INEEL to address the important issues that face the MPBR and to have a complete integrated reactor core design capability for the MPBR. In this report, we provide a description of progress made in the past year. The work capitalizes on INEEL’s historic strength in fuel development and testing (including extensive experience with light-water reactor fuel, ATR-type fuel, and New-Production-Reactor particle fuel). The project also builds on the strong capabilities of INEEL and MIT for reactor core neutronics and thermal hydraulic design, as well as nuclear safety analysis. The DOE has begun funding the development of a fourth-generation reactor with NERI funds and will try to budget significant line items within the next five years. If we are to compete for further nuclear energy development funding, we need to demonstrate our capability to design and build advanced reactors. We have made substantial progress during the past fiscal year towards demonstrating this capability for the MPBR. During Fiscal Year 2001, five MIT student researchers were involved, three of whom were supported by INEEL funds. Four MIT faculty and two senior research scientists supervised the students. In addition, twelve INEEL staff members worked part-time on different parts of the project. The three major areas of research funded by this LDRD are shown in Table 1.1. Table 1.1. Research Demographics for the MPBR Project. Research Area Students MIT Faculty and Staff INEEL Staff Fuel Performance Jing Wang Ronald G. Ballinger David A. Petti
Heather MacLean Sidney Yip John T. Maki (supported by DOE Gregory K. Miller fellowship) Dominic Varacalle
Thermal Hydraulics Chunyung Wang Ronald G. Ballinger David A. Petti and Safety Tieliang Zhai Andrew C. Kadak Chang H. Oh Walter Kato Richard L. Moore Hee Cheon No Brad J. Merrill Core Neutronics Julian Lebenhaft Andrew C. Kadak William K. Terry and Physics Michael J. Driscoll Hans D. Gougar Abderrafi M. Ougouag J. Stephen Herring Kevan D. Weaver _____________________________________________________________________________

2
2.0 Gas Reactor Fuel Performance Studies
A key phenomenon in the PBMR is the behavior of the TRISO-coated particle fuel during normal, off-normal, and accident conditions. Without a pressure-bearing containment, the safety case for the reactor depends upon the safety and high quality of the coated particle fuel. Both the INEEL and MIT have investigated fuel performance issues extensively.
2.1 Studies at the INEEL Figure 2.1 schematically represents a classical TRISO gas reactor fuel microsphere. Various fissile and fertile kernels have been used in particles, including ThC2, ThO2, PuO2, (Th,U)O2, UC2, UO2, and UCO. Nominal fuel kernel diameters range between 70 and 500 microns. The fuel kernel is surrounded by a porous graphite buffer layer that absorbs radiation damage, allows space for fission gases produced during irradiation, and resists kernel migration at high temperature. The buffer layer is generally about 100 µm thick. Surrounding this inner buffer layer is a layer of dense pyrolytic carbon, an SiC layer, and one or two dense outer pyrolytic carbon layers. The pyrolytic carbon layers act to protect the SiC layer, which is the pressure boundary for the microsphere; the inner pyrolytic carbon layer also protects the kernel from corrosive gases that are present during the deposition of the SiC layer. The pyrolytic carbon layers are typically 40 µm thick; the SiC layer is usually about 35 µm thick. However, layer thicknesses have historically ranged between 20 and 60 µm. This layer arrangement is known as the TRISO coating system. Each microsphere acts as a miniature pressure vessel. This feature is designed to impart robustness to the gas reactor fuel system. Compared to light water reactor and liquid metal reactor fuel forms, the behavior of coated-particle fuel is inherently more multidimensional. Moreover, modeling of fuel behavior is made more difficult because of statistical variations in fuel physical dimensions and/or component properties from particle to particle that arise from the nature of the fabrication process. Previous attempts to model this fuel form have attacked different pieces of the problem. Simplified one-dimensional models exist to describe the structural response of the fuel particle. Models or correlations exist to describe the fission product behavior in the fuel, though the database is not complete owing to the changes in fuel design that have occurred over the last 25 years. Significant effort has gone into modeling the statistical nature of fuel particles. However, under pressure to perform over one million simulations with the computing power available in the 1970s and 1980s, the structural response of the particle model was simplified to improve the speed of calculation.
Fuel Kernel
Buffer Layer
Inner PyCLayer
SiC Layer
Outer PyCLayer
Figure 2.1. A typical gas reactor fuel microsphere

3
Thus, the INEEL has begun the development of an integrated mechanistic fuel performance model, named PARFUME (PARticle FUel ModEl), for TRISO-coated gas-reactor particle fuel. Our objective in developing PARFUME is to describe physically both the mechanical and physico-chemical behavior of the fuel particle under irradiation. Our goal is to develop a performance model for particle fuel that has the proper dimensionality and still captures the statistical nature of the fuel. The statistical variation of key properties of the particle associated with the production process requires Monte Carlo analysis of a very large number of particles to understand the aggregate behavior. Thus, state-of-the-art statistical techniques are being used to incorporate the results of the detailed multidimensional stress calculations and the fission product chemical interactions into PARFUME. Furthermore, we want to verify PARFUME using data from historical irradiations of TRISO-coated particles so that the code can be used with greater confidence to design advanced coated-particle fuel for the gas reactor and other particle fuel applications (e.g., Pu- and minor-actinide-burning fast reactors). The model is currently focusing on carbide, oxide and oxycarbide uranium fuel kernels. The coating layers are the classical TRISO type (IPyC/SiC/OPyC). Extensions to other fissile and fertile materials and other coating materials (e.g. ZrC) are currently under consideration. The model will be used to address the following important phenomena: • Anisotropic response of the pyrolytic carbon layers to irradiation (shrinkage, swelling, and creep, which are
functions of temperature, fluence, and orientation/direction in the carbon) • Failure of a SiC ceramic in the coating system (using the classic Weibull formulation for a brittle material),
either by traditional pressure vessel failure criteria or by mechanisms such as asphericity, layer debonding, or cracking
• Chemical changes of the fuel kernel during irradiation (changes in carbon/oxygen, carbon/metal and/or oxygen/metal ratio depending on the kernel fuel type, and production of CO/CO2 gas) and their influence on fission product and/or kernel attack on the particle coatings.
Our major work for this year focused on the stress model discussed in Section 2.1.1. Work has begun on fission gas release and fuel chemistry, which is presented in Section 2.1.2. 2.1.1 Stress Model Development and Approach 2.1.1.1 Basic Particle Behavior In the fuel particle for the pebble-bed reactor, fission gas pressure builds up in the kernel and buffer regions, while the IPyC, SiC, and OPyC regions act as structural layers to retain this pressure. The basic behavior modeled in PARFUME is shown schematically in Figure 2.2. The IPyC and OPyC layers both shrink and creep during irradiation of the particle, while the SiC exhibits only elastic response. A portion of the gas pressure is transmitted through the IPyC layer to the SiC. This pressure continually increases as irradiation of the particle progresses, thereby contributing to a tensile hoop stress in the SiC layer. Countering the effect of the pressure load is the shrinkage of the IPyC during irradiation, which pulls inward on the SiC. Likewise, shrinkage of the OPyC causes it to push inward on the SiC. Failure of the particle is normally expected to occur if the stress in the SiC layer reaches the fracture strength of the SiC. 2.1.1.2 Material Properties Numerous material properties are needed to represent fuel particle behavior in the performance model. These include irradiation-induced strain rates used to represent shrinkage (or swelling) of the pyrocarbon layers, creep coefficients to represent irradiation-induced creep in the pyrocarbon layers, and elastic properties to represent elastic behavior for the pyrocarbons and silicon carbide. Our performance model has been updated to incorporate the comprehensive data that were compiled in a report by the CEGA Corporation (July 1993). These data are summarized below.

4
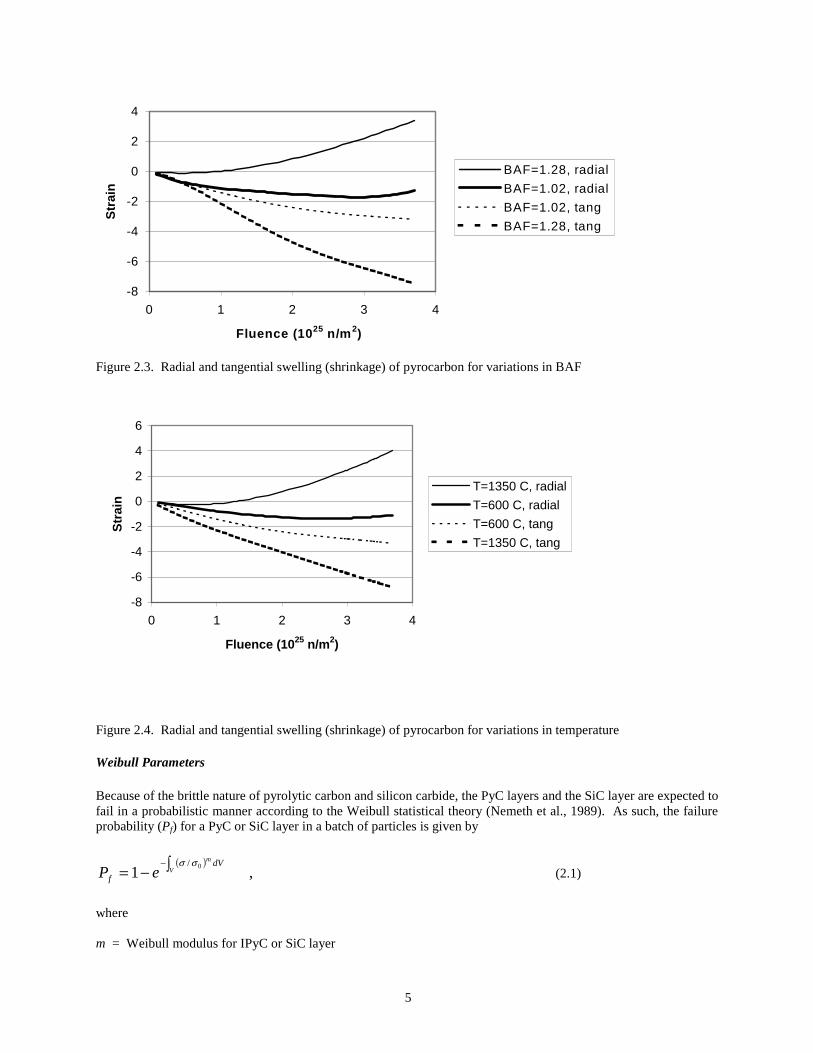
Figure 2.2. Behavior of coating layers in fuel particle. Creep Irradiation-induced creep in the pyrocarbon layers is treated as secondary creep; i.e., the creep strain rate is proportional to the level of stress in the pyrocarbon. The creep coefficient is applied as a function of pyrocarbon density and irradiation temperature. Because variations in pyrocarbon density are small, the creep is primarily a function of temperature, increasing significantly with increases in temperature. The creep coefficients used in the analysis range from 0.5 to 1.4 ×10⁻²⁷(psi-neutrons/cm2)-1 over a temperature range from 600 to 1200 °C. There is considerable variation among values reported for the creep coefficient throughout the literature, making this a major source of uncertainty in the analysis. The remaining creep property is Poisson’s ratio for creep of the pyrocarbon layers. In accordance with CEGA’s recommendations, a value of 0.5 is used for secondary creep of the pyrocarbons. A discussion on the effects of decreasing this parameter is contained in Section 2.1.1.8. Shrinkage Because of anisotropy in the swelling behavior of the pyrocarbon layers, the strains are different for the radial and tangential directions. The swelling strains are treated as functions of four variables: fluence level, pyrocarbon density, degree of anisotropy (as measured by the Bacon Anisotropy Factor, BAF), and irradiation temperature. Figure 2.3 shows swelling strain as a function of fluence and BAF for the radial and tangential directions. The plots presented correspond to a pyrocarbon density of 1.9 g/cm3 and an irradiation temperature of 1032 °C, and they cover a range of BAF from 1.02 to 1.28. In the radial direction, the pyrocarbon shrinks at low fluences but swells at higher fluences for all but the lowest BAF values. In the tangential direction, the pyrocarbon continuously shrinks at all levels of fluence, and the magnitude of the shrinkage increases as the BAF increases. Figure 2.4 shows swelling strain as a function of fluence and irradiation temperature. The plots presented correspond to a pyrocarbon density of 1.96 g/cm3 and a BAF value of 1.08, and they cover a range of temperature from 600 to 1350 °C. Similar trends are seen in these curves, wherein the magnitude of shrinkage increases as the temperature increases.
IPyC SiC OPyC
shrinks and creeps elastic shrinks and creeps
Gas Pressure 1
23
1 Gas pressure is transmitted through the IPyC
2 IPyC shrinks, pulling away from the SiC
3 OPyC shrinks, pushing in on SiC
5
Figure 2.3. Radial and tangential swelling (shrinkage) of pyrocarbon for variations in BAF
Figure 2.4. Radial and tangential swelling (shrinkage) of pyrocarbon for variations in temperature Weibull Parameters Because of the brittle nature of pyrolytic carbon and silicon carbide, the PyC layers and the SiC layer are expected to fail in a probabilistic manner according to the Weibull statistical theory (Nemeth et al., 1989). As such, the failure probability (Pf) for a PyC or SiC layer in a batch of particles is given by
( )∫−=−
V
m dV
f eP0/
1σσ
, (2.1)
where m = Weibull modulus for IPyC or SiC layer
Stra
in
-8
-6
-4
-2
0
2
4
0 1 2 3 4
Fluence (1025 n/m2)
Str
ain
BAF=1.28, radial
BAF=1.02, radial
BAF=1.02, tang
BAF=1.28, tang
-8
-6
-4
-2
0
2
4
6
0 1 2 3 4
Fluence (1025 n/m2)
Str
ain
T=1350 C, radial
T=600 C, radial
T=600 C, tang
T=1350 C, tang

6
V = Volume of the IPyC or SiC layer σ = Stress in the IPyC or SiC layer σ0 = Weibull characteristic strength for the IPyC or SiC layer. In the PARFUME code, the Weibull modulus m for the pyrocarbons is assumed to have a value of 9.5. CEGA’s data indicate that the characteristic strength σ0 increases with increasing values of BAF. For isotropic PyC (BAF = 1), the recommended value for σ0 is 13.36 MPa-m3/9.5. For a BAF of 1.06, which may typically be expected, the strength increases to 23.99 MPa-m3/9.5. The Weibull modulus m for the silicon carbide layer is assumed to have a value of 6 and the corresponding characteristic strength σ0 is assumed to be 9.64 MPa-m3/6.
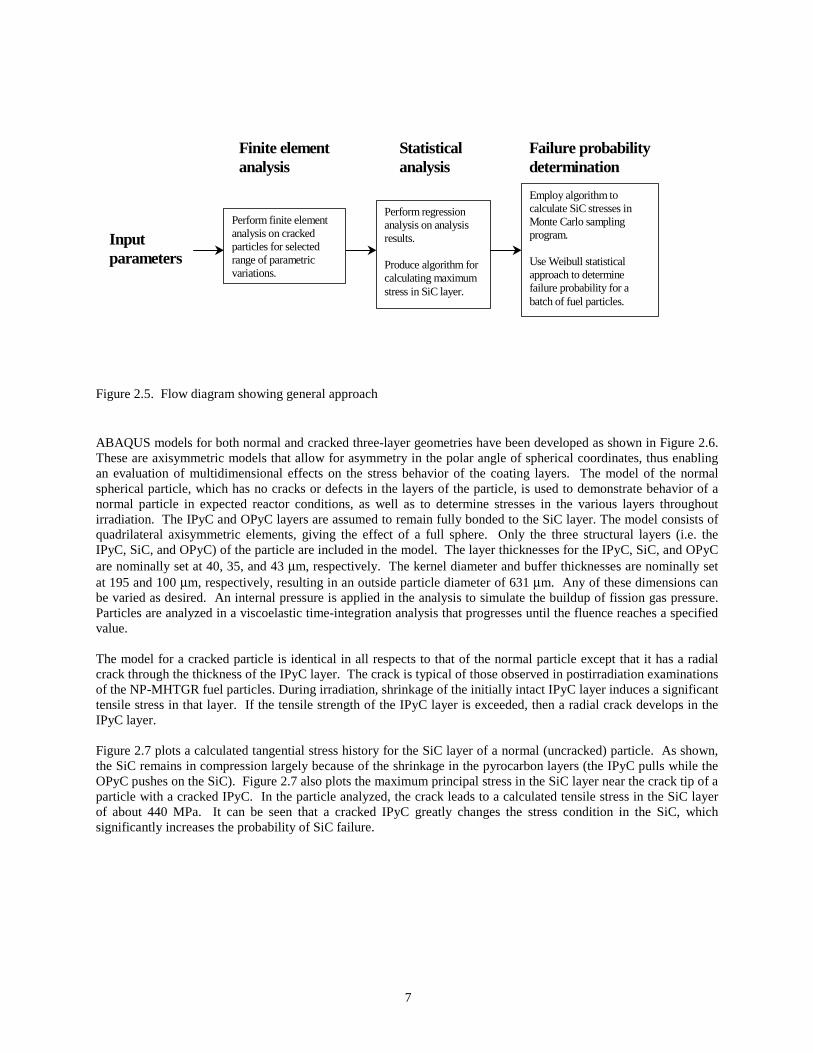
Elastic Properties The Young’s modulus for the pyrocarbon layers is applied as a function of four variables (the same variables as used for swelling), while the Young’s modulus for the silicon carbide layer is applied only as a function of temperature. A typical Young’s modulus for the pyrocarbons is about 30 GPa, while that of the silicon carbide is about 370 GPa. Values of 0.33 and 0.13 are used for Poisson’s ratio in the pyrocarbon and SiC layers, respectively. The stresses in the coating layers are not highly sensitive to variations in the elastic properties. 2.1.1.3 Evaluation of Shrinkage Cracks in the IPyC We have performed a detailed evaluation of the effects of shrinkage cracks in the IPyC layer on the performance of fuel particles. A shrinkage crack in the IPyC layer induces tensile stresses in the SiC layer of a particle. In the investigations performed, it was determined that these stresses can make a significant contribution to fuel particle failures. It was also determined that the irradiation temperature has a significant effect on stresses in the particle because of its effect on both creep and swelling of the pyrocarbons. Calculations indicate that a decrease in irradiation temperature significantly increases the tensile stress in the IPyC layer of a normal particle and the stresses in the vicinity of the crack tip of a particle having a cracked IPyC. This increase in stress is due to a reduction in stress relaxation caused by a smaller creep coefficient at the lower temperature. Our evaluation into the effects of shrinkage cracks has been published in the Journal of Nuclear Materials (Miller et al., 2001). 2.1.1.4 Basic Approach Used in Fuel Performance Model Results of the investigation into the effects of shrinkage cracks indicate the need to address failure mechanisms that involve multidimensional behavior in fuel particles. These must be considered in addition to the one-dimensional behavior associated with the traditional pressure vessel failure. The approach used in the PARFUME performance model is to perform finite element analyses using the ABAQUS Code (Hibbitt, Karlsson, and Sorenson, Inc., 1998) to characterize particle behavior over a range of parameters involving a multi-dimensional failure mechanism. Statistical fits are then performed on the results obtained from the ABAQUS analyses. Finally, the statistical fits are incorporated into the PARFUME code, where the Monte Carlo method is employed to calculate the expected failure probability for a statistical sample of fuel particles. This approach is depicted in Figure 2.5. The structural and statistical models developed so far are discussed below. Structural Models The ABAQUS program is used in the performance model to perform finite element stress analysis on coated fuel particles. This program is capable of simulating the complex behavior of the coating layers, and it can be used to evaluate multidimensional effects, such as shrinkage cracks in the IPyC, partial debonding between layers, and asphericity. ABAQUS analyses are also used as a benchmark for validating simplified solutions that may be employed in the performance model. The condition of a cracked IPyC is included as a potential failure mechanism in the fuel performance model, and it has been evaluated using ABAQUS analyses.
7
Figure 2.5. Flow diagram showing general approach ABAQUS models for both normal and cracked three-layer geometries have been developed as shown in Figure 2.6. These are axisymmetric models that allow for asymmetry in the polar angle of spherical coordinates, thus enabling an evaluation of multidimensional effects on the stress behavior of the coating layers. The model of the normal spherical particle, which has no cracks or defects in the layers of the particle, is used to demonstrate behavior of a normal particle in expected reactor conditions, as well as to determine stresses in the various layers throughout irradiation. The IPyC and OPyC layers are assumed to remain fully bonded to the SiC layer. The model consists of quadrilateral axisymmetric elements, giving the effect of a full sphere. Only the three structural layers (i.e. the IPyC, SiC, and OPyC) of the particle are included in the model. The layer thicknesses for the IPyC, SiC, and OPyC are nominally set at 40, 35, and 43 µm, respectively. The kernel diameter and buffer thicknesses are nominally set at 195 and 100 µm, respectively, resulting in an outside particle diameter of 631 µm. Any of these dimensions can be varied as desired. An internal pressure is applied in the analysis to simulate the buildup of fission gas pressure. Particles are analyzed in a viscoelastic time-integration analysis that progresses until the fluence reaches a specified value. The model for a cracked particle is identical in all respects to that of the normal particle except that it has a radial crack through the thickness of the IPyC layer. The crack is typical of those observed in postirradiation examinations of the NP-MHTGR fuel particles. During irradiation, shrinkage of the initially intact IPyC layer induces a significant tensile stress in that layer. If the tensile strength of the IPyC layer is exceeded, then a radial crack develops in the IPyC layer. Figure 2.7 plots a calculated tangential stress history for the SiC layer of a normal (uncracked) particle. As shown, the SiC remains in compression largely because of the shrinkage in the pyrocarbon layers (the IPyC pulls while the OPyC pushes on the SiC). Figure 2.7 also plots the maximum principal stress in the SiC layer near the crack tip of a particle with a cracked IPyC. In the particle analyzed, the crack leads to a calculated tensile stress in the SiC layer of about 440 MPa. It can be seen that a cracked IPyC greatly changes the stress condition in the SiC, which significantly increases the probability of SiC failure.
Perform regressionanalysis on analysisresults.
Produce algorithm forcalculating maximumstress in SiC layer.
Finite elementanalysis
Statisticalanalysis
Failure probabilitydetermination
Inputparameters
Perform finite elementanalysis on crackedparticles for selectedrange of parametricvariations.
Employ algorithm tocalculate SiC stresses inMonte Carlo samplingprogram.
Use Weibull statisticalapproach to determinefailure probability for abatch of fuel particles.

8
Figure 2.6. Finite element models for normal and cracked configurations Statistical Evaluations Investigations have been performed into the statistical variations in fuel particle design parameters. In the case of a normal particle, statistical variations in design parameters are treated with simplified solutions built into the PARFUME code, rendering finite element analysis unnecessary. In the case of a cracked particle, however, finite element analyses are performed to capture the multidimensional behavior and thereby characterize the effects of variations in these parameters. Based on the results of analyses on cracked particles, the following six variables have been judged to be important in describing the behavior of the cracked particle and thus meriting a detailed statistical evaluation: IPyC thickness, SiC thickness, OPyC thickness, IPyC density, BAF of the IPyC, and irradiation temperature. Other parameters such as kernel diameter and buffer thickness are less important and have not yet been addressed in these studies because of the size of the statistical base. These parameters have been held constant throughout the analyses at values typical of TRISO particles.
Figure 2.7. Time histories for stress in SiC layer for normal and cracked particles

9
Three values for each of five factors were chosen for analysis in a statistical study of the cracked particle, as shown in Table 2.1. The sixth factor, irradiation temperature, was analyzed at the four values shown. A full-factorial statistical analysis, involving 243 load cases for each irradiation temperature (972 runs total), allowed an evaluation of all six factors (i.e. A = IPyC thickness, B = SiC thickness, C = OPyC thickness, D = IPyC density, E = BAF (of IPyC), F = irradiation temperature) and their interactions (e.g., AB, ABF, BCDF, AB2CD, BC2D2EF, ABCDEF).
Table 2.1. Range of parameters selected for ABAQUS analyses
Factor Low Nominal High A (µm) 30 40 50 B (µm) 25 35 45 C (µm) 33 43 53 D (g/cm3) 1.8 1.9 2.0 E 1.0 1.16 1.32 F (°C) 600 800, 1000 1200
The Design Expert program (Whitcomb et al., 1993) was used to perform both an effects analysis and a regression analysis on the data obtained from the ABAQUS analyses on the cracked particle. The effects analysis showed the relative significance of varying each of the parameters, while the regression analysis produced an algorithm that can be used to predict the stress level in the SiC layer of a cracked particle. The program used response surface analysis to develop a sixth-order polynomial that statistically fit the stress data to within 0.5 % accuracy. This algorithm has been incorporated in the PARFUME code to calculate failure probabilities utilizing a Monte Carlo sampling approach (within the range of parametric variations considered above). The program uses the Weibull statistical approach to estimate the potential for fracture of the SiC layer in a particle that has a cracked IPyC. A fracture mechanics approach has been deemed impractical since the material discontinuity at the interface of the IPyC and SiC layers greatly complicates the calculation of stress intensity at the crack tip. In the failure probability calculations, the stress (in the SiC layer of a sampled particle) calculated by the algorithm is compared to a strength value to determine whether the particle fails. The mean strength for these comparisons is derived from the Weibull characteristic strength (σ0) and accounts for the intensification of stresses that occurs in the region surrounding the crack tip. A journal article has been prepared concerning development of the statistical treatment of the ABAQUS stress results; the article has not yet been submitted for publication. When the PARFUME code samples a particle it first uses a closed-form solution (Miller and Bennett, 1993) to calculate stresses in the IPyC layer and thereby determine (with Weibull statistics) whether the particle has a cracked or uncracked IPyC layer. If the IPyC layer is cracked, then the code uses the approach described above to determine whether the particle fails. If the IPyC is uncracked, then the code first uses the closed-form solution to determine the SiC stress, and it next uses this stress in a Weibull statistical evaluation to determine whether the particle fails. In its Monte Carlo sampling, the code performs statistical variations on any number of input parameters (such as IPyC, SiC, OPyC thicknesses, IPyC BAF, etc.) by applying Gaussian distributions to these parameters. 2.1.1.5 Cracked Particle Model and Results for NPR Experiments The capabilities of the PARFUME code to predict failure probabilities for fuel particles having a cracked IPyC were used in predicting failure probabilities for three irradiation experiments conducted as part of the NP-MHTGR program in the early 1990s. Fuel compacts were irradiated at the High Flux Isotope Reactor (HFIR) and the Advanced Test Reactor (ATR) in the United States. TRISO-coated particles containing high-enriched uranium were irradiated at temperatures between 750 and 1250 °C, burnups between 65 and 80% FIMA, and fluences between 2 and 3.8×1025 n/m2. On-line fission gas release measurements indicated significant failures during irradiation. Post-irradiation examination (PIE) of individual fuel compacts revealed the presence of radial cracks in all layers of the TRISO coating. The levels of cracking measured during PIE are shown in Table 2.2. The particle dimensions, burnup, end-of-life fluence, irradiation temperature, and 235U enrichment were set to appropriate values for each experiment. Included in the results shown in Table 2.2 are the percentage of particles predicted to have a cracked

10
IPyC and the percentage of particles predicted to fail because of a cracked SiC. It is seen that the program predicts that the IPyC layer cracks in 100% of the particles for every compact tested. In reality, the PIE revealed that the actual failure fractions were less than this, as shown in the table. It is believed that the creep coefficients currently used in the PARFUME code are too low, which allows the calculated shrinkage stresses to reach too high a value before creep relaxation takes effect. The failure probabilities predicted by PARFUME for the SiC layer are somewhat high relative to the irradiation test results. However, were the number of cracked IPyCs reduced through the use of a higher creep coefficient, a closer correlation would be observed. The particle samples for the irradiation tests are typically small (< 300 particles), so precise correlations with the test results are difficult to attain. The predictions are in agreement with the test results in indicating that percent-level particle failures are expected. This type of correlation is generally not achieved if shrinkage cracks in the IPyC are ignored. The question arises as to how much the creep coefficient would have to be increased before the predicted number of IPyC failures would match the test results. This was determined for all three tests, and the results for the compact NPR-2 A4 are presented in Figure 2.8. The horizontal dashed line in the graph corresponds to the actual percentage of IPyC failures occurring in the compact. These results together with those of the other tests indicate that the creep coefficient would have to be amplified by a factor in the range of 2 to 3 to gain a good correlation with the test results. The effect of a higher creep coefficient on the SiC failure percentages cannot yet be ascertained because the statistical algorithm used to calculate SiC stresses in a cracked particle was developed on the basis of the lower creep coefficients. Table 2.2. Comparison of ceramographic observations to PARFUME calculations for TRISO coated fissile fuel particles
Irradiation Conditions Fuel Compact ID
Fast Fluence (1025 n/m2)
Irradiation Temp. (°C)
Burnup (%FIMA)
NPR-2 A4 3.8 746 79 NPR-1 A5 3.8 987 79 NPR-1 A8 2.4 845 72 NPR-1A A9 1.9 1052 64
IPyC Layer (a) Sample Size % Failed 95% Conf.
Interval (%) Calc.
NPR-2 A4 83 65 54 < p < 76 100 NPR-1 A5 39 31 17 < p < 47 100 NPR-1 A8 53 6 2 < p < 16 100 NPR-1A A9 17 18 5 < p < 42 100
SiC Layer (a) Sample Size % Failed 95% Conf.
Interval (%) Calc.
NPR-2 A4 287 3 2 < p < 6 8.2 NPR-1 A5 178 0.6 0 < p < 3 1.6 NPR-1 A8 260 0 0 < p < 2 4.9 NPR-1A A9 83 1 0 < p < 5 0.9
(a) Layer failure is considered as a through wall crack as measured by PIE.

11
Figure 2.8. Predicted IPyC failures as a function of the creep coefficient 2.1.1.6 Standard Particle Model and Results for EU High-Burnup Case The closed-form solution for the standard (uncracked) particle of the PARFUME code was used to calculate stress levels in EU (German) fuel particles. A major difference between the EU particle and the NPR particle is that the former has a much larger kernel diameter (500 vs. 200 µm), which makes for a significantly larger particle. A calculated time history for the maximum tangential stress in the SiC layer of a nominal EU particle is presented in Figure 2.9. This calculation was made for a particle having a 235U enrichment of 8%, an end-of-life burnup of 8.5% FIMA, and an end-of-life fluence of 2.3×10²¹ neutrons/cm2. Calculations were performed at various levels of burnup, up to a maximum of 21% FIMA. A range of 235U enrichment from 8 to 20% was considered in these calculations, but the enrichment had no effect on the magnitude of the calculated stress. The maximum tangential stress occurring in the SiC layer at the end of life is plotted in Figure 2.10 as a function of burnup, showing that an increasing burnup results in an increasing stress. Because it is believed that the creep coefficients in PARFUME are too low, the same calculations were performed where the creep coefficient in each case was amplified by a factor of 2.5. These results are also shown in Figure 2.10, which demonstrate that the higher creep coefficient results in a significantly higher stress in the SiC layer. The results of Figures 2.9 and 2.10 correspond to an irradiation temperature of 900 °C. Since temperature variations affect the material properties of the coating layers, analyses were also performed at temperatures of 700 and 1100 °C (using the amplification factor of 2.5 on creep). Results for these temperature variations are presented in Figure 2.11. Because creep is greater at a higher temperature, the compressive stress in the SiC layer is reversed earlier during irradiation. This results in a higher (less compressive) stress at the end of life.
NPR-2 A4
0102030405060708090
100
1 1.5 2 2.5 3 3.5 4 4.5
Factor Applied to Creep Coefficient
Per
cen
t IP
yC F
ailu
res

12
Figure 2.9. Time history for tangential stress in the SiC layer of EU particle.
Figure 2.10. Calculated SiC stress as a function of burnup for the EU particle at 900 °C.
EU Particle
-600
-500
-400
-300
-200
-100
0
0 5 10 15 20 25
End-of-life burnup (%FIMA)
SiC
Str
ess
(MP
a)
CEGA creep
Amplified creep

13
Figure 2.11. Effect of temperature on the SiC stress in the EU particle 2.1.1.7 Effects of Thermal Cycling The effects of thermal cycling, which results from multiple passes through the core during the lifetime of a fuel particle, have been investigated. For example, a stress history was calculated for the IPyC layer of a normal (uncracked) particle that was subjected to ten thermal cycles between temperatures of 600 and 1200 °C over its irradiation lifetime. This stress history is plotted in Figure 2.12 along with stress histories for particles that were subjected to constant temperatures of 600 and 1200 °C through their lifetimes. It is seen that the stress in the cycled particle fluctuates mildly at a level near the average of the stresses for the other two particles. The results indicate that the failure of particles that experience multiple passes through the core can be evaluated by using an adjusted average for the high and low temperatures to which they are subjected.
Figure 2.12. Effect of thermal cycling between 600 and 1200°C
EU Particle
-300
-250
-200
-150
-100
-50
0
0 5 10 15 20 25
End-of-life burnup (%FIMA)
SiC
Str
ess
(MP
a)
700 C
900 C
1100 C

14
2.1.1.8 Effects of Varying Poisson’s Ratio in Creep for the Pyrocarbons The effect of varying Poisson’s ratio in creep has also been investigated. The closed-form solution that is used in the PARFUME code to determine stresses in a standard particle (Miller and Bennett, 1993) was initially derived under a simplifying assumption that Poisson’s ratio in creep for the pyrocarbons is 0.5. The solution has now been extended so that other values can be used. Because some literature sources indicate that this ratio could be closer to 0.4, analyses were performed to determine the effect that this might have on stresses in the IPyC and SiC. Results for several cases are shown in Table 2.3, where stresses for the IPyC and SiC are listed for values of Poisson’s ratio (νc) of 0.5 and 0.4. These are maximum stresses occurring throughout the irradiation history. The results show that decreasing Poisson’s ratio in creep from 0.5 to 0.4 significantly decreases the stresses in the coating layers in all cases. The IPyC stresses decreased on the order of 25% while the SiC stresses decreased on the order of 20%. Because decreases of this magnitude could significantly affect particle failure probabilities, Poisson’s ratio in creep is an important parameter in fuel modeling. Table 2.3. Effect of reducing Poisson’s ratio in creep for the pyrocarbons
Case IPyC Stress (MPa, tension) SiC Stress (MPa, compression) νc = 0.5 νc = 0.4 νc = 0.5 νc = 0.4 Nominal, T = 1273°K
475 351 847 697
Nominal, T = 873°K
627 488 1107 948
NPR-1 A9 430 307 784 610 NPR-2 A4 599 449 1101 895 (a) The nominal case has the ‘nominal’ parameters from Table 2.1. 2.1.1.9 Calculating Particle Batch Failure Probabilities Using an Integral Formulation The failure probability for a batch of fuel particles generally depends on statistical variations in a number of parameters and on variations in the strength of the SiC layer among particles in the batch. The probability is traditionally calculated using the Monte Carlo method, wherein a large number of particles are statistically sampled to account for the variations. The lower the failure probability, the larger this sample of particles must be to produce an accurate estimate of the probability. Sampling a large number of particles to calculate small failure probabilities can be a time consuming effort. Therefore, an alternative integral formulation has been developed to make the failure probability determination more efficient. The stress in the SiC layer may be a function of several parameters, each having a statistical (normal) distribution, and the strength of the SiC layer may follow a Weibull distribution. For the case where the stress is a function of only two parameters, the following expression has been developed for the failure probability (Pf) of a statistical sample of particles:
( ) ( )∫ ∫∞
∞−
∞
∞−
−
−−−−−= jk
vvg
Dv
k
Dv
j
f dvdveeD
eD
P
m
ms
kj
kkkjjj σµµ
ππ
),(
2/2/ 2222
2
1
2
11 (2.2)
where νj, vk = two independent parameters which vary among particles in the statistical sample µj, µk = mean values for the two parameters Dj, Dk = standard deviations for the two parameters g(νj,vk) = stress in the SiC layer as a function of the two parameters

15
σms = Weibull mean strength of the SiC layer for particles in the sample m = Weibull modulus of the SiC layer for particles in the sample. Determining the failure probability for a batch of particles is reduced to performing a numerical integration of the expression above in lieu of Monte Carlo sampling. This method has not yet been implemented in the PARFUME performance model. 2.1.2 Fission Gas Release, CO Production and Fission Product Chemistry The second critical piece of the fuel performance model is the physiochemical behavior of the fuel. The purpose of this module is to describe the evolution of the fuel kernel in terms of fission gas production and release, oxygen release during fission, chemical redistribution of that oxygen among the fission products and carbon in the buffer layer, and potential CO production. This work has just started. Results to date are presented in the following subsections. 2.1.2.1 Fission Gas and CO Release Model The fission gas release model calculates the amount of CO and noble fission product gases released to the void volume of the fuel particle. This quantity is used to determine the internal gas pressure of the fuel particle according to the Ideal Gas Law. For each gas species i, the amount released is determined by (moles gas)i = (release fraction)i (fission yield)i (burnup) (moles fuel). (2.3) Fission yields for the significant noble fission product gases, xenon and krypton, are taken from the ORIGEN-2 computer code database (Croff, 1980). For uranium based fuels, the production of krypton decreases with time, while the production of xenon increases with time because of the increasing yield contribution from conversion plutonium fission. Within reasonable accuracy, the sum of the xenon and krypton yields may be assumed to be a constant throughout the life of the fuel; a value of 0.259 is currently used. The release fraction for noble fission product gases considers recoil from the outer shell of the fuel kernel into the buffer and diffusive transport to free surfaces. Recoil release is based upon standard geometrical considerations (Olander, 1976) and average fission fragment ranges. For particle fuel, the recoil release fraction is calculated as (release fraction)recoil = 0.25 [ rk
3 – ( rk - d )3 ] / rk
3 (2.4) where rk = radius of fuel kernel, and d = average fission fragment range. The average fission fragment ranges are calculated for a given fuel composition from compiled elemental data (Littmark and Ziegler, 1980). Based upon fission energies of 107 MeV for krypton and 72 MeV for xenon, the average krypton range is 5.8 µm and the average xenon range is 4.1 µm in UO2 with a density of 10.5 g/cm3. Diffusive release is calculated according to the Booth equivalent sphere diffusion model (Booth and Rymer, 1958) and is expressed as ∞ (release fraction)diffusive = 1 - (6 / D′t) Σ [1- exp( -n2 π2 D′t )] / n4 π4 (2.5) n = 1 where D′ = D / a2, t = irradiation time, a = radius of equivalent sphere, and D = diffusion coefficient.
16
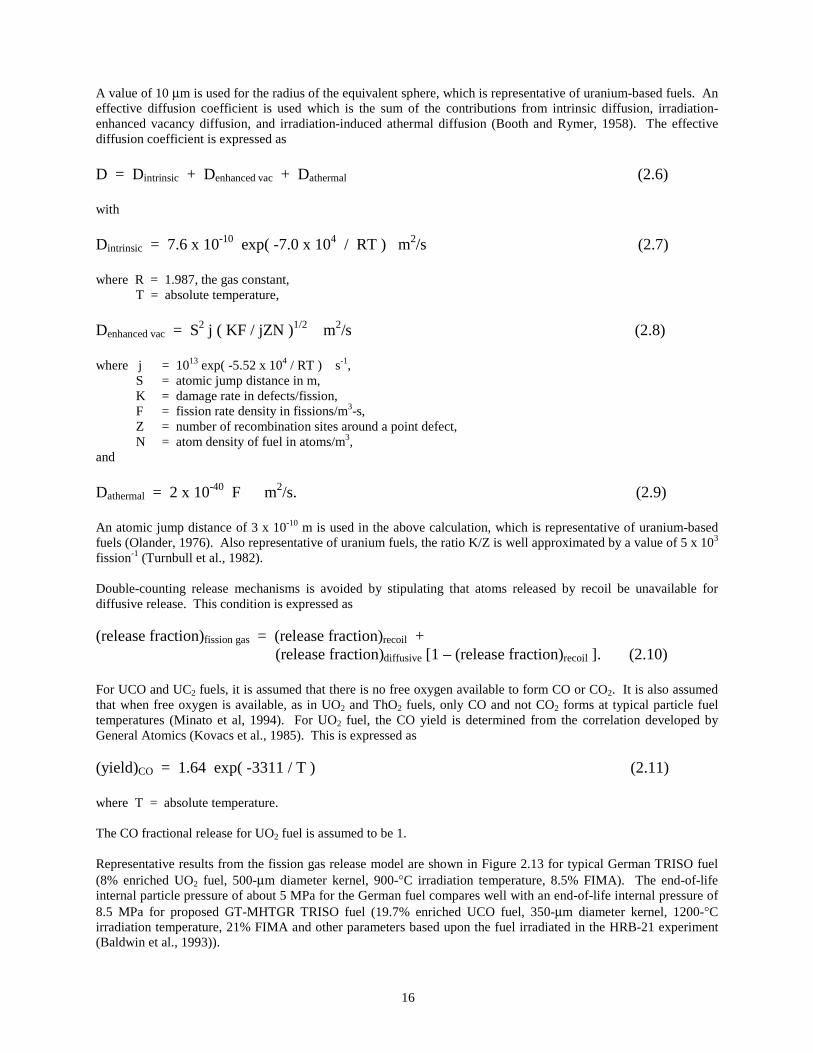
A value of 10 µm is used for the radius of the equivalent sphere, which is representative of uranium-based fuels. An effective diffusion coefficient is used which is the sum of the contributions from intrinsic diffusion, irradiation- enhanced vacancy diffusion, and irradiation-induced athermal diffusion (Booth and Rymer, 1958). The effective diffusion coefficient is expressed as D = Dintrinsic + Denhanced vac + Dathermal (2.6) with Dintrinsic = 7.6 x 10⁻¹⁰ exp( -7.0 x 10⁴ / RT ) m2/s (2.7) where R = 1.987, the gas constant, T = absolute temperature, Denhanced vac = S2 j ( KF / jZN )1/2 m2/s (2.8) where j = 1013 exp( -5.52 x 10⁴ / RT ) s-1, S = atomic jump distance in m, K = damage rate in defects/fission, F = fission rate density in fissions/m3-s, Z = number of recombination sites around a point defect, N = atom density of fuel in atoms/m3, and Dathermal = 2 x 10-40 F m2/s. (2.9) An atomic jump distance of 3 x 10⁻¹⁰ m is used in the above calculation, which is representative of uranium-based fuels (Olander, 1976). Also representative of uranium fuels, the ratio K/Z is well approximated by a value of 5 x 10³ fission-1 (Turnbull et al., 1982). Double-counting release mechanisms is avoided by stipulating that atoms released by recoil be unavailable for diffusive release. This condition is expressed as (release fraction)fission gas = (release fraction)recoil + (release fraction)diffusive [1 – (release fraction)recoil ]. (2.10) For UCO and UC2 fuels, it is assumed that there is no free oxygen available to form CO or CO2. It is also assumed that when free oxygen is available, as in UO2 and ThO2 fuels, only CO and not CO2 forms at typical particle fuel temperatures (Minato et al, 1994). For UO2 fuel, the CO yield is determined from the correlation developed by General Atomics (Kovacs et al., 1985). This is expressed as (yield)CO = 1.64 exp( -3311 / T ) (2.11) where T = absolute temperature. The CO fractional release for UO2 fuel is assumed to be 1. Representative results from the fission gas release model are shown in Figure 2.13 for typical German TRISO fuel (8% enriched UO2 fuel, 500-µm diameter kernel, 900-°C irradiation temperature, 8.5% FIMA). The end-of-life internal particle pressure of about 5 MPa for the German fuel compares well with an end-of-life internal pressure of 8.5 MPa for proposed GT-MHTGR TRISO fuel (19.7% enriched UCO fuel, 350-µm diameter kernel, 1200-°C irradiation temperature, 21% FIMA and other parameters based upon the fuel irradiated in the HRB-21 experiment (Baldwin et al., 1993)).

17
In the longer term, we will develop a complete thermodynamic prediction of the chemical states of all important fission products (as oxides, carbides or in elemental form) and determine the amount of oxygen available to react with the buffer to form CO. That work has just started, and the preliminary steps are discussed in the next section.
0
1
2
3
4
5
6
0 200 400 600 800 1000 1200
Irradiation Time (days)
Inte
rnal
Pre
ssu
re (
MP
a)
Total internal pressure
CO partial pressure
Fission gas partial pressure
Figure 2.13. Internal gas pressure for typical German TRISO fuel.
2.1.2.2 Fission Product Chemistry Module The goal of the fission product chemistry module is to determine the chemical state of the fission products (carbide, oxide, or elemental) as a function of uranium loading in the pebble, U-235 enrichment, pebble burnup, and temperature. We started by calculating fission product inventories. Fission product inventories were calculated as a function of uranium loading, enrichment and burnup, as described in Section 3.1.6 below. These results were fit analytically for eventual use in the fission product chemistry module What follows below is a brief description of the mathematical approach to generate the correlation, the range of validity of the correlation, and its uncertainty. The two correlating variables are the burnup, BU, and the initial U-235 enrichment, E. The cumulative generation of any fission product, FP, is fitted by a 5th-order polynomial of the burnup:
)()()()()()()( 33
42
51 BULogEcBULogEcBULogEcFPLog ++=
)()()()()( 65
24 EcBULogEcBULogEc +++ (2.12)
where FP is given in mol/g-U235, E is given in wt%, and BU is given MWd/kgHM. The coefficients are cubic functions of the enrichment E:
14132
123
111 cEcEcEcEc +++=)( (2.13)
24232
223
212 cEcEcEcEc +++=)( (2.14)
. . . . . . . .
64632
623
616 cEcEcEcEc +++=)( (2.15)
There are 24 coefficients per fission product. Because 48 fission products are tracked, it is necessary to specify a total of 24×48=1152 coefficients. These coefficients are calculated with the “POLYFIT” function of MATLAB,

18
which implements a standard least-mean-squares algorithm. The numerical values of the coefficients are not reported here because they are of no technical interest. However, the relative error of the correlation in reproducing the discrete data is illustrated in Figure 2.14. It can be seen that a vast majority of the data are reproduced with an error of ±2%. However, all data are reproduced with an error of at most ±8%, which is judged acceptable. The correlation is applicable for BU between 0.3 and 113 MWd/kgHM, and for E between 7 and 20 wt%.
Figure 2.14. Performance of the fission-product correlation. In Figure 2.15, the ability of the correlation to reproduce the odd variation of some fission product inventories with burnup is demonstrated. In the coming year these results will be used in a thermodynamic code (e.g. HSC) to calculate the chemical state of the fission product and uranium in the kernel. These results will also be fit to simple analytical correlations and used in the fuel performance model.

19
10-1
100
101
102
103
10-20
10-19
BU (MWd/kgHM)
FP
(m
ol/g
-U23
5)
Cobalt10% U235 Enrichment
a. Cobalt
10-1
100
101
102
103
10-16
10-15
BU (MWd/kgHM)
FP
(m
ol/g
-U23
5)
Copper10% U235 Enrichment
b. Copper Figure 2.15. Variation of selected fission-product inventories

20
10-1
100
101
102
103
10-17
10-16
BU (MWd/kgHM)
P (
mol
/g-U
235)
Nickel10% U235 Enrichment
c. Nickel
10-1
100
101
102
103
10-8
10-7
10-6
10-5
10-4
BU (MWd/kgHM)
FP
(m
ol/g
-U23
5)
Niobium10% U235 Enrichment
d. Niobium
Figure 2.15 (continued)
2.2 Studies at MIT The purpose of the fuel performance task for this year at MIT was to develop an integrated fuel performance model with increased accuracy to predict the behavior of TRISO-coated fuel particles. The developed model will be used to develop optimized fuel designs. During this year we have developed the full mechanical model and are in the process of comparing the MIT results with those of the INEEL team. The chemical model is less fully developed and consists of only those components necessary for the evaluation of fission-gas-induced pressure. While individual components of the model vary in degree of sophistication, they are, in total, sufficient for use as an initial predictor of fuel performance. The development of a fuel performance model has been broken into three major sub-tasks:
1. The simulation of reactor core environment for fuel particles 2. Analyses of chemical behavior of fuel particles
21
3. Modeling of the mechanical behavior of fuel particles including fuel failure. 2.2.1 In-Core Environment: Simulation of Core Fueling The modeling of the pebble-bed reactor requires that accurate power histories be obtained. This task is complicated by the fact that an individual pebble may be recycled through the core more than 10 times during its exposure. In many PBR designs, the entry point for each pass through the core is essentially randomly determined. Using the VSOP program (Teuchert et al., 1980), we are able to obtain the neutron flux and temperature distribution in the steady-state reactor core given its specifications. The refueling process is then simulated by allowing each pebble to be cycled through the core using a random entry point for each pass. The power vs. time (position) is recorded for each pass through the core, and a total power history is eventually built. With this approach, we are able to simulate the realistic reactor environment and capture the history-dependent behavior of particles. After the power history is generated, fuel particle dimensions and initial properties are sampled in a Monte Carlo simulation process to develop approximately 2 million power-history/properties combinations. These combinations are then processed by the fuel performance model to access the mechanical evolution of the particles and to estimate failure probabilities. 2.2.2 Chemical Model The majority of the individual models in the current chemical model are taken from an existing German KFA fuel performance model and incorporated directly. The German models are very simplified and need to be modified to account for variable temperature-time histories. 2.2.3 Mechanical Model Development The mechanical model plays a key role in predicting the rupture of fuel coatings. It consists of a stress analysis model and a mechanical failure model. During this year, the stress analysis has been improved to account for a changing creep Poisson’s ratio during exposure. This improvement has resulted in a more realistic stress vs. time calculation. A fracture-mechanics-based failure model has been developed to deal with stress concentration from macroscopic cracks in coatings. This approach shows promise in predicting fuel failure and has been implemented in the fuel performance model. During the last quarter of the year an extensive effort was made to resolve differences between the predictions of the model developed at MIT and those of the companion model being developed at INEEL. Differences in the calculated failure probabilities between the two models were attributable to differences in the values used for the Poisson’s ratio in creep for the pyrocarbons and in the values used for the Weibull parameters for the pyrocarbons. When these differences were removed, the models produced comparable results. The MIT model allows for a variable Poisson’s ratio in creep and now uses the same integral approach as used by the INEEL for determining the Weibull mean strength. The MIT model was used to evaluate a number of fuel designs and to compare results with literature and with results of the INEEL model. For these comparisons, we used fuel characteristics that are similar to those for the High Temperature Test Reactor (HTTR) in Japan and the New Production Reactor (NPR), a conceptual design from the early 1990s for a prismatic high-temperature gas-cooled reactor (HTGR) intended for the production of weapons tritium. These comparisons are not meant to duplicate HTTR and/or NPR fuel. Thus, we refer to “NPR-type”, and “HTTR-type” fuel designs in the remainder of this report. 2.2.3.1 Benchmarking the Stress Analysis Model Fuel performance models for particle fuel suffer from the disadvantage that it is essentially impossible to verify, using actual data, the detailed stresses and/or dimensional changes that occur during irradiation. Under these circumstances, we have chosen to compare our results with those of other investigators, in particular recent results from Sawa et al. (1996) and INEEL. First we compared our stress calculations in a simple preset environment with those from Sawa et al. Sawa et al. analyzed fuel used in HTTR initial fuel loading. The HTTR uses particle fuel arranged in a prismatic core design. The key parameters for this analysis are given in Table 2.4. In the comparison,

22
we used the properties given by Sawa et al. where possible. However, some of the properties were not provided in their paper. In this case best-estimate engineering judgment was used. The mechanical properties and irradiation data for pyrocarbon and SiC were taken from Ho et al. (1993) since they were not provided by Sawa et al. The fuel particle was irradiated to 3.0 x 10²¹ neutrons/cm-2 at a temperature of 1300 °C. The results of this comparison are shown in Figure 2.16. Table 2.4. HTTR-type Fuel Characteristics _____________________________________________________________________________________________ Property Mean Value Std. Dev. Distribution Type _____________________________________________________________________________________________ Kernel Diameter (µm) 600 12.0 Triangular Buffer Thickness (µm) 60 10.0 Triangular IPyC Thickness (µm) 30 6.0 Triangular SiC Thickness (µm) 25 2.0 Triangular OPyC Thickness (µm) 45 3.0 Triangular UO2 Enrichment (% U-235) 20.0 0.15 Triangular Fuel Density (gm/m3) 10.7 0.1 Triangular Buffer Density (gm/cm3) 1.1 0.05 Triangular IPyC/OPyC Strength (MPa) 160 4.0 (modulus) Weibull SiC Initial Strength (MPa) 834 8.0 (modulus) Weibull SiC KIC (MPa√µm) 3300 530 Triangular IPyC/OPyC BAF0
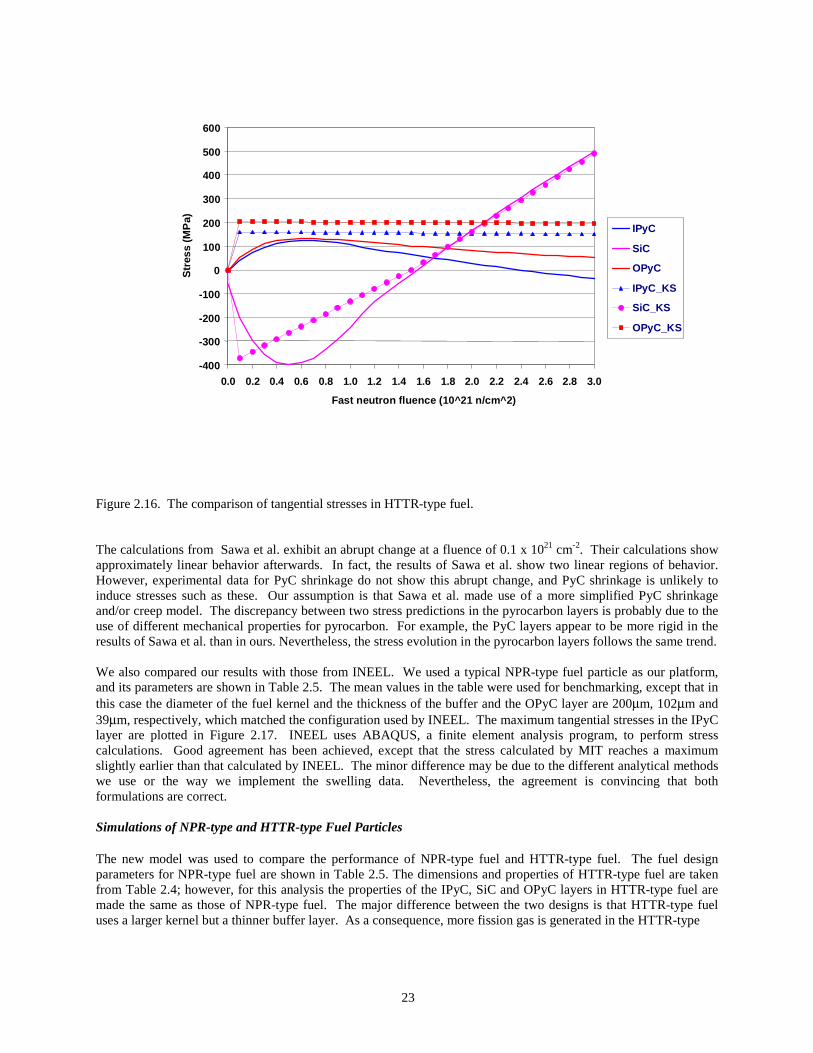
† 1.02 Fuel Temperature (°C) 1300 Fast Fluence (E>0.18 MeV) 3.0 x 10²¹ (n/cm2) EOL Burnup (GWd/T) 66 _____________________________________________________________________________________________ † Pre-irradiation BAF In Figure 2.16, the lines without symbols represent our calculations of tangential stresses in the three structural layers. The lines with symbols, labeled “KS” in the legend, are from Sawa et al. (1996) Initially, the SiC is placed in compression. This is due to neutron-induced shrinkage of the adjacent PyC layers. Accordingly, the IPyC and OPyC layers are placed in tension. As the irradiation progresses, the pyrocarbon shrinkage rate gradually decreases, but only slightly. At the same time, fission gases build up in the buffer layer, which increases the internal pressure and, hence, pushes the layer stress in the positive direction. The internal pressure buildup eventually offsets the shrinkage-induced compression in the SiC and leads to increasing tensile stress at the end of the exposure. At higher fluence the stress is dominated by the internal pressure in the particle. The calculations for the SiC layer agree with each other quite well at high burnup, whereas our results show a slower relaxation early in the irradiation.
23
Figure 2.16. The comparison of tangential stresses in HTTR-type fuel. The calculations from Sawa et al. exhibit an abrupt change at a fluence of 0.1 x 1021 cm-2. Their calculations show approximately linear behavior afterwards. In fact, the results of Sawa et al. show two linear regions of behavior. However, experimental data for PyC shrinkage do not show this abrupt change, and PyC shrinkage is unlikely to induce stresses such as these. Our assumption is that Sawa et al. made use of a more simplified PyC shrinkage and/or creep model. The discrepancy between two stress predictions in the pyrocarbon layers is probably due to the use of different mechanical properties for pyrocarbon. For example, the PyC layers appear to be more rigid in the results of Sawa et al. than in ours. Nevertheless, the stress evolution in the pyrocarbon layers follows the same trend.
We also compared our results with those from INEEL. We used a typical NPR-type fuel particle as our platform, and its parameters are shown in Table 2.5. The mean values in the table were used for benchmarking, except that in this case the diameter of the fuel kernel and the thickness of the buffer and the OPyC layer are 200µm, 102µm and 39µm, respectively, which matched the configuration used by INEEL. The maximum tangential stresses in the IPyC layer are plotted in Figure 2.17. INEEL uses ABAQUS, a finite element analysis program, to perform stress calculations. Good agreement has been achieved, except that the stress calculated by MIT reaches a maximum slightly earlier than that calculated by INEEL. The minor difference may be due to the different analytical methods we use or the way we implement the swelling data. Nevertheless, the agreement is convincing that both formulations are correct. Simulations of NPR-type and HTTR-type Fuel Particles The new model was used to compare the performance of NPR-type fuel and HTTR-type fuel. The fuel design parameters for NPR-type fuel are shown in Table 2.5. The dimensions and properties of HTTR-type fuel are taken from Table 2.4; however, for this analysis the properties of the IPyC, SiC and OPyC layers in HTTR-type fuel are made the same as those of NPR-type fuel. The major difference between the two designs is that HTTR-type fuel uses a larger kernel but a thinner buffer layer. As a consequence, more fission gas is generated in the HTTR-type
-400
-300
-200
-100
0
100
200
300
400
500
600
0.0 0.2 0.4 0.6 0.8 1.0 1.2 1.4 1.6 1.8 2.0 2.2 2.4 2.6 2.8 3.0
Fast neutron fluence (10^21 n/cm^2)
Str
ess
(MP
a)
IPyC
SiC
OPyC
IPyC_KS
SiC_KS
OPyC_KS

24
Table 2.5. Typical NPR Fuel Kernel Properties & Distribution Parameters _____________________________________________________________________________________________ Property Mean Value Max/Min Std. Dev. Dist Type _____________________________________________________________________________________________ Kernel Diameter (µm) 195 207.7/182.3 5.20 Triangular Buffer Thickness (µm) 100 125.0/75.02 10.2 Triangular IPyC Thickness (µm) 53 62.01/43.99 3.68 Triangular SiC Thickness (µm) 35 42.64/27.36 3.12 Triangular OPyC Thickness (µm) 43 52.82/33.18 4.01 Triangular UO2 Enrichment (% U-235) 93.15 93.17/93.13 0.01 Triangular Fuel Density (gm/cm3) 10.52* 10.54/10.50 0.01 Triangular Buffer Density (gm/cm3) 0.9577 1.080/0.8352 0.05 Triangular IPyC BAF0 † 1.063 1.076/1.050 0.00543 Triangular OPyC BAF0 † 1.036 1.051/1.021 0.00622 Triangular IPyC σ0 (MPa.meter3/m) 24.55 9.5 (modulus) Weibull OPyC σ0 (MPa.meter3/m) 19.60 9.5 (modulus) Weibull SiC σ0 (MPa.meter3/m) 9.64 6.0 (modulus) Weibull SiC KIC (MPa√µm) 3300 530 Triangular _____________________________________________________________________________________________ * Fuel can be either UCO or UO2. It’s UCO here. † Pre-irradiation BAF fuel kernel, but this gas occupies a smaller volume in the porous buffer. We thus expect a higher internal pressure acting on the inner surface of the IPyC layer. The effects of this will be shown shortly. In the analysis we exposed the nominal particles for each fuel design to a typical PBR power history. Figures 2.18 and 2.19 show typical temperature-time histories for NPR-type and HTTR-type fuel. The temperature-time history for a typical particle of each fuel type corresponds to the power history shown in Figure 2.20. It must be stressed that these figures show only a single power or temperature history from an analysis of one million cases for each design. In Figures 2.18 and 2.19, the temperature closest to the vertical axis is the temperature in the fuel center. The temperature profile proceeds outward through the fuel kernel, buffer and structural coating layers (IPyC, SiC and OPyC). The significant temperature drop in the fuel particle occurs in the buffer region because of its low density and hence its lower conductivity. Notice that this temperature drop in NPR-type fuel is much larger than in the HTTR-type fuel. This is because we impose the constraint that the power of one particle of both types is the same by imposing the same power history for each. Since the NPR-type fuel uses a much smaller kernel and is made from highly enriched uranium, the volumetric heat generation rate is much higher. As a result, its fuel center temperature climbs to about 1300 °C. Typically, the temperature variation through the structural layers is on the order of 1-2 °C. Another observation is that the temperature “swing” that a particle may experience during a cycle can be more than 800 °C. Also, when we compare PBR time-temperature profiles to the time-temperature profile for a typical LWR fuel pellet, we observe that the pebble-bed fuel experiences a more severe time-temperature history. The number of cycles is greater (10 vs. 3 or 4) and the temperature swing during a cycle is larger. Finally, as has been mentioned earlier, the pebble-bed fuel time-temperature cycle is not within the

25
0
50
100
150
200
250
300
350
400
0 0.5 1 1.5 2 2.5 3
Fast Neutron Fluence (10^21 neutrons/cm^2))
Str
ess
(MP
a)
MIT
INEEL
Figure 2.17. Comparison of tangential stresses in the IPyC layer of NPR-type fuel calculated by MIT and INEEL control of the fuel manager as it is, to some extent, in the LWR case. In a typical LWR fuel cycle a fuel pellet will experience a continuously decreasing average temperature during exposure both because of planned fuel shuffling between cycles and because of fissile material depletion. Since the temperature strongly influences the mechanical and chemical processes in a particular particle, one would expect a wide variation in overall particle behavior and, in turn, potentially wide variations in performance. The comparison of circumferential stresses in NPR fuel and HTTR fuel is shown in Figure 2.21. Solid lines are for NPR-type fuel and broken lines are for HTTR-type fuel. It can be seen that the overall shape of stress evolution is comparable to that in Figure 2.16. The ripple pattern imposed on it is the direct result of thermal cycling. Every time the fuel particles exit the reactor core, they suffer a temperature drop, and hence an internal pressure drop. It is interesting to note that when the pressure drops, instead of relaxing as one might expect, the particle is actually stressed more. This is explained as follows. Initially, the SiC is in compression induced by the shrinkage of the OPyC and IPyC layers. However, the effect of internal pressure is in the opposite direction from the effect of IPyC shrinkage. Therefore, when the internal pressure is lowered, the effect of PyC shrinkage is enhanced, because the stresses imposed by the shrinkage are not opposed by as much internal pressure. One point we want to make here is that although high internal pressure is not favorable, a suitable amount of internal pressure could be beneficial in controlling the stress state of particles.
If we compare the behavior of these two types of fuel particles, we can make three major observations. First, the amplitude of power-induced stress ripples in the SiC layer of the HTTR-type fuel is larger because of higher internal pressure, which results from more fission gas release from the HTTR fuel and less void volume in the buffer layer to accommodate gases. Meanwhile, high internal pressure causes the irradiation-stressed particle to relax more quickly, as can be seen at the end of irradiation. Second, as stated above, higher internal pressure counteracts the effect of IPyC shrinkage and results in lower tension in the IPyC layer of HTTR fuel. This will result in a lower IPyC stress and a reduced level of IPyC cracking. Third, the stresses in the OPyC layers of the two types of particles are almost the same. This is because the SiC layer is so rigid that it decouples the OPyC layer from what is inside. Therefore, even though the configurations of two particles differ significantly, this difference barely influences the stresses in the OPyC layer, which are governed by that layer’s own shrinkage.

26
Figure 2.18. Typical NPR-type fuel temperature history.
Figure 2.19. Typical HTTR-type fuel temperature history.

27
Figure 2.20. Typical particle power history in a PBR.
Figure 2.21. Tangential stress evolution in NPR-type and HTTR-type fuel.
0.0E+00
2.0E+06
4.0E+06
6.0E+06
8.0E+06
1.0E+07
1.2E+07
1.4E+07
1.6E+07
0 100 200 300 400 500 600 700 800
Irradiation time (days)
Pow
er d
ensi
ty (
W/m
^3)

28
2.2.3.2 Fuel Failure Probability The two fuel designs were analyzed using Monte Carlo sampling, where the power histories were derived from the VSOP output for the MPBR described earlier. One million cases were run for each fuel design. The results of this analysis are shown in Table 2.6. All failures predicted are induced by IPyC cracking followed by SiC failure as opposed to failure by overpressure. Notice that the failure probability of the SiC layer is lower in both fuel designs than that of the IPyC, because there are cases where the IPyC cracked, but the fracture toughness of the SiC was not exceeded. As was explained earlier, the circumferential stress in the IPyC layer of HTTR type fuel is lower, whereas the strength of the IPyC layers in both designs is about the same. As a result, the failure probability of the IPyC and SiC in HTTR-type fuel is much lower. Table 2.6. NPR-type and HTTR-type fuel failure predictions
Case
Sampled IPyC Failure Probability
OPyC Failure Probability
SiC Failure Probability
Particle Failure Probability
NPR-type fuel 1,000,000 27.79% 17.07% 13.30% 13.30% HTTR-type fuel 1,000,000 5.660% 16.22% 0.1017% 0.1017%
2.2.4 Conclusions and Future Work The fuel performance model has been developed to a point where useful comparisons between different fuel designs can be made on a relative basis. The failure model is adequate for failure prediction. The chemistry model is currently very primitive and useful for fission gas release and internal pressure calculations only. The path forward in the development process will be to focus first on enhancing the mechanical and failure models. In the current model, once a PyC crack develops the SiC failure occurs instantaneously if KIC is exceeded. No further evolution of the stresses is allowed if failure is not predicted. Yet we know that further shrinkage of the PyC will result in an increase in K. Also, future efforts will be focused on developing a better calculation of the crack tip stresses in the SiC caused by cracking in the PyC layers. The net effect of these two enhancements will be to result in an increased failure probability from the former and a decrease in failure probability from the latter. The net effect is not known at this time, but engineering judgment indicates that a net decrease in predicted failure probability will result. On the chemistry modeling side, as soon as the INEEL-developed chemistry model is available it will be evaluated and incorporated into the overall model.
References Baldwin, C. A., et al., September 1993. “Interim Postirradiation Examination Data Report for Fuel Capsule HRB 21,” ORNL/M-2850, Oak Ridge National Laboratory. Booth, A. H., and G. Rymer, August 1958. “Determination of the Diffusion Constant of Fission Xenon in UO2 Crystals and Sintered Compacts,” CRDC-720, Atomic Energy of Canada Ltd. CEGA Corporation, July 1993. “NP-MHTGR Material Models of Pyrocarbon and Pyrolytic Silicon Carbide,” CEGA-002820, Rev. 1. Croff, A. G., July 1980. “ORIGEN2 – A Revised and Updated Version of the Oak Ridge Isotope Generation and depletion Code,” ORNL-5621, Oak Ridge National Laboratory. Hibbitt, Karlsson, and Sorenson, Inc., 1988. ABAQUS User’s Manual, Version 5.8. Ho, et al., 1993. “Material Models of Pyrocarbon and Pyrolytic Silicon Carbide,” CEGA Project No. 89001.
29
Kovacs, W. J., et al., 1985. “High-Temperature Gas-Cooled Reactor Fuel Pressure Vessel Performance Models,” Nuc. Tech., 68, 344. Littmark, U., and J. F. Ziegler, 1980. “Handbook of Range Distributions for Energetic Ions in All Elements,” Pergamon Press, New York. Miller, G. K., and R. G. Bennett, 1993. “Analytical Solution for Stresses in TRISO-coated Particles,” J. Nucl. Mat. 206, p. 35. Miller, G. K., D. A. Petti, D. J. Varacalle, and J. T. Maki, 2001. “Consideration of the Effects on Fuel Particle Behavior from Shrinkage Cracks in the Inner Pyrocarbon Layer,” J. Nucl. Mat. 295, p. 205. Minato, K., et al., 1994. “Fission Product Behavior in TRISO-Coated UO2 Fuel Particles,” J. Nucl. Mater. 208, 266. Nemeth, N. N., J. M. Mandershield and J. P. Gyekenyesi, 1989. “Ceramics Analysis and Reliability Evaluation of Structures (CARES) User’s and Programmer’s Manual,” NASA Technical Paper 2916. Olander, D. R., 1976. “Fundamental Aspects of Nuclear Reactor Fuel Elements,” TID-26711-P1, ERDA. Sawa, K., 1996. et al., J. of Nuclear Science & Technology 33, No. 9, pp. 712-720. Teuchert, E., U. Hansen, and K. A. Haas, March 1980. “V.S.O.P. - Computer Code System for Reactor Physics and Fuel-Cycle Simulation,” KFA-IRE Report Jül-1649. Turnbull, J. A., et al., 1982. “The Diffusion Coefficients of Gaseous and Volatile Species During The Irradiation of Uranium Dioxide,” J. Nucl. Mater. 107, 168. Whitcomb, P., et al., 1993. Design-Expert, Version 4.0, Stat-Ease Inc.

30
3.0 Reactor Physics Research
3.1 INEEL Work 3.1.1 Introduction Fiscal Year 2001 saw great progress in the Reactor Physics research area in the Pebble-Bed Reactor LDRD program. The INEEL Reactor Physics Team’s principal product, the PEBBED code, went from a proof-of-principle demonstration to a practical analysis tool that was actually used to address several pebble-bed reactor physics issues. An archival paper was accepted by Annals of Nuclear Energy on the proof-of-principle version of PEBBED, and refereed conference papers were accepted for presentation at the American Nuclear Society’s Winter 2001 Meeting at Reno, Nevada – one describing a major enhancement of the code, and another describing an application of the code to assess the resistance of pebble-bed reactors (PBRs) to nuclear weapons proliferation. This report summarizes the accomplishments of the INEEL Reactor Physics Team during FY 2001. These accomplishments, briefly summarized, are: • The code was rewritten from MATLAB to FORTRAN • An expanded isotopics package was installed, which enables the code to track the accumulation and depletion
of a user-specified set of nuclides • The one-group treatment of neutron energy was replaced by a multigroup treatment of up to eight energy
groups, with upscattering allowed in cases of multiple thermal groups • A new recirculation algorithm was developed to model arbitrary user-defined recirculation schemes, using an
innovative matrix method; with this algorithm, the code can track the individual neutronics histories of pebbles with differing compositions and recirculation patterns
• The geometric capabilities of the code were expanded to allow variable mesh spacing in Cartesian or cylindrical geometry in one or two dimensions
• The recirculation module was modified to accommodate ex-core radioactive decay • The code was used to evaluate the peak flux and eigenvalue of the startup and equilibrium cores of both the
HTR Modul 200 and Eskom PBMR pebble-bed reactor designs • PEBBED was used to evaluate the fluence-burnup-temperature histories of typical and extreme pebble
trajectories in the Eskom PBMR design; these results were used in the development of a fuel testing and qualification program slated for the INEEL’s Advanced Test Reactor.
Furthermore, PEBBED was used to evaluate one aspect of the proliferation risk of the PBR. The rate at which nuclear-weapons material could be overtly and covertly produced was found to be much lower than previously believed. The key characteristic of the core that limits the PBR from diversion to nuclear-weapons production is the very low excess reactivity implied by the on-line refueling in PBR designs. In addition to the PEBBED work summarized above, a parallel effort was being performed at the Georgia Institute of Technology, funded by the Pebble-Bed LDRD, to develop a state-of-the-art method for calculation of multigroup diffusion parameters such as nuclear reaction cross sections. This method will eventually be coupled to PEBBED. The Georgia Tech team, led by Professor Farzad Rahnema, made good progress during FY 2001; their accomplishments were presented in a 60-page report that was sent to the INEEL Reactor Physics Team for comments at the end of the fiscal year. Another perspective on nonproliferation was taken in a study of plutonium isotopics and production rate in a unit-cell model for the MCNP code (Briesmeister, 1997). This study also found that PBRs would give very low plutonium production rates, or poor isotopics, or both. The achievements summarized above are described in greater detail in the following sections.

31
3.1.2 Advances in the Development of PEBBED 3.1.2.1 PEBBED 2.0 – the FORTRAN Version of PEBBED Originally, PEBBED was written in the MATLAB language. MATLAB is a flexible high-level language very well suited for rapid implementation of algorithms to validate or refine concepts for computational analysis. It is not well suited for use in a production code, because it requires too much CPU time to perform its calculations. The original proof-of-principle version of PEBBED (PEBBED 1.0) was written in MATLAB because the objective of that code was simply to confirm the viability of the novel approach conceived by the Reactor Physics Team for the self-consistent computation of fuel burnup and neutron flux in a reactor with a flowing core. After the Reactor Physics Team’s solution approach was validated by PEBBED 1.0, the next step in the development of the approach was to rewrite the code in a more powerful computing language. The widely used and understood FORTRAN language was chosen for this development, and PEBBED was translated into FORTRAN. This translation was the beginning of PEBBED 2.0. 3.1.2.2 Expanded Isotopics Tracking The depletion solver in PEBBED 1.0 is quite limited in that it tracks only the capture and fission of U-235 and U-238. It also computes the spatially dependent xenon and samarium concentrations. The depletion equations for these isotopes were hardwired into the code. PEBBED 2.0 uses a generalized production-depletion routine with a nuclide chain specification similar to that in the HARMONY (Breen, 1965) system. Atomic weights, decay constants, fission yields, and capture and fission cross sections for up to 30 separate isotopes are read from input (more isotopes can be accommodated by simply changing a parameter specification in the code). Linear chain parameters (link and loss coefficients, decay yields, precursor identifiers) computed from input data couple adjacent nuclides. Multiple precursors as well as complex looping chains can be handled by appropriate specification of chain parameters, but cases run thus far have had simple chains that do not exploit these features. Rather than solving iteratively a system of linear differential burnup equations as done in other pebble-bed fuel management codes, PEBBED 2.0 solves the analytical equations for nuclide concentration over a region small enough that the flux may be assumed constant within it. The constant flux assumption is not necessary for solving these equations, but it is suitable for the current version of PEBBED, in which the diffusion equation solver meshes are the same as those used in the burnup solver. Like the previous version, PEBBED 2.0 assumes that pebble flow is strictly axial, so this redundancy in mesh structure is allowed. Future versions of the code that model non-axial streamline flow will require the decoupling of the diffusion and burnup meshes. The depletable isotopes modeled in recent PEBBED runs include U-235, U-238, Np-239, Pu-239, Pu-240, Pu-241, Pu-242, Xe-135, I-135, Pm-149, and Sm-149. Non-depletable isotopes include C-12, O-16, and Si-28. A ‘void’ isotope uses zeroed cross-sections and an effective diffusion coefficient computed from transport theory (Gerwin and Scherer, 1987) to model the coolant space above the pebble bed. 3.1.2.3 Multigroup Energy Treatment PEBBED 1.0 solves the basic 1-group finite difference approximation to the steady-state neutron diffusion equation. PEBBED 2.0 solves the multigroup finite difference form of the diffusion equation. The code allows up to eight energy groups and employs a standard inner (flux) and outer (source) iteration technique with successive overrelaxation acceleration. An extra source term iteration is used when the modeling of upscattering in multiple thermal groups is desired. 3.1.2.4 Enhancements to the Geometric Modeling Capability In regions where steep gradients exist in the neutron flux, flow speed, or material compositions, high resolution in the spatial mesh definition is required for accurate numerical solution of the governing equations. However, it is computationally inefficient to specify the same fine mesh spacing for the whole reactor as that which is required
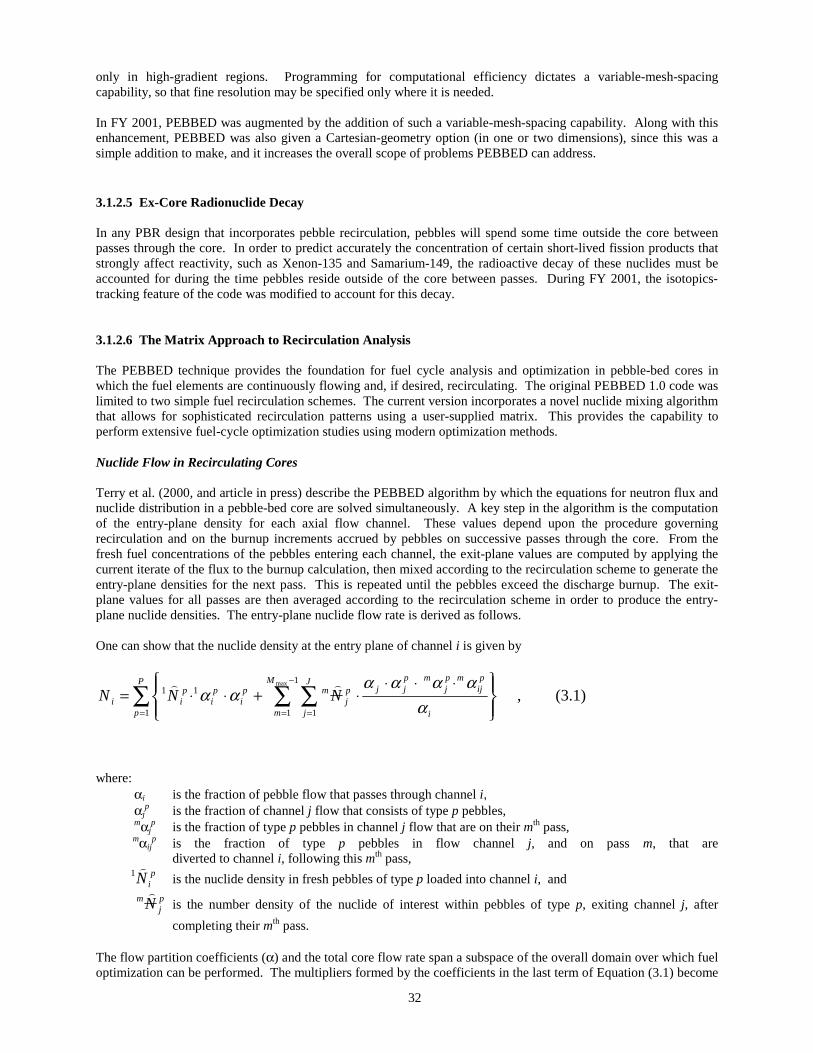
32
only in high-gradient regions. Programming for computational efficiency dictates a variable-mesh-spacing capability, so that fine resolution may be specified only where it is needed. In FY 2001, PEBBED was augmented by the addition of such a variable-mesh-spacing capability. Along with this enhancement, PEBBED was also given a Cartesian-geometry option (in one or two dimensions), since this was a simple addition to make, and it increases the overall scope of problems PEBBED can address. 3.1.2.5 Ex-Core Radionuclide Decay In any PBR design that incorporates pebble recirculation, pebbles will spend some time outside the core between passes through the core. In order to predict accurately the concentration of certain short-lived fission products that strongly affect reactivity, such as Xenon-135 and Samarium-149, the radioactive decay of these nuclides must be accounted for during the time pebbles reside outside of the core between passes. During FY 2001, the isotopics-tracking feature of the code was modified to account for this decay. 3.1.2.6 The Matrix Approach to Recirculation Analysis The PEBBED technique provides the foundation for fuel cycle analysis and optimization in pebble-bed cores in which the fuel elements are continuously flowing and, if desired, recirculating. The original PEBBED 1.0 code was limited to two simple fuel recirculation schemes. The current version incorporates a novel nuclide mixing algorithm that allows for sophisticated recirculation patterns using a user-supplied matrix. This provides the capability to perform extensive fuel-cycle optimization studies using modern optimization methods. Nuclide Flow in Recirculating Cores Terry et al. (2000, and article in press) describe the PEBBED algorithm by which the equations for neutron flux and nuclide distribution in a pebble-bed core are solved simultaneously. A key step in the algorithm is the computation of the entry-plane density for each axial flow channel. These values depend upon the procedure governing recirculation and on the burnup increments accrued by pebbles on successive passes through the core. From the fresh fuel concentrations of the pebbles entering each channel, the exit-plane values are computed by applying the current iterate of the flux to the burnup calculation, then mixed according to the recirculation scheme to generate the entry-plane densities for the next pass. This is repeated until the pebbles exceed the discharge burnup. The exit-plane values for all passes are then averaged according to the recirculation scheme in order to produce the entry-plane nuclide densities. The entry-plane nuclide flow rate is derived as follows. One can show that the nuclide density at the entry plane of channel i is given by
∑ ∑ ∑=
−
= =
⋅⋅⋅
⋅+⋅⋅=P
p
M
m
J
j i
pij
mpj
mpjjp
jmp
ip
ip
ii NNN1
1
1 1
11max
ααααα
αα��
, (3.1)
where: αi is the fraction of pebble flow that passes through channel i, αj
p is the fraction of channel j flow that consists of type p pebbles, mαj
p is the fraction of type p pebbles in channel j flow that are on their mth pass, mαij
p is the fraction of type p pebbles in flow channel j, and on pass m, that are diverted to channel i, following this mth pass,
piN
�1 is the nuclide density in fresh pebbles of type p loaded into channel i, and
pj
m N�
is the number density of the nuclide of interest within pebbles of type p, exiting channel j, after
completing their mth pass. The flow partition coefficients (α) and the total core flow rate span a subspace of the overall domain over which fuel optimization can be performed. The multipliers formed by the coefficients in the last term of Equation (3.1) become

33
the elements of a recirculation matrix ℜ. The values for pij
mpjj ααα and ,, uniquely determine p
jmα and are
dependent upon the number of pebble types, the flow properties of the core, and the flexibility of the pebble loading and discharge mechanisms. All are computed in advance of the flux calculation. For example, if the core is to contain only one pebble type, as in the HTR Modul 200 design (Frewer et al., 1985), then p = 1 and
1=pjα for all j. (3.2)
The pebbles in this design are loaded and unloaded in a purely random manner. The values of the recirculation matrix elements are thus determined entirely by the maximum number of passes that the average pebble completes
before final discharge (Mmax) and the fractional flow area of each of the flow channels (αi); i.e., ip
ijm αα = .
The Pebble-Bed Modular Reactor (PBMR) design (Nicholls, 2001) under consideration by the South African utility Eskom uses two pebble types (graphite and fuel), which are modeled as flowing through five channels in the core (following de Haas et al., 2001). The innermost channel is composed of only graphite pebbles to limit power peaking. The second channel is a 50/50 mixture of fuel and graphite pebbles, and the outer three channels consist only of the fueled type. The radial placement and discharge of pebbles are not dependent on burnup or pass number. The recirculation matrix ℜ is a combination of two submatrices: one for fuel,
=ℜ
5432
5432
5432
5432
max
5.0
5.0
5.0
5.5.5.25.0
00000
1
αααααααααααααααα
α ff
M, (3.3a)
and one for graphite,
=ℜ
00000
00000
00000
00025.5.
0005.
121
21
max
αααα
α gg
M . (3.3b)
The coefficients α f and α g refer to the fraction of pebbles in the core composed of fuel and graphite, respectively. A fast flux map (Figure 3.1) is shown for the Eskom case described above. The significant drop in flux near the core center indicates the lack of fuel in the central graphite column.

34
3.1.3 Application of PEBBED to the Analysis of Pebble-Bed Reactors 3.1.3.1 Evaluation of Peak Neutron Flux and Core Eigenvalue of HTR Modul 200 and Eskom PBMR The capabilities of the PEBBED 2.0 code described above were exploited to generate core eigenvalue and power peaking data for the HTR Modul 200 (Frewer et al., 1985) and the Eskom PBMR (Nicholls, 2001) reactor designs. Both quantities are strong functions of the cross sections that are supplied as input parameters, and the techniques for accurate evaluation of cross sections for PEBBED are still being developed. Nonetheless, the capability of the code to provide core-wide parameters is displayed in the following plots. Figure 3.2a shows the thermal (<1.86 eV) flux in the Eskom PBMR, while Figure 3.2b shows the corresponding burnup profile. Figures 3.3 and 3.4 show the thermal flux and local fission power density for the HTR Modul 200 with a fresh core (initial startup) and the equilibrium core, respectively. The PBMR core exhibits a high thermal flux peak in the central reflector region, where little absorption occurs. The bottom reflector peak is less pronounced than in the HTR Modul core. The burnup plot in Figure 3.2 indicates the mixing of pebbles at ten stages of burnup (10 passes per pebble before discharge). Pebbles first enter the core with 0 MWd/kg of heavy metal and are recirculated until their burnup exceeds 80 MWd/kgHM. Thus the average of all pebbles in a region of the core falls between 40 and 50 MWd/kgHM, with the average local burnup increasing toward the core bottom. Notable features are caused by the geometry of the HTR core. The sizable peaks near the bottom and periphery of the pebble bed are the result of thermalization of neutrons in the bottom and radial reflectors. A void space exists between the top of the pebble bed and the top reflector, so the thermalization peak there is much less significant. The core eigenvalues are higher than 1.0 because control rods, natural poisons in the graphite, and most fission products are not included in the model. Variations in cross sections caused by temperature and burnup variations have yet to be modeled as well.
Top and Center of Core
r (m) z (m)
φ (n/cm2s)
Figure 3.1. Fast (>0.11MeV) Flux in Eskom PBMR Core at Equilibrium
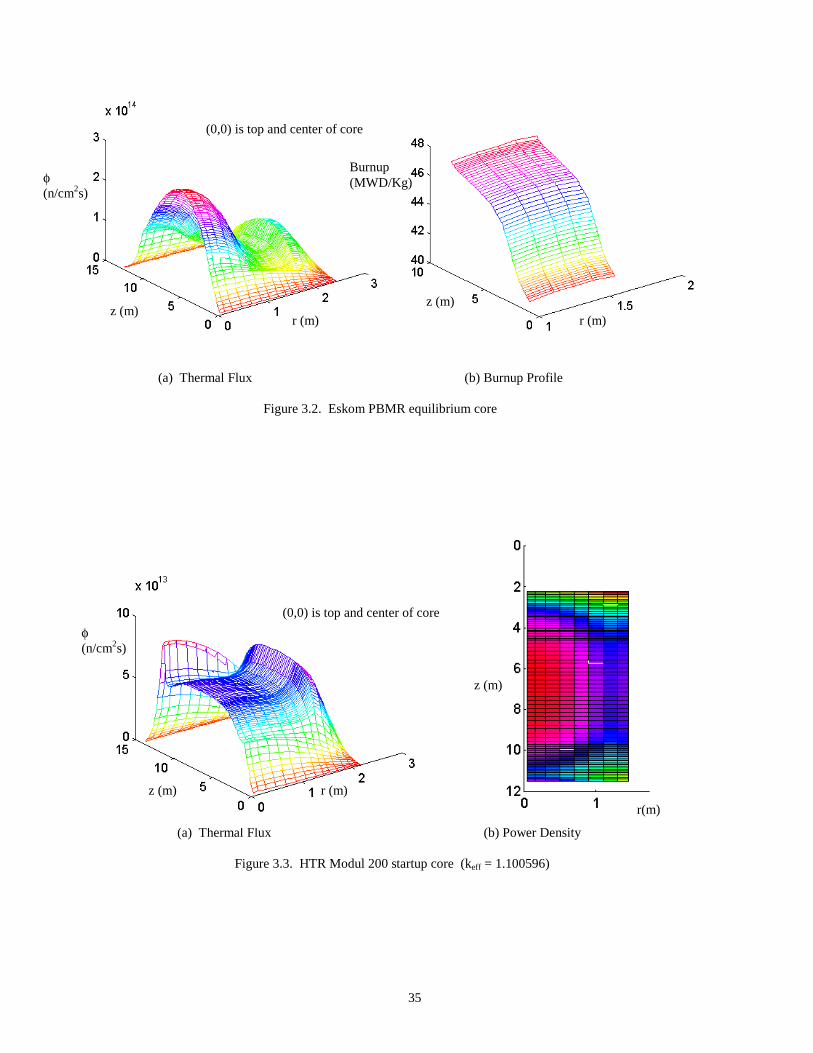
35
(a) Thermal Flux (b) Power Density
Figure 3.3. HTR Modul 200 startup core (keff = 1.100596)
z (m)
r(m)
(0,0) is top and center of core
z (m)
r (m)
φ (n/cm2s)
(a) Thermal Flux (b) Burnup Profile
Figure 3.2. Eskom PBMR equilibrium core
(0,0) is top and center of core
z (m) r (m)
φ (n/cm2s)
z (m)
r (m)
Burnup (MWD/Kg)

36
3.1.3.2 Support of Planning for Testing of Eskom PBMR Fuel in the Advanced Test Reactor The INEEL is pursuing a program of fuel testing and qualification for the Eskom PBMR (Nicholls, 2001) featuring its Advanced Test Reactor (ATR). The ATR is ideally suited for irradiation of nuclear materials because of the high fluxes generated in the reactor and because of the precise control of temperature and other test conditions that may be achieved in ATR experiments. In order for an appropriate test vehicle and program to be designed, the irradiation history of pebbles under normal and extreme operating conditions must be estimated. The PEBBED code was used to generate fluence, temperature, and burnup data for pebbles of the PBMR design. The PEBBED algorithm for determining the equilibrium flux and nuclide distributions lends itself to the generation of such pebble history data. After the equilibrium flux is computed, pebbles of each type in the core are ‘burned’ through it for as many passes as required to exceed the discharge burnup threshold. After each pass, the nuclide densities for each type and channel are mixed according to the user-specified recirculation matrix to compute the average burnup of pebbles at the entry plane in each channel. Pebble-type-dependent fluence, burnup, and power data accumulated during each pass are stored for final editing. Pebbles of the same composition but with different recirculation rules may also be tracked using this method. This feature was exploited to generate an ‘operating envelope’ to aid in the development of the fuel testing proposal. Fuel temperatures were computed using 1-D models for heat deposition into the coolant and heat conduction through the pebble. The axially dependent coolant temperature was computed for each channel from the local power density and pebble bed convection correlations obtained from Melese and Katz (1984). No cross-channel mixing of coolant was modeled. Heat transfer through the pebble was computed using a two-zone (graphite and fuel) spherical conduction model and constant conductivity values also obtained from Melese and Katz (1984). Graphite conductivity is strongly dependent upon temperature and irradiation history. Values were conservatively chosen to reflect end-of-life conditions. For the PBMR fuel testing proposal, data were obtained for PBMR pebbles undergoing the nominal (most probable) trajectory in the PBMR core operating at 265 MWth. Data were also obtained for pebbles traversing the same channel on each pass. Such trajectories are extremely unlikely given the random loading pattern of the PBMR design, but the histories generated present bounding cases for defining test conditions. In the following plots, the ‘mean’ label refers to the nominal pebble history while the ‘Ch. X’ label refers to a pebble that has been confined to channel X for its entire time in the core.
(a) Thermal Flux (b) Power Density Figure 3.4. HTR Modul 200 equilibrium core (keff = 1.046539)
z (m)
r (m)
(0,0) is top and center of core
z (m)
r (m)
φ (n/cm2s)

37
Figure 3.5 shows the accumulation of burnup over a pebble’s time in the PBMR core. The subtle ‘waviness’ in the curves is a result of non-uniformity in the axial flux profile. Note the relatively rapid rate of burnup accumulation in pebbles that are restricted to channel 2, i.e., next to the inner reflector. Figure 3.6 shows the power produced per pebble. Again, pebbles in channel 2 are subject to a significantly higher thermal flux and thus produce much more power than pebbles located elsewhere in the core. Because Ch. 2 is only half filled with fueled pebbles, these represent but a small fraction of the total fuel inventory. Thus the mean pebble power is much lower. Note also that the time between peaks varies slightly between the cases. This is a result of the different pebble velocities associated with the different radial channels.
. Figure 3.7 depicts the estimated pebble centerpoint temperature. Note the fact that Ch. 2 pebbles are not the hottest on average. A few factors account for this. Graphite has a much higher thermal conductivity than the pure UO2 used in LWR fuel ( ~30 W/m-K vs. 3 W/m-K), so that the heat generated in the pebble is quickly transferred to the coolant. Helium enters the PBMR core from the top and thus achieves its highest temperature at the bottom of the pebble bed where pebbles are just completing a pass. These two factors lead to a peak in the fuel temperature near the bottom of the core. Finally, since only half of the pebbles in Ch. 2 are fueled, the overall power density and thus the local coolant temperature are lower in this channel. Crossflow of helium between channels means that the actual difference in fuel temperatures between the channels is probably lower.
Figure 3.5. Pebble burnup accumulation in ESKOM PBMR
0
20
40
60
80
100
0 5000 10000 15000 20000 25000
Residence Time (hrs)
Bu
rnu
p (
MW
D/K
g)
MeanCh. 2Ch. 3Ch. 4Ch. 5

38
Figure 3.7. Estimated pebble peak fuel temperature in ESKOM PBMR.
0
200
400
600
800
1000
1200
1400
0 5000 10000 15000 20000 25000
Residence Time (hrs)
Fu
el T
emp
(d
egC
)
MeanCh. 2Ch. 3Ch. 4Ch. 5
Figure 3.6. Pebble power in ESKOM PBMR.
0
400
800
1200
1600
2000
0 5000 10000 15000 20000 25000
Residence Time (hrs)
Po
wer
(W
)
MeanCh. 2Ch. 3Ch. 4Ch. 5
39
3.1.4 Study of the Potential for PBRs to be Diverted for Production of Material for Nuclear Weapons 3.1.4.1 Introduction The PEBBED code was used to perform a preliminary study of the nonproliferation properties of the pebble-bed reactor concept. This concept is often criticized as a potentially highly proliferating machine because of its online refueling operation and because of the small size of its fuel elements (pebbles). The principal criticism is that online refueling and the frequency of refueling (many pebbles every day) could make the inclusion of target pebbles possible. Such target pebbles would then be diverted to extract weapons-grade plutonium from them. The scenario of greatest concern is a dual use of the reactor by a country with no significant fuel cycle facilities of its own. A country with advanced fuel cycle facilities could produce the materials for a nuclear bomb via more effective and efficient means. In this study, performed in FY 2001, the physics group has investigated the detectability of an attempt at clandestine dual use of a PBR. It was demonstrated that the dual use of a PBR does not produce weapons materials in an efficient way and that detection is very likely even in the early stages of the attempt. The study is summarized below. The bulk of the information given below has been presented at the ANS Winter Meeting of November 2001 in Reno, Nevada (Ougouag and Gougar, 2001). 3.1.4.2 Methodology The routine recirculation of the fuel pebbles and the online de-fueling and refueling of these reactors raise questions about their potential use as production facilities for weapons materials. However, these features also allow the reactors to operate with very little excess reactivity. The low excess reactivity makes possible an asymptotic fueling pattern with properties that are not suitable for the efficient production of plutonium. Building on this knowledge, in this work it is demonstrated that the dual use of a PBR (simultaneous production of power and weapons materials) would be easily and promptly detected. The PEBBED code computes directly the asymptotic (equilibrium) fuel-loading pattern of a PBR, given the fresh fuel composition. This asymptotic pattern is that which is established well after the initial loading (from at least 6 months to as much as 3 years) and persists for the remainder of the operating life of the reactor. The pattern and its properties, such as the radiological signatures of discharged fuel, are highly predictable. Presumably the result of extensive optimization, the fuel-handling procedures that lead to this pattern are unlikely to be changed by the owners. Departures from this pattern could be viewed as suspicious and as possible attempts at diversion of fuel for dual use. Any departure from the pattern will result in noticeable changes in fresh fuel requirements, power production, and/or discharge isotopics. All three attributes could easily be monitored via an instituted safeguard regime and via spent fuel re-purchase. As continuous burnup monitoring of discharged pebbles is part of the fuel management policy, the information on the isotopics could also be made available on-line or via the transmission of recorded data sets to the safeguards authority. Uninterrupted fuel supply would be contingent upon acceptable reactor use. The PBR owner is assumed to be a low technology country without front-end fuel cycle facilities (i.e. enrichment capability) and thus dependent on a supplier country for its fresh fuel needs. The supplier country is party to a non-proliferation regime and agrees to enforce safeguards on its fuel customers. Either the spent fuel is reclaimed or information on the isotopics of discharged pebbles is required. Finally, it is assumed that for economic reasons the on-hand fresh fuel inventory of the PBR owner is maintained as low as practical. In this paper, we assume that after the initial loading the fuel supplier periodically provides ninety days of fresh fuel to the PBR owner, just prior to stock exhaustion. The PEBBED code is first used to estimate the fresh fuel requirements of a PBR operated according to the asymptotic pattern with no attempt at dual use. The code is also used to estimate the fresh fuel requirements of a similar reactor operated with dual use intent. The modeled legitimate reactor is loosely based on the Kraftwerk Union HTR Modul 200 (Frewer et al., 1985), with a 10.0-m core height and a 3.0-m diameter. Graphite reflectors surround the core. The void space between the top of the pebble bed and the top reflector is about 80 cm. The fresh fuel pebbles contain 7 g of uranium enriched to 7.8%. They travel through the core with a mean velocity of 13.4 cm/day. The core produces 200 MWth of power. In the two illicit use cases, target pebbles containing natural uranium (NU) are assumed to be inserted into the core in the proportions of 0.1% and 0.4% of the overall fuel mix, respectively. The 0.4% content is a physical limit corresponding to the highest number of NU pebbles that can be incorporated into the core while retaining the same critical multiplication factor via the addition of supplementary fresh fuel pebbles. This hypothetical limit corresponds to the plenum above the pebble bed being filled. It cannot

40
be achieved in practice because there is no mechanical means for filling the plenum uniformly to its top, and it would be precluded from acceptance because of its hindrance of coolant flow. Nevertheless, this model provides an upper bound on the Pu-239 production rate possible with this reactor. The 0.1% NU pebble loading was chosen arbitrarily with the goal of dissimulating the dual use. Reactivity is maintained by the addition of about 18 cm of fuel mix. The PEBBED code explicitly models the two types of pebbles and assumes different circulation patterns for each. The regular fuel is recirculated a sufficient number of times to achieve the normal nominal burnup. The NU pebbles are circulated once then removed (the Once-Through-Then-Out, or OTTO, cycle) in order to maximize the plutonium quality (i.e., the ratio of Pu-239 to the other plutonium isotopes) in the extracted NU pebbles. The results from the PEBBED runs are used to assess the likelihood of detection of dual use attempts. 3.1.4.3 Results Results from PEBBED runs were used to generate the information presented in Table 3.1. In the 0.1% NU case, the fresh fuel supply would run out about 19 days prior to the predicted exhaustion of the on-hand fresh fuel. This will result in an outage of the reactor, an unexpected and highly detectable event. Similarly, if the PBR operator were to lower the power in order to extend operation until the receipt of a new supply of fresh fuel, the nearly 21% power decrease would be noticeable and would require explanation under safeguard agreements. Furthermore, the power decrease would imply lower fuel consumption than originally anticipated and would, under a rational safeguards regime, imply a reduced delivery of fuel at the following supply date. If the performance is repeated, it would eventually lead to increasingly shorter fuel reserves. Such a mode of operation would be uneconomical and politically questionable, as the dual use would become apparent. The illicit patterns of performance would be discovered during the first three-month fuel-use period of their occurrence, provided that the on-hand supply is replenished to result in stocks meant to last only three months. In contrast, the time required for accumulation of enough Pu-239 to make a bomb (about 5 kg) is very long: 92 years with continuous operation (unlimited fuel supply) and as high as 118 years if fuel shipments are restricted to the requirements of power production. In the 0.4% NU case, the detection would occur after only four days of operation, as the fuel supply would then be exhausted. The accumulation time would be 23 years (continuous) or 492 years (intermittent). The last data entry line in Table 3.1 shows the residual U-235 content of the discharged fuel pebbles for each case. Although the differences appear small, they are well within the detection limits of modern assay methods. Therefore, the discharge isotopics could also provide an effective tool for detecting attempts at dual use. However, this application will require the prior establishment of a database for legitimate discharge isotopics based on measurements, thus eliminating the error in prediction that can arise from the uncertainty in cross section data. 3.1.4.4 Conclusions It is clear that the PBR is a poor tool for production of Pu-239 in all circumstances, even if a continuous fresh fuel supply is assured. Indeed the lowest accumulation period of 23 years for a single device cannot be construed as the basis for a successful proliferation program. Furthermore, any attempt at dual use would be detected promptly and long before the significant accumulation of prohibited materials. Detection would occur within the first three months of illicit use in both cases considered. The results presented here apply to a hypothetical reactor similar in many of its features to the HTR-Modul 200 and assuming target pebbles similar to the fuel in that design (merely replacing the enriched uranium with natural uranium). The models assumed random circulation. The method should be applied to other reactor designs with a comprehensive examination of target pebble designs and recirculation patterns.
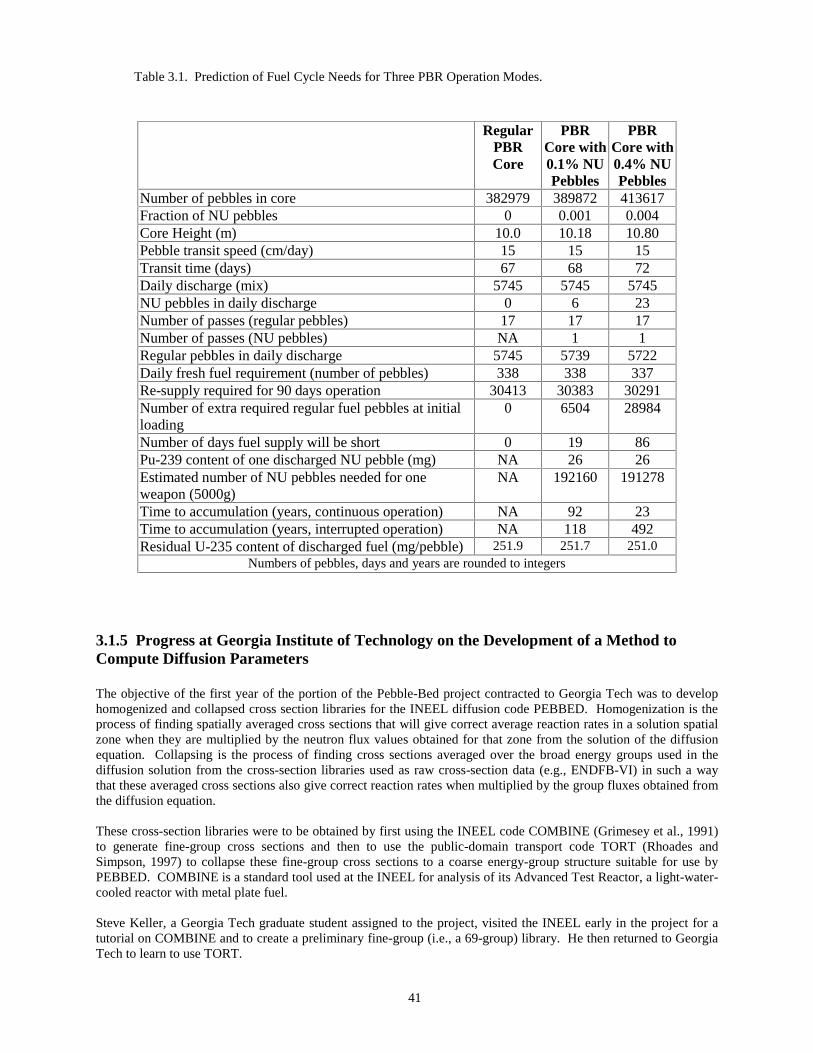
41
Table 3.1. Prediction of Fuel Cycle Needs for Three PBR Operation Modes.
Regular
PBR Core
PBR Core with 0.1% NU Pebbles
PBR Core with 0.4% NU Pebbles
Number of pebbles in core 382979 389872 413617 Fraction of NU pebbles 0 0.001 0.004 Core Height (m) 10.0 10.18 10.80 Pebble transit speed (cm/day) 15 15 15 Transit time (days) 67 68 72 Daily discharge (mix) 5745 5745 5745 NU pebbles in daily discharge 0 6 23 Number of passes (regular pebbles) 17 17 17 Number of passes (NU pebbles) NA 1 1 Regular pebbles in daily discharge 5745 5739 5722 Daily fresh fuel requirement (number of pebbles) 338 338 337 Re-supply required for 90 days operation 30413 30383 30291 Number of extra required regular fuel pebbles at initial loading
0 6504 28984
Number of days fuel supply will be short 0 19 86 Pu-239 content of one discharged NU pebble (mg) NA 26 26 Estimated number of NU pebbles needed for one weapon (5000g)
NA 192160 191278
Time to accumulation (years, continuous operation) NA 92 23 Time to accumulation (years, interrupted operation) NA 118 492 Residual U-235 content of discharged fuel (mg/pebble) 251.9 251.7 251.0
Numbers of pebbles, days and years are rounded to integers
3.1.5 Progress at Georgia Institute of Technology on the Development of a Method to Compute Diffusion Parameters The objective of the first year of the portion of the Pebble-Bed project contracted to Georgia Tech was to develop homogenized and collapsed cross section libraries for the INEEL diffusion code PEBBED. Homogenization is the process of finding spatially averaged cross sections that will give correct average reaction rates in a solution spatial zone when they are multiplied by the neutron flux values obtained for that zone from the solution of the diffusion equation. Collapsing is the process of finding cross sections averaged over the broad energy groups used in the diffusion solution from the cross-section libraries used as raw cross-section data (e.g., ENDFB-VI) in such a way that these averaged cross sections also give correct reaction rates when multiplied by the group fluxes obtained from the diffusion equation. These cross-section libraries were to be obtained by first using the INEEL code COMBINE (Grimesey et al., 1991) to generate fine-group cross sections and then to use the public-domain transport code TORT (Rhoades and Simpson, 1997) to collapse these fine-group cross sections to a coarse energy-group structure suitable for use by PEBBED. COMBINE is a standard tool used at the INEEL for analysis of its Advanced Test Reactor, a light-water-cooled reactor with metal plate fuel. Steve Keller, a Georgia Tech graduate student assigned to the project, visited the INEEL early in the project for a tutorial on COMBINE and to create a preliminary fine-group (i.e., a 69-group) library. He then returned to Georgia Tech to learn to use TORT.

42
In the course of developing the desired cross-section libraries, two discoveries were made. First, it was found that COMBINE does an inadequate job of treating the upper portion of the thermal neutron energy spectrum, which is populated by many more neutrons in graphite-moderated reactors like PBRs than in water-moderated reactors like the ATR. Second, it was found that TORT produced eigenvalues and cross sections that differed significantly from those calculated by the Monte Carlo code MCNP, which is often used as a benchmark for new methods. The discrepancies between TORT and MCNP results may be due to errors in the TORT input model or to shortcomings in the TORT code itself. They may also be due to the fact that TORT is restricted to either Cartesian or spherical geometry, and the PBR model, like all known PBR designs, is cylindrical. In any case, however, TORT input is arcane, and the complexity of specifying input for TORT invites errors. Furthermore, the GA Tech team found and documented several errors in the TORT manual, and there may be more, some of which could contribute to making input errors. The GA Tech team discovered an alternative transport code, EVENT, for which it is much easier to develop input files, and to which they (and INEEL) can obtain a conditional license without charge. The GA Tech team repeated the benchmarking calculations with EVENT, and the agreement between EVENT and MCNP was very good. The developer of EVENT, Professor Cassiano de Oliveira of the Imperial College, London, has engaged in extensive discussions with the GA Tech team and with the INEEL Reactor Physics Team, and the plan for the GA Tech cross-section development work has been changed to replace TORT by EVENT. There are several options for replacing COMBINE, and they are being investigated by the INEEL Reactor Physics Team. Despite the shortcomings of COMBINE and TORT, the GA Tech team did create cross-section libraries, as promised. However, substantial improvements in accuracy will be achieved when TORT and COMBINE are replaced by superior tools. 3.1.6 Analysis of Plutonium Concentration and Isotopics Based on the Reactivity-Limited Burnup of Pebble-Bed Reactor Fuel Using Various Enrichments 3.1.6.1 Introduction
Because one of the goals for next-generation (Generation IV) nuclear reactors is to increase their proliferation resistance as compared to the current generation of reactors, the work presented here illustrates the relative proliferation resistance of the pebble-bed reactor based on the plutonium content of the discharged fuel. All spent nuclear fuel that had an initial uranium loading contains an inventory of plutonium because of the conversion of uranium by neutron capture and subsequent decay. The main source of the fissile 239Pu is the following sequence of reactions:
PuNpUnU d.,m., 23935522394723239238 → →→+−− ββ .
Concern for the amount (and type) of fissile material present in spent fuel is based on the belief that this material can or may be used to create a weapon of mass destruction. It is generally thought that specific safeguards can be put in place to protect the spent fuel, thus preventing its theft. However, unfavorable discharge isotopics can also add a measure of protection, where the discharge isotopics are low in fissile material while high in absorbing material. By taking the fuel to higher burnups, the plutonium isotopic fractions (or plutonium vector) will begin to favor the fertile rather than fissile isotopes. 3.1.6.2 Modeling Methods Advances in computer hardware are now making it possible to apply Monte Carlo codes to the modeling of neutron and photon transport in pebble-bed reactors. MCNP (Monte Carlo N-Particle) (Briesmeister 1997) is a well-known Monte Carlo transport code developed at Los Alamos National Laboratory for neutral particle transport. The code is capable of using general 3-D geometries in calculating fluxes, reaction rates, heating rates, effective multiplication factors (keff), and other useful tabulations. Use of continuous-energy cross sections is making it the tool of choice for analyzing nuclear reactors. However, the stochastic nature of MCNP makes it quite cumbersome because of the long computational times needed, especially if a small uncertainty is required.
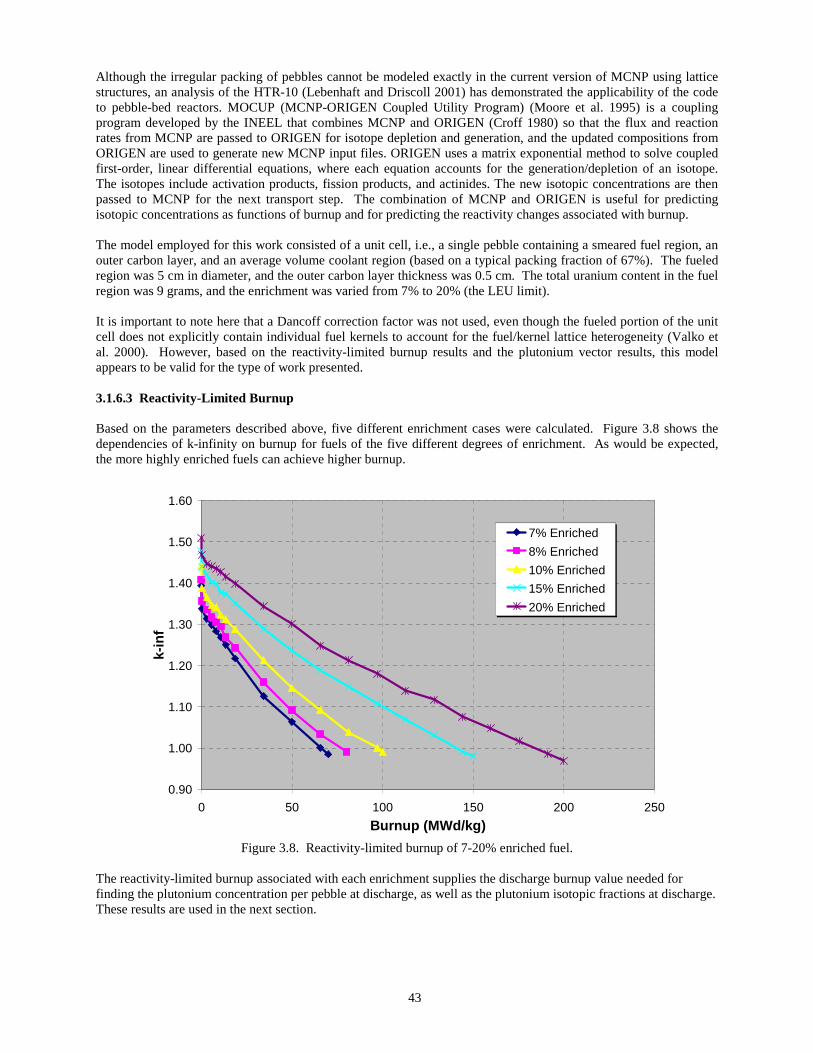
43
Although the irregular packing of pebbles cannot be modeled exactly in the current version of MCNP using lattice structures, an analysis of the HTR-10 (Lebenhaft and Driscoll 2001) has demonstrated the applicability of the code to pebble-bed reactors. MOCUP (MCNP-ORIGEN Coupled Utility Program) (Moore et al. 1995) is a coupling program developed by the INEEL that combines MCNP and ORIGEN (Croff 1980) so that the flux and reaction rates from MCNP are passed to ORIGEN for isotope depletion and generation, and the updated compositions from ORIGEN are used to generate new MCNP input files. ORIGEN uses a matrix exponential method to solve coupled first-order, linear differential equations, where each equation accounts for the generation/depletion of an isotope. The isotopes include activation products, fission products, and actinides. The new isotopic concentrations are then passed to MCNP for the next transport step. The combination of MCNP and ORIGEN is useful for predicting isotopic concentrations as functions of burnup and for predicting the reactivity changes associated with burnup. The model employed for this work consisted of a unit cell, i.e., a single pebble containing a smeared fuel region, an outer carbon layer, and an average volume coolant region (based on a typical packing fraction of 67%). The fueled region was 5 cm in diameter, and the outer carbon layer thickness was 0.5 cm. The total uranium content in the fuel region was 9 grams, and the enrichment was varied from 7% to 20% (the LEU limit). It is important to note here that a Dancoff correction factor was not used, even though the fueled portion of the unit cell does not explicitly contain individual fuel kernels to account for the fuel/kernel lattice heterogeneity (Valko et al. 2000). However, based on the reactivity-limited burnup results and the plutonium vector results, this model appears to be valid for the type of work presented. 3.1.6.3 Reactivity-Limited Burnup Based on the parameters described above, five different enrichment cases were calculated. Figure 3.8 shows the dependencies of k-infinity on burnup for fuels of the five different degrees of enrichment. As would be expected, the more highly enriched fuels can achieve higher burnup.
0.90
1.00
1.10
1.20
1.30
1.40
1.50
1.60
0 50 100 150 200 250
Burnup (MWd/kg)
k-in
f
7% Enriched
8% Enriched
10% Enriched
15% Enriched
20% Enriched
Figure 3.8. Reactivity-limited burnup of 7-20% enriched fuel.
The reactivity-limited burnup associated with each enrichment supplies the discharge burnup value needed for finding the plutonium concentration per pebble at discharge, as well as the plutonium isotopic fractions at discharge. These results are used in the next section.

44
3.1.6.4 Plutonium Isotopics For each enrichment case shown in Figure 3.8, the plutonium isotopic fractions were calculated at the average discharge burnup value. At up to ~20 MWd/kg of burnup, all of the 239Pu concentrations are the same regardless of the initial enrichment. However, after this point the concentration changes are dependent on the initial enrichment. Increasing enrichment equates to an increase in plutonium content per pebble at discharge. This is due to the slow decrease (burnup) of initial fissile material, and the buildup of fission products and minor actinides. This also results in a neutron spectrum change throughout the burnup lifetime, which in turn affects the discharge isotopics. For the higher enriched fuel, the longer lifetimes allow for a higher plutonium buildup before discharge. Table 3.2 shows the isotopic fractions of each case at end of life.
Table 3.2. Plutonium isotopic fractions as a function of enrichment and burnup.
Pu-238 Pu-239 Pu-240 Pu-241 Pu-2427% 70 1% 46% 29% 15% 9%8% 80 1% 46% 28% 16% 9%10% 100 1% 46% 26% 17% 11%15% 150 2% 44% 23% 18% 13%20% 200 4% 42% 20% 19% 15%
Pu Isotopic Fractions%
Enrichment (U-235)
Average Discharge
Burnup (MWd/kg)
The important factor to note here is that the 239Pu fraction is below 50%, while the 240Pu is 20% or higher in each case. This is significant in that the low 239Pu content and high 240Pu result in a plutonium vector that is unattractive for subversive purposes because of the high spontaneous neutron and decay heat rates. Finally, Table 3.3 shows the predicted values for the 239Pu content at a specific enrichment and burnup from three independent calculations (Petti et al., 2000, Herring et al., 2000, and Venter and Tshivhase, 2000).
Table 3.3. Predicted Pu-239 content in a single 8% enriched pebble at 80 MWd/kg burnup.
Organization Pu-239 (g/pebble) at 80 MWd/kg
MIT 0.011
INEEL 0.079
ESKOM 0.086
Note that both MIT and Eskom used the VSOP code (Teuchert et al., 1980) to calculate these results. While the source of the difference between the MIT and Eskom results is unknown, the INEEL and Eskom results differ by only 8%. In addition to the plutonium isotopic analysis, an elemental analysis of the fission products was performed. However, the results of the elemental analysis will not be presented here. 3.1.6.5 Conclusions The 239Pu content varied from 0.073 to 0.117 grams per pebble at the average discharge burnup, while the total plutonium varied from 0.157 to 0.277 grams per pebble at the average discharge burnup. Thus the 239Pu accounts for less than 50% of the total plutonium per pebble at discharge. Assuming that 6 kg of 239Pu are needed for a weapon, 82,192 to 51,282 discharged pebbles would need to be diverted. Note that more plutonium, and thus more pebbles, will be needed based on the low fraction of fissile to fertile material that exists within each pebble at average discharge burnups.

45
If a more “isotopically friendly” discharge is used, where the 240Pu content is kept below 6%, the number of pebbles needed increases from 82,192 to 526,316 for the 7% enriched case, and from 51,282 to 182,371 for the 20% enriched case. The large volume these pebbles would occupy would make the standard pebble-bed reactor fuel unattractive for theft or diversion. Although not presented in this work, an initial study of the use of special production pebbles has been performed (Herring et al. 2000 and Lebenhaft et al. 2000). This study indicates that specially made pebbles containing depleted uranium (DU) could be inserted into the core for production purposes. When a solid DU or graphite mixed DU fuel is used in place of the fuel kernels and graphite matrix, calculations show that 239Pu production is increased to 0.462 grams per pebble. However, recent reactivity calculations performed at the INEEL have shown that a single DU pebble would significantly affect the performance of a pebble-bed reactor, necessitating a slow DU pebble insertion rate. This in turn will affect the rate at which special pebbles can be processed. The time it would take to extract enough weapons-usable material is equal to the lifetime of the reactor, thus making this method very unattractive. 3.1.7 Summary and Outlook The Reactor Physics Team made good progress during FY 2001 towards their ultimate goal of developing a comprehensive state-of-the-art tool for reactor physics analysis of PBRs. The central component of this tool, the PEBBED code, grew during the year from a proof-of-principle code written in the MATLAB language to a practical analysis code written in FORTRAN. It now incorporates several enhancements that enable it to represent actual PBR designs realistically, and it has been used to do so. Still, substantial further improvements are possible, and many of these are planned for the new fiscal year. One of the most important of these improvements is the incorporation into PEBBED of the new method for calculating cross sections that is being developed by Georgia Tech. Another is the addition of the azimuthal variable into the cylindrical-geometry option in PEBBED, first in the existing finite-difference formulation, and eventually (perhaps not in FY 2002) in a nodal formulation. A three-dimensional nodal solution of the diffusion equation in cylindrical geometry is currently being developed by the Reactor Physics Team under separate funding. As the PEBBED code grows in sophistication, it will be important to verify that the calculations it makes continue to represent physical reality, and, in fact, that the code gives more and more accurate solutions as refinements are added. Therefore, a benchmarking program, begun in FY 2001 and discussed above in the section on accomplishments in analysis of pebble-bed reactors, will continue in FY 2002, with particular attention to the HTR-10 facility. Acknowledgement The Reactor Physics Team expresses great appreciation for the support it has received from the LDRD program, and also – and especially – for the personal advocacy of the Pebble-Bed LDRD leader, Dr. David A. Petti, and for the support of the original LDRD leader, Dr. John M. Ryskamp. 3.2 MIT Work 3.2.1 Introduction The focus of the reactor physics effort at MIT has been the modeling of pebble-bed cores using MCNP4B (Briesmeister, 1997). This effort required the development of new techniques for representing the randomly packed cores of pebble-bed reactors using regular lattices. This methodology was then validated using critical experiments. The first critical experiments considered were the HTR-PROTEUS experiments, which were performed in the mid- 1990s at the Paul Scherrer Institute, Switzerland (Mathews and Chawla, 1990). Of eleven core configurations investigated, three were loaded randomly to simulate the packing found in pebble-bed reactors. These stochastic cores, which were characterized by a single fuel zone and a 1:1 fuel-to-moderator sphere ratio, were modeled using MCNP4B.

46
The success of the HTR-PROTEUS modeling effort justified the application of the methodology to the IAEA-sponsored physics benchmark problem for the HTR-10 reactor in Beijing (Jing and Sun, 2000). A key component of this benchmark was the prediction of the initial critical loading of the reactor, which achieved criticality in December 2000. The final step in the validation of the modeling methodology is the MCNP4B analysis of the on-going critical experiments in the ASTRA facility at the Kurchatov Institute in Moscow (Naidoo, 2000). These experiments employ a mockup of the annular Pebble-Bed Modular Reactor (PBMR) core, and they involve measurement of the critical core height, control-rod reactivity worths, and reaction rates. This work is being carried out in collaboration with PBMR (Pty) Ltd. 3.2.2 Modeling Considerations When spheres are dropped into a large cylinder such as the core of a pebble-bed reactor, they pack randomly with a void fraction of approximately 0.39; see Figure 3.9. This loose, random packing cannot be modeled directly with MCNP4B, because of the large number of spheres in a typical core (e.g., approximately 27,000 spheres in the HTR-10). Therefore, the core model must rely on the repeated-geometry feature of the code, in which a unit cell is expanded throughout the volume of the core. However, this raises two questions: (a) how good is a regular lattice representation of the random packing, and (b) which regular lattice should be used? Several choices of lattice are possible, including simple cubic, body-centered cubic (BCC; see Figure 3.10), face-centered cubic, or hexagonal close packed (HCP). Although the spheres tend to pack towards an HCP lattice at the bottom of the core, the BCC (or the closely related body-centered tetragonal, BCT) lattice was found to work well for the loose packing typically encountered in pebble-bed reactor cores. One consequence of the repeated-geometry feature of MCNP4B is the presence of partial spheres at the core edge, which can overestimate the amount of fuel in the system (Figure 3.11). The solution to this problem is to use an exclusion zone (Murata and Takahashi, 1998), whose dimensions are equal to the radius of the sphere scaled by the fraction of fuel spheres in the unit cell (Figure 3.12).
�
Figure 3.9. Dense random packing. Figure 3.10. BCC regular lattice.
Figure 3.11. Partial spheres. Figure 3.12. Exclusion zone.
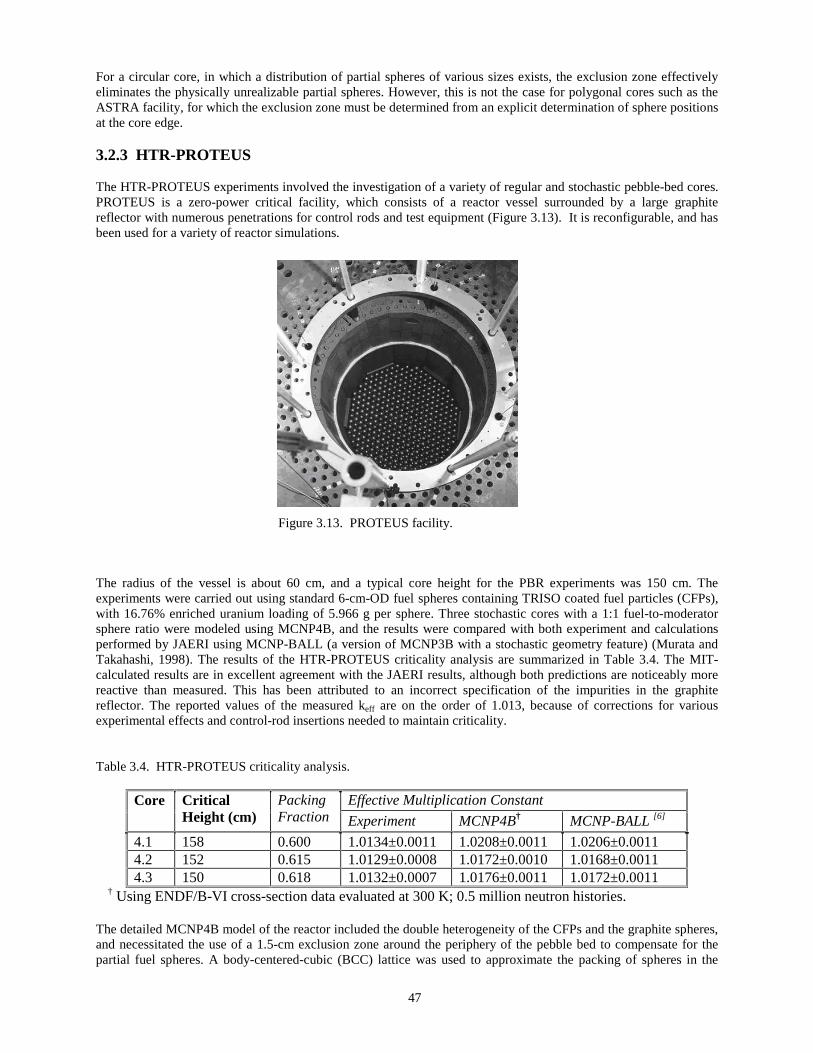
47
For a circular core, in which a distribution of partial spheres of various sizes exists, the exclusion zone effectively eliminates the physically unrealizable partial spheres. However, this is not the case for polygonal cores such as the ASTRA facility, for which the exclusion zone must be determined from an explicit determination of sphere positions at the core edge. 3.2.3 HTR-PROTEUS The HTR-PROTEUS experiments involved the investigation of a variety of regular and stochastic pebble-bed cores. PROTEUS is a zero-power critical facility, which consists of a reactor vessel surrounded by a large graphite reflector with numerous penetrations for control rods and test equipment (Figure 3.13). It is reconfigurable, and has been used for a variety of reactor simulations.
The radius of the vessel is about 60 cm, and a typical core height for the PBR experiments was 150 cm. The experiments were carried out using standard 6-cm-OD fuel spheres containing TRISO coated fuel particles (CFPs), with 16.76% enriched uranium loading of 5.966 g per sphere. Three stochastic cores with a 1:1 fuel-to-moderator sphere ratio were modeled using MCNP4B, and the results were compared with both experiment and calculations performed by JAERI using MCNP-BALL (a version of MCNP3B with a stochastic geometry feature) (Murata and Takahashi, 1998). The results of the HTR-PROTEUS criticality analysis are summarized in Table 3.4. The MIT- calculated results are in excellent agreement with the JAERI results, although both predictions are noticeably more reactive than measured. This has been attributed to an incorrect specification of the impurities in the graphite reflector. The reported values of the measured keff are on the order of 1.013, because of corrections for various experimental effects and control-rod insertions needed to maintain criticality. Table 3.4. HTR-PROTEUS criticality analysis.
Effective Multiplication Constant Core Critical Height (cm)
Packing Fraction Experiment MCNP4B† MCNP-BALL [6]
4.1 158 0.600 1.0134±0.0011 1.0208±0.0011 1.0206±0.0011 4.2 152 0.615 1.0129±0.0008 1.0172±0.0010 1.0168±0.0011 4.3 150 0.618 1.0132±0.0007 1.0176±0.0011 1.0172±0.0011
† Using ENDF/B-VI cross-section data evaluated at 300 K; 0.5 million neutron histories. The detailed MCNP4B model of the reactor included the double heterogeneity of the CFPs and the graphite spheres, and necessitated the use of a 1.5-cm exclusion zone around the periphery of the pebble bed to compensate for the partial fuel spheres. A body-centered-cubic (BCC) lattice was used to approximate the packing of spheres in the
Figure 3.13. PROTEUS facility.

48
core, with the size of the unit cell adjusted to reproduce the specified packing fraction. Details of the model appear in Figures 3.14 and 3.15.
�������
Figure 3.14. MCNP model of PROTEUS.
Figure 3.15. Details of core model.
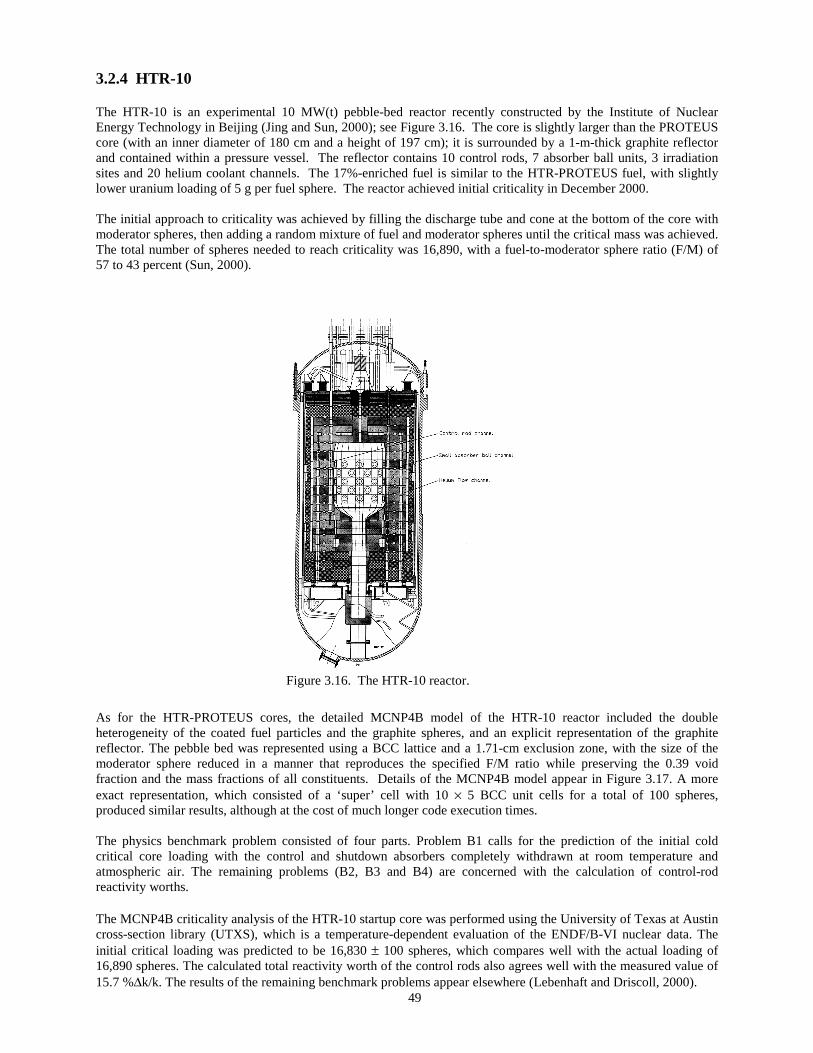
49
3.2.4 HTR-10 The HTR-10 is an experimental 10 MW(t) pebble-bed reactor recently constructed by the Institute of Nuclear Energy Technology in Beijing (Jing and Sun, 2000); see Figure 3.16. The core is slightly larger than the PROTEUS core (with an inner diameter of 180 cm and a height of 197 cm); it is surrounded by a 1-m-thick graphite reflector and contained within a pressure vessel. The reflector contains 10 control rods, 7 absorber ball units, 3 irradiation sites and 20 helium coolant channels. The 17%-enriched fuel is similar to the HTR-PROTEUS fuel, with slightly lower uranium loading of 5 g per fuel sphere. The reactor achieved initial criticality in December 2000. The initial approach to criticality was achieved by filling the discharge tube and cone at the bottom of the core with moderator spheres, then adding a random mixture of fuel and moderator spheres until the critical mass was achieved. The total number of spheres needed to reach criticality was 16,890, with a fuel-to-moderator sphere ratio (F/M) of 57 to 43 percent (Sun, 2000). As for the HTR-PROTEUS cores, the detailed MCNP4B model of the HTR-10 reactor included the double heterogeneity of the coated fuel particles and the graphite spheres, and an explicit representation of the graphite reflector. The pebble bed was represented using a BCC lattice and a 1.71-cm exclusion zone, with the size of the moderator sphere reduced in a manner that reproduces the specified F/M ratio while preserving the 0.39 void fraction and the mass fractions of all constituents. Details of the MCNP4B model appear in Figure 3.17. A more exact representation, which consisted of a ‘super’ cell with 10 × 5 BCC unit cells for a total of 100 spheres, produced similar results, although at the cost of much longer code execution times. The physics benchmark problem consisted of four parts. Problem B1 calls for the prediction of the initial cold critical core loading with the control and shutdown absorbers completely withdrawn at room temperature and atmospheric air. The remaining problems (B2, B3 and B4) are concerned with the calculation of control-rod reactivity worths. The MCNP4B criticality analysis of the HTR-10 startup core was performed using the University of Texas at Austin cross-section library (UTXS), which is a temperature-dependent evaluation of the ENDF/B-VI nuclear data. The initial critical loading was predicted to be 16,830 ± 100 spheres, which compares well with the actual loading of 16,890 spheres. The calculated total reactivity worth of the control rods also agrees well with the measured value of 15.7 %∆k/k. The results of the remaining benchmark problems appear elsewhere (Lebenhaft and Driscoll, 2000).
Figure 3.16. The HTR-10 reactor.
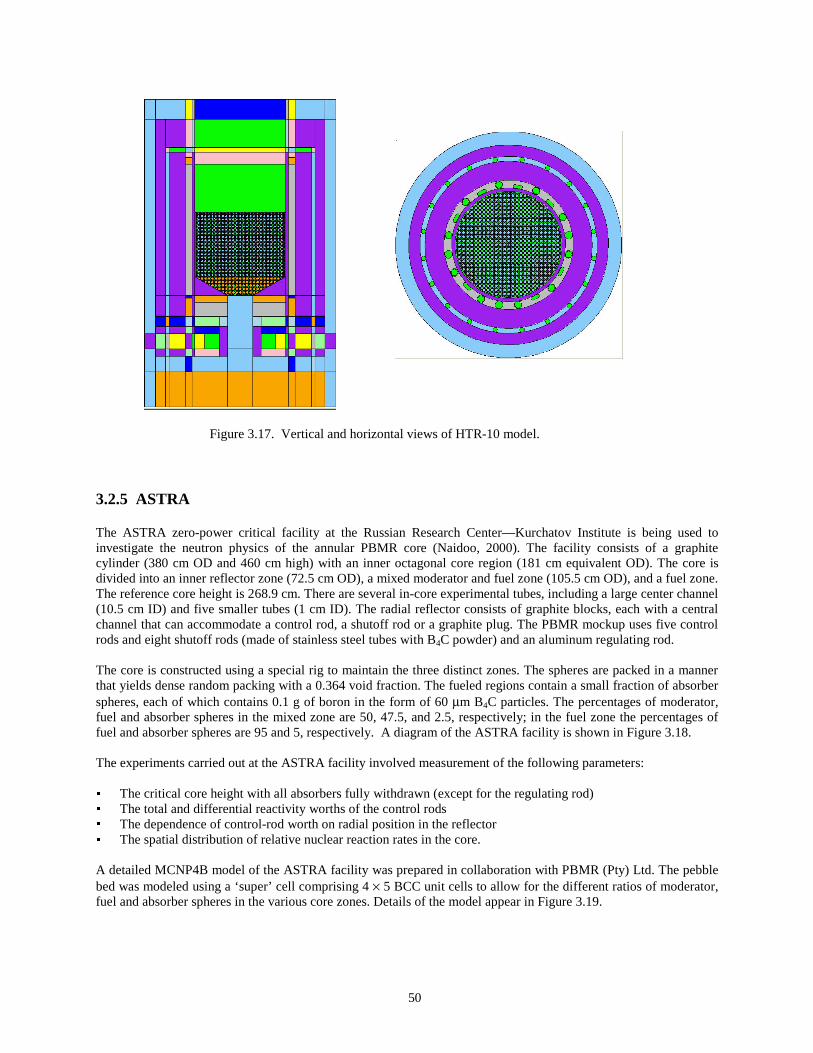
50
3.2.5 ASTRA The ASTRA zero-power critical facility at the Russian Research Center—Kurchatov Institute is being used to investigate the neutron physics of the annular PBMR core (Naidoo, 2000). The facility consists of a graphite cylinder (380 cm OD and 460 cm high) with an inner octagonal core region (181 cm equivalent OD). The core is divided into an inner reflector zone (72.5 cm OD), a mixed moderator and fuel zone (105.5 cm OD), and a fuel zone. The reference core height is 268.9 cm. There are several in-core experimental tubes, including a large center channel (10.5 cm ID) and five smaller tubes (1 cm ID). The radial reflector consists of graphite blocks, each with a central channel that can accommodate a control rod, a shutoff rod or a graphite plug. The PBMR mockup uses five control rods and eight shutoff rods (made of stainless steel tubes with B4C powder) and an aluminum regulating rod. The core is constructed using a special rig to maintain the three distinct zones. The spheres are packed in a manner that yields dense random packing with a 0.364 void fraction. The fueled regions contain a small fraction of absorber spheres, each of which contains 0.1 g of boron in the form of 60 µm B4C particles. The percentages of moderator, fuel and absorber spheres in the mixed zone are 50, 47.5, and 2.5, respectively; in the fuel zone the percentages of fuel and absorber spheres are 95 and 5, respectively. A diagram of the ASTRA facility is shown in Figure 3.18. The experiments carried out at the ASTRA facility involved measurement of the following parameters: The critical core height with all absorbers fully withdrawn (except for the regulating rod) The total and differential reactivity worths of the control rods The dependence of control-rod worth on radial position in the reflector The spatial distribution of relative nuclear reaction rates in the core.
A detailed MCNP4B model of the ASTRA facility was prepared in collaboration with PBMR (Pty) Ltd. The pebble bed was modeled using a ‘super’ cell comprising 4 × 5 BCC unit cells to allow for the different ratios of moderator, fuel and absorber spheres in the various core zones. Details of the model appear in Figure 3.19.
Figure 3.17. Vertical and horizontal views of HTR-10 model.

51
Side reflector
Central
Core
Mixing zone
Internal reflector
Experimentalchannels
CR - Control MR1 - Manual control SR - Safety E1-E6 - Experimental chambers 1-9 - Experimental channels for PIR,ZPT,ZII,ZRTA - Ionization chambers and neutron
Neutron source channel
SR2
SR3 CR5 SR7
E5 SPU2
PIR
PIR
E6
ZII2 ZRTA4
E1
SPU3
E2
=,, ZRTA1
E3
E4
ZII1
SPU1 ZRTA2
ZPT2
ZII1 ZRTA3
CR4
SR6
MR1
SR5
CR3
SR4 SR8 CR2
SR1
CR1
a b c d e f g h j k l m n i o
15
14
13
12
11
10
9
8
7
6
5
4
3
2
1
A
B
Figure 3.18. The ASTRA facility.

52
The results of the MCNP4B criticality analysis of the ASTRA core presented below were generated with the approximate model, which used fuel spheres with borated shells and no exclusion zones. The effective multiplication constant (keff)) for the reference critical height of 268.9 cm was calculated to be 0.99977 ± 0.00082 with all absorber rods fully withdrawn. All cases were run for a total of 1 million active histories from a source file generated in a separate run. The reactivity worths of individual control rods are given in Table 3.5. Table 3.5 Individual control rod worths in ASTRA facility
Control Rod Reflector Reactivity Worth (% ∆k/k) Position Measured Calculated CR1 D8 -1.77 ± 0.01 -1.72 ± 0.11 CR2 H12 -1.84 ± 0.01 -1.89 ± 0.11 CR4 K5 -1.40 ± 0.01 -1.56 ± 0.11 CR5 H14 -1.83 ± 0.01 -2.01 ± 0.12 MR1 I8 -0.372 ± 0.002 -0.11 ± 0.12
The ASTRA critical experiments have highlighted the limitations of applying MCNP4B to the modeling of pebble bed reactors. The ASTRA core has the following features, which were not found in the HTR-PROTEUS facility or the HTR-10 reactor: (a) an octagonal core vessel; (b) absorber spheres that make up 5 % of the fueled portion of the
Figure 3.19. Vertical and horizontal views of the MCNP model of the ASTRA core.

53
core: and (c) an annular core. Polygonal cores are not common in actual reactor designs, but absorber spheres may be required in start-up cores. The octagonal core precludes the inclusion of a buffer zone to compensate for the appearance of partial spheres at core boundaries, and a reduced packing fraction (given by the experimenters) was used instead. The procedure used by the Kurchatov Institute to estimate the reduced packing fraction is unknown, but the resulting model correctly predicted the critical height of the core. However, the mixing of the absorber spheres with the fuel spheres complicated the construction of an exact core model considerably. The effective multiplication constant of the core was found to depend strongly on the manner in which the relatively small number of absorbers spheres was distributed in the core lattice, especially in the narrow mixed zone where the required ratio of absorber to fuel spheres is more difficult to realize because of boundary effects. The resulting variability in keff and the long running time (~24 hours) of the detailed model led to the development of a more approximate but equally accurate model, in which the boron carbide kernels were dispersed in the graphite shells of the fuel spheres. The annular core appears to pose a more serious computational challenge for MCNP4B, partly because of the fuzzy interfaces between the core zones, but also because of the greater neutronic decoupling caused by the large central reflector region and the presence of boron absorber among the fuel spheres. The decoupling was evident from the sensitivity of the MCNP4B results to the definition of the starting fission source and the number of neutron histories used to determine the effective multiplication constant. MCNP4B can be used for accurate criticality calculations of pebble-bed cores, using appropriately modeled regular lattices to approximate the random loading and a peripheral buffer zone to prevent the inclusion of partial fuel spheres at the reflector interface. Annular cores have the additional complication of overlapping spheres at zone interfaces, which can be handled in a manner similar to that used at the core edge. Different sphere mixtures can be modeled using a ‘super’ unit cell, although the results depend on how well the arrangement of spheres in this larger cell reproduces the random packing. An engineer’s thesis, entitled “MCNP4B Modeling of Pebble Bed Reactors,” was completed on this topic by Julian Lebenhaft in October 2001. References Breen, R. J., January 1965. “HARMONY: System for Nuclear Reactor Depletion Computation,” WAPD-TM-478, Bettis Atomic Power Laboratory, Pittsburgh, PA. Briesmeister, J. F., 1997. “MCNP—A General Monte Carlo N-Particle Transport Code,” Los Alamos National Laboratory, Los Alamos, New Mexico. Croff, A. G., 1980. “A User’s Manual for the ORIGEN2 Computer Code,” Oak Ridge National Laboratory, Oak Ridge, Tennessee. Frewer, H., W. Keller, and R. Pruschek, 1985. “The Modular High Temperature Reactor,” Nucl. Sci. Eng. 90, pp. 411-426.
Gerwin, H., and W. Scherer, 1987. “Treatment of the Upper Cavity in a Pebble-Bed High-Temperature Gas-Cooled Reactor by Diffusion Theory,” Nucl. Sci. Eng. 97, pp. 9-19. Grimesey, R. A., D. W. Nigg, and R. L. Curtis, February 1991. “COMBINE/PC - A Portable ENDF/B Version 5 Neutron Spectrum and Cross-Section Generation Program,” EGG-2589, Revision 1, Idaho National Engineering Laboratory. de Haas, J., J. Kuijper, and J. Oppe, March 2001. “PBMR: Evaluation of the Equilibrium Core Enrichment,” 3rd Meeting of the IAEA CRP-5, Oarai, Japan. Herring, J. S., et al., 2000. “Proliferation-Resistant Advanced Nuclear Fuel Cycles,” URC Annual Report, INEEL/EXT-2000-01048, Idaho Falls, Idaho.
54
Jing, X., and Y. Sun, March 2000. “Benchmark Problem of the HTR-10 Initial Core,” Institute of Nuclear Energy Technology, Tsinghua University, Beijing. Lebenhaft, J. R., M. J. Driscoll, J. S. Herring, and K. D. Weaver, 2000. “Plutonium Production in a Pebble-Bed Reactor,” MIT/INEEL Joint Report to the TOPS Committee. Lebenhaft, J. R., and M.J. Driscoll, March 2000. “Physics Benchmark Analysis of the HTR-10 Reactor using the Monte-Carlo Code MCNP,” MIT-ANP-TR-070. Lebenhaft, J. R., and M. J. Driscoll, 2001. “MCNP4B Analysis of the HTR-10 Startup Core,” Transactions of the American Nuclear Society, Vol. 84, pp. 214-215. Mathews, D., and R. Chawla, October 1990. “LEU-HTR PROTEUS Calculational Benchmark Specifications,” Paul Scherrer Institute, TM-41-90-32. Melese, G. and R. Katz, 1984. Thermal and Flow Design of Helium-Cooled Reactors, American Nuclear Society, LaGrange Park, IL. Moore, R. L., B. G. Schnitzler, C. A. Wemple, R. S. Babcock, and D. E. Wessol, 1995. “MOCUP: MCNP-ORIGEN2 Coupled Utility Program,” INEL-95/0523, Idaho Falls, Idaho. Murata, I., and A. Takahashi, April 1998. “Analysis of Critical Assembly Experiments by Continuous Energy Monte Carlo Method with Statistical Geometry Model,” Technology Reports of the Osaka University, 48(2304), pp. 19-31. Naidoo, D., May 4, 2000. “ASTRA Critical Facility Configuration Report,” PBMR, 003402-34 (Rev. A). Nicholls, D., September 2001. “The Modular Pebble Bed Reactor,” Nuclear News, pp. 35-40.
Ougouag, A. M., and H. D. Gougar, November 2001. “Preliminary Assessment of the Ease of Detection of Attempts at Dual Use of a Pebble-Bed Reactor,” Transactions of the Winter 2001 Annual Meeting of the American Nuclear Society, Reno, Nevada.
Petti, D. A., et al., 2000. “Modular Pebble-Bed Reactor Project,” URC Annual Report, INEEL/EXT-2000-01034 (MIT-ANP-PR-075), Idaho Falls, Idaho. Rhoades, W. A., and D. B. Simpson, October 1997. "The TORT Three-Dimensional Discrete Ordinates Neutron/Photon Transport Code," ORNL/TM-13221. Sun, Y., December 2000. Institute of Nuclear Energy Technology, personal communication. Terry, W. K., H. D. Gougar, and A. M. Ougouag, November 2000. “Deterministic Method for Fuel Cycle Analysis in Pebble-Bed Reactors," Transactions of the Winter 2000 Annual Meeting of the American Nuclear Society, Washington, DC.
Terry, W. K., H. D. Gougar, and A. M. Ougouag, in press. “Direct Deterministic Method for Neutronics Analysis and Computation of Asymptotic Burnup Distribution in a Recirculating Pebble-Bed Reactor,” Annals of Nuclear Energy. Teuchert, E., U. Hansen, and K. A. Haas, 1980. “V.S.O.P. - Computer Code System for Reactor Physics and Fuel-Cycle Simulation,” KFA-IRE Report Jül-1649, March 1980. Valko, J., P. V. Tsvetkov, and J. E. Hoogenboom, 2000. “Calculation of the Dancoff Factor for Pebble Bed Reactors,” Nuclear Science and Engineering, Vol. 135, pp. 304-307. Venter, J., and V. Tshivhase, 2000. “Pebble-Bed Modular Reactor and the PBMR Fuel Qualification Program,” INEEL Seminar, December 5, Idaho Falls, Idaho.

55
4.0 Reactor Safety and Thermal Hydraulics Modeling 4.1 INEEL Research Our work in the area of safety for the MPBR is focused on a loss-of-coolant event and an air-ingress event. We are using safety codes that have been used extensively in light-water reactor analysis, modified as needed for the MPBR. Results to date from the ATHENA code (based on the RELAP5 code) simulation are presented in Section 4.1.1. A scoping analysis of the response of a pebble to air ingress is presented in the Appendix. Preliminary results of simulations of air ingress using the MELCOR code are presented in Section 4.1.3. 4.1.1 ATHENA Code Simulation 4.1.1.1 ATHENA Model An ATHENA (Carlson et al., 1986) model of the pebble-bed reactor was developed to perform preliminary calculations of loss-of-coolant accidents (LOCAs). The model is considered preliminary because all of the relevant design data were not available during its development. The model, which is illustrated in Figure 4.1, represents the reactor, a heat exchanger, a coolant circulator, and connecting piping.
Figure 4.1. Nodalization diagram for the ATHENA model of the pebble-bed reactor.
The reactor model was based on the Eskom design (Nicholls, 2001), which features a central region containing only graphite pebbles and an outer region containing only fuel pebbles. The mixed transition zone was not modeled. The core, which contains approximately 350,000 pebbles of 6-cm diameter, was divided into ten axial levels. The pebbles in each level were attached to a single coolant channel. Two heat structures were used to represent the pebbles, one representing the 285,000 fuel-containing pebbles in the outer region, and the other representing the 65,000 graphite pebbles in the central region, which were modeled as unheated. The default RELAP5 heat transfer model was used to represent convective heat transfer from the pebbles to the helium coolant. The heat conduction enclosure model was used to represent radial and axial heat transfer from the pebbles to the side, bottom, and top graphite reflectors. The side reflector and the core barrel were modeled as a composite heat structure. The radiation enclosure model was used to represent radiation between the core barrel, reactor vessel, and containment wall. The

56
convective heat transfer model provides the dominant heat removal mechanism during normal operation, but the heat conduction enclosure model provides the dominant heat transfer mechanism following a LOCA. The conduction and radiation enclosure models are described more fully below. Details of the heat exchanger and coolant circulator were not available during the development of the ATHENA model. Consequently, representative components were modeled. A counterflow tube-in-shell heat exchanger was simulated. Boundary conditions on the secondary side of the heat exchanger were simulated using a time-dependent junction to specify inlet flow and two time-dependent volumes to specify inlet temperature and outlet flow. The circulator was simulated with a centrifugal pump. The hot-leg piping in the reactor is contained within the cold-leg piping, allowing for the possibility of a simultaneous double-ended rupture on both the inlet and outlet sides of the reactor vessel. Valves and a containment volume were included so that a simultaneous rupture of the hot-leg and cold-leg piping could be simulated. The inner diameters of the cold-leg and hot-leg pipes were 1.12 m (44 inches) and 0.61 m (24 inches), respectively. The containment was filled with air at an initial pressure of 0.1 MPa. The ATHENA model was adjusted to obtain desired operating conditions as given in Figure 4.2. Specifically, the pump velocity was adjusted to the desired coolant flow rate, while form loss coefficients in the pebble bed and heat exchanger were adjusted to match pressure drops. The surface areas of the heat exchanger were also adjusted to match coolant temperatures. Table 4.1 shows that the results of the ATHENA model are in good agreement with the design operating conditions.
Figure 4.2. Reactor flow sheet.

57
Table 4.1. A comparison of full-power operating conditions for the pebble-bed reactor.
Parameter Desired ATHENA Thermal power, MW 250 250 Primary coolant flow rate, kg/s 109 109 Reactor inlet temperature, oC 408 417 Reactor outlet temperature, oC 850 851 Reactor inlet pressure, MPa 7.80 7.78 Reactor pressure drop, MPa 0.15 0.15 Heat exchanger pressure drop, MPa 0.16 0.16 Secondary coolant flow rate, kg/s 109 109 Secondary coolant inlet temperature, oC 623 625 Secondary coolant outlet temperature, oC 800 792 Secondary coolant outlet pressure, MPa 7.75 7.78
The ATHENA heat transfer model of the pebble bed is illustrated in Figure 4.3. Each pebble generates heat that must be removed either by convection to the surrounding coolant or by conduction through adjacent pebbles to the graphite reflectors, which are then cooled by radiation between the core barrel, the reactor vessel wall, and the containment wall. The code’s default heat transfer model represents the heat conduction within an individual pebble and the convection to the surrounding fluid. The conduction enclosure model was used to represent the heat conduction between the radial center of the pebble bed and the reflector.
Radiation Radiation
GraphiteRefector
CoreBarrel
ReactorVessel
ContainmentVesselUnheated
Pebbles
HeatedPebbles
Conduction
Soil35 °C
0 R0T0
R1T1
R2T2
R3T3
R4T4
R5T5
R6T6
R7T7
R8T8
Figure 4.3. Sketch of the conduction enclosure model. The conduction enclosure model allows heat transfer from one heat structure to another by
F)1T0(T1GA q −= (4.1)
where q = heat transfer rate (W) G = gap conductance (W/m2-K) A1 = surface area (m2) T = surface temperature (K) F = a user input factor.

58
The subscripts 0 and 1 refer to heat structures 0 and 1, respectively, and the factor F accounts for the fraction of surface area involved in the conduction. The radial gap conductance was calculated based on an exact solution for radial heat transfer in an annulus, assuming constant thermal conductivity and uniform volumetric heat generation. The exact solution in a cylinder is presented by Bird et al. (1960). A minor extension of their solution for a cylinder yields
−−=− )/rln(rr
2rr
2kS
TT 012
1
20
21
01 (4.2)
for an annulus, where S = volumetric heat generation rate, W/m3 k = thermal conductivity, W/m-K. The total amount of heat generated within a region of height h is
)hr(rSq 20
21 −= π (4.3)
and the corresponding surface area is
hr2A 11 π= (4.4)
The radial gap conductance, Gr, is obtained by combining Equations (4.1) through (4.4):
)/rln(rrr
r0.5
k/rG
0120
21
20
1r
−−
= (4.5)
An average value of the thermal conductivity was chosen as 17.8 W/m-K based on a correlation for effective thermal conductivity in the pebble bed (No, 2001). The resulting value for Gr is 32.2 W/m2-K. The axial gap conductance, Ga, is calculated as
hk
Ga ∆= (4.6)
where ∆h is the height of a node. Using a total core height of 7.18 m and an average thermal conductivity of 17.8 W/m-K yields Ga = 24.8 W/m2-K. The F factor in Equation 1 was input so that the effective heat transfer area was A1 in the radial direction and π(r1
2- r0
2) in the axial direction. The side reflector was allowed to communicate thermally with the pebble bed only through radial conduction. Preliminary LOCA calculations were performed in which the side reflector was connected to the helium coolant in the pebble bed region. However, in these preliminary calculations, the primary heat transfer path was from the pebbles to the coolant and then to the reflector through natural convection heat transfer. This heat transfer path was deleted because ATHENA’s natural convection correlation, which was developed for a vertical flat plate immersed in a fluid, was thought to grossly overestimate natural convection heat transfer over large radial distances across a pebble bed. Furthermore, any natural convection heat transfer between adjacent pebbles would be accounted for by the correlation for effective thermal conductivity of the pebble bed. The radiation enclosure model was used to account for radiation between the core barrel, the reactor vessel, and the containment wall. The emissivities were set to 0.6 for the core barrel and reactor vessel and 0.8 for the containment

59
wall, based on the values given by No (2001). View factors were calculated based on infinite cylinders. Radiation was only allowed between heat structures within an axial level; adjacent levels did not radiate to each other. Radiation was allowed in the radial direction from the upper and lower reflectors to the reactor vessel and containment walls. Heat transfer to the upper and lower heads of the reactor vessel was neglected. The containment wall and the adjacent soil were modeled as a composite heat structure. The thermal properties of the concrete and soil were obtained from No (2001). A boundary condition of 35oC was applied at the outer radius of the soil. The soil thickness (11.6 m) was large enough that the outer soil did not heat appreciably during the transient. Decay heat was calculated according to the equations presented by No (2001) assuming infinite reactor operation prior to scram. Specifically,
00.0639 P t0.0603P −= , t < 10 s (4.7)
00.181 P t0.0766P −= , 10 ≤ t < 150 s
0283.0 P t0.130P −= , 150 ≤ t < 107 s
where P is the power, P0 is the normal operating power, and t is the time in seconds. 4.1.1.2 Results A LOCA initiated by a simultaneous rupture of the hot-leg and cold-leg piping was simulated using the ATHENA model described above. The LOCA was initiated by opening the break valves and tripping the pump at 0.0 s. The reactor was tripped at 0.1 s and the secondary coolant flow was shut off at 10.0 s. The simultaneous rupture of the hot-leg and cold-leg piping caused an extremely rapid depressurization of the primary coolant system, as shown in Figure 4.4. The pressure of the reactor vessel equalized with that of the containment near 0.8 s. The calculated break mass flow rates are shown in Figure 4.5. Because of the larger area of the cold leg, the flow through the broken cold leg (component 486 in Figure 4.1, cross sectional area=0.638m2) exceeded that through the hot leg (component 480 in Figure 4.1, cross sectional area=0.292m2). The breaks unchoked near 0.2 s. Although difficult to see on the figure, the break flow rates decreased to slightly below zero, bringing some air from the containment into the system, first through the cold leg and then later through the hot leg into the bottom of the reactor vessel.
0.0 0.2 0.4 0.6 0.8
Time (s)
0
2
4
6
8
Pres
sure
(MPa
)
p-200050000
Figure 4.4. Calculated pressure during the LOCA.

60
0.0 0.2 0.4 0.6 0.8Time (s)
-1000
0
1000
2000
3000
4000
Mas
s fl
ow r
ate
(kg/
s)
mflowj-480000000mflowj-486000000
Figure 4.5. Vessel-side break flow rates during the LOCA.
After the effects of the blowdown subsided, a tiny circulation flow was calculated from the containment upwards through the core. This circulation is illustrated in Figure 4.6, which shows oxygen flow rate through the core. This natural circulation flow was very small considering the large temperature difference between the fluid in the core and the downflow leg as shown in Figure 4.7.
0 50 100 150 200Time (hr)
-0.4
-0.3
-0.2
-0.1
0.0
0.1
0.2
Mas
s fl
ow r
ate
(g/s
)
Figure 4.6. Oxygen flow rate through the core during the LOCA.
0 50 100 150 200Time (hr)
0
500
1000
1500
2000
Tem
pera
ture
(°C
)
CoreDownflow leg
Figure 4.7. Fluid temperatures in the core and downflow leg of the vessel during the LOCA.

61
The thermal response of the reactor is illustrated in Figure 4.8, which shows the pebble surface temperature (at r0, see Figure 4.3) and the temperature of the inner containment wall (at r6). The figure also shows results of similar calculations performed at MIT using the PBR_SIM code (No, 2001). The calculated results were similar. In both cases, the pebble temperature increased rapidly at first and then gradually until reaching a peak value near 120 hours. The peak pebble temperature was about 50 oC higher in the ATHENA calculation. The ATHENA results should be somewhat higher because radiation heat transfer to the upper and lower heads of the pressure vessel was neglected. The containment temperatures increased throughout both calculations, which were in excellent agreement. The containment and reactor vessel wall temperatures exceeded thermal design limits (No, 2001) in both calculations. However, this is currently under closer examination since previous gas reactor analyses do not show such high temperatures outside of the core.
0 50 100 150 200Time (hr)
0
200
400
600
800
1000
1200
1400
1600
1800
Tem
pera
ture
(°C
)
ATHENANo (2001)
Pebbles
Containment
Figure 4.8. Fuel and containment wall temperatures during the LOCA.
Figure 4.9 compares the core decay power with the energy deposited on the inner wall of the containment vessel through radiation and convection. The core decay power always exceeded the power deposited on the containment wall. At the end of the calculation, the core decay power was about a factor of two higher than the power removed at the containment wall. Thus, the system had not reached a quasi-steady state and would have continued to heat up had the calculation been continued.
0 50 100 150 200Time (hr)
0.0
0.5
1.0
1.5
2.0
Pow
er (
MW
)
CoreContainment
Figure 4.9. Core decay power and power deposited at the containment wall during the LOCA.

62
4.1.1.3 Conclusions A large-break loss-of-coolant accident in the pebble bed results in an extremely rapid depressurization that is essentially over within 1 s. Afterwards, the flow rate through the core is insignificant until the onset of natural convection occurs (permitting oxidation of the graphite pebbles, as confirmed by the MELCOR calculation), which was not modeled in the ATHENA calculation. Thus, the interaction between the fluid and pebbles is unimportant during the non-convective stage of the decay-heat-removal phase of a large-break LOCA, which can last many days. The heat conduction and radiation enclosure models allowed ATHENA to represent the heat transfer from the pebble bed to the containment wall and the surrounding soil. The enclosure model allowed radial and axial heat conduction to be modeled. Although the model of the pebble bed was relatively simple, using only two axial stacks of heat structures and one hydraulic channel, ATHENA was able to predict results that were in reasonable agreement with more detailed calculations. The trends of the calculated fuel and containment temperatures were in excellent agreement with those calculated by No (2001). The peak pebble temperature calculated by ATHENA was 50 oC higher. 4.1.2 Scoping Analyses The INEEL completed a scoping analysis of air ingress accidents in an HTGR, which was published in the proceedings of the 2001 ASME International Mechanical Engineering Congress and Exposition in New York. This was a fully refereed paper. It is attached in its entirety in the Appendix. 4.1.3 MELCOR Modeling 4.1.3.1 MELCOR Model A preliminary MELCOR (Gauntt et al., 1997) model of a reference pebble-bed reactor (PBR) was developed to explore the potential for oxidation of the PBR core if it were exposed to outside air because of a break of the inlet and outlet coolant pipes. Rapid or extensive oxidation of the core (i.e., a fire) could impose a serious safety issue on PBR design. The break is assumed to occur just outside of the reactor vessel between the reactor vessel and the high-pressure turbine. The MELCOR model presented in this report is considered preliminary because, as was the case for the ATHENA model discussed above, all the relevant design data were not available during the development of the model. A more detailed look at the problem of an air ingress accident will continue in the next fiscal year. MELCOR is a severe accident code being developed at Sandia National Laboratory for the U. S. Nuclear Regulatory Commission to model the progression of severe accidents in light-water nuclear power plants. However, because of the general and flexible nature of the code, other concepts such as the pebble-bed reactor can be modeled. The latest released version of MELCOR is 1.8.5; however, for the analysis presented in this report we are using a modification of the earlier 1.8.2 version of the code. The INEEL modifications to MELCOR 1.8.2 were the implementation of multi-fluid capabilities (Merrill et al., 2000) and the ability to model carbon oxidation. The multi-fluid capabilities allow MELCOR to use fluids other than water, such as helium, as the primary coolant. This capability was added to MELCOR for the INEEL Fusion Safety Program and is documented in Merrill et al. (2000). The capability to analyze the oxidation of carbon structures was also added to MELCOR under the fusion safety program and will be discussed later in this report. The reactor considered for this study was assumed to have a core diameter of 3.5 m and a height of 7.18 m, yielding a total core volume of 67.5 m2. The volume is slightly smaller than would be calculated using the above diameter and height, because the core narrows at the bottom of the reactor. The dimensions for the geometry and some of the initial conditions used may vary slightly from what others have presented but will not affect the general conclusions presented in this section of the report. The core of the reactor was divided into three radial zones and nine axial zones for a total of 27 core control volumes, as shown in Figure 4.10. The top layer, comprising volumes 25, 26, and 27, represents the plenum between the top surface of the pebbles and the top reflector. The core control volumes are cylindrical and are centered about the core centerline. The inner radial zone contains 63,800 non-

63
heated pebbles. The two outer radial zones contain a total of 294,240 heat-generating pebbles producing a total of 270 MW of thermal energy. The coolant inlet channel at the top of the core is represented by control volume 100. For nominal operating conditions the coolant enters the bottom of the reactor at 723 K and flows up an annular flow channel located between the reactor side reflector and the reactor vessel; this channel is represented by control volumes 101 through 110 in Figure 4.10. The coolant then flows radially along the top of the reactor (CV 100), exiting into a plenum above the core. From the plenum the coolant flows down through the core and exits the bottom of the core at 1123 K. The coolant then flows to the power conversion unit, which is represented simplistically by control volumes 110 through 119. The double-ended rupture of both the inlet and outlet pipes as shown in Figure 4.10 occurs in control volumes 11l and 117; the rupture is represented in the model as two valves which are connected to containment volumes 500 and 501 and are opened at the beginning of the decompression accident. For this calculation, the containment volume was assumed to be 27,000 m3. When details of the containment geometry are available, the correct volumes will be input into the model.
?????
?????
?????
?????
?????
?????
?????
?????
?????
?????
?????
?????
?????
?????
?????
?????
?????
?????
?????
?????
?????
?????
?????
?????
?????
?????
?????
?????
CV001
CV004
CV007
CV013
?????
?????
?????
?????
?????
?????
?????
?????
?????
CV002
CV005
CV008
CV014
CV010
CV016
CV019
CV022
CV025
CV011
CV017
CV020
CV023
CV026
?????
?????
?????
?????
?????
?????
?????
?????
?????
CV003
CV006
CV009
CV015
CV012
CV018
CV021
CV024
CV027
?????
?????
?????
?????
?????
?????
?????
?????
?????
001002
003004
005
006007
008
009010
CV100
011 013
014015
012
016017
018
019020
021022
023
024
025
026
027028
029030
031032
033
034035
036037
038
039040
041
042 043
044
045
046
047
048
049
050
051
052
CV101
CV102
CV103
CV104
CV105
CV106
CV107
CV108
CV109
CV119
CV110
CV117
CV118
CV116 CV115
CV
114
CV113CV112CV111
053
054 055 056057
058059060
061063
CV500Containment
CV502Containment
CV501Containment
CV501Containment
? ?
CL
Figure 4.10. MELCOR volume and flow diagram. The heat transfer from the pebbles is dominated by convection during nominal operation of the reactor. However, during the LOCA when the flow in the core decreases to near zero, the heat generated by the pebbles is removed by conduction and radiation through the pebbles to the graphite reflector. The heat is then conducted through the reflector, radiated to the reactor vessel wall, conducted through the vessel wall, radiated to the containment walls and then conducted to a heat sink at 300 K. The pebbles in the core were modeled as spherical heat structures, one heat structure per control volume. The heat transfer from the one structure was then multiplied by the number of pebbles in the control volume to get the overall heat transfer from all the pebbles in the volume. A user subroutine is used to model the conduction heat transfer between heat structures according to the following equation
( )2 1
2
1
2 hk T Tq
rln
r
π −=
, (4.8)
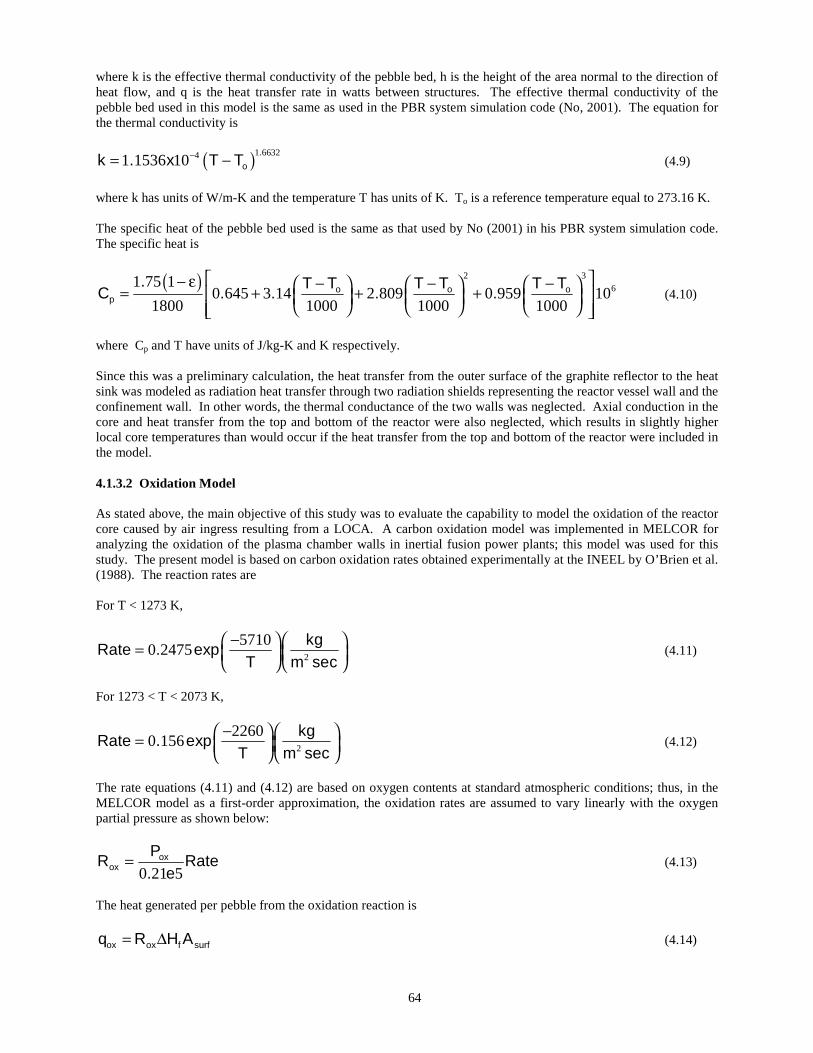
64
where k is the effective thermal conductivity of the pebble bed, h is the height of the area normal to the direction of heat flow, and q is the heat transfer rate in watts between structures. The effective thermal conductivity of the pebble bed used in this model is the same as used in the PBR system simulation code (No, 2001). The equation for the thermal conductivity is
( )1 663241 1536 10.
ok . x T T−= − (4.9)
where k has units of W/m-K and the temperature T has units of K. To is a reference temperature equal to 273.16 K. The specific heat of the pebble bed used is the same as that used by No (2001) in his PBR system simulation code. The specific heat is
( ) 2 361 75 1
0 645 3 14 2 809 0 959 101800 1000 1000 1000
o o op
. T T T T T TC . . . .
− ε − − − = + + + (4.10)
where Cp and T have units of J/kg-K and K respectively. Since this was a preliminary calculation, the heat transfer from the outer surface of the graphite reflector to the heat sink was modeled as radiation heat transfer through two radiation shields representing the reactor vessel wall and the confinement wall. In other words, the thermal conductance of the two walls was neglected. Axial conduction in the core and heat transfer from the top and bottom of the reactor were also neglected, which results in slightly higher local core temperatures than would occur if the heat transfer from the top and bottom of the reactor were included in the model. 4.1.3.2 Oxidation Model As stated above, the main objective of this study was to evaluate the capability to model the oxidation of the reactor core caused by air ingress resulting from a LOCA. A carbon oxidation model was implemented in MELCOR for analyzing the oxidation of the plasma chamber walls in inertial fusion power plants; this model was used for this study. The present model is based on carbon oxidation rates obtained experimentally at the INEEL by O’Brien et al. (1988). The reaction rates are For T < 1273 K,
2
57100 2475
kgRate . exp
T m sec− =
(4.11)
For 1273 < T < 2073 K,
2
22600 156
kgRate . exp
T m sec− =
(4.12)
The rate equations (4.11) and (4.12) are based on oxygen contents at standard atmospheric conditions; thus, in the MELCOR model as a first-order approximation, the oxidation rates are assumed to vary linearly with the oxygen partial pressure as shown below:
0 21 5ox
ox
PR Rate
. e= (4.13)
The heat generated per pebble from the oxidation reaction is
ox ox f surfq R H A= ∆ (4.14)

65
where fH∆ is the heat of formation of carbon dioxide and Asurf is the surface area of the pebble. The heat of
formation of carbon dioxide is given as
22
4600000 09516 93690 0 7077 0 00007f
. kJH . . . T . T
T kg ∆ = − − + −
(4.15)
The temperature has the units of K. During the oxidation of graphite, some CO will likely be generated but is not included in the graphite oxidation model that is presently in MELCOR. This is conservative from the standpoint of maximum pebble temperatures since the heat of formation of CO2 is greater than the heat of formation of CO. 4.1.3.3 Results The LOCA was initiated at 0.1 seconds by opening the two valves that connect the hot and cold legs to the containment. The circulator was tripped at 0.1 seconds and the reactor was scrammed at the same time. The simultaneous double-ended rupture of the hot and cold legs causes a rapid depressurization of the primary coolant system, as shown in Figure 4.11. The pressure in the reactor equalizes with the containment pressure of 0.15 MPa in approximately 3 seconds. From the figure we see that the pressure of the reactor decreases from 7.0 MPa to 0.15 MPa during the 3-second time frame. Comparing the calculated MELCOR core pressure decrease (Figure 4.11) with the ATHENA results shown in Figure 4.4, we see that the decompression phase of the LOCA for ATHENA is approximately twice as fast as shown in the MELCOR calculation. The reason for this difference in the decompression rate is that the break flow area in ATHENA was approximately twice as large as the MELCOR break flow area. Again this is due to the preliminary nature of the calculation.
Figure 4.11. Calculated core and containment pressure during the decompression phase of the LOCA.
0 .0 0 .5 1 .0 1 .5 2 .0 2 .5 3 .0
T im e (sec )
0
2
4
6
8
Pre
ssur
e (M
Pa)
C on ta inm en tC ore

66
. The mass flow rate of air through the core is presented in Figure 4.12. As shown, after the decompression phase of the LOCA the mass flow rate of air through the core by natural convection is essentially zero out to approximately 90 hr. At this time, the flow suddenly increases from zero to 0.025 kg/sec, indicating the onset of natural circulation through the core. The flow rate through the core remains between 0.025 kg/sec and 0.020 kg/sec from 90 to 160 hours, the time when the transient was terminated. This delay in the onset of natural convection is also seen by Japanese experimental and analytical studies on air ingress accidents in high-temperature gas-cooled reactors (Hishida and Takeda, 1991, and Takeda and Hishida, 1992).
Figure 4.12. Air mass flow rate through the core during the LOCA After the decompression stage of the accident, hot helium gas occupies the core and upper plenum regions of the reactor, while cool heavy air sits at the entrance of the pipe breaks. In this configuration, the buoyancy force needed to support natural convective flows is lacking; thus, there is little or no mass flow of air between the containment and the core. During this phase of the accident, air from the containment is mainly transported to the core and upper plenum of the reactor by molecular diffusion. The mole fraction of air in the core and upper plenum of the reactor gradually increases (as shown in Figure 4.13) until the buoyancy force is large enough to initiate natural circulation. When natural circulation of the air from the containment begins, the pebbles in the bottom of the reactor immediately experience a sharp rise in surface temperature. This rise in temperature is the result of surface oxidation of the graphite pebbles. As shown in Figure 4.14, the pebbles in the bottom of the reactor have a temperature of 1200 K at the start of the transient. During the first 10 hr. of the transient, the temperature of the pebbles rapidly increases to 1500 K, then over the next 80 hr. it gradually increases to 1650 K. This increase in temperature is due to core decay heat that must be removed by radial conduction through the pebble bed to the outside environment. At 90 hr. we see a sharp increase in the surface temperature of the pebbles because of surface oxidation. Over the next 70 hr. the temperature of the pebbles in the bottom of the reactor increases from 1650 K to 2400 K. The maximum allowable pebble temperature is assumed to be 1600 °C, or 1873 K. If we look at the temperature of the pebbles in the middle and top of the reactor, we see no increase in the pebble temperatures above that caused by decay heat. This is because all the oxygen in the air entering from the containment is consumed in the first several layers of pebbles.
0 20 40 60 80 100 120 140 160
Time (hr)
-0.005
0.000
0.005
0.010
0.015
0.020
0.025
0.030
Mas
s F
low
Rat
e (k
g/se
c)

67
Figure 4.13. Mole fraction of air in upper plenum of reactor.
Figure 4.14. Pebble bed core temperatures
0 20 40 60 80 100 120 140 160
Time (hr)
0.0
0.2
0.4
0.6
0.8
1.0
Mol
e F
ract
ion
of A
ir
Onset of natural convection
After blowdown m ole fraction
of air in the containm ent is 0.63
0 20 40 60 80 100 120 140 160
Time (hr)
1000
1200
1400
1600
1800
2000
2200
2400
2600
Tem
pera
ture
(K
)
Bottom of coreMiddle of coreTop of core
Onset of natural convection

68
It should be noted that the graphite reflector below the reactor core was not included in this model. If it were to be included and its temperature remained high (greater than 400 K), then the oxygen in the air flowing from the containment to the reactor core may be consumed by the oxidation of the lower reflector before it can reach the core, thus preventing the pebbles from exceeding their safe temperature limit. The bottom reflector will be added to the model next year. 4.1.3.4 Conclusions The preliminary results presented is this section of the report indicate that oxidation of the pebble bed needs to be considered in any accident involving air ingress. The amount of core oxidation depends to a great extent on the amount of natural convective flow that can be supported by the buoyancy forces developed in the fluid. The timing of the onset of natural convection depends on the rate of molecular diffusion of air through the helium in the core. This phenomenon is strongly dependent on flow characteristics through the core (e.g. form losses) and subsequent thermal response. Prediction of the onset of natural convection depends on how well the code being used represents molecular diffusion and how accurately the flow through the core is modeled. Therefore, we will be benchmarking MELCOR against the Japanese experimental results presented in Takeda and Hishida (1992). With the benchmarking complete, we will then take what we have learned and apply it to our MPBR model.
4.2 MIT Research 4.2.1 The Loss-of-Coolant Accident with Depressurization 4.2.1.1 Introduction One of the criteria that are emerging for Generation IV reactors is that the reactor be designed such that core damage will not occur even without the use of emergency core cooling systems. The pebble-bed reactor being developed under this project and in South Africa is a reactor for which such an objective can be reasonably attained by virtue of its low power density and special fuel design. The loss-of-coolant accident (LOCA) is one of the most severe accidents for an MPBR. The challenge in a LOCA is to remove the heat released by radioactive decay of fission products without core damage by passive means (such as natural convection) only. This reactor concept must be designed in such a way that the temperature limits will not be exceeded in such an accident, even if no active heat removal measures are taken. The design feature by which decay heat removal is to be accomplished in a LOCA is called the Reactor Cavity Cooling System (RCCS). However, the reliability of the RCCS has not been demonstrated. Therefore, to prove the PBMR’s complete passive safety, an analysis must be performed to show the course of a LOCA in conjunction with the failure of the RCCS. The purpose of the analysis presented below is to determine the peak temperatures for the core, pressure vessel and concrete wall after a LOCA with depressurization which proceeds with no means of core and reactor cavity cooling except for conductive and radioactive heat transfer to the soil and natural convection from the enclosed top of the reactor cavity to the air. 4.2.1.2 Description of the Model A three-dimensional model of the PBMR was developed for input to the HEATING-7 code (Childs, 1993); further discussion of HEATING-7 is provided below. The model divides the reactor into 21 regions, as shown in Figure 4.15, which are composed of seven different materials: pebbles, graphite, helium, 2-1/4 Cr-Mo steel, air, concrete, and soil. The core void is filled with stagnant helium. Figure 4.16 shows the core nodalization. The thermal properties (thermal conductivity, density, and specific heat) of the materials are shown in Figures 4.17-4.19. In some cases, these properties could not be fully determined. In these cases, conservative values were chosen as a basis, and sensitivity analyses were performed on these undetermined parameters.

69
(112). Bottom Air Gap
Figure 4.15. HEATING-7 Model.
(101). Top Reflector
(103). Bottom Reflector
(102). Side Reflector
(107). The Top of the Vessel
(116) Side Ground
(109). The Bottom of the Vessel
(113). Top Concrete Wall
(114). Side Concrete Wall
(110). Top Air Gap
(104) Top Helium Gap
(1-5). Core
R
Z
(108). The Side of the Vessel
(111). Side Air Gap
(115). Bottom Concrete Wall
(105) Side Helium Gap
(117). Bottom Ground

70
1
12
6
11
5
4
3
2
20 31 43
32 21 44
33 45
35 13
14
23
24
15
25
10
36
37
26
22
50
34
49
48
47
46
54
7
16 52
51
38
8
9
18
19
29
17 28
40
53 39
27
30 57 42
56 41
55
Channel 1
Channel 2
Channel 3
Channel 4
Channel 5
Hot-Point of the Core
Figure 4.16. The Geometry of the Core

71
Figure 4.17. Conductivity vs. Temperature.
0.01
0.1
1
10
100
0 200 400 600 800 1000 1200 1400 1600 1800 2000 2200 2400
Temperature (C)
Co
nd
uct
ivit
y (w
/m.C
)--L
og
arit
hm
ic S
cale
Air
Graphite
Helium
Pebble
Vessel
Figure 4.18. Density vs. Temperature.
0
2
4
6
8
10
12
0 300 600 900 1200 1500 1800 2100 2400 2700 3000
Temperature (C)
Den
sity
(kg
/m3)
Air
Helium

72
Figure 4.19. Specific Heat vs. Temperature.
0
1000
2000
3000
4000
5000
6000
0 500 1000 1500 2000 2500
Temperature (C)
Sp
ecif
ic H
eat
(J/k
g.C
)
Air
Concrete
Graphite
Pebble
Vessel
HEATING-7 (Heat Engineering and Transfer in Nine Geometries) (Childs, 1993) is a general-purpose FORTRAN-77 code for steady-state and transient heat transfer problems in one-, two-, or three-dimensional Cartesian, cylindrical, or spherical coordinates. HEATING-7 uses free-form input subdivided into data blocks by keywords. HEATING-7 has been modified to accept twelve (instead of nine) geometry variations. Because of the very slow heat transfer rate, the outer radius of this model is assumed to be 26.63 m; i.e., all the heat transfer happens only in this huge volume. (The temperature map of the calculation confirmed this estimation.) The total number of nodes in the model is 58,106. Initial equilibrium cycle core conditions obtained from the VSOP code (see Section 3.2) were assumed to exist at the time of reactor depressurization and shutdown. Table 4.2 shows the initial conditions. Where the temperature is spatially dependent, the figures that display them are identified in the table. The core modeled was the Eskom pebble-bed reactor being proposed in South Africa, which is being used by MIT as the reference core design. The initial temperature of the concrete wall and the soil were assumed to be 50 °C and 35 °C respectively. The KFA decay heat curve was assumed. The core barrel region, which is made of steel of small thickness and high thermal conductivity relative to the other materials, is neglected because of its low thermal resistance. The air in the confinement region is assumed to be stagnant and to transfer heat only through conductivity and radiation.

73
Table 4.2 Initial Temperatures of the Regions.
Region Initial Temperature (°C) The Core Figure 4.20 Top Reflector Figure 4.21 Side Reflector Figure 4.22 Helium Gap 279 Pressure Vessel 279 Air Gap 279 Concrete Wall 50 Earth 35
The initial temperatures are adopted from the results of VSOP.
Figure 4.20. The Initial Temperatures of the Channels.
500
550
600
650
700
750
800
850
900
950
1000
-4 -3 -2 -1 0 1 2 3 4
Z (m)
Tem
per
atu
re (
C)
Channel 1
Channel 2
Channel 3
Channel 4
Channel 5

74
Figure 4.21. The Initial Temperature of the Top Reflector.
470
480
490
500
510
520
530
540
550
560
3.5 3.7 3.9 4.1 4.3 4.5 4.7 4.9 5.1 5.3 5.5
Z (m)
Tem
per
atu
re (
C)
Figure 4.22. The Initial Temperature of the Side Reflector.
0
100
200
300
400
500
600
700
800
900
1000
-6 -4 -2 0 2 4 6
Z (m)
Tem
per
atu
re

75
4.2.1.3 Decay Heat Generation After reactor shutdown, fission power induced by delayed neutrons subsides rapidly, and thereafter the heat released by radioactive decay of fission products dominates the reactor power. The decay heat depends primarily on the operating history of the reactor, including the reactor power level prior to shutdown, and on the duration of the shutdown period. The following empirical formula from KFA (Yan, 1990) is used to approximate the power released by radioactive decay: QDH(t0,ts)=QTA(ts
–a-( t0 + ts)-a) (4.16)
where QT = reactor power prior to shutdown, ts = reactor shutdown time, t0 = reactor operating time, and A and a are constants given for different time intervals in Table 4.3. Table 4.3. Constants A and a in Eq. (4.16) Time Intervals (seconds) A a 10-1< ts<101 0.0603 0.0639 101<ts<1.5*102 0.0766 0.181 1.5*102<ts<4.0*106 0.130 0.283 4.0*106<ts<2.0*108 0.266 0.335 Figure 4.23 displays the decay heat curve. The power curves for the five core channels are shown in Figure 4.24.
Figure 4.23. Decay Heat vs. Time.
0
0.005
0.01
0.015
0.02
0.025
0.03
0.035
0.04
0.045
1 10 100 1000 10000 100000 1000000 10000000 100000000
Time (Second)
Dec
ay H
eat
(W)
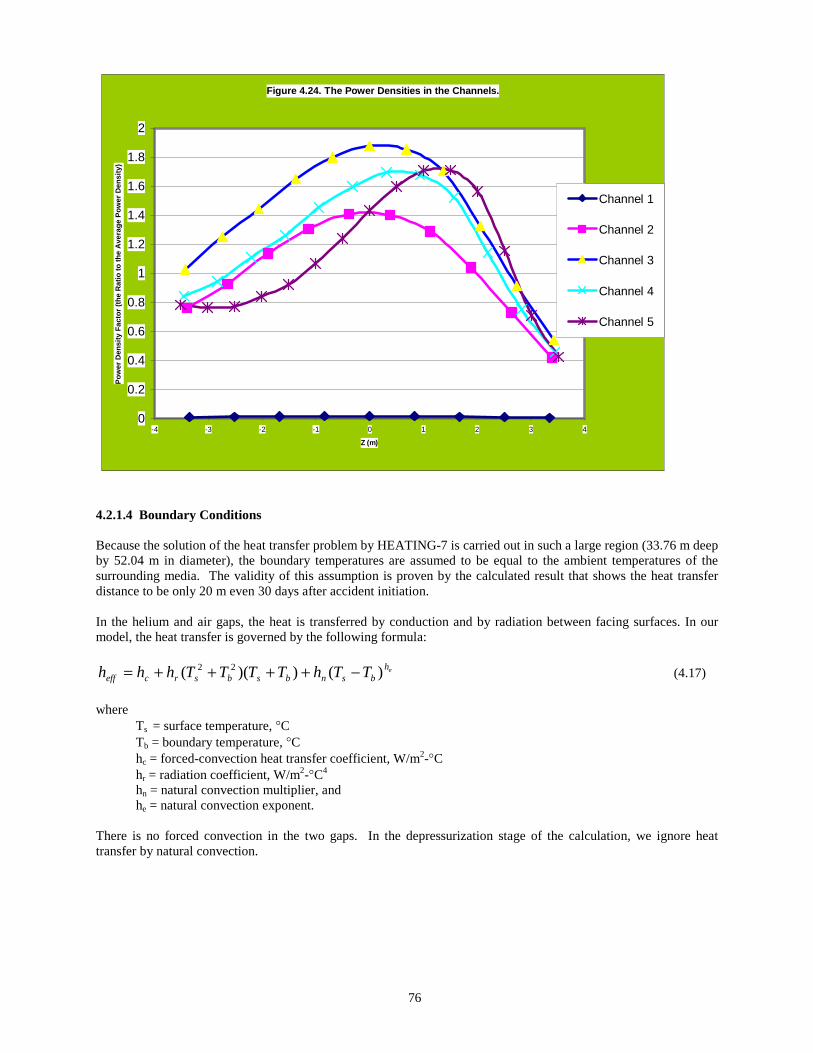
76
Figure 4.24. The Power Densities in the Channels.
0
0.2
0.4
0.6
0.8
1
1.2
1.4
1.6
1.8
2
-4 -3 -2 -1 0 1 2 3 4
Z (m)
Po
wer
Den
sity
Fac
tor
(th
e R
atio
to
th
e A
vera
ge
Po
wer
Den
sity
)
Channel 1
Channel 2
Channel 3
Channel 4
Channel 5
4.2.1.4 Boundary Conditions Because the solution of the heat transfer problem by HEATING-7 is carried out in such a large region (33.76 m deep by 52.04 m in diameter), the boundary temperatures are assumed to be equal to the ambient temperatures of the surrounding media. The validity of this assumption is proven by the calculated result that shows the heat transfer distance to be only 20 m even 30 days after accident initiation. In the helium and air gaps, the heat is transferred by conduction and by radiation between facing surfaces. In our model, the heat transfer is governed by the following formula:
ehbsnbsbsrceff TThTTTThhh )())(( 22 −++++= (4.17)
where Ts = surface temperature, °C
Tb = boundary temperature, °C
hc = forced-convection heat transfer coefficient, W/m2-°C
hr = radiation coefficient, W/m2-°C4
hn = natural convection multiplier, and
he = natural convection exponent. There is no forced convection in the two gaps. In the depressurization stage of the calculation, we ignore heat transfer by natural convection.

77
4.2.1.5 The Calculation and the Sensitivity Analysis In this analysis, three hot points were identified – hot points for the core, the pressure vessel and the concrete wall. The location of the hot point in the core is shown in Figure 4.16. The temperatures at these three points are shown as functions of time in Figure 4.25 for the baseline calculation. The hot point in the core lies in core channel 2, but its location is not steady – it will move slowly from the bottom of the core to a point near the axial midplane. Because of the very slow heat transfer, most of the decay heat will be deposited in the graphite and the soil immediately around the reactor cavity. The maximum temperature attained at the core hot point is 1642 °C at 92 hours after the beginning of the accident. This temperature slightly exceeds the 1600 °C limiting value for the fuel. Although the decay heat goes down with time, the core hot-point temperature stays above 1400 °C during the first three months. The main reason for this is that the thermal resistance increases with the spread of heat in the soils. At the same time, the calculation indicates that the hot points in the pressure vessel and the concrete wall will reach their peak values at 1311.42 °C and 1306.17 °C, respectively, at 1680 hours (about 73 days) after the shutdown of the reactor. The difference between the temperatures at the pressure vessel hot point and the concrete wall hot point is only about 5-20 °C, because the thermal resistance of the reactor cavity is comparable to that of the soil. Figure 4.26 shows the temperature profile in the axial midplane from the center of the core to the soil on the 73rd day (73 d = 1752 hr). There is a steep temperature gradient in the concrete wall and the soil immediately around the concrete wall. The heat transfer distance in the soil is only about 3 meters even 73 days after the accident begins. Thus, most of the decay heat will accumulate in this small volume, which leads to the higher temperature inside the cavity. Because the MPBR program is still in the conceptual design stage, many key parameters have not been identified. Based on our engineering experience and theoretical estimates, the most crucial parameters that affect the temperature field were identified and a sensitivity analysis was done. The parameters for which sensitivity analyses are shown in this report are: • The emissivities of the vessel and the concrete wall • The decay heat • The combined conductance of the concrete wall and the soil. There are other factors that were analyzed but are not shown. These are: • The volume of the graphite • The natural convection above the cavity • The temperature of the air above the cavity • The initial temperature of the core • The initial temperature of the graphite • The initial temperature of the air gap • The conductance of the concrete wall • The conductance of the soil • The specific heat of the concrete wall • The specific heat of the soil. Because the difference between the temperatures of the pressure vessel and the concrete wall is small (between 5 and 20 °C), the sensitivity study does not present separate results for these two components. The concrete wall serves to represent both. It is assumed in the sensitivity study that the pressure vessel and concrete wall have equal emissivities. The time histories of the temperatures of the core and the concrete wall are shown in Figure 4.27 for three values of this emissivity. The baseline value is 0.73, and two other values are compared with this. The lowest emissivity considered is 0.01, which will result in a higher core peak temperature. For this value, the hot-point temperature of the core during the first three months is always above 1600 °C once the peak value is reached early in the accident. Moreover, because of the isolating effect of this very low emissivity, most of the heat will be retained inside of

78
Figure 4.25. The Temperature Curves for 3 months.
0
200
400
600
800
1000
1200
1400
1600
1800
0 200 400 600 800 1000 1200 1400 1600 1800 2000 2200Time (hour)
Tem
per
atu
re (
C)
The Hot-PointTemperatureof the Core
The Hot-PointTemperatureof thePressureVessel
The Hot-PointTemperatureof theConcreteWall
Figure 4.26. The Temperature Profile on the 73rd Day
0
200
400
600
800
1000
1200
1400
1600
0 1 2 3 4 5 6 7 8 9 10 11
Distance to the Centerline (m)
Tem
pera
ture
(C
)
Vessel
Core Reflector Soil
ConcreteWall

79
Figure 4.27. Sensitivity to Emissivity of Vessel and Concrete Wall.
0
200
400
600
800
1000
1200
1400
1600
1800
2000
0 200 400 600 800 1000 1200 1400 1600 1800 2000 2200Time (hr)
Tem
per
atu
re (
C)
Core benchmark Core E=0.01
Core E=1 Wall Benchmark
Wall E=0.01 Wall E=1
the vessel at the beginning, so the concrete wall has a lower temperature than in the baseline for the first 900 hrs. After 900 hours, this retained heat leaks out into the soil, which then becomes the main heat sink. Then the steepest temperature gradient will be in the soil. Consequently, the concrete will have a higher hot point peak temperature (about 1400°C) than in the baseline (1307°C). The third value of the emissivity is 1.0. The differences between the temperature histories in the baseline case and this one are very small. Figure 4.28 shows the core and wall hot-point temperatures as functions of time for the first 2200 hours (about three months) after the accident begins, for decay-heat levels resulting from reactor operation for one, three, and 40 years prior to the accident. The baseline operation interval is three years. The temperatures for the three cases are close together for the first 48 hr. After 48 hr, the influence of the operation interval increases with time. The peak hot-point core temperature is just barely 1600 °C for the one-year interval and it is over 1700 °C for the 40-year interval. By two months (about 1500 hr) after the accident, the temperature differences between the two extreme cases are about 400 °C for both components. Thus, the temperatures are sensitive to the decay heat. Figure 4.29 shows the sensitivity of the core and concrete wall temperatures to the thermal conductivity of the soil and the concrete wall (these two components are assumed to have equal thermal conductivities). The limiting temperatures of the pressure vessel and the concrete wall are 482 °C and 177 °C, respectively (recall that the temperatures of these two components are considered to be equal). The baseline value of the conductivity is 0.54 W/m-°C, and the values of 5 W/m-°C and 10 W/m-°C were also considered. This last value is approximately the same as that of mercury at 200 °C. Figure 4.29 shows that the maximum value of the core hot-spot temperature is not highly sensitive to the soil and concrete wall conductivity, even when this conductivity is extremely high, but that the core hot-point temperature at later times is strongly reduced by high values of the conductivity. The peak temperature of the concrete wall and pressure vessel decreases dramatically when the soil and concrete wall conductivity is increased so radically, but it is still 535 °C, which is above the temperature limits of both materials. The remaining parameters that were varied in the sensitivity study do not strongly affect the core and concrete wall temperatures.

80
As an independent confirmatory check, calculations were performed by Hee Cheon No to benchmark the HEATING-7 results. Dr. No’s summary conclusions are shown on Figure 4.30. This figure shows that with a convective coolant flow in the reactor cavity of approximately 6 meters per second, the concrete peak temperatures can be maintained within allowable limits, but the reactor vessel temperatures are still above the allowable range. 4.2.1.6 Conclusions and Recommendations Although the results of the conservative baseline condition show that the core peak temperature is lower than 1650 °C, which is not greatly in excess of the limiting fuel temperature, the temperatures of the vessel and the concrete wall are well out of the safety range in a short time. Therefore, our attention should turn to how to reduce the temperatures of the vessel and the concrete wall. From the baseline and sensitivity study, the conclusions obtained are: • The operation history, the emissivity of the pressure vessel and concrete wall, and the thermal conductivity of
the soil and concrete have significant influence on the temperature distribution, but the vessel and concrete wall exceed their temperature limitations for all values of these parameters.
• The safety objectives CANNOT be satisfied by improvement of the thermal properties. • Convection, natural or forced, must be added in the reactor cavity. • The study focus should be the vessel and the concrete wall.
Figure 4.28 The Sensitivity to the Decay Heat
0
200
400
600
800
1000
1200
1400
1600
1800
0 200 400 600 800 1000 1200 1400 1600 1800 2000 2200
Time (hr)
Tem
pera
ture
(C
)
3-Y Core
1-Y Corel
40-Y Core
3-Y Wall
1-Y Wall
40-Y Wall

81
Figure 4.29. Sensitivity to Conductivity of Soil and Concrete Wall (Soil and concrete wall have the same thermal conductivity).
0
200
400
600
800
1000
1200
1400
1600
1800
0 200 400 600 800 1000 1200 1400 1600 1800 2000 2200
Time (hr)
Tem
pera
ture
(C
)
Core Hot-Point Temperature When the Conductivity of the Soil and Concrete Wall is 0.54 W/m.C(Benchmark Condition)Core Hot-Point Temperature When the Conductivity of the Soil and Concrete Wall is 5 W/m.C
Core Hot-Point Temperature When the Conductivity of the Soil and Concrete Wall is 10 W/m.C
Concrete Wall Hot-Point Temperature When the Conductivity of the Soil and Concrete Wall is 0.54W/m.C (Benchmark Condition)Concrete Wall Hot-Point Temperature When the Conductivity of the Soil and Concrete Wall is 5W/m.CConcrete Wall Hot-Point Temperature When the Conductivity of the Soil and Concrete Wall is 10W/m.C

82
Figure 4.30. Trends of maximum temperature for 0, 2, 4, 6 m/s of air velocity in the air gap region.
0
300
600
900
1200
1500
1800
0 30 60 90 120 150 180 210Time (hr)
Tem
per
atu
re (
C)
Max FuelTemperature (0m/s)
Max VesselTemperature (0m/s)
Max Concrete WallTemperature (0m/s)
Max FuelTemperature (2m/s)
Max VesselTemperature (2m/s)
Max Concrete WallTemperature (2m/s)
Max FuelTemperature (4m/s)
Max VesselTemperature (4m/s)
Max Concrete WallTemperature (4m/s)
Max FuelTemperature (6m/s)
Max VesselTemperature (6m/s)
Max Concrete WallTemperature (6m/s)
Limiting Temperature for the Fuel
Limiting Temperature for the Vessel
Limiting Temperature for the Concrete Wall
4.2.2 The Air Ingress Accident 4.2.2.1 Introduction The air ingress accident is another accident sequence that must be evaluated for pebble-bed and prismatic HTGRs. Massive ingress of air into the core of a PBMR is among the accidents with a low occurrence frequency but possibly severe consequences. There are still gaps in understanding its progression. This work is intended to contribute towards improving the understanding of processes taking place during air ingress accidents.
After the blowdown stage of this accident, air in the reactor cavity enters the reactor vessel by diffusion and then by natural convection. In the natural convection stage, air flow is driven by buoyancy forces established by temperature and density differences in air and helium. At some point, natural convection is established in the loop comprising the coolant channels and the reactor cavity. The analysis completed to date is a highly hypothetical scenario involving a complete cross-duct failure and unlimited air supply into the reactor vessel. 4.2.2.2 The Physical Process of the Accident
When the depressurization stage ends, helium gas remains in the reactor vessel at essentially atmospheric pressure. There is an air/helium gas mixture around the reactor vessel with a volume concentration ratio of about 1 to 1. This means that the gas layers are entirely stable, because helium is lighter than an air/helium gas mixture. In addition, the buoyancy force between a high-temperature coolant passage (hot leg) and a medium-temperature passage (cold leg) in the reactor is not large enough to cause natural circulation of the gas mixture (composed of N2, O2, CO2 and CO) throughout the reactor. Hence, air enters the reactor vessel mainly by molecular diffusion and by a special type of natural convection called very weak natural convection. This special type of natural convection is caused by buoyancy forces between the high-temperature and the medium-temperature passages. In addition, the gas mixture is transported by natural convection in many local spaces inside the reactor vessel. Oxygen in the air reacts with graphite components and produces CO and CO2. This period is called the first stage of the accident. Although the first stage lasts for a long time, the total amount of air entering the reactor in this stage is very small.

83
As time passes, the density of the gas mixture in the reactor increases and the buoyancy force caused by density differences between the high-temperature and medium-temperature passages also increases. Finally, because of these buoyancy forces, natural circulation of air takes place throughout the reactor. That is, air enters into the reactor from the breach of the inner tube of the primary pipe and passes through the high-temperature passage and medium-temperature passage. It goes out from the reactor through the breach of the outer tube of the primary pipe. After initiation of this natural circulation, the second stage of the accident starts. The air ingress process is completely different in the first and second stages. The important mechanisms of air ingress in the first stage of the accident are molecular diffusion and the very weak natural convection of the gas mixture. The dominant mechanism in the second stage is buoyancy-driven natural convection. 4.2.2.3 Main Reactions In contrast to its excellent thermal, mechanical and neutron physical properties, the resistance of graphite to oxidizing gases is rather low. The possible chemical reactions are:
2C + O2 ---> 2CO ( H = -110.52 KJ/mole) C + O2 ---> CO2 ( H = -393.51 KJ/mole) C + CO2 <--->2CO ( H = 172.47 KJ/mole) 2CO + O2<--->2CO2 ( H = - 565.98KJ/mole).
The reactions may be described as occurring in four major steps. First, oxygen gas must be transported to the graphite surface. Second, the gas must diffuse into the graphite pores to the oxidation location. Third, the actual chemical reaction must occur. Last, the reaction products must diffuse out of the media to allow more oxygen to reach the graphite (Wichner, 1999). This is a very complicated process. Besides CO, CO2, and NxOx a carbon-oxygen surface complex is formed. For the reaction above 1000 K, CO is the dominant reaction product. Its production progresses by the formation of a surface oxide, C3O4, which forms very rapidly and then decomposes in the presence of carbon and oxygen. At temperatures above 1100 °C, the reaction favors the formation of CO. Increasing the velocity of the gases flowing over the carbon suppresses the formation of CO2. CO2 is the product of the secondary reaction between CO and O2 (Liu, 1973). Important Parameters Governing these Reactions The most important factors that determine the reaction rates of the reactions listed above are:
• Temperature of reacting components • Gas flow rates • Concentration of oxygen • Pressure (the partial pressures of reacting gases and the total pressure).
Reaction of oxygen with graphite will commence at temperatures higher than 400 °C. Countermeasures to stop the oxidation process are either to cool down the core below 400 °C by the main heat sink or to stop the air ingress. In the low-temperature regions (less than 600 °C), chemical reactions are slow and the time required for oxygen transport may be neglected. In this temperature regime, oxidation is assumed to proceed uniformly throughout the graphite by in-pore diffusion; then the diffusion rate determines the graphite conversion rate. Boundary layer diffusion occurs at high temperatures. In general, the higher the temperature, the greater the proportion of CO formed. Above 900 °C, the product consists almost entirely of CO. For graphite pebbles and the graphite reflector, one of the crucial issues is whether the graphite will burn in an air ingress accident. “Burning” is defined as rapid self-sustained oxidation at high temperatures. Self-sustained oxidation occurs when enough heat is deposited by the reaction in the oxidizing material either to maintain or to increase the material’s temperature. This requires either vaporization or the release into the air of fine particulate matter (Wichner, 1999). There is no mechanism for the release of fine particulate graphite, and graphite vaporization requires temperatures above 3500 °C. The factors needed to determine whether or not graphite can

84
burn in air are graphite temperature, air temperature, air flow rate (in a limited range), and the ratio of heat lost to heat produced.
The consecutive elementary processes are:
1. diffusion of reactants to the surface 2. absorption of reactants at the surface 3. chemical reaction on the surface and within pores 4. desorption of products 5. diffusion of products away from the surface and pores. 4.2.2.4 The Pressure Drop For the pressure drop in the pebble bed, the following formulas were adopted (Fenech, 1980):
2
2
1u
d
Hp
ρε
εψ −=∆ (4.18)
1.0)
1Re
(
6
1Re320
εε
ψ
−
+
−
= (4.19)
where H is the height of the pebble bed
d is the diameter of the pebbles ρ is the fluid density
ε is the porosity of the pebble bed u is the gas velocity, and
ψ is the pressure drop coefficient, which is dependent on the Reynolds number, defined as
η
ρdu=Re (4.20)
where η is the fluid dynamic viscosity. Equation (4.18) is confirmed by experiments up to Re/(1-ε) = 5 x 10⁴. The first term of Eq. (4.19) represents the asymptotic solution for laminar flow, the second for turbulent flow.
It has to be taken into account that the average void fraction of the pebble bed, εt, is dependent on D/d, where D is the diameter of the pressure vessel:
375.0)/(
78.02
+=dDtε (4.21)
The voidage decreases with increasing ratio D/d and levels out to εt =0.375 for D/d → ∞ . 4.2.2.5 The Model
A schematic diagram of the model is shown in Figure 4.31. The key parameters are shown in Table 4.4. The Main Assumptions: In this study, a scenario referred to as the “chimney effect” is assumed. Figure 4.32 illustrates the flow paths in the “chimney.” Based on our former LOCA sensitivity study, we made the following assumptions:
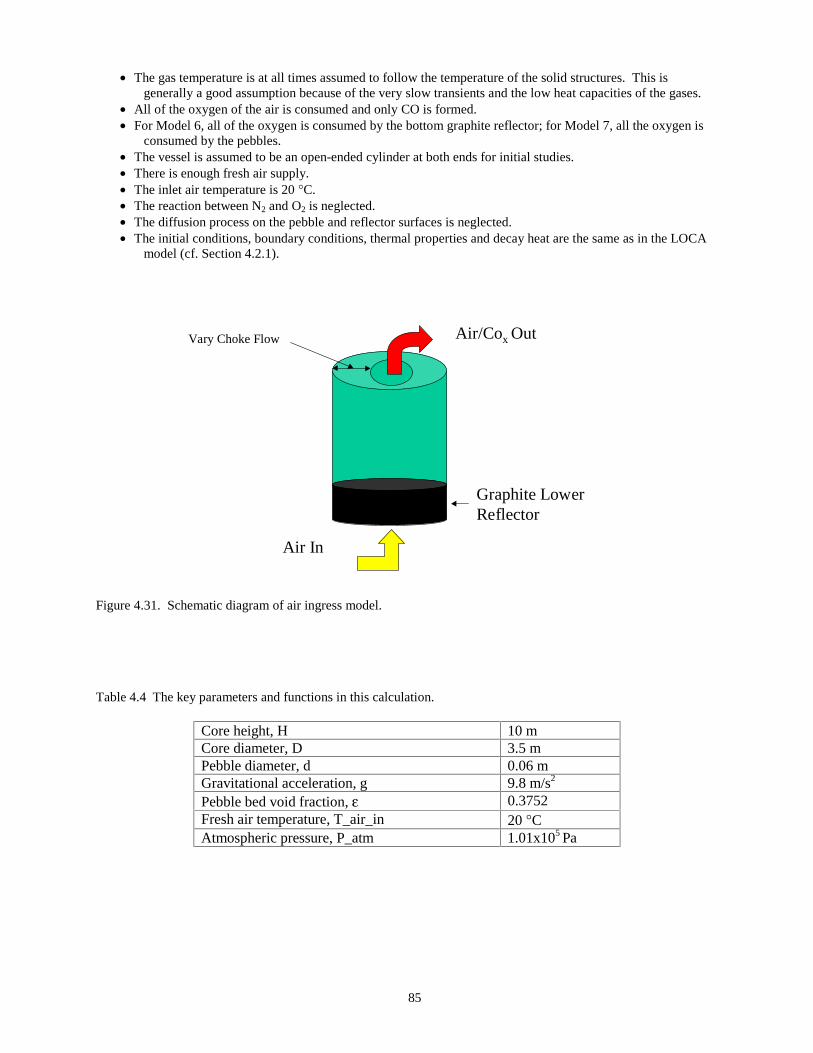
85
• The gas temperature is at all times assumed to follow the temperature of the solid structures. This is generally a good assumption because of the very slow transients and the low heat capacities of the gases.
• All of the oxygen of the air is consumed and only CO is formed. • For Model 6, all of the oxygen is consumed by the bottom graphite reflector; for Model 7, all the oxygen is
consumed by the pebbles. • The vessel is assumed to be an open-ended cylinder at both ends for initial studies. • There is enough fresh air supply. • The inlet air temperature is 20 °C. • The reaction between N2 and O2 is neglected. • The diffusion process on the pebble and reflector surfaces is neglected. • The initial conditions, boundary conditions, thermal properties and decay heat are the same as in the LOCA
model (cf. Section 4.2.1).
Figure 4.31. Schematic diagram of air ingress model. Table 4.4 The key parameters and functions in this calculation.
Core height, H 10 m Core diameter, D 3.5 m Pebble diameter, d 0.06 m Gravitational acceleration, g 9.8 m/s2 Pebble bed void fraction, ε 0.3752 Fresh air temperature, T_air_in 20 °C Atmospheric pressure, P_atm 1.01x10⁵ Pa
Air In
Air/Cox OutVary Choke Flow
Graphite LowerReflector

86
Figure 4.32. The Initial Model of the Air Ingress.
Pebbles
Hot COx

87
4.2.2.6 Calculation Procedures The extensive literature on this accident indicates that this is a challenging problem in which several complicated issues are involved, such as mass transfer, chemical reactions, and heat transfer by conduction, natural convection and radiation. Therefore, it was determined that the study would be divided into the following steps: Step 1: Determine the flow resistance of the pebble bed; from the balance between buoyancy and friction forces, the relationship is obtained between the air inlet velocities and the gas outlet temperatures. Step 2: Calculate the chemical reaction rate. The chemical reaction rate given by chemical kinetics theory is (Oh et al., 2001):
R=K1*exp(-E1/T)(PO2/20900) (4.22)
where K1=0.2475 and E1=5710 when T < 1273 K, and K1=0.0156 and E1=2260 when 1273 K < T < 2073 K.
The production ratio (Ra) of CO to CO2 is (No, 2001)
Ra=7943exp(-9417.8/T) (4.23) For C + zO2 = xCO + y CO2 , the general formula for all the graphite oxidation reactions,
z=0.5(Ra+2)/(Ra+1), x=Ra/(Ra+1), and y=1/(Ra+1). (4.24)
Step 3: Add the heat by chemical reaction to the energy term of Code HEATING-7. Step 4: Run HEATING-7. Step 5: Estimate the air velocity, graphite combustion rate and other parameters.
4.2.2.7 Results Our first model was used to study the flow resistance of the pebble bed as a function of the graphite average temperature (Figure 4.33). The resistance calculation for the pebble bed shows that the air inlet velocity does not always increase when the core is heated. The air inlet velocity reaches its peak value at about 300 °C. As pebble temperature increases beyond this point, the inlet air velocity is reduced. The reason for this decrease is that if the pebble temperature is higher, the temperature of the air becomes higher, which leads to a lower air density. The higher temperature would result in higher exit velocities at the outlet of the open cylinder. However, because the resistance to flow is almost proportional to the air velocity, at some point (which turns out to be about 300 °C), the higher pebble temperature leads to slower air inlet velocity (even though the outlet velocity increases). This negative feedback is a very positive result for the air ingress accident study, because the core temperature is almost always well above 300 °C.

88
Figure 4.33. Air Inlet Velocity vs Graphite Average Temperature.
0
0.01
0.02
0.03
0.04
0.05
0.06
0.07
0.08
0.09
0 400 800 1200 1600 2000 2400 2800 3200
Graphite Average Temperature(C)
Air
Inle
t V
elo
city
(m/s
)
HEATING-7 was run with the slightly increased heat source that includes the decay heat. Then the temperature distribution was obtained. Because this is a very slow transient and because of the very low heat capacity of the gases, the gases would have a temperature distribution similar to that of the solid structure. In contrast to the assumptions made in our LOCA study, natural convection was included in the initial calculation of the air ingress accident. The calculation shows that after the core average temperature is higher than 1300 °C, the rate of heat removal by the gases is greater than the chemical reaction heating rate (Figure 4.34). This result means that there is less heat transfer through the vessel than in our LOCA study if the natural convection term is considered in the air ingress accident. Therefore, the core peak temperature (Figure 4.35) is 1613 °C, lower than the core peak temperature of 1642 °C observed in the LOCA analysis but still above the limiting temperature of 1600 °C. As noted in Section 4.2.1.5, the hot-point temperature is not stationary in channel 2, but slowly moves upwards. Figure 4.36 shows the temperature in channel 2. Figure 4.37 displays the air inlet velocity as a function of time. Because all of the oxygen is consumed in the reactor (actually, most of it is consumed in the bottom reflector), the chemical reaction rate curve (Figure 4.38) has a shape similar to that of the curve for the air inlet velocity. In the first two weeks, the average chemical reaction rate is about 2419kg/day, which means that all of the bottom reflector will be consumed in 39 days. The relationship between air inlet velocity and the diameter of the broken pipe is shown in Figure 4.39. There is no significant influence on the flow rate if the diameter is above 0.7 meter. The mole percentage concentrations of gases are shown in Figure 4.40. All the oxygen is consumed in the bottom reflector, and the dominant gas is CO because of the higher core temperature.

89
Figure 4.35. The Core Hot-Point temperature
0
200
400
600
800
1000
1200
1400
1600
1800
0 50 100 150 200 250 300 350 400time(hr)
Tem
pera
ture
(de
gree
s C
)
Figure 4.34. Chemical reaction heat transfer through reactor vessel.
-150000
-100000
-50000
0
50000
100000
150000
200000
800 1000 1200 1400 1600 1800 2000
Core average temperature (degrees C)
Ch
emic
al r
eact
ion
hea
t tr
ansf
er r
ate
th
rou
gh
vess
el (
W)

90
Figure 4.36. The Tem perature in Channel 2
1000
1100
1200
1300
1400
1500
1600
1700
-4 -2 0 2 4
Z (m )
Tem
pera
ture
(de
gree
s C
)
Figure 4.37. Air Inlet Velocity Vs. Time
0
0.01
0.02
0.03
0.04
0.05
0.06
0.07
0 1000 2000 3000 4000 5000 6000 7000 8000 9000
Time(min)
Air
Inle
t Vel
ocity
(m
/s)

91
Figure 4.38. Chemical Reation Rate
0
0.005
0.01
0.015
0.02
0.025
0.03
0.035
0.04
0.045
0 50 100 150 200 250 300 350 400time(hr)
Gra
phite
Con
sum
ptio
n R
ate
(kg/
seco
nd)
F ig u r e 4 . 3 9 . A i r in le t v e lo c i t y v s . c h o k e d ia m e t e r .
0
0 . 0 1
0 . 0 2
0 . 0 3
0 . 0 4
0 . 0 5
0 . 0 6
0 0 . 5 1 1 . 5 2 2 . 5C h o k e d ia m e t e r ( m )
Air
inlte
t vel
ocity
(m
/s)
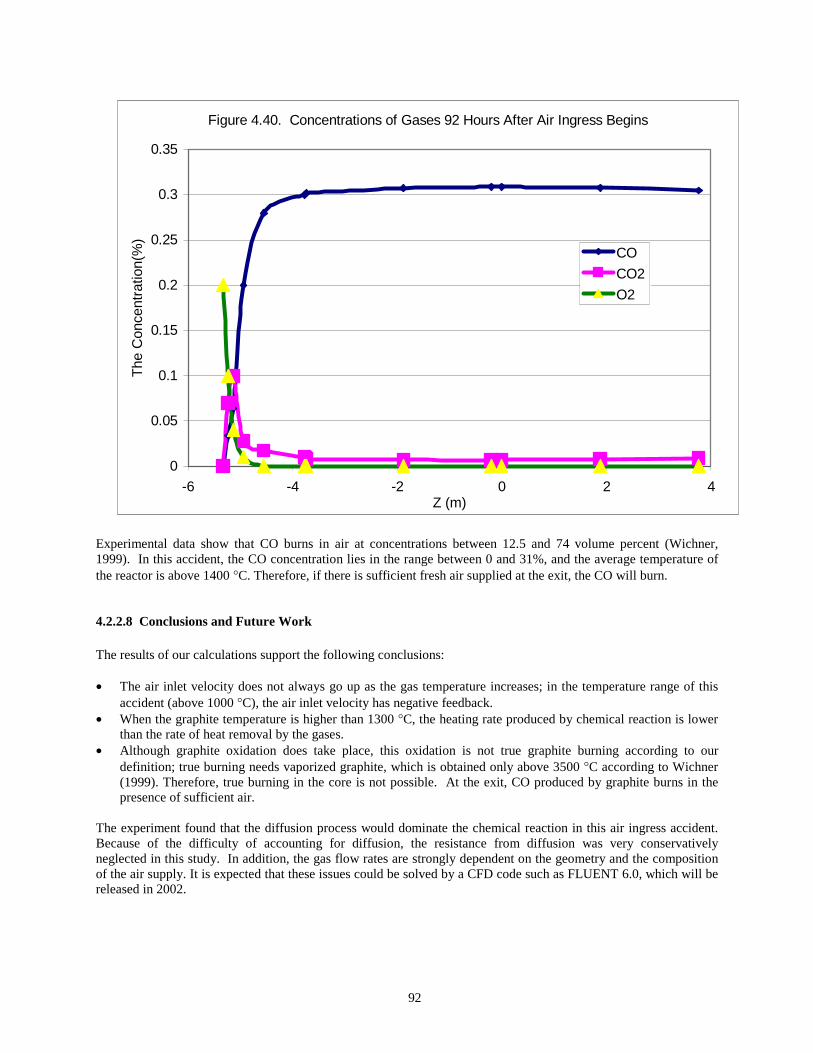
92
Experimental data show that CO burns in air at concentrations between 12.5 and 74 volume percent (Wichner, 1999). In this accident, the CO concentration lies in the range between 0 and 31%, and the average temperature of the reactor is above 1400 °C. Therefore, if there is sufficient fresh air supplied at the exit, the CO will burn. 4.2.2.8 Conclusions and Future Work
The results of our calculations support the following conclusions: • The air inlet velocity does not always go up as the gas temperature increases; in the temperature range of this
accident (above 1000 °C), the air inlet velocity has negative feedback. • When the graphite temperature is higher than 1300 °C, the heating rate produced by chemical reaction is lower
than the rate of heat removal by the gases. • Although graphite oxidation does take place, this oxidation is not true graphite burning according to our
definition; true burning needs vaporized graphite, which is obtained only above 3500 °C according to Wichner (1999). Therefore, true burning in the core is not possible. At the exit, CO produced by graphite burns in the presence of sufficient air.
The experiment found that the diffusion process would dominate the chemical reaction in this air ingress accident. Because of the difficulty of accounting for diffusion, the resistance from diffusion was very conservatively neglected in this study. In addition, the gas flow rates are strongly dependent on the geometry and the composition of the air supply. It is expected that these issues could be solved by a CFD code such as FLUENT 6.0, which will be released in 2002.
Figure 4.40. Concentrations of Gases 92 Hours After Air Ingress Begins
0
0.05
0.1
0.15
0.2
0.25
0.3
0.35
-6 -4 -2 0 2 4Z (m)
The
Con
cent
ratio
n(%
)
CO
CO2
O2

93
References Bird, R. B., W. E. Stewart, and E. N. Lightfoot, 1960. Transport Phenomena, John Wiley and Sons, New York, p. 269. Carlson, K. E., P. A. Roth, and V. H. Ransom, September 1986. “ATHENA Code Manual Vol. I: Code Structure, System Models, and Solution Methods,” EGG-RTH-7397. Childs, K. W., February 1993. “HEATING 7.2 USER’S MANUAL,” ORNL/TM-12262, Oak Ridge National Laboratory. Fenech, Henri, 1980. Heat Transfer and Fluid Flow in Nuclear Systems, Pergamon Press, pp. 382-401 Gauntt, R. O., R. K. Cole, S. A. Hodge, S. B. Rodriguez, R. L. Sanders, R. C. Smith, D. S. Stuart, R. M. Summers, and M. F. Young, 1997. “MELCOR Computer Code Manuals,” NUREG/CR-6119, Vol. 1, Rev. 1, SAND97-2397-2398. Hishida, M., and T. Takeda, 1991. “Study on air ingress during an early stage of a primary-pipe rupture accident of a high-temperature gas-cooled reactor,” Nuclear Engineering and Design, 126, 175-187. Liu, G. N-K., August 1973. “High temperature oxidation of graphite by a dissociated oxygen beam,” Master’s thesis, Massachusetts Institute of Technology. Merrill, B. J., R. L. Moore, S. T. Polkinghorne, and D. A. Petti, 2000. Fusion Engineering and Design, 51-52, 555-563. Nicholls, D., September 2001. “The Modular Pebble Bed Reactor,” Nuclear News, pp. 35-40.
Nieben, H.F., B. Stocker, O. Amoignon, Z. Gao, and J. Liu, September 30-October 4, 1997. “Sana Experiments for Self-Acting Removal of the After-Heat in Reactors with Pebble Bed Fuel and Their Interpretation,” Eighth International Topical Meeting on Nuclear Thermal-Hydraulic. Kyoto, Japan. No, H. C., 2001. “PBR System Simulation Code for Depressurization Accident Analysis in a Modular Pebble Bed Reactor,” Massachusetts Institute of Technology. O’Brien, M. H., B. J. Merrill, and S. N. Ugaki, September 1988. “Combustion Testing and Thermal Modeling of Proposed CIT Graphite Tile Material,” EGG-FSP-8255, Idaho National Engineering Laboratory. Oh, C., B. Merrill, R. Moore, and D. Petti, January, 2001. “Oxidation Model for an MPBR Graphite Pebble,” Idaho National Engineering & Environmental Laboratory. Takeda, T., and M. Hishida, 1992. “Studies on diffusion and natural convection of two-component gases,” Nuclear Engineering and Design, 135, 341-354. Wichner, R.P., April 1999. “Potential Damage to Gas-Cooled Graphite Reactors Due to Severe Accidents,” ORNL/TM-13661, Oak Ridge National Laboratory. Yan, Xinglong, June, 1990. “Dynamic Analysis and Control System Design for an Advanced Nuclear Gas Turbine Power Plant,” PhD thesis, Massachusetts Institute of Technology.

94
5.0 Conclusions
The collaboration between the INEEL and MIT has achieved successes in two arenas. First, analyses of PBR behavior has brought greater understanding of fuel performance, reactor physics, and thermohydraulic phenomena in these reactors; second, great progress has been made in the development of tools to advance the state of the art in PBR analysis. The key points of these successes are summarized below. Fuel Performance Model Development • The structural component of the fuel performance model PARFUME was developed for both normal and
cracked particles. • PARFUME code calculations were compared with results from US experiments (NPR). • Sensitivity studies were performed to identify important variables and the influence of key materials properties
(PyC-irradiation-induced creep, PyC Poisson’s ratio, and PyC strength). • A framework was developed for a chemistry module and work was begun to implement this module. • PARFUME was applied to predict performance of German fuel particles at high burnup. • Work was performed under other funding to understand differences between US and German fuel. • Two papers on the subject were published and one more is in process. • A functional fuel performance model independent of PARFUME has been developed and is being
benchmarked. • Consideration of fuel conditions during transit through the pebble bed core has been incorporated in this
independent model. • A more sophisticated chemical module for the independent module will be included in the next reporting
period, and final validation of the code will be performed using available fuel data. Core Neutronics • The PEBBED code has been developed from a proof-of-principle MATLAB program into a FORTRAN code
capable of addressing practical PBR physics problems. • PEBBED has been applied to analysis of nuclear-weapons proliferation issues. • Progress has been made towards the development of a state-of-the-art method for computing PBR physics
parameters. • An MCNP4B analysis methodology has been developed for pebble-bed reactors. • Benchmarks of the Proteus, HTR-10 and ASTRA tests have been performed that show very good agreement for
criticality calculations. • Control rod worth calculations show less good agreement because of the experimental configuration difficulties. • An MCNP/VSOP linkage has been developed. • Results of the annular core benchmarking show potential decoupling that needs evaluation. • Limitations of MCNP4B have been identified. • Proliferation analyses have been performed using MCNP and PEBBED. Safety Analysis • An ATHENA model of the Eskom MPBR was developed and used to analyze a hypothetical LOCA event. • An air ingress accident was modeled at the INEEL, and results of the modeling were published in a refereed
conference proceedings. • A MELCOR model was developed and applied to analyze the oxidation of the PBR core following air ingress.
Preliminary results show high localized pebble temperatures because of localized oxidation of the graphite pebbles. More detailed analyses are needed to confirm these results as well as to verify the MELCOR code’s ability to analyze air ingress accidents correctly.
• A depressurized loss-of-coolant analysis has been completed at MIT independently of the INEEL model, using conservative assumptions regarding heat removal; the results show that additional heat removal will be required for maintaining core, reactor vessel, and concrete reactor cavity temperatures within design limits.
• Preliminary air ingress analyses performed at MIT for scoping calculations, independently of the INEEL air ingress analysis, indicate a limit on inlet air flow and peak temperatures on the order of 1700 °C; more detailed analysis will be required to model the details of natural convection in the reactor system under air ingress conditions.

95
APPENDIX
AIR INGRESS ANALYSES ON A HIGH TEMPERATURE GAS-COOLED REACTOR

96
Proceedings of 2001 ASME International Mechanical Engineering Congress and Exposition
November 11-16, New York, NY
IMECE2001/HTD-24187
AIR INGRESS ANALYSES ON A HIGH TEMPERATURE GAS-COOLED REACTOR
Chang H. Oh Idaho National Engineering and Environmental
Laboratory, PO. Box 1625 Idaho Falls, ID 83415
Richard L. Moore Idaho National Engineering and Environmental
Laboratory, P.O. Box 1625 Idaho Falls, ID 83415
Brad J. Merrill Idaho National Engineering and Environmental
Laboratory, P.O. Box 1625 Idaho Falls, ID 83415
David A. Petti Idaho National Engineering and Environmental
Laboratory, P.O. Box 1625 Idaho Falls, ID 83415
ABSTRACT A loss-of-coolant accident is one of the design-basis accidents for a high-temperature gas-cooled reactor (HTGR). Following the depressurization of helium in the core, if the accident is not mitigated, there exists the potential for air to enter the core through the break and oxidize the in-core graphite structure in the modular pebble bed reactor (MPBR). This paper presents the results of the graphite oxidation model developed as part of the Idaho National Engineering and Environmental Laboratory’s Directed Research and Development effort. Although gas reactors have been developed in the past with limited success, the innovations of modularity and integrated state-of-art control systems coupled with improved fuel design and a pebble bed core make this design potentially very attractive from an economic and technical perspective. A schematic diagram of a reference design of the MPBR has been established at a major component level (INEEL & MIT, 1999). Steady-state and transient thermal hydraulics models will be produced with key parameters established for these conditions for all major components. Development of an integrated plant model to allow for transient analysis on a more sophisticated level is now being developed. In this paper, preliminary results of the hypothetical air ingress are presented. A graphite oxidation model was developed to
determine temperature and the control mechanism in the spherical graphite geometry.
INTRODUCTION The high temperature gas-cooled reactor (HTGR) provides an alternative approach to the commercialization of nuclear power as compared to other fission-power-producing systems such as light water reactors (LWRs), and liquid metal-cooled fast breeder reactors (LMFBRs). Gas cooling for nuclear reactors had been considered in the United States. The fundamental design of the MPBR is aimed at achieving a system without any physical process that could cause an internally induced and/or externally induced radiation hazard outside the site boundary. The thermal-hydraulic stabilization is provided by modularizing the core with a relatively low power density (<4.5MW/m3) such that the integrated heat loss capability from the reactor exceeds the decay heat production of the core under all conceivable accident conditions. The use of helium as a coolant, which is both chemically and radiologically inert, combined with the high temperature integrity of the fuel and structural graphite, allows for the use of high primary coolant temperature (1123 K) that yields high thermal efficiencies. The MPBR fuel is based upon the proven high quality German molded graphite sphere and TRISO coated particles. The fuel consists of 50-mm diameter inner fuel zone. The fuel zone is covered by a 5-mm thick fuel free graphite matrix zone, resulting in a spherical fuel pebble having a diameter of 60-mm. The fuel zone contains

97
approximately 11,000 coated particles, the equivalent of 7-g uranium. Approximately 300,000 fuel pebbles and 137,000 pure graphite pebbles are required for a single core loading.
PROBLEM STATEMENT When the pebbles composed mainly of graphite are surrounded by air resulting from a hypothetical air ingress event, there is a need to determine the maximum pebble temperature from a reactor safety point of view to make certain the temperature produced by the oxidation of the pebble is within the maximum allowable limit. Thus, we have developed a coupled heat and mass transfer solution in spherical geometry to describe the response of a graphite fuel pebble to ingress of air. The model considers convective mass transfer across a gas boundary layer, oxidation and recession at the surface of the pebble, and the resulting heat transfer to the pebble. From the literature (O’Brien et. al., 1988), the mechanisms that control oxidation of graphite are well defined as shown in Figure 1. At low temperatures (Regime 1), the reaction rate is controlled by chemical kinetics of oxygen reacting with active sites within the graphite. Mass transport rates are by diffusion, and nearly uniform oxidation occurs throughout the graphite mass. The percentages of sites within graphites that are reactive are very low and graphites are in general quite porous. Oxygen, or the oxidizing gas, will have the opportunity to diffuse sufficient distances into the material. Oxidation rates can therefore be expressed as a bulk rate based upon mass of the graphite, e.g., oxidized mass/(total mass-unit time). As temperature is increased, Regime 2 is reached where more sites within the graphite become active.
Figure 1. Schematic display of oxidation regimes.
Oxygen diffusing within the pores of the graphite is consumed at near-surface locations in the graphite. Both chemical reactivity and in-pore diffusion control the overall rate. Oxygen supply through boundary layer controls the reaction in Regime- 3. For bulk graphites, this occurs at temperatures greater than 1270 K. Reaction with the graphite occurs at the outer surface of the graphite and rates are therefore expressed based on surface area in terms of g/(cm2-s). Governing equations and boundary conditions For this study, the energy equation was solved using spherical geometry with boundary conditions specified below: 1. Air flows around the spherical graphite. The oxygen in
the air reacts with the graphite surface to produce CO2 gas.
molkJHCOOC CO /5.393,
222 −=∆→+
2. The heat transfer at the interface between the graphite and the bulk stream is defined by Nusselt number.
k
dhNu sc ⋅
= (1)
where ch is the convective heat transfer coefficient, sd is
the sphere diameter, and k is the air thermal conductivity. The heat transfer coefficients are defined in the following section. 3. The diffusive mass transfer rate through the boundary layer is defined by the Sherwood number.
ab
mi
3/1
h D
Lk
Pr
ScNuS =
= (2)
where mik is the convective mass transfer coefficient, Dab is
the binary diffusion coefficient and L is the characteristic length.
3/1
abmi Pr
ScNu
L
Dk
= (3)
Given the mass transfer coefficients, the oxygen mass flux arriving at the pebble surface is
mik32
12 ⋅ρ⋅
=Γ (4)
where ρ is the oxygen density.
These mass transfer equations are used to compare with the kinetic rate, which is described in later sections. The above diffusion coefficient was calculated using the following equation.

98
( ) ( )[ ]23/1
bv3/1
av2/1
ab
75.1
ab
MP
T00143.0D
∑+∑⋅⋅= (5)
1
baab M
1
M
12M
−
+
⋅= (6)
where Ma and Mb are the molecular weights for air and CO2,
respectively, and v∑ is diffusion volume (19.7 for air, and
26.9 for CO2, Reid, Praunitz, and Poling (1987)). The oxidation rate is determined as the minimum value of three values calculated each time step, which is: (1) graphite oxidation rate by kinetics, (2) oxygen mass flux in the bulk stream, (3) oxygen mass flux arriving at the interface. The equation solved for oxidation of the spherical pebble is the partial differential equation (PDE) shown below:
decayprpp qqr
Tkr
rrTcvr
rrt
Tc ++
∂∂
∂∂
=∂∂
+∂∂
&
22
22
1)(
1ρρ
(7)
where pρ is the density of graphite pebble, pc is the
specific heat, T is the temperature, t is the time, r is the radius,
rv is a node advection velocity defined as the oxidation rate
divided by density of graphite, k is the thermal conductivity, qdecay is the decay heat, and q� is the net surface heat flux and
is defined as
Thqq cox ∆⋅−=� (8)
where oxq is the heat flux due to the oxidation and ch is the
convective heat transfer coefficient calculated from the Nusselt (Eqn 1). The decay heat used in these calculations is listed below: if time ≤ 1.45 seconds , decay heat = 800 W/ volume. if 1.45 < time ≤ 25 seconds, decay heat = 800W/volume*1.394exp(-0.26*time) + 0.046 if 25 < time ≤ 1,000 seconds, decay heat = 800W/volume*(0.0495 - 2.0518e-5*time) if time > 1000, decay heat = 800W/volume* 0.03. The decay heat is small when compared to the heat of formation for CO2. The decay heat is about 50W (4420 J/m2-sec) after 17 seconds which is much smaller than the heat obtained from oxidation, provided sufficient oxygen is available at 1000 K. The above equation (7) is integrated:
( ) ( )
decay
V
2
V
2
22
V
2pr
22
V
2p
V
2
qdrr4qdrr4
r
Tkr
rr
1drr4Tcvr
rrdrr4
t
Tcdrr4
ii
iii
⋅π+⋅π+
∂∂
∂∂
π=
∂∂ρπ+
∂∂ρπ
∫∫
∫∫∫&
(9)
In the control volumes i, ρ , pc , k and q are assumed to be
constants. The PDE was rewritten in a finite difference form as:
( ) ( )ni
1ni
3j
31j
piTTrr
t3
c−−
∆
ρ+
+ +
[ ]1n1ip
2j
1nip
21jrp TcrTcrvc
1iii
+−
++ −
⋅−⋅ρ =
[ ] ( )1n1i
1ni
1ii
2jj1n
i1n
1ii1i
21j1j TT
rr
rkTT
rr
rk +−
+
−
+++
+
++ −−
−−−
+
( )3j
31j rr
3
q −+�
+ ( )3j
31j
decay rr3
q−+
(10) Corresponding to the different oxidation rates were used in this study. For Regime 1 in Figure 1, Grsac model (Wichner and Ball, 1999) was used:
[ ]
[ ]MW
*688.22T*02859.0T*2e368.9*}PR*AGE*21.0
Po*
T*R
24800exp*6e64.1Po
T*R
45000exp*PR*AGE*37.117e04.2{Rate
286.0
2
7.02
ρ+−−
−+
−+=
(11) where AGE is a reactor age factor, PR is a local to average core power, R is the universal gas constant, Po2 is the partial oxygen pressure, T is temperature, ρ is the density of the
graphite, and MW is the molecular weight of the graphite. A value of unity was used for ACE and PR. The transition temperature depends upon impurities in the graphite or reacting gas, microstructure of the graphite, and the type and concentration of the reacting gas (Veet al. 1978, Bunnell et al., and 1987. Gulbransen et al., 1964, Helms and MacPherson, 1965). The transition temperature between Regime 1 and Regime 2 is 395K as shown in Figure 2.

99
0 300 600 900 1200 1500 1800Temperature (K)
10-11
10-10
10-9
10-8
10-7
10-6
10-5
10-4
10-3
10-2
10-1
100
101
102
103
Oxi
datio
n R
ate
(kg/
m^2
-s)
Grsac correlationO’Brien correlation (T>1273K)O’Brien correlation (T<1273K)
Figure 2. Oxidation rates (three correlations). For Regime 2 and 3, INEEL correlation (O’Brien et al., 1988) is used. The type and dimension of the graphite specimen used for these correlations are as follows: Union carbide (density of 1720 kg/m3), Pfizer pyrolytic (density of 2150kg/m3), cylindrical specimens 2.7 cm in diameter and 1.27 cm in height, and 12.4279 g-mass. For T < 1273 K,
( ) ( ).secm/kgT
5710exp2475.0min/g
T
5710exp16Rate 2 ⋅⋅
−=⋅
−=
(12) For 1273 < T < 2073 K,
( ) ( ).secm/kgT
2260exp0156.0min/g
T
2260exp01.1Rate 2 ⋅⋅
−=⋅
−=
(13) Those oxidation correlations (Eqns. (11), (12), and (13)) used in these calculations are based on oxygen content at standard atmospheric conditions. As a first order approximation, the oxidation rate is assumed to vary linearly with the oxygen partial pressure as shown below:
)14()13,12,11.(521.0
orEqnsRatee
PrateOxidation ox ⋅=
The following equation was used for the heat of formation for CO2:
( )TTTHCOf /46000000007.0303.2/63.1.93690
44
.4187 22
−⋅+⋅−−⋅
=∆
(15)
)16(),
,(12
44
22
2
surfacetheatfluxmassObulkinfluxmassO
kineticsvaluelowestHheatOxidationCOf ⋅∆⋅
=
Other inputs to the computer program are: diameter of the graphite = 60 mm bulk temperature = 1100 K Nusselt number = 10, 40, and 90 oxygen partial pressure = 0.00447 MPa, 0.0106MPa, and 0.01704 MPa. thermal conductivity of air at the bulk temperature = 0.06 W/m-K density of air at the bulk temperature = 0.31 kg/m3
viscosity of air at the bulk temperature = 1120 N-s/m2
The thermal conductivity and heat capacity of graphite (based on GraphNOL N3M, Mattas, 1988) are calculated using the following equations:
( ) )17(*10*632.1exp.251.30)/( 3 TKmWk −−+=⋅
( )TKkgJcp *10*028.2exp*.2204.2000)/( 3−−−=⋅
(18) Figure 3 shows the complete oxidation regimes with transitions between the regimes.
Figure 3. Kinetics regime map depending n temperature. Heat transfer correlations The convective heat transfer is very important in these calculations. The heat transfer coefficient, hc, between the surface of a sphere and a fluid through which it is moving with relative velocity, is given by Ranz and Marshall (1952)
( )2/13/1
sc Re*Pr*6.02
d
kh += or
k
dhNu sc ⋅
= (19)
where k, ds, Pr, and Re are the thermal conductivity, diameter of the sphere, Prandtl and Reynolds number of the fluid. The heat transfer in fixed beds of coarse solids may be approximated by Ranz and Marshall (1952):

100
( )2/13/1
sc Re*Pr*8.12
d
kh += or
k
dhNu sc ⋅
= (20)
A similar heat transfer correlation developed for a pebble sphere is found by Kunii and Levenspiel (1962) such as
3/12/1
sc Pr*
Re*
d
k*664.0h
ε= or
k
dhNu sc ⋅
= (21)
where ε is the void fraction of the pebble bed reactor. Based upon experimental data from several independent studies of heat convection in pebble beds (Waermeuebergang 1978), heat transfer can be determined by
+= 86.0
07.1
5.00.36
18.1
0.333
sc Re
Pr033.0Re
Pr27.1
d
kh
εε or
k
dhNu sc ⋅
= (22)
Figure 4 shows heat transfer coefficients using the aforementioned four different heat transfer correlations.
0 500 1000 1500 2000 2500 3000
Reynolds number
0
20
40
60
80
100
120
140
160
180
200
Hea
t tra
nsfe
r co
effic
ient
(W
/m2 -K
)
Eqn (22)Eqn (20)Eqn (21)Eqn (19)
Figure 4. Heat transfer vs. Reynolds number using correlations developed for spheres in a fixed bed. To calculate the Reynolds number, the air velocity was estimated by using the following equation developed by Takase et. al (1996):
=
dt
)t(dx*
)t(x
1
A
V)t(U air
airNair
(23)
where V, NA , and Xair are the volume and cross-sectional area
of the bed and the mole fraction of air. Using the geometry of the bed, Figure 7 in the Takase’s paper (dx/dt = slope of the mole fraction curve at a specified time), a Reynolds number was calculated at about 292 (air velocity 0.65 m/s using Eqn. (23)) which gives the heat transfer coefficient of 12 W/m2-K using the above equation (20). However, the geometry and breach location of the Takase experiment is very different compared with the pebble bed reactor. The Takase experiment used a breach high in the vessel which allows natural convection to begin immediately because heavy air sits on top of light helium. The density difference in this configuration results in a Raleigh-Taylor instability which promotes mixing. In the case of a breach low in the vessel, as is the case for the MPBR, the heavy air sits at the bottom of the reactor and helium is above it. This situation is more thermodynamically stable. Processes like molecular diffusion promote mixing in a much longer time scale (Takeda and Hishida, 1991). The location of the breach greatly influences air mass flow to the reactor. As preliminary analyses are now showing, breaks at the core inlet show very low convective flows compared to calculated values using Eqn (23). Therefore, our analyses are very conservative. The partial pressure of oxygen is also important in these calculations. Air consists of 21% oxygen by volume.
VVg ⋅ε=
(24)
heliumairtotal PPP +=
(25)
( )volumegastotal
airofmass
V
M
TR
PP
g
air
air
heliumtotalair ==
⋅−
=ρ
(26) According to Amagat’s law, partial volume occupied by each
gas based upon totalP and T.
heliumairg VVV += at totalP and T.
(27)
TRV
MP air
air
airtotal ⋅= (28)
Combing these equations, the partial oxygen pressure is:
)(*21.02 heliumtotalO PPP −= (29)

101
RESULTS To validate the model, numerical results obtained from solving the above PDE equation were compared with the following analytical solutions using the following equation (Carslaw and Jaeger, 1959):
( )( )
( )
κ++−
κ−+=
2/12/1o
t2
ra1n2erfc
t2
ra)1n2(erfc
r
aTT
(11)
where ρ⋅
=κpc
k, To is the surface temperature. In this
comparison, q� and decayq in Eqn (7) were set to zero.
Figure 5 shows the comparison between analytical solutions and numerical solutions at various radii and time. For these comparison calculations, the initial temperature in the graphite was set to zero with a surface temperature of 1270 K, thermal conductivity of 36 W/m-K, heat capacity of 1465 J/kg-K, density of 900 kg/m3, and diameter of 10 mm. Oxidation in the program was turned off just to calculate the heat conduction without oxidation. The results agree fairly well as shown in Figure 5.
Figure 5. Comparison of Analytical Solutions with Numerical Ones. Using Eqn. (20), Nusselt numbers were calculated. Two oxygen partial pressures were assumed: a partial oxygen pressure of 0.0106 MPA was based on 0.5 mole fraction of air and 0.5 mole fraction of helium in the gas stream, and a partial oxygen pressure of 0.00447 MPa based on 0.2 mole fraction of air and 0.8 mole fraction of helium using Eqn (29).
As shown in Figure 6, as the oxygen partial pressure increases, the graphite temperature increases. Using the same pressures, Nusselt numbers were changed to determine the effect of the Nusselt number on temperature. As shown in Figure 7, temperature increases as the Nusselt number is reduced as anticipated. The effect of pressure has the same trend as those of Figure 6.
0 1000 2000 3000
Time (sec)
0
600
1200
1800
2400
3000
Tem
pera
ture
(K
)
Nu=90, PO2=0.0106MPaNu=90, PO2=0.0044MPa
Figure 6. Effect of oxygen partial pressure on temperature for Nu=90.
0 1000 2000 3000
Time (sec)
0
1000
2000
3000
4000
Tem
pera
tuire
(K
)
Nu=40, PO2=0.0106MPANu=40, PO2=0.0044MPa
Figure 7. Effect of the oxygen pressure on temperatures for Nu=40. Calculations were made to determine whether the oxidation was either “diffusion-limited” or “kinetics-limited”. For the “diffusion-limited”, mass transfer equation (4) is used to calculate the oxygen mass flux arriving at the interface between the graphite surface and bulk stream. An Arrhenius expression (Eqns. (11), (12) and (13)) was used for “kinetics-limited”. Then the values calculated from “diffusion-limited”

102
and “kinetics-limited” are compared, and the smaller values are taken for the reaction rate (Figure 8).
1000 1200 1400 1600 1800 2000
Temperature (K)
0
1
2
3
Rat
io o
f Diff
usio
n ov
er K
inet
ic R
ate
Nu=90, PO2=0.0106MPa Nu=10, PO2=0.0106MPa
Kinetics-limited
Diffusion-limited
Figure 8. Kinetics-limited vs. diffusion-limited. A case with Nusselt number of 10 and the partial oxygen pressure of 0.0106MPa is "diffusion-limited" while a case with Nusselt number of 90, and the partial oxygen pressure of 0.0106Mpa is "kinetic-limited". The small Nusselt number makes the mass transfer rate obtained in Eqn (3) smaller, which results in “diffusion-limited”. This means that the diffusion controls the oxidation mechanism. If it is “kinetics-limited, “ the temperature profile is affected by the inversed T in the exponent function (Eqns. (11), (12), and (13)), which makes the steady state value as shown in Figure 9.
0 1000 2000 3000
Time (sec)
0
1000
2000
3000
Tem
pera
ture
(K
)
Nu=90, PO2=0.0106MPaNu=10, PO2=0.0106MPa
Kinetics-limited
Diffusion-limited
Figure 9. Temperature profile of Figure 8 depending on the control mechanism. To determine the effect of decay heat for the graphite temperature profile shown in Figure 10, the ratio of oxidation heat over the decay heat was calculated as shown in Figure 10. In Figure 10, the exothermic heat due to the oxidation is much greater than decay heats, provided sufficient oxygen is supplied.
0 1000 2000 3000 4000 5000Time (sec)
0
10
20
30
40
50
Rat
io o
f Oxi
datio
n H
eat /
Dec
ay H
eat
Nu=40, PO2=0.0106MPaNu=10, PO2=0.0106MPa
Kinetics-limited
Diffusion-limited
Figure 10. Ratio of heat due to oxidation to decay heat for Figure 8. CONCLUSIONS Heat transfer, mass transfer, and oxygen pressures are important parameters for this study. The Nusselt number depends on thermal conductivity of the air and air velocity over the graphite. As anticipated, a lower Nusselt number results in higher temperatures in the graphite due to the reduced heat transfer at the surface. The partial pressure of oxygen and the flow rate of air into the core affect the temperature significantly. Once the oxygen mass flow is introduced to the reactor by a hypothetical pipe break accident as determined by RELAP5/ATHENA (ATHENA, 2000) or MELCOR (Summers et al, 1991) calculations, the detailed graphite temperature calculations can be made using the oxidation model developed in this study. Parametric study can be performed using this model. REFERENCES 1. Bunnell, L.R. et al., "Oxidation of TSX Graphite Over the Temperature Range 450 to 1C," UNI-SA-207, PNL-SA-14925, march 1987. 2. Carslaw, H.S. and J.C. Jaeger, Conduction of Heat in Solids, 2nd Ed., Oxford Press, 1959. 3. Gulbransen, E.A. et al., "Ablation of Graphite in Oxygen and Air at 1000-14000C Under Flow Conditions," Carbon, 1., 1964. 4. Helms, R.E., and R.E. MacPherson, "The Reaction of Steam with Large Specimen of Graphite for the Experimental Gas-Cooled Reactor," ORNL-TM-984, March 1965.

103
5. Idaho National Engineering and Environmental Laboratory and Massachusetts Institute of Technology, 1999, Strategic Nuclear Research Collaboration: FY-99 Annual Report, INEEL/EXT-99-00694, July 1999. 6. Mattas, R.F., A letter report (ANL), December 22, 1988. 7. Kunni, D. O. Levenspiel, Fluidized Engineering, John Wiley & Sons, 1962. 8. O’Brien, M.H., B.J. Merrill, and S.N. Ugaki, "Combustion Testing and Thermal Modeling of Proposed CIT graphite Tile Materials," EGG-FSP-8255, September 1988. 9. Ranz, W.E. and W.R. Marshall, Jr., Chem. Eng. Progr., 48, 141, 1952. 10. Reid, R.C. J.M. Praunitz, and B.E. Poling, The Properties of gases & Liquids," 4th Ed., McGraw-Hill, Inc., 1987. 11. Summers et al., MELCOR 1.8.0: A Computer Code for Severe Nuclear Reactor Accident Source Term and Risk Assessment Analyses, NUREG/CR-5532, Sandia
National Laboratory Report, SAND-90-0364, January 1991. 12. Takeda, T. and M. Hishida, “Studies on Diffusion and Natural Convection,” Nucl. Eng. Design, 135, 1992. 13. Takase, K., T. Kunugi, and Y. Seki, "Effect of Breach Area and Length to Exchange Flow Rates Under the LOVA Condition in A Fusion Reactor," FUSION TECHNOLOGY, 30, December 1996. 14. The RELAP-3D Code development Team, ATHENA Code manual, Idaho National Engineering and Environmental Laboratory, INEEL-EXT-98-00834, Revision 1.2a, May 2000. 15. Velasquez, C et al., "The Oxidation of H-451 Graphite by Steam, Part 1: Reaction Kinetics," GA-A14951, UC-77, August 1978. 16. Waermeuebergang im Kugelhaufen, KTA 3102.1 KTA, June 1978.