
WIC Contract Spillover Effects - University of California...
33
WIC Contract Spillover Effects Rui Huang* Jeffrey M. Perloff** June 2012 * Corresponding author: Assistant Professor, Department of Agricultural and Resource Economics, University of Connecticut. Mailing Address: 314 W.B. Y Building U4021, 1376 Storrs Road, University of Storrs, Storrs, CT 06269-4021. Email: [email protected] Tel: (860) 486-1924 Fax: (860) 486-1932 ** Professor, Department of Agricultural and Resource Economics, University of California, Berkeley; member of the Giannini Foundation. This study was produced under cooperative agreement 43-3AEM-5-80035 with the U.S. Department of Agriculture. We are grateful to our colleagues, particularly David Davis at South Dakota University, and Linnea Sallack at the U.S.D.A. ERS, for information and helpful comments on our earlier research proposals. We thank David Betson and Betsy Frazao for very helpful comments.
Transcript of WIC Contract Spillover Effects - University of California...
WIC Contract Spillover Effects
Rui Huang*
Jeffrey M. Perloff**
June 2012
* Corresponding author: Assistant Professor, Department of Agricultural and Resource Economics, University of Connecticut. Mailing Address: 314 W.B. Y Building U4021, 1376 Storrs Road, University of Storrs, Storrs, CT 06269-4021. Email: [email protected] Tel: (860) 486-1924 Fax: (860) 486-1932
** Professor, Department of Agricultural and Resource Economics, University of California, Berkeley; member of the Giannini Foundation.
This study was produced under cooperative agreement 43-3AEM-5-80035 with the U.S. Department of Agriculture. We are grateful to our colleagues, particularly David Davis at South Dakota University, and Linnea Sallack at the U.S.D.A. ERS, for information and helpful comments on our earlier research proposals. We thank David Betson and Betsy Frazao for very helpful comments.

Abstract
Under the U.S. Special Nutrition Program for Women, Infants, and Children (WIC) program, the
three major infant formula manufacturers compete for WIC supply contracts, state by state.
Policy makers have been puzzled by why the contracted WIC price is extremely low compared
to the non-WIC price. Our explanation is that winning the WIC contract is extremely valuable to
a manufacturer because of a spillover effect: The increased retail shelf-space that is dedicated to
the WIC brand and the WIC logo increases non-WIC sales. We identify this effect by showing
the variations in market shares of winning and losing firms that follow WIC contract changes.
Immediately after the contract change, there is an immediate increase in the market share of the
WIC contract winner and an equal drop in the loser’s share because of new WIC purchases. Then,
over an extended period, the spillover effect increases the winner’s share and decreases the
loser’s share as retailers shift shelf space from the loser to the winner.
Key words: infant formula, spillover, WIC program

1. Introduction
The U.S. Special Nutrition Program for Women, Infants, and Children (WIC) provides free
infant formula to many poor families. To limit their cost, WIC state agencies hold periodic
auctions where three major manufacturers of infant formula bid to become the sole provider
within a state. A vigorous academic and public policy debate has centered on why the
manufacturers are willing to sell formula to WIC agencies for a small fraction of the usual retail
price. Our explanation is that the winning firm benefits from spillover effects, which greatly
increases its share of the non-WIC market.1
We illustrate the spillover using a natural experiment. When a state’s WIC contract changes
hands, retailers provide additional shelf space to the new WIC brand and post a logo indicating it
is the WIC brand, while removing the logo and a comparable amount of shelf space from the
previous WIC contract brand. Using store-level scanner data on infant formula sales, we show
that WIC consumers respond immediately and non-WIC consumers respond with a lag to these
changes. We find that spillover effects are very large: The contract winner’s brand gains almost a
third of the entire market one year after a contract change.
1 A competing theory is that the WIC and its rebate program separates consumers in two markets so that they can now price discriminate. For example, Hal Varian, www.wwnorton.com/mip/ime/varian/24a.htm, discussed a price-discrimination model where the removal of the low-income consumers from the out-of-the-pocket-market results in a higher non-WIC price. Similarly, Post and Wubbenhorst (1989) argued that WIC vouchers make WIC consumers price insensitive so that the overall demand is much less price sensitive; hence profit-maximizing retailers raise their prices. Oliveira et al. (2004, pp. 2-3) reported this conclusion. However, this explanation of price discrimination across states is implausible because each manufacturer sets a single national wholesale price once a year and does not change it at the time that new state contracts are signed.

2
The next section describes the WIC program. The following one discusses the spillover effect.
The next section examines a variety of ways of measuring spillover effects using scanner data.
The final section summarizes the paper and draws conclusions.
The WIC Program
Infant formula accounted for about $3.5 billion in sales in 2007 in the U.S., and it is
estimated that between 57% and 68% of it was purchased through U.S. Special Nutrition
Program for Women, Infants, and Children (WIC), which provides formula and other food to
low-income infants, children, and mothers who are at nutritional risk (Oliveira et al, 2010). It is
the third largest nutrition assistance program (at $6.6 billion in 2012), after the Food Stamp
Program and the National School Lunch Program.
Since 1998, Federal law has required that WIC state agencies use cost-containment practices.
To limit costs, a WIC agency in a state (or a group of a small number of states) holds an auction,
typically every three years, in which the three major infant formula manufacturers bid to be the
sole supplier.2 The manufacturers bid by offering a rebate—a percentage discount off their
national wholesale price—for WIC purchases. The WIC contract is awarded to the manufacturer
that bids the lowest net price, which is the wholesale price less the rebate.
Most WIC participants use a WIC voucher (or an electronic equivalent) provided by the state
WIC agency to purchase the contract brand’s infant formula from an authorized retailer, typically
a grocery store. WIC then reimburses the retailer for the full retail price, and the contracted
manufacturer issues a rebate to the WIC agency. The retailer receives the same retail price for
2 In 2000, the three major manufacturers produced 99% of all infant formula: Mead Johnson had 52% of the market, Ross had 35%, and Carnation had 12% (Oliveira and Prell 2004).

3
both WIC and non-WIC consumers. Thus the cost to the WIC agency is the retail price minus the
rebate. Retailers pay the WIC-contract manufacturer the wholesale price for the infant formula it
sells to both WIC and non-WIC consumers. Consequently, the WIC manufacturer collects the
wholesale price for formula sold to non-WIC consumers but the wholesale price net of the rebate
for formula sold to the WIC program.
The WIC rebate has been relatively large in some recent years, once reaching a 98% discount
off the wholesale price. Oliveira et al. (2010) examined all of the contracts that were in effect as
of December 2008 and contracts preceding them in the United States. They found that the
average percentage discount in the previous contracts was 91%, while it fell to 85% in the
December 2008 contracts.
Immediately after the WIC sole-source rebate program was instituted in 1989, the wholesale
prices paid by non-WIC purchasers rose faster than the historical rate while the net prices paid by
WIC agencies decreased (General Accounting Office [GAO], 1998). The wholesale prices for
non-WIC purchasers increased by 9% at an annual rate in 1989–1990 after adjusting for inflation,
compared with increases of about 3% before and after this period (GAO 1998). This trend raised
political concerns as to whether the WIC program was being subsidized by the non-WIC
consumers. Congress ordered the GAO to investigate whether there was any causal relationship
between the rebate program and prices paid by non-WIC consumers (GAO, 1990, 1998, 2006b);
however, the program has continued.
Spillover Effect
The spillover effect may work through three mechanisms. First, the WIC contract brand
gains greater shelf space in retail stores. A WIC-authorized retailer is likely to allocate relatively
more shelf space to the WIC brand because WIC purchases represent guaranteed sales and the

4
same retail markups as non-WIC sales. Second, non-WIC consumers may view “WIC-approved”
logos on shelf labels as the government’s tacit endorsement of a particular brand. Third,
pediatricians apparently are more likely to recommend the WIC brand to non-WIC consumers
(GAO, 1998, Oliveira et al, 2010, 2011).
There is some anecdotal evidence suggesting substantial spillover effects due to shelf space
allocation with respect to another aspect of the WIC program: infant cereal. A June 19, 2003,
press release of Senator Schumer of New York (where Beech-Nut is located) stated:
According to Beech-Nut, about 50% of WIC consumers who purchase infant cereal under the program will continue to stay loyal to that brand once the child switches to jarred food. By contrast if they do not win the cereal contract, they would expect to capture only 10% of the business after the child is eating jarred food. Beech-Nut claims that Gerber has gone to extreme efforts to prevent Beech-Nut from winning WIC bids, saying it uses its 77% market share advantage to offer infant cereal under the WIC program at a fraction of its costs, thereby securing exclusive, sole-source WIC cereal contracts. By preventing Beech-Nut from becoming the WIC supplier through below-cost bids, Gerber ensures that far fewer retailers will carry Beech-Nut infant cereal – for both WIC sales and non-WIC sales.”
GAO (2006a) made the same point. The GAO interviewed officials from the leading formula
companies, who reported that the firm that wins the WIC contract is able to acquire greater shelf
space and better market its product to non-WIC customers. The GAO also found that the
companies target non-WIC mothers via media advertising and free samples that are distributed
indirectly by doctors and hospitals or directly to consumers. Some of these marketing tactics use
the trademarked WIC acronym or logo in their promotional materials. That is, the firms believe
that non-WIC consumers are positively influenced by knowing that a brand has won the WIC
contract.

5
The GAO (1998) discounted the spillover effects based on industry experts’ opinion, but
GAO (2006b) stated that directors of WIC state agencies generally believe that shelf space is an
important determinant in rebate bids. Prell (2005) incorporated a spillover effect and considered
the demand for a WIC brand and non-WIC brand that are carried by a representative retailer. He
provided some simulation results but does not estimate the spillover effect.
Davis (2012) developed a theoretical model where a manufacturer faces WIC and non-WIC
demand and decides first on wholesale prices and then on rebate bids. He obtained an equation
where the WIC bids are a function of the size of the WIC market, the spillover effect (which he
bases on our work), and marginal cost. He showed that the optimal net price, which is the
difference between the wholesale price and the rebate, is lower if there are spillover effects.
Using a different data set than we do (WIC bids, wholesale prices, and WIC program
characteristics), he estimated the equation and obtained statistically significant spillover effects
in the range of 30−60% for different brands. His main point is that the WIC program does not
affect the wholesale price or the price markup on non-WIC purchases.
There is a substantial body of literature on the effect of shelf space allocation on sales. Some
of the most compelling results on shelf space is experimental (e.g., Kotzan and Evanson, 1969;
Cox, 1970). Another largely theoretical literature provides some stylized empirical support (e.g.,
Amrouche and Zaccour, 2007; Murray, Talukdar, and Gosavi, 2010; and Kurtulu and Toktay,
2011). Again, we contribute to this literature by providing empirical evidence that illustrates the
effect of shelf space allocation on market shares by exploiting a natural experiment.
Empirical Evidence
The ideal data for this research would be household level purchase data that distinguish WIC
and non-WIC consumers. Unfortunately, such data are not available. Instead, we use Information

6
Resources Incorporated (IRI) grocery-store level scanner data. The IRI InfoScan weekly scanner
data set for 1997-1999 contains grocery store-level infant formula weekly prices, quantities, and
other information by product item (Universal Product Code or UPC). We aggregate each store’s
powder formula products to two-week (biweek) intervals, which smoothes random sales
fluctuations and eliminates having observation periods in which a few stores have zero sales.
The biggest challenge in identifying the spillover effect arises because the data do not
distinguish WIC sales from non-WIC sales. Our identification strategy exploits changes in WIC
contracts during the sample period and its differential effects on WIC and non-WIC consumers.
There is usually strong brand loyalty among parents for infant formula although the various
brands have the same basic components. Many doctors and websites for new parents recommend
sticking to one brand while the baby is consuming formula.3 Consequently, many parents choose
a brand and then stick to it. Such customers would need a strong incentive to induce them to
switch brands.
The WIC contract effective dates are binding. The WIC vouchers are issued on a monthly
basis, and they explicitly specify the foods that may be purchased under the WIC program. If the
WIC contract brand changes, a WIC participate cannot use a voucher for the new WIC brand
before the contract’s effective date. The retailer will not be reimbursed for sales of non-WIC
brands. Thus, the retailer has an incentive to immediately move the WIC logo to the new WIC
brand and to train its cashiers to make sure that the WIC participants purchase only the new WIC
brand.
3 See, for example, bottle-feeding-baby.com/what-baby-formula-milk-to-use.php and Rhode Island University’s Cooperative Extension’s nutritional education program site: www.uri.edu/ce/efnep/Infant percent20Feeding percent20p.10 percent20Choosing percent20A percent20Formula.htm.

7
Similarly, a change in the WIC contract brand provides a strong financial incentive for
mothers in the WIC program to switch to the new WIC brand. If a WIC participant chooses to
stick with the previous WIC brand, she has to pay the full retail price for it, whereas she can
obtain the new WIC brand’s formula for free. Because infant formula is relatively expensive and
WIC participants are poor, we expect virtually all WIC mothers to switch from the previous WIC
brand to the new brand. Thus, we expect to observe that the original WIC brand loses market
share while the new WIC brand benefits from a symmetric gain in market share within at most a
few weeks after the contract change, depending on the WIC households’ demand and inventory
levels.
The contract change does not provide a financial incentive for non-WIC consumers to switch
brands. However, a spillover effect may cause the non-WIC consumers gradually to switch
brands.
To handle the demands of WIC mothers, grocery stores allocate significantly more space to
the WIC contract winner. In addition, that brand now has the WIC logo. This change may not
influence the parents of older babies that have been using another brand due to their aversion to
switching. Gradually over time, parents of these older babies stop buying formula, and new
parents enter the market and are influenced by the WIC logo and larger shelf space of the WIC
brand. These new parents are more likely to choose the WIC brand over other brands. If most
parents keep their children on formula for the medically recommended period of time, it may
take 9 to 12 months for the full spillover effect to be revealed. Thus, in the presence of the
spillover effect, the market share of the previous WIC brand would decline gradually while that
of the current WIC brand would increase slowly over several months after the contract change.

8
Therefore, our identification of the spillover effect relies on distinguishing between the initial
change in market share due to the immediate response by WIC mothers and the gradual shift in
market share by non-WIC households. This strategy circumvents the data limitation that we
cannot distinguish WIC purchases from non-WIC purchases. The identification strategy requires
that the WIC contract changes are exogenous to the retail stores and non-WIC consumers. These
changes are reasonably exogenous to retail stores and non-WIC consumers given that the WIC
agencies use sealed-bid auctions to determine the contract winner.
Sample
The WIC program covers powder and liquid concentrate infant formula formats and, in a few
states, the more expensive ready-to-use format. We focus on powdered infant formula, the least
expensive form, which accounted for substantially more infant formula sales measured in
reconstituted ounces during the 1997-1999 period than did the other physical forms (Oliveira et
al., 2004, Figure 6.3). When we conducted the same analysis for concentrate, we observed
qualitatively similar results and larger spillover effects.4
Our IRI sample has retail stores in 24 cities from 16 states for 1997-1999. Eight of these
states experienced a contract change where one firm replaced another firm as the WIC supplier.
Again, we aggregate the weekly data to biweek periods. Because our identification method relies
4 Most states issue ready-to-use (RTU) infant formula only to WIC participants with specific conditions, such as the unavailability of sanitary water supply, the inability of the caretakers to dilute formula, or the unavailability of comparable substitute in other formats, so relatively few people are affected. We do not know which firm provides RTU infant formula through WIC in most states. Even if we had this information, we could not conduct an analysis similar to that for powder because most stores did not carry at least one of the major brands for extended periods.

9
on contract changes, our primary analysis concerns states in which a contract change occurs
during our sample period.
This sample contains eight states covered by the IRI data in which the WIC contract shifted
from one firm to another during the sample period.5 These states are located in the south, mid-
west, and northeast. Within those states, we have data for 11 cities of various sizes.6 The sample
contains a total of 56 stores for which we could match zip code-level demographic information
from the U.S. Census Bureau (2000) Summary Files 1 and 3.
For each of the 56 stores, we calculate the quantity shares of the WIC contract winner, the
loser (the firm that held the WIC the contract before losing it to the winner), and all other firms.
Missouri is the only state that experienced more than one contract changeover during our sample
period.7 For Missouri, we re-label the winner and loser after each contract change. The residual
share of the other brands consists almost entirely of the share of the third national brand, but
includes sales of private labels and minor national brands. These three shares sum to one by
5 The states are Georgia, Missouri, Pennsylvania, Texas, Tennessee, Minnesota, Iowa, and Florida. In Georgia, Ross replaced Mead as the WIC supplier effective from August 1, 1998. Ross also replaced Mead in Pennsylvania two months later. Mead took over the contract with the alliance of Texas, Minnesota, and Iowa from Ross on October 1, 1998. In Tennessee, Ross replaced Mead as the WIC supplier effective on July 1, 1999. In Florida, Carnation became the winner in February 1, 1999, replacing Mead. Two contract changes took place in Missouri: The WIC supplier changed from Mead to Carnation and to back to Mead. The first change occurred on October 1, 1997, and the second on October 1, 1998. 6 Atlanta; Cedar Rapids, Iowa; Houston; Kansas City, Missouri; Midland, Texas; Minneapolis/St. Paul; Philadelphia; Pittsburg; Rome, Georgia; St. Louis; Tampa/St. Petersburg. 7 Missouri went through two contract changes during the sample period. The first change became effective on Oct. 1, 1997, when Carnation replaced Mead. This contract was one-year long with two one-year renewal options, according to our conversation with Annie Siu-Norman, a veteran consultant at the WIC agency in Missouri. The WIC agency at Missouri chose not to renew the contract after one year and opened bids again in July 1998. Mead won the contract back from Carnation, and this change was effective on Oct. 1, 1998.
10
definition. In our sample, 60% of the observations are from 40 stores in states where Mead is the
winner; 25% are from 13 stores where Ross is the winner; and the rest are from 15 stores where
Carnation is the winner.
Plots
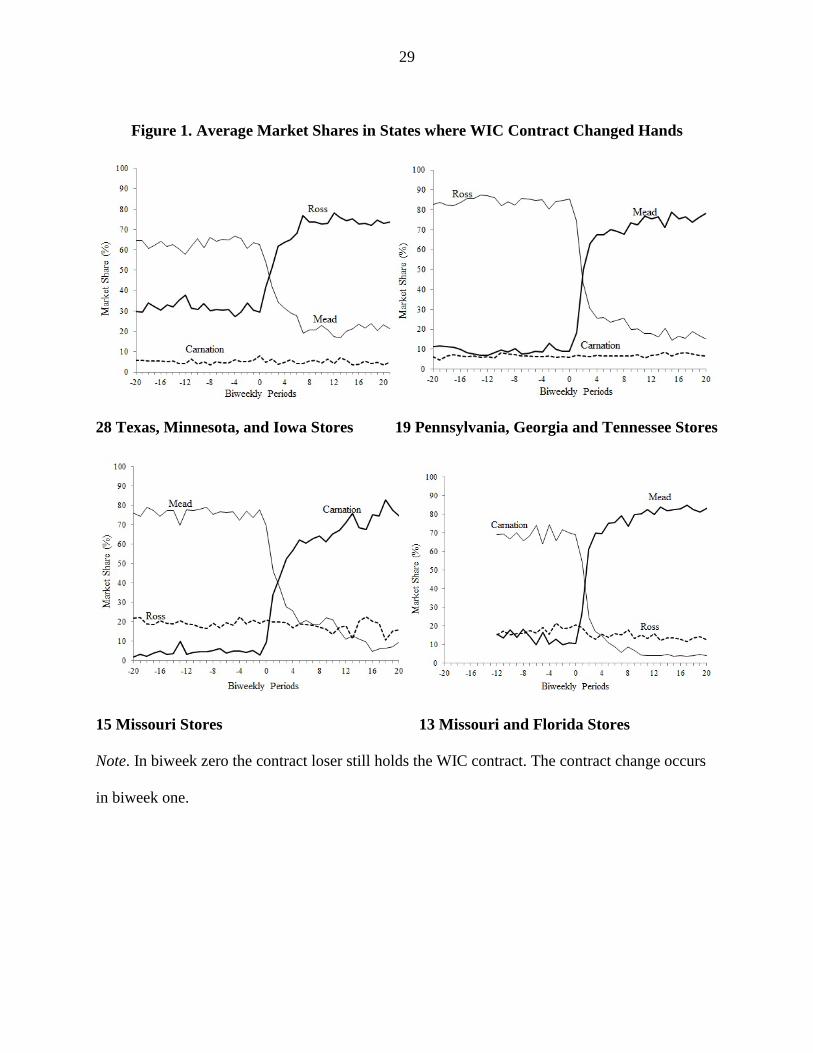
Figure 1 shows the average quantity shares of powdered infant formula, WIC and non-WIC
purchases combined, across stores for 20 biweeks before and 20 biweeks after the WIC contract
changed for the winning firm, the losing firm, and the remaining firms (primarily the third
national manufacturer). We group the stores into four groups, based on the identities of the
winners and losers.
The top left panel covers thirteen stores in Pennsylvania and Georgia where the WIC contract
changed from Mead to Ross. The top right panel summarizes results for 28 stores in Texas,
Minnesota and Iowa where the WIC contract went from Ross to Mead. The bottom left panel
summarizes results for 15 Missouri stores when the WIC contract changed from Mead to Nestle.
The bottom right panel shows average shares in 11 Missouri stores and 2 Florida stores where
the WIC contract shifted from Nestle to Mead.
In all of the plots, the shares of all three brands were stable before the contract change, with
the contract brand enjoying the largest market share. In the first few weeks after the contract
change, we see a sharp reverse in the shares of the contract winner and the loser, which is
consistent with an immediate switch in brands by all WIC participants.
We describe these effects for the top left panel, where the contract changed from Mead to
Ross, but the results are qualitatively the same in the other three panels. Immediately after the
firm holding the WIC contract changes, the share of the new WIC contract winner increases
substantially, while the loser’s share falls comparably. The winner’s (Ross’) share increased by

11
about 22 percentage points from 23% one biweek before the change to 45% one biweek after the
change, while the loser’s (Mead’s) share fell by 16 percentage points from 53% to 37%. The
changes in the contract winner and the loser are comparable, consistent with a constant WIC
market size during the window of contract change.
Over the following weeks, the shares of the WIC contract winner continued to increase
gradually, while the shares of the losers decayed by comparable amounts. For the period starting
from two biweeks after the change (that is, after the initial spike) to 20 periods after the change,
Ross’s share rose by 13 percentage points from 45% to 58%, while Mead’s share fell by 10
percentage points from 37% to about 27%. This adjustment period takes months and is consistent
with a spillover effect in the non-WIC market. The share of the other brands remains relatively
stable before and after the change, which is also consistent with the existence of spillover effects.
For these 56 stores, the average increase in the contract winner’s share in the first biweek
after the change is 34 percentage points. Similarly, the average increase from the first biweek to
the twelfth biweek (half a year) after the contract change is 23 percentage points. The
corresponding average decrease in the contract loser’s share is 32 percentage points and 21
percentage points respectively. Thus, the large adjustments we see in market share over the first
half-year following a contract change are consistent with a spillover from the WIC market to the
non-WIC market. It appears that changes in market share that are attributable to a spillover effect,
though slower, are about two-thirds of the changes in market share that are attributable to
winning or losing a WIC contract, without controlling for other covariates.
In contrast, these market shares remained stable in states where no contract change occurred.
In Figure 2, stores in the top and the bottom panels were located in states where Mead or Ross
always held the WIC contracts, respectively. In both panels the shares for all three brands are

12
virtually constant, which suggests that there were no systematic unobserved shocks to the
demand of any of the brands formula during the sample period.
Multinomial Logit Analysis
Though the plots provide strong support for our shelf-space hypothesis, a better test is to
examine the effect of a contract change on firms’ market shares while controlling for other
variables that may also affect these shares. Because the firms’ shares are constrained to lie
between zero and one and to add to one, we use multinomial logit. The dependent variables are
the store-level quantity-based market shares of the WIC contract winner, the WIC contract loser,
and the other brands (primarily the third major manufacturer) at each store at biweekly intervals.
The base share is that for the other-brands group.
The multinomial logit analysis uses data for just those states that had a WIC contract change
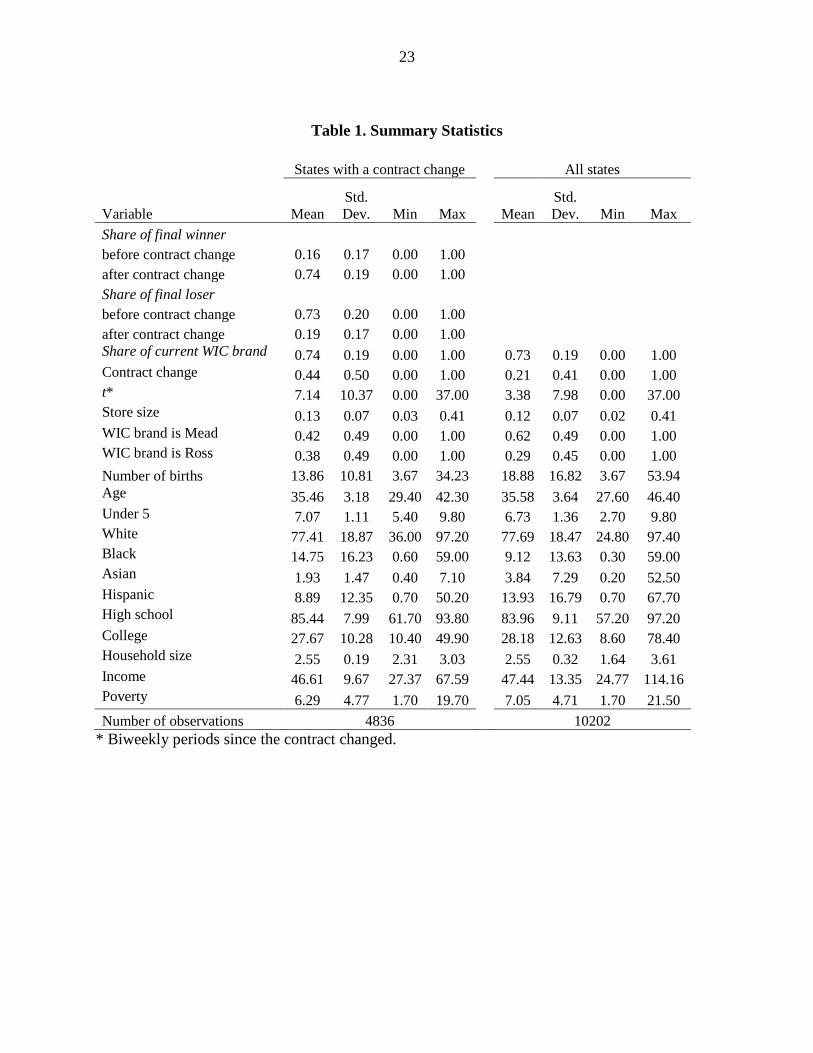
during the sample period. Table 1 reports summary statistics for that subset of the data (the first
four columns) and for the entire sample (the last four columns). For the relevant sample, the
average shares of the final WIC contract winner (the one at the end of the sample period) and the
final loser reversed before and after a contract change: the share of the winner increased from
0.16 to 0.74, whereas the loser’s share decreased from 0.73 to 0.19, after the winner replaced the
loser as the WIC contract brand.
To capture this change of brands by WIC customers immediately following the contract
changes, the multinomial logit equation includes a WIC contract change dummy variable. The
change in market shares that occurs immediately after the contract change takes place in the
initial time interval after the contract change and is captured by the contract change dummy
variable. This dummy variable equals zero before the contract changes and one thereafter.
Contract changes typically occurred in the middle of our sample period. The mean of the contract

13
dummy variable is 0.44 (Table 1), so slightly fewer than half of the observations follow a
contract change.
To capture possible spillover effects that lead to the gradual adjustment in market shares of
the contract winners and losers after contract changes, we use three time trend measures that are
functions of the number of biweeks since the contract change. The first variable is a time trend t
= 1, 2, 3,…, where t is the number of biweeks following the contract change. The average
number of biweekly periods, t, after the contract change is 7.1, with a standard deviation of 10.4
(Table 1). The maximum value for t is 37 biweeks or almost one year and a half after the contract
change.
The second variable is a log-linear time trend, ln (t +1), where we add one to avoid taking the
logarithm of zero before the change. Third, primarily as a robustness check, we use discrete time
dummy variables for various periods after the contract change.
To allow for varying degrees of brand loyalty, we include brand dummy variables that
indicate whether Ross or Mead held the WIC contract at the time and in that state (Carnation and
the smaller brands constitute the residual category). All of our regressions include zip-code-level,
state-level, and store-level control variables. The zip-code-level demographic variables for each
store include median age of the population (35.5 on average, Table 1); the share of the
population that is younger than five years old (7.1%); the fractions of the population that are
white (77.4%), black (14.7%), Asian (1.9%), and Hispanic (8.9%); the fractions of the
population that are 25 years old and older who have a high school degree (85.4%) or who have a
bachelor degree (27.7%); the median household size (2.5%); the median household annual
income in 1999 (46.6%); and the fraction of families with incomes below the poverty level
(6.3%).

14
We hypothesized that better educated households and households with larger families (and
hence prior experience with formula) are less sensitive to spillover effects. We do not have
hypotheses about the direction of the effects of the other demographic variables.
The regressions control for the state birth growth rate (the ratio of total number of live births
in the state in each year to that in the previous year), which captures state-specific trends that
could affect the demand for infant formula. We also include a proxy for store size: the average
weekly quantity in 10,000 gallons of all beverages sold in the store during 1996–1998. In the
sample, the store size ranges from 0.31 (3,100 gallons) to 4.07, with an average of 1.28. Given
that the spillover effect works through shelf space allocation, this proxy may capture how the
cost of additional shelf space varies with store size.
We expected the spillover effect to be stronger in small stores than in large ones. Thus, we
also include an interaction between the time-trend terms (in the first two specifications) and the
store size measure.8
We do not include prices as explanatory variables for three reasons: First, the store-level
brand shares reflect both WIC and non-WIC sales in unknown proportions. WIC participants do
not pay for the infant formula, and hence should not be sensitive to the listed retail price. Thus,
the relationship between price and share is not clear. Second, the retail prices are potentially
endogenous (though they hardly change when the contract changes in the data). Third, because
the prices are virtually constant over our time period, they would provide little explanatory
power.
8 The signs of the coefficients on the various time trend and contract variables remain the same if we drop this interaction term.

15
Table 2 shows three multinomial logit specifications. The first two columns show the winner
and loser equations for the linear time trend model. The next two columns are for the log time
trend model. The final two columns are for the time dummy variable model.9
Before discussing the WIC and store-size effects, we briefly consider the effects of the
demographic and brand loyalty variables. Across the models, the poverty measure has a
statistically significant (at the 0.05 level) effect on market shares: Both the winner’s and loser’s
shares are greater, relative to the residual category, the larger is the share of poor people in the
area. The winner’s share is larger, the greater is the proportion of college graduates in the area.
The loser’s share is larger if the WIC brand is Ross, possibly indicating brand loyalty to Mead
(or another non-Ross brand). The loser’s share is greater in both of the time trend models, the
larger is the share of high school graduates. The other demographic dummy variables do not
have a statistically significant effect on market shares.
In all of the models, the contract-change variable has the expected effects. A statistically
significant positive coefficient in the winner’s equation shows that a once-and-for-all increase in
the winner’s share occurs immediately after the contract changes. This result is consistent with
the observed jump in the contract winner’s market share that followed the contract change in
Figure 1. Similarly, the coefficient is negative in the loser’s share equation, although it is not
statistically significant in the log-linear specification.
Both the linear and log-linear time trends have the expected effect: The statistically
significant positive coefficients in the winner’s equations and negative coefficients in the losers’
equations show that the winner’s share grows and the loser’s share falls over time. All the time
9 We also experimented with other time interval dummies, such as 7 ≤ t ≤ 12, 13 ≤ t ≤ 18, 19 ≤ t ≤ 24, t > 24, and found qualitatively similar results.

16
dummy variables have the expected sign. Some of the smaller, early ones are not statistically
significant, but all of the later, larger ones are statistically significant. That the coefficients on
these dummy variables increase in absolute size over time shows the gradual spillover effect over
time.
The store size proxy (beverage sales) has the expected effect that the shares of both the
winner and loser are smaller for the larger stores, presumably because larger stores carry more
small brands. The interaction term between the store size and the time trends also have the
expected signs: positive for the loser and negative for the winner (though the latter coefficients
are not statistically significant). That is, the larger is the store, the less important is the spillover
effect, at least for the loser.10
To illustrate the effects of a contract change and the spillover effects in the multinomial logit
model, we plotted the predicted quantity shares of the contract winner, loser, and the other brand
based on estimates from all of the specifications holding the various other control variables
constant at their means. Because all these plots look similar, Figure 3 shows only those based on
the log-linear time trend model. It shows how the predicted firms’ market shares vary over the 37
biweeks after the contract change, which is the maximum observed period after a contract
change. These shares are calculated at the means of the demographic and other variables, so that
the only variable that changes is the time since the new contract took effect. The four panels in
Figure 3, one for each observed pairs of winners and losers, correspond to those in Figure 1.
All four panels show a large increase in the share of the winner and a corresponding drop in
the share of the loser in the period immediately after the contract changes hands, after controlling
10 To reduce the size of the table, we do not show the size interaction with the time dummy variables. However, those results are similar to the time trend models.

17
for other factors. The magnitudes are comparable to those of the corresponding unconditional
share plots in Figure 1. The winner’s share grows gradually but substantially over time, and the
loser’s share falls by roughly the same degree. The share of the other brands—primarily
Carnation—is essentially unaffected by the WIC brand contract change.
To investigate the effects of store size on the size of spillover effect, we repeat the simulation
for the sample’s largest store and for the sample’s smallest store. The plots are qualitatively
similar across store sizes, but the spillover effect is smaller, the larger is the store. The average
spillover effect from the 3rd biweek to the 37th biweek is only a quarter of the size in the largest
store (7 percentage points) as compared to the smallest store (27 percentage points). This result is
consistent with what we expect, given that the marginal cost of shelf-space is higher in small
stores than in large ones, hence the WIC brand’s shelf-space advantage is greater in small stores.
Robustness
In our multinomial logit analysis of winners’ and losers’ shares we had to drop those states
where the WIC contract did not change hands. We investigate whether sample bias might arise
from dropping these states by conducting a logit analysis that is analogous to the multinomial
logit analysis. We regress quantity shares of a firm during a biweek on the same contract change
dummy variable as before and either a linear or log-linear time trend variable that measures time
elapsed since the contract change. Because we are using all of the states, we can identify the
WIC winner but not the WIC loser. Thus, the dependent variable is the winner’s share.
We report the summary statistics for the entire sample in the last four columns of Table 1.
The sample size of this analysis is more than double that used in the multinomial logit analysis,
which includes only states that had a contract change during our three-year window. The share of
current WIC brand is virtually identical across the two samples. The WIC brand is more likely to

18
be Mead in this sample. Most of the store characteristics are comparable between the two
samples, except that, on average, stores in the full sample are located in zip codes that have
fewer black residents and more Asian and Hispanic than in the states with a contract change.
Table 3 shows the logit results for our three models. Exploiting the relative changes in the
shares of contract holders before and after the contract changes, and in states with and without
contract changes, this regression uses a difference-in-differences approach. The treatment is the
WIC contract change, which is reasonably exogenous to the retailers and consumers.
In the multinomial logit analysis, we defined a contract change variable and variables
capturing time trends following the contract changes in the states where the change occurred. In
states without any contract changes, these variables are always zeros.
Both the contract change and time trend variables are used to capture the treatment effects:
the former captures the average change in the winner’s share between the period prior to the
contract change and the period following the contract change, the latter captures the gradual
average variation in the winner’s share attributable to the contract change after the contract
change occurred. We further allow for heterogeneity in the gradual effect on winner’s shares
over time with interactions between the time trend and store size variable.
The contract change statistically significantly increases the winner’s quantity share as in our
earlier analysis in all but the specification with the log linear time trend. Over time, the winner’s
share rises even more. The results are robust across all specifications and consistent with our
multinomial logit analysis. The main difference between the multinomial logit analysis on the
restricted sample and this logit analysis on the entire sample is that the demographic variables
are more likely to have a statistically significant effect on market share in this analysis. That may

19
be the result of increasing the variation in demographics as the larger (by population) and more
diverse states were less likely than others to have a contract change during this period.
Mechanisms
The spillover effect might arise through multiple channels, such as increased shelf space
allocation to the WIC brand, the marketing effect of the WIC logo, and (possibly) physician or
hospital recommendations to use the WIC brand. Though we do not have data on shelf space
allocation or free samples or physician recommendation, we find indirect empirical evidence that
is consistent with the shelf space allocation hypothesis with our data.
Presumably becoming the WIC brand increases that brand’s relative shelf space even more in
small stores. In the extreme case, a small store might not carry all three national brands but
definitely carries the WIC brand. We can infer which brands a store drops by observing a lack of
sales of those brands over a sufficiently long period in our data. We estimate a logit model where
the dependent variable equals one if the store had no sales of one of the three national brands for
at least three months in a row and zero otherwise. We have one observation for each of the 131
stores across all states. Only 13 stores had such a sales gap.
The explanatory variables in our logit include our average weekly sales of beverages (our
proxy for the size of the grocery store) and the various zip code area demographics that are used
in our other analyses. As Table 4 shows, the only variable for which we can reject the null
hypothesis that its coefficient is zero at the 0.05 level is the store size. An increase of 10,000
gallons in average weekly beverage sales in a store decreases the probability by 5.3% of a sales
gap lasting at least three months. Thus, apparently only store size determines whether a store
fails to carry a particular brand.

20
We scrutinized the sales gaps and found that small stores tend to have sales gaps, and
virtually all of the sales gaps are for non-WIC brands. There are two stores that did not carry one
brand for more than 20 biweeks and only started selling it a few biweeks after it became the WIC
brand in the state. These findings support the hypothesis that WIC brands receive preferential
shelf space allocation, especially in small stores.
Conclusions
We examined the effects of the states’ sole-source WIC infant formula rebate program on
infant formula brand prices and quantity shares. We hypothesized that the firms bid aggressively
for WIC contracts because the winner benefits from a spillover effect in the non-WIC retail
market. Grocery stores provide relatively large amounts of shelf space to the WIC contract
winner. Non-WIC customers infer that the WIC brand is superior and are more likely to buy it,
though this adjustment takes time as new families enter the market.
The pattern of market share adjustments over time, shown by both simple plots and a formal
statistical analysis, is consistent with the spillover effects. Immediately after a firm wins the WIC
contract, its share may jump by a quarter of the total market. Then, a gradual adjustment period
occurs that may last the better part of a year, where non-WIC customers switch to the WIC brand.
This trend takes time because current customers stick to their traditional brand, but new
customers are more likely to buy the WIC contract winner brand, which now has more shelf
space in stores. Over this period, the WIC contract winner’s share continues to grow—often by
much more than the initial jump. Because a typical WIC contract lasts three years, a contract
winner could enjoy over two years of a dominant share among the non-WIC consumers.
Consequently, the spillover effects can explain the stylized fact that firms are willing to place
very low bids to win the WIC contract.
21
References
Amrouche, N., and G. Zaccour. (2007). Shelf-space allocation of national and private brands.
European Journal of Operational Research, 180(2), 648–663
Cox, K. K. (1970). The Effects of shelf space upon sales of branded products. Journal of
Marketing Research, 7(1), 55–58.
Davis, D.E. (2012). Bidding for WIC infant formula contracts: Do non-WIC customers subsidize
WIC customers? American Journal of Agricultural Economics, 94(1), 80–96.
Kotzan, J.A., and Robert, V.E. (1969). Responsiveness of drug store sales to shelf space
allocations. Journal of Marketing Research, 6(4), 465–469.
Kurtulu, M., and L. B. Toktay. (2011). Category captainship vs. retailer category management
under limited retail shelf space. Production and Operations Management, 20(1), 47–56.
Oliveira, V., Frazao, E., and Smallwood, D. (2010). Rising infant formula costs to the wic
program recent trends in rebates and wholesale prices, ERS Research Report #93,
Washington DC: U.S. Department of Agriculture.
Murray, C. C., D. Talukdar, and A. Gosavi. (2010). Joint Optimization of Product Price, Display
Orientation and Shelf-Space Allocation in Retail Category Management. Journal of
Retailing, 86 (2), 125–136.
Oliveira, V., Prell, M., Smallwood, D., and Frazao, E. (2004). WIC and the retail price of infant
formula, ERS Research Report #39-1, Washington DC: U.S. Department of Agriculture.
Oliveira, V., and Prell, M. (2004). Sharing the economic burden: Who pays for WIC’s infant
formula? Amber Waves, 2(4), 30–36.
Post, J. E., and Wubbenhorst III, W. H. (1989). Assessing the infant formula rebate initiative,
Boston University School of Management working paper.

22
Prell, M. 2005. An economic model of WIC, the infant formula rebate program, and the retail
price of infant formula, Food Assistance and Nutrition Research Report No. FANRR39-2,
Washington, D.C.: U.S. Department of Agriculture.
U.S. General Accounting Office. (1990). Infant formula: Cost containment and competition in
the WIC program, GAO/HRD-90-122.
U.S. General Accounting Office. (1998). Food assistance: Information on WIC sole-source
rebates and infant formula prices, Report to the chairman, Committee on the Budget,
House of Representatives, GAO/RCED-98-146.
U.S. Government Accounting Office. (2006a). Breastfeeding: Some strategies used to market
infant formula may discourage breastfeeding: state contracts should better protect against
misuse of WIC name, GAO-06-282.
U.S. Government Accountability Office. (2006b). Food assistance: FNS could take additional
steps to contain WIC infant formula costs, GAO-06-380.
23
Table 1. Summary Statistics
States with a contract change All states
Variable Mean Std. Dev. Min Max Mean
Std. Dev. Min Max
Share of final winner before contract change 0.16 0.17 0.00 1.00 after contract change 0.74 0.19 0.00 1.00 Share of final loser before contract change 0.73 0.20 0.00 1.00 after contract change 0.19 0.17 0.00 1.00 Share of current WIC brand 0.74 0.19 0.00 1.00 0.73 0.19 0.00 1.00 Contract change 0.44 0.50 0.00 1.00 0.21 0.41 0.00 1.00 t* 7.14 10.37 0.00 37.00 3.38 7.98 0.00 37.00 Store size 0.13 0.07 0.03 0.41 0.12 0.07 0.02 0.41 WIC brand is Mead 0.42 0.49 0.00 1.00 0.62 0.49 0.00 1.00 WIC brand is Ross 0.38 0.49 0.00 1.00 0.29 0.45 0.00 1.00 Number of births 13.86 10.81 3.67 34.23 18.88 16.82 3.67 53.94 Age 35.46 3.18 29.40 42.30 35.58 3.64 27.60 46.40 Under 5 7.07 1.11 5.40 9.80 6.73 1.36 2.70 9.80 White 77.41 18.87 36.00 97.20 77.69 18.47 24.80 97.40 Black 14.75 16.23 0.60 59.00 9.12 13.63 0.30 59.00 Asian 1.93 1.47 0.40 7.10 3.84 7.29 0.20 52.50 Hispanic 8.89 12.35 0.70 50.20 13.93 16.79 0.70 67.70 High school 85.44 7.99 61.70 93.80 83.96 9.11 57.20 97.20 College 27.67 10.28 10.40 49.90 28.18 12.63 8.60 78.40 Household size 2.55 0.19 2.31 3.03 2.55 0.32 1.64 3.61 Income 46.61 9.67 27.37 67.59 47.44 13.35 24.77 114.16 Poverty 6.29 4.77 1.70 19.70 7.05 4.71 1.70 21.50 Number of observations 4836 10202
* Biweekly periods since the contract changed.

24
Table 2. Multinomial Logit for States with a Contract Change
Linear Time Trend Log-Linear Time Trend Time Dummies Winner Loser Winner Loser Winner Loser Contract change 1.300* -0.783* 0.825* -0.194 1.078* -0.487*
(0.175) (0.183) (0.290) (0.305) (0.250) (0.249) t 0.028* -0.049*
(0.013) (0.014) log (t+1) 0.415* -0.549*
(0.128) (0.137) 3 ≤ t ≤ 4 0.372 -0.476
(0.463) (0.498) 5 ≤ t ≤ 6 0.401 -0.628
(0.364) (0.393) 7 ≤ t ≤ 12 0.534 -0.797*
(0.287) (0.305) 13 ≤ t ≤ 20 0.627* -0.905*
(0.290) (0.311) t > 20 0.741* -0.940*
(0.273) (0.289)
Store size × t -0.006 0.016* (0.007) (0.007)
Store size × log(t+1) -0.085 0.111* (0.049) (0.050)
Store size -0.377* -0.508* -0.296 -0.510 -0.474* -0.455* (0.092) (0.082) (0.100) (0.086) (0.074) (0.072)
WIC brand is Mead 0.059 -0.154 0.060 -0.152 0.032 -0.128 (0.160) (0.154) (0.160) (0.154) (0.160) (0.154)
WIC brand is Ross -0.270 0.404* -0.284 0.405* -0.272 0.388* (0.168) (0.161) (0.169) (0.161) (0.168) (0.160)
Number of births -0.035 -0.012 -0.035 -0.012 -0.037 -0.013 (0.024) (0.023) (0.024) (0.023) (0.024) (0.023)
Age (median) -0.031 -0.077* -0.029 -0.077 -0.036 -0.073 (0.045) (0.042) (0.045) (0.043) (0.045) (0.042)
Children Under 5 (%) -0.209 -0.175 -0.206 -0.176 -0.218 -0.175 (0.162) (0.152) (0.162) (0.153) (0.162) (0.152)
White (%) 0.072 -0.110 0.070 -0.114 0.083 -0.102 (0.170) (0.166) (0.170) (0.166) (0.170) (0.166)
Black (%) 0.060 -0.119 0.058 -0.123 0.072 -0.111 (0.171) (0.167) (0.172) (0.168) (0.171) (0.167)
Asian (%) 0.248 -0.103 0.248 -0.110 0.260 -0.090 (0.238) (0.233) (0.239) (0.233) (0.238) (0.233)

25
Hispanic (%) 0.019 -0.050 0.018 -0.052 0.027 -0.046 (0.101) (0.099) (0.102) (0.099) (0.101) (0.099)
High school (%) 0.016 0.065* 0.017 0.065* 0.015 0.068 (0.035) (0.035) (0.035) (0.035) (0.037) (0.035)
College (%) 0.041* 0.025 0.041* 0.025 0.042* 0.025 (0.016) (0.016) (0.016) (0.016) (0.016) (0.016)
Household size (median) 0.933 0.170 0.966 0.155 0.937 0.175 (0.749) (0.743) (0.750) (0.743) (0.749) (0.743)
Income (median) 0.008 -0.007 0.008 -0.007 0.007 -0.008 (0.020) (0.020) (0.020) (0.020) (0.020) (0.020)
Poverty (%) 0.165* 0.137* 0.167* 0.138* 0.162* 0.142* (0.055) (0.054) (0.055) (0.054) (0.055) (0.054)
Constant -9.129 10.512 -9.314 10.972 -9.806 9.336 (18.719) (18.389) (18.769) (18.413) (18.713) (18.357)
# observations 4,836 4,836 4,836 Log Likelihood –3,399 –3,378 –3,390 Chi-square 2,181 2,223 2,253 Degrees of freedom 36 36 42 * indicates that we can reject the null hypothesis at the 0.05 level.

26
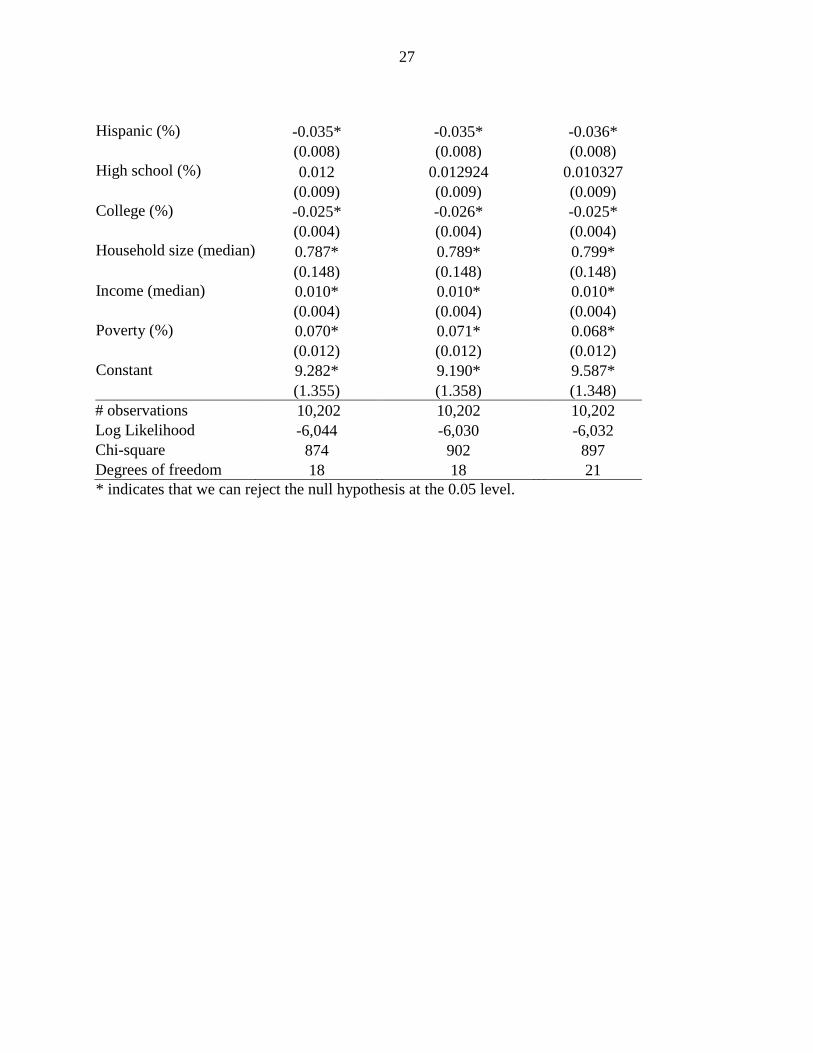
Table 3. WIC Brand Market Share Logit for All States
Linear Time Trend Log-Linear Time Trend Time Dummies Contract change 0.812* -0.05993 0.294**
(0.100) (0.176) (0.144) t 0.048*
(0.008) log (t+1) 0.659*
(0.077) 3 ≤ t ≤ 4 0.792*
(0.289) 5 ≤ t ≤ 6 0.938*
(0.230) 7 ≤ t ≤ 12 1.169*
(0.179) 13 ≤ t ≤ 20 1.223*
(0.179) t > 20 1.386*
(0.167)
Store size × t -0.010* (0.004)
Store size × log(t+1) -0.076* (0.029)
Store size -0.250* -0.239* -0.288* (0.038) (0.039) (0.034)
WIC brand is Mead 1.206* 1.201* 1.213* (0.084) (0.084) (0.085)
WIC brand is Ross 0.578* 0.571* 0.596* (0.087) (0.087) (0.088)
Number of births -0.000 -0.000 0.000 (0.002) (0.002) (0.002)
Age (median) -0.042* -0.042* -0.043* (0.010) (0.010) (0.010)
Children Under 5 (%) -0.526* -0.529* -0.527* (0.037) (0.037) (0.037)
White (%) -0.082* -0.082* -0.083* (0.012) (0.012) (0.012)
Black (%) -0.098* -0.097* -0.098* (0.012) (0.012) (0.012)
Asian (%) -0.078* -0.078* -0.078* (0.013) (0.013) (0.013)
27
Hispanic (%) -0.035* -0.035* -0.036* (0.008) (0.008) (0.008)
High school (%) 0.012 0.012924 0.010327 (0.009) (0.009) (0.009)
College (%) -0.025* -0.026* -0.025* (0.004) (0.004) (0.004)
Household size (median) 0.787* 0.789* 0.799* (0.148) (0.148) (0.148)
Income (median) 0.010* 0.010* 0.010* (0.004) (0.004) (0.004)
Poverty (%) 0.070* 0.071* 0.068* (0.012) (0.012) (0.012)
Constant 9.282* 9.190* 9.587* (1.355) (1.358) (1.348)
# observations 10,202 10,202 10,202 Log Likelihood -6,044 -6,030 -6,032 Chi-square 874 902 897 Degrees of freedom 18 18 21 * indicates that we can reject the null hypothesis at the 0.05 level.

28
Table 4. Probability that a Store Does Not Sell a Brand for a 12 Week Period
for all 131 Stores
Coefficients
Asymptotic
standard error
Store size -2.583* -1.026
Age (median) -0.014 0.160
Children Under 5 (%) -0.982 0.644
White (%) 0.016 0.212
Black (%) 0.0060 0.214
Asian (%) -0.227 0.333
Hispanic (%) 0.046 0.129
High school (%) -0.041 0.121
College (%) 0.068 0.0582
Household size (median) 2.844 2.255
Income (median) 0.033 0.0636
Poverty (%) 0.139 0.168
Constant -2.952 20.340
Pseudo-R2 0.31
* indicates that we can reject the null hypothesis at the 0.05 level.
29
Figure 1. Average Market Shares in States where WIC Contract Changed Hands
28 Texas, Minnesota, and Iowa Stores 19 Pennsylvania, Georgia and Tennessee Stores
15 Missouri Stores 13 Missouri and Florida Stores
Note. In biweek zero the contract loser still holds the WIC contract. The contract change occurs
in biweek one.

30
Figure 2. Average Market Shares in States without WIC Contract Changes
55 Massachusetts, California, Colorado, New York and Washington Stores
14 Wisconsin, Illinois, and Michigan Stores
Note. Biweek period 1 is the first biweek in 1996 and biweek period 78 is the last biweek in 1998.

31
Figure 3. Predicted Market Shares Based on a Log Time Trend Multinomial Logit Model
0
10
20
30
40
50
60
70
80
90
0 2 4 6 8 10 12 14 16 18 20 22 24 26 28 30 32 34 36
Qua
ntity
Sha
re (%
)
Biweekly Periods
Ross
Mead
Other
0
10
20
30
40
50
60
70
80
90
0 2 4 6 8 10 12 14 16 18 20 22 24 26 28 30 32 34 36
Qua
ntity
Sha
re (%
)
Mead
RossOther
Biweekly Periods Ross replaces Mead as the WIC brand Mead replaces Ross as the WIC brand
0
10
20
30
40
50
60
70
80
90
0 2 4 6 8 10 12 14 16 18 20 22 24 26 28 30 32 34 36
Qua
ntity
Sha
re (%
)
Biweekly Periods
Carnation
MeadOther
Carnation
0
10
20
30
40
50
60
70
80
90
0 2 4 6 8 10 12 14 16 18 20 22 24 26 28 30 32 34 36
Qua
ntity
Sha
re (%
)
Biweekly Periods
Carnation
Mead
Other
Carnation replaces Mead as the WIC brand Mead replaces Carnation as the WIC brand Note. In biweek zero the contract loser still holds the WIC contract. The contract change occurs
in biweek one.