WIC Contract Spillover Effects - AgEcon Searchageconsearch.umn.edu/bitstream/9773/1/sp07hu01.pdf ·...
36
WIC Contract Spillover Effects Rui Huang Jeffrey M. Perloff May, 2007 Selected Paper prepared for presentation at the American Agricultural Economics Association Annual Meeting, Portland, OR, July 29-August 1, 2007 This study was produced under cooperative agreement 43-3AEM-5-80035 with the U.S. Department of Agriculture. We are grateful to our colleagues at the U.S.D.A. ERS, particularly David Davis, and Linnea Sallack for information and helpful comments on our earlier research proposals. Copyright 2007 by Rui Huang and Jeffrey Perloff. All rights reserved. Readers may make verbatim copies of this document for non-commercial purposes by any means, provided that this copyright notice appears on all such copies.
Transcript of WIC Contract Spillover Effects - AgEcon Searchageconsearch.umn.edu/bitstream/9773/1/sp07hu01.pdf ·...
WIC Contract Spillover Effects
Rui Huang
Jeffrey M. Perloff
May, 2007
Selected Paper prepared for presentation at the American Agricultural Economics Association Annual Meeting, Portland, OR, July 29-August 1, 2007
This study was produced under cooperative agreement 43-3AEM-5-80035 with the U.S. Department of Agriculture. We are grateful to our colleagues at the U.S.D.A. ERS, particularly David Davis, and Linnea Sallack for information and helpful comments on our earlier research proposals. Copyright 2007 by Rui Huang and Jeffrey Perloff. All rights reserved. Readers may make verbatim copies of this document for non-commercial purposes by any means, provided that this copyright notice appears on all such copies.

2
WIC Contract Spillover Effects
Under the Special Nutrition Program for Women, Infants, and Children (WIC), each WIC
state agency holds auctions whereby the low-bidder among the three major manufacturers of
infant formula becomes the sole provider of formula to the state. Low income WIC participants
in the state are then able to obtain infant formula products produced by this WIC supplier from
participating grocery stores for free by using vouchers issued by the WIC program. All three
firms compete for retail sales to higher-income consumers, who are charged a regular retail price.
In contrast to earlier studies that describe this outcome as one of price discrimination, we present
a spillover model. We hypothesize that the winning WIC brand gains additional shelf-space
within grocery stores and hence credibility with non-WIC customers, which allows the WIC
brand to greatly increase its share of the non-WIC market. Consequently, the WIC contract
winner becomes the dominant player in the non-WIC market, which can result in a price
differential between the WIC and non-WIC price that exceeds that of the classic price-
discrimination model. We use grocery scanner data to empirically test and confirm our
hypothesis.
Before we present our hypothesis it is important to describe how WIC infant formula
program works. The WIC program targets low-income infants and children, pregnant and
postpartum women are who nutritionally at risk by providing them free supplemental nutritious
foods and nutritional counseling. Infant formula is the most expensive food items contained in
the WIC package and therefore deemed as the most important benefits to the WIC participants.
Each year Congress authorizes a specific amount of funds for the program. On average 7.5
million people per month participated in the program, including 1.9 million infants or about half

3
of all the infants in the US in the fiscal year 2002, according to USDA(2003). Infant formula
procurement cost is the lion’s share of the WIC budget. Since 1998, Federal law has required the
WIC state agency to use cost-containment practices. Typically the state agencies obtain deep
discounts off the wholesales prices of the infant formula manufacturers in the form of rebates in
the auctions, held usually every three years. The states sign contracts with one of three
manufacturers. These firms produce 99 percent (in 2000) of infant formula. Mead Johnson has
52 percent of the market; Ross, 35 percent; and Carnation, 12 percent (Oliveira and Prell 2004).
When a contract is in effect, a WIC participant “purchases” infant formula products of the
contract brands from a retailer with her WIC vouchers. These vouchers are then sent to the WIC
agencies by the retailer to get reimbursed for their retail prices of the products. The WIC supplier
of the state, who has been paid the wholesales price of the product by the retailer, has to give
rebates to the WIC agents for these formula products as agreed in the contract. Therefore, The
cost to the WIC program is the retail price minus the rebate. The retailer earns a same retail
markup whether a WIC or non-WIC consumer purchases the product. The WIC contract supplier
essentially charges a rebated wholesales price for products sold to the WIC participants but
charges a regular wholesales prices for products sold to non-WIC consumers.
The existence of two wholesales prices and the segmentation of the market by income
under the WIC infant formula rebate program, therefore, make price discrimination practice
possible. Consequently, price discrimination effects are the dominant view among researchers on
how the rebate program affects WIC and non-WIC prices. We believe that spillover effect plays
an important role in determining the WIC and non-WIC prices differential. Examining this
spillover effect is important because it has substantial policy and legal implications and there is
little formal analysis of this effect. In the first year after the WIC sole-source rebate program

4
was instituted in 1989, the wholesale prices paid by non-WIC purchasers rose faster than usual
while the net prices paid by WIC agencies decreased. The wholesale prices for non-WIC
purchasers increased by 9 percent at an annual rate in 1989-1990 after adjusting for the general
rate of inflation in the economy, compared with increases of about 3 percent before and after this
period (GAO 1998).
Consequently, many politicians and others raised concerns that the WIC’s rebate program
was harming non-WIC consumers. In response to a request by the U.S. House of
Representatives' Committee on the Budget, the U.S. General Accounting Office in 1998
conducted analysis to address questions including how prices in the infant formula market
changed after the introduction of the rebate program (U.S. GAO 1998). In May 1999, the U.S.
House of Representatives' Committee on Appropriations expressed concern “that since rebates
began infant formula costs appear to have risen far greater than inflation, and the number of
suppliers has declined” (H.R. 106-157). Oliveira et al. (2004) conclude that WIC and its infant
formula rebate program led to modest increases in retail prices for non-WIC consumers for given
wholesale prices, especially in states with relatively large WIC programs. Despite the GAO and
other empirical studies, we believe that there is a lack of a consensus on a theory as to how the
rebate program affects non-WIC consumers.
The U.S. GAO (1998) argued based on simulations (rather than a formal empirical
analysis) that spillover effects could not be substantial in the WIC infant formula market. In
contrast, lawyers and politicians have argued that there are substantial spillover effects with
respect to another aspect of the WIC program: infant cereal. A June 19, 2003 press release of
Senator Schumer of New York (where Beech-Nut is located) stated:
According to Beech Nut, about 50 percent of WIC consumers who purchase infant cereal under the program will continue to stay loyal to that brand

5
once the child switches to jarred food. By contrast if they do not win the cereal contract, they would expect to capture only 10 percent of the business after the child is eating jarred food. Beech Nut claims that Gerber has gone to extreme efforts to prevent Beech Nut from winning WIC bids, saying it uses its 77.4 percent market share advantage to offer infant cereal under the WIC program at a fraction of its costs, thereby securing exclusive, sole-source WIC cereal contracts. By preventing Beech Nut from becoming the WIC supplier through below-cost bids, Gerber ensures that far fewer retailers will carry Beech Nut infant cereal – for both WIC sales and non-WIC sales.
Thus, the allegation in the Beech Nut case is that winning the WIC contract results in
dominance of that brand in the non-WIC retail market and that firms may use below-cost bids to
obtain the WIC contract.
There are several possible channels for a spillover effect. Increases in shelf-space for the
WIC contract winner within grocery stores may influence non-WIC buyers. The GAO (GAO
2006a) reports that some infant formula manufacturers’ marketing efforts used the trademarked
WIC acronym in promotional materials. Examples include glossy posters for health care
providers promoting a formula as “WIC Eligible” in big letters and depicting a flag with the WIC
acronym and a consumer advertisement and coupon indicating a formula for babies with
colic is “WIC approved in all 50 states.” (The GAO recommended a limit to the uses of the WIC
acronym or logo in promotional materials.) Although we do not have data that permits us to
identify the source of the spillover effect, we are able to identify and measure the spillover effect
using grocery scanner data.
We start by describing the WIC program. Next, we present some simple theoretical
models to illustrate our basic point. Then we use grocery scanner data to provide supporting
evidence of a spillover effect.

6
WIC Program
The WIC program is large and important. Congress allocated WIC over $5.2 billion in
fiscal 2006, making it the third largest nutrition assistance program after the Food Stamp
Program and the National School Lunch Program. Oliveira and Prell (2004) report that nearly
half of all U.S. infants receive WIC benefits. WIC purchases of infant formula accounted for
over 50 percent of this product’s sales in the United States (GAO 1998).
Since 1989, states have been required to contain the cost of infant formula primarily
through state programs that award a sole-source contract to a manufacturer for the exclusive right
to sell its infant formula to WIC participants. WIC State agencies hold auctions in which the
three major infant formula manufacturers bid by offering rebates for each can of formula that
WIC participants obtain. The WIC contract is awarded to the manufacturer that bids the lowest
net price—wholesale price less the rebate. WIC participants are given vouchers, which they use
to “purchase” the formula at grocery stores at other outlets. The WIC state agency compensates
the grocery store and receives the rebate from the manufacturer.
This WIC program has greatly reduced the amount that states pay for infant formula.
States paid an average of 20¢ per can for milk-based concentrate formula in 2004, a savings of
93 percent off the wholesale price (GAO 2006b). Rebate savings have remained near $1.6
billion per year since 1997 after adjusting for inflation, but the amount states pay per can of
infant formula has increased since 2002 (GAO 2006b), which affects the number of possible
recipients.

7
Theory
We want a model that is consistent with the three major observed properties of this
market (which we document in our empirical section). First, the non-WIC relative prices across
brands do not change substantially after a new firm wins the WIC contract. Second, when a new
firm wins a WIC contract, its share of sales within grocery stores just substantially immediately
and then increases steadily over time for up to a year. Third, each manufacturer annually sets a
national wholesale price (Oliveira and Prell, 2004).
Much of the formal and informal WIC literature describes the WIC and its rebate
program as enabling price discrimination.1 According to the price-discrimination story, the
winning firm sets a high, profit-maximizing price to non-WIC participants. Because the price to
the government for WIC purchases is the wholesale price less the rebate, the firm can control the
lower price as well by the size of the rebate it offers.
However, such a description is not accurate. For legal and other reasons, each major
infant-formula manufacturer set a national wholesale price, which is changed roughly annually.
As each of these firms is the winning bidder in some states and not in others, it cannot fully
control the after-rebate price on a state by state basis.2
1 For example, Hal Varian, www.wwnorton.com/mip/ime/varian/24a.htm, discusses a simple economic model where the removal of the low-income consumers from the out-of-the-pocket-market results in higher non-WIC price. Similarly, Post and Wubbenhorst (1989) argued that WIC vouchers make WIC consumers price insensitive so that the overall demand is much less price sensitive hence profit-maximizing retailer raise their price. Oliveria et al. (2004, pp. 2-3) report this conclusion. 2 Conceivably, the manufacturers could divide the states in which they win the WIC contract in such a way that setting the wholesale price nationally suffices to allow them to optimally price discriminate. They could do that by colluding, by using a mixed strategy in their bids such that they win an expected number of states, or by bidding in such a way that firms win in different types of states. However, according to our fairly small samples for the late 1990s, the contract

8
A more accurate description of the equilibrium is that the auction process determines the
low, WIC price. The winning firm provides the entire quantity for WIC sales. All the firms
compete for the non-WIC customers. Because they set their wholesale prices nationally, they
cannot adjust their prices for variations in demographics across jurisdictions.
Prell (2005) is the only formal analysis on WIC that incorporates spillover effect. He
considers the demand for a WIC brand and non-WIC brand carried by a representative retailer
and solves for the equilibrium retail prices assuming the retailer takes wholesales prices as given.
In contrast, our study abstracts from the retailer’s behavior and focuses on the manufacturer’s
decisions when there is a spillover effect.
To illustrate the effects of the WIC program, we start by considering how a monopoly
would behave. Then, we describe an oligopoly equilibrium. Next, we discuss how the oligopoly
equilibrium would change given a spillover effect where the contract winner benefits from an
increased demand among non-WIC consumers increases. Finally, we discuss the dynamic
adjustment that is associated with the spillover effect.
Monopoly
Suppose that a monopoly sells to n1 poor people and n2 rich people, where each poor
person has a constant elasticity demand function of q1 = 1pε and every rich person’s demand
function is q2 = 2pε . Thus, the total demand functions are Q1 = n1 1pε and Q2 = n2 2pε .
changed from Ross to Mead in states with relatively low retail prices and changed in the other direction in states with relatively high retail prices, as we show later in the paper. (Unfortunately, we do not have enough variation to examine fully whether there is a systematic pattern in which firm wins in a given state.)

9
Infant formula can be manufactured at constant marginal cost c. If a monopoly
manufacturer can price discriminate, it will charge poor people p1 = c/(1 + 1/ε1) and rich people
p2 = c/(1 + 1/ε2).
If it cannot price discriminate, it charges everyone the same price. Its total demand is Q
= Q1 + Q2 = n1 1pε + n2 2pε . Differentiating with respect to p, we obtain dQ/dp = ε1Q1/p + ε2Q2/p.
Multiplying through by p/Q, we learn that ε is the weighted sum of the two groups’ elasticities: ε
= s1ε1 + s2ε2, where si = Q1/Q. Thus, it charges p* = c/(1 + 1/ε) if can charge only a single price.
If the government institutes a WIC program, the monopoly charges the wealthy what it
wants, which is p2 = c/(1 + 1/ε2) > p*, and the firm sells a fixed quantity to each of the n1 WIC
consumers at a negotiated price. Presumably, the maximum price that the government will
accept is one that is less than p* (and hence less than p2). The lowest price that the monopoly
will offer is one such that its profit is at least as high as its single-price profit, which is πs =
(p - c)(Q1 1pε + Q2 2pε ), ignoring any fixed cost. Thus, the lowest amount it is willing to bid
depends on n1, n2, ε1, and ε2. In contrast, if it could price discriminate it would set the price p1
based solely on ε1.
Oligopoly
If the industry consists of an oligopoly, the single-price equilibrium will be lower than
the monopoly equilibrium. For example, if there are three identical firms that sell products that
are viewed as homogeneous by consumers, and they play a Cournot game, they each charge the
triopoly price, p3 = c/(1 + 1/[3ε]) < p*.3
3 In a Cournot game, p = c/(1 + 1/[fε]), where f is the number of firms and ε is the market elasticity of demand at the equilibrium. Corts (1998) and others have solved for the oligopoly price-discrimination equilibria, which differ from the monopoly price-discrimination equilibrium.

10
Under the government’s WIC program, the firms are asked to bid on an exclusive
contract, where the winner is the only firm that supplies the WIC consumers. All the firms
compete for the remaining customers. If the WIC bidding process has no effect on wealthier
customers, the new price to this group is , which is greater than p3, the single
price they charge if they sell to all consumers because ε < ε2. The lowest price that a firm would
be willing to bid for the WIC contract is c. At that price, all firms are worse off than before the
WIC program.
Spillover Effect
Now suppose that the winner of the WIC contract benefits from a spillover effect.
Grocery stores increase their shelf-space for the WIC winner’s brand—for example, for
inventory reasons. Many wealthier customers are influenced by the winning firm’s greater shelf
space: “The most-popular brand gets the most shelf space, so I’ll buy that product.” Instead of
splitting all sales to wealthier customers equally, the WIC-contract winner now gets a much
larger share. Because of these greater sales, a firm may be willing to bid a price lower than c for
the WIC contract.4 Though it will lose money on the WIC contract, it earns a larger non-WIC
profit.
However, as this market is not properly described as one of price discrimination, we do not discuss these model further. 4 According to Beechnut in its suit with Gerber where it alleged predatory pricing by bidding below cost for WIC contracts in California, Nevada, and Texas (Sally C. Pipes, “Fight Over Baby-food Vouchers,” Sacramento Bee, March 18, 2004), the WIC monopolies generated so much demand for Gerber cereals that grocery chains dropped other brands or gave them inferior placement on shelves. As a consequence, Beechnut was essentially forced out of Texas and faced plummeting sales in Nevada and California.

11
Finally, suppose that the spillover effect causes the WIC contract winner’s demand curve
for wealthier consumers to shift to the right and become less elastic. If so, the WIC contract
winner could bid a price that was less than marginal cost for the WIC contract and charge
wealthier customers more than the price-discrimination price given no shift in the demand
function. Thus, a spillover model can explain the unusual deep rebates observed and the
relatively high prices charged to non-WIC customers.
For example, suppose that the spillover effect resulted in the WIC winner becoming a
virtual monopoly (dominant firm facing a small competitive fringe). It would then want to
change its price from the triopoly level, c/(1 + 1/[3ε]), to nearly the monopoly level, c/(1 + 1/ε).
Although the firms set their prices nationally, even without colluding, they might find it in their
best interests to set the monopoly price and expect to sell substantial quantities only in the states
in which they are the WIC winners.
Dynamics
Although the various brands have the same basic components, many websites for new
parents recommend sticking to one brand.5 Consequently, many parents choose a brand initially
and then stick to that brand throughout the period during which the baby is consuming formula.
Thus, even if a spillover effect occurs and non-WIC parents who are choosing formula
for the first time are more like to pick the WIC brand, the effect on sales may be small initially as
most parents of older babies do not switch from their former brand (the previous WIC winner).
Gradually over time, parents of older children stop buying formula and new parents enter the
5 For example, see bottle-feeding-baby.com/what-baby-formula-milk-to-use.php and Rhode Island University’s Cooperative Extension’s nutritional education program site: www.uri.edu/ce/efnep/Infant percent20Feeding percent20p.10 percent20Choosing percent20A percent20Formula.htm.
12
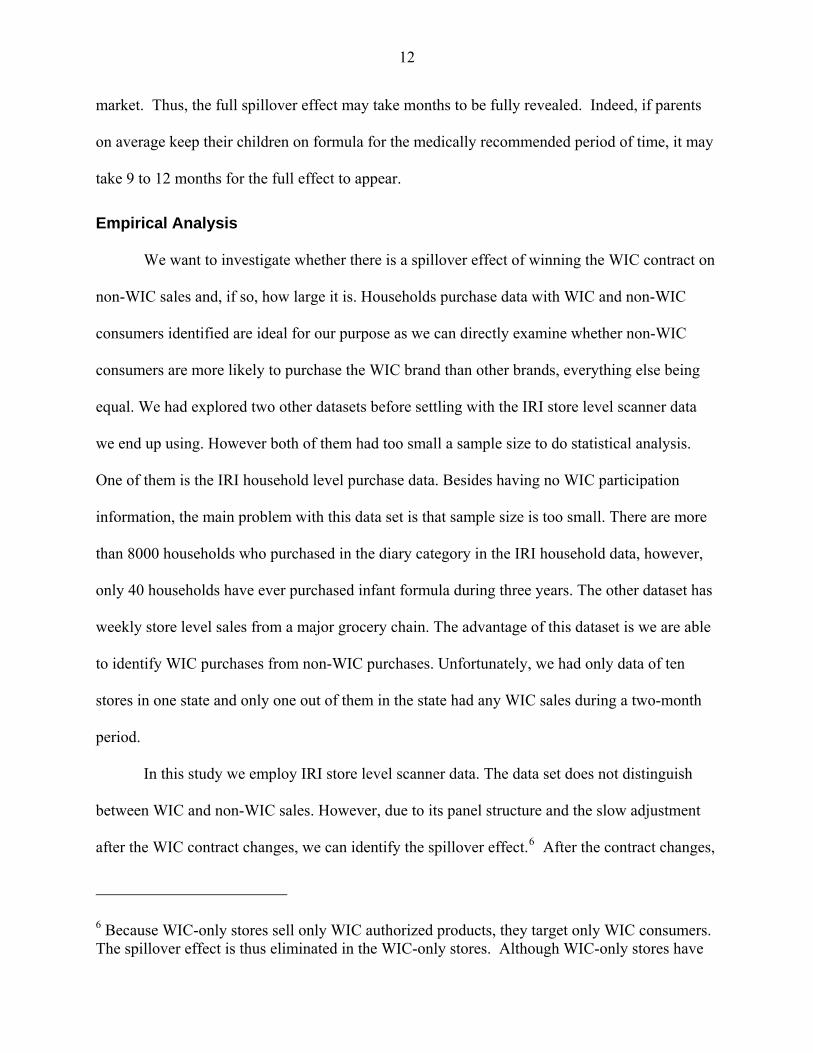
market. Thus, the full spillover effect may take months to be fully revealed. Indeed, if parents
on average keep their children on formula for the medically recommended period of time, it may
take 9 to 12 months for the full effect to appear.
Empirical Analysis
We want to investigate whether there is a spillover effect of winning the WIC contract on
non-WIC sales and, if so, how large it is. Households purchase data with WIC and non-WIC
consumers identified are ideal for our purpose as we can directly examine whether non-WIC
consumers are more likely to purchase the WIC brand than other brands, everything else being
equal. We had explored two other datasets before settling with the IRI store level scanner data
we end up using. However both of them had too small a sample size to do statistical analysis.
One of them is the IRI household level purchase data. Besides having no WIC participation
information, the main problem with this data set is that sample size is too small. There are more
than 8000 households who purchased in the diary category in the IRI household data, however,
only 40 households have ever purchased infant formula during three years. The other dataset has
weekly store level sales from a major grocery chain. The advantage of this dataset is we are able
to identify WIC purchases from non-WIC purchases. Unfortunately, we had only data of ten
stores in one state and only one out of them in the state had any WIC sales during a two-month
period.
In this study we employ IRI store level scanner data. The data set does not distinguish
between WIC and non-WIC sales. However, due to its panel structure and the slow adjustment
after the WIC contract changes, we can identify the spillover effect.6 After the contract changes,
6 Because WIC-only stores sell only WIC authorized products, they target only WIC consumers. The spillover effect is thus eliminated in the WIC-only stores. Although WIC-only stores have

13
we expect the winning brand’s market share to increase markedly due to the additional WIC
sales, and the losing firm’s share to fall by a comparable amount. Then, over time, we expect the
share of the winning firm to grow and that of the losing firm to fall, reflecting the slow
adjustment of customers to the spillover effect. Throughout the period, we expect the remaining
share to be affected to a less degree than the winning and losing firm, if any at all. Nevertheless
the remaining share could be affected if some brand has really strong spillover.
Data
We use Information Resources Incorporated’s (IRI) InfoScan store-level infant formula
sales data for 1997 through 1999. The store-level data set includes weekly prices, total sales
quantities, promotion activities (price reduction, special display, retail ads, and any other type of
promotion excluding coupons), and other information by product item (Universal Product Code
or UPC).
The WIC program covers both powder and liquid concentrate formats, occasionally the
more expensive Ready-to-use format if approved by WIC. Below, we report an analysis using
powdered infant formula, the least expensive form, which accounts for substantially more infant
formula sales than the other physical forms in U.S. measured in reconstituted ounces, according
to Oliveira et al (figure 6.3, 2004) during the 1997-1999 period we studied. 7
been growing rapidly recently, during our data period 1997 to 1999, they are believed to have accounted for at most a tiny share of the WIC products market. We do not have any number for our period, however, in the year of 2000, there were fewer than 15 WIC-only stores across all states except California (303), Florida (78), and Texas (89). 7 We repeated our powder analysis for concentrate and observed qualitatively similar results (though the spillover effects were larger), so we do not report the results for the concentrate here. Most states issue ready-to-use (RTU) infant formula to only WIC participants with specific conditions, such as unavailability of sanitary water supply or lack of the ability of the caretakers to dilute formula, or unavailability of comparable substitute in other format, so relatively few
14
We examine data from the 11 cities in 7 states where WIC contract changes occurred
during our sample period.8 (We also looked at cities in states without a WIC contract change and
did not find the substantial changes that occur in the states where the contract changed.)
Geographically, these are the states located in South, Mid-west and North Eastern regions. Most
of the cities in the sample are big cities such as Philadelphia, St. Louis, Houston and Atlanta. But
we also have some mid- or small cities such as Midland, TX and Rome, GA. There are a total of
39 stores from 18 grocery chains in the sample, including national giants Kroger and Albertsons,
and also local chains such as Randall’s, Rainbow, and Shop N Save. The 39 stores are located in
22 zip codes. For each of the 39 stores, we match the store zip code with zip code level
demographic information from U.S. Census Bureau 2000 data(U.S. Census Bureau, Summary
File 1 (SF 1) and Summary File 3 (SF 3) ). We report the summary statistics of important
demographic variables, such as age, income, and education in Table 1. The last column in Table
1 is the U.S. average from the 2000 Census data. We can see that there is considerable variation
in terms of each variable listed. On the average, compared to the US average, our sample has the
similar median age and % population under 5. The variable % population under 5 can be viewed
as a proxy for fraction of infants, the potential infant formula users, in the area. In terms of race
people are affected. We do not know which firm provides RTU infant formula through WIC in most states. Even if we had this information, we could not conduct an analysis similar to that for powder because most stores fail to carry at least one of the major brands for extensive periods. 8 The seven states are Georgia, Missouri, Pennsylvania, Texas, Minnesota, Iowa, and Florida. In Georgia, Ross replaced Mead as the WIC supplier effective from August 1, 1998. Ross also replaced Mead in Pennsylvania two months later. Mead took over the contract with the alliance of Texas, Minnesota, and Iowa from Ross at October 1, 1998. In Florida, Carnation became the winner in February 1, 1999, replacing Mead. Two contract changes took place in Missouri, the WIC supplier changed from Mead to Carnation and to Mead again. The first change occurred on October 1, 1997, and the second on October 1, 1998.
15
composition, our data slightly over sample the white population at the cost of Asian and Hispanic.
Our data also, on the average, have higher education, higher income and lower poverty level than
the average Americans. In particular, on the average there are % 5.5 families below poverty level
as opposed to a %9.2 at the national level. Nevertheless the span of the poverty percentage is
quite big, from a minimum of 1.7% to a maximum of 19.7% in our data. When it comes to
generalizing our findings to the average population, the effects of higher income and lower
poverty however are somehow ambiguous. This is because the relationship between spillover
effect and share of WIC consumers might not be linear. The spillover is clearly zero if all the
population is enrolled in WIC. Spillover then increases as the percentage of non-WIC consumers
increase. However, intuitively, the spillover effect could level off or even decrease when less and
less share of consumers participate in WIC because then the stores might become less and less
willing to allocate additional shelf space to WIC brand when WIC consumers shrink. In the
extreme we can imagine that in some affluent neighborhoods where no one participates in WIC
and spillover effect becomes zero. Therefore, in the neighborhoods with higher than national
average income in our sample, on one hand, being a WIC brand could potentially influence more
non-WIC people consumption decision via preferential shelf space allocation or physician’s
endorsement, but on the other hand, stores might be reluctant to allocate shelf space
preferentially when there are not many WIC consumers. By necessity, we use data for only
those stores for which we have information both before and after the WIC contract change.
In some stores, one of the three national brands (a non-WIC contract brand) was not sold
in every period. Although we do not have information on what brands a store carries, we can
reasonably infer that the store did not carry a brand if none of UPCs under the brand were sold in
the store for an extended period. In our case, we say that a store did not carry a brand in the

16
period if none of the UPCs of the brand was sold for more than one month. The brand most
likely not to be carried is Carnation, the brand with the smallest share and the lowest price. Two
possible explanations for why a grocery would not carry all brands are that the store is small (has
limited shelf space) or that the demographic composition of its customers is such that it does not
pay to carry all three brands.
To see if restricting our sample to only stores that carried all three brands throughout the
time period might cause a systematic bias related to variations in the demographic composition
of customers, we estimated a probit model. The dependent variable was one if the stores carried
all three national brands throughout and the explanatory variables were the demographic
characteristics of the store’s customers and a proxy for store size.9 We find that we cannot reject
the null hypothesis of zero effect at the 0.05 level for all the demographic variables but not the
store size variable. Therefore we conclude that size of the store or cost of shelf space is the single
important factor in determining whether to carry all the brands. Consequently, we restrict the
following analysis to large stores that carried all the three top national top brands throughout the
data period. We lost 26 stores thus but all of the cities are kept in the final sample of 39 stores.
As another check, we also conducted similar analyses using all stores and found virtually
identical similar results.
9 The explanatory variables in the probit model include store size (proxied by a store’s mean weekly milk sales because we do not have direct measure of store size) and store demographics computed based on average consumer characteristics of the store, including mean household sizes, mean household annual income, percentage of households whose annual income exceeding 1 million dollars, percentage of households with kids under six, percentage of households with households full-time employed, percentage of households with households having white-collar occupation, percentage of households with college education, percentage of white households, percentage of home owners. The number of observation is 65, and the pseudo R2 of the probit regression is 0.66.

17
In constructing data for the empirical analysis, we aggregate each store’s powder formula
products to two-week intervals. By using biweekly periods, we smooth random sales
fluctuations and avoid having time periods in which a few stores have zero sales.
For each store, we calculate the shares of the WIC contract winner and the loser, where
the “loser” originally held the WIC the contract before losing it to the “winner.”10 The residual
share is attributed to “other” brands—almost entirely the share of the third national brand, but
also including private labels and minor national brands. Thus, the shares of the winner, loser,
and the others sum to one by definition. In our sample, 65 percent of the observations are from
30 stores in states where Mead eventually wins WIC contract, 18 percent are from 7 stores where
Ross is the winner, and the rest are from 13 stores where Carnation is the winner.
Summary Statistics
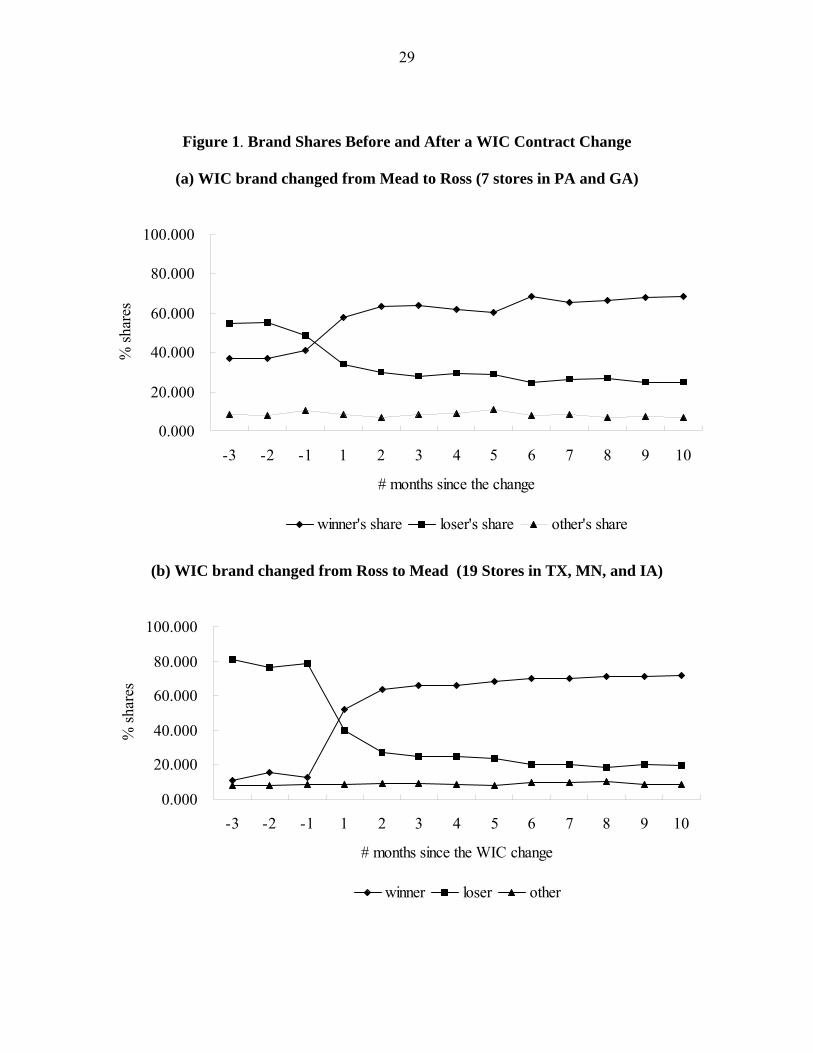
Even a cursory examination of the data produces is consistent with our stylized facts and
our theory. Figure 1 shows the average shares of the winner, loser and the other brands before
and after the change. There are four subplots in Figure 1, each corresponding to a sub-sample
with the all four winner-loser combinations occurred in our data. Sub-sample a contains 7 stores
in Pennsylvania and Georgia where WIC contract changed from Mead to Ross. Sub-sample b are
the 19 stores in Texas, Minnesota and Iowa where WIC contract changed from Ross to Mead.
Sub-sample c has 11 Missouri stores and 2 Florida stores where contract changed from Mead to
Carnation. Finally, sub-sample d has 11 Missouri stores when contract changed from Carnation
to Mead. For the first three sub-samples we plotted out monthly average brand shares from three
months before the change to 10 months after the change. The last subplot is based on sub-sample
10 Missouri is the only state that experienced more than once contract changeover during our sample period. For Missouri, we re-label the winner and loser after each contract change.
18
d and so we only plotted the shares from three months before the change to three months after
the change because another contract changeover from Mead to Carnation took place five months
after this first change in MO. We also compute the average monthly brand prices, as measured
by total revenue in a period divided by total ounces sold in the period, for each of the sub-
samples for the comparable periods. Figure 2 are the corresponding price plots for each of the
sub-samples. We draw two chief conclusions from these crude plots.
First, the share of the new WIC contract winner increases substantially, while the loser’s
share falls comparably immediately after the WIC contract change. For example, when the
contract changed from Mead to Ross, Ross’s share increased by about 17% from 41 percent one
month before the change to 58 percent one month after the change, while Mead’s share fell by
15% from 49 percent to 34 percent. Ross’ share further increased to 63.4%, while Mead’s share
dropped to 29.8% two months after the change. The results are similar for the other two types of
contract changes, although the magnitudes of the changes are different. We believe the sharp
gains and losses shortly after the contract changeover are mainly due to the fact that WIC
consumers switch from the old contract brand to the new contract brand. Second, the shares of
the WIC contract winner keeps increasing gradually while the shares of the losers decay slowly 4
or 8 weeks after a WIC contract change. As shown in subplot (a) in Figure 1, during the period
starting from two months after the change to 10 months after the change from Mead to Ross, on
the average, Mead’s share fell over time to 24% from about 30% and Ross’ share climbed to
70% from 63%. Similarly, the pattern is observed in other sub-plots in Figure 1. We view this
gradual adjustment after the sharp change as evidence to spillover effect. Third, the share of the
“other” brands, usually the third national brand and sometimes private label, remains relatively
stable before and after the change as shown in all the subplots. Finally, the retail prices of all

19
brands are virtually constant before and after the change. As a matter of fact, during the 13-
month interval we looked at, the monthly average prices were stable in all sub-samples but the
13 stores in MO and FL where both the prices of the winner (Carnation) and the loser (Mead)
picked up in the latter half of the period. However, the increases of the prices occurred three
months after the contract change and hence are not directly associated with the change of the
contracts.
These shifts in brand shares before and after changes in WIC contract are not caused by
changes in the demographic composition of the store’s customers. We examined the aggregate
consumer demographics for this store using the demographic information of the households who
have purchased dairy products in these stores and could not find any significant changes in the
demographics over the entire sample period.
Although the change in contract caused a dramatic change in shares, it did not alter total
sales. In Figure 3, we plot the average total store monthly powdered volume for all the four sub-
samples depicted in Figure 1 and Figure 2. We see that except for sub-sample d, no major change
in total demand occurs at the time of WIC contract change exceeding normal month to month
fluctuation. The total demand however appeared to suddenly drop for sub-sample d at the time of
the change. Whether this is coincidence or due to some special circumstances in the Missouri
state is not clear.
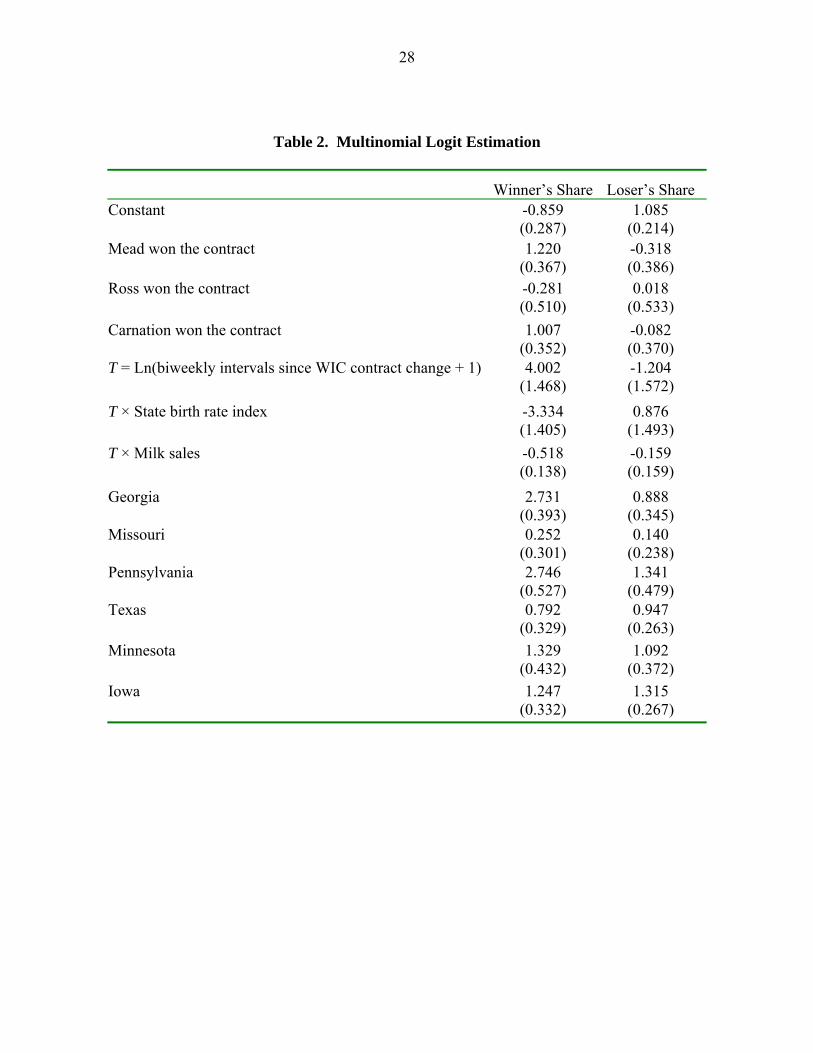
Multinomial Logit Analysis
To examine the causes of this shift in market shares more formally, we estimate a
multinomial logit model and report the results in Table 2, where the dependent variables are the
shares of the winner, loser, and others at each store at biweekly intervals. The base share is that
for the “others” group. We include three types of explanatory variables: a dummy to capture the

20
instantaneous effect of a contract change, a time trend after the contract change to capture the
gradual spillover effect, and additional control variables.
The additional control variables include dummy variables for each state to capture other
possible effects. These coefficients are often statistically significantly different from zero, but
have no obvious interpretation. We experimented with including other variables such as city
dummies, dummies for the grocery chains, and a variety of demographic variables for consumers
that patronize a given store (those that were used in the probit), however none of the estimated
coefficients on these variables were statistically significantly different from zero, so we do not
report them in Table 2.
We do not include prices as explanatory variables for two reasons. First, the store-level
brand shares reflect both WIC and non-WIC sales in an unknown proportions. WIC customers
do not pay for the infant formula, and hence should not be sensitive to the listed retail price.
Thus, the relationship between price and share is not clear. Second, the retail prices are
potentially endogenous (though they do not actually change).
Instantaneous WIC Customer Effect
We hypothesize that when the WIC contract changes hands, virtually all the WIC
customers shift immediately to the new brand. Were these customers to continue to buy their
original brand, they would have to pay the full retail price; whereas if they shift, they receive the
formula at no cost.
To capture this change of brands by WIC customers, we include a WIC dummy. For each
of the three leading firms, the WIC dummy is one for the firm during the periods in which it
holds the WIC contract. For example in Texas effective October 1, 1998, Mead became the WIC
contract winner replacing Ross. Hence, for a store in Midland, Texas, the WIC dummy for Mead

21
is zero before October 1, 1998 and one thereafter. We interpret the coefficient on this dummy as
reflecting the transfer of WIC sales from the loser to the winner. However, by allowing each
firm to have a separate dummy, we are allowing for different degrees of brand loyalty even
among WIC consumers. The separate WIC dummies for each brand could also be interpreted as
how differently the transition periods are handled by state agencies for different changes. That is,
some states might immediately enforce the change while some other states might enforce with a
lag or a non-compliance period.
For the winner’s share, the WIC dummy coefficient is positive and statistically
significantly different from zero at the 0.05 level for Mead and Carnation (though not Ross),
while the loser’s share coefficient is not statistically significantly different from zero. The net
effect is a large, instantaneous adjustment for when Mead wins. Figure 3 shows a simulation of
the average adjustment across stores in those states where Mead won the WIC contract. Before
the contract changes in its favor, Mead’s share is 15 percent and the share of the previous
contract holder, Ross, is 74 percent. Immediately after the change, Mead’s share shoots up 41
percentage points to 56 percent and Ross’s share drops by 42 percentage points to 32 percent.
Figure 4 shows a comparable result when Carnation wins.
However, as Figure 5 illustrate, Ross does not benefit from an instantaneous adjustment.
One possible explanation for the lack of a Ross effect is that we have relatively few stores (only
seven) in our sample in states where Ross won. We examined the data store by store. In two
large stores, we fail to see the discontinuous jump at the time of the contract change that we see
in virtually all other stores (possibly because they have relatively few WIC customers). Were we
to remove these two stores from our sample, we would observe a positive effect on the Ross
dummy coefficient similar to that of the other two firms.
22
Spillover Effect
We also hypothesize that non-WIC sales by the WIC contract winner will gradually
increase over time. To capture this spillover effect, we include a time trend measuring the
biweekly periods since the contract change. To allow for nonlinear adjustment, we use a
variable T, which is the natural log of the number of biweekly time periods in the period when
the contract changes plus one (to avoid taking the log of zero before the change). We
experimented with other nonlinear functional forms, such as a polynomial, and found similar
adjustment patterns.
To allow for the possibility of different adjustment rates over time, we also include two
interaction terms, where we interact T with two other possibly relevant variables. One is the
state birthrate relative to that in 1996. This interaction term allows for the possibility that the
rate of adjustment in the contract winner’s share might vary with an acceleration in birthrates
since the 1996 base year.
The other interaction variable is our proxy for grocery store size: the volume of milk
sales. It is possible that smaller stores allocate relatively large amounts of shelf space to the WIC
contract winner as WIC brands generate guaranteed revenue. Thus, we hypothesize that the
spillover effect is likely to be relatively large in small stores.
The T coefficients are statistically significantly positive for the winner’s share and
negative for the loser’s share. Consequently, the share of the winner rises and that of the loser
falls over time, as we would expect.
The interaction terms with birth rates are not statistically significantly different from zero.
The interaction term with the store size proxy is statistically significantly negative for the
winner’s share (but not for the loser’s share). This result is consistent with our prediction that

23
the spillover effect is greater in small stores where shelf space plays a more critical role than in
large stores.
Figures 3, 4, and 5 all are consistent with our prediction that the adjustment takes many
months and that the spillover effect is large. The figures show the simulated shares for 74 weeks
after the contract change, which is the maximum number of weeks observed after a change in our
sample. After the initial jump in market share for the winner, which we attribute to the shift in
WIC consumers, the market share of winner gradually increases.
For example, as we previously noted, immediately after it wins the contract, Mead’s
share jumps from 15 percent to 56 percent. Then, gradually over time, its share rises until it
reaches 82 percent after about year. Similarly, the share of the losing firm, Ross, initially falls
from 74 percent to 32 percent, and then gradually drops to less than a percent point share after a
year. The market share of the other brands is essentially unaffected by the WIC brand change.
We see qualitatively similar patterns, but larger spillover effects, in Figures 3 and 4, where
Carnation or Ross are the contract winners.
Conclusions
We examined the effects of the states’ sole-source WIC infant formula rebate program on
infant formula brand market shares. Each state (or small group of states) holds auctions for a
contract, which typically lasts for three years, to be the exclusive provider of WIC infant formula.
All three major infant formula manufacturers then compete for non-WIC customers at grocery
stores.
Traditionally, the behavior of the manufacturers has been explained using a standard
price discrimination story. We believe that such an explanation is incorrect. The traditional
price discrimination story cannot explain market shares and pricing in the infant formula market.

24
The three major manufacturers set their wholesale prices (which determine both the retail level
price and the size of the rebate that they provide to states) once a year at a national level. Thus,
firms cannot be price discriminating on a state-by-state basis. Moreover, we find that prices do
not change at the state level when the WIC contract changes hands.
Instead, we hypothesize that the firms want to win the WIC contract because it provides a
spillover effect in the retail market. We do not have data to identify the source of the spillover.
However, through conversations with the representatives of the manufacturers and casual
observations in grocery stores, we believe that shelf space plays an important roll. Grocery stores
provide relatively large amounts of shelf space to the WIC contract winner. Non-WIC customers
infer that the WIC brand is superior and are more likely to buy it.
Because data are not available by WIC and non-WIC customers, we use time to identify
the two effects when a firm wins the WIC contract. Immediately after a contract change, WIC
sales shift from the previous winner to the current winner. Then, slowly over time, the share of
the winner increases more. This adjustment takes time because existing customers stick to their
traditional brand, but new customers are more likely to buy the WIC contract winner brand.
Both casual empiricism and a statistical analysis produce results that are consistent with
our story. Immediately after a firm wins the WIC contract, its share jumps substantially (e.g., by
a quarter of the total market). Then, a gradual adjustment period occurs that may last the better
part of a year. Over this period, the WIC contract winner’s share increases by more—often by
much more than the initial jump. Because a typical WIC contract lasts three years, a contract
winner could enjoy two years of a dominant market share among the non-WIC consumers.
Consequently, firms are willing to place very low bids (e.g., 15 percent of the national wholesale
price) in an attempt to win the WIC contract. Thus, our theory can explain price differentials

25
between WIC and non-WIC prices that exceed those that would be observed if the firms price
discriminated.

26
References
Corts, Kenneth S. 1998. “Third-Degree Price Discrimination in Oligopoly: All-Out
Competition and Strategic Commitment,” Rand Journal of Economics, 29(2):306-323.
Oliveira, Victor, Prell, Mark, Smallwood, David, and Frazao, Elizabeth. 2004. “WIC and the
Retail Price of Infant Formula,” USDA ERS Research Report #39-1.
Oliveira, Victor, and Mark Prell. 2004. “Sharing the Economic Burden: Who Pays for WIC’s
Infant Formula?” Amber Waves,
www.ers.usda.gov/Amberwaves/september04/Features/infantformula.htm.
Post, J. E., and W. H. Wubbenhorst III. 1989. “Assessing the Infant Formula Rebate Initiative,”
Boston University School of Management, Apr. 1989.
Prell, M. 2005. “An Economic Model of WIC, the Infant Formula Rebate Program, and the
Retail Price of Infant Formula.” Food Assistance and Nutrition Research Report No.
(FANRR39-2) 39 pp, January 2005
U.S. Department of Agriculture, Food and Nutrition Service, Budget Division. Program Information Report (Keydata), U.S. Summary, March 2003. May 2003.
U.S. General Accounting Office. 1998. Food Assistance: Information on WIC Sole-Source
Rebates and Infant Formula Prices, Report to the Chairman, Committee on the Budget,
House of Representatives, GAO/RCED-98-146.
U.S. Government Accountability Office. 2006a. Breastfeeding: Some Strategies Used to Market
Infant Formula May Discourage Breastfeeding: State Contracts Should Better Protect
against Misuse of WIC Name, GAO-06-282.
U.S. Government Accountability Office. 2006b. Food Assistance: FNS Could Take Additional
Steps to Contain WIC Infant Formula Costs, GAO-06-380.

27
Table 1. Zip Code Demographics of the Stores in the Sample
No.
Stores Mean Std dev Min Max
U.S.
average
Median Age (years) 39 35.84 2.72 29.9 42.3 35.3
% Population under 5 years 39 6.97 0.93 5.4 9.8 6.8
% White 39 81.00 16.14 39.9 97.2 75.1
% Black 39 11.94 14.04 0.6 43.4 12.3
% Asian 39 1.76 1.21 0.4 5.8 3.6
% Hispanic or Latino 39 7.89 11.00 0.7 50.2 12.5
% High school graduate or higher 39 86.59 7.41 61.7 93.8 80.4
% Bachelor’s degree or higher 39 27.79 10.68 10.4 49.9 24.4
Average household size 39 2.50 0.16 2.31 2.86 2.59
Median household income in 1999 (dollars) 39 47477 9389 27369 67586 41994
% Families below poverty level 39 5.51 4.12 1.7 19.7 9.2
28
Table 2. Multinomial Logit Estimation
Winner’s Share Loser’s Share Constant -0.859
(0.287) 1.085
(0.214) Mead won the contract 1.220
(0.367) -0.318 (0.386)
Ross won the contract -0.281 (0.510)
0.018 (0.533)
Carnation won the contract 1.007 (0.352)
-0.082 (0.370)
T = Ln(biweekly intervals since WIC contract change + 1) 4.002 (1.468)
-1.204 (1.572)
T × State birth rate index -3.334 (1.405)
0.876 (1.493)
T × Milk sales -0.518 (0.138)
-0.159 (0.159)
Georgia 2.731 (0.393)
0.888 (0.345)
Missouri 0.252 (0.301)
0.140 (0.238)
Pennsylvania 2.746 (0.527)
1.341 (0.479)
Texas 0.792 (0.329)
0.947 (0.263)
Minnesota 1.329 (0.432)
1.092 (0.372)
Iowa 1.247 (0.332)
1.315 (0.267)
29
Figure 1. Brand Shares Before and After a WIC Contract Change
(a) WIC brand changed from Mead to Ross (7 stores in PA and GA)
0.000
20.000
40.000
60.000
80.000
100.000
-3 -2 -1 1 2 3 4 5 6 7 8 9 10
# months since the change
% sh
ares
winner's share loser's share other's share
(b) WIC brand changed from Ross to Mead (19 Stores in TX, MN, and IA)
0.000
20.000
40.000
60.000
80.000
100.000
-3 -2 -1 1 2 3 4 5 6 7 8 9 10
# months since the WIC change
% sh
ares
winner loser other

30
(c) WIC brand changed from Mead to Carnation (13 Stores in MO and FL)
0.000
20.000
40.000
60.000
80.000
100.000
-3 -2 -1 1 2 3 4 5 6 7 8 9 10
# months since the WIC change
% sh
ares
winner loser other
(d) WIC brand changed from Carnation to Mead (11 Stores in MO)
0.00010.00020.00030.00040.00050.00060.00070.00080.000
-3 -2 -1 1 2 3
# months since the WIC change
% sh
ares
winner loser other

31
Figure 2. Brand Average Prices Before and After a WIC contract change
(a) WIC brand changed from Mead to Ross (7 stores in PA and GA)
0
0.2
0.4
0.6
0.8
-3 -2 -1 1 2 3 4 5 6 7 8 9
# months since the WIC contract change
pric
e pe
r oun
ce ($
)
winner loser other
(b) WIC brand changed from Ross to Mead (19 Stores in TX, MN, and IA)
0
0.2
0.4
0.6
0.8
-3 -2 -1 1 2 3 4 5 6 7 8 9 10
# months since the WIC contract change
pric
e pe
r oun
ce ($
)
winner loser other

32
(c) WIC brand changed from Mead to Carnation (13 Stores in MO and FL)
0.55
0.6
0.65
0.7
0.75
0.8
-3 -2 -1 1 2 3 4 5 6 7 8 9 10
# months since WIC contract change
pric
e pe
r oun
ce ($
)
winner loser other
(d) WIC brand changed from Carnation to Mead (11 Stores in MO)

33
Figure 3. Sub-sample Average Powder Formula Monthly Volume
0
500
1000
1500
2000
2500
3000
3500
4000
4500
-3 -2 -1 1 2 3 4 5 6 7 8 9 10
# months since the WIC contract change
stor
e m
onth
ly v
olum
e (o
z)
sub-sample a sub-sample b sub-sample c sub-sample d

34
Figure 4. Simulation of Market Shares in a Typical Store when Mead is the Winner and
Ross is the Loser

35
Figure 5. Simulation of Market Shares in a Typical Store when Carnation is the Winner
and Mead is the Loser

36
Figure 6. Simulation of Market Shares in a Typical Store when Ross is the Winner and
Mead is the Loser