
What if the Shipyard Closed? - New Hampshire · What if … the Shipyard Closed? The economic...
28
What if … the Shipyard Closed? The economic impact of a Portsmouth Naval Shipyard closure on New Hampshire Published April 2005 Prepared by Peter S. Bartlett, Economist Annette Nielsen, Labor Market Analyst Economic and Labor Market Information Bureau New Hampshire Employment Security State of New Hampshire John H. Lynch, Governor New Hampshire Employment Security Richard S. Brothers, Commissioner Darrell L. Gates, Deputy Commissioner Economic and Labor Market Information Bureau George Nazer, Director Bruce DeMay, Assistant Director
Transcript of What if the Shipyard Closed? - New Hampshire · What if … the Shipyard Closed? The economic...

What if … the Shipyard Closed?The economic impact of aPortsmouth Naval Shipyard closureon New Hampshire
Published April 2005
Prepared byPeter S. Bartlett, EconomistAnnette Nielsen, Labor Market AnalystEconomic and Labor Market Information BureauNew Hampshire Employment Security
State of New HampshireJohn H. Lynch, Governor
New Hampshire Employment SecurityRichard S. Brothers, CommissionerDarrell L. Gates, Deputy Commissioner
Economic and Labor Market Information BureauGeorge Nazer, DirectorBruce DeMay, Assistant Director

Acknowledgments
The following New Hampshire Employment Security staff were instrumental in the preparation of this report:
Economic and Labor Market Information Bureau –Editing and modeling advice:Anita Josten, Research AnalystDjelloul Fourar-Laidi, Program Specialist
Cover Design and pre-press layout:Elisabeth Richardson, Program Assistant
Reproduction Services –Douglas Hamer, Supervisor of ReproductionScott Koblich, Digital Press Operator
Completion of this project would not have been possible without data and technical assistance provided by thefollowing organizations and individuals:
Department of the NavyPortsmouth Naval ShipyardPublic Affairs Office
Seacoast Shipyard Association
Regional Economic Models, Inc.Adam Cooper, Associate EconomistBilly Leung, Associate Economist / Consultant
Photographs courtesy of the Portsmouth Naval Shipyard Public Affairs Office
For further information contact:Peter S. Bartlett at (603) 228-4122, [email protected] Nielsen at (603) 229-4427, [email protected]
Economic and Labor Market Information BureauNew Hampshire Employment Security32 South Main StreetConcord, New Hampshire 03301

Table of Contents
Executive Summary .........................................................................................4
BackgroundPortsmouth Naval Shipyard and theBase Realignment And Closure Round Of 2005...........................................6
ModelingPotential Impact of a Closure of the Portsmouth Naval Shipyard................12
The Baseline ForecastThe Growth Projected Without a Portsmouth Naval Shipyard Closure .......16
Simulation ResultsDifference Between the Simulation and the Baseline Forecast...................17
AppendicesAppendix A.The New Hampshire REMI Policy Insight® Econometric Model .................22
Appendix B.Portsmouth Naval Shipyard Civilian OccupationsBy General Schedule Group/federal Wage SystemFamily On February 24, 2005 .....................................................................24
Appendix C.Portsmouth Naval Shipyard Civilian EmploymentBy Standard Occupational Classification (SOC) .........................................26

Executive SummaryThe fifth round of the Base Realignment and Closure (BRAC) Act is well underway, and everyone in theSeacoast Region of New Hampshire and in Southern Maine is concerned that the Portsmouth NavalShipyard might be included on the list to be released by the Secretary of Defense in mid-May. The Yardsurvived a closure order in the mid-sixties, as well as four rounds of BRAC. The area has not goneunscathed as Pease Air Force Base fell victim to the first round of BRAC. History has shown theshipyard’s ability to change its focus in order to be in alignment with the needs of the Navy. But it isbeyond our means to predict the outcome of the BRAC 2005 process.
The Shipyard has been an important economic player in the regional economy. It contributes more than4,800 civilian jobs and more than 800 military positions to the region. The total civilian payroll was$318,329,729; of which $122,635,908 was paid to New Hampshire residents. In addition the shipyardspent $5,817,322 on purchased goods and services in New Hampshire and Maine as well as $46,418,335on contracted facility services (utilities and maintenance/alteration/support).
The following analysis estimates the impact on New Hampshire alone, and, beyond the initial direct lossof military and civilian employment, does not include effects on Maine, the other state that would begreatly affected by a closure. The total regional effect would be a multiple of the effects, on NewHampshire alone, that are presented here.
Despite the name, Portsmouth Naval Shipyard, this shipyard is located in Kittery, Maine. Since most ofthe jobs are physically located in Maine (jobs by place of establishment), the closure of the Shipyardwould have an immediate direct effect on the number of jobs in Maine. However, 39 percent of itscivilian employees commute to the Shipyard from cities and towns in New Hampshire. The wages fromthese commuters are included in the New Hampshire economy, and the secondary effects following aclosure would significantly reduce jobs and income in New Hampshire.
Compared to the baseline forecasts in the New Hampshire Econometric Model, a closure of the PNSwould result in the following:
• A direct loss of 800 military positions and 27 civilian positions in New Hampshire. (The Departmentof Defense reports the military contingent of the yard as if it were in New Hampshire.)
• $122,635,908 in lost wages paid to PSN civilian employees residing in New Hampshire. Of theseNew Hampshire wages, 61 percent are from Strafford County and 33 percent are from RockinghamCounty. In 2004, New Hampshire residents held 1,878 civilian positions at PNS.
• 1,219 jobs lost in the secondary effects of a PNS closure. The secondary effects would be caused bya decrease in purchasing power (due to the loss of the PNS wages), the loss of expenditures on localgoods and services purchased by PNS, as well as the loss of facility services contracted by PNS.
• New Hampshire civilian jobs will remain at least 900 below the projected growth for the duration ofthe simulation, statewide.
• Gross Regional (or State) Product (GRP) in New Hampshire would fall $133.8 million below thebaseline in the first year and remain $128.7 million below the baseline by 2021.
• Wage and salary disbursements linked to secondary effect job declines in New Hampshire wouldinitially suffer losses of $71.5 million, expanding to a loss of $106.3 million by 2021.

• Wages in Strafford County would be hit the hardest. The average annual wage rate would be loweredby $123.51 in nominal dollars by 2010, the bottom of the trough. The effects on the average annualwage rate are smaller at the statewide level, but it would take New Hampshire until 2019 to get backto the pre-closing wage level.
• New Hampshire would lose $14.8 million in state and local revenues in the first year after closure,while state and local expenditures would be reduced by $4.4 million. This would result in a net lossof $10.4 million in state and local government finances.
• Sales, office and administrative occupations are the occupational group most affected by thesecondary effects of the closure. By 2021 only about half of the jobs lost would be recouped.
• By 2021 the State’s population will have shrunk by 3,780.
• Unemployment in New Hampshire would rise by at least 2,700 persons, with the unemployment raterising by about 0.5 percent. Since most of the unemployment would occur in the Portsmouth-Rochester area, that area’s unemployment rate would increase much more.
If the Portsmouth Naval Shipyard were to close, the opportunity for reemployment as skilled shipbuildingworkers in New Hampshire, and nearby Maine and Massachusetts, would be very limited.
The shipyard has a high concentration of workers in the following major occupational groups (StandardOccupational Code - SOC):
• 17-0000 Architecture and Engineering Occupations – 1,018 positions
• 51-0000 Production Occupations - 924 positions
• 49-0000 Installation, Maintenance, and Repair Occupations - 741 positions
• 47-0000 Construction and Extraction Occupations - 691 positions
This is especially a problem as the shipyard has a high concentration of employees in certain occupationsnot common in the region otherwise, such as Riggers, Nuclear engineers and Lay-out workers (metal).The impact of the PNS closure, at the personal level, would be quite devastating, as individuals may havedifficulties maintaining current income levels and finding jobs matching their skills. The average annualpay at the PNS is about $65,000, a wage level substantially higher than average 2003 annual pay for allprivate covered employment in New Hampshire or in Rockingham County. A large portion of theshipyard employees are either highly skilled or have attained a high level of education. If workers withhigh levels of educational attainment seek employment in other parts of the nation, the state will losevaluable human capital as these workers migrate from New Hampshire.
For the purpose of modeling we assumed that no other major employer would enter the region and absorbsome of the excess labor force. If that were to occur, the economy would tend to move back towardequilibrium. Depending on how much employment would be absorbed, the economy would recover,accordingly. In any case, the recovery period and jobs replacement would likely be a long and protractedone, especially in light of the slow recoveries experienced by other areas whose naval bases have alreadybeen closed.

BackgroundPortsmouth Naval Shipyard and theBase Realignment and Closure Round of 2005
The Portsmouth Naval Shipyard is in the history books as the place where the Treaty of Portsmouth,ending the Russo-Japanese War, was signed in 1905. Events are taking place this year celebrating the100th anniversary of that treaty. But in addition the Shipyard is currently drawing attention because of itspotential for closure under the 2005 round of the Base Realignment and Closure (BRAC) Act. Such aclosure would lead to the direct loss of more than 4,800 civilian jobs and more than 800 militarypositions. The Shipyard avoided closure in each of the four previous rounds of BRAC. On the contrary,nearby Pease Air Force Base, the other military facility that remained in the Portsmouth area at the end ofthe cold war, was one of the first bases to close under BRAC in 1990. The loss to the regional economyresulting from this 1990 closure was significant. The roughly 3,500 military personnel stationed at thePease Air Force Base were transferred to other bases around the nation and the world, but the purchasingpower of the military families and their availability to the local labor force was lost. Pease also employedabout 400 civilian employees. Of the base’s original 4,100 acres; 1,100 acres on Great Bay have been setaside as a wildlife refuge. Much of the remaining 3,000 acres, which include the 1,500 acre airportdistrict, have been successfully redeveloped, over the past 14 years, into a business and aviation industrialpark known as the Pease International Tradeport. An estimated 5,000 civilian jobs had been created byOctober 2004.
Shipyards, however, unlike other types of defense installations, typically employ thousands of skilledcivilians and relatively few military personnel. And the track record of civilian jobs regained fromclosures of naval shipyards and shipyard complexes under BRAC is not as positive. The PhiladelphiaNaval Shipyard was selected for closure in 1991’s BRAC II, and officially closed in 1996. It has onlyrecovered 34 percent of the more than 8,000 civilian jobs lost. The Long Beach Naval Shipyard inCalifornia, chosen for closure in 1995’s BRAC IV, lost 4,487 civilian jobs by September 1997, theofficial date of closure. That area has only regained 200 jobs since then. At the Charleston NavalComplex in South Carolina, which was selected in 1993’s BRAC III, more than 3,000 civilian jobs havebeen created since its official closing in 1996, but these jobs only represent about half the civilian jobsthat were lost.1
The BRAC 2005 ProcessThe decision making behind BRAC is a rather procedural two-year recommendation and approval processdesigned to downplay the role of local political interests. Each branch of the Department of Defenseconducts an internal deliberative process of information gathering and analysis, and no base closureinformation is to be released before May 16, 2005.
Unlike each of the previous rounds of BRAC, the 2005 round has a statutory requirement incorporated,making military value the primary consideration. (In the earlier rounds of BRAC military value wasconsidered a primary concern, but not a statutory requirement.) No set target has been made for thenumber of base closures, but the Department of Defense has estimated that the DOD’s overall excesscapacity is 24 percent.2 In perspective, the four previous BRAC rounds eliminated nearly 20 percent of 1 Military Base Closures: Updated Status of Prior Base Realignments and Closures (GAO-05-138, January 13, 2005). United States
Government Accountability Office. Accessed February 15, 2005 http://www.gao.gov/new.items/d05138.pdf
2 Report Required by Section 2912 of the Defense Base Closure and Realignment Act of 1990, as amended throughthe National Defense Authorization Act for Fiscal Year 2003, March 2004, Department of Defense.

the Department of Defense 1988 capacity. In other words an amount almost equal to what has alreadybeen eliminated in four rounds will be eliminated in this 2005 round.
The primary criteria for closure is that national security is not compromised. After that, all militaryinstallations are to be considered equally, no matter how hard an area was hit by any of the previousrounds of closures. In the post 9/11 era, national security connotes Homeland Security. In that respectPortsmouth Naval Shipyard has a role. Three U.S. Coast Guard cutters are located at the Yard.
Included under the criteria of Military value is the efficiency of the operations. The Portsmouth NavalShipyard claims a reputation as “America’s submarine maintenance expert” – the best performingshipyard in the country, public or private. However, the demand for submarine maintenance can bepredicted to go down as the Pentagon intends to decrease the size of the Navy’s submarine fleet from 55to 37.3 The Administration’s proposed FY 2006 defense budget also reduces the number of new navalvessels from six to four, including only one new submarine.4
As a state or region, we have limited influence on defining national security. But, among Otherconsiderations the Department of Defense evaluates when selecting military installations for closure, is“the economic impact on existing communities in the vicinity of military installations”. By using theNew Hampshire Econometric Model to perform a regional economic simulation, we are able to show theimpact that a closure of the Portsmouth Naval Shipyard would have on the economies of Rockingham andStrafford Counties as well as on the entire state of New Hampshire. This model estimates the impact onNew Hampshire alone. Beyond the initial direct loss of military and civilian employment, this study doesnot consider effects on Maine, the other state that would be greatly affected by a closure.
LocationDespite its name, Portsmouth Naval Shipyard, the Yard is in Kittery, Maine. It is located on SeaveyIsland in the Piscataqua River and connected to the mainland by two bridges to Kittery. Although locatedin Kittery, the main gate of the Shipyard is just 1.5 miles from downtown Portsmouth, New Hampshire.The Shipyard is also only about 13 miles from Dover, New Hampshire, and about 28 miles fromRochester, New Hampshire, the two largest cities in the vicinity of the Shipyard. Kittery, Portsmouth,Dover, and Rochester are all part of the Portsmouth-Rochester, NH-ME Primary Metropolitan StatisticalArea (PMSA), an interstate urban area with a population of 247,258 in 2003. This urban area was definedby the Office of Management and Budget (OMB) based on data about commuting patterns collected inthe 1990 Decennial Census. OMB has defined new metropolitan areas, based on the 2000 DecennialCensus, creating a Portsmouth, NH-ME Metropolitan NECTA (New England City and Town Area) and aRochester-Dover, NH-ME Metropolitan NECTA. We chose to use the 1990 PMSA to describe the areabecause it corresponds well to the 2004 patterns of commuting to the Shipyard (see map). Fifty-eightpercent of the Yard’s workers lived in the PMSA. The Portsmouth-Rochester PMSA definition is alsomore familiar to data users since data has only just started to be released, in 2005, using the new areadefinitions.
The Shipyard and Pease Airforce Base Following World War IIThe Portsmouth Naval Shipyard has been a key employer in the Portsmouth area since the Civil War.With the construction of its first submarine, the L8, in 1917, the Shipyard changed its focus fromconstruction of steamboats and sloops to submarines. World War II caused employment at PNS to reachan historic high of 20,466 civilian workers in 1943. From 1940 to 1945, 88 submarines were
3 Lenz, Ryan: Associated Press; Bases in Northeast prone to BRAC.
4 Kenny, Elizabeth: http://www.seacoastonline.com; Navy: Too soon to tell future of the shipyard.

commissioned from the Portsmouth Naval Shipyard. In comparison, the pre-war level was only about onesubmarine commissioned per year.
The Portsmouth Naval Shipyard has consistently been at the forefront in applying technology. In 1957the Shipyard launched the Skate class USS Swordfish, the first nuclear-powered submarine built by agovernment-owned shipyard. The Yard became the first facility in history to overhaul a nuclear-poweredship when the first nuclear-powered submarine, the Nautilus, was serviced in Kittery in 1959. Since thebase started building and overhauling nuclear-powered submarines its civilian employment level hasvaried between a high of 9,200 in 1962 to a low of 3,300 in 1998. In November 1969 the USS SandLance, the last submarine built in a public shipyard, was launched, ending a fifty-plus year PNSsubmarine construction era. Since then the Yard has specialized in the refueling and maintenance ofnuclear-powered submarines.
During World War II the U.S. Navy leased the Portsmouth Municipal Airport, which led to opening ofPortsmouth Air Force Base in 1957. The base was renamed Pease Air Force Base a year later.Geographically, Pease Air Force Base was located in Portsmouth and Newington. The military personneland their dependents who lived on or nearby the base, mostly in Portsmouth and Newington, weretherefore counted in the population of area communities. The increase in the population of thesecommunities from 1950 to 1960 can partly be attributed to the opening of the air force base. Likewise theclosure of the Pease Air Force Base in the early 1990’s led to a decrease in both Portsmouth’s andNewington’s populations as 3,400 active duty military personnel5 and their dependents left the area.
The unemployment rate in the Portsmouth-Rochester, NH-ME PMSA has in general been lower than theunemployment rates of the Granite state during the 1990s. Although only 400 civilians were laid off atPease, in combination with the decline in PNS employment (1,700) and the effect of the nationalrecession of 1990-1991, total employment in the New Hampshire portion of the Portsmouth-RochesterPMSA dropped by 6,300 from 1990 to 1992. At the same time the labor force in the New Hampshireportion of the Portsmouth-Rochester, NH-ME PMSA was reduced by about 5,100. This reduction in laborforce can be partly attributed to those military family members who had worked, or been seeking to work,in civilian jobs, but who left the area when the base closed. (Active military personnel would not becounted as part of the civilian labor force.)
During the first half of the 1990s the employment at PNS declined from more than 8,000 to just above4,000. As the economy started recovering from the 1991 recession and the high tech boom took off in theseacoast area, jobs lost at the PNS were offset by growth in other sectors of the economy. By the late1990s the PNS started to increase its employment, which has been growing steadily since 2001.
The Portsmouth-Rochester, NH-ME PMSA weathered the 2001 recession fairly well. AlthoughManufacturing lost a couple of thousand jobs, Government and Educational and health services eachamended a couple of thousand jobs.
The Federal government employment share in the Portsmouth-Rochester, NH-ME PMSA is higher thanthe New Hampshire statewide share of federal government employment. In most regional economies, themajority of federal government employment is US Postal workers. Federal government employment forthe Portsmouth-Rochester area makes up about a quarter of total government employment. In comparison,federal government employment for the whole state makes up less than ten percent of total governmentemployment. This higher share of federal employment in the PMSA is due in large part to the civilianemployment at the Portsmouth Naval Shipyard. (The federal share of government employment in
5 Pease ANGB 43°04’N 70°49’W, Global Security, http://www.globalsecurity.org/military/facility/pease.htm.

New Hampshire is not affected by employment at the Shipyard since that is counted as employment inMaine.) According to the Portsmouth Naval Shipyard, the shipyard and its tenant activities employ about4,800 civilians, thereby accounting for about three quarters of the federal government employment in thePortsmouth-Rochester, NH-ME PMSA. Making up about 39 percent of the Yard’s civilian workforce,2,008 New Hampshire residents commuted to the Yard in 2004, to 1,878 jobs (the balance representingturnover).
Government employment data is generally available by ownership rather than by work activity. If thePortsmouth Naval Shipyard were to be coded according to work activity, it would be included in the Shipbuilding and repairing industry (NAICS 336611). The 2003 covered employment data forNew Hampshire shows that on average 51 persons were employed in Boat building (NAICS 336612)under private ownership but none in the Ship building and repairing industry (NAICS 336611).
Bath Iron Works, a privately owned shipyard, is located in Maine, about 85 miles north of Kittery. Thisshipyard has approximately 6,4006 persons employed. Although privately owned, this shipyard primarilybuilds Guided Missile Destroyers under contract with the US Navy. This means that Bath Iron Works isunder the same threat of slowed contracts activity due to the Navy’s budget constraints.
Finally, covered employment data in Shipbuilding for Massachusetts shows average employment for2003 to be 183. So, if the Portsmouth Naval Shipyard were to be closed, the opportunity forreemployment as skilled shipbuilding workers in nearby Maine, Massachusetts, and New Hampshirewould be very limited.
Capacity and Occupational EmploymentToday, 95 percent of the activity at the PNS has to do with the overhauling of nuclear-poweredsubmarines. Currently three submarines of the Los Angeles class are stationed at the Shipyard,undergoing repair and refueling. Each submarine overhaul takes about two years.7 While a submarine isbeing overhauled at the Shipyard, its approximately 135 submarine crewmembers live at the Yard.Although the Los Angeles class submarine isn’t the newest generation of submarines (Virginia class), theU.S. Navy fleet consists mainly of this type of submarine and will continue to do so for at least the nextdecade. According to PNS, its three dry docks are capable of docking all active classes of submarinesincluding the Virginia and the Ohio classes. History has shown the Shipyard’s ability to change its focusin order to be in alignment with the needs of the Navy.
In addition, the base is host for several tenant activities such as a Naval medical clinic; the Coast Guard;and Submarine Maintenance Engineering, Planning, and Procurement (SUBMEPP). Another unit, relatedto the planning process and project cycle for maintenance and overhauling submarines called the NavalMaterial Quality Assessment Office (NMQAO), is located in downtown Portsmouth.
• The Naval Clinic employs 57 employees and serves as a primary care facility first for the military andcivilian personnel at the Yard, but is also available to retired military personnel in the New Englandregion.
• The Coast Guard has three cutters stationed at the Yard and employs approximately 295 militarypersonnel as crew and in support roles.
6 “General Dynamics Awarded $489 Million in Funding for Navy Destroyer”, News, November 16, 2004, Bath
Iron Works, A General Dynamics Company Quarterly Census of Employment and Wages Data from BLS is notavailable, even statewide for Maine, because of disclosure.
7 http://www.globalsecurity.org/military/facility/portsmouth_nsy.htm

• SUBMEPP employs 226 civilians, primarily engineers and technicians, who support submarine repairactivities worldwide.
• NMQAO employs 27 civilians and is part of the Naval Sea Systems Command (NAVSEA), aheadquarters component of the Department of the Navy. This unit was originally located at the Yardand performed work only for PNS. As the unit evolved, it became responsible for the developmentand administration of centralized quality assurance and assessment systems for NAVSEA.
Occupational Specialties of Civilian Employees at PNSThe economic impact, at the personal level, of a potential base closure would be quite devastating, asindividuals may have difficulties maintaining current income levels and finding jobs matching their skills.Maintenance and refueling of nuclear-powered submarines is highly specialized and requires a largenumber of engineers and technicians, as well as a large number of skilled tradespeople. Most of the workis very specifically related to submarines, one reason why the Yard’s training and apprenticeship programis crucial to making sure that the ‘PNS’s expertise’ or ‘Quality workmanship’ is kept intact as theworkforce reaches retirement. The average annual pay at the PNS is about $65,000, a wage levelsubstantially higher than the average 2003 annual pay for all private covered employment in NewHampshire ($37,700) or in Rockingham County ($38,000). But the average pay for PNS is in line withwages in Rockingham County for Machinery manufacturing ($60,200) and Computer and electronicproduct manufacturing ($67,300) — industries that, like PNS, require highly skilled labor.
If the Portsmouth Naval Shipyard were to close under BRAC, it would become the task of state andregional development authorities to try to replace those jobs. With data provided by the Shipyard onoccupational groups and families for 4,036 of the Shipyard’s civilian employees, it is possible to gaininsight into the occupations and the skills represented at the Yard.
Using a conversion table provided by the National Crosswalk Service Center between General Scheduleand Federal Wage Schedule codes and O*NET98 occupations, we were able to translate the PNSoccupational data to Standard Occupational Classification data. In some cases we also used the O-Netdatabase to get a more precise classification in the case of a very broad translation of code, such asGovernment Service Executives. The Shipyard has a high concentration of engineers and technicians. Themajor occupational group level shows that one out of four are employed in Architecture and engineeringoccupations. Within this group a little more than half are engineers and the rest are engineeringtechnicians. At the detailed occupational level, Mechanical engineering technicians are the largest singleoccupational group with 266 employed, followed by Mechanical engineers and Nuclear engineers with184 and 180 employees, respectively.
The second largest major occupational group at the Shipyard is Production occupations, with a littlebelow 1,000 employed in that field. At the detailed level, Helpers – production workers made up a quarterof this occupational group and Painters, transportation equipment was the second largest occupationalgroup with 152 employed. Machinist came in as the third largest occupation within Productionoccupations with 117 employed.
Combined, the Installation, maintenance and repair occupations and the Construction and extractionoccupations employed about a third of all the Shipyard workers. Among the Installation, maintenance andrepair occupations, Industrial machinery mechanics is the largest occupation employing 250 workers. Afairly large proportion (30 percent) of Construction and extraction workers is First-linesupervisors/managers of construction trades and extraction workers. Due to the code translation, theseFirst-line supervisors/managers should be interpreted more broadly than supervising just Construction andextraction workers. Electricians, and Plumbers, pipefitters, and steamfitters are the two other big

occupations within the Construction and extraction occupations group, employing 153 and 123,respectively.
By comparing the Shipyard occupational data with data from the November 2003 New HampshireOccupational Employment Statistics (OES) survey for the “Portsmouth, Dover, Rochester wage area”(which includes only the New Hampshire portion of the Portsmouth-Rochester PMSA and thus does notinclude PNS), we found that the Shipyard has a high concentration of employees in certain occupationsnot common in the New Hampshire portion of the area otherwise. Examples of such occupations areRiggers; Nuclear engineers; Lay-out workers; and Painters, transportation equipment.

ModelingPotential Impact of a Closure of the Portsmouth Naval Shipyard
This assessment of the potential economic impact of a closure of the Portsmouth Naval Shipyard onNew Hampshire under BRAC 2005 was carried out using the Economic and Labor Market InformationBureau’s New Hampshire 10-County Econometric Model8. Below is a discussion of the data used toestimate the direct impact of the closure scenarios and the assumptions that were made in modeling theclosure impacts.
For this study, the policy modeled is the closure of the Portsmouth Naval Shipyard. The impact isassessed relative to the expected growth (baseline forecast) in the region’s economy assuming no closureand growth as forecasted to 2021 by REMI.
Data and AssumptionThe information used to develop the policy inputs to model the Shipyard closing was provided by thePortsmouth Naval Shipyard, some directly and some indirectly. The data provided indirectly was gatheredfrom PNS by Seacoast Shipyard Association (SSA) and published in their “Portsmouth Naval Shipyard –Economic Impact” reports. Information provided included: 1) total military personnel and militarypayroll; 2) civilian payroll total and by place of residence; and, 3) total non-payroll contracts andexpenditures. The information was for calendar year 2004.
BRAC is not an instantaneous process. Once a base is designated to be closed, several years may elapsebefore the closure is complete. This presents the first challenge which must be resolved in the modelingprocess, how to reflect the timing of the impact of a closure. This study takes the approach that theobjective of the analysis is to identify the economic importance of the Yard. This is best accomplished byassuming that closure occurs instantaneously, that all expenditures associated with the Yard’s operationand payroll cease at once. Since the data provided was based on 2004, the study simulates the closure as ifit occurred on December 31, 2004.
Second, in previous rounds of BRAC, communities with significant economic impacts from closures wereprovided with Federal redevelopment funds. It may be that similar assistance will be provided as part ofthe 2005 BRAC, however the timing as to when such support might be available and the amount of thesupport which may be provided are completely unknown. Therefore, for this study it was assumed thatthere would be no offsetting injections of Federal redevelopment funds to replace the lost militaryexpenditures.
Third, in most cases the military facilities closed as part of the previous BRACs were offered for sale,though shipyards have been less likely to be completely turned over to private use. Communities wereencouraged to prepare base re-use plans and to systematically market the base infrastructure forcommunity-wide economic development. In the present round, it is unclear if facilities will be offered forsale and re-use. Some discussion has focused on the need to retain some capacity to provide flexibility infuture military options. Further, even if bases are offered for sale and re-use again, one is confronted withthe problem of speculating as to when and what type of re-use may occur. To avoid such long-rangespeculative assumptions, this study assumes no re-use of the facilities.
8 The New Hampshire 10-County Econometric Model is a REMI Policy Insight® model, a product of Regional
Economic Models, Inc. of Amherst, MA (see Appendix A).

Simulating the Effects of a PNS Closure on New HampshireUsing the New Hampshire 10-county Model
Simulating a possible PNS closure offered some challenges. In an ordinary facility closure simulation,removal of the facility’s employment is straight-forward. But in this case, the baseline employment data9,on which the model’s control forecasts are based, does not include the Yard’s approximately 4,800civilian jobs, because it is a New Hampshire model and the jobs are physically located in Maine. So it isnot possible to remove jobs that do not exist.
The military employment data, however, comes from U.S. Department of Defense sources. The DefenseDepartment reports the military contingent of the yard as if it were in New Hampshire.
The simulation was done in four stages:
Stage 1The first stage of the simulation was to remove the New Hampshire wages by the county of residence.There is not a loss of 4,800 jobs in New Hampshire, but we can anticipate a rather substantial loss ofwages paid to New Hampshire residents. The SSA’s “Economic Impact��– 2004” provided informationabout wages paid in 2004. The total of wages paid to civilians working at the yard was $318.3 million.Civilian workers residing in New Hampshire received $122.6 million in wages, $185.5 million went toMaine civilians, and $7.3 million to Massachusetts residents. “Economic Impact – 2004” providedinformation about wages paid by city or town of residence. This we aggregated by county to produce theinformation in the table above. This information was input into the model to yield the impact of the lossof these wages on the economies of New Hampshire and its counties. The wages were removed as a fixedamount for the entire period of the simulation. The assumption is made that no other employer oremployers will come forward to replace these wages. Therefore, for the duration of the simulation, theresults will not return to equilibrium (the baseline forecast).10
The model responded to this loss of purchasing power in the six New Hampshire counties by reducingemployment, the labor force, and population. We recognize that a significant portion of the civilianworkers are old enough and have sufficient longevity to be offered retirement options. If the Yard hadclosed in February 2005, nearly 13 percent of the civilian employees would have been eligible for fullretirement and another 33 percent would be eligible for a pension under early retirement provisions.Acknowledging that most of these laid off workers with pensions would have attachments to the area andwould want to stay, we retained them in the area. Those with full retirement eligibility we retained in theirhome counties as “retirement migrants” and those with early retirement eligibility we retained as“economic migrants”. We reasoned that those early retirees will remain in the labor force finding jobs tosupplement their pensions until they reach full retirement age. We also estimated the amount ofpensions11 that would be paid to these early retirees still in the labor force and modeled this amount as anaddition to transfer payments in their counties of residence.
9 U.S. Department of Commerce, Bureau of Economic Analysis, Regional Economic Accounts; and U.S.
Department of Labor, Bureau of Labor Statistics, Quarterly Census of Employment and Wages.
10 REMI Policy Insight® is a long-term equilibrium model.
11 The value of transfer money received by migrating early retirees was based on a formula from the FERS website(1 percent of your high-3 average pay times years of creditable service - converted to average pay times 22.5years, which is the average of 20 years of service and 50 years old and 25 years of service and any age) which wasapplied to the 2004 New Hampshire PNS wages by county.

Stage 2In the second stage, we accounted for the military employment. The table on page 18, shows the militaryemployment of the Shipyard and its tenant activities in 2004. Our New Hampshire model contains themilitary employment because the defense department reports it as being in Portsmouth. Therefore, it ispossible to model its loss by reducing the military employment in Rockingham County. We did not thinkthat it was reasonable to remove employment representing the entire amount, however, because it isphysically located in Maine. A share of its impact belongs in Maine. In general, military personnel tend todo most of their spending on base.
We reasoned that the spending they do off base is likely to be nearby and for Retail trade purchases andon Accommodation and food services such as in Eating and drinking establishments. There are sevencommunities within a seven mile radius of the center of Kittery: the Maine towns of Kittery, Eliot, andYork and in New Hampshire the city of Portsmouth and towns of Newington, New Castle, and Rye. InRetail trade and Accommodation and food service combined, economic activity, as measured by jobs incovered employment, about 70 percent of the jobs are in the four New Hampshire communities. Most ofthis activity is in the City of Portsmouth, itself, a destination in the region for entertainment, fine dining,and cultural attractions (including the Albacore the last non-nuclear U.S. Navy submarine12). We modeledthe loss of military employment in New Hampshire by using 70 percent of the total 893 militaryemployment at the Yard. We converted that amount into a share of the existing military employment inRockingham County, and removed that share for the period of the simulation.
Stage 3In the third stage of the simulation, we removed the 27 civilian employees of the Naval Sea SystemsCommand Detachment who are physically located in the Federal Building in downtown Portsmouth.Since their activity is directly connected to submarine operations, it seems unlikely that they wouldremain behind should the Shipyard close. We adjusted the wages because the average pay for NAVSEAemployees in 2004 was $76,292.
Stage 4In the fourth stage, we incorporated information published by the Seacoast Shipyard Association aboutthe Yard’s spending patterns in New Hampshire. Of the $49,469,785 spent by the Shipyard’s supplydepartment in 2004 for purchased goods and services; $3,552,392 went to New Hampshire firms. This ismore than 50 percent greater than what was spent in Maine. Connecticut firms13 dominated this spending(at $18,203,736). We modeled the New Hampshire spending, apportioning it by industry, as if were spentby a private Ship and boat building firm, based on industry averages in the REMI control forecast.14
In the second part of stage four, we modeled the spending on contracted facility services by the Yard’spublic works department. The Seacoast Shipyard Association published this amount as $46,469,785 butdid not break it out by state. We were able to obtain some information on contracts with New Hampshirefirms from the Shipyard and some from defense department web sites, but it was incomplete. Of the totalof $46,418,335, a little over $14 million was spent on utilities (natural gas, fuel oil, sewer, electricity,
12 Though built on Seavey Island, the Albacore now rests on dry ground in Portsmouth as a museum, certainly a
must-see for Navy personnel and their children.
13 Presumably much of this went to submarine manufacturer Electric Boat Company, in Groton CT and its suppliersand contractors.
14 National input/output tables for each industry are imbedded in the Model.

communications). This, we reasoned, would most likely be spent in Maine, so we did not model it. Theremainder was spent on maintenance, alterations, and support. To apportion this spending toNew Hampshire, we made the assumption that the bulk on this spending would involve contractorsnearest to PNS. We drew a 30-mile radius from Seavey Island selecting those towns whose geographiccentroid fell within the circle and used private covered employment within those towns as a measure ofeconomic activity. Within the circle, 60 percent of the private employment was in New Hampshire citiesand towns, 23 percent was in Massachusetts, and 17 percent was in Maine. We then used 60 percent ofthe $32,261,052 total to model the Yard’s spending on maintenance, alterations, and support. Since thisspending represented expenditures required to maintain the physical plant, and we had already taken careof the production-related spending in the first part of stage 4, we distributed it as if it were spent tosupport a military base, using the industry averages in the REMI New Hampshire control forecast formilitary employment.

The Baseline ForecastThe Growth Projected Without a Portsmouth Naval Shipyard Closure
Gross Regional (or State) Product (GRP) is the value of all goods and services produced by NewHampshire’s economy, annually. In real 2004 dollars, it is expected to increase from $57.2 billion in 2004to $114.6 billion in 2021. GRP in real terms, over the 17 year period between 2004 and 2021, is expectedto increase by 100.2 percent. The GRP for Rockingham County is expected to increase by 133.1 percentover the 2004 to 2021 period. Total GRP for Rockingham County will reach an estimated $28.2 billion inreal 2004 dollars and will represent 30 percent of New Hampshire’s Gross State (Regional) Product.Strafford County’s GRP will grow 64.9 percent to reach $5.1 billion in 2021.
Growth in GRP will result in growth in employment and population.15 Total employment for the state isexpected to exceed 953,000 in 2021, an increase of almost 18 percent. Rockingham County’semployment is expected to increase by more than 21 percent to 222,000. Strafford’s is expected toincrease by almost 15 percent to nearly 69,000. Together the two counties will account for just over 30percent of the state’s jobs in 2021.
Population in the state, without the closure of the Shipyard, is expected to increase by more than a quartermillion from 1.309 million in 2004 to 1.565 in 2021. This is a 19.5 percent increase in 17 years. Thirtypercent of this growth will be in Rockingham County which is projected to gain 66,654 people, a22 percent increase from a population of 299,480 in 2004 to 366,134 in 2020. Strafford’s is projected togrow considerably slower than the state rate at 14.8 percent.
Rockingham County Has Two Economic PolesThe growth of Rockingham County in recent years, however, has largely taken place away from thecommuting area for the Yard. Between the 1980 and the 2000 census, the 10 towns in the Southwesterncorner of the county, covering a combined area of 237.4 square miles have grown by 58 percent from84,978 to 133,917, while the 18 communities in the Northeastern corner, closest to Portsmouth, covering237.6 square miles, have grown from 82,969 to 103,154 – just 24 percent. In the 1970 Census thepopulation of this Northeastern part of Rockingham County was 25 percent larger than the Southwesternpart. During that same period, the state’s population grew by 40 percent and Strafford County by21 percent. The city of Portsmouth’s population declined by 19 percent during that period. In fact,Portsmouth’s population has declined in every Decennial Census since 1970. During the same period,Portsmouth’s private employment has increased by 100 percent while the state’s private employmentincreased 61 percent, Rockingham County’s by 108 and Strafford’s by 40 percent.
IncomePer capita personal income, median household income, and housing costs in the Portsmouth-RochesterPMSA are higher than for the state as a whole, suggesting that living expenses in the seacoast area arehigher than in other parts of New Hampshire. According to the baseline forecast, Rockingham County’spersonal income per capita in 2004 is $51,831 while Strafford’s is $38,009. This compares to $45,288 forNew Hampshire and $40,861 for the U.S.
15 Increases in population are both caused by and the cause of economic growth.
Simulation ResultsDifference Between the Simulation and the Baseline Forecast
To gage the impact of the economic shock created by our simulation of the Portsmouth Naval Shipyardclosing, we compare the results of our REMI model simulation to the previously established “control”forecasts of the economies of New Hampshire’s ten counties. Comparisons show that the closure of theYard generally produces negative results in almost every economic measure. It is important to rememberthat these losses do not mean that the economy will show negative growth. Rather the losses that we willdiscuss are relative to the control forecast. The economy will continue to grow, but by a reduced amountrepresented by the differences between the control forecast and the Shipyard closure simulation.
Total Job LossesThe closure simulation, which was run as if the Portsmouth Naval Shipyard had ceased to exist onDecember 31, 2004, had its largest impact on employment in 2005. Statewide, compared to the forecast,2005 shows a deficit of nearly 1,900 jobs. Rockingham County suffers the largest number of job losses.This results from the direct effects of the loss of the New Hampshire share of the Yard’s militaryemployees (all apportioned to Rockingham County) and the loss of 27 civilian jobs in the Naval SeaSystems Command Detachment. These direct effects are compounded by secondary effects resulting fromthe disappearance of the purchasing power of their wages and wages of the Yard’s civilian employeeswho commute from homes in the county.
Total Civilian Job Losses - Secondary EffectAll of the New Hampshire civilian jobs lost, except for the 27 at the Naval Systems Command indowntown Portsmouth, result from the secondary effects of the loss of the purchasing power of the lostwages. In simulating the closing, we were not able to directly remove the Yard’s civilian employmentsince this employment is not counted in New�Hampshire. Instead, we removed wages received byNew Hampshire residents, who worked at the yard in 2004, apportioned by the counties in which theylived. When wages are removed from the economy, purchases of goods and services are curtailed, leadingto layoffs in the industries that provide those goods and services. Businesses that rely heavily on theYard’s employees as customers may have to close or scale back their operations. A share of the laid-offworkers may move away with their dependents, to seek employment, reducing the population. Thedeparture of migrants that are of childbearing age reduces the area’s potential for natural increase (birthsminus deaths). The population losses lead to further slackening of demand for goods and services.
The direct loss of the Yard’s civilian wages weighed more heavily on Strafford County since 60 percentof the Yard’s New Hampshire civilian wages went to workers commuting from there. In RockinghamCounty, the loss of the wages of military families and its proportionately larger share of the PNS’spurchases of goods and services due to close proximity to the Yard, made the total loss of jobs larger thanin Strafford. Civilian employment in both counties starts to recover slowly. In Rockingham, the gainsflatten out. Stafford County’s small gains in the first five years turn to losses by 2010. Since the Yard’scivilian wages were removed for the duration of the simulation, employment cannot recover to the levelsforecasted in the control. Eventually the losses will flatten and civilian job growth will occur at the samerate as projected. Civilian job counts will remain more than 900 below the baseline, statewide, for theduration of the simulation. The level will not return to equilibrium. This is because the simulation doesnot assume that another large employer would step in to replace those wages. Though state and localdevelopment officials will strive to replace these wages, the possibility of this happening was not modeledsince the outcome of their efforts is unknowable.

The Effect on Unemployment in New HampshireThe New Hampshire Econometric Model does not estimate changes in unemployment levels. However,based on the changes in employment at the PNS and the secondary job losses predicted for NewHampshire, we can deduce a change in unemployment.
Unemployment is based on place of residence. It is important to note that even though the elimination ofjobs at PNS is not a direct job loss to New Hampshire, it would have a direct effect on the 1,878New Hampshire residents working at the Shipyard as civilian employees. About 240 of them are eligiblefor full federal retirement, and they may leave the labor force and not seek further employment. Thiswould leave about 1,600 of the Shipyard employees from New Hampshire unemployed, in the short run,because of the direct job loss at PNS. In addition; 1,246 jobs in New Hampshire would be lost due tosecondary effects in the first year after the PNS closure. According to Census 2000 commuting patterns,six percent of workers in Rockingham County commute from Maine, close to ten percent of workers inStrafford County commute from Maine, and less than one percent of the workers in the rest of NewHampshire commute to work from Maine. Therefore, we assume that about 1,100 of these jobs lost inNew Hampshire would be held by New Hampshire residents.
In total, then, the number of unemployed in New Hampshire would increase by 2,700 in the year afterclosure. [This is the sum of the 1,600 New Hampshire residents who would lose jobs at the Yard (and beunable to retire) and 1,100 New Hampshire residents losing jobs in New Hampshire as secondary effectstake hold.] This would, in the short term, increase the unemployment rate in New Hampshire by0.5 percent, using the 2004 annual average labor force as the base.
The Yard closure would also cause secondary job losses in Maine. These losses would be larger than thedeclines in New Hampshire because of the greater share of Shipyard civilian wages paid to Maineresidents. As secondary job losses occur in Maine, additional New Hampshire workers would becomeunemployed because they commuted to those jobs. The New Hampshire Econometric Model is notdesigned to capture the effects of jobs lost in Maine and how they impact New Hampshire residents.What we can conclude, however, is that the unemployment rate, especially in the Portsmouth-Rochesterarea, would be driven yet higher.
Industry EmploymentAt the outset, the industries most susceptible to the secondary effects of the disappearance of thepurchasing power of the Yard’s wages are those where people are most likely to spend their disposableincome. Retail trade initially has the greatest losses, dropping more than 300 jobs statewide in 2005.Next, Accommodation and food service loses almost 150 jobs. Construction follows a somewhat differentpattern from other industries. This pattern likely reflects the loss of purchases/contracts by the Yard itselfin the first year. In the second year the loss of residents’ ability to purchase new homes or repairs drivesconstruction employment still lower. Then it begins a slow climb back toward equilibrium for theremainder of the forecast period.
Projected negative population differences have long term implications for several industries. Employmentin local and state government continues to fall, relative to the control forecast, throughout the period ofthe simulation. By 2009 local and state government employment losses increase at a faster rate as thepopulation starts migrating away. Healthcare and social assistance, Administrative and waste services,and Professional and technical services turn upward toward the control forecast after the initial shock, butby the end of the period are trending downward.

Occupational EmploymentThough the initial reduction in jobs occurs in Maine where the Shipyard is officially located, this directloss of jobs was modeled by removing the wages received by New Hampshire residents working at thePNS. Because the New Hampshire Econometric Model is not a multi-state model, events occurringoutside the state cannot be modeled directly. Most of the New Hampshire job losses resulting fromsimulating the closure of the Shipyard are from the secondary effects of the closure. These job losses aredue to a decrease in consumer spending and a reduced need for health and educational services as thepopulation diminishes. In order to get a full picture of what kind of excess skilled workforce will beavailable in the area as a consequence of the closure of the Shipyard, the occupational detail of the jobscurrently occupied at PNS is described under the section Occupational specialties above.
Statewide, the model’s occupational group most affected by the closure of the Shipyard would be Sales,office and administrative occupations. Sales, office and administrative occupations are hit hard from thestarting point with a job loss of 401 in 2005. The drop is due to a decline in consumer spending (becauseof the drop in income), and a decline in the immediate demand by the Shipyard (goods and servicespurchased by PNS). In general, it is also a very large occupational group with a large presence amongmany industries. By 2021 less than half of the lost jobs would be recouped. As the long term effects aredriven by population growth, and jobs in these occupations will not recover. Food preparation and servingrelated occupations are also hit hard with a loss of 150 jobs statewide in 2005. These losses are due to adecline in consumer spending reflecting a decrease in per capita personal income.
Job losses in Construction and extraction occupations are 101 in 2005, and worsen to 130 in 2007 beforethe group starts to recover. By 2021 job losses have diminished to 78. These job losses respond both to adecrease in personal income as well as a decrease in population. A decline in population lessens the needfor housing, and the demand for new construction would be down. Remodeling of existing homes wouldrespond to a decline in disposable personal income.
Both Healthcare occupations and Education, training and library occupations are driven by the size of thepopulation. When the population contracts, demand for occupations related to primary education andprimary health care diminishes. In stage (three) of the simulation process, some of the lost wages weremigrated back into the regional economy to represent retirees who remain in the area. This is the reasonwhy the healthcare occupations are recovering from a loss in 2005 of 50 jobs to a loss of 27 jobs in 2009and then starts increasing the job losses more permanently. By 2021 the healthcare occupations are 71fewer than if the PNS had not closed. As the population declines faster by 2009, jobs in Education,training, and library occupations decline at a faster rate as well.
Demand for Goods and Services and Gross Regional ProductThe Portsmouth Naval Shipyard closure simulation reduces the final demand for goods and services inNew Hampshire in 2005 by $197.3 million. Some of these losses are exported to other economies asimports from the rest of the U.S. fall by $95.4 million and imports from foreign countries fall by $0.3million.
New Hampshire’s Gross Regional (or State) Product (GRP) falls $133.8 million below the baseline in thefirst year. It does not recover to the baseline forecast levels through the simulation period.
WagesIn the event of the closure of the Portsmouth Naval Shipyard, losses in total wage and salarydisbursements for New Hampshire would initially be $71.5 million. This loss would expand to $106.3million by 2021. This amount is in nominal dollars, and the increasing loss over time is partly due toinflation. The Retail trade industry suffers the biggest losses in wage and salary disbursement, followed
by losses in Construction. A fifth of the losses in private nonfarm wage and salary disbursement is inRetail trade and another ten percent of the losses are in Construction.
Employees in Strafford County would be hardest hit. Their average annual wage rate would be loweredby $123.51 in nominal dollars by 2010, the bottom of the trough. The closing’s effect on the averageannual wage rate is smaller at the statewide level, but it is interesting to note, it would still take the stateuntil 2019 to get back to the pre-closing wage level. In the short-term, the average annual wage rate isactually higher in 2005 for both Rockingham and Strafford counties, and for New Hampshire as a whole,and would remain higher for Rockingham County in 2006. The reason is that, when Militaryemployment was taken out, most of the jobs lost were in retail. Both are segments of the economy with alower than the average wage rate, and by eliminating these jobs the average of the remaining jobs will seean increase.
IncomeLosses in per capita real personal income and per capita real disposable personal income follow a verysimilar pattern, with slightly bigger losses in per capita real personal income. Strafford County is hit thehardest by the closure of PNS with an immediate economic impact in 2005 of $426 fixed 1996 dollars inper capita real personal income and $358 fixed 1996 dollars in per capita real disposable personal income.[The Econometric Model uses 1996 as a baseline for income figures; $1 in 1996 had approximately thesame purchasing power as $1.22 in 2005. Therefore, $426 in fixed 1996 dollars would translate intoabout $521 in current 2005 dollars; $358 in fixed 1996 dollars would translate into about $438 in current2005 dollars.]
As more people move away from the area due to lack of employment, per capita personal incomegradually begins to recover. This rising per capita personal income happens despite a decline in totalpersonal income because there is a smaller population over which to spread the total income. It wouldtake until 2017 for per capita real personal income in Strafford County to recover enough to be at thelevel it would reach if the Yard were not closed. New Hampshire’s per capita real personal income andper capita real disposable personal income are negatively affected by $77 and $68, respectively, in 2005,but it will take the state until 2021 to reach the same income level in fixed dollars in the case if the Yardwere not closed. Per capita real personal income in Rockingham County follows the same pattern as thestate, just starting with a loss of $150 in fixed 1996 dollars in 2005 and with a loss of $58 in fixed 1996dollars by 2021. Rockingham County suffers long-term declines in per capita real personal income andper capita real disposable income, compared to the levels attained if the Yard does not close.
Population and Labor ForcePopulation and labor force both continue to decline relative to the control forecast throughout the periodof the simulation. The sudden loss in the wages of commuters plus the loss of military personnel and theirdependents has an immediate sharp impact on population levels. The labor force impact does not occur asrapidly. It builds as the secondary effects of the economic shock churn through the economy. Ultimately,the loss of population exceeds the labor force considerably since members of the labor force who moveaway take dependents with them.
State and Local Revenues and ExpendituresAccording to the REMI New Hampshire Econometric Model baseline, close to 60 percent of localrevenues in New Hampshire come from property taxes and another 22 percent come from Stateintergovernmental funds. At first, losses in local revenues are driven by losses in Other charges andrevenues, but by 2008 losses are primarily driven by losses in property taxes.

A majority of the local expenditures are used to fund elementary and secondary education (includinglibraries), and another ten percent fund the police, fire and corrections. Declines in expenditures areapportioned in line with the level of spending. In general, both local revenues and expenditures are drivenby the size of the population. Likewise drops in revenues are primarily from the loss of property taxes,drops in expenditures are from lower spending on education and other public services. This explains whydeclines in local revenues statewide are smaller than declines in local expenditures by 2016. In StraffordCounty drops in local revenues are smaller than declines in local expenditures by 2010. In other words,more money is spent on education and other local services than is collected in property and other localtaxes, compared to the baseline.
The difference between state revenues and expenditures more than makes up for the deficit in localfinances both in Strafford County and Statewide. Most of the state revenues come from federalintergovernmental, other charges and revenues, and employee retirement. The rest of the revenues arefrom varying sources like corporate income tax, education charges, and other sales tax. Most of the lossesin revenues in 2005 are from other charges and revenues and employee retirement, but by 2013 federalintergovernmental revenue carries the largest share of the losses.
A quarter of the State’s expenditures is used to fund intergovernmental expenditures and another 17percent is spent to fund higher education. With the closure of the Shipyard, state expenditures on welfareand insurance trust are higher compared to the baseline until 2012, thereby offsetting other drops in Stateexpenditures by about a million dollars in the first year after closure.
Appendix A.The REMI Model 16
REMI Policy Insight® is a structural model, meaning that it clearly includes cause-and-effect relationships. Themodel is based on two key underlying assumptions from mainstream economic theory: households maximize utilityand producers maximize profits. Since these assumptions make sense to most people, lay people as well as trainedeconomists can understand the model.
In the model, businesses produce goods to sell locally to other firms, consumers, investors, and governments, andfrom purchasers outside the region. The output is produced using labor, capital, fuel, and intermediate inputs. Thedemand, per unit of output, for labor, capital, and fuel depends on their relative costs, since an increase in the priceof any one of these inputs leads to substitution away from that input to other inputs. The supply of labor in the modeldepends on the number of people in the population and the proportion of those people who participate in the laborforce. Economic migration affects the population size. People will move into an area if the real after-tax wage ratesor the likelihood of being employed increases in a region.
Supply and demand for labor determine the wage rates in the model. These wage rates, along with other prices andproductivity, determine the cost of doing business for each industry in the model. An increase in the cost of doingbusiness causes either an increase in prices or a cut in profits, depending on the market for the product. In eithercase, an increase in costs would decrease the share of the local and U.S. market supplied by local firms. This marketshare, combined with the demand described above, determines the amount of local output. Of course, the model hasmany other feedbacks. For example, changes in wages and employment impact income and consumption, whileeconomic expansion changes investment, and population growth impacts government spending.
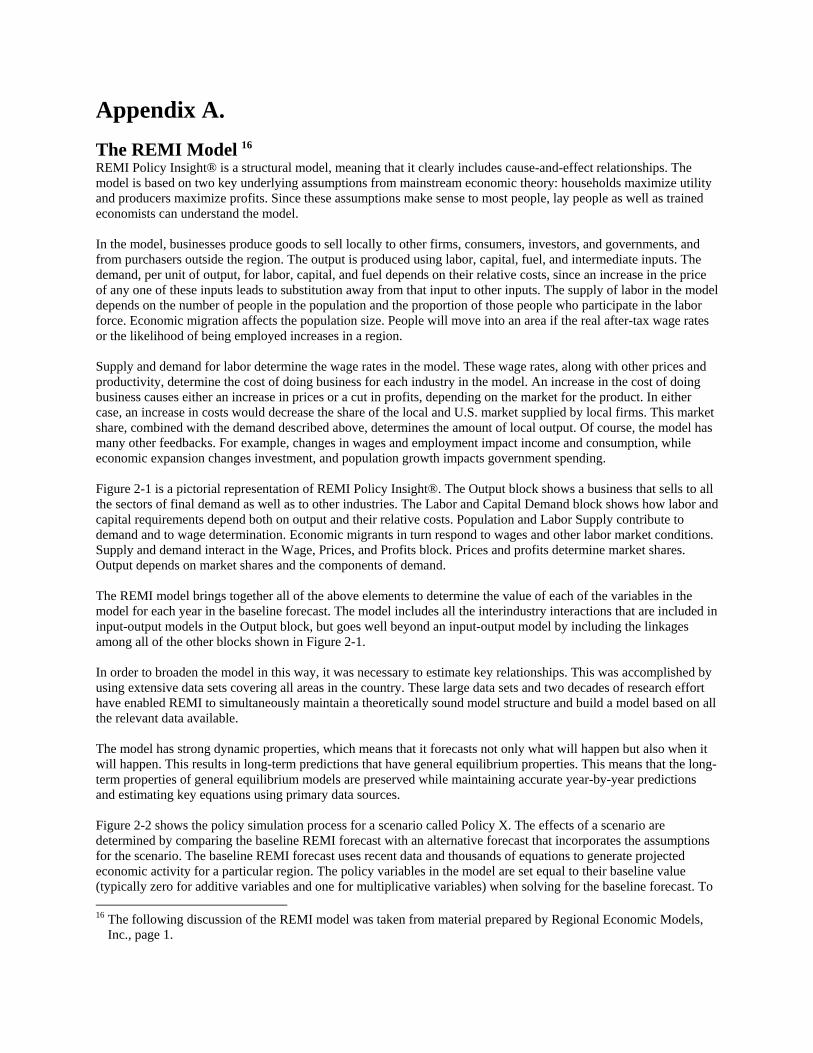
Figure 2-1 is a pictorial representation of REMI Policy Insight®. The Output block shows a business that sells to allthe sectors of final demand as well as to other industries. The Labor and Capital Demand block shows how labor andcapital requirements depend both on output and their relative costs. Population and Labor Supply contribute todemand and to wage determination. Economic migrants in turn respond to wages and other labor market conditions.Supply and demand interact in the Wage, Prices, and Profits block. Prices and profits determine market shares.Output depends on market shares and the components of demand.
The REMI model brings together all of the above elements to determine the value of each of the variables in themodel for each year in the baseline forecast. The model includes all the interindustry interactions that are included ininput-output models in the Output block, but goes well beyond an input-output model by including the linkagesamong all of the other blocks shown in Figure 2-1.
In order to broaden the model in this way, it was necessary to estimate key relationships. This was accomplished byusing extensive data sets covering all areas in the country. These large data sets and two decades of research efforthave enabled REMI to simultaneously maintain a theoretically sound model structure and build a model based on allthe relevant data available.
The model has strong dynamic properties, which means that it forecasts not only what will happen but also when itwill happen. This results in long-term predictions that have general equilibrium properties. This means that the long-term properties of general equilibrium models are preserved while maintaining accurate year-by-year predictionsand estimating key equations using primary data sources.
Figure 2-2 shows the policy simulation process for a scenario called Policy X. The effects of a scenario aredetermined by comparing the baseline REMI forecast with an alternative forecast that incorporates the assumptionsfor the scenario. The baseline REMI forecast uses recent data and thousands of equations to generate projectedeconomic activity for a particular region. The policy variables in the model are set equal to their baseline value(typically zero for additive variables and one for multiplicative variables) when solving for the baseline forecast. To 16 The following discussion of the REMI model was taken from material prepared by Regional Economic Models,
Inc., page 1.

show the effects of a given scenario, these policy variables are given values that represent the direct effects of thescenario. The alternative forecast is generated using these policy variable inputs.
Figure 2-2 shows how this process would work for a policy change called Policy X.
Figure 2-2 Policy X ScenarioFor this study, the Policy X is the closure of the Portsmouth Naval Shipyard. The impact is assessed relative to theexpected growth in the region’s economy assuming no closure and growth as forecasted to 2021 by REMI.

Appendix B.Portsmouth Naval Shipyard Civilian Occupations by General ScheduleGroup/Federal Wage System Family on February 24, 2005
General ScheduleNumber Occupation Family/Group NumberGS-0800 Engineering And Architecture Group 1,008GS-1600 Equipment, Facilities, And Services Group 199GS-0300 General Administrative, Clerical, and Office Services Group 132GS-1300 Physical Sciences Group 119GS-1100 Business And Industry Group 75GS-1700 Education Group 65GS-1900 Quality Assurance, Inspection, And Grading Group 45GS-2200 Information Technology Group 32GS-0500 Accounting And Budget Group 29GS-0000 Miscellaneous Occupations Group 26GS-2000 Supply Group 22GS-1000 Information And Arts Group 9GS-1400 Library And Archives Group 8GS-0600 Medical, Hospital, Dental and Public Health Group 7GS-2100 Transportation Group 5GS-0900 Legal And Kindred Group 3GS-0200 Human Resources Management Group 1GS-1500 Mathematics And Statistics Group 1
GS Subtotal 1,786
Federal Wage SystemFWS-5300 Industrial Equipment Maintenance Family 357FWS-3800 Metal Work Family 272FWS-4100 Painting And Paperhanging Family 267FWS-4200 Plumbing And Pipefitting Family 220FWS-2800 Electrical Installation And Maintenance Family 204FWS-5200 Miscellaneous Occupations Family 182FWS-3400 Machine Tool Work Family 167FWS-3700 Metal Processing Family 154FWS-2600 Electronic Equipment Installation And Maintenance Family 135FWS-4300 Pliable Materials Work Family 66FWS-3600 Structural And Finishing Work Family 48FWS-5800 Transportation/Mobile Equipment Maintenance Family 45FWS-3100 Fabric And Leather Work Family 37FWS-5700 Transportation/Mobile Equipment Operation Family 25FWS-4700 General Maintenance And Operations Work Family 16FWS-6900 Warehousing And Stock Handling Family 14FWS-3300 Instrument Work Family 13FWS-4800 General Equipment Maintenance Family 9

FWS-5400 Industrial Equipment Operation Family 6FWS-7000 Packing And Processing Family 6FWS-3500 General Services And Support Work Family 5FWS-6500 Ammunition, Explosives, And Toxic Materials Work Family 2
FWS Subtotal 2,250
Shipyard Total 4,036
Note: PNS provided additional detail by GS series and FWS occupation which was converted toO*NET occupations for comparison to New Hampshire occupational data.
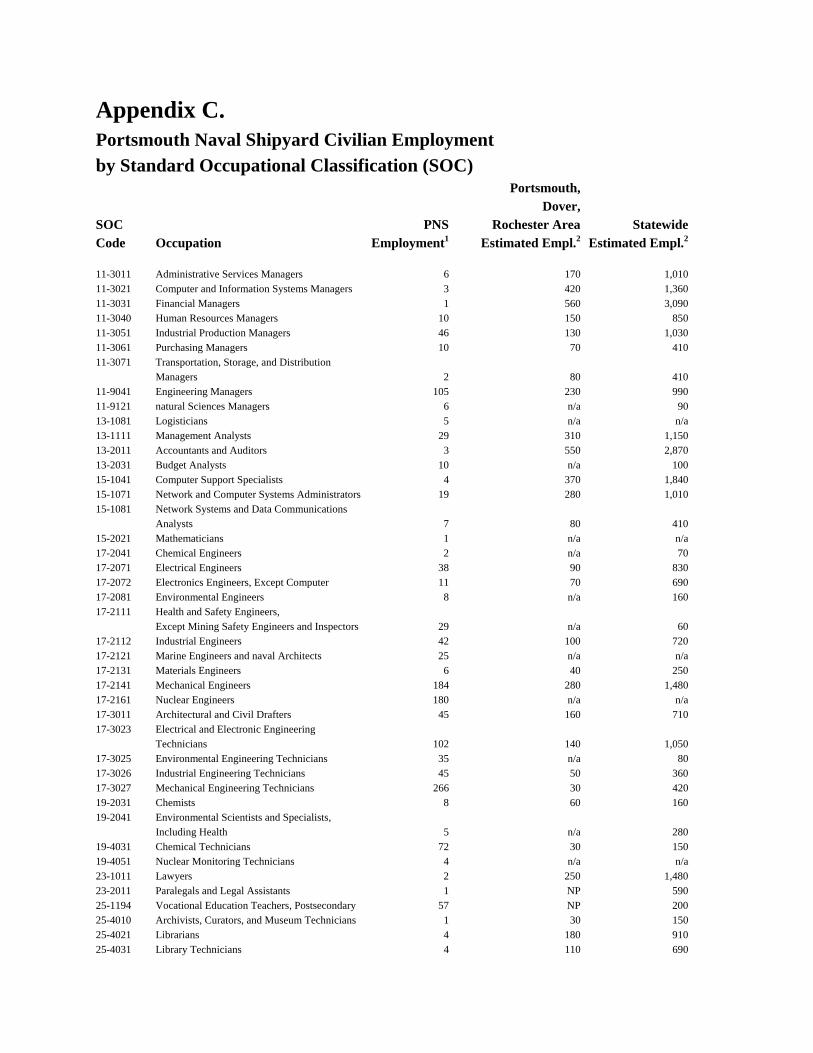
Appendix C.Portsmouth Naval Shipyard Civilian Employmentby Standard Occupational Classification (SOC) Portsmouth,
Dover,SOC PNS Rochester Area StatewideCode Occupation Employment1 Estimated Empl.2 Estimated Empl.2
11-3011 Administrative Services Managers 6 170 1,01011-3021 Computer and Information Systems Managers 3 420 1,36011-3031 Financial Managers 1 560 3,09011-3040 Human Resources Managers 10 150 85011-3051 Industrial Production Managers 46 130 1,03011-3061 Purchasing Managers 10 70 41011-3071 Transportation, Storage, and Distribution
Managers 2 80 41011-9041 Engineering Managers 105 230 99011-9121 natural Sciences Managers 6 n/a 9013-1081 Logisticians 5 n/a n/a13-1111 Management Analysts 29 310 1,15013-2011 Accountants and Auditors 3 550 2,87013-2031 Budget Analysts 10 n/a 10015-1041 Computer Support Specialists 4 370 1,84015-1071 Network and Computer Systems Administrators 19 280 1,01015-1081 Network Systems and Data Communications
Analysts 7 80 41015-2021 Mathematicians 1 n/a n/a17-2041 Chemical Engineers 2 n/a 7017-2071 Electrical Engineers 38 90 83017-2072 Electronics Engineers, Except Computer 11 70 69017-2081 Environmental Engineers 8 n/a 16017-2111 Health and Safety Engineers,
Except Mining Safety Engineers and Inspectors 29 n/a 6017-2112 Industrial Engineers 42 100 72017-2121 Marine Engineers and naval Architects 25 n/a n/a17-2131 Materials Engineers 6 40 25017-2141 Mechanical Engineers 184 280 1,48017-2161 Nuclear Engineers 180 n/a n/a17-3011 Architectural and Civil Drafters 45 160 71017-3023 Electrical and Electronic Engineering
Technicians 102 140 1,05017-3025 Environmental Engineering Technicians 35 n/a 8017-3026 Industrial Engineering Technicians 45 50 36017-3027 Mechanical Engineering Technicians 266 30 42019-2031 Chemists 8 60 16019-2041 Environmental Scientists and Specialists,
Including Health 5 n/a 28019-4031 Chemical Technicians 72 30 15019-4051 Nuclear Monitoring Technicians 4 n/a n/a23-1011 Lawyers 2 250 1,48023-2011 Paralegals and Legal Assistants 1 NP 59025-1194 Vocational Education Teachers, Postsecondary 57 NP 20025-4010 Archivists, Curators, and Museum Technicians 1 30 15025-4021 Librarians 4 180 91025-4031 Library Technicians 4 110 690

27-1024 Graphic Designers 1 110 57027-3031 Public Relations Specialists 3 90 45027-3042 Technical Writers 2 50 24027-3043 Writers and Authors 2 60 18029-2071 Medical Records and Health Information
Technicians 2 n/a 84029-9010 Occupational Health and Safety Specialists
and Technicians 15 n/a 16033-1012 First-Line Supervisors/Managers of Police
and Detectives 2 80 36033-9032 Security Guards 5 180 2,22043-1011 First-Line Supervisors/Managers of Office
and Administrative Support Workers 3 1,250 7,42043-3031 Bookkeeping, Accounting, and Auditing Clerks 8 1,510 9,27043-3051 Payroll and Timekeeping Clerks 5 90 68043-5011 Cargo and Freight Agents 5 50 12043-5061 Production, Planning, and Expediting Clerks 58 200 1,12043-5081 Stock Clerks and Order Fillers 15 1,120 8,54043-6011 Executive Secretaries and Administrative
Assistants 19 1,090 5,98043-6014 Secretaries, Except Legal, Medical, and
Executive 39 1,160 7,68043-9011 Computer Operators 4 90 44043-9022 Word Processors and Typists 3 30 40043-9051 Mail Clerks and Mail Machine Operators,
Except Postal Service 1 50 76043-9061 Office Clerks, General 14 1,910 10,23047-1011 First-Line Supervisors/Managers of
Construction Trades and Extraction Workers 201 290 2,47047-2031 Carpenters (Boat Builders and Shipwrights) 41 NP 4,41047-2111 Electricians 153 420 2,14047-2131 Insulation Workers 33 n/a n/a47-2152 Plumbers, Pipefitters, and Steamfitters 129 NP 2,30047-2211 Sheet Metal Workers 45 120 65047-3013 Helpers--Electricians 35 n/a 30047-3015 Helpers--Pipelayers, Plumbers, Pipefitters,
and Steamfitters 41 n/a 16047-3019 Helpers - Construction Trades, All Others 10 n/a 23047-4041 Hazardous Materials Removal Workers 3 40 8049-1011 First-Line Supervisors/Managers of Mechanics,
Installers, and Repairers 103 420 25,65049-2092 Electric Motor, Power Tool, and
Related Repairers 7 n/a 64049-2094 Electrical and Electronics Repairers,
Commercial and Industrial Equipment 93 50 30049-3042 Mobile Heavy Equipment Mechanics,
Except Engines 36 30 10049-9021 Heating, Air Conditioning,
and Refrigeration Mechanics and Installers 11 380 10049-9041 Industrial Machinery Mechanics 250 170 13049-9042 Maintenance and Repair Workers, General 7 720 1,34049-9069 Precision Instrument and Equipment
Repairers, All Other 4 n/a 10049-9093 Fabric Menders, Except Garment 35 n/a n/a49-9096 Riggers 92 n/a n/a49-9098 Helpers--Installation, Maintenance,
and Repair Workers 103 150 730

51-1011 First-Line Supervisors/Managers of Productionand Operating Workers 93 550 52,080
51-4011 Computer-Controlled Machine Tool Operators,Metal and Plastic 3 n/a 50
51-4022 Forging Machine Setters, Operators,and Tenders, Metal and Plastic 3 n/a 690
51-4041 Machinists 117 340 18051-4111 Tool and Die Makers 9 70 57051-4121 Welders, Cutters, Solderers, and Brazers 98 170 46051-4192 Lay-out Workers, Metal and Plastic 106 n/a n/a51-7031 Model Makers, Wood 6 n/a n/a51-8031 Water and Liquid Waste Treatment Plant
and System Operators 5 110 10051-9061 Inspectors, Testers, Sorters, Samplers,
and Weighers 38 510 8051-9122 Painters, Transportation Equipment 152 n/a 50051-9198 Helpers--Production Workers 243 240 53051-9199 Production Workers, All Other 51 280 1,37053-1031 First-Line Supervisors/Managers
of Transportation andMaterial-Moving Machine and Vehicle 3 120 480
53-7021 Crane and Tower Operators 22 n/a 17053-7061 Cleaners of Vehicles and Equipment 6 120 1,680
1 Portsmouth Naval Shipyard civilian employment on February 24, 20052 Estimated area and statewide employment are based on the November 2003 New Hampshire Occupational Employment and Wages survey by the Occupational Employment Statistics (OES)
Program n/a - not available NP - indicates that the estimated employment is not publishable