well as forward-looking statements that reflect Logo ...
42
Transcript of well as forward-looking statements that reflect Logo ...

2
This presentation contains information and analysis on financial statements aswell as forward-looking statements that reflect Logo management’s current viewswith respect to certain future events. Although it is believed that the informationand analysis are correct and expectations reflected in these statements arereasonable, they may be affected by a variety of variables and changes inunderlying assumptions that could cause actual results to differ materially.Neither Logo nor any of its managers or employees nor any other person shallhave any liability whatsoever for any loss arising from the use of thispresentation.
3
39
4
5
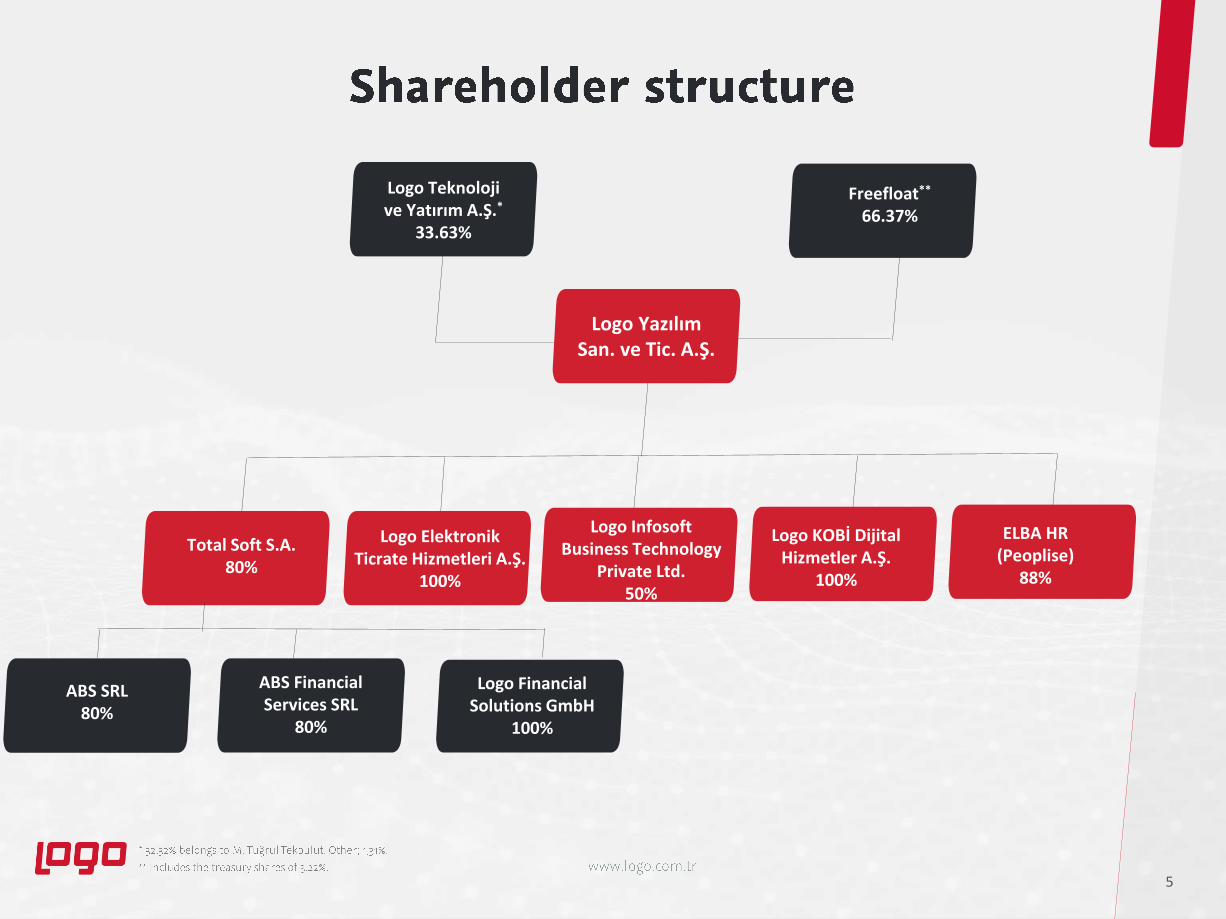
Logo Teknolojive Yatırım A.Ş.*
33.63%
Freefloat**
66.37%
Logo YazılımSan. ve Tic. A.Ş.
Total Soft S.A.80%
Logo ElektronikTicrate Hizmetleri A.Ş.
100%
Logo InfosoftBusiness Technology
Private Ltd.50%
Logo KOBİ DijitalHizmetler A.Ş.
100%
ABS SRL80%
ABS Financial Services SRL
80%
Logo Financial Solutions GmbH
100%
ELBA HR (Peoplise)
88%

6
1984
1986
1996
1999
2000
2000
2004
2006
2008
2011
2013
2013
2015
2016
2016
2016
2017
2017
2018
2019
2020
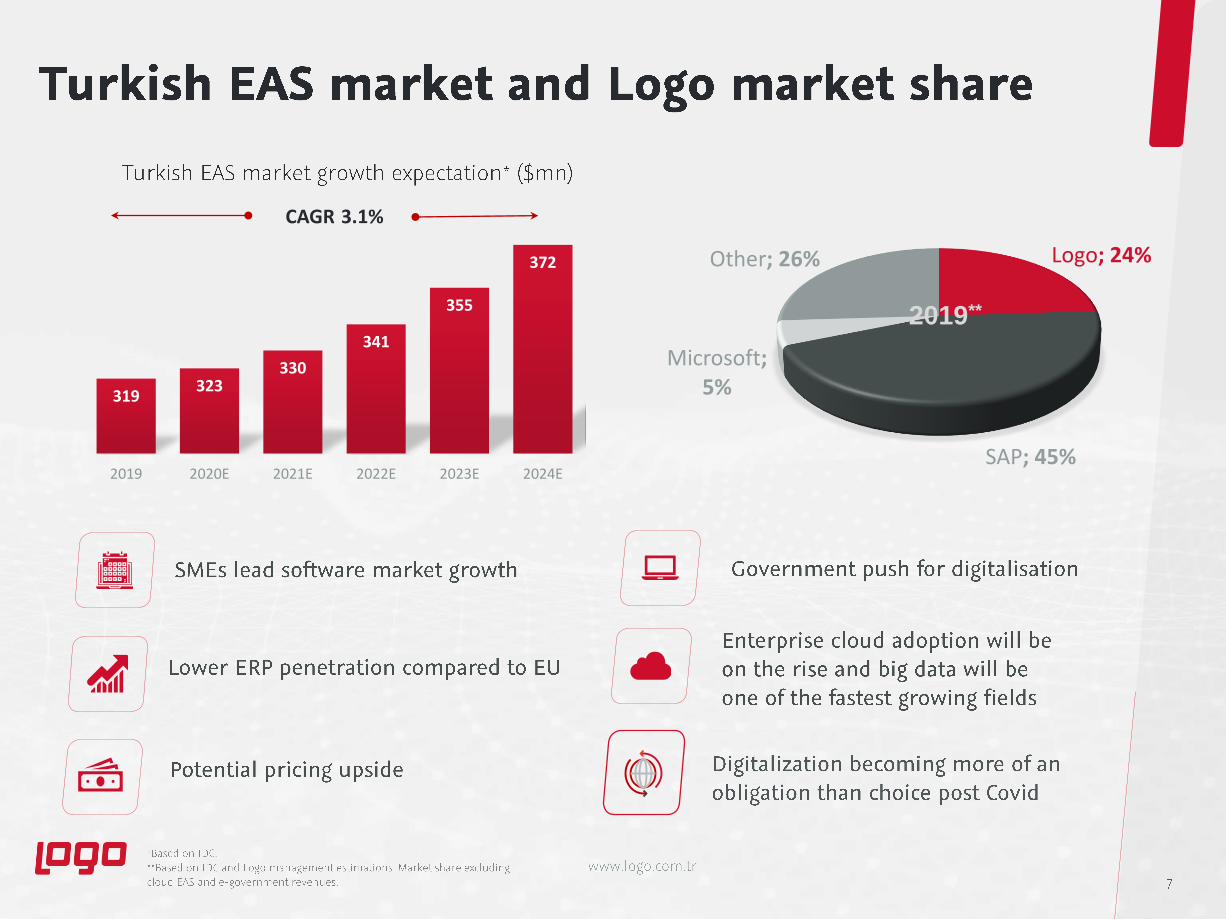
Logo; 24%
SAP; 45%
Microsoft; 5%
Other; 26%
2019**
319323
330
341
355
372
2019 2020E 2021E 2022E 2023E 2024E
CAGR 3.1%

Customisation
Tools
Vertical
Solutions
Retail
Management
B2B
Environment
Health and Safety
Management
e-solutions
Warehouse
Management
Human
Resources
Business
Analytics
Customer
Relationship
Management
Enterprise
Resource
Planning
Field
Sales
Management
Logo
apps
60+ solutions
35+ years of experience
One-stop-shop for companies of all sizes
•
•
1•
•
•
•
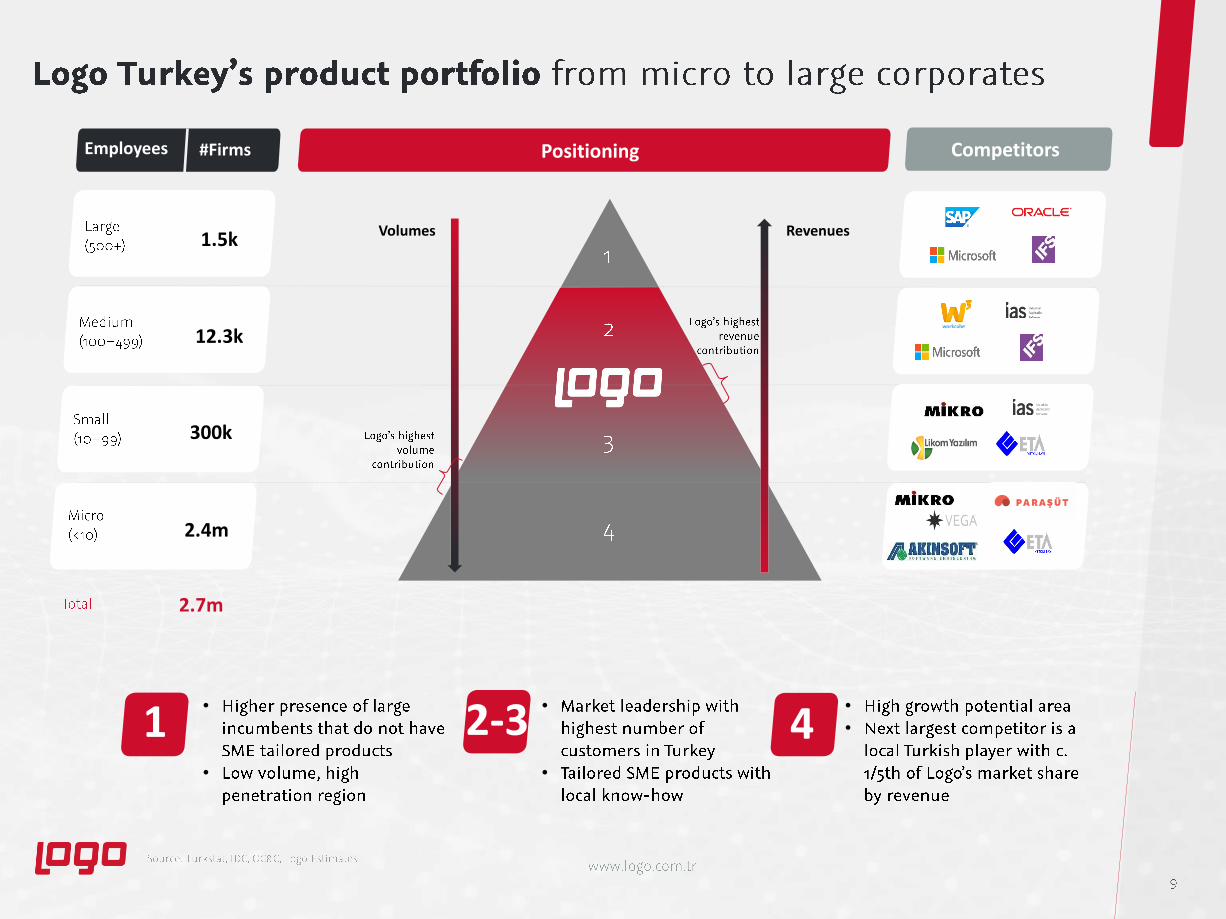
2.7m
Volumes Revenues
PositioningEmployees #Firms Competitors
1.5k
12.3k
300k
2.4m
2-3 4
•
•
•
•
•
•
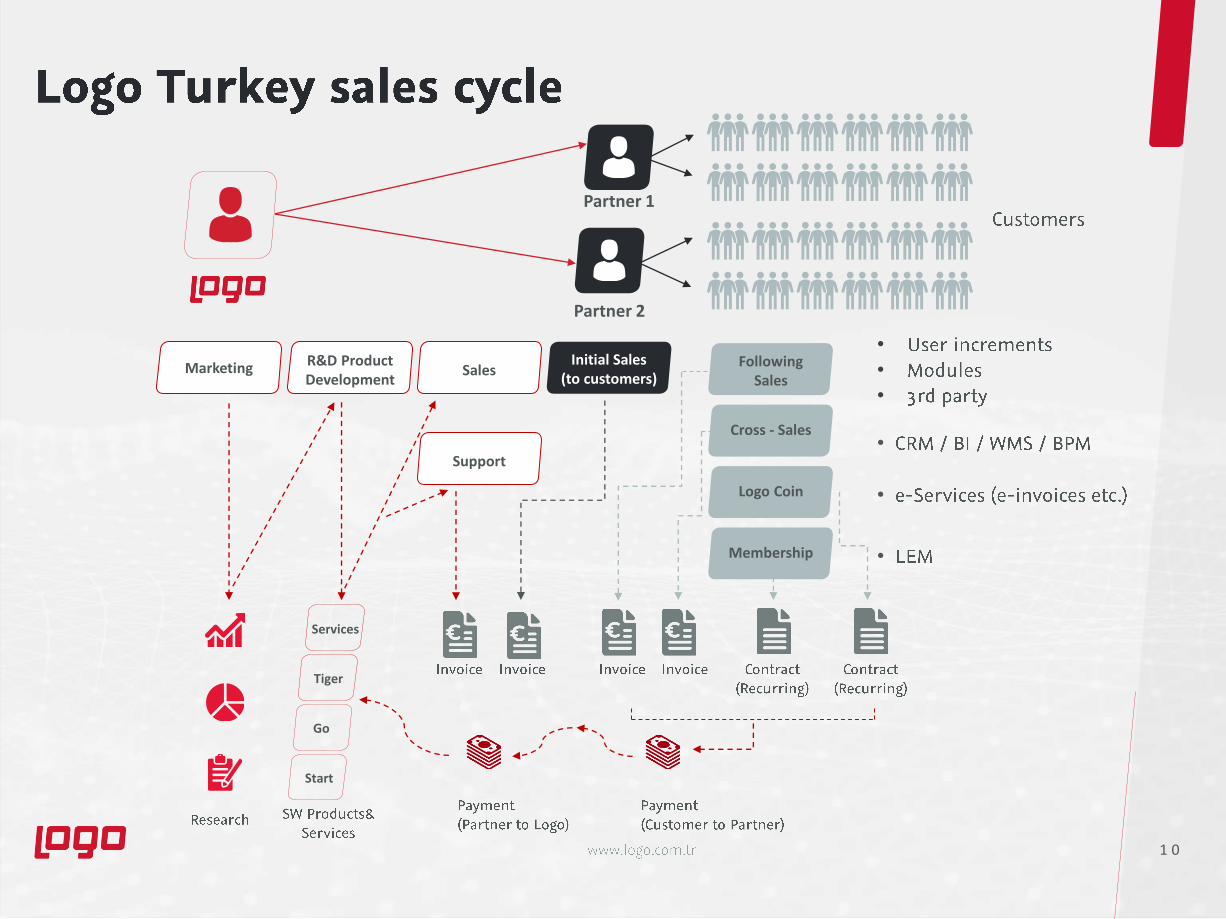
Marketing
Partner 1
Partner 2
R&D ProductDevelopment
SalesInitial Sales
(to customers)
Support
FollowingSales
Cross - Sales
Logo Coin
Membership
Tiger
Go
Start
Services
1 0

1 1
◉ Best suited to local market legislations and business practices
1Robust product suite
2Extensive distribution
network
3Strong brand
◉ Lower total cost of ownership
◉ Attractive price point, simple maintenance and easy implementation
◉ Best-in-class technology and adaptive to trends
◉ All BPs exclusively sell Logo software products creating high barriers of entry
◉ 50% of BPs have tenure longer than 10 years
◉ No BP with over 1-2% of sales
◉ Positive perception of Logo products across the board
◉ Upsell opportunities to large passive customer base of c. 100k
◉ Strong advocates of Logo products
◉ Trusted brand with > 35yrs of presence
◉ Large network of 800+ BPs and c. 5,000 sales and implementation team members
Rapid growth in total & recurring revenues
Increased opportunity to cross-sell
Low churn Economies of scale
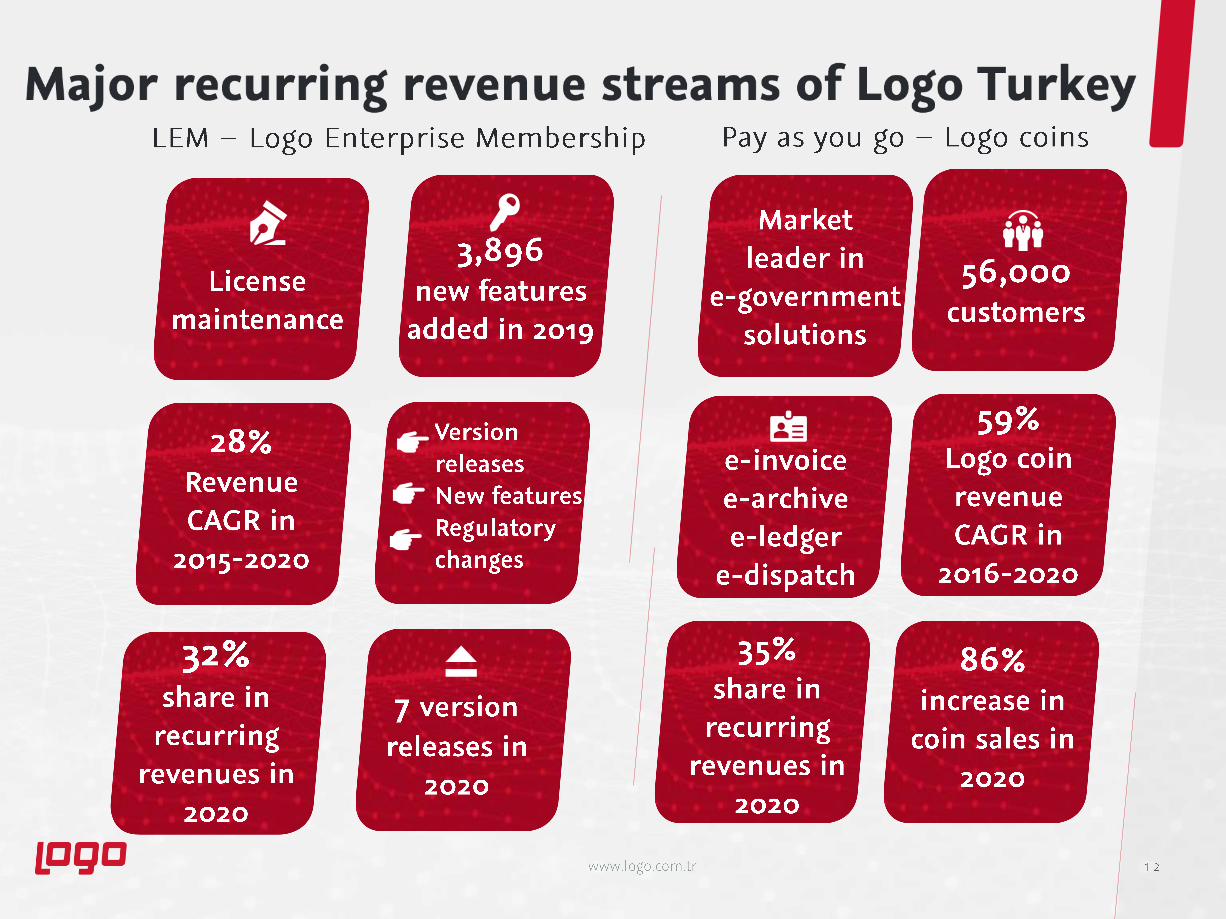

Market leader in e-government solutions; e-invoice, e-archive, e-ledger, e-dispatch with 56K customers
1 3
eLogoLogo ERP solutions
e-invoice portal for non-ERP users
Other ERPs & software
direct web service connector
# of customers ('000)
10 14 1832
56
2016 2017 2018 2019 2020
CAGR: 53%
eLogo invoiced revenues (TL mn)
2016 2017 2018 2019 2020
coin revenues module&other revenues
32 38 56
107
158
66% 74% 68%
66%
85%
CAGR: 49%
1 4
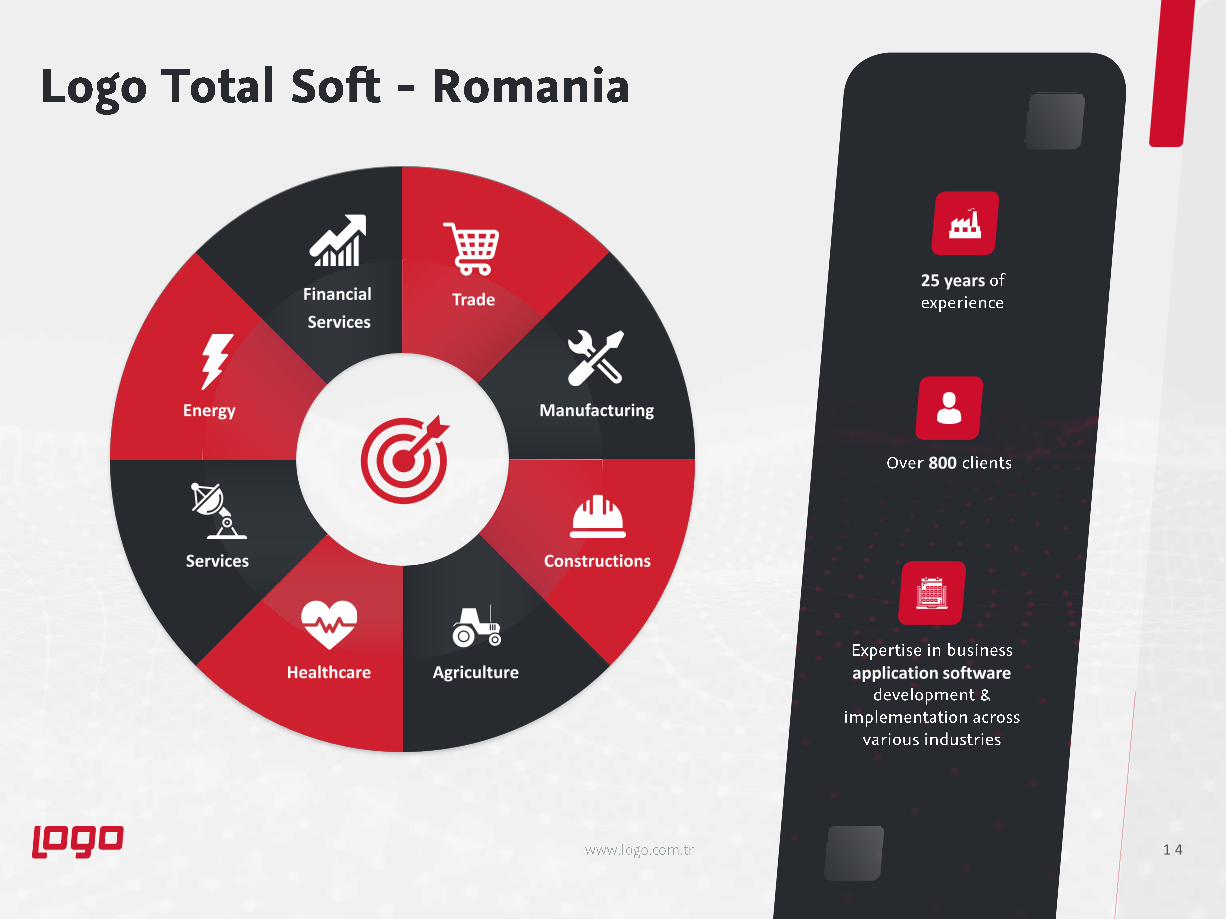
25 years
800
application software
Financial
ServicesTrade
Manufacturing
Constructions
AgricultureHealthcare
Services
Energy

1Robust product suite &superior service quality
3Project management
know-how
◉ Charisma Business Suite; core being ERP and Human Capital Management (HCM)
◉ Focus on 8 verticals at the second layer; Financial Services, Healthcare and Agriculture standing out
◉ Innovation and technology present in all product and services
◉ 1st place in Romanian ERP providers
◉ Human Capital and Healthcare solutions expanded through CEE
◉ One of Top 10 Global Leasing and Credit solutions
◉ Project implementation experience in 35 countries
◉ Know-how, innovation and project management capabilities strengthened with ABS acquisition in 2018
◉ High-quality developers dedicated to project development
◉ Development of best of breed solutions together w/ vertical leaders
◉ Trusted brand with >25 yrs of presence
Competitive positioning in home market
Client centric organization and business model
Well-positioned to increase international
sales
Sustainable competitive advantages in multiple
verticals
◉ Member Firm of Global Retail Consulting, Ebeltoft
2Strong brand

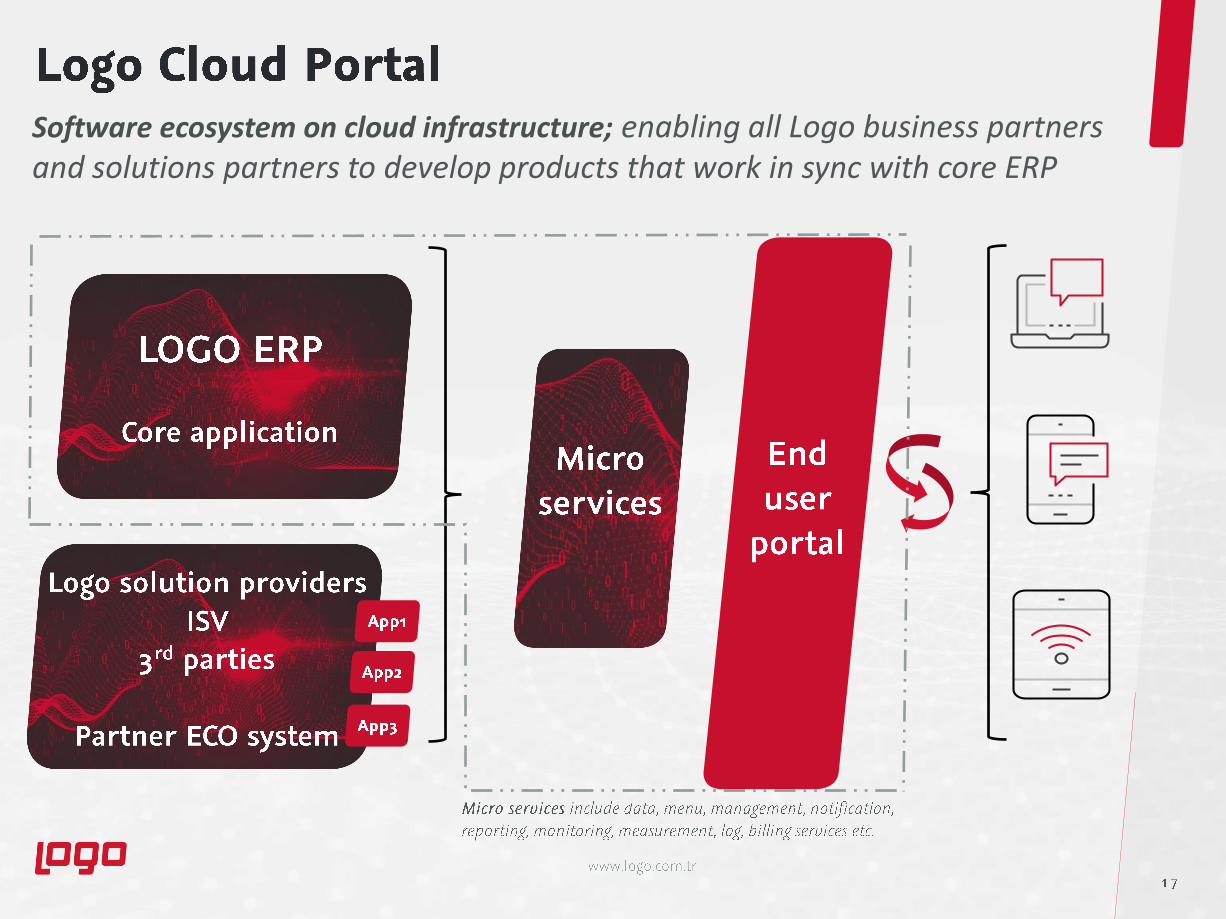
Software ecosystem on cloud infrastructure; enabling all Logo business partners and solutions partners to develop products that work in sync with core ERP

✓
670% growth y/y
✓
high service quality
✓ easy upgradability
✓ Value creation on digital platform
Only 8 solutions are approved by the Goods
and Services Tax Network (GSTN) of India
Basic functionality is free for 1 user until
March 2023 - when thru GSTN
Only 4 solutions are mobile among the 8-
GSTN-approved solutions
Aligned R&D effort
Logo CaptainBizis GSTN
approved
Logo CaptainBizis a mobile
solution
1K users at end-Q121
Samesource-code
with Logo İşbaşı
✓
✓
•
•
12 3
5
10
15
Dec.'19 Mar.'20 Jun.'20 Sept.'20 Dec.'20 Mar.'21
# of users ('000)
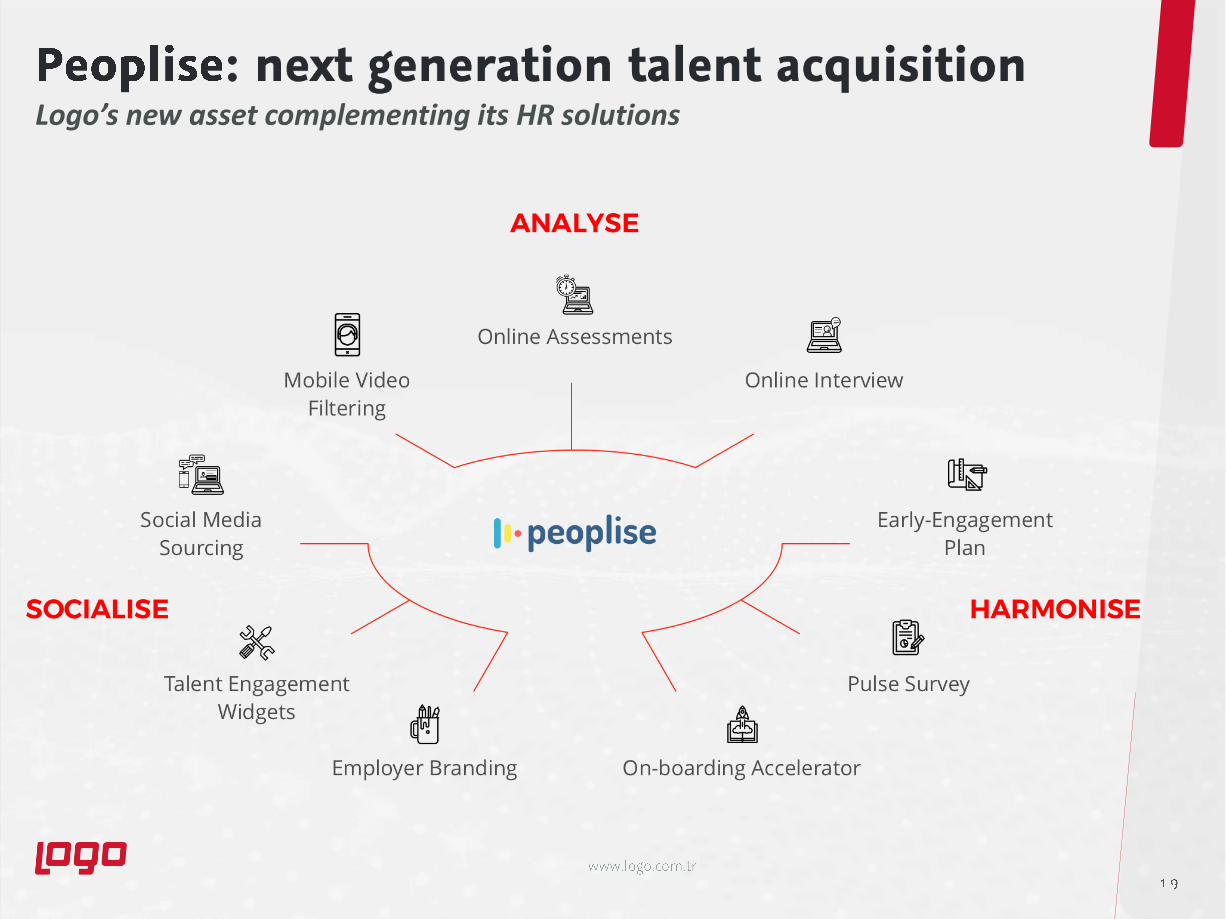
Logo’s new asset complementing its HR solutions
2 0
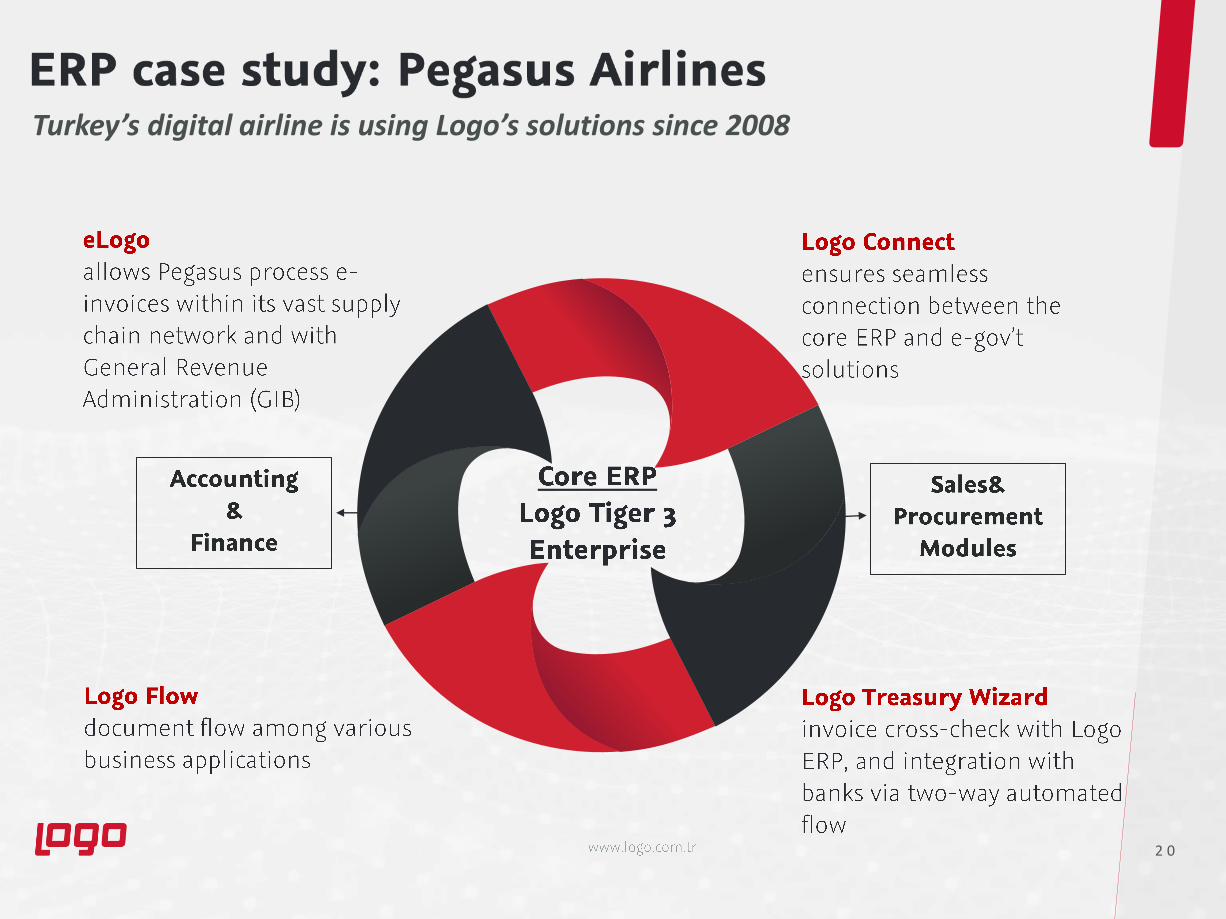
Turkey’s digital airline is using Logo’s solutions since 2008

2 1
Unilever /Consumer Goods
Yaktas /Flooring
▪ Logo j-Platform (ERP)▪ Logo CRM▪ Logo Netsis 3 Standard (ERP)
▪ Logo Ocean (warehouse automation)
▪ Logo Tiger 3 Enterprise (ERP)▪ e-gov’t solutions (eLogo)
Barilla /Pasta
Customer’s need:• Managing distributors’ sales and distribution activities • Centralized management• Cost saving
Logo solutions’ benefits:• Cost saving on server investment, maintenance and support• Centralized data management• Sales team of 1,600 people connected and integrated via tablet application
Customer’s need:▪ Increasing efficiency in warehouse
management▪ Quicker response time for customer
requests▪ Faster and easier inventory counting▪ Reducing aged product inventory
Logo solutions’ benefits:▪ 20% reduction in order preparation
duration▪ 30% reduction in shipment error rates▪ Up to 50% improvement in aged
product inventory▪ Shortening the inventory
counting time
Customer’s need:▪ Meeting customers' changing needs▪ Effective management, follow-up
and reporting of sales and marketing operations
▪ Recording all field activities
Logo solutions’ benefits:▪ Increase in customer satisfaction▪ Enhanced performance by sales
teams thanks to mobile applications▪ More effective communication with
prospective clients
2 2
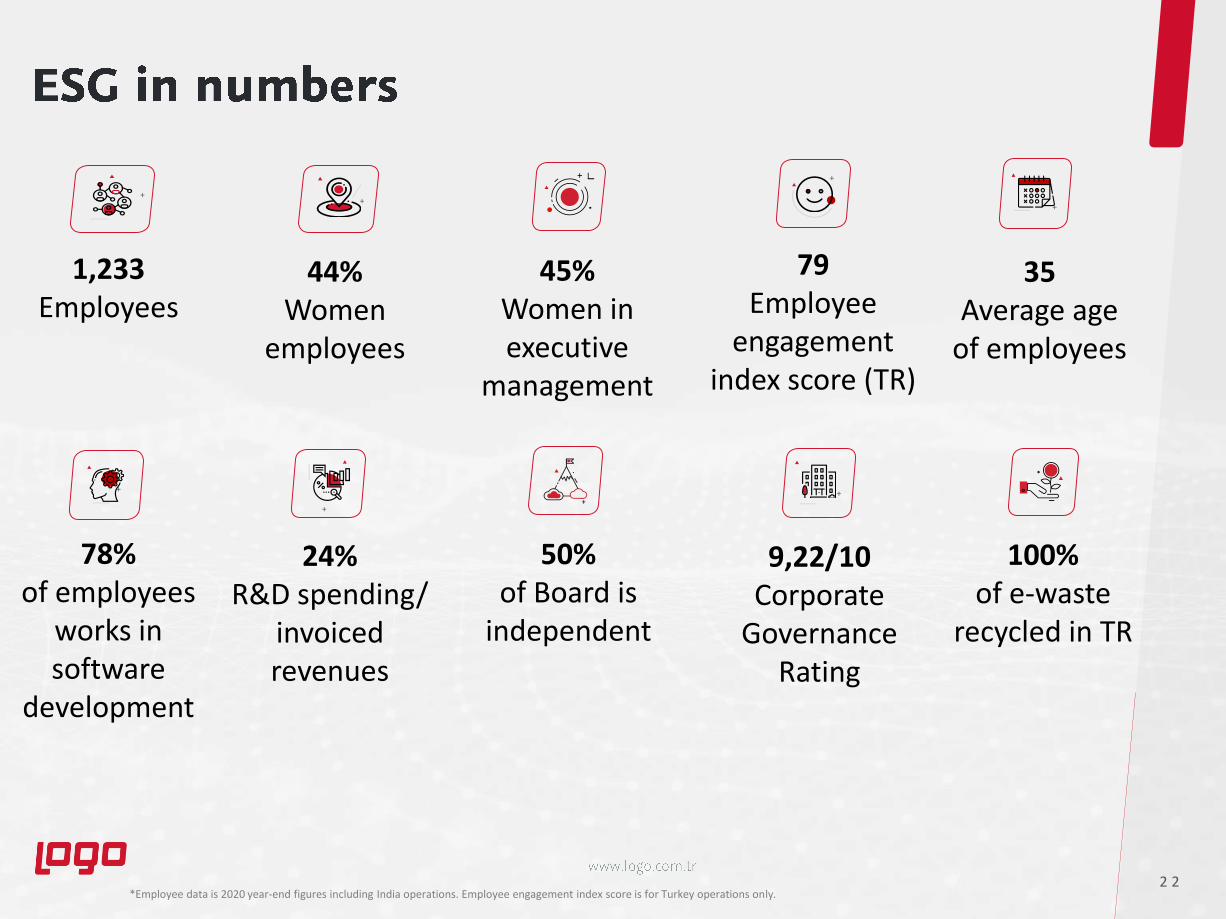
44%Women
employees
45%Women in executive
management
1,233Employees
35Average age
of employees
78%of employees
works in software
development
50%of Board is
independent
9,22/10Corporate
Governance Rating
24%R&D spending/
invoiced revenues
79Employee
engagement index score (TR)
+
+
+
+
+
+
+
*Employee data is 2020 year-end figures including India operations. Employee engagement index score is for Turkey operations only.
100%of e-waste
recycled in TR

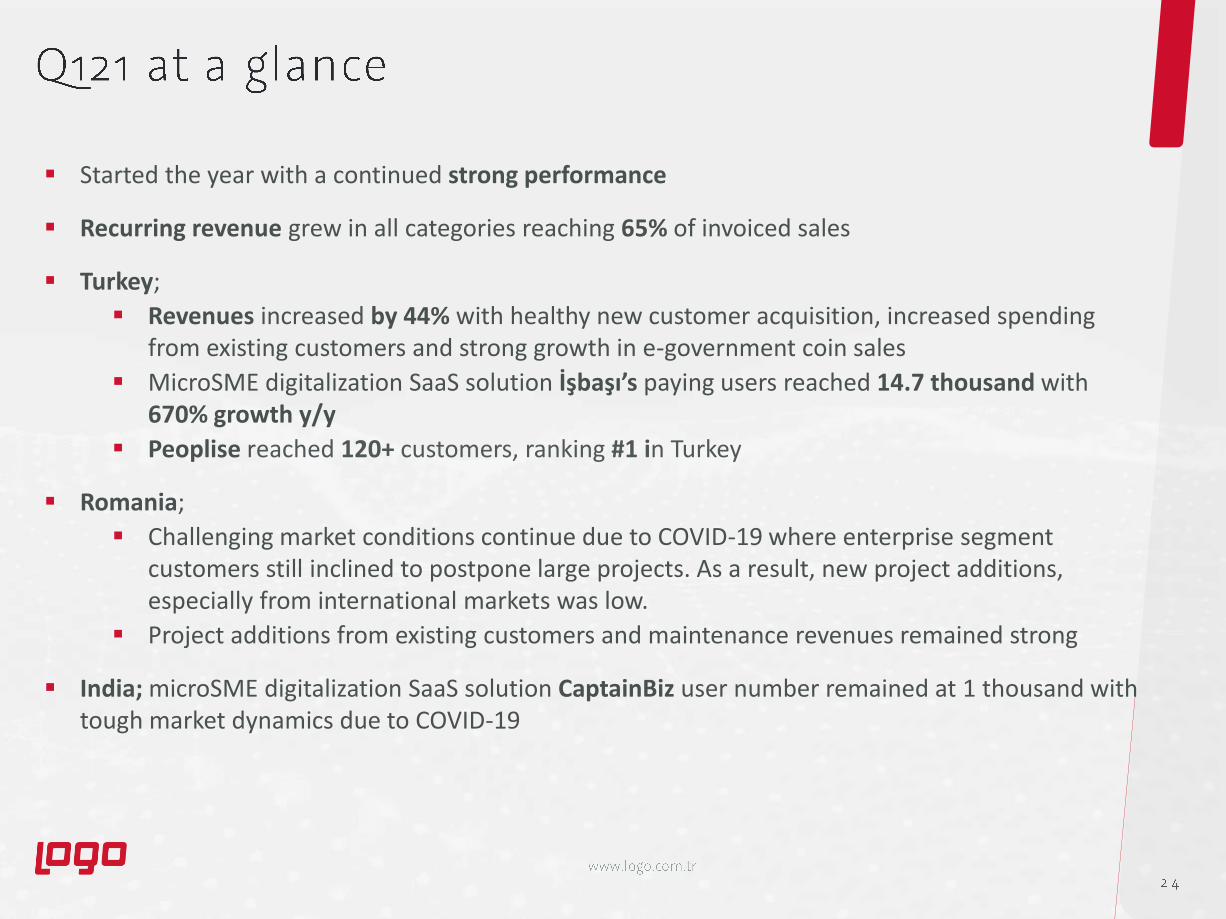
▪ Started the year with a continued strong performance
▪ Recurring revenue grew in all categories reaching 65% of invoiced sales
▪ Turkey;
▪ Revenues increased by 44% with healthy new customer acquisition, increased spending from existing customers and strong growth in e-government coin sales
▪ MicroSME digitalization SaaS solution İşbaşı’s paying users reached 14.7 thousand with 670% growth y/y
▪ Peoplise reached 120+ customers, ranking #1 in Turkey
▪ Romania;
▪ Challenging market conditions continue due to COVID-19 where enterprise segment customers still inclined to postpone large projects. As a result, new project additions, especially from international markets was low.
▪ Project additions from existing customers and maintenance revenues remained strong
▪ India; microSME digitalization SaaS solution CaptainBiz user number remained at 1 thousand with tough market dynamics due to COVID-19

Revenues (TL mn) EBITDA (TL mn) Net Income (TL mn)
• Revenues grew by 37% reaching 139 TL mn, with Turkey and Romania operations contributing 65% and 35% respectively.
• EBITDA increased by 51%, yielding 40% margin.
• Net income grew by 164%, yielding 39% margin.
*IFRS 16 impact: EBITDA +2.6 TL mn (Q120:2.8 TL mn) / EBIT +537 TL thou (Q120:+370 TL thou) / EBT -65 TL thou (Q120:-131 TL thou)
102
139
Q120 Q121
37%
36
55
Q120 Q121
51%
36%
40%
21
55
Q120 Q121
164%
20%
39%
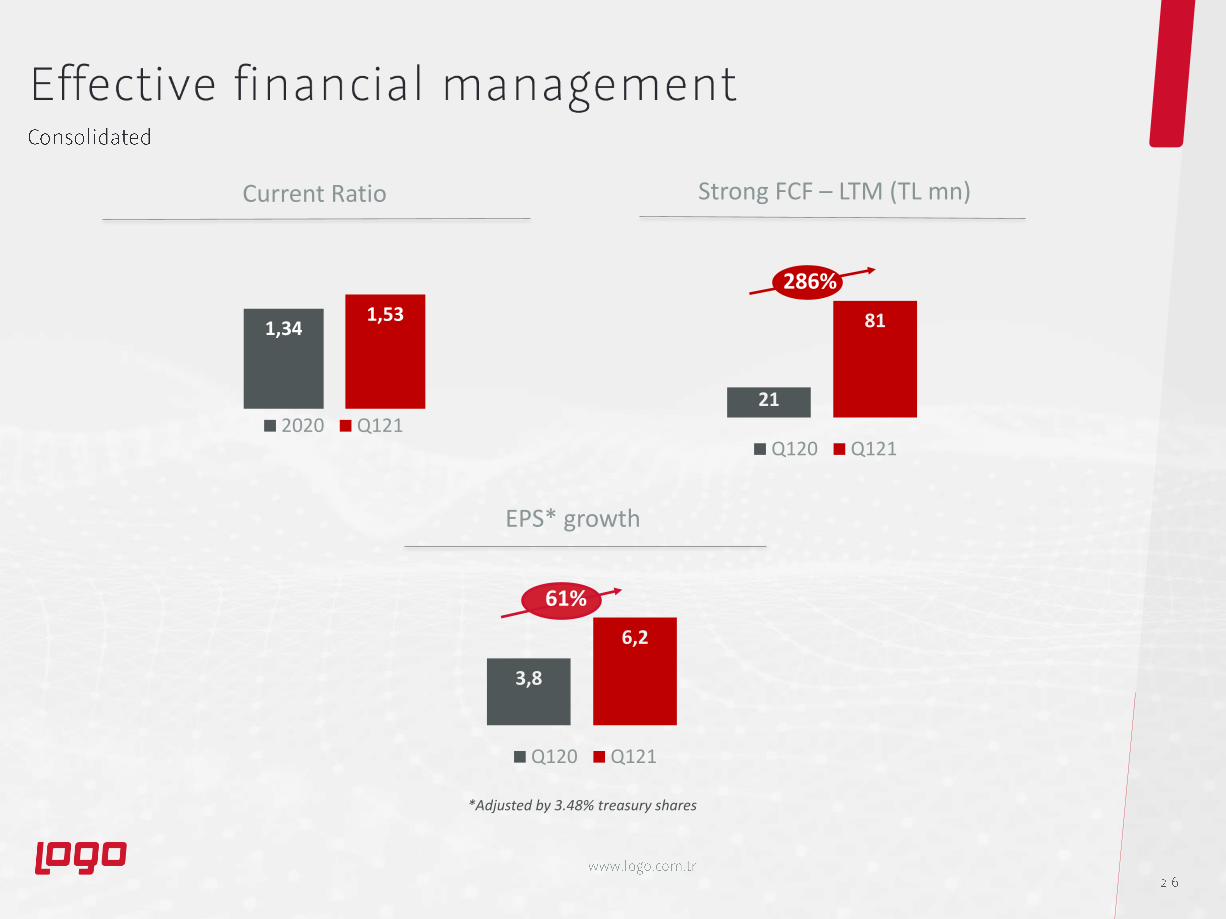
Current Ratio
EPS* growth
Strong FCF – LTM (TL mn)
*Adjusted by 3.48% treasury shares
21
81
Q120 Q121
286%
3,8
6,2
Q120 Q121
61%
1,341,53
2020 Q121

Logo Turkey-Revenues (TL mn) Logo Turkey-EBITDA (TL mn) Logo Turkey-Net Income (TL mn)
• Revenues increased by 44% with healthy new customer acquisitions, increased spending from existing customers, and strong growth in e-service coin sales
• EBITDA grew by 59% with margin reaching 49%
• Net income positively affected by net financial gains with margin reaching 49%
*IFRS 16 impact: EBITDA +1.7 TL mn (Q120: 1.7 TL mn ) / EBIT +448 TL thou (Q120: +337 TL thou) / EBT -65 TL thou (Q120: -131 TL thou)
63
91
Q120 Q121
44%
28
45
Q120 Q121
59%
45%
49%
18
44
Q120 Q121
154%
28%
49%

✓ eLogo invoiced revenues (modules and coins) recorded significant growth rate since 2016.
✓ Coin revenues comprises 85% of eLogo’s invoiced revenues in 2020 signaling strong recurring revenue growth potential going forward
Market leader in e-government solutions; e-invoice, e-archive, e-ledger, e-dispatch with 62K customers
# of customers ('000)
coin usage (mn)
eLogo invoiced revenues (TL mn)
21 28 3870
134
11 10 18
37
24
2016 2017 2018 2019 2020
coin revenues module&other revenues
CAGR: 49%
10 14 1832
56
38
62
2016 2017 2018 2019 2020 Q120 Q121
CAGR: 53% 62%
73 104 134213
499
90166
2016 2017 2018 2019 2020 Q120 Q121
CAGR: 62%
85%

✓
670% growth y/y
✓
high service quality
✓ easy upgradability
✓ Value creation on digital platform
Only 8 solutions are approved by the Goods
and Services Tax Network (GSTN) of India
Basic functionality is free for 1 user until
March 2023 - when thru GSTN
Only 4 solutions are mobile among the 8-
GSTN-approved solutions
Aligned R&D effort
Logo CaptainBizis GSTN
approved
Logo CaptainBizis a mobile
solution
1K users at end-Q121
Samesource-code
with Logo İşbaşı
✓
✓
•
•
12 3
5
10
15
Dec.'19 Mar.'20 Jun.'20 Sept.'20 Dec.'20 Mar.'21
# of users ('000)
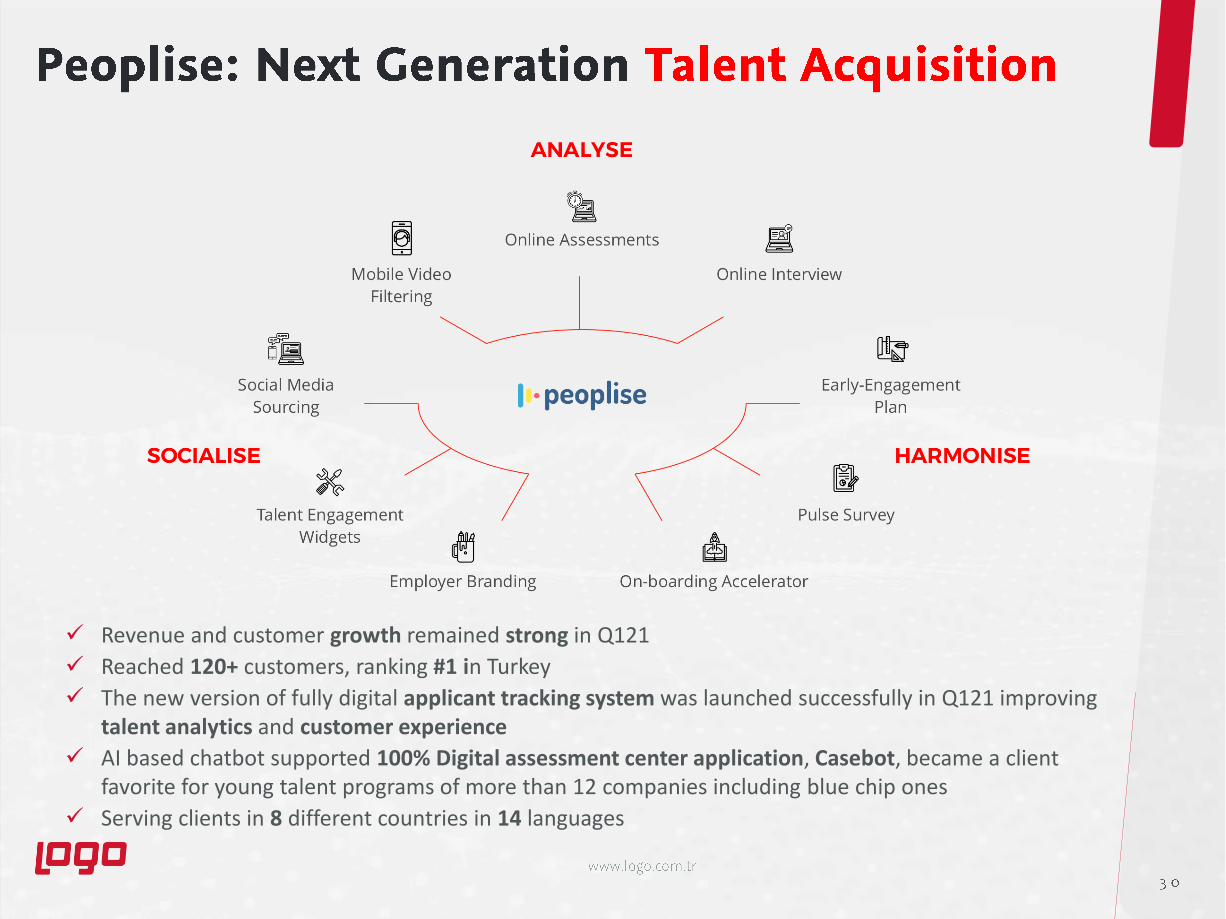
✓ Revenue and customer growth remained strong in Q121
✓ Reached 120+ customers, ranking #1 in Turkey
✓ The new version of fully digital applicant tracking system was launched successfully in Q121 improving talent analytics and customer experience
✓ AI based chatbot supported 100% Digital assessment center application, Casebot, became a client favorite for young talent programs of more than 12 companies including blue chip ones
✓ Serving clients in 8 different countries in 14 languages
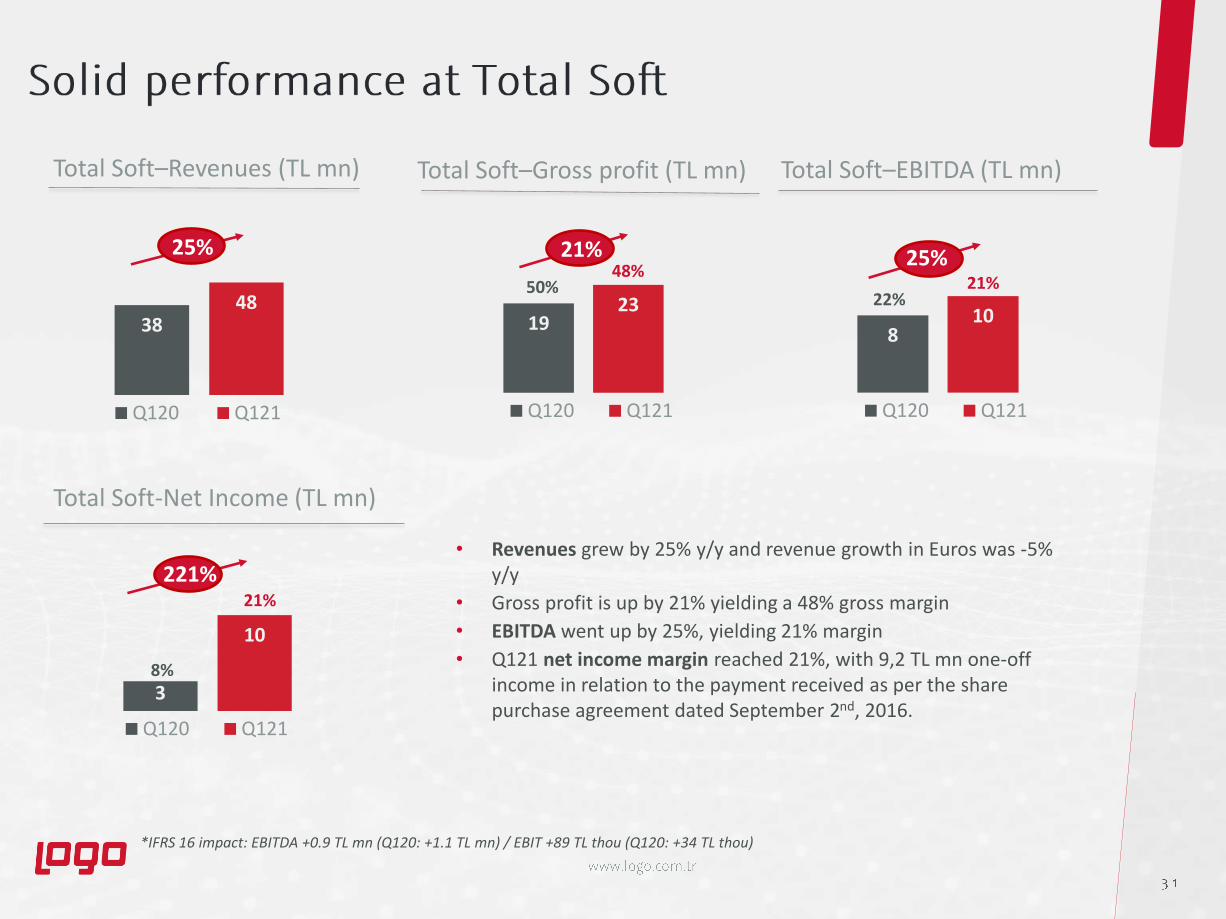
Total Soft–Revenues (TL mn) Total Soft–Gross profit (TL mn) Total Soft–EBITDA (TL mn)
Total Soft-Net Income (TL mn)
• Revenues grew by 25% y/y and revenue growth in Euros was -5% y/y
• Gross profit is up by 21% yielding a 48% gross margin
• EBITDA went up by 25%, yielding 21% margin
• Q121 net income margin reached 21%, with 9,2 TL mn one-off income in relation to the payment received as per the share purchase agreement dated September 2nd, 2016.
*IFRS 16 impact: EBITDA +0.9 TL mn (Q120: +1.1 TL mn) / EBIT +89 TL thou (Q120: +34 TL thou)
3848
Q120 Q121
25%
1923
Q120 Q121
21%
50%48%
810
Q120 Q121
25%
22%21%
3
10
Q120 Q121
221%
8%
21%

Invoiced Revenues (TL mn)
• Q1 sales invoice growth was 33% y/y
• IFRS Revenue growth was 37%y/y in Q1
• In Turkey, invoiced revenue was 93,1 TL mnwith 41% increase
• Total Soft’s invoiced revenue increased by 21% and reached 50,8 TL mn
• Recurring revenues make up 65% of invoices
First Quarter Invoices & IFRS Revenues (TL mn)
CAGR: 32%
2636
5467
81
102
139
24 30
5366
76
108
144
Q115 Q116 Q117 Q118 Q119 Q120 Q121
IFRS Revenues=Invoices - Net DeferralsInvoices
152 176
259333
460
618
108144
2015 2016 2017 2018 2019 2020 Q120 Q121
33%
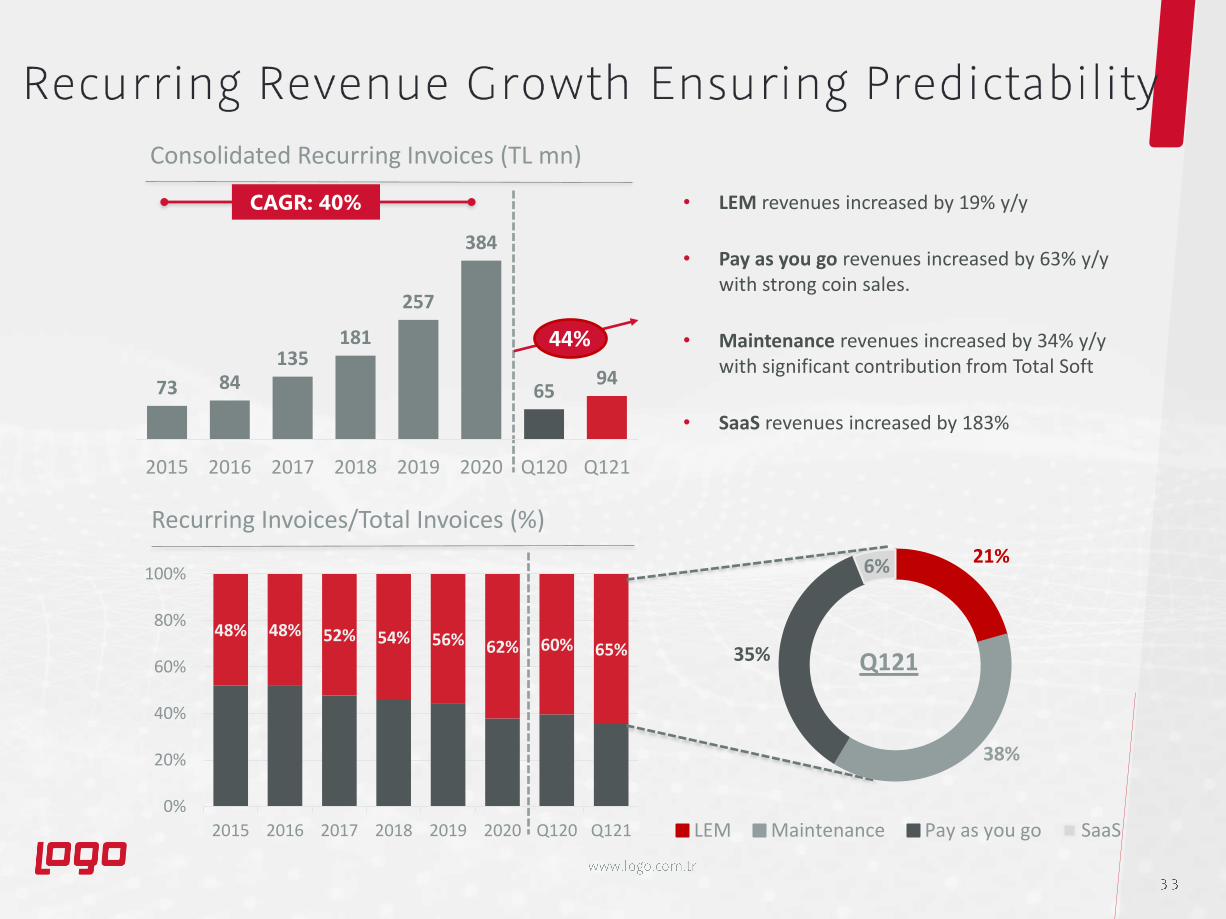
Consolidated Recurring Invoices (TL mn)
Recurring Invoices/Total Invoices (%)
CAGR: 40% • LEM revenues increased by 19% y/y
• Pay as you go revenues increased by 63% y/y with strong coin sales.
• Maintenance revenues increased by 34% y/y with significant contribution from Total Soft
• SaaS revenues increased by 183%
73 84135
181
257
384
6594
2015 2016 2017 2018 2019 2020 Q120 Q121
44%
48% 48% 52% 54% 56% 62% 60% 65%
0%
20%
40%
60%
80%
100%
2015 2016 2017 2018 2019 2020 Q120 Q121
21%
38%
35%
6%
LEM Maintenance Pay as you go SaaS
Q121

• All recurring revenue streams recorded substantial growth between 2016 and 2020, and recurring revenues’ share reached 62% in 2020 ensuring predictability going forward
• E-services’ coin sales is the main trigger for pay-as-you-go revenue growth
• Maintenance revenues’ major contributor is Romania operations
2016 2017 2018 2019 2020 4-yr-CAGR
Invoice revenues (TL mn) 175,8 259,1 333,0 460,1 617,7 37%
One-time 91,6 123,6 152,5 203,0 233,5 26%
share in total 52% 48% 46% 44% 38%
Recurring 84,1 135,5 180,5 257,2 384,2 46%
share in total 48% 52% 54% 56% 62%
Recurring invoice revenues (TL mn)
LEM 46,2 61,4 75,7 97,0 124,7 28%
share in recurring 55% 45% 42% 38% 32%
Pay-as-you-go 21,7 29,1 39,5 72,7 139,7 59%
share in recurring 26% 21% 22% 28% 36%
Maintenance 11,3 38,5 57,4 77,1 106,9 75%
share in recurring 13% 28% 32% 30% 28%
SaaS 5,0 6,5 7,9 10,3 12,8 26%
share in recurring 6% 5% 4% 4% 3%

Consolidated (TL mn) – As % of IFRS Revenue Total Soft (TL mn) – As % of IFRS Revenue
20% 20% 50% 52%
102
139
20 28
Q120 Q121
Revenue Cost of Sales
36%38
48
1925
Q120 Q121
Revenue Cost of Sales
30%
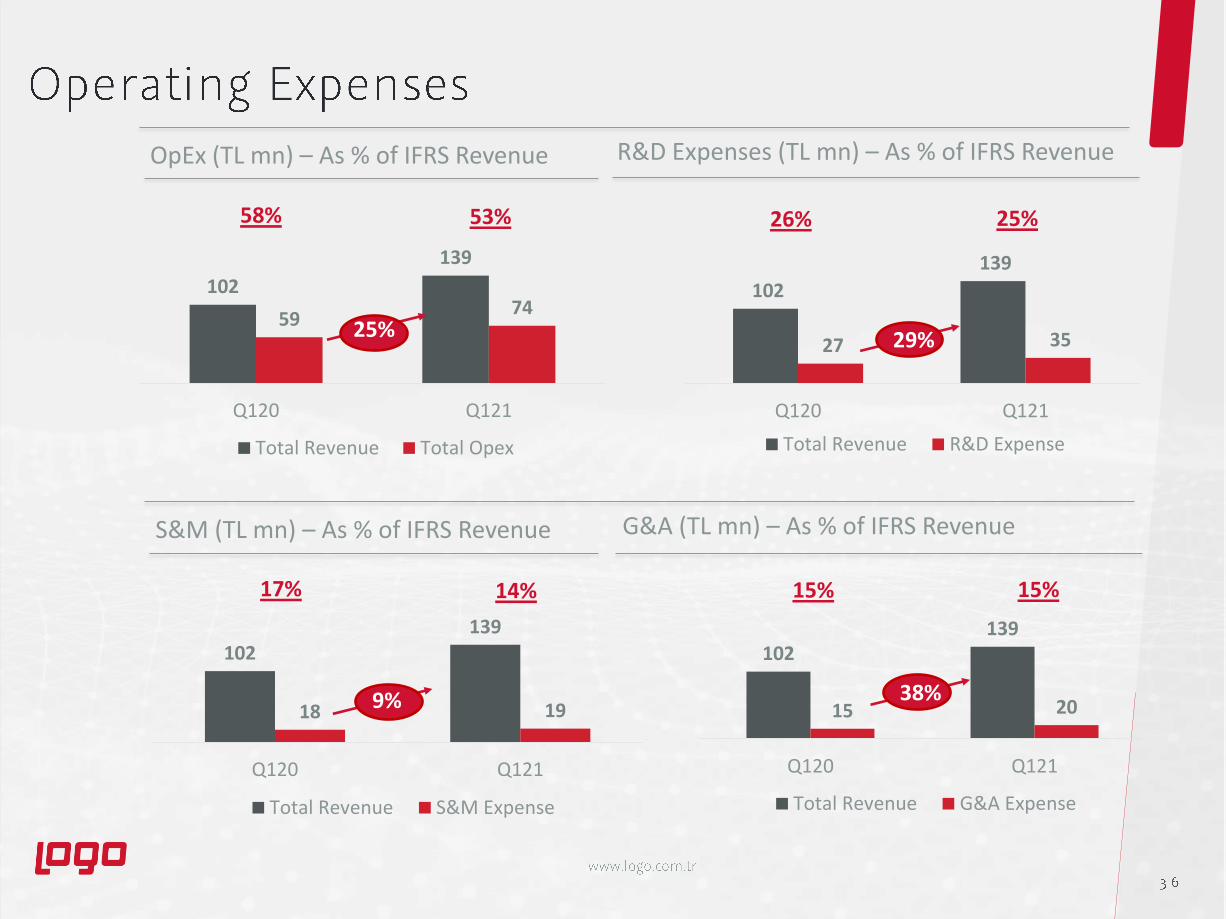
OpEx (TL mn) – As % of IFRS Revenue R&D Expenses (TL mn) – As % of IFRS Revenue
58% 53%
S&M (TL mn) – As % of IFRS Revenue G&A (TL mn) – As % of IFRS Revenue
17% 14%
26% 25%
15% 15%
102
139
27 35
Q120 Q121
Total Revenue R&D Expense
29%
102139
18 19
Q120 Q121
Total Revenue S&M Expense
9%
102139
15 20
Q120 Q121
Total Revenue G&A Expense
38%
102
139
5974
Q120 Q121
Total Revenue Total Opex
25%

R&D Spending (TL mn) – As % of Invoices
4157
77
99
123
146
3345
27%
33%30% 30%
27%24%
30% 31%
0%
5%
10%
15%
20%
25%
30%
35%
0
50
100
150
200
2015 2016 2017 2018 2019 2020 Q120 Q121
R&D Spending (TLmn) - LHS R&D Spending/Invoices -RHS
38%

Balance Sheet Highlights (TL mn) Working Capital (TL mn)
• Net cash is 161.5 TL mn at end-Q121 (excluding 21.6 TL mn IFRS 16 impact) vs 160.6 TL mn at end-2020 (excluding 19.2 TL mnIFRS 16 impact). Net cash of 297.8 TL mn together with 3.48% treasury shares @Mcap at end-Q121.
• WC is 24% of invoiced revenues, improving from 28% at end-2020.
* Includes goodwill** Adjusted by 3.48% treasury shares
Working capital: Trade receivables +Inventories – Trade payablesWC/Invoices figures are based on 12-mnth trailing invoices
2020 1Q21 ∆
Cash & Cash Eq. 293,7 319,1 9%
Trade Receivables 235,7 203,0 -14%
Tangible Assets 19,3 18,9 -2%
Intangible Assets* 470,2 506,8 8%
Other Assets 78,6 85,2 8%
Total Assets 1.097,5 1.133,0 3%
Total Liabilities 559,8 528,7 -6%
Total Shareholders’ Equity 537,8 604,3 12%
Total Liabilities and Equity 1.097,5 1.133,0 3%
Shareholders Equity Ratio 0,49 0,53 9%
Current Ratio 1,34 1,53 14%
EPS** 4,75 6,16 30%
62 77 85113
165 173149 158
41%44%
33% 34% 36%
28% 30%24%
0%
10%
20%
30%
40%
50%
2015 2016 2017 2018 2019 2020 Q120 Q121
0306090120150180210240270300330
Working Capital (RHS) WC as a % of Invoices (LHS)

Invoiced Revenue (TL mn)
IFRS Revenue (TL mn)
EBITDA** (TL mn)
EBT (TL mn)
2020 2021 guidance
41% 17% n.m. 45% 36%33% 19% n.m.
33% 2% n.m. 39% 27%22% 5% n.m.
Margins
Margins
*Investments = Logo Infosoft (India), Logo Kobi Digital (Turkey) and ELBA HR (Peoplise). Logo Infosoft (India) is recognized with equity method and does not have expense impact on consolidated figures.** IFRS 16 impact on consolidated EBITDA: +11.1 TL mn for 2020 and 9 TL mn for 2021 guidance.
+66%
+31%
+33%
+47%
429 615 560 802 179 226
6 16
150 177 221 260
30 43 -8
-8
361 545 489
728 179
226 6
15
118 118 190 196
411
-9
-11
LogoStandalone
Total Soft Investments* Consolidated LogoStandalone
Total Soft Investments* Consolidated


New communique’s details (October 19th, 2019)
e-invoice Companies w/sales 10mio₺+Companies w/sales 5mio₺+,
specific sectors
e-archive Companies w/sales 5mio₺+ and online sales
All e-invoice issuers and invoices above 5K and 30K
e-ledgerRequired to safekeep on
in-house server
Required to safekeep on in-house server, e-invoice integrator, GIB
e-dispatch Not mandatoryCompanies w/sales 25mio₺+,
specific sectors
e-selfemp.invoice Not mandatory
All self-employed professionals (doctors, lawyers, etc.)
BEFORE AFTER (eff. as of July 1st, 2020)