AMP Investor Presentation - December 2017 Goldman Sachs Conference FINAL · PDF file1...
35
Ameriprise Financial December 5, 2017 Brokerage, investments and financial advisory services are made available through Ameriprise Financial Services, Inc. Member FINRA and SIPC. Some products and services may not be available in all jurisdictions or to all clients. © 2017 Ameriprise Financial, Inc. All rights reserved.
Transcript of AMP Investor Presentation - December 2017 Goldman Sachs Conference FINAL · PDF file1...
Ameriprise Financial
December 5, 2017
Brokerage, investments and financial advisory services are made available through Ameriprise Financial Services, Inc.
Member FINRA and SIPC. Some products and services may not be available in all jurisdictions or to all clients.
© 2017 Ameriprise Financial, Inc. All rights reserved.
1
Forward-looking statements
The forward-looking statements in this presentation reflect management’s expectations about future events, plans and
performance. These forward-looking statements and the many assumptions upon which they are based involve risks and
uncertainties. A list of factors that could cause actual results to be materially different from those expressed or implied by
any of these forward-looking statements is detailed under the headings “Forward-Looking Statements” and “Risk
Factors”, and elsewhere, in our Annual Report on Form 10-K for the year ended December 31, 2016 and elsewhere in
our Quarterly Report on Form 10-Q for the quarter ended September 30, 2017. These forward-looking statements speak
only as of today's date and we undertake no obligation to update publicly or revise them for any reason. For information
about Ameriprise Financial, please refer to the Third Quarter 2017 Statistical Supplement available at ir.ameriprise.com.
Non-GAAP Financial Measures
This presentation contains certain non-GAAP financial measures that our management feels best reflect the underlying
performance of our operations. Reconciliations of such non-GAAP financial measures to the most directly comparable
GAAP financial measure have been provided along with the presentation.

Strategically positioned to seize large market opportunity
2
Ameriprise: a compelling investment opportunity
✓
✓
✓
✓
✓
Differentiated value proposition centered on providing comprehensive advice and strong performing solutions to clients and advisors✓
Fee-based business expansion delivering high ROE and EPS growth with multiple expansion✓
Excellent financial strength, substantial capital returns and value for shareholders through market cycles✓
✓

3
Diversified financial services leader
Leading wealth
and asset
management
businesses
Highly trusted
and respected
firm
Evolving
business mix and
navigating
industry change
Data as of 9-30-17
✓ $869 billion in AUM-A
✓ $145 billion balance sheet
✓ $13 billion to shareholders since 2010
✓ ~90% free cash flow generation
✓ More than doubled EPS since 2010
✓ $1.7 billion excess capital
4
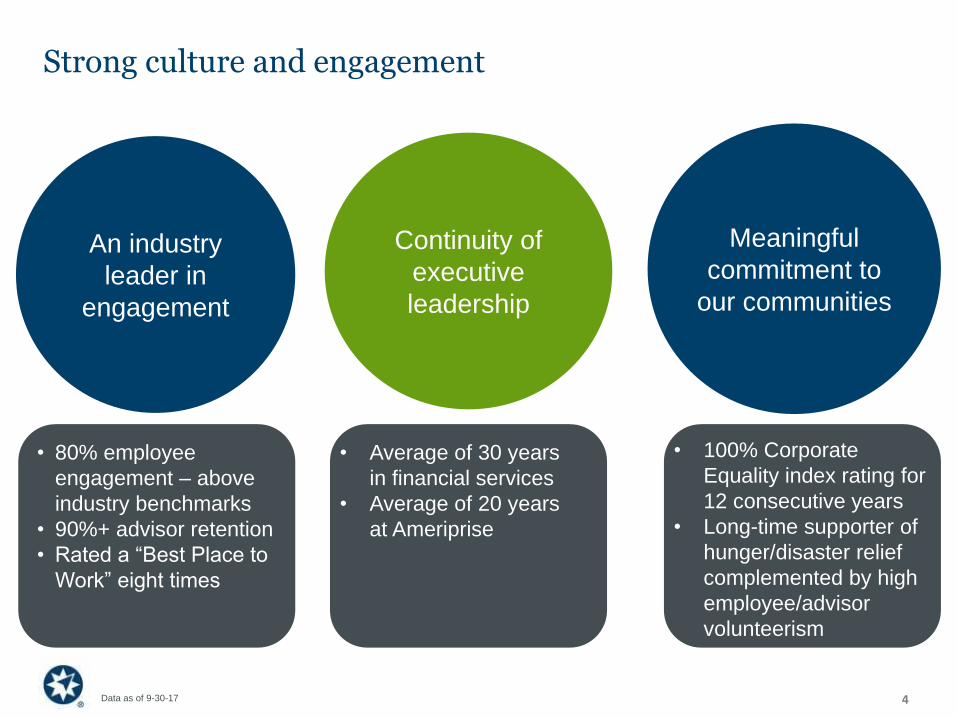
Strong culture and engagement
Continuity of
executive
leadership
An industry
leader in
engagement
Meaningful
commitment to
our communities
Data as of 9-30-17
• 80% employee
engagement – above
industry benchmarks
• 90%+ advisor retention
• Rated a “Best Place to
Work” eight times
• Average of 30 years
in financial services
• Average of 20 years
at Ameriprise
• 100% Corporate
Equality index rating for
12 consecutive years
• Long-time supporter of
hunger/disaster relief
complemented by high
employee/advisor
volunteerism

5
Significant Wealth Management opportunity with U.S. investable assets expected to nearly double over the next 15 years
2030E
$66
2025E
$53
2020E
$41
$37
U.S. investable assets$ in trillions
2016
See source information in the appendix

Our market opportunity spans generations of clients
An important part of our client
base and growth opportunity
Millions want advice from an
investment professional
Generation X
Want to be served by a person
who will guide their financial
future in a relationship supported
by technology
Millennials
Fast growing wealth segment
Controls ~50% of investable
assets
Investors with
$500K to $5MM
6See source information in the appendix

Ameriprise Advice & Wealth Management is positioned to win
The leaderin financial planning
in the U.S.
Recognized
and Respectedbrand
9,890financial advisors
(Top 5 branded)
$235Bin wrap assets
$550ktrailing twelve month
operating net revenue
per advisor
~70%of AMP earnings
driven by AWM
90%+advisor retention
Data as of 9-30-17
See source information in the appendix 7

8
Large opportunity for Advice & Wealth Management –target market is fast growing & our services are valued
60%of target affluent and
mass affluent
households prefer a
comprehensive
financial plan
49%of households are
engaged with an
advisor
39%have a detailed
financial plan
See source information in the appendix
Majority of our target affluent market prefers a comprehensive approach to advice

9
Ameriprise is highly respected in the marketplace
One of the most
Investment firms
trusted in customer ratings based on “unbiased
and puts myinterests first”
A Top Performer
in the investment industry in Net
Promoter Score
#1
See source information in the appendix

10
Powerful full service financial planning value proposition
✓
• Personal client-advisor relationships
• Face-to-face complemented with compelling
digital experience
• Well positioned with focus on goal-based
solutions
• Unique Confident Retirement® approach
contributing to high client satisfaction and
growth in assets
• Attractive advisor value proposition drives
strong advisor retention and experienced
advisor recruiting
• High share of wallet with strong asset
persistency
90% 94% 91%
feel more
confident
about
retirement
feel the advice
addresses their
needs
are committed
to implement
recommendations
Clients engaging in our
Confident Retirement approach
See source information in the appendix

11
Investing to deliver a compelling and consistent advisor and client experience
Training and leadership
Technology, security, privacy
Strong compliance program
Brand Advice value proposition
Digital experience
Advisor productivity
tools
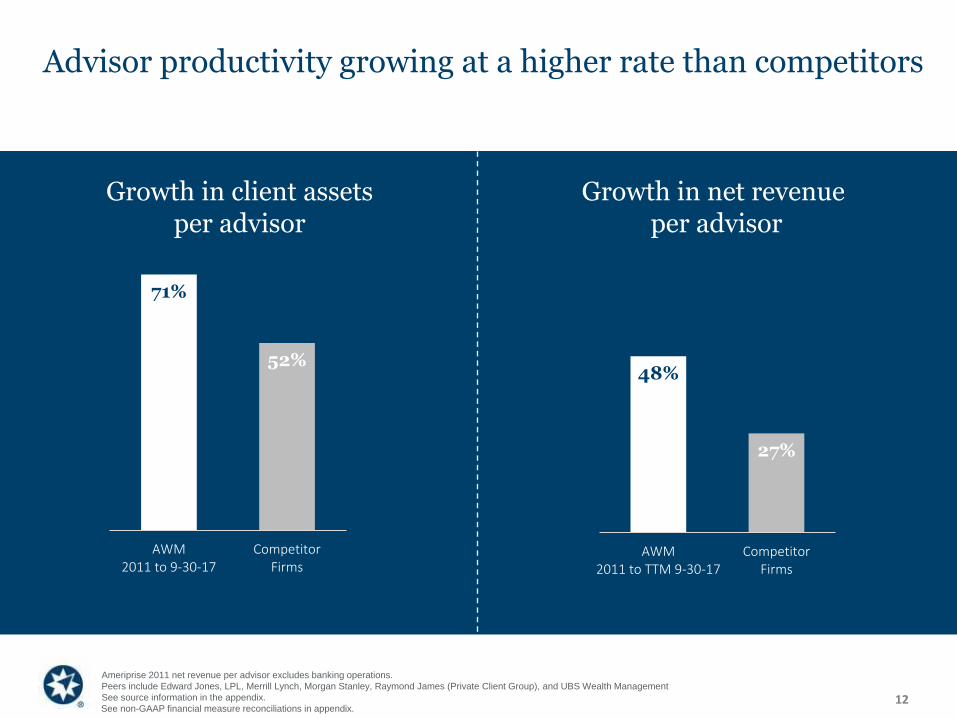
71%
52%
AWM2011 to 9-30-17
CompetitorFirms
12
Advisor productivity growing at a higher rate than competitors
Ameriprise 2011 net revenue per advisor excludes banking operations.
Peers include Edward Jones, LPL, Merrill Lynch, Morgan Stanley, Raymond James (Private Client Group), and UBS Wealth Management
See source information in the appendix.
Growth in client assetsper advisor
Growth in net revenue per advisor
48%
27%
AWM2011 to TTM 9-30-17
CompetitorFirms
See non-GAAP financial measure reconciliations in appendix.

$207
$304$103
$235
$310
$539
2011 9-30-2017
Other client assets Client wrap assets
$1.0 $1.1
$2.6
$4.2
$3.7
$5.3
10.9%
20.4%
0%
5%
10%
15%
20%
25%
30%
0
1
2
3
4
5
6
2011 TTM 9-30-2017
Non-recurring revenue Recurring revenue
Pretax operating margin
13
Strong Wealth Management results with room to grow
Operating net revenues & margin$ billions (except margin)
~80% Segment revenue
is recurring
Total client assets$ billions
Pretax operating earnings$ millions
$406
$1,091
2011 TTM 9-30-2017

Our Insurance and Annuities business has strong performance and provides important client solutions
100%affiliated distribution for life,
health and variable annuities
Top 15 life insurance provider
Top 15 variable annuity carrier
Affinity based Auto & Home carrier with
a leading client experience
Strong
Capital base
Core solutionsessential to our Confident
Retirement approach
ExcellentRatings
$100 billionclient AUM
14
$
%
Data as of 9-30-17
See source information in the appendix.

Solutions focus results in high client retention and a differentiated risk profile
5Xhigher retention
of clients who
own RiverSource
Insurance and
Annuity products
38%of variable annuity
account value does
not have a living
benefit rider
• Focused on product design and risk
management to meet Ameriprise client needs
• Consistent sales volume and market share
• Very low net amount at risk as a percent of
account value: 0.3% with living benefits and
0.1% with death benefits
• High-quality books are supported by
disciplined hedging strategy
15Data as of 9-30-17

Global AUM
16
Growth opportunity globally for Asset Management
Significant AUM growth in the U.S. and Europe
Accelerated growth rates in Asia,Latin America, Middle East
and Australia
Asia Pacific Latin America Middle East & Africa North America Europe
$75T2016 AUM
$85-90T2020E AUM
See source information in the appendix

Ameriprise is a leading asset manager
$484 billion in AUM with annual gross sales
of $80-100 billion
Top 15 long-term mutual funds in the U.S.
Top 5 retail ranking in the UK
115four- and five-star
Morningstar-rated funds
Institutionalpresence is strong
Globalpresence
Innovativeglobal product solutions
Benefiting from
strategicrelationships
17
$
1. Data as of 9-30--2017
See source information in the appendix.
Competitive margins and earnings growth
$
1
1

$411$73
18
We are increasing third-party assets under management
$310 $147 Q3 20172010
Assets Under Management ($ in billions)
Former Parent Related Third-party & Affiliated
90%+ of net
management
fees are from
third-party and
affiliated AUM

19
Adjusting to industry headwinds with more work to do
Distribution: Deepen retail and institutional relationships globally
Operating efficiency: Supporting business growth by transitioning
to a single back-, middle- and front-office platform in 2018
Proven product expertise
Credit
High-conviction equity
Asset allocation
Solutions
Strategic Beta
Adding offerings in
higher-demand categories
Multi-asset solutions
Adaptive risk
Global
Strategic Beta / ETF
Responsible Investment / ESG
Third-party flow
rate within range
of active peers
Product: Helping clients and advisors address investor goals

$436
$484
2011 9-30-2017
$2.9 $3.0
33%
37%
2011 TTM 9-30-17
Revenue Adjusted net pretax operating margin
20
Delivering competitive earnings & margins
Operating net revenues & margin$ in billions (except margin)
Assets Under Management$ in billions
Pretax operating earnings$ in millions
$528
$695
2011 TTM 9-30-2017
35-39%
Margin1
maintained
through
expense
discipline
1. Adjusted net pretax operating margin
See non-GAAP financial measure reconciliations in appendix.

21
Solution focused business - targeting 75% of earnings from lower capital, fee-based businesses
Pre-tax Operating Earnings(excluding Corporate & Other)
>75%
Q3
2017
68%
32%
2011
49%
51%
Near-term
Objective
<25%
Advice & Wealth Management and Asset Management Insurance and Annuities
Q3 2017 excludes unlocking impacts
See non-GAAP financial measure reconciliations in appendix.

$5.21
$11.35
2011 TTM 9-30-2017
$10.1$11.8
2011 TTM 9-30-2017
16.1%
29.8%
2011 9-30-2017
1. Excludes impact of unlocking
2. Accumulated other comprehensive income
We consistently deliver both strong financial and shareholder results
Operating EPS1 $
Operating Total Net Revenue1 $ in billions
Operating ROE (ex. AOCI1,2) %
22See non-GAAP financial measure reconciliations in appendix.

Ameriprise delivers growth with lower volatility than peers
23
1. Calculated on a quarterly basis.
Peers include Edward Jones (pretax earnings only), LPLA, RJF, AB, AMG, EV, IVZ, LM, TROW, LNC, PFG and PRU; peer data excluded when not meaningful.
See source information in the appendix.
Operating Earnings 2011 – TTM 9-30-2017
Ameriprise
Asset Manager
Peers
Pretax earnings volatility1 EPS CAGR
9%
10%
10%
15%
24%
26%
30%
17%
Advice & Wealth
Management Peers
Insurance &
Annuities Peers
See non-GAAP financial measure reconciliations in appendix.

24
With a differentiated and sustainable level of capital return
1. Peer dividends and share buybacks as a percentage of net income.
2017 Totals YTD through 9/30/2017
Peers include: LPLA, RJF, SCHW, AB, BLK, IVZ, BEN, LM, LNC, MET, PFG, PRU, TMK, UNM, PRI
See non-GAAP financial measure reconciliations in appendix.
See appendix for source information
2011 – 2017
Dividend Payout1
2011 - 2017
Share Buyback
Payout1
2011 - 2017
Total
Payout1
Ameriprise Financial 27% 98% 125%
Broker Dealer Peer Average 27% 13% 40%
Asset Manager Peer Average 40% 52% 92%
Insurance & Annuity Peer Average 30% 40% 70%
Returned ~$13 billion to shareholders over the past 7 years
25
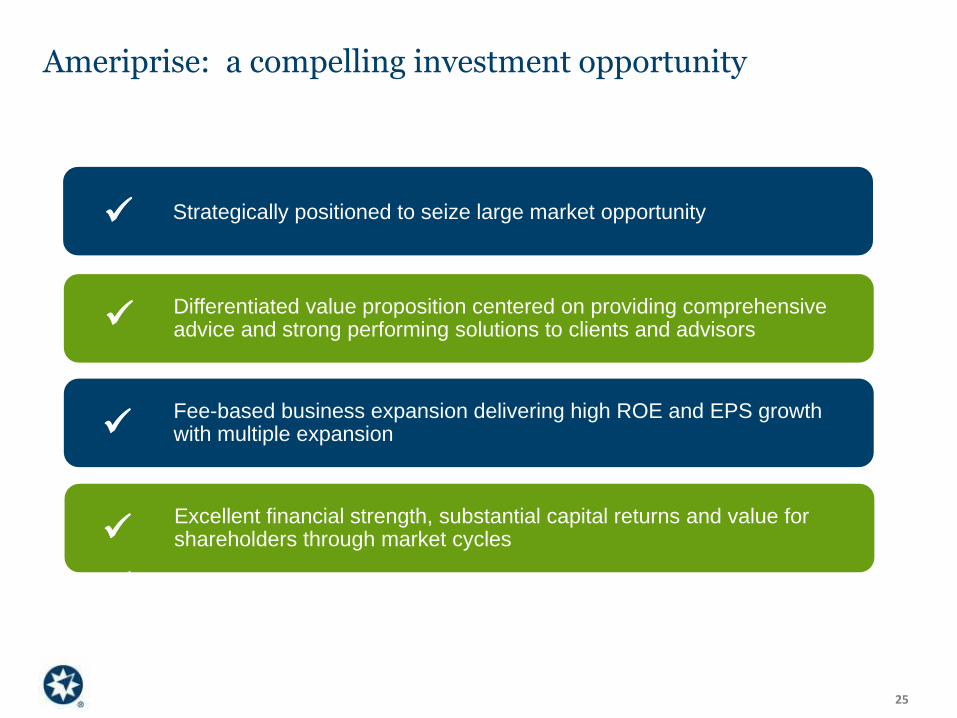
Ameriprise: a compelling investment opportunity
Strategically positioned to seize large market opportunity ✓
✓
✓
✓
✓
Differentiated value proposition centered on providing comprehensive advice and strong performing solutions to clients and advisors✓
Fee-based business expansion delivering high ROE and EPS growth with multiple expansion✓
Excellent financial strength, substantial capital returns and value for shareholders through market cycles✓
✓

26
Source information
Significant wealth management opportunity with U.S. investable assets expected to nearly double over the next 15 years
Federal Reserve Survey of Consumer Finances – multiple years; Federal Reserve, Financial Accounts of the United States, Z.1
Our market opportunity spans generations of clients
Ameriprise Financial research. Federal Reserve Survey of Consumer Finances – multiple years; Federal Reserve, Financial Accounts of
the United States, Z.1.
Ameriprise Advice & Wealth Management is positioned to win
Leader in Financial Planning – Ameriprise helped pioneer the financial planning process more than 30 years ago. We have more
CERTIFIED FINANCIAL PLANNER™ professionals than any other company in the U.S. as documented by the Certified Financial
Planner Board of Standards, Inc., as of Dec. 31, 2016.
Top 5 branded advisor force – Based on company filings as of Q3 2017
Large opportunity for Advice & Wealth Management – target market is fast growing & our services are valued
Ameriprise Financial Market Segmentation survey, February 2017
Ameriprise is highly respected in the marketplace
One of the most trust investment firms – Temkin Group 2017 Trust Ratings, www.temkinratings.com
Top performer in customer ratings based on “unbiased and puts my interests first” – Hearts & Wallets 2016 Wants and Pricing Report
from the Hearts & Wallets IQ DatabaseTM Hearts and Wallets conducted a survey in 2016 of 5,216 investors.
#1 in the investment industry Net Promoter Score – Rating based on responses to a consumer survey as part of the Temkin Group 2016
Net promoter Score® Benchmark Study. See www.temkingroup.com for more.
Powerful full service financial planning value proposition
Ameriprise Financial Confident Retirement Client survey, Jan. 2015 - Dec. 2016. The Confident Retirement approach is not a guarantee
of future financial results.
Advisor productivity growing at a higher rate than competitors
Capital IQ and company filings

27
Source information
Our Insurance and Annuities business has strong performance and provides important client solutions
Top 15 variable annuity carrier – LIMRA International, Q2 2017
Top 15 life insurance provider (VUL total assets) – LIMRA International, Q2 2017
Growth opportunity globally for Asset Management
2020 estimate from PWC based on PWC’s CAGR of ~5.2% to 2016 global AUM from sources below. McKinsey “Thriving in the New
Abnormal, NA Asset Management”, November 2016; Boston Consulting Group, “Global Asset Management 2016: Doubling Down on Data”,
July 2016; Casey Quirk press release August 2016; “The World Turned Upside Down”, Morgan Stanley Research, Oliver Wyman, 2017.
Ameriprise is a leading asset manager
Top 15 long-term mutual funds in the U.S. – ICI Complex Assets report, data through September 2017.
Top 5 retail ranking in the UK – Investment Management Association, data as of May 2017.
Ameriprise delivers growth with lower volatility than peers
S&P Capital IQ and company filings
With a differentiated and sustainable level of capital return
SNL Financial and Bloomberg

28
Reconciliation tables
For Advice & Wealth Management operating net revenue per advisor
($ in millions)
TTM
2011 9/30/2017
Advice & Wealth Management operating total net revenues 3,713$ 5,342$
Less: Operating total net revenues attributable to former banking operations 116 -
Advice & Wealth Management operating total net revenues excluding former
banking operations 3,597$ 5,342$

29
Reconciliation tables
Asset Management adjusted net pretax operating margin
($ in millions) TTM
2011 9-30-2017
Operating total net revenues 2,897$ 3,013$
Less: Distribution pass through revenues 833 802
Less: Subadvisory and other pass through revenues 385 368
Adjusted operating revenues 1,679$ 1,843$
Pretax operating earnings 528$ 695$
Less: Operating net investment income 11 21
Add: Amortization of intangibles 40 17
Adjusted operating earnings 557$ 691$
Pretax operating margin 18.2% 23.1%
Adjusted net pretax operating margin 33.2% 37.5%
30
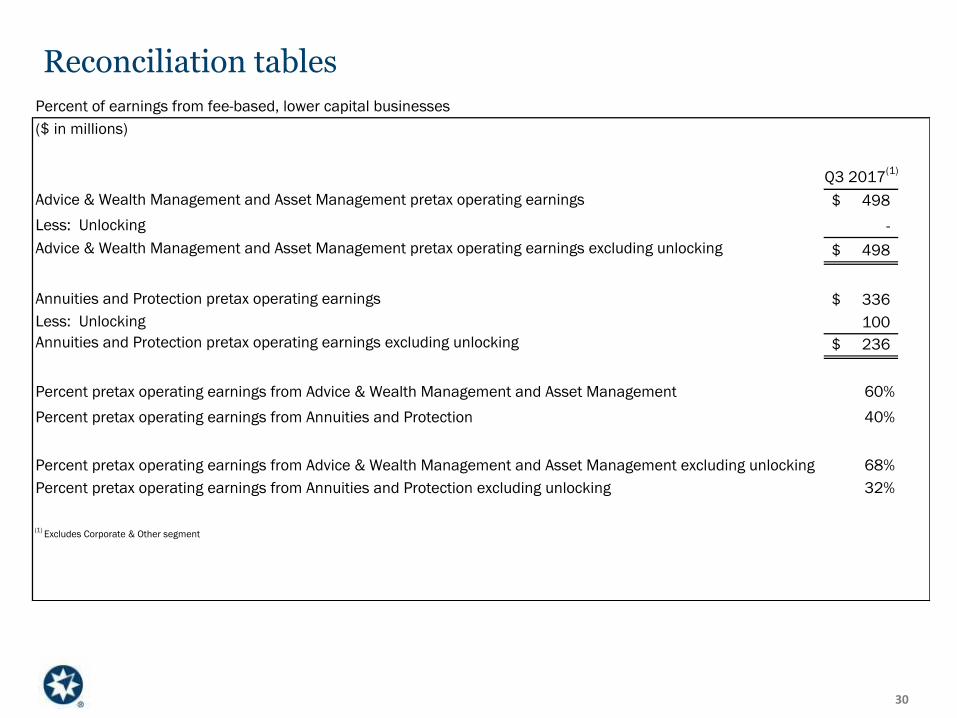
Reconciliation tables
Percent of earnings from fee-based, lower capital businesses
($ in millions)
Q3 2017(1)
Advice & Wealth Management and Asset Management pretax operating earnings 498$
Less: Unlocking -
Advice & Wealth Management and Asset Management pretax operating earnings excluding unlocking 498$
Annuities and Protection pretax operating earnings 336$
Less: Unlocking 100
Annuities and Protection pretax operating earnings excluding unlocking 236$
Percent pretax operating earnings from Advice & Wealth Management and Asset Management 60%
Percent pretax operating earnings from Annuities and Protection 40%
Percent pretax operating earnings from Advice & Wealth Management and Asset Management excluding unlocking 68%
Percent pretax operating earnings from Annuities and Protection excluding unlocking 32%
(1) Excludes Corporate & Other segment

31
Reconciliation tables
Operating net revenues
($ in millions) TTM
2011 9-30-2017
Total net revenues 10,192$ 11,929$
Less: CIEs revenue 136 121
Less: Net realized investment gains (losses) 6 46
Less: Market impact on indexed universal life benefits - (1)
Less: Market impact of hedges on investments - 49
Operating total net revenues 10,050 11,714
Less: Unlocking (20) (47)
Operating total net revenues excluding unlocking 10,070$ 11,761$

32
Reconciliation tablesOperating earnings per diluted share
($ in millions, except per share amounts)
TTM TTM
2011 9-30-2017 2011 9-30-2017
Net income attributable to Ameriprise Financial 1,116$ 1,699$ 4.53$ 10.72$
Less income (loss) from discontinued operations, net of tax (60) - (0.24) -
Net income from continuing operations attributable to Ameriprise Financial 1,176 1,699 4.77 10.72
Less net income (loss) attributable to the CIEs - - - -
Market impact on variable annuity guaranteed benefits(1)
62 336 0.25 2.12
Market impact on indexed universal life benefits(1)
- 11 - 0.07
Market impact of hedges on investments(1)
- (49) - (0.31)
Integration/restructuring charges(1)
95 1 0.39 0.01
Net realized investment losses (gains)(1)
(6) (44) (0.02) (0.28)
Tax effect of adjustments(2)
(53) (90) (0.22) (0.57)
Operating earnings 1,274 1,864 5.17 11.76
Less: Pretax impact of unlocking (14) 99 (0.06) 0.63
Less: Tax effect of unlocking(2)
5 (35) 0.02 (0.22)
Operating earnings excluding unlocking 1,283$ 1,800$ 5.21$ 11.35$
Weighted average common shares outstanding:
Basic 241.4 156.3
Diluted 246.3 158.5 (1)
Pretax operating adjustments.
(2) Calculated using the statutory tax rate of 35%.
Per Diluted Share

33
Reconciliation tablesOperating return on equity
($ in millions) Twelve Months Ended Twelve Months Ended
December 31, September 30,
2011 2017
Net income attributable to Ameriprise Financial 1,116$ 1,699$
Less: Income (loss) from discontinued operations, net of tax (60) -
Net income from continuing operations attributable to Ameriprise Financial 1,176 1,699
Less: Adjustments (1)
(98) (165)
Operating earnings 1,274 1,864
Less: Unlocking, net of tax (2)
(9) 64
Operating earnings excluding unlocking 1,283$ 1,800$
Total Ameriprise Financial, Inc. shareholders' equity 9,164$ 6,369$
Less: Assets and liabilities held for sale 29 -
Less: Accumulated other comprehensive income, net of tax 701 325
Total Ameriprise Financial, Inc. shareholders' equity from continuing
operations excluding AOCI 8,434 6,044
Less: Equity impacts attributable to the consolidated investment entities 478 1
Operating equity 7,956$ 6,043$
Return on equity, excluding AOCI 13.9% 28.1%
Operating return on equity, excluding AOCI (3)
16.0% 30.8%
Operating return on equity, excluding AOCI and unlocking 16.1% 29.8%
(3) Operating return on equity excluding accumulated other comprehensive income (AOCI) is calculated using the trailing twelve months of earnings excluding the after-tax net realized investment gains/losses, net of DSIC and DAC
amortization, unearned revenue amortization and the reinsurance accrual; market impact on variable annuity guaranteed benefits, net of hedges and related DSIC and DAC amortization; the market impact on indexed universal
life benefits, net of hedges and related DAC amortization, unearned revenue amortization, and the reinsurance accrual; the market impact of hedges to offset interest rate changes on unrealized gains or losses for certain
investments; integration/restructuring charges; the impact of consolidating certain investment entities; and discontinued operations in the numerator, and Ameriprise Financial shareholders' equity excluding AOCI; the impact of
consolidating investment entities; and the assets and liabilities held for sale using a five-point average of quarter-end equity in the denominator. After-tax is calculated using the statutory tax rate of 35%.
(1) Adjustments reflect the trailing twelve months' sum of after-tax net realized investment gains/losses, net of deferred sales inducement costs ("DSIC") and deferred acquisition costs ("DAC") amortization, unearned revenue
amortization and the reinsurance accrual; the market impact on variable annuity guaranteed benefits, net of hedges and related DSIC and DAC amortization; the market impact on indexed universal life benefits, net of hedges and
related DAC amortization, unearned revenue amortization, and the reinsurance accrual; the market impact of hedges to offset interest rate changes on unrealized gains or losses for certain investments; integration/restructuring
charges; and the impact of consolidating certain investment entities. After-tax is calculated using the statutory tax rate of 35%.
(2) After-tax is calculated using the statutory tax rate of 35%.
34
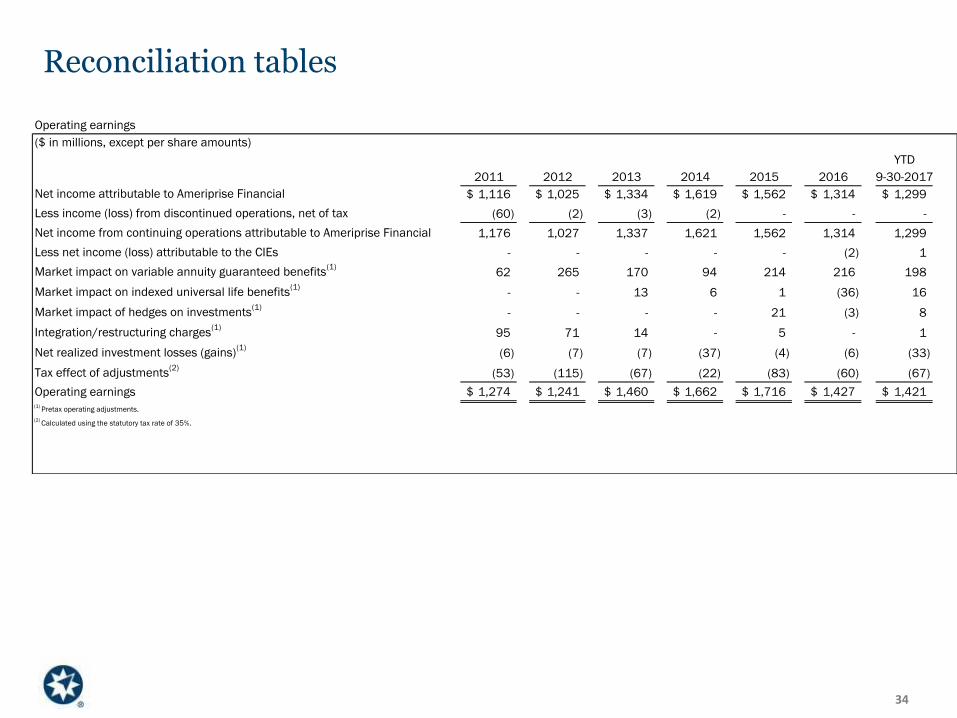
Reconciliation tables
Operating earnings
($ in millions, except per share amounts)
YTD
2011 2012 2013 2014 2015 2016 9-30-2017
Net income attributable to Ameriprise Financial 1,116$ 1,025$ 1,334$ 1,619$ 1,562$ 1,314$ 1,299$
Less income (loss) from discontinued operations, net of tax (60) (2) (3) (2) - - -
Net income from continuing operations attributable to Ameriprise Financial 1,176 1,027 1,337 1,621 1,562 1,314 1,299
Less net income (loss) attributable to the CIEs - - - - - (2) 1
Market impact on variable annuity guaranteed benefits(1)
62 265 170 94 214 216 198
Market impact on indexed universal life benefits(1)
- - 13 6 1 (36) 16
Market impact of hedges on investments(1)
- - - - 21 (3) 8
Integration/restructuring charges(1)
95 71 14 - 5 - 1
Net realized investment losses (gains)(1)
(6) (7) (7) (37) (4) (6) (33)
Tax effect of adjustments(2)
(53) (115) (67) (22) (83) (60) (67)
Operating earnings 1,274$ 1,241$ 1,460$ 1,662$ 1,716$ 1,427$ 1,421$ (1)
Pretax operating adjustments.
(2) Calculated using the statutory tax rate of 35%.