WELCOME TO DIS-CHEM’S INVESTOR DAY MSDS (Cape Town DC) Adventure Commercial Holdings (Pty) Ltd...
27
WELCOME TO DIS-CHEM’S INVESTOR DAY July 2018
-
Upload
hoangkhanh -
Category
Documents
-
view
213 -
download
0
Transcript of WELCOME TO DIS-CHEM’S INVESTOR DAY MSDS (Cape Town DC) Adventure Commercial Holdings (Pty) Ltd...

WELCOME TO DIS-CHEM’SINVESTOR DAY
July
2018

2
Agenda
HIGHLIGHTS OF THE SENS ANNOUNCEMENT
SINGLE EXIT PRICE (SEP)
WHOLESALE
RETAIL
OTHER
GUIDANCE

3
HIGHLIGHTS OF THE
SENS ANNOUNCEMENT
4
Highlights of the SENS announcement
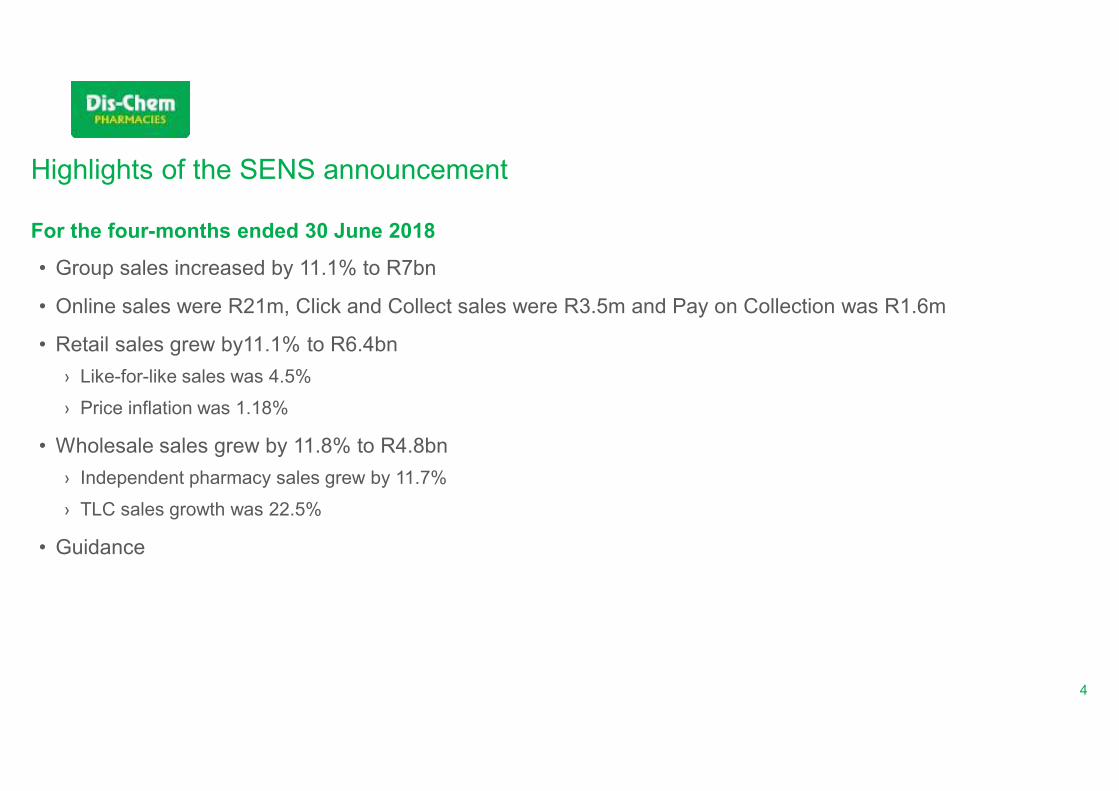
For the four-months ended 30 June 2018
• Group sales increased by 11.1% to R7bn
• Online sales were R21m, Click and Collect sales were R3.5m and Pay on Collection was R1.6m
• Retail sales grew by11.1% to R6.4bn
› Like-for-like sales was 4.5%
› Price inflation was 1.18%
• Wholesale sales grew by 11.8% to R4.8bn
› Independent pharmacy sales grew by 11.7%
› TLC sales growth was 22.5%
• Guidance

5
SINGLE EXIT PRICE (SEP)
6
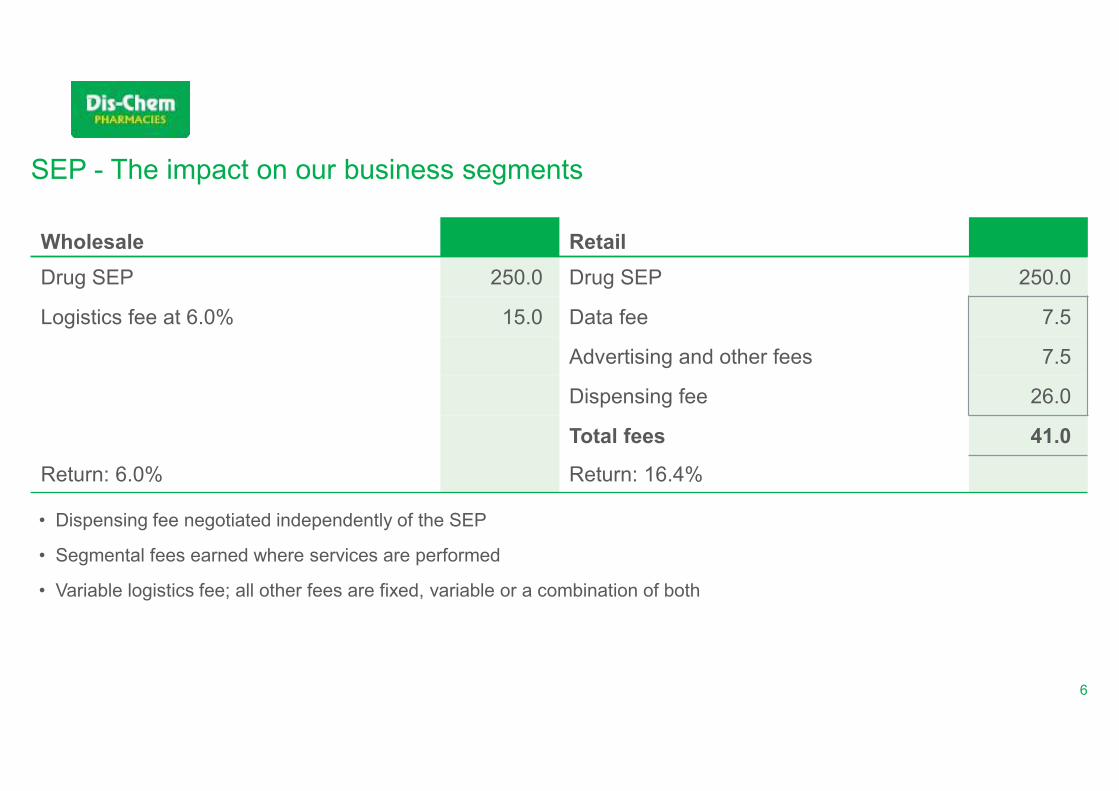
SEP - The impact on our business segments
• Dispensing fee negotiated independently of the SEP
• Segmental fees earned where services are performed
• Variable logistics fee; all other fees are fixed, variable or a combination of both
Wholesale Retail
Drug SEP 250.0 Drug SEP 250.0
Logistics fee at 6.0% 15.0 Data fee 7.5
Advertising and other fees 7.5
Dispensing fee 26.0
Total fees 41.0
Return: 6.0% Return: 16.4%

7
The impact of SEP on our business
Example 1: Buy-in of stock
FY2017 March 2016 June 2016 February 2017
SEP = R243.91 SEP = R250.00
Buy-in 100 units at R233.40 (1H) 4.50% 2.50% Rand
Buy-in 100 units at R243.91 (2H) Sell: 100 at R243.91 24 391.00 Sell: 100 at R250.00 25 000.00
Bought at R233.40 (23 339.71) Bought at R243.91 (24 391.00)
Profit 1 051.29 Profit 609.00
FY2018 March 2017
SEP = R268.75 R
February 2018
7.50% Rand
Buy-in 100 units at R250.00 (1H) Sell: 100 at R268.75 26 875.00 Sell: 100 at R268.75 26 875.00
Bought at R250 (25 000.00) Bought at R268.75 (26 875.00)
Profit 1 875.00 Profit 0.00
FY2019 March 2018
SEP = R272.14February 2019
1.26% Rand
Sell: 100 at R272.14 27 213.63 Sell: 100 at R272.14 27 213.63
Bought at R272.14 (27 213.63) Bought at R272.14 (27 213.63)
Profit 0.00 Profit 0.00
8
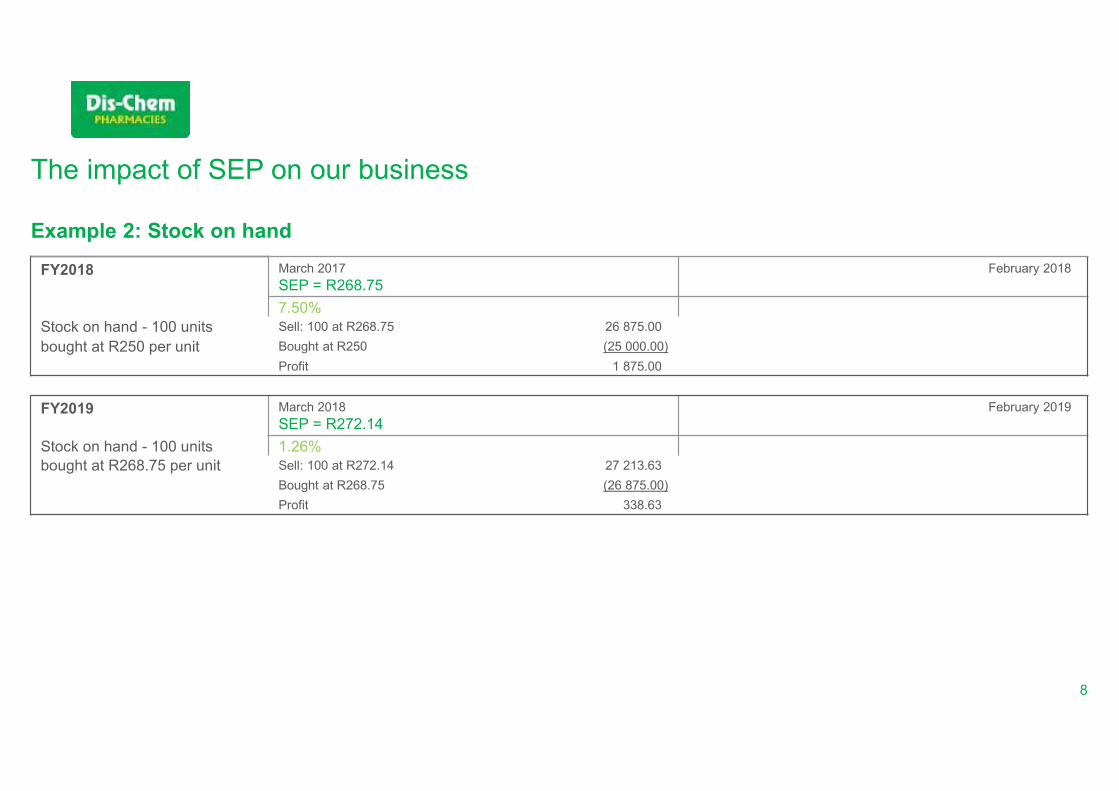
The impact of SEP on our business
Example 2: Stock on hand
FY2018 March 2017
SEP = R268.75 R
February 2018
7.50%
Stock on hand - 100 units Sell: 100 at R268.75 26 875.00
bought at R250 per unit Bought at R250 (25 000.00)
Profit 1 875.00
FY2019 March 2018
SEP = R272.14February 2019
Stock on hand - 100 units 1.26%
bought at R268.75 per unit Sell: 100 at R272.14 27 213.63
Bought at R268.75 (26 875.00)
Profit 338.63
9
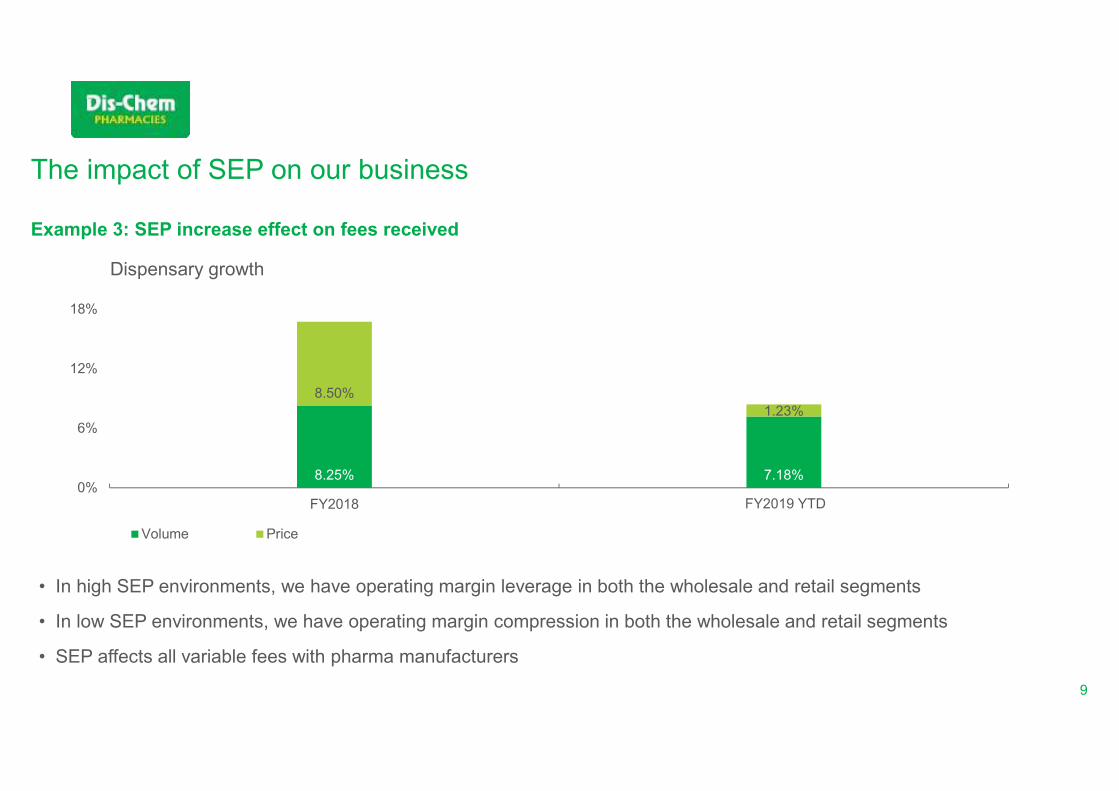
The impact of SEP on our business
• In high SEP environments, we have operating margin leverage in both the wholesale and retail segments
• In low SEP environments, we have operating margin compression in both the wholesale and retail segments
• SEP affects all variable fees with pharma manufacturers
8.25% 7.18%
8.50%
1.23%
0%
6%
12%
18%
FY2018 FY2019
Volume Price
FY2019 YTD
Example 3: SEP increase effect on fees received
Dispensary growth

10
WHOLESALE

11
Composition and growth of Wholesale turnover
4 months to June 2017 4 months to June 2018
Turnover growth
over the 4 month period
Midrand
Internal 99.4% 98.3% (4.5%)
Independent 0.5% 1.1% 91.6%
TLC 0.1% 0.6% 327.2%
KwaZulu-Natal
Internal 98.6% 95.9% 85.3%
Independent 0.8% 1.4% 247.1%
TLC 0.6% 2.7% 840.9%
Cape Town
Internal 99.7% 99.7% 275.0%
Independent 0.3% 0.3% 349.1%
TLC n/a n/a n/a
Delmas
Internal 39.4% 43.5% 21.6%
Independent 37.8% 33.4% (2.7%)
TLC 22.8% 23.0% 10.7%
Contribution to total sales

12
Ownership structure of the different distribution centres
Columbia Falls
(Midrand DC)
The Bental
Group
(50%)
Dis-Chem
Adventures Trust
(50%)
Josneo
(KZN DC)
Adventure Commercial
Holdings (Pty) Ltd
(100%)
MSDS
(Cape Town DC)
Adventure Commercial
Holdings (Pty) Ltd
(100%)
76.2
11.9
5.9
2.02.01.01.0
Ivlyn (Pty) Ltd
SGFT Investments
Niajul (Pty) Ltd
Busdis (Pty) Ltd
Kevlu (Pty) Ltd
Melnique (Pty) Ltd
Sauta (Pty) Ltd
Adventure Commercial Holdings (Pty) Ltd (%)
78
12
6
22
Ivlyn (Pty) Ltd
SGFT Investmetns
Niajul (Pty) Ltd
Kevlu (Pty) Ltd
Busdis (Pty) Ltd
Dis-Chem Adventures Trust (%)

13
Lease term disclosures
Midrand Cape Town Kwa-Zulu Natal
Type of lease Financial Operating Operating
Lease period 30-years 10-years 10-years
Annual escalation 8% 7% 7%
Review clause period 7-years 5-years 5-years
• All future acquisition terms will be disclosed in detail

14
RETAIL

15
Site identification
Geo-coded loyalty data
and analysed catchment
area penetration
Bottom-up estimation of
Dis-Chem potential for
South Africa
Identified micro-markets
with incremental
opportunity
Identified characteristics
of each market
Overlay potential with
script data to validate
results
• Geo-coded loyalty card
holders
• Each customer linked
to a specific census area
(100 000 areas across
SA with ~250
households in each)
• Calculated Dis-Chem
loyalty card penetration
for each census area
(i.e. percentage of total
households in census
area with a loyalty card)
• Estimate Dis-Chem
potential per census
area
• Household spend per
census area used to
estimate total value
• Dis-Chem penetration
based on loyalty card
data used to estimate
Dis-Chem potential in
census area
• Summed up for whole of
SA
• Identify top potential
markets (many census
areas) across country,
ranking market potential
by value
• 2.5km radius in metro
and 10km radius in
non-metro markets
• Size of opportunity,
degrees of penetration
and competition used to
categorise markets
• Competition
disaggregated into
independents and
Dis-Chem presence
• Assign each market
potential action
archetypes
• Overlay size of script
market in each area
• Use combination of
incremental market
potential to estimate
stores per market
• Use incremental script
market potential to
validate results
16
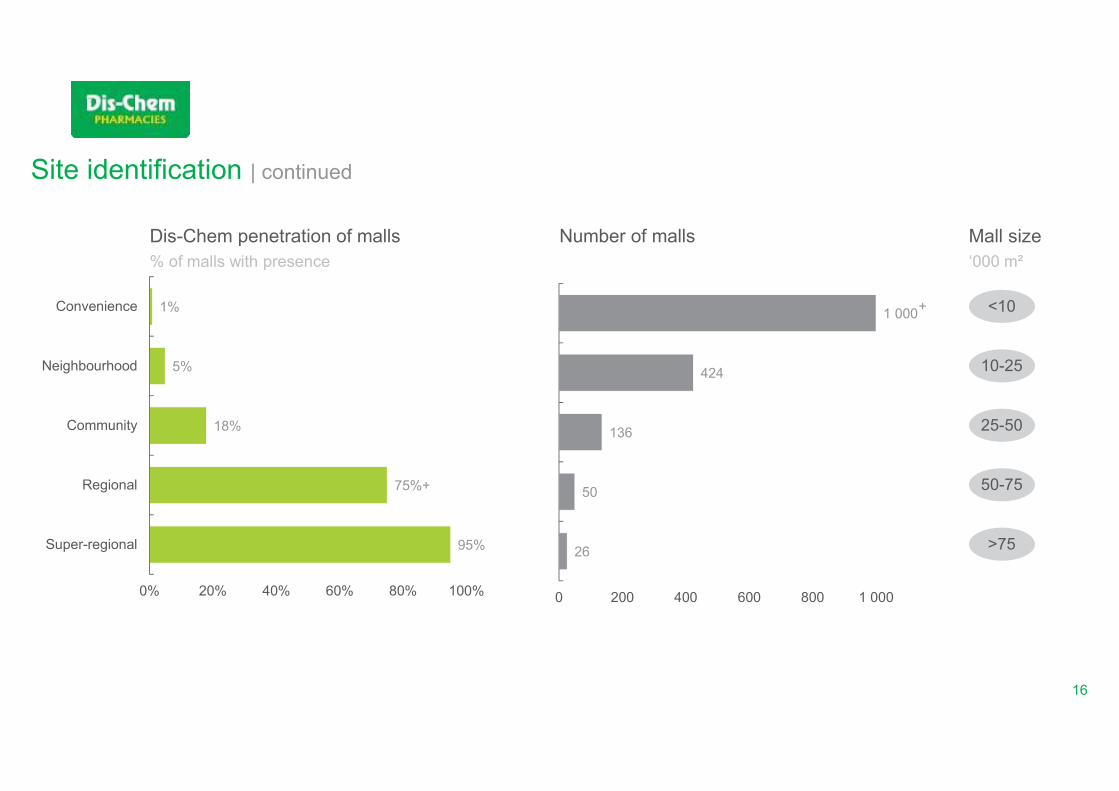
26
50
136
424
1 000
0 200 400 600 800 1 000
Site identification | continued
95%
75%+
18%
5%
1%
0% 20% 40% 60% 80% 100%
Super-regional
Regional
Community
Neighbourhood
Convenience
Dis-Chem penetration of malls
% of malls with presence
Number of malls Mall size
‘000 m²
+ <10
10-25
25-50
50-75
>75

17
Store formats
Format type
Number
of stores FY18
New
stores FY19
Centre
type
Trading
space
Product
range
Minority
partner
Big Box Format 116 10Super regional/
Regional
1000 m²
plus
Full core
and ancillaryUnlikely
Smaller Format 8 8Community/
Convenience
650 m² to
1 000 m²
95% core
No ancillaryPossible
Dis-Chem TLC 22
(plus another
potential seven)
Neighbourhood/
Residential
350 m² to
650 m²
75% core
No ancillaryVery likely
18
0
50 000
100 000
150 000
200 000
250 000
FY14 FY15 FY16 FY17 FY18 FY19
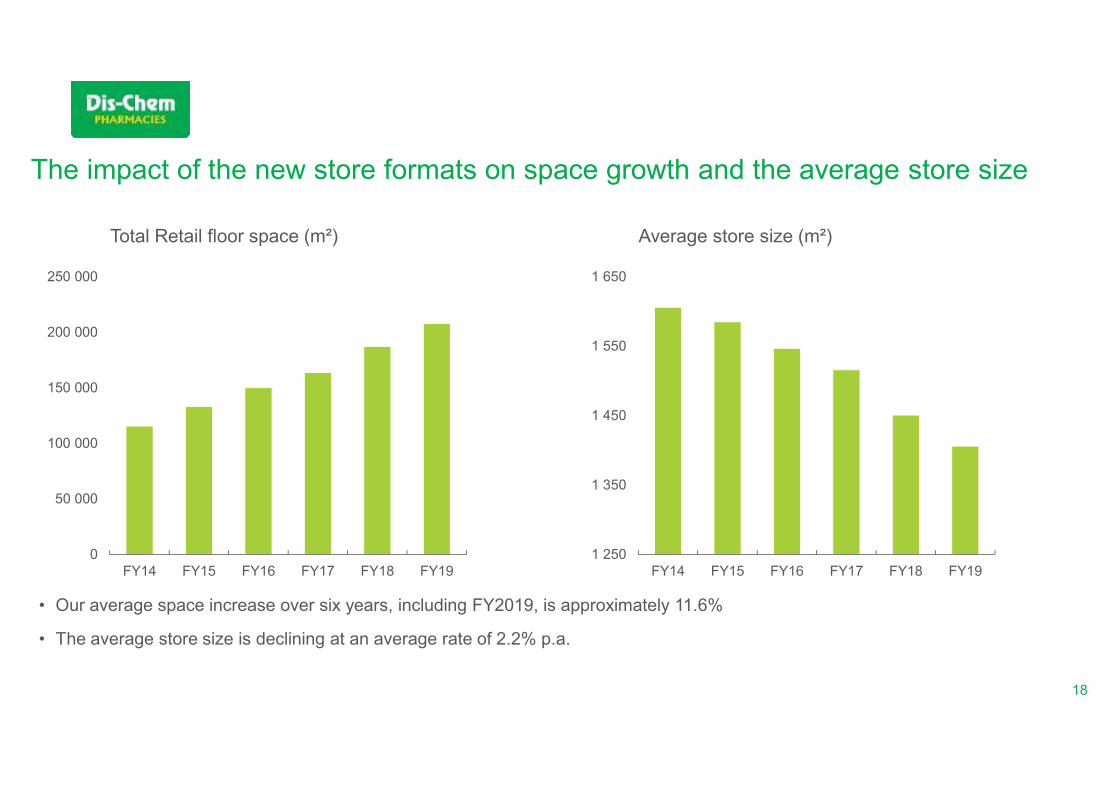
The impact of the new store formats on space growth and the average store size
Total Retail floor space (m²)
1 250
1 350
1 450
1 550
1 650
FY14 FY15 FY16 FY17 FY18 FY19
Average store size (m²)
• Our average space increase over six years, including FY2019, is approximately 11.6%
• The average store size is declining at an average rate of 2.2% p.a.

19
Dispensary market share underpins trading density by province
13.1%
R61.3k/m²
15.5%
R112.6k/m²
25.2%
R95.4k/m²
12.6%
R93.1k/m²
12.7%
R94.4k/m²
10.1%
R90.7k/m² 17.1%
R90.7k/m²
12.9%
R87.5k/m²
9.8%
R84.6k/m²
Province and number
of stores
Mature store
densities 000/m²
Non-mature store
densities 000/m²
Eastern Cape (5) 93.2 49.9
Free State (3) 78.5 115.0
Gauteng (71) 118.1 67.7
KwaZulu-Natal (16) 94.7 48.3
Limpopo (3) 61.4 61.3
Mpumalanga (4) 95.6 75.2
North West (4) 112.6 n/a
Northern Cape (1) 94.4 n/a
Western Cape (19) 121.4 57.0

20
Benmore 179 029 599 187 460 435 201 032 026 211 263 964 214 216 980 197 200 000
% Change | Benmore 4.7% 7.2% 5.1% 1.4% (7.9%)
Morningside sales 12 006 093 63 950 000
Sandton sales 120 550 000
Trading densities of Benmore 97 670 102 270 109 674 115 256 116 8667 107 583
Trading densities of Morningside 7 863 41 880
Trading densities of Sandton 67 234
Total node sales 179 029 599 187 460 435 201 032 026 211 263 964 226 223 073 381 700 000
Total node sales growth 4.7% 7.2% 5.1% 7.1% 68.7%
Sandton node- Growth and like-for-like impact
(10.0%)
(5.0%)
0.0%
5.0%
10.0%
0
50
100
150
200
250
FY14 FY15 FY16 FY17 FY18 FY19e
Mill
ion
s
21
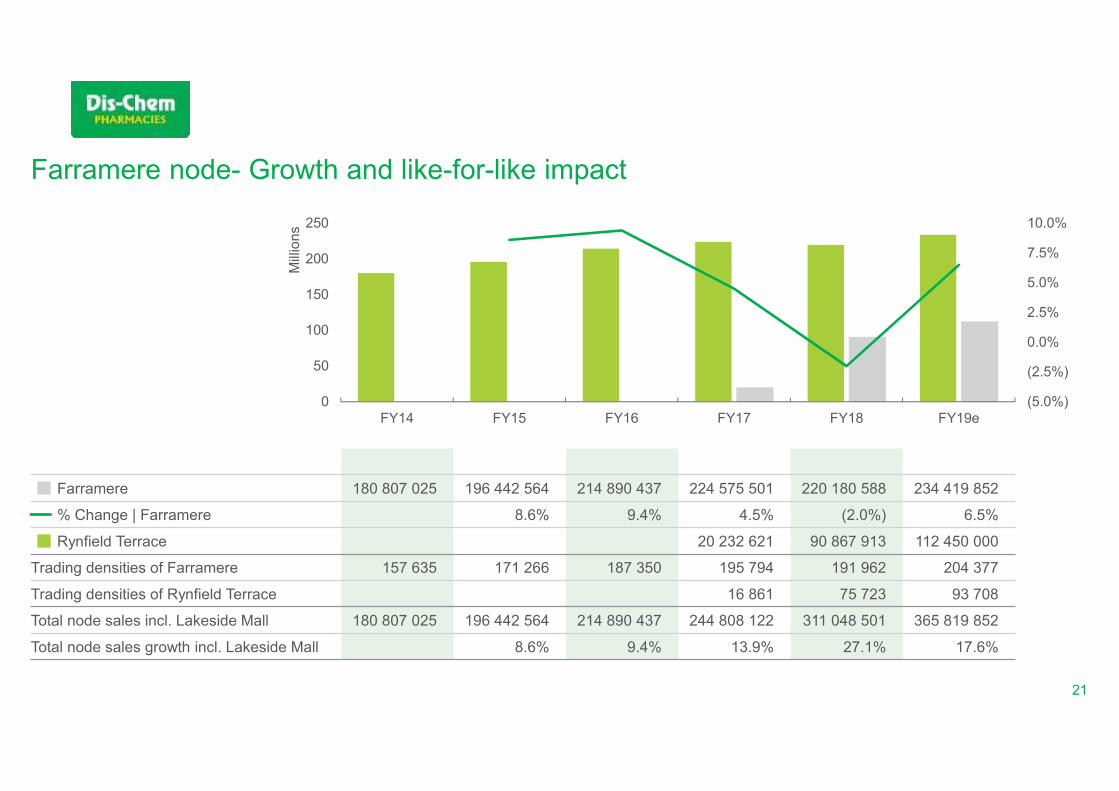
Farramere 180 807 025 196 442 564 214 890 437 224 575 501 220 180 588 234 419 852
% Change | Farramere 8.6% 9.4% 4.5% (2.0%) 6.5%
Rynfield Terrace 20 232 621 90 867 913 112 450 000
Trading densities of Farramere 157 635 171 266 187 350 195 794 191 962 204 377
Trading densities of Rynfield Terrace 16 861 75 723 93 708
Total node sales incl. Lakeside Mall 180 807 025 196 442 564 214 890 437 244 808 122 311 048 501 365 819 852
Total node sales growth incl. Lakeside Mall 8.6% 9.4% 13.9% 27.1% 17.6%
Farramere node- Growth and like-for-like impact
(5.0%)
(2.5%)
0.0%
2.5%
5.0%
7.5%
10.0%
0
50
100
150
200
250
FY14 FY15 FY16 FY17 FY18 FY19e
Mill
ion
s

22
Loyalty and Customer Relationship Management
• Around 4.3 million Loyalty members
• Contribution to front shop turnover from loyalty members is 72%
• Partner contribution to total loyalty at 55.7%
• Partner baskets and loyalty baskets higher than non-loyalty baskets
• CRM investment gives us a single view of our customers
• Around 8.2 million CRM profiles
• ForYouth program opportunity identified through our CRM solution

23
OTHER

24
Other topics of discussion as requested
1. CAPEX
• R5 670 inflation adjusted per additional square meter of floor space added
• R80m-R100m in IT
• R20m-R30m in warehouse movables
2. Pre-distribution
• Commercial model and benefits
3. Collar hedge

25
GUIDANCE

26
Profit and earnings guidance
• The group expects full-year earnings per share to be between 92.3 cents
and 98.7 cents implying an increase of between 16% and 24%
• The group expects half-year earnings per share to be between 50.6 cents
and 52.9 cents implying an increase of between 8.1% and 13%
• We expect to break even at an earnings before interest, tax, depreciation
and amortisation (EBITDA) level in the Wholesale segment for the FY2019 period
• There are no changes to our medium-term targets

THANK YOU
Questions