Erste Group investor presentation Q2 18 results€¦ · Erste Group investor presentation Q2 18...
46
Page Improved operating performance drives net profit growth Andreas Treichl, CEO Erste Group Gernot Mittendorfer, CFO Erste Group Willibald Cernko, CRO Erste Group 31 July 2018 Erste Group investor presentation Q2 18 results
Transcript of Erste Group investor presentation Q2 18 results€¦ · Erste Group investor presentation Q2 18...
Page
Improved operating performance drives net profit growth Andreas Treichl, CEO Erste Group Gernot Mittendorfer, CFO Erste Group Willibald Cernko, CRO Erste Group
31 July 2018
Erste Group investor presentation Q2 18 results

Page
Disclaimer – Cautionary note regarding forward-looking statements
2
• THE INFORMATION CONTAINED IN THIS DOCUMENT HAS NOT BEEN INDEPENDENTLY VERIFIED AND NO REPRESENTATION OR WARRANTY EXPRESSED OR IMPLIED IS MADE AS TO, AND NO RELIANCE SHOULD BE PLACED ON, THE FAIRNESS, ACCURACY, COMPLETENESS OR CORRECTNESS OF THIS INFORMATION OR OPINIONS CONTAINED HEREIN.
• CERTAIN STATEMENTS CONTAINED IN THIS DOCUMENT MAY BE STATEMENTS OF FUTURE EXPECTATIONS AND OTHER FORWARD-LOOKING STATEMENTS THAT ARE BASED ON MANAGEMENT’S CURRENT VIEWS AND ASSUMPTIONS AND INVOLVE KNOWN AND UNKNOWN RISKS AND UNCERTAINTIES THAT COULD CAUSE ACTUAL RESULTS, PERFORMANCE OR EVENTS TO DIFFER MATERIALLY FROM THOSE EXPRESSED OR IMPLIED IN SUCH STATEMENTS.
• NONE OF ERSTE GROUP OR ANY OF ITS AFFILIATES, ADVISORS OR REPRESENTATIVES SHALL HAVE ANY LIABILITY WHATSOEVER (IN NEGLIGENCE OR OTHERWISE) FOR ANY LOSS HOWSOEVER ARISING FROM ANY USE OF THIS DOCUMENT OR ITS CONTENT OR OTHERWISE ARISING IN CONNECTION WITH THIS DOCUMENT.
• THIS DOCUMENT DOES NOT CONSTITUTE AN OFFER OR INVITATION TO PURCHASE OR SUBSCRIBE FOR ANY SHARES AND NEITHER IT NOR ANY PART OF IT SHALL FORM THE BASIS OF OR BE RELIED UPON IN CONNECTION WITH ANY CONTRACT OR COMMITMENT WHATSOEVER.

Page
Presentation topics
3
• Executive summary • Business environment • Business performance • Assets and liabilities • Outlook • Additional information

Page
Executive summary – Group income statement performance
QoQ net profit reconciliation (EUR m)
YoY net profit reconciliation (EUR m)
4
• Erste Group Q2 18 net profit advances to EUR 438.2m driven by rising operating income (strong NII and fees) in Q2 18 and lower expenses (Q1 18 impacted by full year deposit insurance and resolution fund contributions)
• Risk releases declined in Q2 18, but overall asset quality trends remained exceptionally strong with no significant defaults in Q2 18
• Higher minority charge on better performance of savings banks
• H1 18 net profit reaches EUR 774.3m driven by exceptional risk performance and early stage operating turnaround (operating result up 0.7%), despite weaker other result (AfS sales in H1 17)
• Strong NII (+3.3%) and fee growth (+5.3%) more than offset weaker trading (-26.9%) and dividend income (-35.5%)
• Higher costs on the back of wage growth and higher deposit insurance contributions (+ EUR 11.6m yoy)
64
53 36 51438
336
+30.4%
Q2 18 Minorities
25
Taxes on income
6
Other result
Risk costs Operating expenses
Operating income
Q1 18
81 73178
774
625
29
Risk costs Operating expenses
Operating income
1-6 17
+24.0%
1-6 18 Taxes on income
Minorities
4 11
Other result

Page
Executive summary – Key income statement data
Net interest income & margin
5
Operating result & cost/income ratio Cost of risk
Banking levies
Reported EPS & ROE
Return on tangible equity
1,289
+0.7%
1-6 18
1,298
1-6 17
-19
-54
Q2 18
-0.02%
Q1 18
-0.22%
-73
104
1-6 18 1-6 17 Q2 18
707
58.8%
Q1 18
590
64.3%
Q2 18
1,131
2.32%
Q1 18
1,083
2.27%
2539
Q2 18 Q1 18 1-6 18
63
1-6 17
59
1-6 18
1.72
11.7%
1-6 17
1.41
9.9%
0.79
10.5%
Q2 18
0.94
12.8%
Q1 18
1-6 18
2,214
2.30%
1-6 17
2,143
2.40% in EUR m
in EUR m
in EUR m in EUR m
in EUR
1-6 18
13.3%
1-6 17
11.2%
Q2 18
14.6%
Q1 18
12.0%
Page
Executive summary – Group balance sheet performance
YTD total asset reconciliation (EUR m)
YTD equity & total liability reconciliation (EUR m)
6
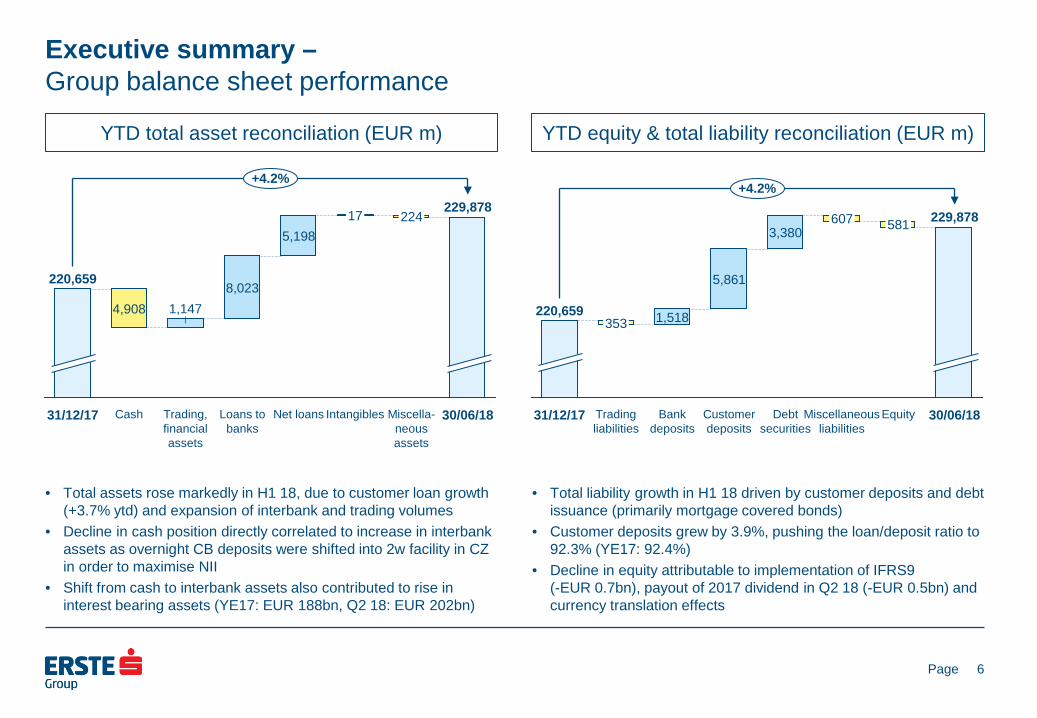
• Total assets rose markedly in H1 18, due to customer loan growth (+3.7% ytd) and expansion of interbank and trading volumes
• Decline in cash position directly correlated to increase in interbank assets as overnight CB deposits were shifted into 2w facility in CZ in order to maximise NII
• Shift from cash to interbank assets also contributed to rise in interest bearing assets (YE17: EUR 188bn, Q2 18: EUR 202bn)
• Total liability growth in H1 18 driven by customer deposits and debt issuance (primarily mortgage covered bonds)
• Customer deposits grew by 3.9%, pushing the loan/deposit ratio to 92.3% (YE17: 92.4%)
• Decline in equity attributable to implementation of IFRS9 (-EUR 0.7bn), payout of 2017 dividend in Q2 18 (-EUR 0.5bn) and currency translation effects
+4.2%
Loans to banks
8,023
Trading, financial assets
1,147
Cash
4,908
31/12/17
220,659
Net loans
17
Intangibles
224
Miscella-neous assets
229,878
30/06/18
5,198
+4.2%
30/06/18
229,878
Equity
581
Miscellaneous liabilities
607
Debt securities
3,380
Customer deposits
5,861
Bank deposits
1,518
Trading liabilities
353
31/12/17
220,659

Page
Executive summary – Key balance sheet data
Loan/deposit & loan/TA ratio
7
Net loans & credit RWA NPL coverage ratio & NPL ratio
B3FL capital ratios
B3FL capital & tangible equity*
Liquidity coverage & leverage ratio**
+3.7%
Credit RWA
94.8 89.2
Net loans
144.7 139.5
30/06/18 31/12/17
NPL ratio
3.6% 4.0%
NPL coverage
72.0% 68.8% 63.2%
Loan/deposit ratio
92.3% 92.4%
Loans/total assets
63.0%
Tangible equity
10.8 11.4
CET 1
14.7 14.4
CET 1
12.5% 12.9%
Total capital
17.3% 18.2%
* Based on shareholders’ equity, not total equity
LR (B3FL)
6.4% 6.6%
LCR
147.5% 145.2%
in EUR bn
in EUR bn
** Pursuant to Delegated Act

Page
Presentation topics
8
• Executive summary • Business environment • Business performance • Assets and liabilities • Outlook • Additional information

Page
Business environment – Strong economic outlook for 2018
Real GDP growth (in %)
9
Dom. demand contribution* (in %) Net export contribution* (in %)
Unemployment rate (eop, in %)
Current account balance (% of GDP)
Gen gov balance (% of GDP)
Consumer price inflation (ave, in %)
Public debt (% of GDP)
• Erste Group’s core CEE markets expected to grow by about 3-4% in 2018 • Domestic demand is expected to remain the main driver of economic growth in 2018 • Consumption is supported by improving labour markets, wage increases and relatively low inflation rates across the region
• Solid public finances across Erste Group‘s core CEE markets: almost all countries fulfill Maastricht criteria • Sustainable current account balances, supported by competitive economies with decreasing unemployment rates
HR
3.4 3.8
HU
2.9
4.1
RO
3.8 4.6
SK
2.4 2.8
CZ
3.0
4.3
AT
1.5 2.0
2019 2018
HR
2.7 2.8
HU
3.3 4.0
RO
3.4 4.1
SK
4.2 3.9
CZ
3.1 3.6
AT
2.2 3.0
HR
1.8 1.7
HU
3.5 2.6
RO
3.3
4.7
SK
2.5 2.5
CZ
2.0 2.1
AT
1.9 2.1
6.4 6.9
CZ
2.5 2.3
AT
5.1 5.2
HR
8.7 9.6
HU
3.9 3.9
RO
4.8 4.6
SK HR
1.8 2.5
HU
2.0 2.1
RO
-4.0 -3.9
SK
-0.5 -1.2
CZ
0.5 0.6
AT
1.9 1.8
-3
HR
-0.5
0.0
HU
-2.3 -2.2
RO
-2.9 -3.4
SK
-1.3 -1.0
CZ
0.2 0.2
AT
0.0
-0.4
7473
3550
32
75 7171
3648
30
71
60
HR HU RO SK CZ AT
* Contribution to real GDP growth. Domestic demand contribution includes inventory change. Source: Erste Group Research
HR
-0.6 -1.0
HU
0.4
-0.4
RO
-0.4 -0.5
SK
1.8 1.1
CZ
0.1
-0.7
AT
0.6 0.8
Page
Business environment – CZ further increases key policy rate to 100bps in June 2018
Austria
10
Czech Republic Romania
Slovakia
Hungary
Croatia
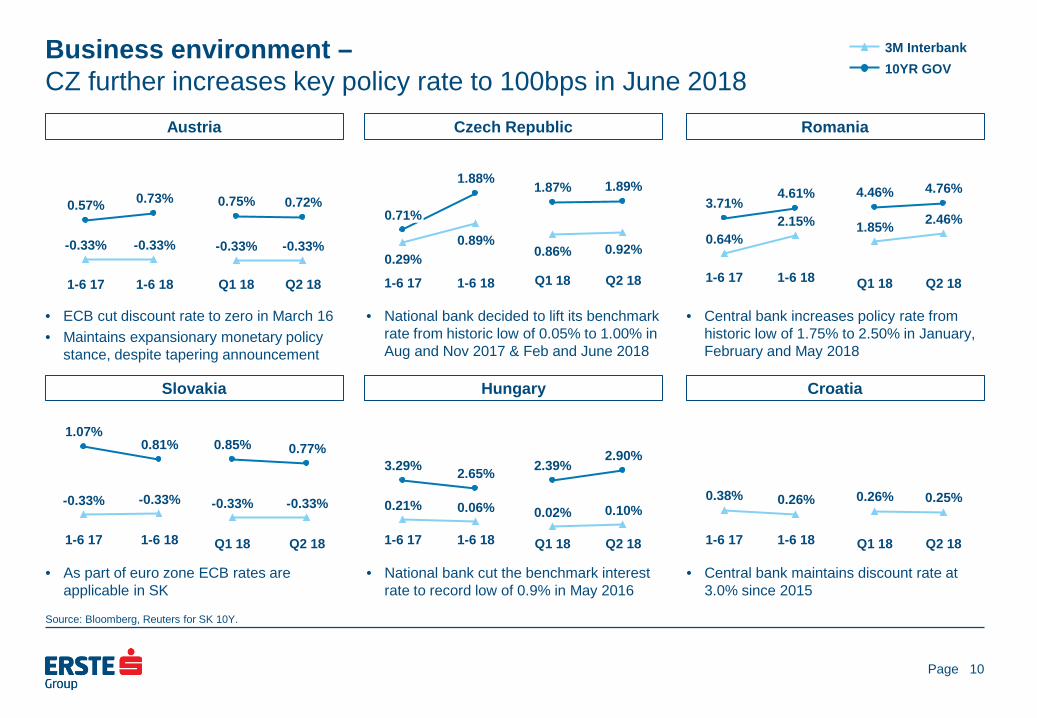
• ECB cut discount rate to zero in March 16 • Maintains expansionary monetary policy
stance, despite tapering announcement
• National bank decided to lift its benchmark rate from historic low of 0.05% to 1.00% in Aug and Nov 2017 & Feb and June 2018
• Central bank increases policy rate from historic low of 1.75% to 2.50% in January, February and May 2018
• As part of euro zone ECB rates are applicable in SK
• National bank cut the benchmark interest rate to record low of 0.9% in May 2016
• Central bank maintains discount rate at 3.0% since 2015
1-6 18
1.88%
0.89%
1-6 17
0.71%
0.29% 1-6 18
4.61%
2.15%
1-6 17
3.71%
0.64%
1-6 18
2.65%
0.06%
1-6 17
3.29%
0.21%
1-6 18
0.26%
1-6 17
0.38%
Q2 18
0.72%
-0.33%
Q1 18
0.75%
-0.33%
Q2 18
1.89%
0.92%
Q1 18
1.87%
0.86%
Q2 18
4.76%
2.46%
Q1 18
4.46%
1.85%
Q2 18
0.77%
-0.33%
Q1 18
0.85%
-0.33%
Q2 18
2.90%
0.10%
Q1 18
2.39%
0.02%
Q2 18
0.25%
Q1 18
0.26%
Source: Bloomberg, Reuters for SK 10Y.
1-6 18
0.73%
-0.33%
1-6 17
0.57%
-0.33%
10YR GOV 3M Interbank
1-6 18
0.81%
-0.33%
1-6 17
1.07%
-0.33%

Page
Business environment – Emerging market volatility has minor impact on CEE currencies
EUR/CZK
11
EUR/RON
EUR/HUF
EUR/HRK
• Czech National Bank ended its currency peg in April 17; benchmark rate increased further to 1.00% in June 2018
• RON depreciated slightly vs EUR amid political volatility; policy rate raised to 2.50% in May 2018
• HUF has recovered after reaching record low against the EUR
• Croatian National Bank continues to manage HRK in tight range
-4.8%
1-6 18
25.5
1-6 17
26.8
+0.8%
Q2 18
25.6
Q1 18
25.4
+1.9%
30/06/18
26.0
31/12/17
25.5
+2.6%
1-6 18
4.65
1-6 17
4.54
0.0%
Q2 18
4.65
Q1 18
4.66
-0.1%
30/06/18
4.66
31/12/17
4.67
+1.5%
1-6 18
314.0
1-6 17
309.5
+2.0%
Q2 18
317.1
Q1 18
311.0
+5.9%
30/06/18
329.3
31/12/17
310.8
-0.4%
1-6 18
7.42
1-6 17
7.45
-0.5%
Q2 18
7.40
Q1 18
7.44
-0.6%
30/06/18
7.39
31/12/17
7.43
Source: Bloomberg

Page
Business environment – Market shares: continued gains in Austria and the Czech Republic
Gross retail loans
12
• CZ: slightly increasing yoy market shares in growing markets
• RO: stable market shares despite restrictive lending standards
• HU: high level of repayments offsets new disbursements
Gross corporate loans
• RO: conservative lending standards impact market share
• HR: market share increase mainly due to substantial sale of NPLs by other market participants
Retail deposits
• Continued inflows in all markets despite low interest rate environment, with broadly growing market shares
• HU: market share has stabilised at around 9% with consolidation of Citibank since Q1 2017
Corporate deposits
• Changes mainly due to normal quarterly volatility in corporate business
RS 6.0% 5.6%
4.5%
HR 13.8% 13.2%
HU 12.0% 12.0% 12.3%
RO 16.4% 16.2% 16.3%
SK 27.3% 27.3% 27.6%
CZ 23.4% 23.2% 22.9%
AT 20.2% 20.0%
30/06/18 31/03/18 30/06/17
RS 5.4% 5.1% 5.3%
HR 17.0% 14.8%
HU 6.9% 7.1%
5.6%
RO 11.7% 11.9% 12.7%
SK 13.5% 13.1%
11.5%
CZ 20.9% 20.5%
19.7%
AT 21.0% 20.1%
RS 3.9% 3.8% 3.5%
HR 13.8% 13.6%
HU 9.2% 9.0% 8.9%
RO 15.6% 15.8% 16.0%
SK 27.8% 27.8% 27.4%
CZ 25.5% 25.4% 25.2%
AT 19.6% 19.1%
RS 6.4%
5.4% 5.3%
HR 13.2% 13.8%
HU 5.8% 6.1% 6.5%
RO 14.6%
15.7% 14.2%
SK 14.7%
14.1% 11.2%
CZ 13.1% 12.9%
12.2%
AT 21.7% 20.6%
AT market shares for 30/06/2018 not yet available
13.8% 17.4% 13.5% 13.8%

Page
Presentation topics
13
• Executive summary • Business environment • Business performance • Assets and liabilities • Outlook • Additional information
Page
Business performance: performing loan stock & growth – Performing loans continue to grow in Q2 18
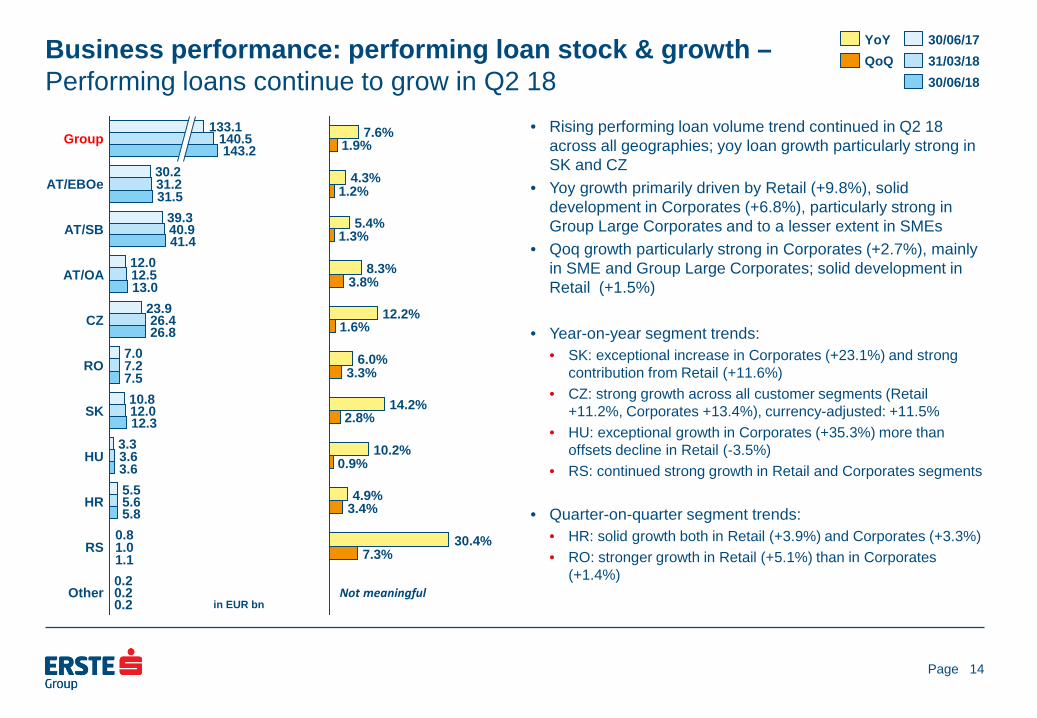
• Rising performing loan volume trend continued in Q2 18 across all geographies; yoy loan growth particularly strong in SK and CZ
• Yoy growth primarily driven by Retail (+9.8%), solid development in Corporates (+6.8%), particularly strong in Group Large Corporates and to a lesser extent in SMEs
• Qoq growth particularly strong in Corporates (+2.7%), mainly in SME and Group Large Corporates; solid development in Retail (+1.5%)
• Year-on-year segment trends: • SK: exceptional increase in Corporates (+23.1%) and strong
contribution from Retail (+11.6%) • CZ: strong growth across all customer segments (Retail
+11.2%, Corporates +13.4%), currency-adjusted: +11.5% • HU: exceptional growth in Corporates (+35.3%) more than
offsets decline in Retail (-3.5%) • RS: continued strong growth in Retail and Corporates segments
• Quarter-on-quarter segment trends:
• HR: solid growth both in Retail (+3.9%) and Corporates (+3.3%) • RO: stronger growth in Retail (+5.1%) than in Corporates
(+1.4%)
14
Other 0.2 0.2 0.2
RS 1.1 1.0 0.8
HR 5.8 5.6 5.5
HU 3.6 3.6 3.3
SK 12.3 12.0 10.8
RO 7.5 7.2 7.0
CZ 26.8 26.4
23.9
AT/OA 13.0 12.5 12.0
AT/SB 41.4 40.9 39.3
AT/EBOe 31.5 31.2 30.2
Group 143.2
140.5 133.1
7.3% 30.4%
3.4% 4.9%
0.9% 10.2%
2.8% 14.2%
3.3% 6.0%
1.6% 12.2%
3.8% 8.3%
1.3% 5.4%
1.2% 4.3%
1.9% 7.6%
QoQ YoY
30/06/18 31/03/18 30/06/17
in EUR bn Not meaningful
Page
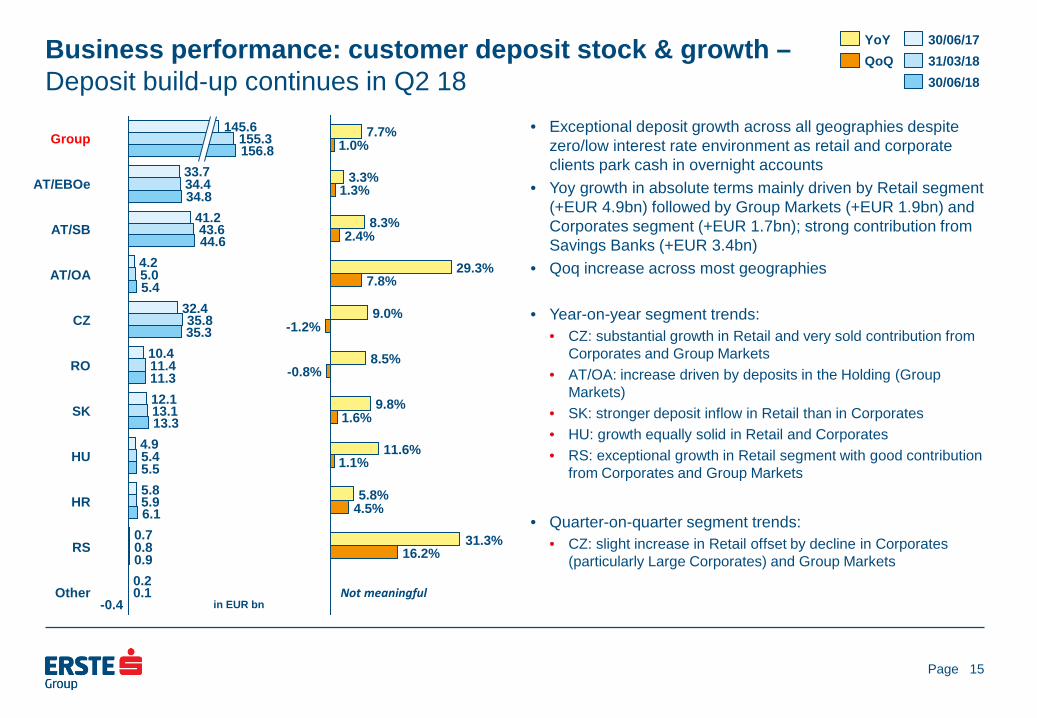
Business performance: customer deposit stock & growth – Deposit build-up continues in Q2 18
• Exceptional deposit growth across all geographies despite zero/low interest rate environment as retail and corporate clients park cash in overnight accounts
• Yoy growth in absolute terms mainly driven by Retail segment (+EUR 4.9bn) followed by Group Markets (+EUR 1.9bn) and Corporates segment (+EUR 1.7bn); strong contribution from Savings Banks (+EUR 3.4bn)
• Qoq increase across most geographies
• Year-on-year segment trends: • CZ: substantial growth in Retail and very sold contribution from
Corporates and Group Markets • AT/OA: increase driven by deposits in the Holding (Group
Markets) • SK: stronger deposit inflow in Retail than in Corporates • HU: growth equally solid in Retail and Corporates • RS: exceptional growth in Retail segment with good contribution
from Corporates and Group Markets
• Quarter-on-quarter segment trends:
• CZ: slight increase in Retail offset by decline in Corporates (particularly Large Corporates) and Group Markets
15
Other -0.4
0.1 0.2
RS 0.9 0.8 0.7
HR 6.1 5.9 5.8
HU 5.5 5.4 4.9
SK 13.3 13.1 12.1
RO 11.3 11.4 10.4
CZ 35.3 35.8
32.4
AT/OA 5.4 5.0 4.2
AT/SB 44.6 43.6
41.2
AT/EBOe 34.8 34.4 33.7
Group 156.8 155.3
145.6
16.2% 31.3%
4.5% 5.8%
1.1% 11.6%
1.6% 9.8%
-0.8% 8.5%
-1.2% 9.0%
7.8% 29.3%
2.4% 8.3%
1.3% 3.3%
1.0% 7.7%
QoQ YoY
in EUR bn
30/06/18 31/03/18 30/06/17
Not meaningful

Page
Business performance: NII and NIM – NII advances qoq and yoy
• Yoy increase driven by higher NII in CZ resulting from higher business volumes, rising interest rates and CZK appreciation
• Qoq improvement in Retail including a EUR 7m one-off booked in AT/EBOe (related to building society) and strong ALM result including a EUR 14m shift from trading to NII in segment Other
• Year-on-year segment trends: • CZ: volume growth, rate hikes and currency appreciation
(+4.5%) pushed NII up in all key business lines (Retail, Corporates, Group Markets)
• AT/SB: increase on higher volumes • AT/OA: decline due to lower contribution from MM business as
well as lower margins in Corporate business of the Holding
• Quarter-on-quarter segment trends: • CZ: decline in NIM exclusively related to technical effect of
shifting cash to interbank assets, ie overnight CNB facility to 2-week repo; underlying business margins broadly stable; NII decline driven by minor currency depreciation in Q2 18
• Other: higher contribution from Holding ALM due to a shift from trading to NII in the amount of EUR 14m
• AT/EBOe: increase on positive one-off (EUR 7m) and rising volumes
16
67
88
48
68
87
71
25
13
52
93
92
15
13
90
39
12
47
95
Other
RS
HR
HU
SK 109 109 107
RO
CZ 252 255
227
AT/OA
AT/SB 254 245 249
AT/EBOe 165
152 166
Group 1,131
1,083 1,092
Q2 18 Q1 18 Q2 17
3.66% 4.12%
4.92% 3.55% 3.47% 3.43%
2.77% 2.79%
3.28% 2.76% 2.81% 2.99% 3.14%
2.93% 3.16%
2.21% 2.44% 2.53%
1.12% 1.25% 1.25%
1.79% 1.74% 1.90%
1.69% 1.50% 1.75%
2.32% 2.27% 2.44%
in EUR m Not meaningful

Page
Business performance: operating income – Operating income up yoy on strong NII and fees
• Yoy and qoq up on higher NII and fees, offset lower net trading result, partially compensated by improvement in gains/losses from financial instruments measured at FV (fair value result)
• Year-on-year segment trends: • Revenues rise across the board on the back of good macro
environment, higher volumes and higher rates, except in: • AT/OA: decline mainly on lower NII from gov’t bonds and MM
business and weaker net trading result in the Holding, partially offset by stronger fee income at Erste Asset Management
• AT/SB: better NII and fees only partially offset decline in net trading and FV result and dividend income
• RO: improved NII almost offset weaker net trading result • HU: increase in fee income and net trading result only partially
offset lower NII, which was primarily due to a change in the segmental capital benefit calculation methodology
• Quarter-on-quarter segment trends: • AT/SB: operating income rises on better NII and improved FV
result • CZ: weaker net trading result weighs on operating income • Other: increase mainly driven by NII as well as net trading and
FV result
17
171716
96
Other 37
-15 -5
RS
HR 107 103 102
HU 99 100
SK 144 141 143
RO 155 154 159
CZ 352 370 337
AT/OA 165 156 177
AT/SB 376 360 379
AT/EBOe 270 270 268
Group 1,719
1,655 1,675
Q2 18 Q1 18 Q2 17
in EUR m
-3.3% -2.5%
3.9% 5.4%
-3.3% -3.6%
2.1% 0.7%
0.7% -2.6%
-4.9% 4.6%
6.1% -6.5%
4.6% -0.7%
-0.1% 0.8%
3.9% 2.6%
QoQ YoY
Not meaningful

Page
Business performance: operating expenses – Expenses improve qoq in line with guidance
• Yoy cost increase mainly driven by higher PEREX following wage increases
• Qoq down on deposit insurance contributions in Q1 18, partially offset by higher PEREX
• Year-on-year segment trends: • CZ: increase due to currency effect as well as higher PEREX
due to wage increase, partially offset by lower headcount • AT/SB: higher PEREX • RO: PEREX up on wage increase and higher headcount,
increase in IT related expenses
• Quarter-on-quarter segment trends:
• AT/EBOe: decline due to deposit insurance contribution in Q1 18 and lower marketing expenses
• AT/SB and CZ: lower OPEX on non-recurrence of deposit insurance, partially offset by higher PEREX
• AT/OA: higher IT service costs in the Holding • Other: improvement mainly driven by lower costs from IT service
providers
18
160
100
535254
48
10
51
67
78
166
251
64
11
57
70
85
182
89
274
180
50
13
51
67
87
177
98
258
157
Other
RS
HR
HU
SK
RO
CZ
AT/OA
AT/SB
AT/EBOe
Group 1,012
1,065 985
Q2 18 Q1 18 Q2 17
in EUR m -21.9% 3.4%
10.4% 21.8%
4.1% 1.8%
-10.2% 0.6%
-4.4% -0.8%
2.6% 11.2%
-3.2% 6.5%
10.9% -1.4%
-5.9% 2.9%
-13.1% -2.4%
-5.0% 2.7%
QoQ YoY

Page
Business performance: operating result and CIR – Operating result expands to 2-year high
Operating result
YoY & QoQ change
19
Cost/income ratio
81
4977
536
49
76
77
5
51
43
71
69
67
85
90
4
45
68
67
Other -13
-80 -54
RS
HR
HU
SK
RO
CZ 176 188 171
AT/OA
AT/SB 118
128
AT/EBOe 113
108
Group 707 590 690
78.2% 68.5%
62.6% 50.4% 50.3% 52.2% 53.0% 57.1%
50.8% 46.4% 49.6% 47.1%
56.2% 55.1%
49.2% 50.2% 49.3% 49.3%
59.6% 57.0% 56.5%
68.6% 76.2%
66.2% 58.0%
66.7% 59.9% 58.8%
64.3% 58.8%
in EUR m Not meaningful
-33.1% -43.1%
3.8% 9.4%
6.0% -7.9%
8.5% 1.9%
-1.7% -16.0%
-6.5% 2.7%
-0.3% -13.1%
38.2% -7.8%
26.0% 5.5%
19.9% 2.5%
QoQ YoY
Q2 18 Q1 18 Q2 17
Not meaningful
Page
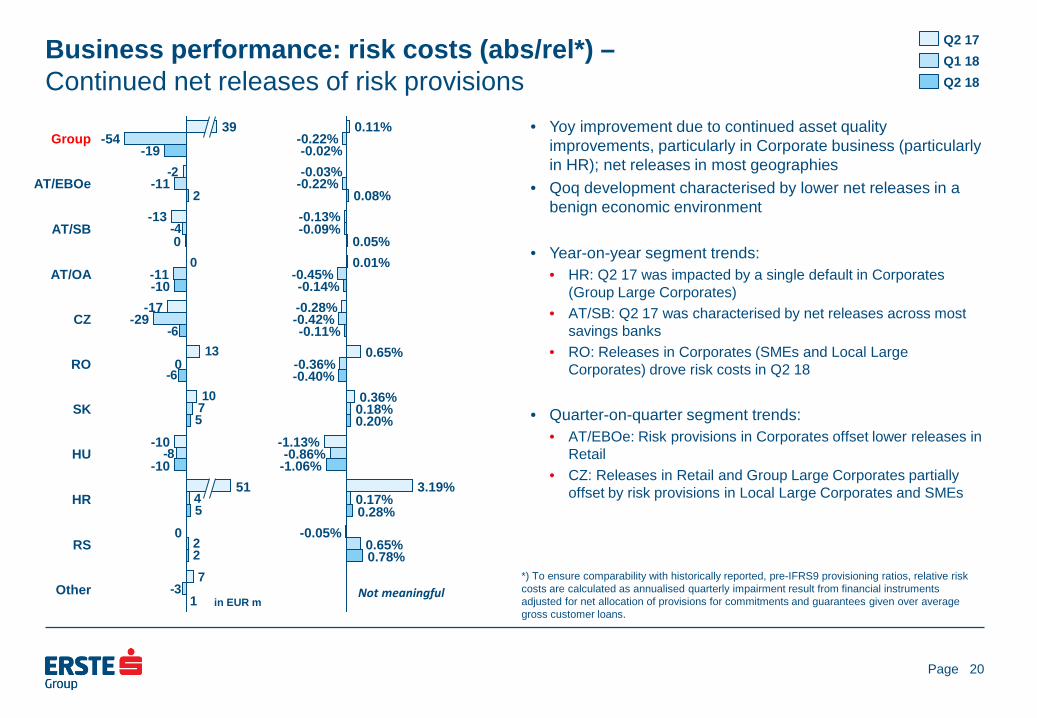
Business performance: risk costs (abs/rel*) – Continued net releases of risk provisions
• Yoy improvement due to continued asset quality improvements, particularly in Corporate business (particularly in HR); net releases in most geographies
• Qoq development characterised by lower net releases in a benign economic environment
• Year-on-year segment trends:
• HR: Q2 17 was impacted by a single default in Corporates (Group Large Corporates)
• AT/SB: Q2 17 was characterised by net releases across most savings banks
• RO: Releases in Corporates (SMEs and Local Large Corporates) drove risk costs in Q2 18
• Quarter-on-quarter segment trends:
• AT/EBOe: Risk provisions in Corporates offset lower releases in Retail
• CZ: Releases in Retail and Group Large Corporates partially offset by risk provisions in Local Large Corporates and SMEs
20
4
1
7
10
13
0
-2
-3
2
-8
7
-4
2
5
5
-6
-6
2
Other
RS 0
HR 51
HU -10
-10
SK
RO 0
CZ -29 -17
AT/OA -10 -11
AT/SB 0
-13
AT/EBOe -11
Group -19
-54 39
0.78% 0.65%
-0.05% 0.28% 0.17%
3.19% -1.06% -0.86%
-1.13% 0.20% 0.18% 0.36%
-0.40% -0.36%
0.65% -0.11%
-0.42% -0.28% -0.14%
-0.45% 0.01% 0.05%
-0.09% -0.13%
0.08% -0.22% -0.03% -0.02%
-0.22% 0.11%
Q2 18 Q1 18 Q2 17
in EUR m
*) To ensure comparability with historically reported, pre-IFRS9 provisioning ratios, relative risk costs are calculated as annualised quarterly impairment result from financial instruments adjusted for net allocation of provisions for commitments and guarantees given over average gross customer loans.
Not meaningful

Page
Business performance: non-performing loans and NPL ratio – NPL ratio improves further, now standing at 3.6%
• NPL volume declined further to EUR 5.3bn in Q2 18 as NPL inflows remained moderate
• NPL sales of EUR 55.1m in Q2 18 (Q1 18: EUR 103.8m) • Retail: EUR 29.6m (Q1 18: EUR 9.3m) • Corporates: EUR 25.5m (Q1 18: EUR 94.5m) • Q2 18 NPL sales mainly in Holding (EUR 19.4m), SK (EUR
15.3m), minor sales in other markets
21
81
50
23
22
24
22RS
HR 721 751 845
HU 179 202 253
SK 454 460 469
RO 539 559
869
CZ 543 524 553
AT/OA 503 540
781
AT/SB 1,722
Other
1,908
AT/EBOe 612 620
1,763
Group 5,321 5,464
6,496
688
11.7% 10.8%
30.2% 2.0% 2.2%
5.8% 11.0% 11.8%
13.2% 4.7% 5.4%
7.2% 3.6% 3.7% 4.2%
7.2% 11.0%
2.0% 1.9% 2.3%
3.7% 4.1%
6.1% 4.0% 4.1% 4.6%
1.9% 1.9% 2.2%
3.6% 3.7%
4.7%
6.7%
30/06/18 31/03/18 30/06/17
in EUR m

Page
Business performance: allowances for loans and NPL coverage* – NPL provision coverage at comfortable 72.0%
• NPL provision coverage qoq broadly stable at group level, exceptionally strong in CZ, RO, SK and RS
• Year-on-year segment trends: • CZ: increase in provisions together with decline in NPLs result
in exceptionally strong coverage • AT/OA: decreasing coverage in line with lower expected losses
for defaulted customers • RS: coverage improves as provisions decrease at a slower pace
than NPLs • No material changes in other markets; excellent macro
backdrop allows for release of provisions
• Quarter-on-quarter segment trends: • CZ: decreasing coverage in line with lower expected losses for
defaulted customers; coverage remains at an exceptionally strong level
22
46
53
16
32
16
32RS
HR 542 553 580
HU 138 161 198
SK 365 370 353
RO 514 538
800
CZ 522 535
474
AT/OA 256 283
442
AT/SB 1,062 1,087
Other
1,094
AT/EBOe 385 388 413
Group 3,833
3,963 4,451
68.1% 56.2%
142.8% 145.8%
105.5% 75.3% 73.7%
68.6% 77.2% 79.5% 78.3% 80.3% 80.5%
75.3% 95.3% 96.3%
66.4%
96.1% 102.0%
85.7% 50.9% 52.4% 56.7% 61.6% 61.7%
57.3% 63.0% 62.6% 60.0%
72.0% 72.5% 68.5%
92.1%
30/06/18 31/03/18 30/06/17
in EUR m *) To ensure comparability with historically reported, pre-IFRS9 NPL coverage ratios, non-performing loans include NPLs from all categories of customer loans.

Page
Business performance: other result – Other result improves qoq on regulatory payments in Q1 18
• Yoy other operating result improved slightly, while gains/losses from financial instruments not measured at FV through P&L declined by EUR 10.0m
• Qoq improvement due to booking of full year resolution fund contributions as well as of HU banking tax in Q1 18
• Year-on-year segment trends: • AT/OA: Q2 17 benefitted from a positive one-off resulting from
property sales • RO: improvement driven by releases of provisions • HU: decline due to releases of provisions in Q2 17
• Quarter-on-quarter segment trends: • CZ: improvements mainly driven by contributions to resolution
fund in Q1 18 • RO: positive development driven by contributions to resolution
fund in Q1 18 and releases of provisions in Q2 18 • HU: improvement due to booking of full amount of annual
banking tax in Q1 18 • Other: development in other result driven by valuation effects in
the Holding
23
1
-32
-1
12
-4
-20
23
-29
-19
-21
-5
-29
-10
-17
-19
-1
-11
-11
-55
6
-13
-9
26
-2
-8
-9
-10
Other
RS 0
0 0
HR
HU
SK
RO
CZ
AT/OA
AT/SB
AT/EBOe
Group -72
-124 -68
in EUR m
Q2 18 Q1 18 Q2 17
Page
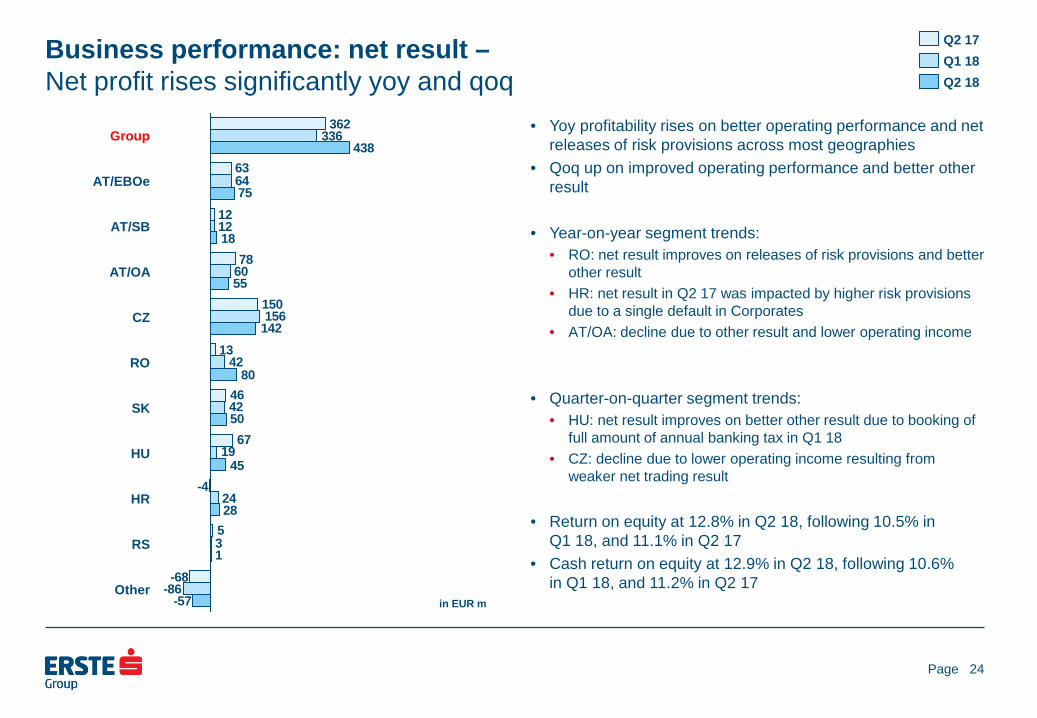
Business performance: net result – Net profit rises significantly yoy and qoq
• Yoy profitability rises on better operating performance and net releases of risk provisions across most geographies
• Qoq up on improved operating performance and better other result
• Year-on-year segment trends: • RO: net result improves on releases of risk provisions and better
other result • HR: net result in Q2 17 was impacted by higher risk provisions
due to a single default in Corporates • AT/OA: decline due to other result and lower operating income
• Quarter-on-quarter segment trends: • HU: net result improves on better other result due to booking of
full amount of annual banking tax in Q1 18 • CZ: decline due to lower operating income resulting from
weaker net trading result • Return on equity at 12.8% in Q2 18, following 10.5% in
Q1 18, and 11.1% in Q2 17 • Cash return on equity at 12.9% in Q2 18, following 10.6%
in Q1 18, and 11.2% in Q2 17
24
362
12
78
13
64
12
60
24
438
28
-68
5
-4
67
46
150
63
-86
3
19
42
42
156
336
-57
1
45
50
80
142
55
18
75
Other
RS
HR
HU
SK
RO
CZ
AT/OA
AT/SB
AT/EBOe
Group
in EUR m
Q2 18 Q1 18 Q2 17

Page
Presentation topics
25
• Executive summary • Business environment • Business performance • Assets and liabilities • Outlook • Additional information
Page
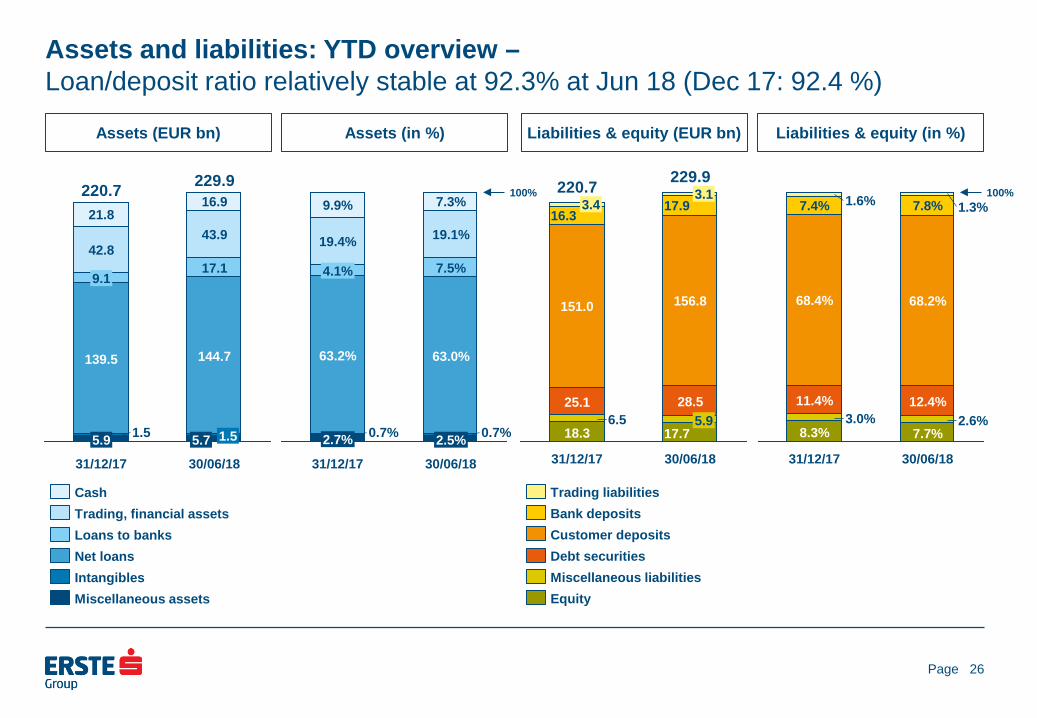
Assets and liabilities: YTD overview – Loan/deposit ratio relatively stable at 92.3% at Jun 18 (Dec 17: 92.4 %)
Assets (EUR bn)
26
Assets (in %)
Liabilities & equity (EUR bn)
Liabilities & equity (in %)
30/06/18
229.9
5.7 1.5
144.7
17.1
43.9
16.9
31/12/17
220.7
5.9 1.5
139.5
9.1
42.8
21.8
Miscellaneous assets Intangibles Net loans Loans to banks Trading, financial assets Cash
30/06/18
229.9
17.7 5.9
28.5
156.8
17.9 3.1
31/12/17
220.7
18.3 6.5
25.1
151.0
16.3 3.4
Equity Miscellaneous liabilities Debt securities Customer deposits Bank deposits Trading liabilities
100%
30/06/18
2.5% 0.7%
63.0%
7.5%
19.1%
7.3%
31/12/17
2.7% 0.7%
63.2%
4.1%
19.4%
9.9% 100%
30/06/18
7.7% 2.6%
12.4%
68.2%
7.8% 1.3%
31/12/17
8.3% 3.0%
11.4%
68.4%
7.4% 1.6%

Page
Assets and liabilities: customer loans by country of risk – Net customer loans up 3.7% and NPLs down 7.9% ytd
Net customer loans (EUR bn)
Performing loans (EUR bn)
27
Non-performing loans (EUR bn)
• Performing loan growth mainly driven by Czech Republic, Slovakia and Austria • Main contributing business lines: Retail (+10.7%), Corporates (+5.8%), primarily Group Large Corporates and SME • Growing performing loans across all geographies
• 18.1% yoy decline in NPL stock driven by reductions across most geographies
+3.7%
30/06/18
144.7
74.2
26.2
13.2 8.0
4.3 6.2 1.2 7.1
4.3
31/12/17
139.5
73.0
25.0
12.3 7.7
4.2 5.9 1.1 6.8 3.5
30/06/17
135.1
70.7
24.2
11.5 7.8
3.9 6.1 0.9 6.7 3.3
Other Other EU RS HR HU RO SK CZ AT
26.1
13.1 8.0
4.3 5.9 1.2 7.0 4.2
31/12/17
137.7
72.1
24.9
12.2
+4.0%
30/06/18
143.2
73.4
7.6 4.2 5.6 1.1 6.6 3.6
30/06/17
133.1
69.8
24.1
11.3 7.7
3.8 5.7 0.9 6.5 3.4
-7.9%
30/06/18
5.3
1.9
0.7
0.5 0.6 0.2 0.8
0.0 0.3 0.2
31/12/17
5.8
2.1
0.7
0.5
0.7
0.2
30/06/17
6.5
2.1
0.7
0.6
0.9
0.3
1.1
0.1 0.5
0.2
0.9 0.1 0.4
0.3

Page
Assets and liabilities: financial and trading assets * – LCR at excellent 147.5%
By geography in EUR bn
By debtor type
28
Liquidity buffer in EUR bn
• Liquidity buffer is defined as unencumbered collateral plus cash
• Total liabilities are defined as total on balance sheet liabilities excluding total equity
+1.7%
30/06/18
40.1
8.9
8.4
4.7
4.9 3.3
0.7
9.1
31/12/17
39.4
9.4
7.7
4.6
5.0 3.3
0.8
8.6
30/06/17
40.8
10.1
7.6
5.0
5.2 2.9
0.9
9.1
AT CZ SK
RO HU DE Other
100%
30/06/18
83.0%
7.9% 9.1%
31/12/17
83.1%
7.8% 9.2%
30/06/17
82.4%
7.8% 9.8%
Sovereign Banks Other
30/06/18
54.0
25.5%
31/12/17
55.5
27.4%
31/12/16
51.2
26.7%
31/12/15
46.1
24.9%
Liquidity buffer as % of total liabilities Liquidity buffer
* Excludes derivatives held for trading.
Page
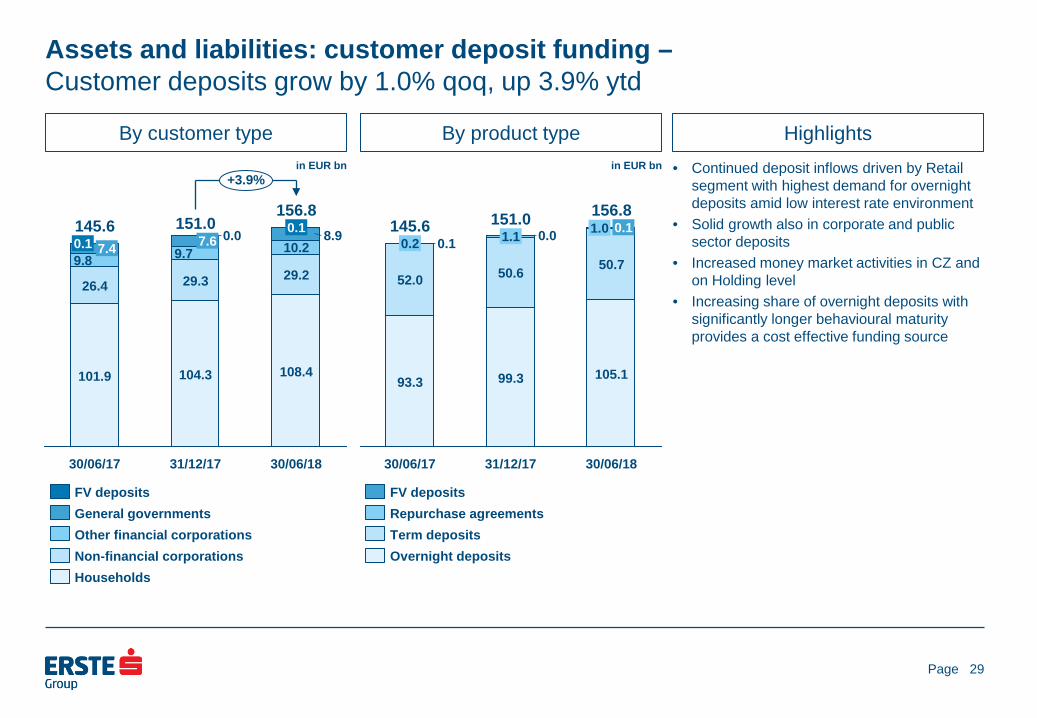
Assets and liabilities: customer deposit funding – Customer deposits grow by 1.0% qoq, up 3.9% ytd
By customer type in EUR bn
By product type
29
in EUR bn
Highlights • Continued deposit inflows driven by Retail
segment with highest demand for overnight deposits amid low interest rate environment
• Solid growth also in corporate and public sector deposits
• Increased money market activities in CZ and on Holding level
• Increasing share of overnight deposits with significantly longer behavioural maturity provides a cost effective funding source
30/06/18
156.8
105.1
50.7
1.0 0.1
31/12/17
151.0
99.3
50.6
1.1 0.0
30/06/17
145.6
93.3
52.0
0.2 0.1
Overnight deposits Term deposits Repurchase agreements FV deposits
+3.9%
30/06/18
156.8
108.4
29.2
10.2 8.9 0.1
31/12/17
151.0
104.3
29.3
9.7 7.6 0.0
30/06/17
145.6
101.9
26.4
9.8 7.4 0.1
Households Non-financial corporations Other financial corporations General governments FV deposits

Page
Assets and liabilities: debt vs interbank funding – Declining wholesale funding reliance, as customer deposits grow strongly
Debt securities issued in EUR bn
Interbank deposits in EUR bn
30
• After periods of reduced wholesale funding, volumes increased again in 2018 led by mortgage covered bonds issuances
• Money market activities peaked in CZ, interbank deposits decline by 14.9% qoq, up 9.3% ytd
+13.5%
30/06/18
28.5
0.6 1.2
10.7
1.1 0.2
8.7
6.0 25.1
0.1 1.2
7.9
0.9 0.2
9.0
5.8
30/06/17
26.6
0.1 1.4
8.2
0.9 0.2
9.3
6.4
31/12/17
Other Public sector CBs Mortgage CBs Other CDs, name cert’s Certificates of deposit Senior unsec. bonds Sub debt
-0.1%
30/06/18
17.9
2.4
11.2
4.2
31/12/17
16.3
1.0
11.9
3.5
30/06/17
17.9
3.0
10.8
4.0
Repurchase agreements Term deposits Overnight deposits

Page
Assets and liabilities: LT funding – Limited LT funding needs
Maturity profile of debt
31
• In January 2018 Erste Group opened the covered bond market for Austrian issuers with a EUR 1bn 10y mortgage covered at a spread of MS-6bps.
• In April 2018 Erste Group placed a EUR 750mn 8y mortgage covered bond at a spread of MS-3bps, and in June 2018 a EUR 750mn 6y mortgage covered bond at a spread of MS-2bps.
• Funding target for 2018 of approximately EUR 3.1bn is forecast slightly above last year’s volume, in line with 2018 redemptions. With the 3 covered bonds in H1 18, the Group is on track with its funding plans.
2030+
0.6
2029
0.1
2028
1.3
2027
1.4
2026
1.4
2025
1.3
2024
1.5
2023
2.0
2022
3.1
2021
3.0
2020
2.7
2019
2.2
2018
1.6
Debt CEE Capital exc Tier 1 Covered bonds Senior unsec. bonds
in EUR bn

Page
Basel 3 capital (phased-in) in EUR bn
Risk-weighted assets (phased-in)
32
in EUR bn
Basel 3 capital ratios (phased-in)
• CET1 capital: -EUR 31m ytd, due to: • Reclassification of financial instruments to FV,
as part of IFRS9 implementation (-EUR 1.0bn) • Partly offset by prudential filter for FV changes
from own credit spread (+EUR 0.6bn) and interim profit in H1 18
• Available distributable items (ADIs) at EUR 2.5bn (pre dividend and AT1 coupon for 2018)
• Credit RWA: +EUR 5.6bn ytd, due to: • Business effects (loan growth, increased repo
and interbank business): +EUR 3.6bn • Regulatory one-off effects (higher sovereign
and equity RWA): +EUR 1.6bn • Operational risk RWA flat in Q2 18
• New model submitted for approval to regulator, resolution expected in H2 18
• B3FL CET1 ratio at 12.5% at 30 Jun 2018 (YE 2017: 12.9%)
• B3FL total capital ratio at 17.3% (YE17: 18.2%)
• Currency impact (CZK and HUF): -14 bps • Impact of acquired BCR-minority stake
(closing expected in H2 18): -9 bps
30/06/18
20.3
14.7
1.0 4.6
31/03/18
20.1
14.3
1.0
4.8
31/12/17
20.3
14.7
0.7 4.9
30/09/17
19.9
14.2
0.7
5.1
30/06/17
19.9
14.1
0.7
5.2
CET1 AT1 Tier 2
30/06/18
116.3
94.8
17.8 3.6
31/03/18
114.0
92.8
17.9 3.4
31/12/17
110.0
89.2
17.9 2.9
30/09/17
110.8
89.1
18.9 2.7
30/06/17
106.8
86.2
17.4 3.2
Credit RWA Op risk Market risk
30/06/18
17.4
%
13.5
%
12.6
%
31/03/18
17.6
%
13.4
%
12.6
%
31/12/17
18.5
%
14.0
%
13.4
%
30/09/17
18.0
%
13.4
%
12.8
%
30/06/17
18.7
%
13.8
%
13.2
%
Total capital Tier 1 CET1
Assets and liabilities: capital position – B3FL CET1 ratio stable at 12.5%

Page
Presentation topics
33
• Executive summary • Business environment • Business performance • Assets and liabilities • Outlook • Additional information

Page
• Real GDP growth of approx. 3-4% expected in 2018 in CEE and Austria • Real GDP growth to be driven by solid domestic demand, as real wage growth and
low unemployment support economic activity in CEE • Solid public finances across CEE
Macro outlook 2018
• ROTE for 2018 targeted at 10%+ (based on average tangible equity in 2018) • Assumptions for 2018: slightly growing revenues (assuming 5%+ net loan growth
and interest rate hikes in CZ and RO); slightly falling expenses due to lower project-related costs; risk costs to remain at historically low levels
Business outlook 2018
• Impact from other than expected interest rate development • Political or regulatory measures against banks • Geopolitical risks and global economic risks
Risk factors for guidance
Conclusion – Outlook 2018
34

Page
Presentation topics
35
• Executive summary • Business environment • Business performance • Assets and liabilities • Outlook • Additional information

Page
Additional information: new segmentation – Business line and geographic view
Retail
Erste Group – Business segments
Corporates Savings Banks
Group Markets
Group Corporate
Center
Intragroup Elimination
Erste Group – Geographical segmentation
Austria Central and Eastern Europe Other
EBOe & Subsidiaries (AT/EBOe)
Savings Banks (AT/SB)
Other Austria
(AT/OA)
Czech Republic
(CZ)
Romania (RO)
Slovakia (SK)
Hungary (HU)
Croatia (HR)
Serbia (RS)
• Holding Business • Erste Group Immorent • Erste Asset Management • Intermarket Bank AG
• Asset/Liability Management • Local Corporate Center
• SME • Local Large Corporate • Group Large Corporate • Commercial Real Estate • Public Sector
• Other Subsidiaries • Group bookings • Holding Corporate Center • Free Capital
• Holding ALM • Holding CC • Other Subsidiaries • Group bookings and
IC elimination • Free Capital
36
ALM & Local CC
(ALM&LCC)

Page
Additional information: income statement – Year-to-date and quarterly view
37
in EUR million 1-6 17 1-6 18 YOY-Δ Q2 17 Q1 18 Q2 18 YOY-Δ QOQ-ΔNet interest income 2,143.0 2,213.8 3.3% 1,091.7 1,082.6 1,131.2 3.6% 4.5%
Interest income 2,812.2 2,485.4 -11.6% 1,414.5 1,222.0 1,263.4 -10.7% 3.4%Other similar income 0.0 886.9 n/a 0.0 473.8 413.1 n/a -12.8%Interest expenses -669.2 -470.4 -29.7% -322.8 -229.7 -240.7 -25.4% 4.8%Other similar expenses 0.0 -688.0 n/a 0.0 -383.5 -304.6 n/a -20.6%
Net fee and commission income 910.9 959.3 5.3% 453.2 478.6 480.7 6.1% 0.5%Fee and commission income 1,149.3 1,205.9 4.9% 578.1 602.9 603.0 4.3% 0.0%Fee and commission expenses -238.4 -246.6 3.5% -124.9 -124.3 -122.3 -2.1% -1.7%
Dividend income 27.1 17.5 -35.5% 23.4 2.6 14.8 -36.5% >100.0%Net trading result 102.9 11.9 -88.5% 54.3 11.3 0.6 -99.0% -95.1%Gains/losses from financial instruments measured at fair value through profit or loss 4.5 66.6 >100.0% 1.5 30.3 36.3 >100.0% 20.0%Net result from equity method investments 6.1 7.0 14.2% 2.9 1.8 5.2 78.9% >100.0%Rental income from investment properties & other operating leases 98.3 98.1 -0.2% 48.2 47.9 50.2 4.0% 4.7%Personnel expenses -1,151.3 -1,216.7 5.7% -579.6 -604.5 -612.1 5.6% 1.3%Other administrative expenses -624.1 -627.5 0.5% -291.8 -344.5 -283.0 -3.0% -17.8%Depreciation and amortisation -228.1 -232.3 1.8% -113.8 -115.9 -116.3 2.2% 0.4%Gains/losses from financial assets and liabilities not measured at fair value through profit or loss, net 42.5 0.0 -100.0% 14.2 0.0 0.0 -100.0% n/aGains/losses from derecognition of financial assets measured at amortised cost 0.0 -0.3 n/a 0.0 0.1 -0.4 n/a n/aOther gains/losses from derecognition of financial instruments not measured at fair value through profit or loss 0.0 8.8 n/a 0.0 4.1 4.7 n/a 13.8%Gains/losses from reclassification from amortised cost to fair value through profit or loss 0.0 0.0 n/a 0.0 0.0 0.0 n/a n/aGains/losses from reclassification from fair value through other comprehensive income to fair value through profit or loss 0.0 0.0 n/a 0.0 0.0 0.0 n/a n/aNet impairment loss on financial assets -104.3 0.0 -100.0% -38.6 0.0 0.0 -100.0% n/aImpairment result from financial instruments 0.0 73.2 n/a 0.0 54.4 18.9 n/a -65.3%Other operating result -209.8 -204.6 -2.5% -82.7 -128.0 -76.6 -7.4% -40.2%
Levies on banking activities -59.4 -63.3 6.6% -23.6 -38.6 -24.7 5.0% -35.9%Pre-tax result from continuing operations 1,017.6 1,174.7 15.4% 583.0 520.7 654.0 12.2% 25.6%Taxes on income -223.9 -234.9 4.9% -128.2 -114.6 -120.4 -6.1% 5.1%Net result for the period 793.8 939.8 18.4% 454.7 406.2 533.6 17.3% 31.4%
Net result attributable to non-controlling interests 169.1 165.5 -2.1% 92.3 70.1 95.4 3.4% 36.1%Net result attributable to owners of the parent 624.7 774.3 24.0% 362.5 336.1 438.2 20.9% 30.4%
Operating income 3,292.8 3,374.1 2.5% 1,675.2 1,655.1 1,719.0 2.6% 3.9%Operating expenses -2,003.5 -2,076.5 3.6% -985.2 -1,065.0 -1,011.5 2.7% -5.0%Operating result 1,289.3 1,297.6 0.7% 690.0 590.2 707.5 2.5% 19.9%
Year-to-date view Quarterly view

Page
Additional information: group balance sheet – Assets
38
in EUR million Jun 17 Sep 17 Dec 17 Mar 18 Jun 18 YOY-Δ YTD-Δ QOQ-ΔCash and cash balances 25,842 22,104 21,796 25,246 16,888 -34.6% -22.5% -33.1%Financial assets held for trading 7,206 6,850 6,349 6,603 6,888 -4.4% 8.5% 4.3%
Derivatives 3,990 3,639 3,333 3,696 3,804 -4.7% 14.1% 2.9%Other financial assets held for trading 3,216 3,211 3,016 2,907 3,083 -4.1% 2.2% 6.1%
Financial assets at fair value through profit or loss 539 549 543 0 0 -100.0% -100.0% n/aNon-trading financial assets at fair value through profit or loss 0 0 0 3,405 3,430 n/a n/a 0.7%
Equity instruments 0 0 0 278 279 n/a n/a 0.4%Debt securities 0 0 0 2,727 2,739 n/a n/a 0.5%Loans and advances to banks 0 0 0 0 0 n/a n/a -100.0%Loans and advances to customers 0 0 0 401 412 n/a n/a 2.8%
Financial assets available for sale 17,786 16,743 16,060 0 0 -100.0% -100.0% n/aFinancial assets at fair value through other comprehensive income 0 0 0 10,289 9,965 n/a n/a -3.2%
Equity instruments 0 0 0 262 242 n/a n/a -7.9%Debt securities 0 0 0 10,027 9,723 n/a n/a -3.0%
Financial assets held to maturity 19,355 19,398 19,800 0 0 -100.0% -100.0% n/aLoans and receivables to credit institutions 4,347 10,358 9,126 0 0 -100.0% -100.0% n/aLoans and receivables to customers 135,122 138,005 139,532 0 0 -100.0% -100.0% n/aFinancial assets at amortised cost 0 0 0 172,805 180,748 n/a n/a 4.6%
Debt securities 0 0 0 23,710 24,029 n/a n/a 1.3%Loans and advances to banks 0 0 0 11,944 17,149 n/a n/a 43.6%Loans and advances to customers 0 0 0 137,151 139,570 n/a n/a 1.8%
Finance lease receivables 0 0 0 3,561 3,676 n/a n/a 3.2%Hedge accounting derivatives 1,063 1,006 884 103 116 -89.1% -86.9% 13.2%Property and equipment 2,431 2,414 2,387 2,342 2,363 -2.8% -1.0% 0.9%Investment properties 1,027 1,033 1,112 1,106 1,102 7.3% -0.8% -0.3%Intangible assets 1,458 1,474 1,524 1,511 1,507 3.4% -1.1% -0.3%Investments in associates and joint ventures 196 196 198 197 201 2.9% 1.5% 2.0%Current tax assets 156 123 108 122 125 -19.6% 16.3% 2.5%Deferred tax assets 209 209 258 319 320 53.0% 24.0% 0.2%Assets held for sale 231 217 214 228 203 -12.2% -5.2% -10.9%Trade and other receivables 0 0 0 947 1,072 n/a n/a 13.2%Other assets 1,190 1,036 769 1,235 1,274 7.1% 65.7% 3.2%Total assets 218,156 221,715 220,659 230,018 229,878 5.4% 4.2% -0.1%
Quarterly data Change
Page
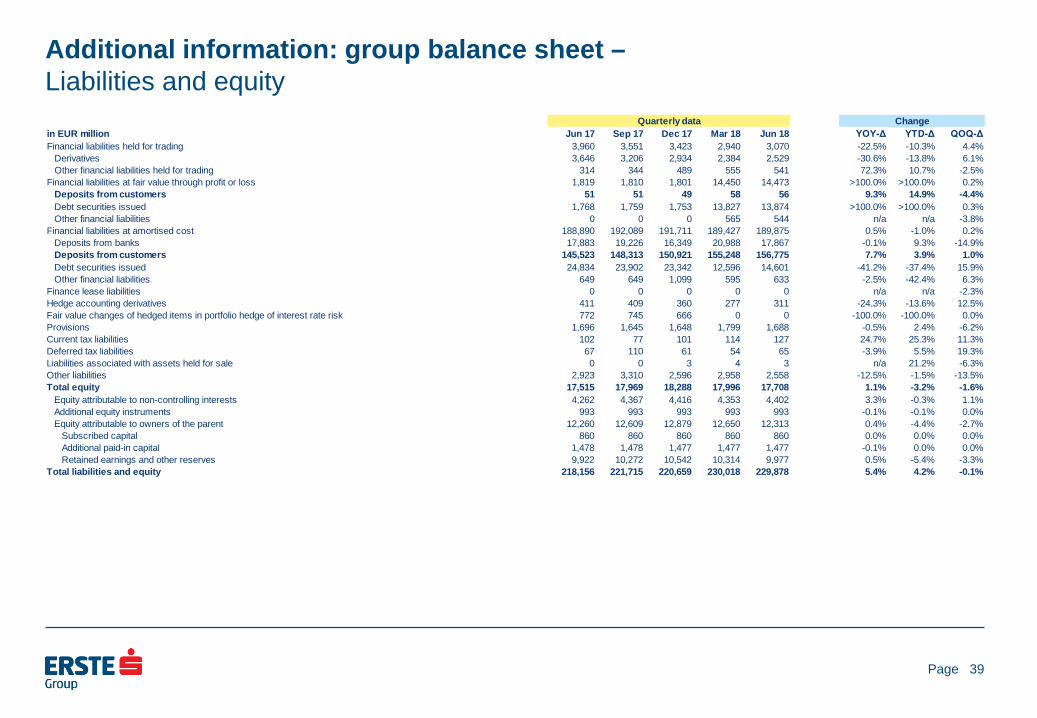
Additional information: group balance sheet – Liabilities and equity
39
in EUR million Jun 17 Sep 17 Dec 17 Mar 18 Jun 18 YOY-Δ YTD-Δ QOQ-ΔFinancial liabilities held for trading 3,960 3,551 3,423 2,940 3,070 -22.5% -10.3% 4.4%
Derivatives 3,646 3,206 2,934 2,384 2,529 -30.6% -13.8% 6.1%Other financial liabilities held for trading 314 344 489 555 541 72.3% 10.7% -2.5%
Financial liabilities at fair value through profit or loss 1,819 1,810 1,801 14,450 14,473 >100.0% >100.0% 0.2%Deposits from customers 51 51 49 58 56 9.3% 14.9% -4.4%Debt securities issued 1,768 1,759 1,753 13,827 13,874 >100.0% >100.0% 0.3%Other financial liabilities 0 0 0 565 544 n/a n/a -3.8%
Financial liabilities at amortised cost 188,890 192,089 191,711 189,427 189,875 0.5% -1.0% 0.2%Deposits from banks 17,883 19,226 16,349 20,988 17,867 -0.1% 9.3% -14.9%Deposits from customers 145,523 148,313 150,921 155,248 156,775 7.7% 3.9% 1.0%Debt securities issued 24,834 23,902 23,342 12,596 14,601 -41.2% -37.4% 15.9%Other financial liabilities 649 649 1,099 595 633 -2.5% -42.4% 6.3%
Finance lease liabilities 0 0 0 0 0 n/a n/a -2.3%Hedge accounting derivatives 411 409 360 277 311 -24.3% -13.6% 12.5%Fair value changes of hedged items in portfolio hedge of interest rate risk 772 745 666 0 0 -100.0% -100.0% 0.0%Provisions 1,696 1,645 1,648 1,799 1,688 -0.5% 2.4% -6.2%Current tax liabilities 102 77 101 114 127 24.7% 25.3% 11.3%Deferred tax liabilities 67 110 61 54 65 -3.9% 5.5% 19.3%Liabilities associated with assets held for sale 0 0 3 4 3 n/a 21.2% -6.3%Other liabilities 2,923 3,310 2,596 2,958 2,558 -12.5% -1.5% -13.5%Total equity 17,515 17,969 18,288 17,996 17,708 1.1% -3.2% -1.6%
Equity attributable to non-controlling interests 4,262 4,367 4,416 4,353 4,402 3.3% -0.3% 1.1%Additional equity instruments 993 993 993 993 993 -0.1% -0.1% 0.0%Equity attributable to owners of the parent 12,260 12,609 12,879 12,650 12,313 0.4% -4.4% -2.7%
Subscribed capital 860 860 860 860 860 0.0% 0.0% 0.0%Additional paid-in capital 1,478 1,478 1,477 1,477 1,477 -0.1% 0.0% 0.0%Retained earnings and other reserves 9,922 10,272 10,542 10,314 9,977 0.5% -5.4% -3.3%
Total liabilities and equity 218,156 221,715 220,659 230,018 229,878 5.4% 4.2% -0.1%
Quarterly data Change
Page
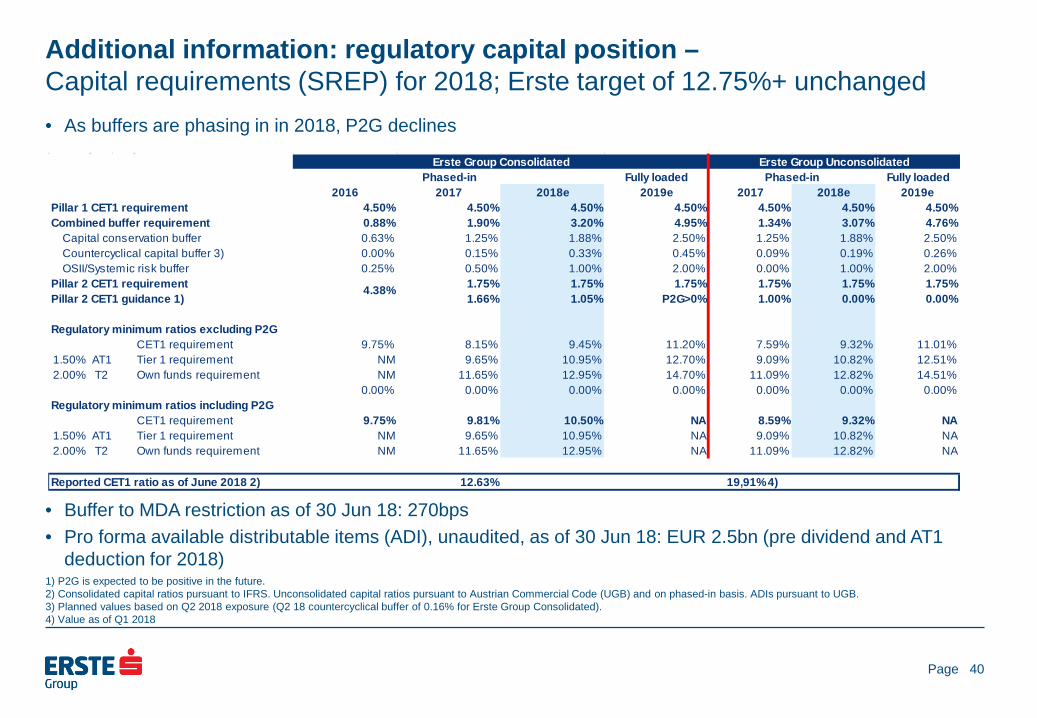
Additional information: regulatory capital position – Capital requirements (SREP) for 2018; Erste target of 12.75%+ unchanged • As buffers are phasing in in 2018, P2G declines
• Buffer to MDA restriction as of 30 Jun 18: 270bps • Pro forma available distributable items (ADI), unaudited, as of 30 Jun 18: EUR 2.5bn (pre dividend and AT1
deduction for 2018)
40
1) P2G is expected to be positive in the future. 2) Consolidated capital ratios pursuant to IFRS. Unconsolidated capital ratios pursuant to Austrian Commercial Code (UGB) and on phased-in basis. ADIs pursuant to UGB. 3) Planned values based on Q2 2018 exposure (Q2 18 countercyclical buffer of 0.16% for Erste Group Consolidated). 4) Value as of Q1 2018
Fully loaded Fully loaded2016 2017 2018e 2019e 2017 2018e 2019e
Pillar 1 CET1 requirement 4.50% 4.50% 4.50% 4.50% 4.50% 4.50% 4.50%Combined buffer requirement 0.88% 1.90% 3.20% 4.95% 1.34% 3.07% 4.76%
Capital conservation buffer 0.63% 1.25% 1.88% 2.50% 1.25% 1.88% 2.50%Countercyclical capital buffer 3) 0.00% 0.15% 0.33% 0.45% 0.09% 0.19% 0.26%OSII/Systemic risk buffer 0.25% 0.50% 1.00% 2.00% 0.00% 1.00% 2.00%
Pillar 2 CET1 requirement 1.75% 1.75% 1.75% 1.75% 1.75% 1.75%Pillar 2 CET1 guidance 1) 1.66% 1.05% P2G>0% 1.00% 0.00% 0.00%
Regulatory minimum ratios excluding P2GCET1 requirement 9.75% 8.15% 9.45% 11.20% 7.59% 9.32% 11.01%
1.50% AT1 Tier 1 requirement NM 9.65% 10.95% 12.70% 9.09% 10.82% 12.51%2.00% T2 Own funds requirement NM 11.65% 12.95% 14.70% 11.09% 12.82% 14.51%
0.00% 0.00% 0.00% 0.00% 0.00% 0.00% 0.00%Regulatory minimum ratios including P2G
CET1 requirement 9.75% 9.81% 10.50% NA 8.59% 9.32% NA1.50% AT1 Tier 1 requirement NM 9.65% 10.95% NA 9.09% 10.82% NA2.00% T2 Own funds requirement NM 11.65% 12.95% NA 11.09% 12.82% NA
Reported CET1 ratio as of June 2018 2) 12.63% 19,91% 4)
Phased-inErste Group Consolidated Erste Group Unconsolidated
4.38%
Phased-in

Page
Additional information: gross customer loans – By risk category, by currency, by industry
Gross cust. loans by risk category (EUR bn)
41
Gross customer loans by currency (EUR bn) Gross customer loans by industry (EUR bn)
Gross customer loans by risk category (in %)
Gross customer loans by currency (in %)
30/06/18
148.5
126.6
15.2 1.5 5.3
31/03/18
146.0
124.2
14.7 1.6 5.5
31/12/17
143.5
121.9
14.2 1.6 5.8
30/09/17
142.3
119.8
14.8 1.5 6.2
30/06/17
139.6
116.9
14.5 1.7 6.5
Low risk
Management attention
Substandard
Non-performing
100%
30/06/18
85.2%
10.2% 1.0% 3.6%
31/03/18
85.1%
10.1% 1.1% 3.7%
31/12/17
85.0%
9.9% 1.1% 4.0%
30/09/17
84.2%
10.4% 1.1% 4.3%
30/06/17
83.8%
10.4% 1.2% 4.7%
30/06/18
148.5
107.2
32.6 3.7
2.9 2.2
31/03/18
146.0
105.6
31.9 3.8
2.6 2.1
31/12/17
143.5
103.9
31.2 4.1
2.5 1.8
30/09/17
142.3
103.1
30.3 4.3
2.8 1.8
30/06/17
139.6
100.4
30.1 4.8 2.5
1.8
EUR CEE-LCY CHF USD Other
72.2%
21.9% 2.5%
2.0% 1.5%
31/03/18
72.3%
21.9% 2.6%
1.8% 1.5%
31/12/17
72.4%
21.7% 2.9% 1.8% 1.3%
30/09/17
72.5%
21.3% 3.0%
1.9% 1.3%
30/06/17
71.9%
21.6% 3.4%
30/06/18
1.8% 1.3%
148.5
62.3
23.6
11.3
8.7 6.6 5.8 4.9 8.6 3.9
4.1 8.9
31/03/18
146.0
61.3
22.9
11.0
8.5 6.6 5.6 4.9 8.6 3.8
4.0 8.8
31/12/17
143.5
60.3
23.1
10.7
8.3 6.5 5.7
3.8 8.4 3.7
3.9 9.1
30/09/17
142.3
59.2
22.9
10.6
8.3 6.6 5.8
30/06/18
7.9 3.6
3.8 9.0
30/06/17
139.6
58.3
22.3
4.7
8.2 6.5 5.8
4.4 7.5
3.6 3.7 8.7
10.5
Households
Real estate
Manufacturing
Trade
Construction
Public admin
Financial inst.
Services
Tourism
Transport & comms
Other
Page
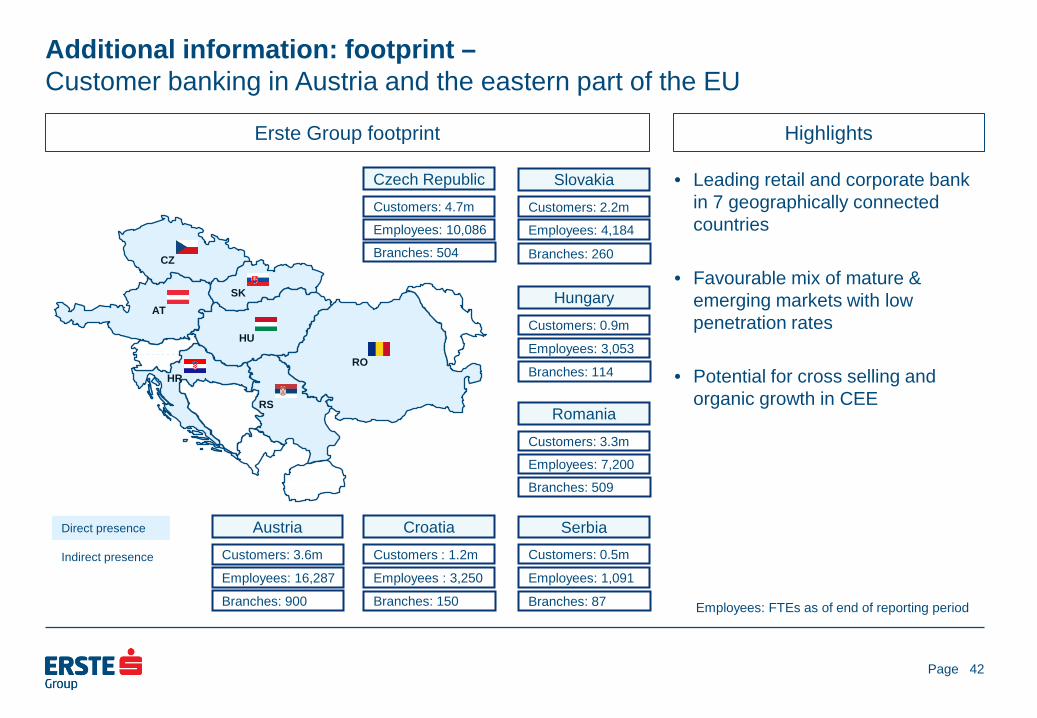
• Leading retail and corporate bank in 7 geographically connected countries
• Favourable mix of mature & emerging markets with low penetration rates
• Potential for cross selling and organic growth in CEE
Additional information: footprint – Customer banking in Austria and the eastern part of the EU
Erste Group footprint Highlights
42
Direct presence
Indirect presence
Customers: 0.9m
Hungary
Employees: 3,053
Branches: 114
Customers: 3.3m
Romania
Employees: 7,200
Branches: 509
Customers: 0.5m
Serbia
Employees: 1,091
Branches: 87
Customers : 1.2m
Croatia
Employees : 3,250
Branches: 150
Customers: 4.7m
Czech Republic
Employees: 10,086
Branches: 504
Customers: 2.2m
Slovakia
Employees: 4,184
Branches: 260
Customers: 3.6m
Austria
Employees: 16,287
Branches: 900
AT
CZ
SK
HU
RO HR
RS
Employees: FTEs as of end of reporting period

Page
Additional information: strategy – A real customer need is the reason for all business
Retail banking
Corporate banking
Capital markets
Public sector
Interbank business
Customer banking in Central and Eastern Europe
Eastern part of EU Focus on CEE, limited exposure to other Europe
Focus on local currency mortgage and consumer loans funded by local deposits FX loans only in EUR for clients with EUR income (or equivalent) and where funded by local FX deposits (HR & RS) Savings products, asset management and pension products Expansion of digital banking offering
Focus on customer business, incl. customer-based trading activities In addition to core markets, presences in Poland, Germany and London with institutional client focus and selected product mix Building debt and equity capital markets in CEE
Financing sovereigns and municipalities with focus on infrastructure development in core markets Any sovereign holdings are only held for market-making, liquidity or balance sheet management reasons
Large, local corporate and SME banking Advisory services, with focus on providing access to capital markets and corporate finance Real estate business that goes beyond financing
Focus on banks that operate in the core markets Any bank exposure is only held for liquidity or balance sheet management reasons or to support client business
43

Page
Additional information: Ratings – Composition of Erste Group Bank AG’s issuer ratings
44
Status as of 30 April 2018
A- Stable / F1
VR - Viability Rating (Individual Rating )
a-
SRF - Support Rating Floor
NF (No Floor)
IDR - Issuer Default Rating Long-Term Outlook / Short-Term
AnchorBusiness Position Strong +1Capital & Earnings Adequate 0Risk Position Adequate 0Funding Above AverageLiquidity Strong
Support
ALAC SupportGRE SupportGroup SupportSovereign Support
Additional Factors
SACP - Stand-Alone Credit Profile
a
00
+
bbb+
+1
0
▲
▲
=Issuer Credit Rating
Long-Term Outlook / Short-Term
A Positive / A-1
00
0
+
Asset Risk baa2Capital baa1Profitability baa3Funding Structure a3Liquid Resources baa1
Business Diversif ication 0Opacity, Complexity 0Corporate Behaviour 0
BCA Baseline Credit Assessment baa1
Affiliate Support 0
Adjusted BCA baa1
LGF Loss Given Failure + 2Government Support 0
Qualitative Factors
Macro ProfileStrong
+Financial Profile
+
+
=Issuer Rating / Senior Unsecured
Long-Term Outlook / Short-Term
A2 Positive / P-1
=+=

Page
Additional information: shareholder structure – Total number of shares: 429,800,000
By investor By region
45
1 Economic interest Erste Foundation 2 Economic interest Savings Banks & Savings Banks Foundations 3 Other parties to the shareholder agreement of Erste Foundation, Savings Banks and CaixaBank * Unidentified institutional and retail investors ** Including Market Makers, Prime Brokerage, Proprietary Trading, Collateral and Stock Lending positions which are visible through custodian banklists
Status as of 30 June 2018
11%
06%
03%
10%
05%
47%
04%
03%
10%
Caixa
Erste Foundation 1
Savings Banks & Savings Banks Foundations 2
Other Syndicated 3
Identified Trading **
Retail
0.7% Employees
Institutional
Unidentified *
BlackRock Inc 28%
16%
15%
26%
03%
03%
10%
North America
Austria Identified Trading **
Rest of world
UK & Ireland
Continental Europe
Unidentified *
Page
Investor relations details
• Erste Group Bank AG, Am Belvedere 1, 1100 Vienna E-mail: [email protected] Internet: http://www.erstegroup.com/investorrelations
http://twitter.com/ErsteGroupIR http://www.slideshare.net/Erste_Group Erste Group IR App for iPad, iPhone and Android http://www.erstegroup.com/de/Investoren/IR_App
Reuters: ERST.VI Bloomberg: EBS AV Datastream: O:ERS ISIN: AT0000652011
• Contacts Thomas Sommerauer Tel: +43 (0)5 0100 17326 e-mail: [email protected] Peter Makray Tel: +43 (0)5 0100 16878 e-mail: [email protected] Simone Pilz Tel: +43 (0)5 0100 13036 e-mail: [email protected] Gerald Krames Tel: +43 (0)5 0100 12751 e-mail: [email protected]
46