WELCOME - s22.q4cdn.com · 2018. the most exciting time in tech history. nvidia gpu. gaming. pro...
70
2018 Simona Jankowski, March 27, 2018 WELCOME
Transcript of WELCOME - s22.q4cdn.com · 2018. the most exciting time in tech history. nvidia gpu. gaming. pro...

2018
Simona Jankowski, March 27, 2018
WELCOME

20182018
SAFE HARBORForward-Looking Statements Except for the historical information contained herein, certain matters in this presentation including, but not limited to, statements as to: our growth and growth drivers; our market opportunities and TAM; the benefits, impact, and performance of: cinematic games, autonomous vehicles, AI, and our products, technologies, services, and programs; every vehicle being autonomous; the challenges to production of AI cars; our production roadmap and schedules; eSports, social, and the growth of gaming; projected three-year datacenter operating expenses; projected exaflops growth; our intended fiscal 2019 capital return; our strategies; market trends; future financial results, estimates and forecasts; and other predictions and estimates are forward-looking statements within the meaning of the Private Securities Litigation Reform Act of 1995. These forward-looking statements and any other forward-looking statements that go beyond historical facts that are made in this presentation are subject to risks and uncertainties that may cause actual results to differ materially. Important factors that could cause actual results to differ materially include: global economic conditions; our reliance on third parties to manufacture, assemble, package and test our products; the impact of technological development and competition; development of new products and technologies or enhancements to our existing products and technologies; market acceptance of our products or our partners’ products; design, manufacturing or software defects; changes in consumer preferences and demands; changes in industry standards and interfaces; unexpected loss of performance of our products or technologies when integrated into systems and other factors. For a complete discussion of factors that could materially affect our financial results and operations, please refer to the reports we file from time to time with the SEC, including our Form 10-K for the fiscal period ended January 28, 2018. Copies of reports we file with the SEC are posted on our website and are available from NVIDIA without charge. These forward-looking statements are not guarantees of future performance and speak only as of March 27, 2018, based on information currently available to us. Except as required by law, NVIDIA disclaims any obligation to update these forward-looking statements to reflect future events or circumstances.
Financial Measures This presentation contains historical revenue amounts for certain of our market platforms and businesses which provides investors with additional information to supplement the segment reporting information contained in our Form 10-K for the fiscal year ended January 28, 2018. In addition to U.S. GAAP financials, this presentation includes certain non-GAAP financial measures. These non-GAAP financial measures are in addition to, and not a substitute for or superior to, measures of financial performance prepared in accordance with U.S. GAAP. See our website for a reconciliation between each non-GAAP measure and the most comparable GAAP measure. Where we present non-GAAP financial measures, including non-GAAP gross margin, non-GAAP gross margin without IP, non-GAAP operating expense, non-GAAP operating income, non-GAAP operating margin, non-GAAP EPS, and free cash flow we generally exclude stock-based compensation, legal settlement, acquisition-related items, restructuring and other charges, product warranty charge, the associated tax impact, provisional tax benefit from tax reform, and other expense, where applicable.

20182018
AGENDA
Jensen Huang
Shanker Trivedi
Rob Csongor
Jeff Fisher
Colette Kress
All
Rise of GPU Computing
Datacenter
Automotive
Gaming
Financials
Q&A
Questions? Please email [email protected]

2018
Jensen Huang, CEO
NVIDIA

2018
THE MOST EXCITING TIME IN TECH HISTORY
NVIDIA GPU
GAMING PRO VIZ DATACENTER AUTONOMOUS VEHICLES

2018
Shanker Trivedi, March 27, 2018
DATACENTER

20182018
HIGHLIGHTS
Volta chosen by all major server OEM/ODMs and all major public clouds
2,000 customers adopt NVIDIA inference platform
86 of Top 500 Supercomputers NVIDIA Tesla Accelerated
Top 15 HPC Apps Accelerated; 550 accelerated apps
CUDA developers up 75% YoY to 770K
2018: A GREAT YEAR
FY 2018FY 2016
$339M
$1,932M
133%
$830M
145%
FY 2017Source: NVIDIA
$MDATACENTER REVENUE

20182018
BIG GROWTH OPPORTUNITY$50B Total Addressable Market (TAM)
HYPERSCALE & CONSUMER INTERNET
$20B
HIGH PERFORMANCE COMPUTING
$10B $20B
CLOUD COMPUTING& INDUSTRIES
Source: NVIDIA

20182018
NVIDIA PLATFORM EVERY MAJOR CLOUDEVERY MAJOR COMPUTER MAKER
DEVELOPERS
AMBER
ANSYS
ANSYS FLUENT
BLAST
GAMESS
Gaussian
GROMACS
LAMMPS
LS-DYNA
NAMD
OpenFOAM
Quantum Espresso
Simula Abaqus
VASP
WRF
AI FRAMEWORKS DATA ANALYTICS
H20
Kinetica
MapD
MatLab
ENTERPRISE Adobe
ANSYS
Dassault
GE
IBM
SAP
SAS
Schlumberger
APPS & FRAMEWORKS
SOFTWARE
VERTICAL SOLUTIONS
TESLA, DGX
GPU & CUDA
DEVELOPERS
USERS
TOP 15 HPC
NVIDIA DATACENTER STRATEGY
Source: NVIDIA

20182018
APPLICATIONS
NVIDIA AI DRIVE: AUTONOMOUS VEHICLES
METROPOLIS: SMART CITIES
CLARA: HEALTHCARE
SOFTWARE, SDKS, ENGINES, LIBRARIES, OS
CUDA & GPU COMPUTING ARCHITECTURE
DATACENTER PLATFORM
HPC FRAMEWORKS ENTERPRISE DATA ANALYTICS VISUALIZATION
cuDNN TensorRT cuBLAS cuSPARSE OpenACC DCGMcuFFTDeepStream
TESLA DGX
vGPU KONG*
NVIDIA GPU CLOUD
DEEP LEARNING HIGH PERFORMANCE COMPUTING DATA CENTER MGMT
*Kubernetes on NVIDIA GPUs
INDUSTRY VERTICAL SOLUTIONS

20182018
1,200
2,800
FY17 FY18
Inception Startups (Companies)
125
550
FY17 FY18
Enterprise DGX Customers
400
550+
FY17 FY18
GPU Ready Apps (Units)
280K
840K
FY17 FY18
Training – cuDNN (Downloads)
DEVELOPER ECOSYSTEM
HYPERSCALE &CONSUMER INTERNET
CLOUD COMPUTING &INDUSTRIES
HIGH PERFORMANCE COMPUTING
200K
350K
FY17 FY18
Accelerated Computing Developers
70
30K
FY17 FY18
Inferencing – TRT (Downloads)
Mainstream Adoption AI Leadership Rapid Growth
75%
37%
200%
∞
133%
340%
Source: NVIDIA

20182018
GPU ACCELERATED DATACENTER VALUEThe More You Buy, the More You Save
WORKLOAD BASELINECPU-Only
HPC(Amber, LAMMPS,
NAMD, VASP)
AI TRAINING(Caffe2, TensorFlow,
MXNet)
AI INFERENCE (Image, Speech,
Translation)
Speed Up 1X 20X >100X 60X
Servers 5,000 250 <50 84
Capex $45M $11M $7.5M $7M
3 Year Opex(Power + Cooling) $19.5M $2.5M $1M $1.5M
TCO Savings N/A 79% 86% 86%
Note(s): CPU Baselined to 5000 Servers for each workload | Capex Costs: CPU node with 2x Skylake CPU’s ~$9K; GPU node with 4x V100 GPU’s ~$45K | Opex Costs: Power & cooling is $180/kW/month | Power: CPU server + n/w = 0.6 KW; GPU server + n/w = 1.6 KW; DGX-1V/HGX-1 Server = 3.2KW | HPC: GPU node with 4xV100 compared to 2xCPU Server | DL Training: DGX-1V compared to a 2xCPU server | DL Inference: HGX-1 based server (8xV100) Compared to 2x CPU Server |numbers rounded to nearest $0.5M
Source: NVIDIA

20182018
LEADERSHIP MILESTONES$10B TAM
102 Top 500 Systems accelerated, 86 NVIDIA systems
Public sector investment in AI and exascale
Top 15 apps, 70% of top 50 HPC apps accelerated; total 550
2,328 scientific computing papers citing GPUs compared to 1,276 in
FY17
HIGH PERFORMANCE COMPUTINGTo Exascale, and Beyond
0
5
10
15
20
25
30
EXAP
LOPS
Top 500 Rest of HPC
2017 2023
Source: NVIDIA, arXiv, PubMed
20182018
APPLICATIONS LEADERSHIP
HYPERSCALE & CONSUMER INTERNETAI Powers Consumer Apps
EXAF
LOPS
Training
EIO
Ps
Inference
2017 2023
RECOMMENDATION ENGINE
CREDIT SCORING
FRAUD DETECTION
AD INSERTION
AI ASSISTANT
2017 2023
$20B TAM
Source: NVIDIA
SPEECH VIDEO IMAGE LANGUAGE

2018
HYPERSCALE & CONSUMER INTERNETGPUs Best for Deep Learning Training
Increasing Complexity of DNNs Top 10 Hyperscale/Consumer Internet
0
1
2
2015 2016 2017
ExaF
LOPS
FY 16 FY 17 FY 18
Source: NVIDIA

20182018
HYPERSCALE & CONSUMER INTERNETAI inference opportunity – 30M Hyperscale Servers
190XIMAGE - CNN
ResNet-50 with TensorFlow Integration
50XNLP - RNN
GNMT
45XRECOMMENDER - MLP
Neural Collaborative Filtering
36XSPEECH SYNTH - DGN
WaveNet
60XSPEECH RECOG – RNN++
Deep Speech 2 DNN
Sep ‘16 April ‘16 Sep ‘17 April ‘18
TensorRT 2INT8
TensorRT 3Tensor Core
TensorRTCNNs
TensorRT 4
TensorFlowIntegration
KaldiOptimization
ONNXWinML
Source: NVIDIA
AI Inferencing is a Large Opportunity: 30M+ Hyperscale Servers

20182018
LEADERSHIP MILESTONES$20B TAM
CLOUD COMPUTING & INDUSTRIESAI Transforming Every Industry
Healthcare
Transportation
Manufacturing
Public Sector
Oil & Gas
Future Industries
Startups
Industry BreakdownVolta chosen by all major
public clouds
$5B in funding for 2,800 NVIDIA Inception Startups
Top segments include: Healthcare, Transportation, AI City
Over 2,000 companies using NVIDIA GPU Cloud (NGC)
Source: NVIDIA

20182018
STARTUPS COMPANIESRESEARCH
AI REVOLUTIONIZING MEDICAL IMAGING$100B Market: $35B Instruments, $5B Imaging Software
0%10%20%30%40%50%60%
2014 2015 2016 2017
SPIE ISBI MICCAI
Medical Imaging Papers Using Deep Learning
FDA approved AI for Medical Imaging
Dedicated supercomputer for AI Pathology
300 NVIDIA Inception Members
-
10
20
30
40
50
60
$-
$200
$400
$600
$800
Healthcare AI Financing History
Disclosed Funding ($M) DealsH1 2012 H1 2017
Source: NVIDIA, CB Insights
20182018
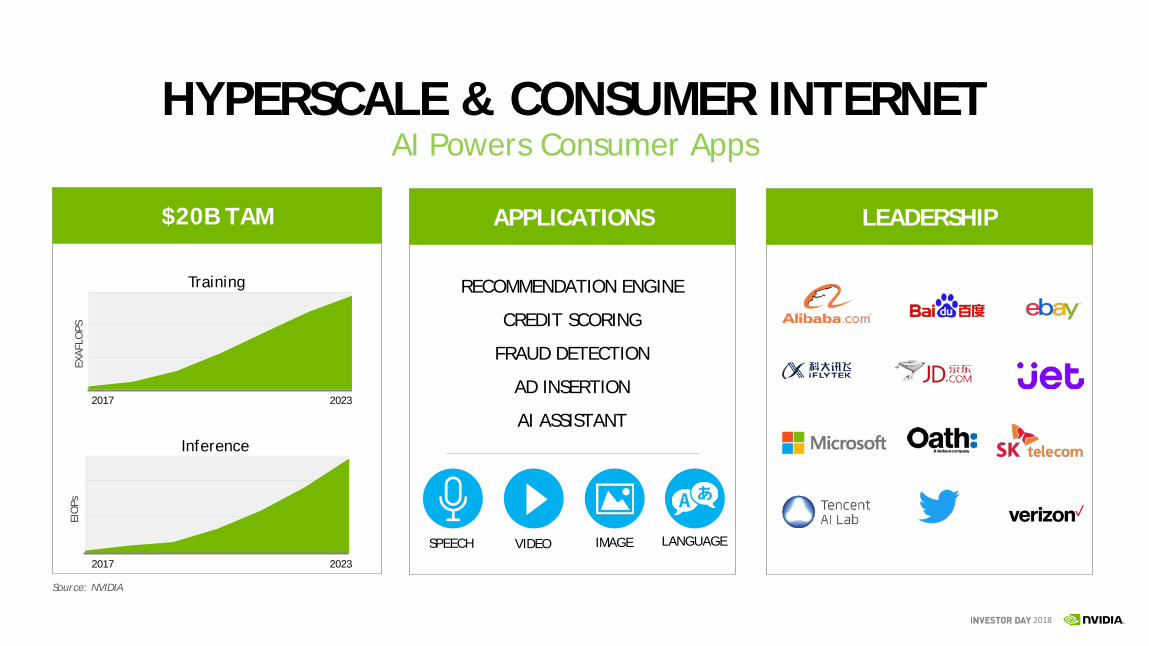
AV DATACENTER OPPORTUNITY
16 petaFLOPs for every paved road in the US in 1 day
RE-SIM on DGX
10B+ miles to ensure safe driving
3D-SIM on DRIVE CONSTELLATION
10+ DNNs, 1+ million images
per DNN
Training on DGX
1+ petabyte per car per year
Data Factory
Self driving cars by 2020
DRIVE AV on DPX
Sources: NVIDIA, RAND Corporation

20182018
DATA CENTER SUMMARY
HYPERSCALE &CONSUMER INTERNET
$20B
HIGH PERFORMANCE COMPUTING
$10B
CLOUD COMPUTING& INDUSTRIES
$20B
Compelling platform strategy
Leadership in HPC and deep learning training
Large AI inference opportunity
Increasing enterprise adoption
Growing developer ecosystem
Extensible flexible architecture
$50B TAM
Source: NVIDIA

2018
Rob Csongor | March 27, 2018
AUTOMOTIVE

2018
AUTOMOTIVE GROWTH
0
100
200
300
400
500
600
700
FY14 FY15 FY16 FY17 FY18
Mill
ions
15%
$558M
0
100
200
300
400
FY17
Q2
FY17
Q3
FY17
Q4
FY18
Q1
FY18
Q2
FY18
Q3
FY18
Q4
Curr
ent
DPX2 DX
0
100
200
300
400
FY17
Q1
FY17
Q2
FY17
Q3
FY17
Q4
FY18
Q1
FY18
Q2
FY18
Q3
FY18
Q4
REVENUE AI ENGAGEMENTSDRIVE PARTNERS

2018
AV REVOLUTIONIZING $10T INDUSTRYEvery Vehicle Will Be Autonomous
DRIVING TRUCKINGMOBILITY SERVICES
$2.4T MARKET
AV will save lives, $Ms in lost productivity
(3000 lives/day, $0.5T/yr)
$5.3T MARKET
AV will reduce parking footprint, lowering cost of ownership
$2T MARKET
AV will extend the range of truckers, help cover shortage of trucker.
(10% decline from ELD, $500B loss due to accidents)

2018Source: ABI Research
AV IS A $60B OPPORTUNITYEvery Vehicle Will Be Autonomous
L5 — Robo-taxi L4 — Full AV L3 — Partial AV L2 — Human backup
2019 2020 20212018 2035
$60B TAM(2035)120M
vehicles
10M Robo-taxis
100MSDC
$20B
$40BL2 – L5
Shipments
AV REVENUE
Development DRIVE Systems
Development NRE
Training, testing &validation systems
2018
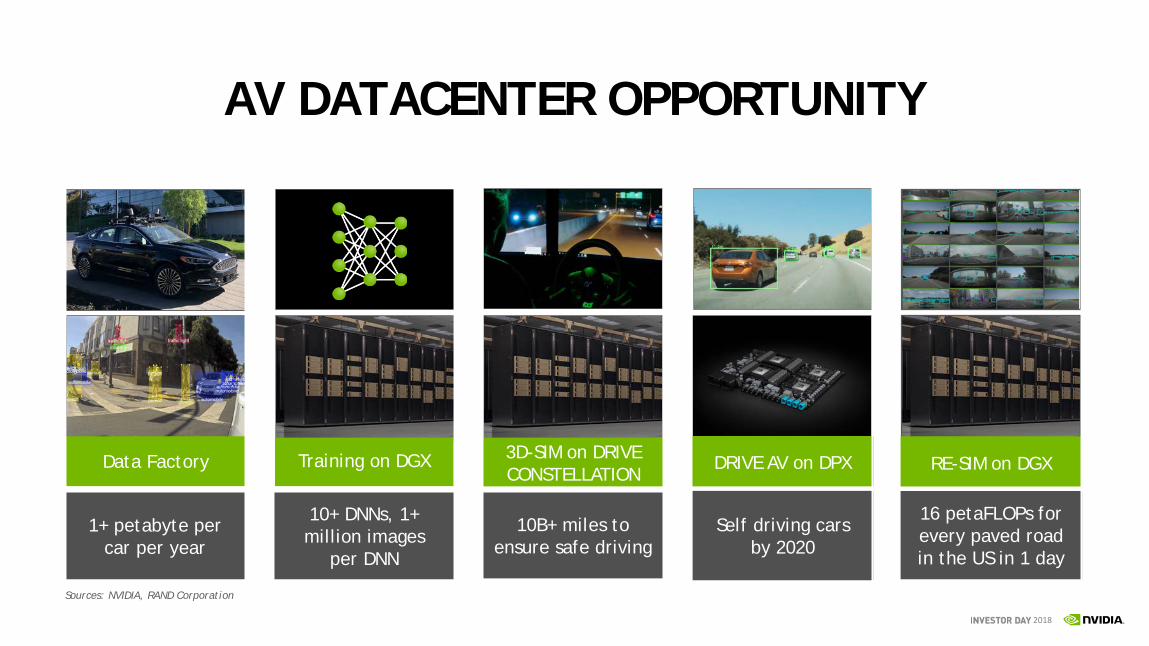
THE CHALLENGE AUTOMAKERS FACE
POWER, COSTUp to …
1000s of Watts, 10000s of $
PROCESSING REQSUp to …
100s of TOPs, 10s of TFLOPs, 1000s of KDMIPs
TESTING, VALIDATIONUp to …
100s of billions of driving miles, 100s of years

2018
AI
The Computing Model for AV
NVIDIA GAME CHANGERSKey Strategies
XAVIER PROCESSOR
One ArchitectureFrom L2 to L5
NVIDIA DRIVEEND-TO-END SYSTEM
Collect DataTrain Models
SimulateDrive
OPEN PLATFORM
370+ PartnerEcosystem

2018
DRIVE Parker
1x Perf
1 Chip
Samples: Now
Production: Now
DRIVE PX 2
20x Perf
4 chips
Samples: Now
Production: Now
DRIVE Xavier
20x Perf
1 chip
Samples: Now
Production: Q1’2019
DRIVE Pegasus
200x Perf
4 chips
Samples: Q3’2018
Production: Q3’2019
ONE SCALABLE ARCHITECTUREL2 through L5 Driving SolutionsONE SW ARCHITECTURE
ORIN
DRIVE Orin
200x Perf
2 chips

2018
DRIVE AV ON XAVIER

2018
FrontRadar
L2 ECU
FrontSurround Camera
SideSurround Camera
SideSurround Camera
SideRadar
ForwardCamera
NCAP ECU
NCAP Camera
SideRadar
Parking ECU
Driving Monitor ECU
Driving Monitor Camera
Rear Radar
RearSurround Camera
TODAY’S ADASFour Separate Computers
Surround ViewECU

2018
FrontRadar
One AI AV Computer
FrontSurround Camera
SideSurround Camera
SideSurround Camera
SideRadar
ForwardCamera
NCAP ECU
NCAP Camera
SideRadar
Driving Monitor Camera
Rear Radar
RearSurround Camera
DRIVE XAVIER VALUEOne Computer — One SW, Lower Cost

2018
ROBO—TAXI DRIVE VALUE

2018
ROBO—TAXI DRIVE VALUE

2018
L5 ROBO-TAXI USE CASE
2x PCs in the Trunk 2x DRIVE PEGASUS
TOPs 330 640
KDMIPs 350 550
GFLOPs 39,000 38,000
Power 3 kw 1/3rd pwr
Size 1x 1/10th size
Cost 1x 1/5th cost
ROBO—TAXI DRIVE VALUE

2018
END-TO-END SYSTEMFrom Training to Testing to Driving
16 petaFLOPs for every paved road in the US in 1 day
RE-SIM on DGX
10B+ miles to ensure safe driving
3D-SIM on DRIVE CONSTELLATION
10+ DNNs, 1+ million images
per DNN
Training on DGX
1+ petabyte per car per year
Data Factory
Self driving cars by 2020
DRIVE AV on DPX
Sources: NVIDIA, RAND Corporation

35
ANNOUNCINGNVIDIA DRIVE SIM AND CONSTELLATIONAV VALIDATION SYSTEM
Virtual Reality AV Simulator
Same Architecture as DRIVE Computer
HIL and PIL Support
Simulate Rare and Difficult Conditions, Recreate Scenarios, Run Regression Tests, Drive Billions of Virtual Miles
10,000 DRIVE Constellations Drive 3B Miles per Year
2018
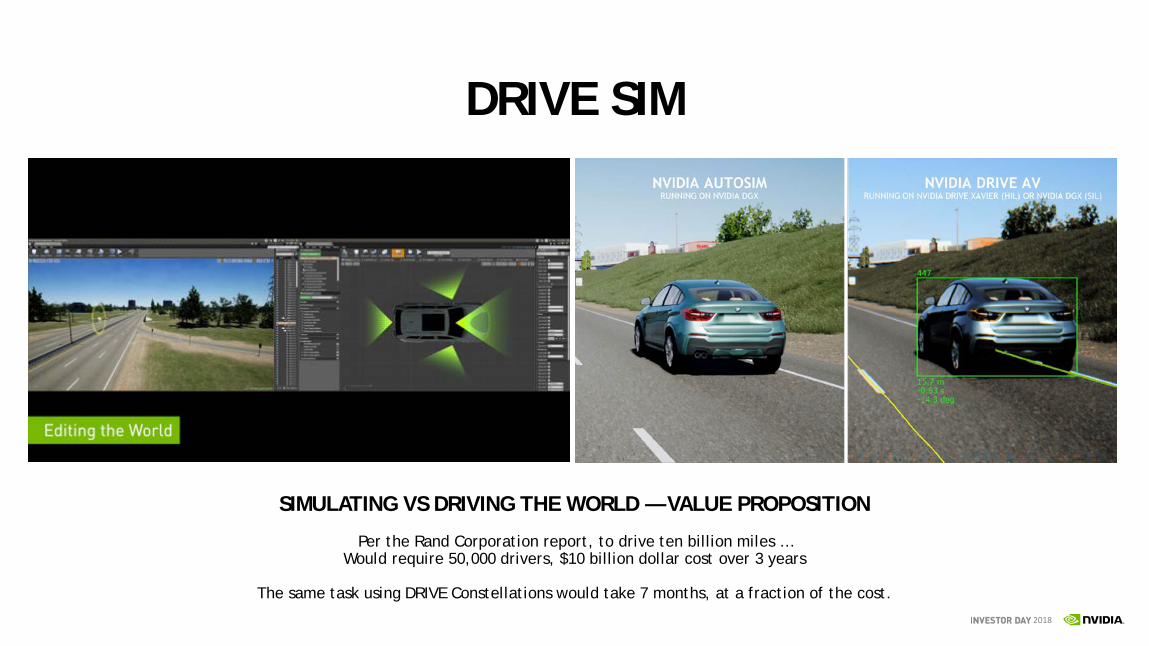
DRIVE SIM
SIMULATING VS DRIVING THE WORLD — VALUE PROPOSITION
Per the Rand Corporation report, to drive ten billion miles …Would require 50,000 drivers, $10 billion dollar cost over 3 years
The same task using DRIVE Constellations would take 7 months, at a fraction of the cost.

2018
THE POWER OF AN OPEN PLATFORM
370+ PARTNERS DEVELOPING ON NVIDIA DRIVE
CARS
TRUCKS
MOBILITY SERVICES
SUPPLIERS
MAPPING
SENSORS
STARTUPS
RESEARCH

2018
KEY ANNOUNCEMENTSProgress This Year
PARTNERSPRODUCTS
VW AI AUDI DEPLOYS ZFASBAIDU APOLLO MERCEDES-BENZ AI
VOLVO / AUTOLIV AURORA CONTINENTAL DEUTSCHE POST DHL
ZF / CHERY TUSIMPLEUBER PACCAR
XAVIER IS HERE DRIVE PEGASUS
DRIVE SIM DRIVE AV
DRIVE IX DRIVE AR

39
SUMMARY
• $0.5B business transitioning to AV – Revenue coming from development systems, NRE, simulating/testing/training systems
• Every vehicle will be autonomous - $60B TAM opportunity by 2035.
• NVIDIA’s Key Strategies - AI, Xavier, end to end system, open platform are game changer strategies for NVIDIA.
• Moment
Every vehicle will be autonomous —$60B opportunity
NVIDIA’s Key Strategies —AI, Xavier, End to End System, Open Platform — are game changers for car makers
Testing & validation for AV —Announcing DRIVE Constellation —AI Validation in the Data Center
The world is building on NVIDIA’s open platform — 370+ partners and growing
2018

2018
Jeff Fisher, March 27, 2018
GAMING

20182018
GAMING HAD A GREAT YEAR
Pascal:1080Ti/1070Ti/Titan Xp
Max-Q Gaming Notebooks
Nintendo Switch Powered by NV
Surpassed 100M GFE Clients
GFN Beta Launched
Crypto Came to Town $0
$1,000
$2,000
$3,000
$4,000
$5,000
$6,000
FY17 FY18
36% YOY
TOTAL GAMING $M

20182018
WW GAME REVENUE
GAMING IS A HUGE MARKET…AND GROWING
Emerging
GAMERS FOR LIFE
Gam
e Re
venu
e
$B
$20B
$40B
$60B
$80B
$100B
2007 2017
Source: DFC Source: DFC (2007), NewZoo (2017) Source: ESA
2003
2017
3X
0
500
1000
1500
2000
2500
2007 2017
WW GAMERS
3X
Over 35 Yrs OldLess Than 35 Yrs Old
M
2,000M
1,500M
1,000M
500M
Gam
ers

20182018
OPEN PLATFORM DEVELOPERS CHOOSE PC 1000s of GAMES
PC IS WHERE THE ACTION IS
RECORD BREAKING SALES
MOST WATCHED..EVER
0%
10%
20%
30%
40%
50%
60%
PC Phone Console0
2000
4000
6000
8000
2013 2015 2017 PS4
Source: Steam, Twitchstats, SteamSpy, BlueHole Source: GDC Annual Survey 2018 Source: Statista, SteamSpy, GameStop
Gam
es R
elea
sed
on S
team
Eac
h Yr
Gam
e De
velo
pers
Sur
veye
d on
Gam
es in
Dev
elop
men
t

20182018
GEFORCE: WORLD’S LARGEST GAMING PLATFORM
GAMING GPU REVENUE $M
$B
$1B
$2B
$3B
$4B
$5B
FY17 FY18
21% YOY
5Yr CAGR
ASP 11%
UNITS 15%
REV 29%
END MARKET
Emerging+40%
Developed+27%
INSTALLED BASE
Pascal Other
30%
70%
LEADERSHIP
Steam Gamers
VR
GeForce Other
Source: NVIDIA Source: NVIDIA Source: NVIDIA Source: Steam, Oculus

20182018
ESPORTS MOMENTUM FUELS GAMING
Source: Statista, Blizzard & Riot Games
ESPORTS AUDIENCE PRIZE MONEY
86% OF ESPORTS GAMERS PLAY ON GEFORCE
-
50M
100M
150M
200M
250M
300M
350M
400M
2016 2018
eSpo
rts
View
ers
+100M
Tota
l eSp
orts
Tou
rnam
ent
Priz
e M
oney
$M
$20M
$40M
$60M
$80M
$100M
$120M
2015 2017
+70%
M
10M
20M
30M
40M
5/16 8/16 10/16 1/17 4/17 10/17
M
25M
50M
75M
100M
2011 2012 2014 2017
WW
Gam
ers
WW
Gam
ers
Source: NewZoo, esportsearnings.com, NewZoo discrete GPU share of eSports gamers

20182018
SOCIAL EXPANDS GAMING REACH
Source: NVIDIA
GAMES WANT TO SHARE
70% OF GAMERS PLAY GAMES TO BE SOCIAL
Source: Twitchtracker, Discord, Nielsen
0.0M
0.2M
0.4M
0.6M
0.8M
1.0M
Jan 16 Jan 18 CNN
Twitch Concurrent Viewers
GAMERS WANT TO CONNECT
0
20
40
60
80
100
2015 2016 2017
Discord App User Growth
“RISE OF PUBG AND FORTNITE IS GROWING THE GAMING COMMUNITY” - Goldman Sachs
GeForce Weekly Gamers
MOST VIEWED, MOST SHARED GO VIRAL
Total Gamers Playing + 20%
4/17 7/17 10/17 1/18
100M
80M
60M
40M
20M

20182018
GEFORCE EXPERIENCEGAMING PLATFORM
100M Clients WW
Over 1B In-Game Captures in 2017:
800M Game Videos
200M Game Highlights
100M Game Photographs
500M so far in 2018
NVIDIA HIGHLIGHTSNVIDIA ANSEL

2018
CINEMATICS KEEP PUSHING PLATFORM
RAYTRACING GAMES MORE DEMANDING
* Est ASP of Graphics Card (based on Actual GPU ASP)
GAMERS BUY UP
GPU
Per
f Re
quir
ed f
or H
igh
Sett
ings
Source: NVIDIA, Games @ 1080p, High Settings
ASP
$125
$150
$175
$200
$225
$250
$275
$300
FY15 FY16 FY17 FY18
GeForce ASP
$200*
Console ASP
$160*
NVIDIA GPU
NVIDIA® RTX™ Technology
Microsoft DXRNVIDIA GameWorks
Ray Tracing
New Class of Ray Traced Games
0X
1X
2X
3X
4X
5X
2013 2015 2017 2019 2021
RTX4KVR
Console Perf

20182018
Gaming is BIG and Growing
GeForce is Number One Game Platform
Gaming Growth Fueled by Esportsand Social
Cinematic Gaming Needs Bigger GPUs
An Exciting Future
G-SYNC
MAX-Q DESIGNGEFORCE GTX NVIDIA SHIELD
GEFORCE EXPERIENCE

2018
Colette Kress, March 27, 2018
FINANCIALS

2018
RECORDS
Gross Margin, Operating Income and EPS are Non-GAAP measures.
OPERATING INCOME
63%
$2.2B
$3.6B
FY 2017 FY 2018FY 2017 FY 2018
REVENUE
41%
$6.9B
$9.7B
EPS
FY 2017 FY 2018
61%
$3.06
$4.92
GROSS MARGIN
FY 2017 FY 2018
59.2%
60.2%100 BPS

2018
PRO VISUALIZATION3-YEAR CAGR 6%
$ M
illio
ns
$795 $750 $835
0
200
400
600
800
1,000
$934
12%
FY 2015 FY 2017 FY 2018FY 2016
DATACENTER3-YEAR CAGR ~85%
$ M
illio
ns
$317 $339$830
$1,932
0
500
1,000
1,500
2,000
133%
FY 2015 FY 2017 FY 2018FY 2016
AUTO3-YEAR CAGR 45%
$ M
illio
ns
$183 $320$487 $558
0
200
400
600 15%
FY 2015 FY 2017 FY 2018FY 2016
$ Bi
llion
s
FY 2015 FY 2017 FY 2018FY 2016
$2.1 $2.8$4.1
$5.5
0
2
4
636%
GAMING3-YEAR CAGR ~40%
MARKET PLATFORMS

2018
MARKET PLATFORMSDiversified and Growing
PRO VISUALIZATION EMERGING APPLICATIONS
15%
30%
0%
10%
20%
30%
40%
Q4 FY 2018Q4 FY 2017
GAMINGGFE USERS
90M100M
50
70
90
110
FY 2017 FY 2018
Mill
ions
AUTOMOTIVEDRIVE PARTNERS
FY 2017 FY 2018
225
320
100
150
200
250
300
350
DATACENTERHYPERSCALE “7” CUSTOMER REVENUE
$ M
illio
ns
FY 2017 FY 2018
+155%

2018
GROSS MARGIN EXPANSIONValue Added Platforms Expand Margins
Gross Margin excluding IP and Gross Margin are Non-GAAP measures.
52%
54%
56%
58%
60%
62%
64%
0
1
2
3
4
5
6
7
FY 2015 FY 2016 FY 2017 FY 2018
60.2%
59.2%
56.8%55.8%
GM% Value Added Platforms All OtherGM% Excl IP IP
Gro
ss P
rofi
t, $
Bill
ions

2018
GROSS MARGINS BY PLATFORMS
0% 100%
AutoOEM &
Embedded
GPU Gaming
Pro Vis
DataCenter
60.2%
Gross Margin is a Non-GAAP measure.
Company GM% Gross Profit
Gro
ss P
rofi
t, $
Bill
ions
FY 2018 Gross Margin %

2018
$1.7 $1.7
$1.9
$2.2
15%
25%
35%
45%
0.0
1.0
2.0
3.0
FY 2015 FY 2016 FY 2017 FY 2018
19%
OPERATING EXPENSES
Operating Expenses Operating Expenses as a % of Revenue
27%
35%34%
YoY Investments Focused on Gaming, AI, and Auto
Operating Expenses and Operating Expenses as a % of Revenue are Non-GAAP measures.
23%
$ Bi
llion
s

2018
INVESTMENT IN R&DCumulative $15B
0
2
4
6
8
10
12
14
16
0.0
0.2
0.4
0.6
0.8
1.0
1.2
1.4
1.6
1.8
2.0R&D Investment Cumulative R&D Investment
R&D,
$ B
illio
ns
Cum
ulat
ive
R&D,
$ B
illio
ns

2018
OUR LEVERAGED MODELENGINEERS
HardwareSoftware
BY PLATFORM
Gaming AI Auto
Software ~40%
GPU Architecture ~50%
FY 2018
FY 2018
FY 2013

2018
$1.0 $1.1
$2.2
$3.6
5%
15%
25%
35%
45%
0.0
1.0
2.0
3.0
4.0
FY 2015 FY 2016 FY 2017 FY 2018
OPERATING MARGIN EXPANSION
Operating Income Operating Margin
Operating Income and Operating Margin are Non-GAAP measures.
32%
37%
20%22%
$ Bi
llion
s

2018
CASH AND CASH FLOW
$1.7
$4.0
$6.8
$3.5
$5.1
$7.1
0
2
4
6
8
Cash Flow Net Cash Total Cash
Cash Flow Increased 109%; Net Cash Increased 28%
4.8%
Cash Flow = Cash Flow from Operations; Net Cash = Total Cash – Total Debt; FY 2017 Total Debt = $2.8B; FY 2018 Total Debt = $2.0B; Total Cash = Cash, Cash Equivalents + Marketable Securities
FY 2018 FY 2018 FY 2018FY 2017 FY 2017 FY 2017
10.4%
Cash as a % of Market Capitalization
$ Bi
llion
s

2018
CAPITAL RETURNSince FY 2013: $5B+, 70% FCF
Free Cash Flow is a Non-GAAP measure.
0
400
800
1,200
1,600
FY 2013 FY 2014 FY 2015 FY 2016 FY 2017 FY 2018 FY 2019
$1.25B
Intended Return
$1.0B
Share Repurchase Dividend
$1.0B$1.1B
$147M
$0.8B
$1.25B
$ M
illio
ns

2018OPEX is a Non-GAAP measure.
USES OF CASH
OPEXEngineersSalesInfrastructure
CAPEXDatacentersFacilitiesSoftware license
M&A and Investments
Capital ReturnDividendsShare Repurchases
FY 2018
$ Bi
llion
s
OPEX CAPITAL RETURN
CAPEX
$2.2
$0.6
0.0
0.5
1.0
1.5
2.0
2.5
$1.25
M&A

20182018
Q&A

2018
SILICON VALLEY | MARCH 26-29,2018www.gputechconf.com
#GTC18

2018
RECONCILIATION OF NON-GAAP TO GAAP FINANCIAL MEASURES

2018
RECONCILIATION OF NON-GAAP TO GAAP FINANCIAL MEASURES
GROSS MARGIN ($ IN MILLIONS &MARGIN PERCENTAGE)
NON-GAAP without IP IP NON-GAAP
STOCK-BASED COMPENSATION
(A)
PRODUCT WARRANTY
(B)
OTHER (C) GAAP
FY 2015$2,367 (244) $2,611 (12) — — $2,599
53.6% (2.2) 55.8% (0.3) — — 55.5%
FY 2016$2,602 (244) $2,846 (15) (20) — $2,811
54.8% (2.0) 56.8% (0.3) (0.4) — 56.1%
FY 2017$3,844 (244) $4,088 (15) — (10) $4,063
57.8% (1.4) 59.2% (0.2) — (0.2) 58.8%
FY 2018$5,821 (23) $5,844 (21) — (1) $5,822
60.2% — 60.2% (0.3) — — 59.9%
A. Stock-based compensation charge was allocated to cost of goods sold.B. Consists of warranty charge associated with a product recall.C. Consists of legal settlement and other related costs.

2018
RECONCILIATION OF NON-GAAP TO GAAP FINANCIAL MEASURES (CONTD.)
OPERATING EXPENSES ($ IN MILLIONS & % OF REVENUE)
NON-GAAPSTOCK-BASED
COMPENSATION (A)
ACQUISITION-RELATED ITEMS
(B)
OTHER (C) GAAP
FY 2015$1,657 146 37 — $1,840
35% 3 1 — 39%
FY 2016$1,721 190 22 131 $2,064
34% 4 — 3 41%
FY 2017$1,867 233 16 13 $2,129
27% 4 — — 31%
FY 2018$2,227 370 13 2 $2,612
23% 4 — — 27%
A. Stock-based compensation charge was allocated to research and development expense, and sales, general and administrative expense.B. Consists of amortization of acquisition-related intangible assets, transaction costs, compensation charges, and other credits related to acquisitions.C. Comprises of legal settlement costs, contributions, and restructuring and other charges.

2018
RECONCILIATION OF NON-GAAP TO GAAP FINANCIAL MEASURES (CONTD.)
OPERATING MARGIN ($ IN MILLIONS &MARGIN PERCENTAGE)
NON-GAAPSTOCK-BASED
COMPENSATION (A)
PRODUCT WARRANTY
(B)
ACQUISITION-RELATED ITEMS
(C)
OTHER (D) GAAP
FY 2015$954 (158) — (37) — $759
20% (3) — (1) — 16%
FY 2016$1,125 (205) (20) (22) (131) $747
22% (4) — — (3) 15%
FY 2017$2,221 (248) — (16) (23) $1,934
32% (4) — — — 28%
FY 2018$3,617 (391) — (13) (3) $3,210
37% (4) — — — 33%
A. Stock-based compensation charge was allocated to cost of goods sold, research and development expense, and sales, general and administrative expense.B. Consists of warranty charge associated with a product recall.C. Consists of amortization of acquisition-related intangible assets, transaction costs, compensation charges, and other credits related to acquisitions.D. Comprises of legal settlement costs, contributions, and restructuring and other charges.

2018
RECONCILIATION OF NON-GAAP TO GAAP FINANCIAL MEASURES (CONTD.)
A. Stock-based compensation charge was allocated to cost of goods sold, research and development expense, and sales, general and administrative expense.B. Consists of amortization of acquisition-related intangible assets, transaction costs, compensation charges, and other credits related to acquisitionsC. Other comprises of legal settlements, contributions, restructuring and other charges, gains from non-affiliated investments, interest expense related to amortization of debt discount and loss on early debt
conversions. Other also comprises anti-dilution impact from note hedge that is excluded from GAAP weighted average diluted share calculation.
($ IN MILLIONS, EXCEPT SHARES & EPS) NON-GAAP
STOCK-BASED COMPENSATION
(A)
ACQUISITION-RELATED ITEMS
(B)
OTHER (C)
TAX IMPACT OF ADJUSTMENTS
PROVISIONAL TAX BENEFIT
FROM INCOME TAX REFORM
GAAP
FY 2017
Net income $1,851 (248) (16) (65) 144 — $1,666Shares used in diluted per share calculation 605 — — 44 — — 649
Diluted EPS $3.06 — — — — — $2.57
FY 2018
Net income $3,085 (391) (13) (24) 257 133 $3,047
Shares used in diluted per share calculation 627 — — 5 — — 632
Diluted EPS $4.92 — — — — — $4.82

2018
($ IN MILLIONS) FY 2013 FY 2014 FY 2015 FY 2016 FY 2017 FY2018
GAAP net cash flow provided by operating activities
$824 $835 $905 $1,175 $1,672 $3,502
Purchase of property and equipment and intangible assets
(183) (255) (122) (86) (176) (593)
Free cash flow $641 $580 $783 $1,089 $1,496 $2,909
RECONCILIATION OF NON-GAAP TO GAAP FINANCIAL MEASURES (CONTD.)