Weekly Weather and Crop Bulletin Feb. 15-21, 2015
48
Volume 103, No. 29 http://www.usda.gov/oce/weather July 19, 2016 (Continued on page 5) Contents Crop Moisture Maps ................................................................. 2 July 12 Drought Monitor & Pan Evaporation Map ..................... 3 Extreme Maximum & Minimum Temperature Maps.................. 4 Temperature Departure Map .................................................... 5 Growing Degree Day Maps ...................................................... 6 National Weather Data for Selected Cities ............................... 8 National Agricultural Summary ............................................... 11 Crop Progress and Condition Tables...................................... 12 International Weather and Crop Summary ............................. 19 June International Temperature/Precipitation Maps ......... 33 Bulletin Information & U.S. Corn Condition Index, 2016 and Selected Years ..... 48 WEEKLY WEATHER AND CROP BULLETIN idwestern corn and soybeans experienced another mostly favorable week, with widespread rainfall and near-normal temperatures. However, pockets of drought persisted in the lower Great Lakes region, where only light rain fell, while locally excessive rainfall (4 inches or more) triggered flooding in the far upper Midwest. Showers also dotted the Plains and the South, although hot weather in the latter region increased moisture demands for pastures and crops. In fact, drought remained deeply entrenched across the southern Appalachians, M U.S. DEPARTMENT OF COMMERCE National Oceanic and Atmospheric Administration National Weather Service U.S. DEPARTMENT OF AGRICULTURE National Agricultural Statistics Service and World Agricultural Outlook Board HIGHLIGHTS July 10 – 16, 2016 Highlights provided by USDA/WAOB
Transcript of Weekly Weather and Crop Bulletin Feb. 15-21, 2015

Volume 103, No. 29 http://www.usda.gov/oce/weather July 19, 2016
(Continued on page 5)
Contents
Crop Moisture Maps ................................................................. 2 July 12 Drought Monitor & Pan Evaporation Map ..................... 3 Extreme Maximum & Minimum Temperature Maps .................. 4 Temperature Departure Map .................................................... 5 Growing Degree Day Maps ...................................................... 6 National Weather Data for Selected Cities ............................... 8 National Agricultural Summary ............................................... 11 Crop Progress and Condition Tables ...................................... 12 International Weather and Crop Summary ............................. 19 June International Temperature/Precipitation Maps ......... 33 Bulletin Information & U.S. Corn Condition Index, 2016 and Selected Years .....48
WEEKLY WEATHER AND CROP BULLETIN
idwestern corn and soybeans experienced another mostly favorable week, with widespread rainfall and
near-normal temperatures. However, pockets of drought persisted in the lower Great Lakes region, where only light rain fell, while locally excessive rainfall (4 inches or more) triggered flooding in the far upper Midwest. Showers also dotted the Plains and the South, although hot weather in the latter region increased moisture demands for pastures and crops. In fact, drought remained deeply entrenched across the southern Appalachians,
M
U.S. DEPARTMENT OF COMMERCE National Oceanic and Atmospheric Administration National Weather Service
U.S. DEPARTMENT OF AGRICULTURENational Agricultural Statistics Service and World Agricultural Outlook Board
HIGHLIGHTS July 10 – 16, 2016 Highlights provided by USDA/WAOB

2 Weekly Weather and Crop Bulletin July 19, 2016

July 19, 2016 Weekly Weather and Crop Bulletin 3
S
S
S
L
L
S
SSL
SLSL
S
S
SL
S
S
SS
S
SL
L
The Drought Monitor focuses on broad-scale conditions. Local conditions may vary. See accompanying text summary for forecast statements.
S Shttp://droughtmonitor.unl.edu/
U.S. Drought Monitor July 12, 2016
Valid 8 a.m. EDT
(Released Thursday, Jul. 14, 2016)
Intensity:D0 Abnormally DryD1 Moderate DroughtD2 Severe DroughtD3 Extreme DroughtD4 Exceptional Drought
Author: David Miskus
Drought Impact Types:
S = Short-Term, typically less than 6 months (e.g. agriculture, grasslands)
L = Long-Term, typically greater than 6 months (e.g. hydrology, ecology)
Delineates dominant impacts
NOAA/NWS/NCEP/CPC
0.07
0.49
0.31
0.33
0.04
0.75
0.33
0.84
0.28
0.41
0.34
0.26
0.30
0.38
0.21
0.34
0.28
0.090.69
0.38
0.18
0.49
0.41
0.21
0.440.26
0.45
0.44
0.44
0.47
0.22
0.24
0.44
0.46
0.47
0.32
0.50
0.23
0.27
0.580.42
0.26
0.53
0.62
0.25
0.19
0.56
0.160.29
0.48
0.17
0.57
0.50
0.33
0.32
0.51
0.490.51
0.44
0.440.86
0.37
0.31
0.220.27
0.15
0.16
0.65
0.47
0.25
0.27
0.37
0.23
0.27
0.18
0.36
0.31
0.39
0.40
0.25
0.17
0.60
0.23
0.23
0.49
0.650.20
0.26
0.29
0.49
0.36
0.38
0.32
0.22
0.29
0.27
0.56
0.71
0.31
0.19
0.28
0.57
0.80
0.32
0.23
0.33
0.40
0.27
0.47
0.51
0.55
0.31
0.49
0.62
0.32
0.25
0.31
0.19
0.33
0.44
0.52
0.22
0.61
0.46
0.26
0.34
0.51
0.36
0.27
Data obtained from the NWS Cooperative Observer Network.
USDA Agricultural Weather Assessments
Based on preliminary data
Average Pan Evaporation (inches/day)July 10 - 16, 2016

4 Weekly Weather and Crop Bulletin July 19, 2016

July 19, 2016 Weekly Weather and Crop Bulletin 5 (Continued from front cover) despite a few showers. Similarly, mostly dry weather persisted in the Northeast, resulting in further drought expansion. Meanwhile, record-setting heat gripped the southern High Plains and environs, depleting topsoil moisture and increasing stress on rangeland, pastures, and rain-fed summer crops. The consistently hot weather boosted temperatures at least 5 to 10°F above normal from southern Arizona to the southern High Plains. Late in the week, however, showers developed in a few areas, including Texas’ northern panhandle. Elsewhere, cool weather in the Northwest contrasted with hot, dry weather farther south. Weekly temperatures averaged at least 5°F below normal from interior sections of Washington and Oregon to Montana, with occasional showers accompanying the cool spell. Locally severe thunderstorms accompanied the unsettled weather across the central and eastern U.S. On July 10 in North Dakota, wind gusts of 70 to 80 mph were clocked in several communities, including Mott, Mandan, and Medina. Torrential rainfall developed from central Minnesota into northwestern Wisconsin; a few 8- to 10-inch totals were reported in a 48-hour period ending July 12. Unofficial totals reached 9.80 inches near Saxon, Iron County, WI, and 8.90 inches near Brainerd, Crow Wing County, MN. Resultant flooding led to record-high crests in Wisconsin gauge locations such as the White River near Ashland and the Bad River near Odanah. In Ashland, the high-water mark on July 12 exceeded the July 1953 record by nearly 8 inches. In Odanah, the river surged 5.08 feet above the June 1946 crest record. Farther south, thunderstorm wind gusts on July 14 were measured at 80 mph in Wichita, KS, and 68 mph in Little Rock, AR. For Wichita, it was the eighth-highest gust in the last 45 years. In Little Rock, a July wind-gust record was established (previously, 56 mph on July 27, 1960). It was also Little Rock’s highest gust since August 7, 2011. The stormy weather resulted in numerous daily-record rainfall totals, especially on July 11. On that date, record-setting amounts included 3.33 inches in Sisseton, SD, and 2.63 inches in St. Cloud, MN. During the second half of the week, daily-record totals reached 3.17 inches (on July 15) in Little Rock, AR; 1.70 inches (on July 14) in Huntsville, AL; and 1.53 inches (on July 15, accompanied by hail) in Amarillo, TX. A few heavy showers also occurred in the Northwest, where daily-record amounts totaled 1.43 inches (on July 11) in Lewistown, MT, and 1.32 inches (on July 10) in McCall, ID. Very cool weather trailed the Northwestern showers. Freezes (and daily-record lows) were noted in a few spots, including Ely, NV (31°F on July 11), and Big Piney, WY (29°F on July 12). Later, a push of cool air into the Great Lakes region led
to a daily-record low of 39°F (on July 16) in Marquette, MI. However, hot weather covered many other areas, particularly the southern High Plains. In northern Texas, Dalhart tied a monthly record with highs of 107°F on July 7, 10, and 11. Previously, Dalhart had reached 107°F on July 9, 2011. Elsewhere in Texas, Borger (110°F) and Amarillo (108°F) shattered monthly record highs on July 11. In New Mexico, all-time records were tied or broken on July 13 in locations such as San Jon (111°F; previously, 110°F on June 24, 1990) and Portales (109°F; previously, 109°F on June 25, 2011). Meanwhile, McAllen, TX, noted 20 consecutive triple-digit days (June 29 – July 18), including a daily-record high of 104°F on July 14. At times, record-setting heat also reached northward across the central High Plains or into the South and East. For example, daily-record highs surged to 100°F (on July 10) in Denver, CO, and 95°F (on July 13) in Cleveland, OH. On July 13, Columbia, SC, reached or exceeded the 100-degree mark for the tenth time in July and the fourteenth time this year; Columbia’s highs soared to 101°F each day from July 11-13. Record-setting warmth covered northern Alaska, pushing weekly temperatures as much as 10°F above normal. The remainder of the state also experienced warm weather (generally 5 to 10°F above normal), with widely scattered showers. Daily-record highs soared to 88°F in Fairbanks (on July 13) and Bettles (on July 14). In southwestern Alaska, St. Paul Island set an all-time record with a high of 68°F on July 11 (previously, 66°F on August 25, 1987). And near the Arctic Coast, all-time records were established in locations such as Kuparuk (86°F on July 14) and Deadhorse (85°F on July 13). Farther south, showers continued to fall across windward sections of Hawaii. On the Big Island, Hilo’s month-to-date rainfall through the 16th totaled 3.59 inches, with 1.11 inches occurring on July 15. Meanwhile, Kauai’s famously wet Mt. Waialeale netted 5.80 inches of rain in a 48-hour period from July 13-15.

6 Weekly Weather and Crop Bulletin July 19, 2016

July 19, 2016 Weekly Weather and Crop Bulletin 7

8 Weekly Weather and Crop Bulletin July 19, 2016
NUMBER OF DAYS
AV
ER
AG
E
MA
XIM
UM
AV
ER
AG
E
MIN
IMU
M
EX
TR
EM
E
HIG
H
EX
TR
EM
E
LOW
AV
ER
AG
E
DE
PA
RT
UR
E
F
RO
M N
OR
MA
L
WE
EK
LY
TO
TA
L, I
N.
DE
PA
RT
UR
E
F
RO
M N
OR
MA
L
GR
EA
TE
ST
IN
24
-HO
UR
, IN
.
TO
TA
L, I
N.,
SIN
CE
JU
N 1
PC
T.
NO
RM
AL
SIN
CE
JU
N 1
TO
TA
L, I
N.,
S
INC
E J
AN
1
PC
T.
NO
RM
AL
SIN
CE
JA
N 1
AV
ER
AG
E
MA
XIM
UM
AV
ER
AG
E
MIN
IMU
M
90 A
ND
AB
OV
E
32 A
ND
BE
LOW
.01
INC
H
O
R M
OR
E
.50
INC
H
O
R M
OR
E
AL BIRMINGHAM 92 71 94 70 82 2 1.41 0.21 0.95 7.92 124 29.53 93 95 49 6 0 5 1HUNTSVILLE 93 71 95 70 82 3 1.87 0.83 1.70 8.36 127 26.65 80 85 60 7 0 3 1MOBILE 90 73 93 71 81 0 1.86 0.37 0.90 9.70 118 37.86 101 93 77 4 0 7 2MONTGOMERY 94 72 96 71 83 1 1.90 0.63 1.50 6.45 92 28.82 89 89 49 7 0 3 1
AK ANCHORAGE 72 56 77 52 64 6 0.00 -0.33 0.00 2.36 135 4.52 90 80 63 0 0 0 0BARROW 60 40 66 34 50 9 0.10 -0.07 0.08 0.84 125 2.18 177 92 60 0 0 2 0FAIRBANKS 80 59 88 52 69 6 0.65 0.29 0.42 4.52 204 6.40 151 87 56 0 0 3 0JUNEAU 68 56 72 53 62 5 0.08 -0.81 0.03 4.07 77 26.86 111 86 72 0 0 3 0KODIAK 66 54 74 48 60 6 0.47 -0.48 0.42 4.56 59 47.33 123 87 71 0 0 4 0NOME 55 46 60 40 50 -3 0.02 -0.41 0.01 0.98 48 4.06 71 96 85 0 0 2 0
AZ FLAGSTAFF 85 48 88 41 67 1 0.00 -0.49 0.00 1.58 118 8.60 80 49 12 0 0 0 0PHOENIX 110 87 111 81 98 5 0.00 -0.20 0.00 0.01 2 1.89 54 23 16 7 0 0 0PRESCOTT 93 62 96 58 78 5 0.00 -0.59 0.00 0.59 40 4.37 53 38 11 7 0 0 0TUCSON 106 81 106 79 94 7 0.00 -0.42 0.00 2.42 240 4.95 118 38 23 7 0 0 0
AR FORT SMITH 92 72 94 68 82 0 0.41 -0.34 0.30 5.23 86 22.44 93 86 51 6 0 4 0LITTLE ROCK 94 73 96 70 83 1 4.77 4.00 3.17 7.81 135 37.00 132 87 51 7 0 3 3
CA BAKERSFIELD 97 69 105 64 83 0 0.00 0.00 0.00 0.00 0 4.10 89 39 21 6 0 0 0FRESNO 97 66 104 61 82 1 0.00 0.00 0.00 0.06 26 9.08 116 52 28 6 0 0 0LOS ANGELES 75 65 77 63 70 1 0.00 0.00 0.00 0.00 0 6.00 64 87 67 0 0 0 0REDDING 97 65 105 57 81 0 0.00 0.00 0.00 2.46 357 30.63 140 51 27 6 0 0 0SACRAMENTO 93 58 100 55 76 1 0.00 0.00 0.00 0.00 0 12.75 107 76 19 5 0 0 0SAN DIEGO 75 65 77 64 70 -1 0.00 0.00 0.00 0.00 0 5.01 66 83 70 0 0 0 0SAN FRANCISCO 72 55 77 54 63 0 0.00 0.00 0.00 0.00 0 12.44 93 85 65 0 0 0 0STOCKTON 95 59 103 56 77 0 0.00 0.00 0.00 0.00 0 12.12 135 70 36 6 0 0 0
CO ALAMOSA 87 44 89 37 65 1 0.00 -0.19 0.00 0.80 82 5.17 165 68 29 0 0 0 0CO SPRINGS 90 59 96 55 75 5 0.26 -0.31 0.26 2.34 66 10.27 111 69 17 5 0 1 0DENVER INTL 92 58 102 51 75 3 0.02 -0.46 0.02 2.40 90 10.22 131 66 17 4 0 1 0GRAND JUNCTION 96 59 101 48 78 1 0.00 -0.12 0.00 0.38 59 5.35 117 28 12 6 0 0 0PUEBLO 98 61 105 56 80 5 0.01 -0.40 0.01 1.24 57 8.42 130 67 30 7 0 1 0
CT BRIDGEPORT 84 70 93 64 77 3 0.44 -0.39 0.35 4.31 79 19.85 82 83 59 1 0 2 0HARTFORD 88 64 94 56 76 2 0.22 -0.58 0.19 3.13 55 17.07 69 85 57 3 0 2 0
DC WASHINGTON 91 74 98 70 82 3 0.43 -0.39 0.43 5.30 108 20.64 98 77 45 4 0 1 0DE WILMINGTON 87 70 93 62 79 2 0.40 -0.59 0.27 5.63 97 23.49 100 88 51 3 0 3 0FL DAYTONA BEACH 94 74 95 73 84 2 0.00 -1.17 0.00 4.20 50 24.20 101 96 54 7 0 0 0
JACKSONVILLE 96 72 99 70 84 2 0.53 -0.83 0.49 4.70 55 19.16 74 99 49 7 0 2 0KEY WEST 91 81 93 76 86 1 0.28 -0.39 0.19 1.72 28 13.37 77 83 67 6 0 3 0MIAMI 92 78 93 75 85 1 1.03 -0.21 0.60 11.01 94 31.40 116 85 61 7 0 4 1ORLANDO 95 76 96 73 86 4 0.24 -1.44 0.08 8.79 78 28.88 112 86 53 7 0 4 0PENSACOLA 88 76 89 73 82 -1 1.10 -0.74 0.63 9.30 88 33.56 95 92 66 0 0 2 1TALLAHASSEE 95 73 97 72 84 2 2.24 0.42 0.87 14.65 133 38.04 106 90 67 7 0 4 2TAMPA 93 77 94 73 85 2 0.95 -0.48 0.52 12.73 145 28.63 135 85 57 7 0 4 1WEST PALM BEACH 93 80 95 78 87 4 0.37 -1.02 0.16 4.93 45 26.30 88 79 58 7 0 3 0
GA ATHENS 96 71 99 68 83 3 0.02 -0.97 0.02 4.26 69 19.43 71 88 62 7 0 1 0ATLANTA 92 72 94 70 82 2 0.03 -1.17 0.03 4.87 78 24.01 83 83 62 6 0 1 0AUGUSTA 97 71 101 69 84 3 0.87 -0.01 0.54 3.89 62 22.62 89 87 53 7 0 2 1COLUMBUS 94 71 95 69 83 1 0.46 -0.70 0.26 3.01 50 22.45 79 94 41 7 0 6 0MACON 97 71 99 69 84 3 0.39 -0.60 0.39 2.47 43 20.43 78 90 36 7 0 1 0SAVANNAH 98 75 99 74 86 4 0.02 -1.28 0.02 7.04 83 29.71 115 78 52 7 0 1 0
HI HILO 86 70 87 68 78 2 2.23 -0.23 1.05 14.81 116 39.75 60 88 75 0 0 4 2HONOLULU 89 75 91 74 82 1 0.17 0.08 0.10 0.42 68 4.47 47 79 66 1 0 4 0KAHULUI 88 71 89 65 80 1 0.15 0.06 0.05 1.02 249 8.75 78 82 72 0 0 6 0LIHUE 82 72 84 70 77 -2 0.49 0.03 0.28 1.92 68 8.35 41 90 84 0 0 5 0
ID BOISE 83 54 92 47 69 -5 0.28 0.20 0.28 0.46 48 4.98 67 62 37 2 0 1 0LEWISTON 80 56 91 51 68 -5 0.32 0.17 0.29 2.56 167 9.37 123 72 45 1 0 2 0POCATELLO 82 47 94 39 64 -5 0.14 0.00 0.14 0.19 16 7.00 94 68 35 1 0 1 0
IL CHICAGO/O'HARE 83 65 90 57 74 1 0.20 -0.54 0.14 4.97 93 18.60 101 85 57 1 0 2 0MOLINE 84 66 90 58 75 0 1.81 0.93 1.42 8.67 129 18.67 90 87 68 1 0 3 1PEORIA 85 68 90 63 77 2 1.70 0.77 1.70 6.75 113 15.86 81 88 58 1 0 1 1ROCKFORD 84 63 92 55 74 1 0.17 -0.75 0.13 3.75 53 15.81 80 91 65 1 0 2 0SPRINGFIELD 88 69 91 64 78 2 1.55 0.77 0.98 5.32 96 18.91 97 93 55 3 0 2 2
IN EVANSVILLE 88 69 91 66 79 0 1.14 0.28 0.81 10.36 170 32.11 124 91 68 2 0 3 1FORT WAYNE 86 63 92 57 75 1 0.12 -0.68 0.07 5.65 95 19.84 99 89 48 2 0 2 0INDIANAPOLIS 86 66 90 60 76 1 1.23 0.24 0.77 7.14 112 24.64 109 89 55 1 0 3 1SOUTH BEND 84 62 92 55 73 0 0.34 -0.50 0.34 4.06 65 19.17 94 91 63 1 0 1 0
IA BURLINGTON 83 66 90 62 75 -1 1.83 0.81 0.80 5.42 79 16.27 79 98 65 1 0 3 2CEDAR RAPIDS 81 63 88 55 72 -3 1.15 0.24 0.64 9.92 150 20.44 113 100 67 0 0 3 2DES MOINES 86 67 94 60 77 1 1.70 0.79 0.72 4.38 65 15.62 82 86 65 1 0 3 2DUBUQUE 80 62 88 52 71 -1 0.29 -0.51 0.25 9.55 161 20.50 109 94 78 0 0 3 0SIOUX CITY 86 62 91 54 74 -1 0.02 -0.72 0.02 2.62 49 18.35 122 90 63 1 0 1 0WATERLOO 81 62 89 53 72 -2 1.53 0.59 0.90 10.82 153 21.25 115 91 70 0 0 3 1
KS CONCORDIA 89 68 96 64 79 0 1.16 0.20 0.61 4.24 70 17.11 104 90 66 4 0 5 1DODGE CITY 91 66 96 58 79 -1 0.89 0.19 0.49 7.53 159 18.65 142 87 47 4 0 2 0GOODLAND 92 61 101 56 76 1 0.33 -0.47 0.24 2.58 51 9.94 82 85 55 5 0 2 0TOPEKA 88 69 93 64 79 1 1.55 0.69 1.08 6.89 99 26.20 133 91 66 2 0 2 1
Based on 1971-2000 normals *** Not Available
TEMP. ˚F
National Weather Data for Selected CitiesWeather Data for the Week Ending July 16, 2016
Data Provided by Climate Prediction Center
PRECIPSTATES
AND STATIONS
RELATIVE HUMIDITY PERCENT
TEMPERATURE ˚F PRECIPITATION

July 19, 2016 Weekly Weather and Crop Bulletin 9
NUMBER OF DAYS
AV
ER
AG
E
MA
XIM
UM
AV
ER
AG
E
MIN
IMU
M
EX
TR
EM
E
HIG
H
EX
TR
EM
E
LOW
AV
ER
AG
E
DE
PA
RT
UR
E
F
RO
M N
OR
MA
L
WE
EK
LY
TO
TA
L, I
N.
DE
PA
RT
UR
E
F
RO
M N
OR
MA
L
GR
EA
TE
ST
IN
24
-HO
UR
, IN
.
TO
TA
L, I
N.,
SIN
CE
JU
N 1
PC
T.
NO
RM
AL
SIN
CE
JU
N 1
TO
TA
L, I
N.,
S
INC
E J
AN
01
PC
T.
NO
RM
AL
SIN
CE
JA
N01
AV
ER
AG
E
MA
XIM
UM
AV
ER
AG
E
MIN
IMU
M
90 A
ND
AB
OV
E
32 A
ND
BE
LOW
.01
INC
H
O
R M
OR
E
.50
INC
H
O
R M
OR
E
WICHITA 92 72 101 67 82 1 0.63 -0.13 0.50 11.23 186 26.79 154 86 65 6 0 3 1
KY JACKSON 86 68 89 64 77 2 0.17 -0.88 0.14 9.26 131 32.06 116 93 58 0 0 2 0LEXINGTON 87 68 90 64 78 2 0.98 -0.12 0.61 7.49 106 26.42 100 88 62 1 0 4 1LOUISVILLE 89 72 93 68 80 2 0.82 -0.16 0.60 6.83 115 25.89 101 83 51 3 0 3 1PADUCAH 91 72 93 68 81 3 0.45 -0.62 0.23 7.73 110 31.93 112 92 53 6 0 2 0
LA BATON ROUGE 93 73 96 72 83 1 2.75 1.40 0.87 10.63 127 40.83 115 93 54 6 0 6 1LAKE CHARLES 92 77 93 74 85 2 0.98 -0.22 0.97 10.37 117 40.69 132 93 61 7 0 2 1NEW ORLEANS 93 77 96 75 85 2 2.10 0.66 0.95 12.68 123 42.00 115 88 70 6 0 5 2SHREVEPORT 95 74 98 71 85 2 1.93 0.99 1.93 6.37 87 40.60 135 87 47 7 0 1 1
ME CARIBOU 80 57 88 50 68 2 1.45 0.61 0.90 7.52 145 23.44 125 91 51 0 0 3 2PORTLAND 81 62 91 56 72 3 0.65 -0.09 0.43 5.51 111 21.02 86 91 51 1 0 2 0
MD BALTIMORE 89 69 96 63 79 2 0.79 -0.07 0.47 6.22 116 24.06 106 83 57 3 0 2 0MA BOSTON 85 66 96 59 76 2 0.03 -0.64 0.03 1.98 41 18.32 81 83 51 3 0 1 0
WORCESTER 80 63 88 56 72 2 0.65 -0.29 0.60 2.83 46 18.54 72 92 51 0 0 2 1MI ALPENA 82 59 94 47 70 3 0.09 -0.59 0.05 2.96 74 17.74 125 90 44 2 0 3 0
GRAND RAPIDS 84 65 91 58 74 3 0.31 -0.51 0.26 2.20 39 19.21 103 85 52 3 0 2 0HOUGHTON LAKE 80 58 88 42 69 2 0.26 -0.32 0.23 5.20 122 19.27 137 90 61 0 0 3 0LANSING 84 63 92 56 74 4 0.48 -0.12 0.27 2.51 49 15.42 95 82 59 1 0 2 0MUSKEGON 82 62 89 53 72 2 0.73 0.26 0.73 3.19 87 17.13 109 87 60 0 0 1 1TRAVERSE CITY 83 61 94 48 72 2 0.47 -0.24 0.23 3.17 63 14.76 88 88 44 2 0 4 0
MN DULUTH 73 57 81 49 65 0 2.61 1.65 2.27 7.91 122 18.02 119 97 72 0 0 6 1INT'L FALLS 74 56 79 43 65 -1 0.82 0.04 0.30 8.67 148 16.45 134 93 62 0 0 4 0MINNEAPOLIS 82 66 90 61 74 1 0.85 -0.04 0.40 6.63 103 15.55 99 84 55 1 0 5 0ROCHESTER 79 62 86 55 71 1 1.13 0.10 0.55 7.77 123 19.46 118 95 69 0 0 7 1ST. CLOUD 77 61 82 52 69 -1 4.00 3.27 2.63 7.88 124 14.25 100 98 57 0 0 5 2
MS JACKSON 94 72 96 71 83 2 1.57 0.50 1.46 6.12 98 38.56 117 92 50 7 0 2 1MERIDIAN 96 73 99 72 84 2 1.00 -0.30 0.67 6.09 89 31.08 87 89 62 7 0 3 1TUPELO 92 71 95 69 81 0 0.69 -0.17 0.41 7.27 106 29.37 87 89 64 5 0 3 0
MO COLUMBIA 88 69 90 67 79 2 1.54 0.69 0.93 9.57 160 19.71 89 94 64 2 0 3 1KANSAS CITY 87 68 91 64 78 0 1.63 0.59 1.09 8.67 128 29.20 143 88 61 2 0 2 2SAINT LOUIS 91 73 95 70 82 2 1.73 0.82 1.15 5.58 96 18.62 86 79 57 4 0 3 2SPRINGFIELD 88 69 90 63 78 0 0.55 -0.31 0.43 7.66 107 18.91 78 86 66 2 0 2 0
MT BILLINGS 80 54 88 52 67 -4 0.14 -0.16 0.09 0.39 15 5.79 62 74 29 0 0 3 0BUTTE 69 41 80 34 55 -7 0.79 0.47 0.68 1.85 65 5.38 70 84 33 0 0 2 1CUT BANK 72 47 81 42 59 -4 0.61 0.27 0.26 1.90 57 6.38 83 95 40 0 0 6 0GLASGOW 74 55 78 53 64 -6 1.17 0.76 0.50 5.41 170 13.69 203 93 70 0 0 6 1GREAT FALLS 75 48 82 44 62 -4 0.78 0.48 0.75 1.87 63 7.89 87 87 31 0 0 2 1HAVRE 75 53 80 49 64 -4 1.43 1.09 0.79 3.52 130 11.41 164 94 69 0 0 6 2MISSOULA 74 46 84 40 60 -6 1.72 1.49 0.70 2.81 122 7.94 98 91 60 0 0 3 2
NE GRAND ISLAND 87 64 95 59 76 0 0.98 0.29 0.97 2.25 42 16.93 111 88 59 3 0 2 1LINCOLN 88 66 94 59 77 -1 0.89 0.10 0.73 4.76 90 17.07 107 91 72 3 0 2 1NORFOLK 85 62 92 53 74 -1 0.83 -0.04 0.83 5.86 93 22.31 139 87 70 2 0 1 1NORTH PLATTE 87 58 96 53 72 -2 0.71 -0.01 0.69 4.39 91 15.57 127 88 41 1 0 2 1OMAHA 88 66 94 58 77 0 1.94 1.06 1.59 4.89 82 17.88 105 86 70 3 0 3 1SCOTTSBLUFF 90 58 103 46 74 1 0.15 -0.36 0.15 1.55 40 10.66 100 73 44 4 0 1 0VALENTINE 87 58 95 49 73 0 0.59 -0.18 0.59 5.52 116 19.44 165 74 57 2 0 1 1
NV ELY 88 42 93 31 65 -2 0.00 -0.11 0.00 1.61 185 8.41 150 34 14 4 1 0 0LAS VEGAS 105 81 110 76 93 2 0.00 -0.08 0.00 0.66 314 3.51 142 14 11 7 0 0 0RENO 90 57 96 50 74 3 0.00 -0.05 0.00 0.00 0 5.21 115 36 17 4 0 0 0WINNEMUCCA 88 44 97 35 66 -6 0.00 -0.06 0.00 0.01 1 4.58 91 45 20 4 0 0 0
NH CONCORD 85 61 93 54 73 3 0.20 -0.54 0.20 2.76 58 15.49 79 91 47 2 0 1 0NJ NEWARK 88 71 94 65 80 3 0.69 -0.38 0.57 4.47 78 19.68 78 78 55 3 0 2 1NM ALBUQUERQUE 98 67 100 62 83 4 0.00 -0.24 0.00 0.20 18 1.39 37 31 10 7 0 0 0NY ALBANY 85 64 91 54 75 4 0.46 -0.31 0.25 5.38 97 16.13 80 90 53 2 0 3 0
BINGHAMTON 81 61 87 53 71 2 0.26 -0.54 0.12 3.57 63 16.36 79 89 61 0 0 4 0BUFFALO 83 66 90 61 75 4 0.00 -0.69 0.00 2.06 38 13.30 65 80 49 1 0 0 0ROCHESTER 86 64 94 58 75 4 0.12 -0.53 0.12 1.73 35 13.34 77 81 51 2 0 1 0SYRACUSE 84 62 94 55 73 2 0.37 -0.57 0.19 3.26 55 18.02 88 92 51 2 0 4 0
NC ASHEVILLE 85 65 88 64 75 2 1.41 0.56 0.49 5.96 94 20.84 78 93 68 0 0 7 0CHARLOTTE 93 70 97 69 82 2 0.70 -0.14 0.40 3.99 75 19.28 81 88 45 6 0 2 0GREENSBORO 91 71 94 69 81 3 0.12 -0.90 0.10 6.09 105 25.06 106 90 49 5 0 2 0HATTERAS 88 76 91 74 82 3 0.32 -0.71 0.30 11.54 192 45.60 163 95 68 1 0 2 0RALEIGH 91 71 95 69 81 2 3.93 2.95 1.98 13.84 248 33.44 141 91 64 5 0 3 2WILMINGTON 92 75 97 73 83 2 1.56 -0.17 1.14 9.13 100 31.81 110 94 55 5 0 5 1
ND BISMARCK 80 59 87 51 69 -1 1.87 1.29 1.22 7.76 197 14.94 158 87 59 0 0 3 2DICKINSON 78 52 87 44 65 -4 2.03 1.52 1.63 5.16 111 9.89 97 94 39 0 0 3 1FARGO 77 60 84 52 68 -2 2.36 1.71 2.11 6.87 135 12.34 107 90 62 0 0 4 1GRAND FORKS 77 58 85 53 68 -1 1.79 1.10 1.28 6.61 143 13.50 132 94 57 0 0 5 1JAMESTOWN 77 58 83 52 67 -3 1.92 1.18 0.98 6.32 133 12.23 118 93 60 0 0 3 2WILLISTON 78 58 84 48 68 -1 0.94 0.40 0.34 4.63 129 9.70 118 89 64 0 0 5 0
OH AKRON-CANTON 87 65 91 59 76 4 0.53 -0.38 0.31 4.57 82 19.24 92 83 52 2 0 2 0CINCINNATI 87 66 90 62 76 0 0.54 -0.29 0.25 4.79 75 24.40 100 93 68 1 0 4 0CLEVELAND 87 68 95 63 78 6 0.28 -0.52 0.16 3.32 57 19.25 94 78 43 2 0 2 0COLUMBUS 87 66 92 61 77 2 0.35 -0.70 0.20 6.15 95 20.88 98 87 61 1 0 2 0DAYTON 85 65 91 59 75 1 0.59 -0.25 0.42 5.23 84 21.44 95 93 51 1 0 2 0MANSFIELD 86 64 91 60 75 4 0.41 -0.52 0.38 2.82 42 19.22 82 93 45 2 0 2 0
Based on 1971-2000 normals *** Not Available
TEMP. ˚F PRECIPSTATES
AND STATIONS
RELATIVE HUMIDITY PERCENT
Weather Data for the Week Ending July 16, 2016
TEMPERATURE ˚F PRECIPITATION

10 Weekly Weather and Crop Bulletin July 19, 2016
NUMBER OF DAYS
AV
ER
AG
E
MA
XIM
UM
AV
ER
AG
E
MIN
IMU
M
EX
TR
EM
E
HIG
H
EX
TR
EM
E
LOW
AV
ER
AG
E
DE
PA
RT
UR
E
F
RO
M N
OR
MA
L
WE
EK
LY
TO
TA
L, I
N.
DE
PA
RT
UR
E
F
RO
M N
OR
MA
L
GR
EA
TE
ST
IN
24
-HO
UR
, IN
.
TO
TA
L, I
N.,
SIN
CE
JU
N 1
PC
T.
NO
RM
AL
SIN
CE
JU
N 1
TO
TA
L, I
N.,
S
INC
E J
AN
01
PC
T.
NO
RM
AL
SIN
CE
JA
N01
AV
ER
AG
E
MA
XIM
UM
AV
ER
AG
E
MIN
IMU
M
90 A
ND
AB
OV
E
32 A
ND
BE
LOW
.01
INC
H
O
R M
OR
E
.50
INC
H
O
R M
OR
E
TOLEDO 86 64 92 59 75 2 0.48 -0.14 0.48 3.06 57 16.82 93 86 57 2 0 1 0YOUNGSTOWN 85 62 90 56 74 4 0.29 -0.67 0.23 4.78 78 19.88 98 88 54 2 0 2 0
OK OKLAHOMA CITY 92 73 96 68 82 0 1.14 0.45 1.14 4.74 75 17.15 84 83 53 5 0 1 1TULSA 93 74 97 67 84 1 1.29 0.60 1.12 2.77 43 16.62 70 86 59 6 0 2 1
OR ASTORIA 69 56 71 52 63 3 0.54 0.26 0.46 3.10 92 40.33 111 89 75 0 0 2 0BURNS 76 41 90 32 59 -6 0.10 0.02 0.10 0.54 64 4.39 70 69 43 1 1 1 0EUGENE 78 52 86 48 65 -1 0.11 -0.04 0.11 1.03 53 20.96 75 85 64 0 0 1 0MEDFORD 85 56 94 52 71 -1 0.05 -0.01 0.05 1.02 123 10.00 102 73 29 2 0 1 0PENDLETON 81 54 89 52 68 -4 0.07 -0.01 0.07 1.73 177 7.32 101 67 42 0 0 1 0PORTLAND 76 58 81 54 67 -1 0.03 -0.13 0.02 1.78 88 21.52 108 77 61 0 0 2 0SALEM 77 56 84 52 67 0 0.18 0.05 0.18 1.45 79 21.74 100 78 59 0 0 1 0
PA ALLENTOWN 88 65 94 58 77 4 0.02 -0.94 0.02 2.71 44 19.44 81 80 49 3 0 1 0ERIE 82 68 90 61 75 3 0.15 -0.58 0.12 4.35 71 18.12 87 72 59 1 0 3 0MIDDLETOWN 89 71 94 63 80 4 0.10 -0.72 0.10 7.85 137 25.04 112 80 43 2 0 1 0PHILADELPHIA 89 71 96 65 80 3 0.25 -0.75 0.12 2.50 46 20.50 89 81 55 3 0 3 0PITTSBURGH 87 66 94 60 76 3 0.41 -0.51 0.40 4.02 64 17.64 83 84 40 1 0 2 0WILKES-BARRE 87 64 91 54 76 4 0.29 -0.59 0.25 2.40 40 15.22 75 89 44 3 0 3 0WILLIAMSPORT 89 65 93 56 77 5 0.57 -0.40 0.42 5.29 78 17.23 76 78 43 3 0 3 0
RI PROVIDENCE 84 65 93 58 75 2 0.85 0.16 0.53 2.72 55 20.86 83 88 63 1 0 3 1SC BEAUFORT 98 77 99 75 87 5 0.08 -1.14 0.07 5.18 60 23.57 92 84 44 7 0 2 0
CHARLESTON 97 77 100 75 87 5 0.44 -0.93 0.27 3.86 42 24.61 92 86 47 7 0 2 0COLUMBIA 99 74 101 73 87 5 1.27 0.03 0.59 3.92 50 17.84 66 83 48 7 0 5 2GREENVILLE 94 70 98 68 82 3 1.02 -0.02 0.73 2.48 40 20.01 71 90 42 6 0 4 1
SD ABERDEEN 81 55 86 49 68 -4 2.26 1.59 1.19 4.11 81 11.05 93 88 59 0 0 3 2HURON 85 58 88 53 72 -1 0.01 -0.65 0.01 2.41 50 11.22 87 85 42 0 0 1 0RAPID CITY 85 54 93 51 70 -1 0.29 -0.16 0.22 1.72 44 6.36 60 74 34 1 0 3 0SIOUX FALLS 84 60 91 51 72 -1 0.17 -0.48 0.16 2.54 50 14.03 101 94 62 1 0 2 0
TN BRISTOL 88 65 91 61 76 2 0.12 -0.87 0.07 2.86 47 19.77 81 96 46 2 0 2 0CHATTANOOGA 94 72 96 71 83 3 0.02 -1.11 0.02 2.36 36 19.60 62 84 58 7 0 1 0KNOXVILLE 89 70 93 69 80 2 0.08 -1.03 0.07 7.91 121 27.18 94 90 50 2 0 2 0MEMPHIS 92 74 95 72 83 0 0.36 -0.64 0.36 3.93 59 39.02 123 86 52 6 0 1 0NASHVILLE 91 72 95 70 81 2 0.26 -0.61 0.19 9.41 155 23.85 86 85 50 5 0 2 0
TX ABILENE 99 75 102 68 87 4 0.00 -0.34 0.00 3.53 89 21.33 178 80 46 7 0 0 0AMARILLO 101 70 108 62 85 7 1.54 0.96 1.54 2.93 63 8.82 82 71 24 7 0 1 1AUSTIN 99 77 100 74 88 4 0.04 -0.37 0.04 2.67 55 30.96 168 88 58 7 0 1 0BEAUMONT 95 77 96 75 86 3 0.19 -1.04 0.15 10.13 106 39.63 124 95 53 7 0 3 0BROWNSVILLE 96 79 97 78 88 4 0.00 -0.41 0.00 2.98 74 12.97 109 94 60 7 0 0 0CORPUS CHRISTI 94 80 95 77 87 3 0.00 -0.41 0.00 2.95 64 21.17 138 93 63 7 0 0 0DEL RIO 103 78 105 76 91 6 0.00 -0.46 0.00 2.93 85 11.54 116 74 45 7 0 0 0EL PASO 105 77 108 71 91 7 0.05 -0.26 0.05 0.38 25 1.02 31 34 12 7 0 1 0FORT WORTH 96 76 99 71 86 1 0.43 -0.01 0.43 6.80 160 23.56 118 78 45 7 0 1 0GALVESTON 91 82 92 79 87 3 0.00 -0.79 0.00 7.94 134 28.47 132 89 66 7 0 0 0HOUSTON 97 79 99 77 88 4 0.00 -0.71 0.00 13.40 187 42.35 163 87 57 7 0 0 0LUBBOCK 103 73 108 67 88 8 0.31 -0.17 0.28 1.62 39 6.89 71 65 37 7 0 3 0MIDLAND 104 76 108 72 90 8 0.01 -0.40 0.01 3.19 120 6.93 103 58 34 7 0 1 0SAN ANGELO 101 76 103 72 88 6 0.00 -0.22 0.00 7.02 225 22.65 210 77 42 7 0 0 0SAN ANTONIO 99 78 100 76 88 4 0.00 -0.44 0.00 2.39 44 24.21 134 85 38 7 0 0 0VICTORIA 96 77 98 73 86 2 0.02 -0.66 0.02 3.20 48 23.42 109 93 61 7 0 1 0WACO 98 77 99 73 88 3 0.00 -0.50 0.00 4.59 107 27.24 147 81 53 7 0 0 0WICHITA FALLS 97 73 101 67 85 0 1.15 0.82 1.11 5.01 108 21.50 133 82 59 7 0 3 1
UT SALT LAKE CITY 90 62 98 51 76 -1 0.00 -0.15 0.00 0.52 49 8.17 83 41 13 4 0 0 0VT BURLINGTON 83 64 91 57 73 2 0.92 0.04 0.39 4.86 90 15.71 88 84 49 1 0 3 0VA LYNCHBURG 87 66 92 62 77 2 0.33 -0.69 0.25 7.26 119 26.91 112 96 61 1 0 3 0
NORFOLK 90 75 97 73 83 4 0.20 -0.95 0.16 7.80 124 30.03 121 86 55 3 0 2 0RICHMOND 90 70 96 67 80 2 0.38 -0.67 0.38 9.30 160 29.93 127 87 63 3 0 1 0ROANOKE 88 68 91 63 78 2 0.21 -0.70 0.21 8.27 145 26.00 110 85 59 2 0 1 0WASH/DULLES 90 68 95 62 79 3 0.16 -0.64 0.16 7.45 126 25.11 110 82 57 4 0 1 0
WA OLYMPIA 73 51 77 46 62 0 0.00 -0.19 0.00 1.68 72 27.06 100 90 63 0 0 0 0QUILLAYUTE 65 53 68 49 59 1 0.07 -0.44 0.06 5.63 119 57.46 105 96 86 0 0 2 0SEATTLE-TACOMA 74 57 76 56 66 1 0.00 -0.18 0.00 2.16 110 23.23 120 85 68 0 0 0 0SPOKANE 76 54 85 51 65 -3 0.02 -0.15 0.02 0.71 45 8.57 92 67 33 0 0 1 0YAKIMA 86 54 92 49 70 1 0.00 -0.04 0.00 0.39 53 5.84 131 57 33 1 0 0 0
WV BECKLEY 81 63 83 58 72 1 1.13 0.03 0.82 12.70 200 31.73 132 92 67 0 0 4 1CHARLESTON 87 66 90 61 76 2 0.55 -0.55 0.35 7.27 111 27.17 111 96 53 1 0 4 0ELKINS 84 61 87 56 72 2 1.28 0.18 0.90 8.10 114 26.52 102 93 49 0 0 3 1HUNTINGTON 87 67 91 63 77 2 0.85 -0.14 0.40 10.68 176 30.39 127 92 57 2 0 4 0
WI EAU CLAIRE 81 62 89 52 72 1 0.37 -0.49 0.24 8.57 136 20.98 126 93 54 0 0 4 0GREEN BAY 80 60 88 50 70 0 0.97 0.21 0.39 5.67 109 16.85 114 97 67 0 0 5 0LA CROSSE 84 66 93 60 75 1 0.18 -0.78 0.10 8.67 139 21.27 124 88 48 1 0 3 0MADISON 82 63 90 51 73 1 0.03 -0.84 0.01 6.00 99 19.93 114 85 60 1 0 3 0MILWAUKEE 83 66 90 57 74 2 0.02 -0.77 0.02 3.64 67 15.45 84 82 62 2 0 1 0
WY CASPER 87 47 95 43 67 -3 0.00 -0.30 0.00 1.17 56 10.63 131 73 30 2 0 0 0CHEYENNE 85 54 95 45 69 2 0.00 -0.50 0.00 2.62 81 12.48 135 64 32 2 0 0 0LANDER 86 52 91 46 69 -1 0.00 -0.19 0.00 0.57 36 16.72 200 53 12 3 0 0 0SHERIDAN 83 50 90 40 66 -2 0.16 -0.10 0.16 0.56 21 9.91 107 78 40 1 0 1 0
Based on 1971-2000 normals *** Not Available
Weather Data for the Week Ending July 16, 2016
STATES AND
STATIONS
TEMP. ˚F PRECIP
RELATIVE HUMIDITY PERCENT
TEMPERATURE ˚F PRECIPITATION

July 19, 2016 Weekly Weather and Crop Bulletin 11
National Agricultural Summary July 11 – 17, 2016
Weekly National Agricultural Summary provided by USDA/NASS
HIGHLIGHTS
Cool weather dominated from the Northwest to the northern Plains. Temperatures averaged more than 6°F below normal in much of Idaho and Montana. Above-average temperatures were noted across most of the South and east of the Mississippi River. Temperatures averaged more than 9°F above normal in parts of New Mexico
and Texas. Rain in the upper Midwest boosted soil moisture and aided developing row crops. Parts of Minnesota and Wisconsin received more than 6 inches of rain. Precipitation across the rest of the nation was generally within 1.5 inches of normal, with scattered storms in the Mississippi Valley and southern Atlantic States.
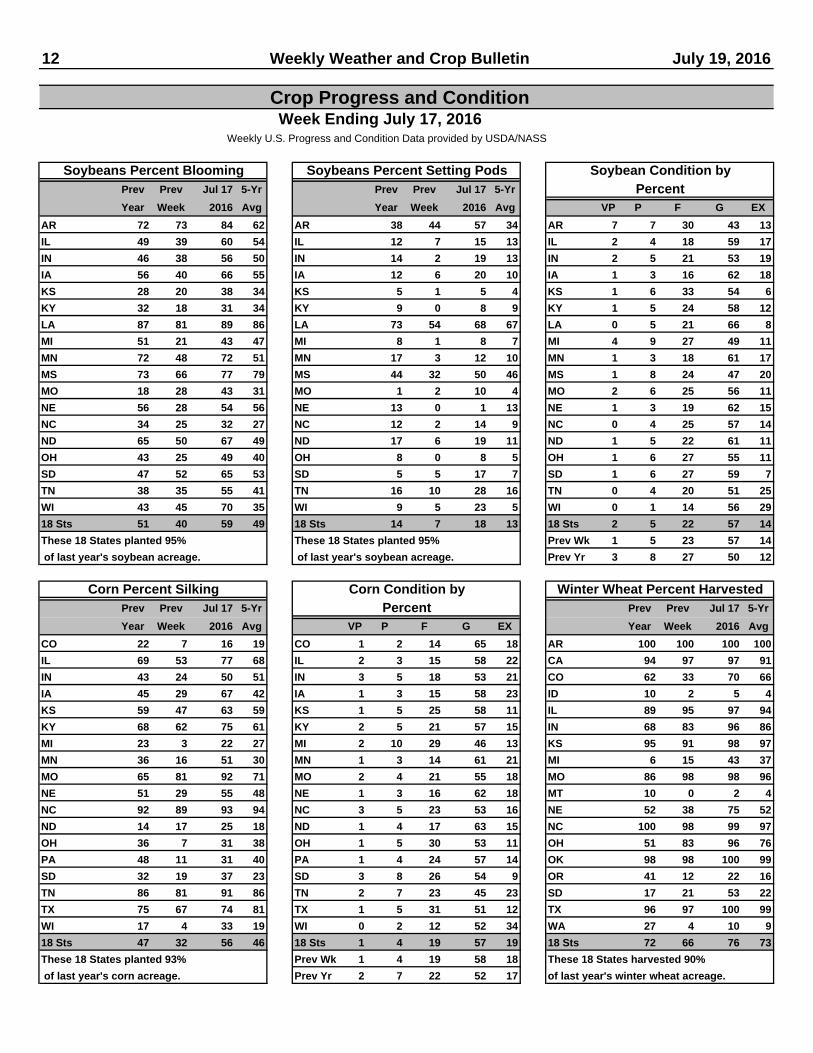
Corn: By week’s end, 56 percent of the crop was at or beyond the silking stage, 9 percentage points ahead of last year and 10 points ahead of the 5-year average. Favorable weather accelerated corn development in the western Corn Belt, with silking advancing 26 percentage points or more during the week in Iowa, Minnesota, Nebraska, and Wisconsin. Overall, 76 percent of the corn was reported in good to excellent condition, unchanged from last week but 7 percentage points above the same time last year. Illinois corn was rated at 80 percent in the good to excellent categories, improving by 4 percentage points from last week. Soybeans: Fifty-nine percent of this year’s soybeans were at or beyond the blooming stage by July 17, eight percentage points ahead of last year and 10 points ahead of the 5-year average. All major estimating states had double-digit blooming advances during the last week except Louisiana and North Carolina. By week’s end, 18 percent of the soybean crop was setting pods, 4 percentage points ahead of last year and 5 points ahead of the 5-year average. Overall, 71 percent of the soybean crop was reported in good to excellent condition, unchanged from last week but 9 percentage points above the same time last year. Winter Wheat: Harvest of this year’s winter wheat crop was 76 percent complete by July 17, four percentage points ahead of last year and 3 points ahead of the 5-year average. Harvest progress was well ahead of normal in the central Great Plains, 31 percentage points ahead of the 5-year average in South Dakota and 23 points ahead in Nebraska. Winter wheat harvest was complete or nearing completion in ten of the 18 estimating states. Cotton: By week’s end, 77 percent of this year’s cotton was at or beyond the squaring stage, 5 percentage points ahead of last year and slightly ahead of the 5-year average. Warm weather spurred cotton development in the southern Great Plains, with squaring progress advancing 28 percentage points during the week in Texas. Nationally, 28 percent of the crop was setting bolls, slightly behind last year and 2 percentage points behind the 5-year average. Overall, 54 percent of the cotton was reported in good to excellent condition, unchanged from last week but 3 percentage points below the same time last year. Sorghum: By July 17, thirty-nine percent of the sorghum was at or beyond the heading stage, 7 percentage points ahead of last year and 6 points ahead of the 5-year average. By week’s end, 19 percent of the sorghum was at or beyond the coloring stage,
equal to last year but 4 percentage points behind the 5-year average. Producers in the Southern Low Plains of Texas reported sugarcane aphids in some sorghum fields. Overall, 68 percent of the sorghum was reported in good to excellent condition, down slightly from last week but slightly better than at the same time last year. Rice: Forty-one percent of this year’s rice was at or beyond the heading stage by week’s end, 4 percentage points ahead of last year and 11 points ahead of the 5-year average. Overall, 68 percent of the rice was reported in good to excellent condition, unchanged from last week but 4 percentage points below the same time last year. Small Grains: By week’s end, producers had harvested 22 percent of the nation’s oat crop. This was 7 percentage points ahead last year and 2 points ahead of the 5-year average. Harvest progress was ahead of the 5-year average in all estimating states except Minnesota, Pennsylvania, and Wisconsin. Overall, 66 percent of the oat crop was reported in good to excellent condition, down slightly from last week and slightly below the same time last year. Ninety-five percent of the barley was at or beyond the heading stage by week’s end, 4 percentage points behind last year but 9 points ahead of the 5-year average. In North Dakota, the barley crop advanced to 98 percent headed, 19 percentage points ahead of the 5-year average. Overall, 73 percent of the barley was reported in good to excellent condition, down slightly from last week but 2 percentage points above the same time last year. By week’s end, 96 percent of the spring wheat was at or beyond the heading stage, slightly ahead of last year and 15 percentage points ahead of the 5-year average. Heading progress was 16 percentage points ahead of the 5-year average in Montana and 22 points ahead in North Dakota. Overall, 69 percent of the spring wheat was reported in good to excellent condition, down slightly from last week and slightly below the same time last year. Other Crops: Seventy-seven percent of the peanut crop was pegging by July 17, eight percentage points ahead of last year and 12 points ahead of the 5-year average. Overall, 69 percent of the peanut crop was reported in good to excellent condition, down slightly from last week and 5 percentage points below the same time last year. In Alabama, good to excellent peanut condition ratings were 36 percentage points below last year.
12 Weekly Weather and Crop Bulletin July 19, 2016
Crop Progress and Condition Week Ending July 17, 2016
Weekly U.S. Progress and Condition Data provided by USDA/NASS
Prev Prev Jul 17 5-Yr Prev Prev Jul 17 5-Yr
Year Week 2016 Avg Year Week 2016 Avg VP P F G EX
AR 72 73 84 62 AR 38 44 57 34 AR 7 7 30 43 13
IL 49 39 60 54 IL 12 7 15 13 IL 2 4 18 59 17
IN 46 38 56 50 IN 14 2 19 13 IN 2 5 21 53 19
IA 56 40 66 55 IA 12 6 20 10 IA 1 3 16 62 18
KS 28 20 38 34 KS 5 1 5 4 KS 1 6 33 54 6
KY 32 18 31 34 KY 9 0 8 9 KY 1 5 24 58 12
LA 87 81 89 86 LA 73 54 68 67 LA 0 5 21 66 8
MI 51 21 43 47 MI 8 1 8 7 MI 4 9 27 49 11
MN 72 48 72 51 MN 17 3 12 10 MN 1 3 18 61 17
MS 73 66 77 79 MS 44 32 50 46 MS 1 8 24 47 20
MO 18 28 43 31 MO 1 2 10 4 MO 2 6 25 56 11
NE 56 28 54 56 NE 13 0 1 13 NE 1 3 19 62 15
NC 34 25 32 27 NC 12 2 14 9 NC 0 4 25 57 14
ND 65 50 67 49 ND 17 6 19 11 ND 1 5 22 61 11
OH 43 25 49 40 OH 8 0 8 5 OH 1 6 27 55 11
SD 47 52 65 53 SD 5 5 17 7 SD 1 6 27 59 7
TN 38 35 55 41 TN 16 10 28 16 TN 0 4 20 51 25
WI 43 45 70 35 WI 9 5 23 5 WI 0 1 14 56 29
18 Sts 51 40 59 49 18 Sts 14 7 18 13 18 Sts 2 5 22 57 14
These 18 States planted 95% These 18 States planted 95% Prev Wk 1 5 23 57 14
of last year's soybean acreage. of last year's soybean acreage. Prev Yr 3 8 27 50 12
Prev Prev Jul 17 5-Yr Prev Prev Jul 17 5-Yr
Year Week 2016 Avg VP P F G EX Year Week 2016 Avg
CO 22 7 16 19 CO 1 2 14 65 18 AR 100 100 100 100
IL 69 53 77 68 IL 2 3 15 58 22 CA 94 97 97 91
IN 43 24 50 51 IN 3 5 18 53 21 CO 62 33 70 66
IA 45 29 67 42 IA 1 3 15 58 23 ID 10 2 5 4
KS 59 47 63 59 KS 1 5 25 58 11 IL 89 95 97 94
KY 68 62 75 61 KY 2 5 21 57 15 IN 68 83 96 86
MI 23 3 22 27 MI 2 10 29 46 13 KS 95 91 98 97
MN 36 16 51 30 MN 1 3 14 61 21 MI 6 15 43 37
MO 65 81 92 71 MO 2 4 21 55 18 MO 86 98 98 96
NE 51 29 55 48 NE 1 3 16 62 18 MT 10 0 2 4
NC 92 89 93 94 NC 3 5 23 53 16 NE 52 38 75 52
ND 14 17 25 18 ND 1 4 17 63 15 NC 100 98 99 97
OH 36 7 31 38 OH 1 5 30 53 11 OH 51 83 96 76
PA 48 11 31 40 PA 1 4 24 57 14 OK 98 98 100 99
SD 32 19 37 23 SD 3 8 26 54 9 OR 41 12 22 16
TN 86 81 91 86 TN 2 7 23 45 23 SD 17 21 53 22
TX 75 67 74 81 TX 1 5 31 51 12 TX 96 97 100 99
WI 17 4 33 19 WI 0 2 12 52 34 WA 27 4 10 9
18 Sts 47 32 56 46 18 Sts 1 4 19 57 19 18 Sts 72 66 76 73
These 18 States planted 93% Prev Wk 1 4 19 58 18 These 18 States harvested 90%
of last year's corn acreage. Prev Yr 2 7 22 52 17 of last year's winter wheat acreage.
PercentWinter Wheat Percent Harvested
Soybeans Percent Blooming Soybeans Percent Setting PodsPercent
Soybean Condition by
Corn Percent Silking Corn Condition by

July 19, 2016 Weekly Weather and Crop Bulletin 13
Crop Progress and Condition Week Ending July 17, 2016
Weekly U.S. Progress and Condition Data provided by USDA/NASS
Prev Prev Jul 17 5-Yr Prev Prev Jul 17 5-Yr
Year Week 2016 Avg Year Week 2016 Avg VP P F G EX
AL 90 85 90 80 AL 46 38 51 35 AL 1 4 47 43 5
AZ 89 85 90 88 AZ 46 40 50 51 AZ 4 1 4 54 37
AR 99 97 100 99 AR 69 66 86 69 AR 5 2 16 45 32
CA 94 83 85 89 CA 75 0 5 60 CA 0 0 25 25 50
GA 86 81 90 82 GA 49 33 52 45 GA 2 6 29 52 11
KS 31 34 44 54 KS 1 5 5 7 KS 0 1 32 64 3
LA 95 85 91 97 LA 64 46 65 71 LA 0 5 17 72 6
MS 88 75 82 90 MS 51 33 51 46 MS 2 8 34 44 12
MO 76 76 78 79 MO 15 7 7 21 MO 2 9 46 39 4
NC 87 68 83 88 NC 38 12 24 40 NC 3 7 28 56 6
OK 41 30 43 46 OK 6 7 10 13 OK 0 0 46 47 7
SC 68 60 75 73 SC 29 12 24 31 SC 0 1 59 34 6
TN 72 75 83 76 TN 22 17 33 24 TN 1 2 19 60 18
TX 63 43 71 69 TX 19 13 18 20 TX 1 12 40 41 6
VA 83 58 73 86 VA 19 5 21 15 VA 0 4 21 74 1
15 Sts 72 57 77 76 15 Sts 29 19 28 30 15 Sts 1 9 36 45 9
These 15 States planted 99% These 15 States planted 99% Prev Wk 1 10 35 45 9
of last year's cotton acreage. of last year's cotton acreage. Prev Yr 1 7 35 46 11
Prev Prev Jul 17 5-Yr Prev Prev Jul 17 5-Yr
Year Week 2016 Avg Year Week 2016 Avg VP P F G EX
AR 73 57 74 74 AR 22 1 12 21 AR 3 9 27 46 15
CO 4 3 6 9 CO 0 0 0 0 CO 0 0 34 62 4
IL 23 1 27 22 IL 1 0 0 1 IL 3 6 25 61 5
KS 2 11 13 5 KS 0 0 1 0 KS 0 2 23 66 9
LA 95 91 95 94 LA 57 38 62 61 LA 0 6 27 55 12
MO 21 14 24 21 MO 0 0 1 1 MO 0 3 30 61 6
NE 15 0 7 8 NE 0 0 0 1 NE 0 0 18 68 14
NM 3 3 10 2 NM 0 0 0 0 NM 0 2 77 20 1
OK 32 19 30 28 OK 2 1 2 3 OK 0 3 23 71 3
SD 27 15 23 18 SD 0 0 1 0 SD 0 2 35 63 0
TX 64 63 76 70 TX 48 44 48 60 TX 0 4 34 45 17
11 Sts 32 31 39 33 11 Sts 19 16 19 23 11 Sts 0 3 29 57 11
These 11 States planted 98% These 11 States planted 98% Prev Wk 0 2 29 58 11
of last year's sorghum acreage. of last year's sorghum acreage. Prev Yr 3 4 26 56 11
Sorghum Percent Headed Sorghum Percent Coloring Sorghum Condition byPercent
Cotton Percent Squaring Cotton Percent Setting Bolls Cotton Condition byPercent

14 Weekly Weather and Crop Bulletin July 19, 2016
Crop Progress and Condition Week Ending July 17, 2016
Weekly U.S. Progress and Condition Data provided by USDA/NASS
Prev Prev Jul 17 5-Yr Prev Prev Jul 17 5-Yr Prev Prev Jul 17 5-Yr
Year Week 2016 Avg Year Week 2016 Avg Year Week 2016 Avg
IA 24 16 35 30 AL 78 53 61 59 AR 27 14 34 22
MN 1 0 2 6 FL 81 80 85 71 CA 18 25 25 7
NE 25 26 49 43 GA 71 79 90 66 LA 82 70 81 75
ND 0 0 3 2 NC 64 40 65 75 MS 48 29 43 42
OH 6 7 40 19 OK 34 50 55 61 MO 32 3 3 14
PA 6 0 3 7 SC 81 80 84 74 TX 60 71 83 66
SD 13 20 38 15 TX 33 34 42 51 6 Sts 37 28 41 30
TX 97 97 100 97 VA 39 25 37 52 These 6 States planted 100%
WI 5 2 8 10 8 Sts 69 67 77 65 of last year's rice acreage.
9 Sts 15 13 22 20 These 8 States planted 97%
These 9 States harvested 70% of last year's peanut acreage.
of last year's oat acreage.
VP P F G EX
AR 3 8 27 44 18
VP P F G EX CA 0 0 15 75 10
VP P F G EX AL 0 0 53 41 6 LA 0 5 30 58 7
IA 0 2 19 64 15 FL 0 5 28 60 7 MS 0 2 23 46 29
MN 1 3 15 61 20 GA 1 4 23 55 17 MO 1 3 23 51 22
NE 1 1 26 64 8 NC 0 2 16 68 14 TX 3 4 36 48 9
ND 3 9 20 63 5 OK 0 0 8 90 2 6 Sts 2 5 25 53 15
OH 1 2 24 66 7 SC 0 0 16 66 18 Prev Wk 2 5 25 53 15
PA 1 5 21 64 9 TX 0 1 41 53 5 Prev Yr 2 4 22 49 23
SD 1 6 29 61 3 VA 0 0 8 91 1
TX 8 15 38 34 5 8 Sts 0 3 28 57 12
WI 0 1 14 55 30 Prev Wk 0 2 28 58 12 Prev Prev Jul 17 5-Yr
9 Sts 3 7 24 55 11 Prev Yr 0 2 24 59 15 Year Week 2016 Avg
Prev Wk 3 6 24 56 11 ID 95 89 96 90
Prev Yr 4 7 22 55 12 MN 99 94 97 91
MT 96 75 90 74
ND 92 96 98 76
Prev Prev Jul 17 5-Yr SD 96 99 100 96
Year Week 2016 Avg VP P F G EX WA 100 95 100 95
ID 99 82 88 92 ID 0 1 22 66 11 6 Sts 95 91 96 81
MN 98 92 97 89 MN 4 7 25 54 10 These 6 States planted 99%
MT 99 86 95 86 MT 1 4 33 40 22 of last year's spring wheat acreage.
ND 95 97 98 79 ND 1 3 16 69 11
WA 100 92 96 93 WA 0 0 11 83 6
5 Sts 99 89 95 86 5 Sts 1 3 23 58 15
These 5 States planted 82% Prev Wk 1 3 22 59 15 VP P F G EX
of last year's barley acreage. Prev Yr 1 5 23 52 19 ID 0 1 22 68 9
MN 3 6 21 52 18
MT 1 4 30 50 15
ND 2 5 20 64 9
SD 3 11 42 41 3
WA 0 1 14 78 7
6 Sts 2 5 24 58 11
Prev Wk 2 5 23 60 10
Prev Yr 1 6 23 55 15
Percent
Spring Wheat Percent Headed
Spring Wheat Condition by
Barley Percent HeadedPercent
Barley Condition by
Percent
Peanuts Percent Pegging
Peanut Condition byPercent
Rice Percent Headed
Rice Condition byPercent
Oats Percent Harvested
Oat Condition by

July 19, 2016 Weekly Weather and Crop Bulletin 15
Crop Progress and Condition Week Ending July 17, 2016
Weekly U.S. Progress and Condition Data provided by USDA/NASS
VP P F G EX VP P F G EX
AL 8 16 32 39 5 NH 1 21 65 13 0
AZ 16 19 40 22 3 NJ 1 2 41 51 5
AR 2 8 33 47 10 NM 3 21 47 27 2
CA 10 25 25 30 10 NY 4 9 42 39 6
CO 3 5 22 58 12 NC 3 12 37 42 6
CT 14 39 40 7 0 ND 4 10 26 54 6
DE 3 8 38 46 5 OH 3 16 29 43 9
FL 3 6 26 47 18 OK 1 7 35 49 8
GA 14 20 38 24 4 OR 13 22 27 35 3
ID 1 3 31 51 14 PA 8 16 38 33 5
IL 1 6 19 60 14 RI 0 12 35 53 0
IN 2 5 21 59 13 SC 10 24 20 42 4
IA 2 7 30 50 11 SD 5 14 34 45 2
KS 1 4 23 63 9 TN 4 16 32 42 6
KY 1 6 22 59 12 TX 3 11 37 39 10
LA 1 9 35 49 6 UT 1 8 35 48 8
ME 0 9 15 36 40 VT 10 35 41 14 0
MD 1 5 24 63 7 VA 2 6 30 54 8
MA 15 40 35 10 0 WA 2 8 18 63 9
MI 5 19 30 38 8 WV 1 5 28 56 10
MN 1 5 15 64 15 WI 1 3 19 57 20
MS 2 11 34 46 7 WY 6 10 21 57 6
MO 1 7 37 49 6 48 Sts 4 10 30 47 9
MT 10 16 36 33 5
NE 2 2 19 64 13 Prev Wk 3 10 30 48 9
NV 5 10 35 40 10 Prev Yr 3 8 26 49 14
Pasture and Range Condition by PercentWeek Ending MMDD, YYYY
VP - Very Poor; P - Poor;F - Fair;
G - Good; EX - Excellent
NA - Not Available* Revised

16 Weekly Weather and Crop Bulletin July 19, 2016
Crop Progress and Condition Week Ending July 17, 2016
Weekly U.S. Progress and Condition Data provided by USDA/NASS
7
77
7
7
6.8
7
6
4
6
4.6
6
56.
4
5.5
3.3
6.1
4.8
5.7
4.3
5.9
6.4
6.4
6.5
4.6
4.5
5.1
6.3
5.5
5.5
6.2
5.4
6.5
5.2
6.1
5.9 4.
3
5.4
6.5
5.6
7
6.5
5.2 6
.2
6.56.
67
6.5
Day
s Su
itabl
e fo
r Fie
ldw
ork
This
pro
duct
was
pre
pare
d by
the
USD
A O
ffice
of t
he C
hief
Eco
nom
ist (
OC
E)W
orld
Agr
icul
tura
l Out
look
Boa
rd (W
AOB)
Uni
ted
Stat
esD
epar
tmen
t of
Agr
icul
ture
Wee
k En
ding
July
17,
201
6
Dat
a ob
tain
ed fr
om U
SDA
Nat
iona
l Agr
icul
tura
lSt
atis
tics
Ser
vice
(NA
SS
) wee
kly
Cro
p P
rogr
ess
repo
rts.
Thes
e re
ports
are
ava
ilabl
e th
roug
hht
tp://
ww
w.na
ss.u
sda.
gov/
Pub
licat
ions
/.
Day
s S
uita
ble
0.0
- 0.4
0.5
- 1.4
1.5
- 2.4
2.5
- 3.4
3.5
- 4.4
4.5
- 5.4
5.5
- 6.4
6.5
- 7.0

July 19, 2016 Weekly Weather and Crop Bulletin 17
Crop Progress and Condition Week Ending July 17, 2016
Weekly U.S. Progress and Condition Data provided by USDA/NASS
2[-2]
0[0]
0[0]
4[0]
0[0]
11[+3]
8[0]
11[0]
2[0]
4[0]
3[-1]
8[-3]
1[0]
1[-1]
1[-2]
10[0]
7[0]
16[+4]
2[-3]
11[-2]
1[+1]
26[+10]
12[0]
7[+3]
8[-1]
7[0]
29[0]
1[+1]
13[+1]
14[0]
3[-1]
8[-1]
5[-1]
5[-3]
3[0]
3[-2]
5[-1]
10[-4]
16[+3]
10[-2]
0[0]
12[0]
15[-1]
9[+1]
0[-3]
0[0]
11[-1]
0[0]
Topsoil MoistureThis product was prepared by theUSDA Office of the Chief Economist (OCE)World Agricultural Outlook Board (WAOB)
United StatesDepartment ofAgriculture
Data obtained from USDA National Agricultural Statistics Service weekly Crop Progressreports. These reports are available through http://www.nass.usda.gov/Publications/.
Top ## - Percent Surplus
[Bottom ##] - Change from Last WeekSurplus
Change from Last Week
8
0
48 States
Percent SurplusWeek Ending - July 17, 2016
Percent90 - 10080 - 8970 - 7960 - 6950 - 5940 - 4930 - 3920 - 2910 - 19 0 - 9
64[+11]
70[0]
31[0]
30[-2]
81[+2]
55[+5]
16[0]
21[+3]
40[+5]
41[-2]
41[+5]
1[-8]38
[+2]
29[-1]
43[-1]
12[0]
58[0]
13[-5]
29[+3]
13[-1]
18[-1]
65[+5]
10[-1]
15[-9]
52[-3]
15[-4]
52[+2]
52[+4]
44[-4]
33[-2]
56[+9]
49[+4]
5[-6]
20[+4]
56[+16]
19[-1]
46[-1]
25[-6]
25[+13]
18[+5]
18[+6]
63[+7]
63[-8]86
[+9]
30[+6]
42[-9]
16[+6]
Topsoil MoistureThis product was prepared by theUSDA Office of the Chief Economist (OCE)World Agricultural Outlook Board (WAOB)
United StatesDepartment ofAgriculture
Percent Short to Very ShortWeek Ending - July 17, 2016
Data obtained from USDA National Agricultural Statistics Service weekly Crop Progressreports. These reports are available through http://www.nass.usda.gov/Publications/.
Top ## - Percent Short to Very Short
[Bottom ##] - Change from Last WeekShort to Very Short
Change from Last Week
30
+1
48 States
Percent90 - 10080 - 8970 - 7960 - 6950 - 5940 - 4930 - 3920 - 2910 - 19 0 - 9

18 Weekly Weather and Crop Bulletin July 19, 2016
Crop Progress and Condition Week Ending July 17, 2016
Weekly U.S. Progress and Condition Data provided by USDA/NASS
3[-2]
0[0]
0[0]
2[0]
0[0]
6[+2]
6[0]
3[0]
1[0]
4[0]
4[-1]
2[0]
0[0]
17[+6]3
[-1]1
[-1]7
[0]
12[+6]
3[-2]
6[-1]
10[0]
4[0]
0[-1]
5[-3]
4[0]
5[+1] 5
[0]
5[-1]
1[+1]
12[+1]
4[-1]
8[-2]
0[0]
2[-3]
23[+2]
4[-1]
8[-2]
3[-2]
16[+2]
6[-1]
6[0]
0[0]
1[0]
0[-9]
15[+1]
1[0]
16[-2]
0[0]
Subsoil MoistureThis product was prepared by theUSDA Office of the Chief Economist (OCE)World Agricultural Outlook Board (WAOB)
United StatesDepartment ofAgriculture
Data obtained from USDA National Agricultural Statistics Service weekly Crop Progressreports. These reports are available through http://www.nass.usda.gov/Publications/.
Top ## - Percent Surplus
[Bottom ##] - Change from Last WeekSurplus
Change from Last Week
6
0
48 States
Percent SurplusWeek Ending - July 17, 2016
Percent90 - 10080 - 8970 - 7960 - 6950 - 5940 - 4930 - 3920 - 2910 - 19 0 - 9
49[+10]
75[+5]
36[-1]
61[+6]
28[-1]
37[0]
55[+5]
16[0]
17[+2]
41[+8]
49[+1]
41[+4]
6[-9]
23[+1]
42[+4]
18[-4]
22[+2]
14[-5]
17[+1]
54[+5]
12[-2]
15[-6]
12[+1]
52[+2]
52[-2]
14[-2]
49[+1]
45[+7]
46[-1]
37[-1]
47[+8]
49[+4]
7[-2]
17[+4]
50[+11]
21[+1]
51[+9]
36[-1]
25[-4]
16[+4]
62[0]
12[+2]
60[-2]
77[+9]
28[+4]
56[0]
9[+3]
Subsoil MoistureThis product was prepared by theUSDA Office of the Chief Economist (OCE)World Agricultural Outlook Board (WAOB)
United StatesDepartment ofAgriculture
Percent Short to Very ShortWeek Ending - July 17, 2016
Data obtained from USDA National Agricultural Statistics Service weekly Crop Progressreports. These reports are available through http://www.nass.usda.gov/Publications/.
Top ## - Percent Short to Very Short
[Bottom ##] - Change from Last WeekShort to Very Short
Change from Last Week
28
+1
48 States
Percent90 - 10080 - 8970 - 7960 - 6950 - 5940 - 4930 - 3920 - 2910 - 19 0 - 9

July 19, 2016 Weekly Weather and Crop Bulletin 19
For additional information contact: [email protected]
International Weather and Crop Summary
July 10-16, 2016 International Weather and Crop Highlights and Summaries provided by USDA/WAOB
HIGHLIGHTS
EUROPE: Rain shifted into eastern Europe, boosting moisture supplies for reproductive summer crops while allowing favorably dry weather to facilitate winter crop harvesting in the west. WESTERN FSU: Hot, dry weather favored winter wheat drydown and harvesting but increased stress on reproductive corn. EASTERN FSU: Additional showers maintained ample moisture supplies for heading spring wheat, while heat in the south raised concerns for flowering cotton. MIDDLE EAST: Locally excessive heat in Turkey was untimely for reproductive cotton and corn, though winter wheat harvesting proceeded without delay. SOUTH ASIA: Monsoon showers covered most growing areas of India, adding to rainfall totals that are a marked improvement over the last two years. EAST ASIA: Dryness continued for reproductive corn and soybeans in northeastern China, while heavy showers farther south maintained abundant to excessive soil moisture for summer crops.
SOUTHEAST ASIA: Monsoon showers kept rice and other summer crops adequately watered throughout the region. AUSTRALIA: Showers persisted in southern and western Australia, favoring winter crop development. ARGENTINA: Showers overspread the southern winter wheat belt, as drier conditions elsewhere favored summer crop harvests. BRAZIL: Rain benefited winter wheat in southern areas, but warmth and dryness fostered rapid maturation of corn and cotton farther north. MEXICO: Beneficial rain continued across the southern plateau, as well as in the country’s northwestern watersheds. CANADIAN PRAIRIES: Widespread, locally heavy showers maintained overall favorable conditions for spring grains and oilseeds. SOUTHEASTERN CANADA: Pockets of dryness persisted in key corn and soybean areas.
Too Hot (Turkey)
Seasonal Rainfall
(SE Asia)
Seasonal Rainfall (Mexico)
Winter Crop Harvesting (W Europe)
Warm & Dry
Rain for Spring Wheat (Eastern FSU)
Showers
Hot, Dry Weather
(Western FSU)
Monsoon Showers
Showers in Southern Wheat Belt (Argentina)
Heavy
Showers Dry Dry
(Ontario)
Rain
Rain
Rain for Wheat (S Brazil)
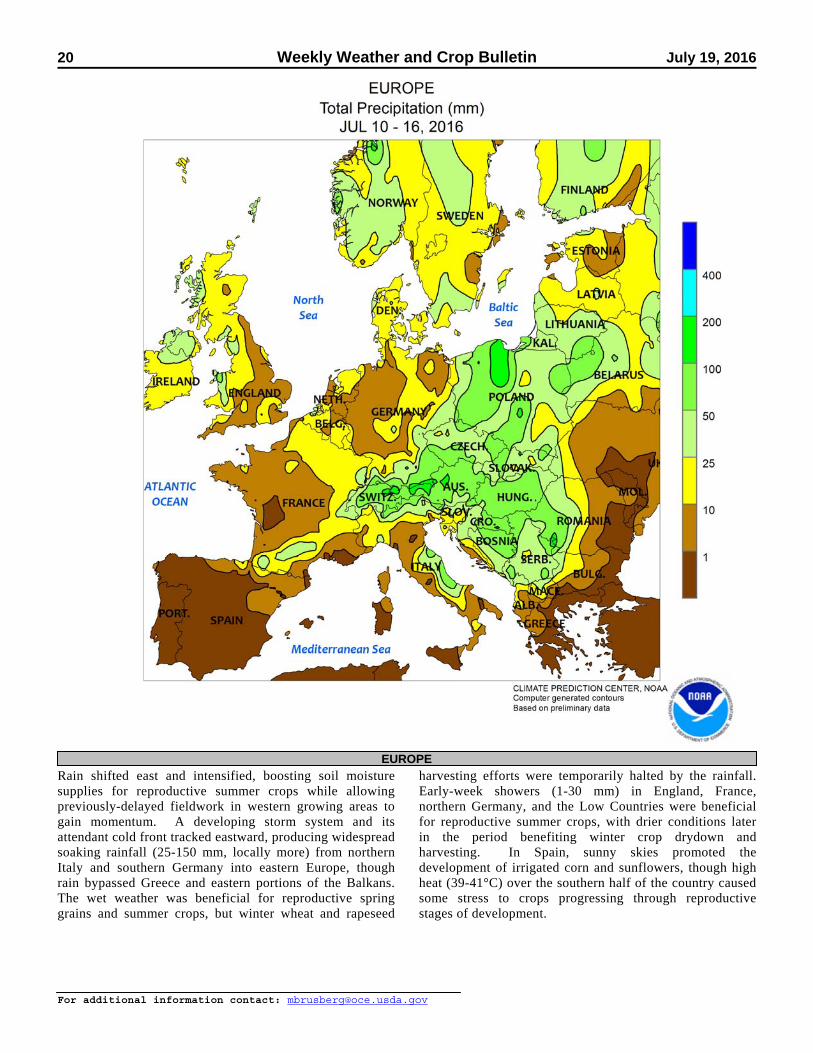
20 Weekly Weather and Crop Bulletin July 19, 2016
For additional information contact: [email protected]
Rain shifted east and intensified, boosting soil moisture supplies for reproductive summer crops while allowing previously-delayed fieldwork in western growing areas to gain momentum. A developing storm system and its attendant cold front tracked eastward, producing widespread soaking rainfall (25-150 mm, locally more) from northern Italy and southern Germany into eastern Europe, though rain bypassed Greece and eastern portions of the Balkans. The wet weather was beneficial for reproductive spring grains and summer crops, but winter wheat and rapeseed
harvesting efforts were temporarily halted by the rainfall. Early-week showers (1-30 mm) in England, France, northern Germany, and the Low Countries were beneficial for reproductive summer crops, with drier conditions later in the period benefiting winter crop drydown and harvesting. In Spain, sunny skies promoted the development of irrigated corn and sunflowers, though high heat (39-41°C) over the southern half of the country caused some stress to crops progressing through reproductive stages of development.
EUROPE

July 19, 2016 Weekly Weather and Crop Bulletin 21
For additional information contact: [email protected]
Dry, hot conditions promoted fieldwork but increased stress on reproductive summer crops. For much of the week, sunny skies and above-normal temperatures (2-6°C above normal) accelerated winter wheat drydown and harvesting from south-central Ukraine into western and southern Russia. However, highly variable showers and thunderstorms (2-54 mm) in the North Caucasus District and environs caused localized harvest delays. More notably, the dry weather was accompanied by increasing heat, with daytime highs of 38 to 40°C stressing
reproductive corn and sunflowers from eastern Ukraine into western and southern Russia. In fact, temperatures continued to climb in the southwestern Southern District (Krasnodar Krai, a key corn area), with a peak value of 40.7°C on June 17. Growing degree day data indicated corn was likely in the silking stage when the heat arrived, making the crop especially vulnerable to heat damage. In contrast, a swath of moderate to heavy rain (10-90 mm, locally more) favored spring grains and summer crops from Belarus into northern Russia.
WESTERN FSU

22 Weekly Weather and Crop Bulletin July 19, 2016
For additional information contact: [email protected]
Widespread showers and near-normal temperatures maintained favorable prospects for spring wheat, while heat in Uzbekistan caused some stress to flowering cotton. A slow-moving storm system maintained cloudy, showery weather over central and eastern portions of the region. Rainfall amounts generally totaled 10 to 50 mm (locally more than 70 mm) over primary
spring wheat areas of northern Kazakhstan and central Russia, boosting soil moisture supplies as the crop enters reproduction. Farther south, the return of seasonably dry weather was accompanied by excessive heat (40-45°C) in Uzbekistan, causing some stress to irrigated cotton which was progressing through the flowering stage of development.
EASTERN FSU

July 19, 2016 Weekly Weather and Crop Bulletin 23
For additional information contact: [email protected]
Seasonably dry weather prevailed over much of the region, though unfavorable heat returned to summer crop areas of Turkey. Sunny skies allowed any remaining winter grain harvesting to near completion from the eastern Mediterranean Coast into Iran. Winter wheat harvesting also proceeded without delay in Turkey. However, the return of sunny, hot weather (35-40°C) in southern
Turkey’s primary corn areas arrived during the silking stage of development, reducing the crop’s yield potential. Extreme heat (40-43°C) was also recorded in western Turkey, adversely impacting flowering cotton. However, northwestern Turkey’s sunflower areas escaped the scorching heat, with daytime highs in the lower to middle 30s (degrees C).
MIDDLE EAST

24 Weekly Weather and Crop Bulletin July 19, 2016
For additional information contact: [email protected]
Monsoon showers were observed throughout India. Rainfall amounts easily surpassed 50 mm in most areas and were locally in excess of 200 mm. The widespread showers stemmed developing dryness for rice in the East, while keeping western soybeans unfavorably wet. Meanwhile, pockets of drier-than-normal weather continued for cotton in Gujarat. Despite the late start to the monsoon season, rainfall totals thus far have been markedly better than the
previous two years and the highest in the last ten years. In other parts of the region, showers (25-100 mm) soaked northern Pakistan, providing ample irrigation water for rice and cotton in downstream growing areas of the Indus River Basin. Rain (50-100 mm or more) in Bangladesh kept rice adequately watered, while unseasonably light showers (less than 25 mm) in Sri Lanka continued the drying trend for rice dating back to mid-June.
SOUTH ASIA

July 19, 2016 Weekly Weather and Crop Bulletin 25
For additional information contact: [email protected]
Showers overspread most of eastern China, maintaining abundant to excessive soil moisture for summer crops. The highest rainfall totals (25-100 mm, locally over 200 mm) occurred across a wide area extending from the North China Plain to the far southern provinces. Seasonal rainfall (since June 1) has been exceptional in these areas, with few locales reporting moisture deficits, and portions of the Yangtze River Basin experiencing significant flooding. In fact for some provinces, this has been the wettest summer in over 25 years. And while
rice has not been hampered by the wet weather, the flooding and saturated soils have been detrimental to other crops. Meanwhile in northeastern China, mostly dry weather continued, as rainfall for the last two weeks has totaled less than 15 mm (averaged across the northeast). The dryness has been untimely as corn and soybeans progressed through reproduction. Elsewhere in the region, showers remained unseasonably light (less than 50 mm) on the Korean Peninsula and in Japan, but irrigation supplies kept rice adequately watered.
EASTERN ASIA

26 Weekly Weather and Crop Bulletin July 19, 2016
For additional information contact: [email protected]
Monsoon showers (25-50 mm or more) continued to keep rice adequately watered across Indochina (Thailand and environs), but portions of northern Thailand (within the Chao Phraya River Basin) experienced unseasonably light rainfall. Nevertheless, seasonal rainfall totals (starting May 15) across Thailand are the highest in the last five years. In the Philippines, drier conditions overset minor rice areas in the central regions, while soil moisture and water supplies in the north continued to improve
on up to 50 mm of rain. Meanwhile, more seasonable rainfall returned to oil palm areas of Malaysia and Indonesia after a brief dry spell last week. However, Sabah in eastern Malaysia remained dry for a second week. In Java, Indonesia, unseasonable wetness (over 25 mm, locally approaching 400 mm) continued to bolster water supplies during what is supposed to be the middle of the dry season. So far, the current dry season is the third wettest over the last 25 years.
SOUTHEAST ASIA

July 19, 2016 Weekly Weather and Crop Bulletin 27
For additional information contact: [email protected]
Widespread showers (5-25 mm, locally more) persisted in western and southeastern Australia, maintaining adequate to abundant topsoil moisture for vegetative winter crops. In contrast, mostly dry weather (generally less than 5 mm) overspread northern New South Wales and extreme southern Queensland. Despite the dryness, growing conditions remained near ideal for agriculture, with sunny skies and abundant moisture supplies further benefiting
vegetative wheat and other winter crops. Elsewhere in the wheat belt, heavy rain (25-100 mm, locally more) overspread portions of central and southern Queensland, causing local flooding. Most winter grains are grown south of the hardest hit areas, however, minimizing any potential negative impact on crops. Temperatures fluctuated throughout the week but averaged near normal (within 1°C of normal) for the time period.
AUSTRALIA

28 Weekly Weather and Crop Bulletin July 19, 2016
For additional information contact: [email protected]
Showers swept across the southern winter grain belt as drier weather developed farther north. Rainfall totaling more than 10 mm overspread southern production areas of La Pampa and Buenos Aires; locally higher amounts (greater than 25 mm) were recorded in southeastern Buenos Aires. While slowing autumn fieldwork, the moisture will ultimately favor winter grains. Mostly dry weather prevailed elsewhere, aiding drydown and harvesting of corn and cotton. Weekly
average temperatures were near to slightly above normal, with the week’s highest temperatures ranging from the middle 10s (degrees C) in Buenos Aires and La Pampa to the lower 30s in Formosa. Freezes were recorded as far north as northern Cordoba. According to Argentina’s Ministry of Agriculture, corn was 57 harvested as of July 14, compared with 77 percent last year. Wheat was 73 percent planted, 9 points behind last year’s pace.
ARGENTINA
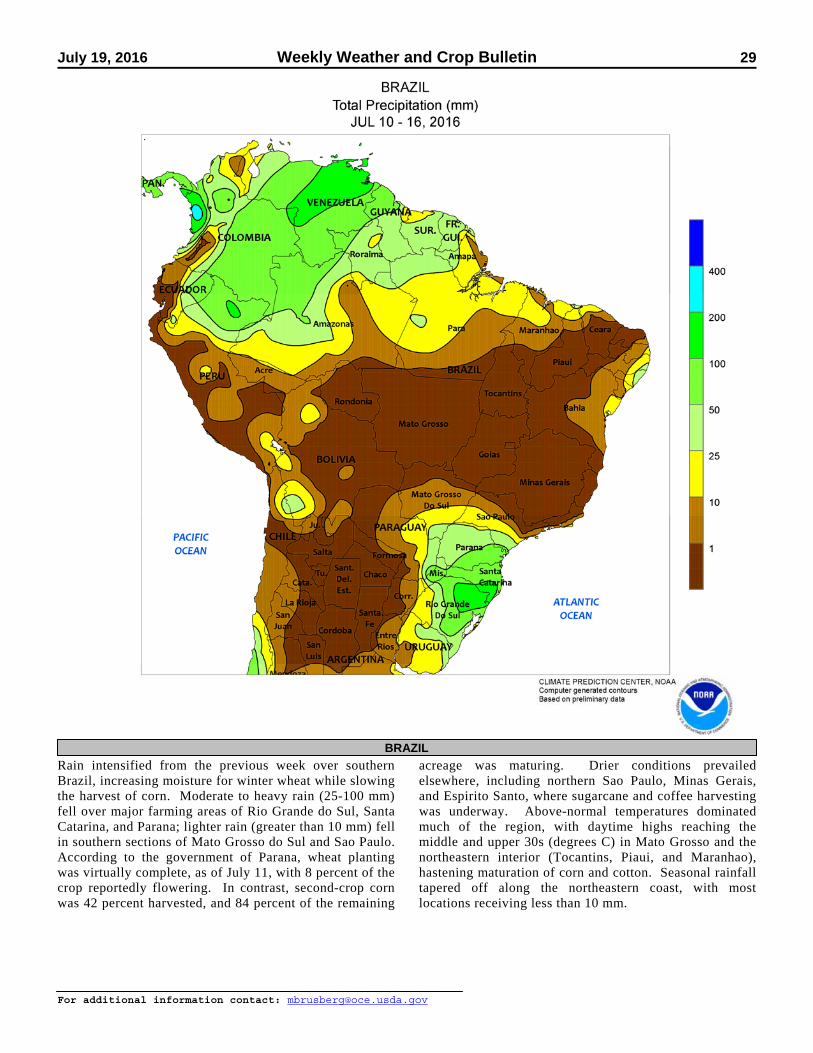
July 19, 2016 Weekly Weather and Crop Bulletin 29
For additional information contact: [email protected]
Rain intensified from the previous week over southern Brazil, increasing moisture for winter wheat while slowing the harvest of corn. Moderate to heavy rain (25-100 mm) fell over major farming areas of Rio Grande do Sul, Santa Catarina, and Parana; lighter rain (greater than 10 mm) fell in southern sections of Mato Grosso do Sul and Sao Paulo. According to the government of Parana, wheat planting was virtually complete, as of July 11, with 8 percent of the crop reportedly flowering. In contrast, second-crop corn was 42 percent harvested, and 84 percent of the remaining
acreage was maturing. Drier conditions prevailed elsewhere, including northern Sao Paulo, Minas Gerais, and Espirito Santo, where sugarcane and coffee harvesting was underway. Above-normal temperatures dominated much of the region, with daytime highs reaching the middle and upper 30s (degrees C) in Mato Grosso and the northeastern interior (Tocantins, Piaui, and Maranhao), hastening maturation of corn and cotton. Seasonal rainfall tapered off along the northeastern coast, with most locations receiving less than 10 mm.
BRAZIL

30 Weekly Weather and Crop Bulletin July 19, 2016
For additional information contact: [email protected]
Beneficial rain maintained mostly favorable conditions for corn and other rain-fed summer crops across southern Mexico. Most areas received at least 10 mm, with higher amounts (25-100 mm) concentrated over sections of the southern plateau, along the southern Pacific Coast, and from southern Veracruz to Chiapas. Locally heavy rain (greater than 50 mm) also fell in Campeche on the Yucatan Peninsula.
In contrast, drier conditions prevailed in the northeast, including for a second week sugarcane areas of northern Veracruz. Daytime highs reached the upper 30s and lower 40s (degrees C) in the lower Rio Grande Valley, maintaining high moisture demands for crops and livestock. Monsoon showers (locally exceeding 50 mm) further replenished irrigation reserves in northwestern watersheds.
MEXICO

July 19, 2016 Weekly Weather and Crop Bulletin 31
For additional information contact: [email protected]
Stormy weather overspread the Prairies, providing abundant rain for spring grains and oilseeds but reportedly causing localized damage from hail and winds. All agricultural districts reported at least 10 mm, with amounts in excess of 50 mm reported over large parts of Alberta and Saskatchewan. Much of the rain fell early in the week, with several locations recording daily amounts in excess of 40 mm. Weekly temperatures averaged near to below normal across the southern Prairies and up to 2°C
above normal in northern farming districts. Daytime highs reached the middle and upper 20s (degrees C) in Manitoba, eastern Saskatchewan, and southern Alberta but were generally lower elsewhere, promoting spring grain and oilseed growth in the absence of stressful heat. According to reports emanating from Canada, crops are progressing well and are rated in relatively good condition but the impacts of the wet weather and storms are evident and damage from hail is being assessed.
CANADIAN PRAIRIES
32 Weekly Weather and Crop Bulletin July 19, 2016
For additional information contact: [email protected]
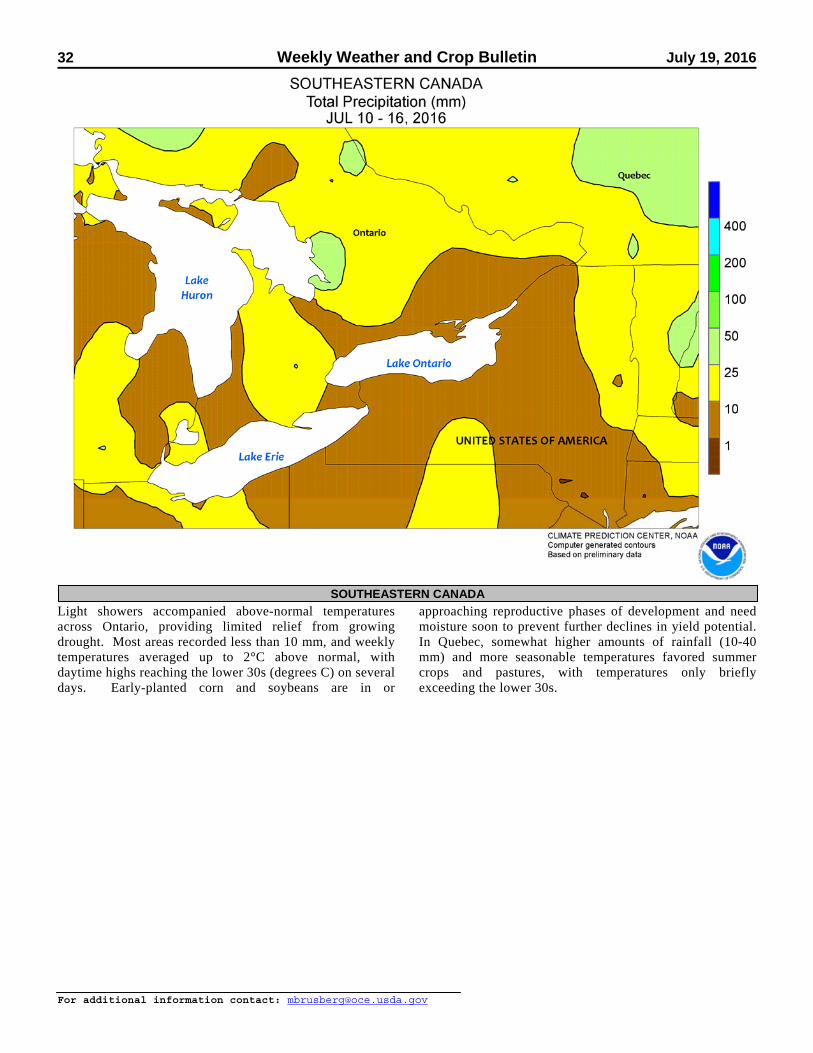
Light showers accompanied above-normal temperatures across Ontario, providing limited relief from growing drought. Most areas recorded less than 10 mm, and weekly temperatures averaged up to 2°C above normal, with daytime highs reaching the lower 30s (degrees C) on several days. Early-planted corn and soybeans are in or
approaching reproductive phases of development and need moisture soon to prevent further declines in yield potential. In Quebec, somewhat higher amounts of rainfall (10-40 mm) and more seasonable temperatures favored summer crops and pastures, with temperatures only briefly exceeding the lower 30s.
SOUTHEASTERN CANADA

July 19, 2016 Weekly Weather and Crop Bulletin 33
For additional information contact: [email protected]
June International Temperature and Precipitation Maps
EUROPE
A second consecutive month of much-above-normal rainfall caused lodging, lowered quality, and reduced yield prospects for reproductive to filling winter wheat and rapeseed. Rain was heaviest in England, France, and Germany, with monthly totals averaging 100 to 200 mm (150-300 percent of normal). In many of these locales, the persistent wet weather further reduced yield prospects for filling winter crops following
excessive rainfall during May. Heavy showers and thunderstorms (50-200 mm, locally more) in Italy and the Balkans boosted soil moisture for vegetative corn, soybeans, and sunflowers. Occasional rain in Poland and the Baltic States likewise improved soil moisture for spring grains and later-developing winter crops. Dry, warm weather in Spain favored wheat and barley harvesting.

34 Weekly Weather and Crop Bulletin July 19, 2016
For additional information contact: [email protected]
WESTERN FSU
Wet weather during early June maintained or boosted winter crop prospects in the region. Winter wheat yields in Ukraine and Russia further benefited from warm, dry weather later in the month during grain fill. Despite the appearance of heat (35°C or greater) in southern Russia
at the end of June, corn had not yet reached reproductive stages of development. Furthermore, soil moisture was in good supply as a result of locally heavy early-June rainfall (100 mm or greater), enabling crops to better withstand the heat.

July 19, 2016 Weekly Weather and Crop Bulletin 35
For additional information contact: [email protected]
EASTERN FSU
After a favorably dry May for spring wheat planting, above-normal June rainfall boosted soil moisture supplies for crop establishment in Kazakhstan and central Russia. Monthly rainfall tallied 50 to 150 mm (130-340 percent of normal) over the region’s spring wheat belt,
keeping vegetative crops abundantly watered and boosting soil moisture reserves for potential incursions of dryness and heat. Warm, occasionally showery weather (10-40 mm) in Uzbekistan favored the development of irrigated cotton.

36 Weekly Weather and Crop Bulletin July 19, 2016
For additional information contact: [email protected]
MIDDLE EAST
In Turkey, excessive heat during late June had little adverse impact on corn, which had not yet reached the tassel stage of development. By early July, the heat abated as corn entered reproduction, though heat has since returned.
Meanwhile, showers over much of Turkey provided supplemental soil moisture for irrigated summer crops. Elsewhere, seasonably dry, hot weather promoted winter grain harvesting.

July 19, 2016 Weekly Weather and Crop Bulletin 37
For additional information contact: [email protected]
NORTHWESTERN AFRICA
Dry, warm weather during June prevailed over much of the region, though unusual late-season showers lingered in eastern-most growing areas. In Morocco, winter grain harvesting neared completion after this season’s severe drought. Likewise, warm, mostly dry weather allowed winter
grain drydown and harvesting to proceed with little delay in Algeria. Winter crops in Algeria were also impacted by drought, especially in western portions of the country. In contrast, showers and thunderstorms (10-65 mm) slowed winter wheat and barley harvesting in Tunisia.

38 Weekly Weather and Crop Bulletin July 19, 2016
For additional information contact: [email protected]
SOUTH ASIA
In June, monsoon showers arrived later than usual across India (up to ten days) and slowly overspread the country during the month. But even with the late onset of the monsoon, most areas received near- to above-normal rainfall, owing to heavy showers (in excess of 100 mm) toward the end of the month. The key exceptions were cotton in Gujarat and rice in the lower Ganges River Basin (both areas received less than half the normal
rainfall). Planting delays were also reported with the late-arriving rainfall. As of June 30, planted area for most major crops was behind last year’s amount. In other parts of the region, rainfall was below normal for rice in Bangladesh and Sri Lanka, but water supplies remained adequate to make up the deficit. Meanwhile, monsoon showers were moving into Pakistan by month’s end, as rice and cotton planting continued.

July 19, 2016 Weekly Weather and Crop Bulletin 39
For additional information contact: [email protected]
EASTERN ASIA
Wet June weather hampered winter wheat harvesting on the North China Plain, while also lowering wheat quality and potentially yields as well. Rainfall averaged over 150 mm (occurring mainly after mid-month) across key wheat areas, nearly twice the normal amount. Above-normal rainfall was also reported in the Yangtze River Basin. Portions of the eastern basin received over 500 mm of rain which caused flooding and
damage to summer crops. Meanwhile, above-normal rainfall was welcomed in northeastern China, benefiting vegetative corn and soybeans. Elsewhere in the region, drier-than-normal weather occurred in most rice areas on the Korean Peninsula, with portions of South Korea experiencing less than half the normal rainfall for the month. Meanwhile, rainfall was near to above normal in Japan, benefiting rice.

40 Weekly Weather and Crop Bulletin July 19, 2016
For additional information contact: [email protected]
SOUTHEAST ASIA
Near- to above-normal June rainfall was reported across Indochina (based on satellite-derived estimates and surface reports), with amounts in excess of 150 mm. The rain benefited wet-season rice growing throughout Thailand, Laos, Cambodia, and southern Vietnam, while also increasing water supplies (for irrigation) that have been nearly depleted from two consecutive years of poor seasonal rain. Similarly,
seasonable rainfall throughout much of the Philippines kept rice and corn well watered, although regions in the north continued to be drier than normal. Meanwhile, oil palm areas in most of Indonesia and Malaysia received near-normal rainfall. However, portions of Sumatra (Indonesia) experienced drier-than-normal conditions, while long-term moisture deficits continued in Malaysia.
July 19, 2016 Weekly Weather and Crop Bulletin 41
For additional information contact: [email protected]
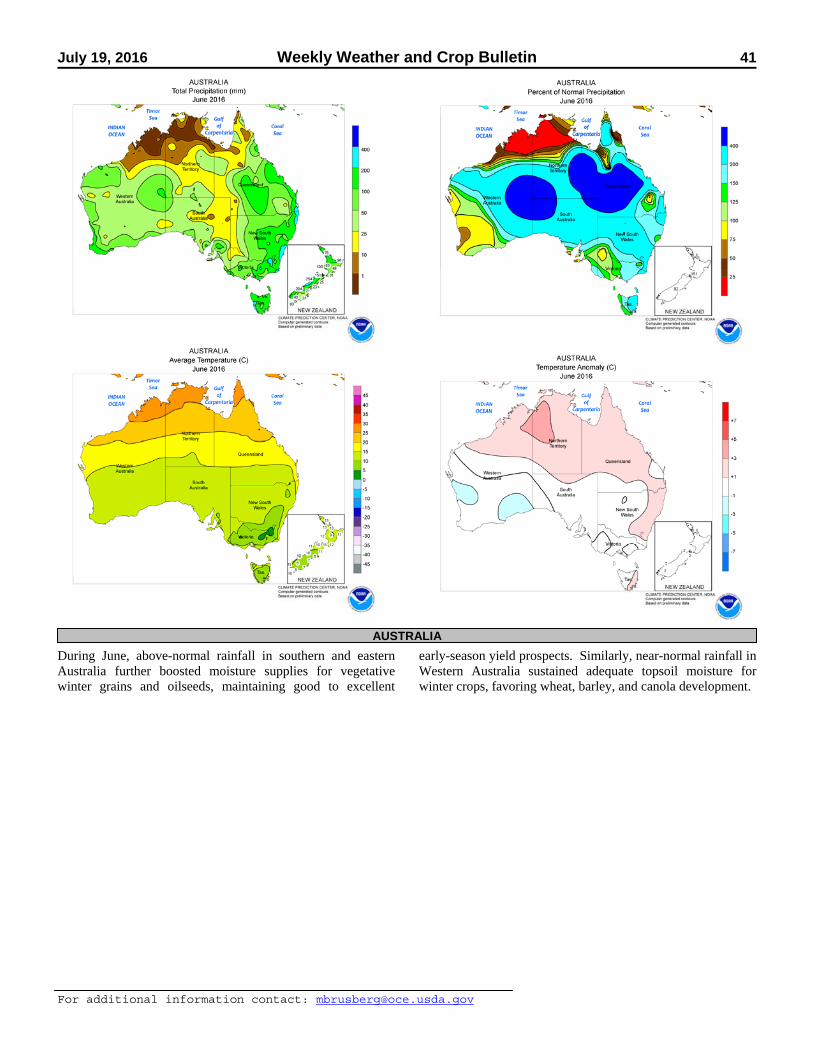
AUSTRALIA
During June, above-normal rainfall in southern and eastern Australia further boosted moisture supplies for vegetative winter grains and oilseeds, maintaining good to excellent
early-season yield prospects. Similarly, near-normal rainfall in Western Australia sustained adequate topsoil moisture for winter crops, favoring wheat, barley, and canola development.

42 Weekly Weather and Crop Bulletin July 19, 2016
For additional information contact: [email protected]
SOUTH AFRICA
In June, mild, showery weather maintained generally favorable conditions for overwintering wheat in key production areas of Western Cape. Monthly rainfall totaled 10 to 50 mm in the main western production areas; higher amounts (locally exceeding 100 mm) in southwestern sections of the province increased long-term moisture reserves for tree and fruit crops. June temperatures were generally seasonable, though patchy frost was possible
toward the end of the month. Elsewhere, showers were infrequent and generally light in the corn belt (notably North West, Free State, and Mpumalanga), allowing harvesting to progress. Mild weather favored overwintering wheat. Mostly dry, unseasonably warm weather promoted sugarcane harvesting in KwaZulu-Natal and eastern Mpumalanga, though showers were recorded in locations closest to the coast.

July 19, 2016 Weekly Weather and Crop Bulletin 43
For additional information contact: [email protected]
ARGENTINA
In June, late-month rain renewed delays in fieldwork, following an extended period of favorable dryness. According to reports emanating from Argentina, soybean harvesting was nearing completion prior to the onset of the showers; corn harvesting continued to lag last year’s pace in spite of nearly 3 weeks of complete dryness in major farming areas of central Argentina (La Pampa, Buenos Aires, and southern sections of Cordoba, Santa Fe, and Entre Rios). Concerns for open-boll cotton were also noted. While the late-month rain
(accumulations exceeding 50 mm in spots, with amounts exceeding 100 mm from eastern Chaco to northern Uruguay) — though lighter than recent events — was untimely for fieldwork, the moisture will ultimately benefit winter grains. June temperatures averaged near to slightly below normal, with the coolest weather relative to normal recorded in the north. Freezing temperatures were recorded as far north as Formosa as seasonal cooling continued, favoring drydown of later-maturing northern row crops.

44 Weekly Weather and Crop Bulletin July 19, 2016
For additional information contact: [email protected]
BRAZIL
An unusual June freeze caused some damage to immature crops in southern Brazil. The unseasonable cold (nighttime lows falling below 0°C) overspread the region from June 6 to 13, with freezes reported in corn and sugarcane areas of southern and western Parana toward the end of the period. However, the cold stayed well south of the main coffee areas (Minas Gerais and Espirito Santos). Showery weather returned to the region during the latter half of June, boosting moisture
for newly-sown winter wheat but disrupting harvesting of sugarcane and corn. Meanwhile, warm, seasonably dry weather dominated much of the Center-West and northeastern interior (Mato Grosso eastward to western Bahia and environs) for most of the month, hastening maturation of second-crop corn and cotton. In contrast, seasonal showers prevailed along the northeastern coast, providing moisture for sugarcane, cocoa, and coffee.

July 19, 2016 Weekly Weather and Crop Bulletin 45
For additional information contact: [email protected]
MEXICO
During June, seasonal showers improved prospects for corn and other rain-fed summer crops. The intensification of rain was particularly welcome in western sections of the southern plateau (Jalisco and Michoacan), where the late start to the rainy season likely resulted in some planting delays. Frequent rain also benefited most agricultural areas along the southern Pacific Coast and in the southeast, including sugarcane in and
around Veracruz. Elsewhere, monsoon showers developed over northwestern watersheds toward the end of the month, signaling the start of the southern rainy season. Showers were more sporadic in nature in the northeast (Coahuila to Tamaulipas), and seasonal warming drove daytime highs into the lower 40s (degrees C), sustaining high moisture reserves for crops and livestock.

46 Weekly Weather and Crop Bulletin July 19, 2016
For additional information contact: [email protected]
CANADIAN PRAIRIES
During June, showers and seasonable warmth maintained overall favorable conditions for vegetative spring crops. Monthly rainfall accumulations totaled between 50 and 100 mm in most areas, though heavier amounts would have been welcome in northern farming areas of Saskatchewan that experienced earlier periods of dryness. Lighter amounts were recorded in southern Alberta, which received above-normal rainfall in May; heavier rain elsewhere in the province helped to alleviate drought that
lingered into the spring planting season. June temperatures averaged 1°C or more above normal in most Prairie farming areas; patchy frost was recorded in traditionally cooler western areas through the middle part of the month, but seasonal warming had reduced the possibility of a late spring freeze by month’s end. Daytime highs briefly reached into the lower 30s (degrees C) across the southern Prairies, otherwise temperatures generally peaked at the middle and upper 20s.
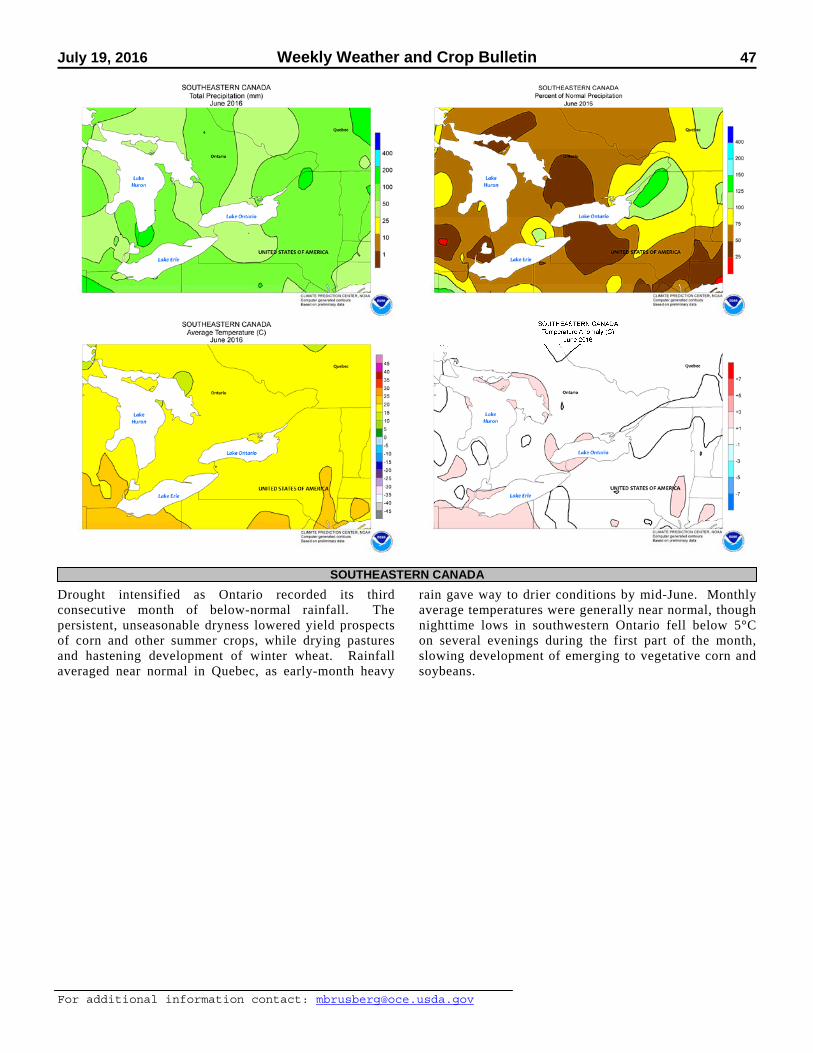
July 19, 2016 Weekly Weather and Crop Bulletin 47
For additional information contact: [email protected]
SOUTHEASTERN CANADA
Drought intensified as Ontario recorded its third consecutive month of below-normal rainfall. The persistent, unseasonable dryness lowered yield prospects of corn and other summer crops, while drying pastures and hastening development of winter wheat. Rainfall averaged near normal in Quebec, as early-month heavy
rain gave way to drier conditions by mid-June. Monthly average temperatures were generally near normal, though nighttime lows in southwestern Ontario fell below 5°C on several evenings during the first part of the month, slowing development of emerging to vegetative corn and soybeans.
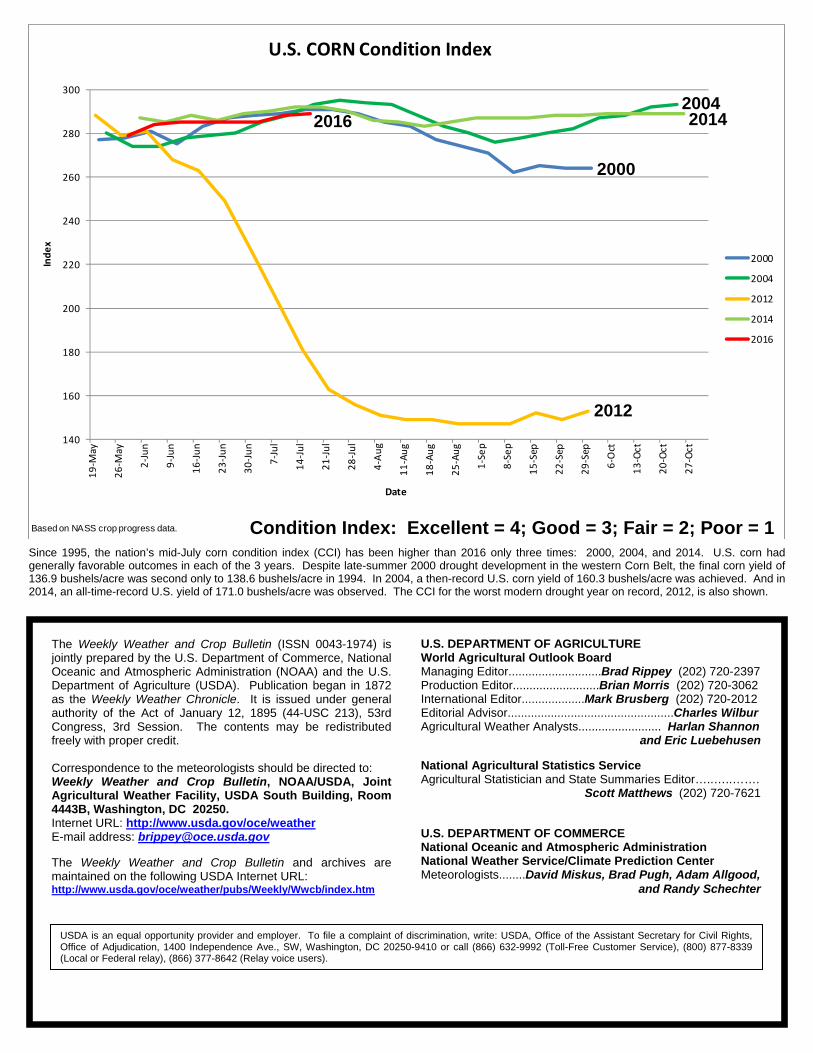
140
160
180
200
220
240
260
280
30019‐M
ay
26‐M
ay
2‐Jun
9‐Jun
16‐Jun
23‐Jun
30‐Jun
7‐Jul
14‐Jul
21‐Jul
28‐Jul
4‐Aug
11‐Aug
18‐Aug
25‐Aug
1‐Sep
8‐Sep
15‐Sep
22‐Sep
29‐Sep
6‐Oct
13‐Oct
20‐Oct
27‐Oct
Index
Date
U.S. CORN Condition Index
2000
2004
2012
2014
2016
Based on NASS crop progress data.
Since 1995, the nation’s mid-July corn condition index (CCI) has been higher than 2016 only three times: 2000, 2004, and 2014. U.S. corn had generally favorable outcomes in each of the 3 years. Despite late-summer 2000 drought development in the western Corn Belt, the final corn yield of 136.9 bushels/acre was second only to 138.6 bushels/acre in 1994. In 2004, a then-record U.S. corn yield of 160.3 bushels/acre was achieved. And in 2014, an all-time-record U.S. yield of 171.0 bushels/acre was observed. The CCI for the worst modern drought year on record, 2012, is also shown.
The Weekly Weather and Crop Bulletin (ISSN 0043-1974) is jointly prepared by the U.S. Department of Commerce, National Oceanic and Atmospheric Administration (NOAA) and the U.S. Department of Agriculture (USDA). Publication began in 1872 as the Weekly Weather Chronicle. It is issued under general authority of the Act of January 12, 1895 (44-USC 213), 53rd Congress, 3rd Session. The contents may be redistributed freely with proper credit. Correspondence to the meteorologists should be directed to: Weekly Weather and Crop Bulletin, NOAA/USDA, Joint Agricultural Weather Facility, USDA South Building, Room 4443B, Washington, DC 20250. Internet URL: http://www.usda.gov/oce/weather E-mail address: [email protected] The Weekly Weather and Crop Bulletin and archives are maintained on the following USDA Internet URL: http://www.usda.gov/oce/weather/pubs/Weekly/Wwcb/index.htm
U.S. DEPARTMENT OF AGRICULTURE World Agricultural Outlook Board Managing Editor............................Brad Rippey (202) 720-2397 Production Editor..........................Brian Morris (202) 720-3062 International Editor...................Mark Brusberg (202) 720-2012 Editorial Advisor..................................................Charles Wilbur Agricultural Weather Analysts......................... Harlan Shannon and Eric Luebehusen
National Agricultural Statistics Service Agricultural Statistician and State Summaries Editor…..…..……. Scott Matthews (202) 720-7621 U.S. DEPARTMENT OF COMMERCE National Oceanic and Atmospheric Administration National Weather Service/Climate Prediction Center Meteorologists........David Miskus, Brad Pugh, Adam Allgood,
and Randy Schechter
USDA is an equal opportunity provider and employer. To file a complaint of discrimination, write: USDA, Office of the Assistant Secretary for Civil Rights, Office of Adjudication, 1400 Independence Ave., SW, Washington, DC 20250-9410 or call (866) 632-9992 (Toll-Free Customer Service), (800) 877-8339 (Local or Federal relay), (866) 377-8642 (Relay voice users).
X
Condition Index: Excellent = 4; Good = 3; Fair = 2; Poor = 1
201620042014
2000
2012