Weekly Market Report: 31st October 4th November, 2016 ... - 2016.11.04-GN... · Cal Bank Ltd Equity...
3
Weekly Market Report: 31 st October – 4 th November, 2016 TRADING HIGHLIGHTS FOR THE WEEK CA LISTED COMPANIES STOCK TICKER ISSUED SHARES ( MIL) MARKET CAP. (GH¢ MIL) YR OPEN PRICE WEEK OPEN PRICE WEEK CLOSE PRICE YTD CHANGE DIV YIELD EPS (GH¢) EARN. YIELD P/E RATIO P/BV AGRO-PROCESSING Benso Oil Palm Plantation BOPP 34.80 83.52 2.50 2.40 2.40 -4.00% 0.81 0.2512 10.46% 10 2.7961 Cocoa Processing Co. Ltd. CPC 2,038.07 40.76 0.02 0.02 0.02 0.00% 0.00 -0.0202 -100.85% -1 n.m Golden Web Ltd GWEB 35.00 0.35 0.01 0.01 0.01 0.00% 0.00 -0.0073 -72.50% -1 n.m AVERAGE -1.33% 27.15% 7.46% -54.30% 2.67% 0.9320 DISTRIBUTION & TRADING Mechanical Llyod Co. Ltd. MLC 8.64 1.38 0.19 0.16 0.16 -15.79% 0.00 -0.0369 -23.03% -4 0.2841 Produce Buying Company Ltd. PBC 480.00 28.80 0.10 0.06 0.06 -40.00% 7.33 -0.0117 -19.43% -5 2.1588 AVERAGE -27.89% 3.67 -0.0243 -21.23% -4.74 1.2214 BANKING & FINANCE Cal Bank Ltd CAL 548.26 466.02 1.00 0.80 0.85 -15.00% 5.25 0.2512 29.55% 3 1.4273 Ecobank Ghana Ltd. EBG 293.23 1,999.82 7.01 6.85 6.82 -2.71% 5.67 1.0689 15.67% 6 3.0659 Ecobank Transnational Inc. ETI 21,313.96 2,344.54 0.27 0.11 0.11 -59.26% 0.00 0.0729 66.23% 1.51 0.9277 Enterprise Group Ltd. EGL 128.52 308.46 2.40 2.38 2.40 0.00% 1.43 0.1294 5.39% 19 0.8766 Ghana Commercial Bank Ltd. GCB 265.00 927.50 3.79 3.50 3.50 -7.65% 3.61 1.0307 29.45% 3 3.4412 HFC Bank (Ghana) Ltd. HFC 296.80 237.44 0.90 0.80 0.80 -11.11% 2.59 0.3005 37.56% 3 0.9769 Mega Africa Capital Ltd MAC 8.64 51.85 6.00 6.00 6.00 0.00% 0.00 2.1422 35.70% 3 Standard Chartered Bank Gh. Ltd. SCB 115.51 1,594.00 16.30 14.00 13.80 -15.34% 5.61 2.2809 16.53% 6 5.9395 SIC Insurance Company Ltd. SIC 195.65 27.39 0.14 0.14 0.14 0.00% 0.00 0.0295 21.08% 5 0.8559 Standard Chartered Bank Pref. Shares SCB PREF 17.48 13.11 0.71 0.75 0.75 5.63% 0.00 0.0000 0.00% SocieteGenerale SOGEGH 333.89 227.05 0.80 0.70 0.68 -15.00% 6.00 0.1959 28.80% 3 1.6123 Trust Bank Ltd. (The Gambia) TBL 200.00 52.00 0.37 0.26 0.26 -29.73% 0.91 0.0048 1.85% 54 33.2844 UT Bank Ltd UTB 456.31 13.69 0.10 0.23 0.03 -70.00% 9.09 0.0258 85.93% 1 1.7409 AVERAGE -18.35% 3.35 0.4492 28% 8.790 4.5124 FOOD & BEVERAGES Guinness Ghana Breweries Ltd. GGBL 211.34 357.16 1.99 1.69 1.69 -15.08% 0.00 -0.1265 -7.49% -13 4.5934 Fan Milk Ltd. FML 116.21 1,141.16 7.35 9.81 9.82 33.61% 1.71 0.1177 1.20% 83 10.5087 AVERAGE 9.27% 0.86 -0.0044 -3% 35.039 7.5510 ICT Clydestone (Ghana) Ltd. CLYD 34.00 1.02 0.03 0.03 0.03 0.00% 0.00 0.0021 7.00% 14 3.8401 Transaction Solutions (Ghana) Ltd. TRANSOL 80.00 2.40 0.03 0.03 0.03 0.00% 0.00 0.0073 24.43% 4 nm AVERAGE 0.00% 0.00 0.0047 16% 1.9201 MANUFACTURING Aluworks Limited ALW 236.69 33.14 0.14 0.14 0.14 0.00% 0.00 -0.0215 -15.37% -7 0.2938 Pioneer Kitchenware Ltd. PKL 33.34 1.67 0.05 0.05 0.05 0.00% 0.00 -0.0086 -17.24% -6 6.1854 PZ Cussons Ghana Ltd. PZ 168.00 36.96 0.34 0.22 0.22 -35.29% 7.53 -0.0100 -4.55% -22 1.3421 Unilever Ghana Ltd. UNIL 62.50 529.38 8.50 8.47 8.47 -0.35% 2.39 -0.2776 -3.28% -31 24.0415 -8.91% 2.48 -0.0794 -10% -13.127 7.9657 MINING AngloGold Ashanti Ltd. AGA 402.61 14,896.73 37.00 37.00 37.00 0.00% 0.00 -0.0639 -0.17% -579 1.2787 AngloGold Ashanti Depository Shares AADS 0.98 50.90 0.52 0.52 0.52 0.00% 0.00 Golden Star Resources Ltd. GSR 255.43 498.08 1.99 1.95 1.95 -2.01% 0.00 0.0427 2.19% 46 0.8382 Tullow Oil Plc TLW 906.96 24,397.33 28.00 26.90 26.90 -3.93% 0.00 -0.2518 -0.94% -107 1.9764 AVERAGE -1.48% 0.00 -0.0683 0% 14 1.0233 PHARMACEUTICALS Ayrton Drug Manufacturing Ltd. AYRTN 215.00 21.50 0.18 0.10 0.10 -44.44% 0.00 0.0006 0.65% 154 1.8458 Starwin Products Ltd. SPL 259.65 5.19 0.04 0.02 0.02 -50.00% 0.00 0.0043 21.28% 5 1.8687 AVERAGE -47.22% 0.00 0.00 11% 79.431 1.8573 PRINTING & PUBLISHING African Champion Ltd ACI 36.50 0.37 0.02 0.01 0.01 -50.00% 0.00 -0.0680 -680.00% 0 0.3923 Camelot Ghana Ltd. CMLT 6.54 0.79 0.12 0.12 0.12 0.00% 5.00 0.0104 8.67% 12 0.6715 Sam Woode Ltd. SWL 21.83 0.87 0.04 0.04 0.04 0.00% 10.00 0.0071 17.78% 6 1.0080 AVERAGE -16.67% 5.00 -0.0168 -218% 3.8432 0.6906 PETROLEUM Ghana Oil Company Limited GOIL 252.22 287.53 1.40 1.17 1.14 -18.57% 1.52 0.1056 9.26% 11 4.2974 Total Petroleum Ghana Ltd. TOTAL 111.87 223.75 5.10 2.04 2.00 -60.78% 1.61 0.2740 13.70% 7 4.7106 AVERAGE -39.68% 1.5693 0.18982 11% 9.047 4.5040 EXCHANGE TRADED FUNDS NewGold ETF GLD 0.40 15.52 39.00 38.80 38.80 -0.51% na AVERAGE -6.68% WEEKLY MARKET HIGHLIGHTS Market Highlights Economy Week Open Week Close Change INFLATION (%) 17.20% 17.20% 0.00% BOG POLICY RATE (%) 26.00% 26.00% 0.00% INTERBANK INTEREST RATE (%) 25.51% 25.51% 0.00% Stock Market Week Open Week Close Change GCFM-ALL SHARE INDEX LEVEL 1,507.25 1,505.25 -2.00 GCFM-ALL SHARE INDEX YTD (%) -22.45% -22.55% -0.10% GCFM-INDEX DOLLAR EQUIVALENT 601.96 601.18 -0.79 GCFM-INDEX DOLLAR EQUIVALENT YTD (%) -25.76% -25.86% -0.10% GSE-COMPOSITE INDEX LEVEL 1,710.67 1,706.19 -4.48 GSE-COMPOSITE INDEX LEVEL YTD (%) -14.25% -14.47% -0.22% GSE-FINANCIAL STOCKS INDEX 1,608.56 1,605.94 -2.62 GSE-FINANCIAL STOCKS INDEX YTD (%) -16.66% -16.79% -0.14% GSE-COMP. INDEX MARKET CAP.(GH¢ Million) 51,884.08 51,858.61 -25.47 GSE-COMP. INDEX MARKET CAP.(US$ Million) 13,653.71 13,647.00 -6.70 VOLUME TRADED 2,120,407 1,744,023 -376,384.00 VALUE TRADED (GH¢) 245,959.66 795,352.19 549,392.53 MARKET MOVERS GAINERS Equity Wk Open Wk Close Wk Change Wk Change % CAL 0.80 0.85 0.05 6.25% EGL 2.38 2.40 0.02 0.84% FML 9.81 9.82 0.01 0.10% MARKET MOVERS LOSERS Equity Wk Open Wk Close Wk Change Wk Change % EGH 6.85 6.82 (0.03) -0.44% GOIL 1.17 1.14 (0.03) -2.56% SCB 14.00 13.80 (0.20) -1.43% SOGEGH 0.70 0.68 (0.02) -2.86% TOTAL 2.04 2.00 (0.04) -1.96% 2010 2011 2012 2013 2014 2015 2016 GSE CI 28.41% -3.30% 22.46% 78.88% 6.57% -11.77% -14.47% GSE FSI 0.00% -14.32% 18.44% 72.00% 27.45% -13.98% -16.79% Fig1: YTD trends for the past six years as at April 11 every year. Some dates might not necessarily fall on the 14th. In such cases, the nearest date applies Fig 2: Indicates the daily growth trend in FSI and CI from Jan 2016 -20.00% 0.00% 20.00% 40.00% 60.00% 80.00% 2010 2011 2012 2013 2014 2015 2016 GSE CI GSE FSI GSE FSI -20.00% -15.00% -10.00% -5.00% 0.00% 5.00% CI YTD -30.00% -25.00% -20.00% -15.00% -10.00% -5.00% 0.00% 5.00% GCFM-STOCK INDEX YTD RETURNS GH¢ Index US$ Index ECONOMY Average interest on deposits decrease to 12.2% The Bank of Ghana’s latest Average Interests (IA) on deposits report released shows a decrease in the average minimum interes ts to be paid annually on deposits of customers’ funds logged at commercial banks in the country between May and September 2016. Fi gures from the central bank indicates a decrease from 12.3 percent to 12.2 percent. According to the APR – AI report indigenous bank UT Bank offers the highest interest on deposits. This means that if customers of a bank deposit money at UT Bank, they were likely to receive 15.8 percent as interest annually on the deposit with Standard Chartered Bank occupying the bottom of 24th position, offering the lowest interest of 4.4 percent on deposits. The AI is the true Average interest paid on deposits by banks on deposits over a period. In second place is South African bank, Stanbic Bank offering 14.7 percent followed by the bank of the year 2015 Fidelity Bank offering 14.5 percent on deposits while First National Bank offers 14.4 percent, occupying the forth place. Capital Bank, Access Bank and Ecobank all occupy the firth place are offering 14.3 percent interest on deposits. GT Bank offers 14.1 percent interests to customers ‘deposits. Fir st Atlantic Bank, GN Bank all offer 14.0 percent while Unibank, Bank of Baroda, Sovereign Bank and UBA all offer 13.8, 13.7, 13.3 and 12.8 percents respectively. In addition, Bank of Africa and Barclays are all offering the same interests on deposits of 13.4 percent occupying the 10th position. Also occupying the 13th, 14th, 15th, and 16th positions were Sahel Sahara 12.6 percent, HFC 12.4 percent, and Energy Bank 12.1percent while SG Bank and The Royal Bank all offers 11.0 percent. Cal Bank’s average interests paid on deposits is 10.7 percent at 17th position, while FBN Ghana offers 10.4 percent, NIB 10.0 percent and GCB Bank 9.8 percent occupying 18th, 19th and 20th positions respectively.
Transcript of Weekly Market Report: 31st October 4th November, 2016 ... - 2016.11.04-GN... · Cal Bank Ltd Equity...

Weekly Market Report: 31st October – 4th November, 2016
TRADING HIGHLIGHTS FOR THE WEEK CA
LISTED COMPANIES STOCK
TICKER
ISSUED
SHARES
( MIL)
MARKET
CAP.
(GH¢
MIL)
YR
OPEN
PRICE
WEEK
OPEN
PRICE
WEEK
CLOSE
PRICE
YTD
CHANGE
DIV
YIELD
EPS
(GH¢)
EARN.
YIELD
P/E
RATIO P/BV
AGRO-PROCESSING
Benso Oil Palm Plantation BOPP 34.80 83.52 2.50 2.40 2.40 -4.00% 0.81 0.2512 10.46% 10 2.7961
Cocoa Processing Co. Ltd. CPC 2,038.07 40.76 0.02 0.02 0.02 0.00% 0.00 -0.0202 -100.85% -1 n.m
Golden Web Ltd GWEB 35.00 0.35 0.01 0.01 0.01 0.00% 0.00 -0.0073 -72.50% -1 n.m
AVERAGE -1.33% 27.15% 7.46% -54.30% 2.67% 0.9320
DISTRIBUTION & TRADING
Mechanical Llyod Co. Ltd. MLC 8.64 1.38 0.19 0.16 0.16 -15.79% 0.00 -0.0369 -23.03% -4 0.2841
Produce Buying Company Ltd. PBC 480.00 28.80 0.10 0.06 0.06 -40.00% 7.33 -0.0117 -19.43% -5 2.1588
AVERAGE -27.89% 3.67 -0.0243 -21.23% -4.74 1.2214
BANKING & FINANCE
Cal Bank Ltd CAL 548.26 466.02 1.00 0.80 0.85 -15.00% 5.25 0.2512 29.55% 3 1.4273
Ecobank Ghana Ltd. EBG 293.23 1,999.82 7.01 6.85 6.82 -2.71% 5.67 1.0689 15.67% 6 3.0659
Ecobank Transnational Inc. ETI 21,313.96 2,344.54 0.27 0.11 0.11 -59.26% 0.00 0.0729 66.23% 1.51 0.9277
Enterprise Group Ltd. EGL 128.52 308.46 2.40 2.38 2.40 0.00% 1.43 0.1294 5.39% 19 0.8766
Ghana Commercial Bank Ltd. GCB 265.00 927.50 3.79 3.50 3.50 -7.65% 3.61 1.0307 29.45% 3 3.4412
HFC Bank (Ghana) Ltd. HFC 296.80 237.44 0.90 0.80 0.80 -11.11% 2.59 0.3005 37.56% 3 0.9769
Mega Africa Capital Ltd MAC 8.64 51.85 6.00 6.00 6.00 0.00% 0.00 2.1422 35.70% 3
Standard Chartered Bank Gh. Ltd. SCB 115.51 1,594.00 16.30 14.00 13.80 -15.34% 5.61 2.2809 16.53% 6 5.9395
SIC Insurance Company Ltd. SIC 195.65 27.39 0.14 0.14 0.14 0.00% 0.00 0.0295 21.08% 5 0.8559
Standard Chartered Bank Pref. Shares SCB PREF 17.48 13.11 0.71 0.75 0.75 5.63% 0.00 0.0000 0.00%
SocieteGenerale SOGEGH 333.89 227.05 0.80 0.70 0.68 -15.00% 6.00 0.1959 28.80% 3 1.6123
Trust Bank Ltd. (The Gambia) TBL 200.00 52.00 0.37 0.26 0.26 -29.73% 0.91 0.0048 1.85% 54 33.2844
UT Bank Ltd UTB 456.31 13.69 0.10 0.23 0.03 -70.00% 9.09 0.0258 85.93% 1 1.7409
AVERAGE -18.35% 3.35 0.4492 28% 8.790 4.5124
FOOD & BEVERAGES
Guinness Ghana Breweries Ltd. GGBL 211.34 357.16 1.99 1.69 1.69 -15.08% 0.00 -0.1265 -7.49% -13 4.5934
Fan Milk Ltd. FML 116.21 1,141.16 7.35 9.81 9.82 33.61% 1.71 0.1177 1.20% 83 10.5087
AVERAGE 9.27% 0.86 -0.0044 -3% 35.039 7.5510
ICT
Clydestone (Ghana) Ltd. CLYD 34.00 1.02 0.03 0.03 0.03 0.00% 0.00 0.0021 7.00% 14 3.8401
Transaction Solutions (Ghana) Ltd. TRANSOL 80.00 2.40 0.03 0.03 0.03 0.00% 0.00 0.0073 24.43% 4 nm
AVERAGE 0.00% 0.00 0.0047 16% 1.9201
MANUFACTURING
Aluworks Limited ALW 236.69 33.14 0.14 0.14 0.14 0.00% 0.00 -0.0215 -15.37% -7 0.2938
Pioneer Kitchenware Ltd. PKL 33.34 1.67 0.05 0.05 0.05 0.00% 0.00 -0.0086 -17.24% -6 6.1854
PZ Cussons Ghana Ltd. PZ 168.00 36.96 0.34 0.22 0.22 -35.29% 7.53 -0.0100 -4.55% -22 1.3421
Unilever Ghana Ltd. UNIL 62.50 529.38 8.50 8.47 8.47 -0.35% 2.39 -0.2776 -3.28% -31 24.0415
-8.91% 2.48 -0.0794 -10% -13.127 7.9657
MINING
AngloGold Ashanti Ltd. AGA 402.61 14,896.73 37.00 37.00 37.00 0.00% 0.00 -0.0639 -0.17% -579 1.2787 AngloGold Ashanti Depository
Shares AADS 0.98 50.90 0.52 0.52 0.52 0.00% 0.00
Golden Star Resources Ltd. GSR 255.43 498.08 1.99 1.95 1.95 -2.01% 0.00 0.0427 2.19% 46 0.8382
Tullow Oil Plc TLW 906.96 24,397.33 28.00 26.90 26.90 -3.93% 0.00 -0.2518 -0.94% -107 1.9764
AVERAGE -1.48% 0.00 -0.0683 0% 14 1.0233
PHARMACEUTICALS
Ayrton Drug Manufacturing Ltd. AYRTN 215.00 21.50 0.18 0.10 0.10 -44.44% 0.00 0.0006 0.65% 154 1.8458
Starwin Products Ltd. SPL 259.65 5.19 0.04 0.02 0.02 -50.00% 0.00 0.0043 21.28% 5 1.8687
AVERAGE -47.22% 0.00 0.00 11% 79.431 1.8573
PRINTING & PUBLISHING
African Champion Ltd ACI 36.50 0.37 0.02 0.01 0.01 -50.00% 0.00 -0.0680 -680.00% 0 0.3923
Camelot Ghana Ltd. CMLT 6.54 0.79 0.12 0.12 0.12 0.00% 5.00 0.0104 8.67% 12 0.6715
Sam Woode Ltd. SWL 21.83 0.87 0.04 0.04 0.04 0.00% 10.00 0.0071 17.78% 6 1.0080
AVERAGE -16.67% 5.00 -0.0168 -218% 3.8432 0.6906
PETROLEUM
Ghana Oil Company Limited GOIL 252.22 287.53 1.40 1.17 1.14 -18.57% 1.52 0.1056 9.26% 11 4.2974
Total Petroleum Ghana Ltd. TOTAL 111.87 223.75 5.10 2.04 2.00 -60.78% 1.61 0.2740 13.70% 7 4.7106
AVERAGE -39.68% 1.5693 0.18982 11% 9.047 4.5040
EXCHANGE TRADED FUNDS
NewGold ETF GLD 0.40 15.52 39.00 38.80 38.80 -0.51%
na
AVERAGE -6.68%
ELI
STED COMPANIES
WEEKLY MARKET HIGHLIGHTS
Market Highlights
Economy Week Open Week Close Change
INFLATION (%) 17.20% 17.20% 0.00%
BOG POLICY RATE (%) 26.00% 26.00% 0.00%
INTERBANK INTEREST RATE (%) 25.51% 25.51% 0.00%
Stock Market Week Open Week Close Change
GCFM-ALL SHARE INDEX LEVEL 1,507.25 1,505.25 -2.00
GCFM-ALL SHARE INDEX YTD (%) -22.45% -22.55% -0.10%
GCFM-INDEX DOLLAR EQUIVALENT 601.96 601.18 -0.79
GCFM-INDEX DOLLAR EQUIVALENT YTD (%) -25.76% -25.86% -0.10%
GSE-COMPOSITE INDEX LEVEL 1,710.67 1,706.19 -4.48
GSE-COMPOSITE INDEX LEVEL YTD (%) -14.25% -14.47% -0.22%
GSE-FINANCIAL STOCKS INDEX 1,608.56 1,605.94 -2.62
GSE-FINANCIAL STOCKS INDEX YTD (%) -16.66% -16.79% -0.14%
GSE-COMP. INDEX MARKET CAP.(GH¢ Million) 51,884.08 51,858.61 -25.47
GSE-COMP. INDEX MARKET CAP.(US$ Million) 13,653.71 13,647.00 -6.70
VOLUME TRADED 2,120,407 1,744,023 -376,384.00
VALUE TRADED (GH¢) 245,959.66 795,352.19 549,392.53
MARKET MOVERS
GAINERS
Equity Wk Open Wk Close Wk Change Wk Change %
CAL 0.80 0.85 0.05 6.25%
EGL 2.38 2.40 0.02 0.84%
FML 9.81 9.82 0.01 0.10%
MARKET MOVERS
LOSERS
Equity Wk Open Wk Close Wk Change Wk Change %
EGH 6.85 6.82 (0.03) -0.44%
GOIL 1.17 1.14 (0.03) -2.56%
SCB 14.00 13.80 (0.20) -1.43%
SOGEGH 0.70 0.68 (0.02) -2.86%
TOTAL 2.04 2.00 (0.04) -1.96%
2010 2011 2012 2013 2014 2015 2016
GSE CI 28.41% -3.30% 22.46% 78.88% 6.57% -11.77% -14.47%
GSE FSI 0.00% -14.32% 18.44% 72.00% 27.45% -13.98% -16.79%
Fig1: YTD trends for the past six years as at April 11 every year. Some dates might not necessarily fall on
the 14th. In such cases, the nearest date applies
Fig 2: Indicates the daily growth trend in FSI and CI from Jan 2016
-20.00%
0.00%
20.00%
40.00%
60.00%
80.00%
2010 2011 2012 2013 2014 2015 2016
GSE CI GSE FSI
GSE FSI
-20.00%
-15.00%
-10.00%
-5.00%
0.00%
5.00%
CI YTD
-30.00%
-25.00%
-20.00%
-15.00%
-10.00%
-5.00%
0.00%
5.00% GCFM-STOCK INDEX YTD RETURNS
GH¢ Index US$ Index
ECONOMY
Average interest on deposits decrease to 12.2% The Bank of Ghana’s latest Average Interests (IA) on deposits report released shows a decrease in the average minimum interests to be
paid annually on deposits of customers’ funds logged at commercial banks in the country between May and September 2016. Figures from
the central bank indicates a decrease from 12.3 percent to 12.2 percent. According to the APR – AI report indigenous bank UT Bank offers
the highest interest on deposits. This means that if customers of a bank deposit money at UT Bank, they were likely to receive 15.8
percent as interest annually on the deposit with Standard Chartered Bank occupying the bottom of 24th position, offering the lowest
interest of 4.4 percent on deposits. The AI is the true Average interest paid on deposits by banks on deposits over a period. In second place
is South African bank, Stanbic Bank offering 14.7 percent followed by the bank of the year 2015 Fidelity Bank offering 14.5 percent on
deposits while First National Bank offers 14.4 percent, occupying the forth place. Capital Bank, Access Bank and Ecobank all occupy the
firth place are offering 14.3 percent interest on deposits. GT Bank offers 14.1 percent interests to customers ‘deposits. First Atlantic Bank,
GN Bank all offer 14.0 percent while Unibank, Bank of Baroda, Sovereign Bank and UBA all offer 13.8, 13.7, 13.3 and 12.8 percents
respectively. In addition, Bank of Africa and Barclays are all offering the same interests on deposits of 13.4 percent occupying the 10th
position. Also occupying the 13th, 14th, 15th, and 16th positions were Sahel Sahara 12.6 percent, HFC 12.4 percent, and Energy Bank
12.1percent while SG Bank and The Royal Bank all offers 11.0 percent. Cal Bank’s average interests paid on deposits is 10.7 percent at 17th
position, while FBN Ghana offers 10.4 percent, NIB 10.0 percent and GCB Bank 9.8 percent occupying 18th, 19th and 20th positions
respectively.

MAR
CURRENCY PERFORMANCE The Cedi lost marginally to the Pound and the Euro but stabilized against the Dollar at week close. The local currency exchanged
at a mid-rate of GHS 3.9643 to the USD, GHS 4.9674 to the GBP and GHS 4.4069 to the EURO as at week close. GN Market
Analysts posit that, the Cedi is poised to exhibit some stability on the forex market in the short-term.
The GCFM Cedi index, a measure of the holistic performance of the Cedi on the interbank market now records a year-to-date
depreciation of 2.12% gaining at an average daily rate of 1.59percent for the week under review.
MARKET NEWS
Assets under private pension funds hit GH¢6.4bn
Total assets under the management of private pension funds have reached GH¢6.4billion as at September this year, Baba Jamal,
Deputy Minister of Employment and Labour Relations has disclosed. The assets under management by the private pension funds
indicates a substantial potential of the pension market, which the fund managers want to capitalize on to boost the prosperity of
workers and to deepen the financial services sector in the country. However, that potential is currently being held back, with a
large portion of workers contribution held in temporary accounts held at the Bank of Ghana. Additionally, a large portion of the
workforce operates in the informal sector, thereby operating outside of the current pension system. According to Mr. Baba Jamal,
about GH¢2.6billion of the assets of private pension funds are currently held in temporary pension funds. Mr. Jamal added that
GH¢356 million has also been transferred to 74 schemes, consisting of 25 Master Trust Schemes and 49 employer-sponsored
schemes representing 4,139 employers and 163,595 employees. He made these comments during the inauguration of the National
Pensions Regulatory Authority (NPRA) Northern Regional zonal office, in Tamale. The Tamale branch is intended to serve the
three northern regions in a bid to rope in more workers and employers onto the various pension schemes.
STOCK MARKET PERFORMANCE
Trading activity in terms of volumes on the stock market decreased by 17.75% in the week under review as volumes of shares
traded scaled down by 376,384. Further, the total values of shares traded increased to GHS 795,352.19 representing 223.37%
appreciation week on week. There were 3 gainers and 5 losers at week-close.
Comparative analyses on CAL bank’s latest financial performance indicate that the bank managed to achieve revenue growth for
the nine months in 2016. The financial performance of the listed bank reported that Interest Income grew by 30.23% to GHS
428,482,000. Total Income reported indicated a marginal increase of 1.62% to GHS 289,249,000.
Despite the growth in revenue, the bank reported a dip in bottom line profits. Profits after Tax fell sharply by 23.20% to GHS
87,745,000 for the nine months in 2016. High credit loss expenses and high operating expenses were the main factors behind the
fall in the bottom line of CAL Bank. Credit loss expenses rose by 92.60% to GHS 33,590,000. Operating expenses incurred by
the bank also went up by 16.99% to GHS 11,697,000 for the nine month period. Net Trading Income also plummeted in value
over the period, falling by 55.42% to GHS 26,147,000. For the nine month period, Earnings per Share [EPS] unsurprisingly went
down from GHS 0.2084 in 2015 to GHS 0.1600 in 2016.
Return on Assets [ROA] also fell from 3.78% in 2015 to 2.75% for the same period in 2016. Return on Equity [ROE] also fell to
16.24% in 2016 from 24.72% same period in 2015. Non Performing Loans [NPL] Ratio increased by 8.4% over the period;
below an industry average of 19.1% [in July 2016]. Capital Adequacy Ratio [CAR] also went up marginally to 21.10% above an
industry average of 16.7% [in July].
GN Analysts posit that the bank’s impressive ability to shield its loans portfolio from credit losses coupled with its increased
ability to withstand unexpected losses and shocks could open up an avenue for more growth in future revenue. The dip in profits
however could possibly cause a short term dip in share performance. The high liquidity of CAL shares on the bourse however
could cushion the negative effects of the dip in fundamentals in the short/ medium term causing CAL to remain an attractive
share for short term capital gains.
Analyses on Ecobank’s latest financial performance indicate that the bank managed to achieve revenue growth for the nine
months in 2016. The financial performance of the listed bank reported that Interest Income grew by 24.30% to GHS 729,774,000.
Total Income reported indicated an increase of 11.43% to GHS 826,717,000.
Despite the growth in revenue, the bank reported a dip in bottom line profits. Profit after Tax fell marginally by 4.81% to GHS
273,768,000 for the nine months in 2016. High credit loss expenses and high operating expenses were the main factors behind the
fall in the bottom line of Ecobank for the period. Credit loss expenses rose marginally by 9.46% to GHS 44,400,000. Operating
expenses incurred by the bank also went up by 30.10% to GHS 393,417,000 for the nine month period.
Earnings per Share [EPS] unsurprisingly went down from GHS 1.31 in 2015 to GHS 1.24 in 2016. Return on Assets [ROA] also
fell from 4.49% for the nine months in 2015 to 3.52% for the same period in 2016. Return on Equity [ROE] also fell marginally
to 30.11% in 2016; from 34.25% same period in 2015. Non Performing Loans [NPL] Ratio also increased to 18.30% over the
period below an industry average of 19.1% [recorded in July 2016]. Capital Adequacy Ratio [CAR] rather fell marginally to
14.86% which is below the industry average of 16.7% [recorded in July].
GN Analysts posit that the dwindling ability in shielding the bank’s loans portfolio from credit losses coupled with its poor ability
to withstand unexpected losses and shocks could lead to investors shying away from buying into EGH shares for the long term.
The dip in profits could also cause a slight dip in share performance. Notwithstanding, the shares of EGH could offer an
opportunity to most retail investors who seek a short to medium term investment capital gains.
Stock Market Outlook
An analytical outlook into 2016 pictures YTD key market indices closing the year in negatives but relatively better than 2015.
Commodity-based stocks are expected to follow in a downward trajectory and most financial stocks may fail again to drive
returns on the market but may record lesser price volatilities as compared to 2015.
Average Exchange rates
Currency Market Week Open Week Close Change
GCS-CEDI INDEX LEVEL 351.25 354.89 3.64
USDGHS 3.9643 3.9643 0.0000
GBPGHS 4.8184 4.9674 0.1490
EURGHS 4.3345 4.4069 0.0724
GHSXOF 151.34 148.85 -2.4850
Fig 4: The level of the GC-Cedi Index from Jan 2, 2015 to September 4, 2015. The GC CEDI INDEX is
calculated as a geometric weighted average of changes in the four currency rates against the cedi at the Inter-
bank market, relative to a base of 100, set on 26th July 2007, when the Bank of Ghana redenominated the
national currency. The GC-Cedi Index is an inverted index which means a positive YTD change indicates
depreciation whiles a negative YTD change signifies an appreciation by the cedi.
Currency Buying Selling Midrate Prev. Wk Midrate Change YTD
USDGHS 3.9623 3.9662 3.9643 3.9643 0.0000 4.46% GBPGHS 4.9648 4.9700 4.9674 4.8184 0.1490 -11.56%
EURGHS 4.4061 4.4076 4.4069 4.3345 0.0724 6.65%
GHSXOF 148.82 148.88 148.8500 151.3350 -2.4850 -6.24%
Fig 5: Year-to-date Depreciation of Cedi against the Dollar, Pound and the Euro
Money Market Week Close Prev Week
Close Change
91 DAY T-BILL RATE (%) 22.54% 22.73% -0.19%
182 DAY BILL (%) 23.61% 23.99% -0.38%
1 YEAR NOTE (%) 23.50% 23.50% 0.00%
2 YEAR FXR NOTE (%) 24.00% 24.00% 0.00%
Interest rate
Dates 91 Days 182 days 1yr Note 2yr Note
08-Jan-16 22.79% 24.36% 23.00% 24.25%
15-Jan-16 22.78% 24.65% 23.00% 23.00%
22-Jan-16 22.69% 24.38% 23.00% 23.00%
29-Jan-16 22.65% 24.45% 23.00% 23.00%
05-Feb-16 22.65% 24.19% 23.00% 23.00%
12-Feb-16 22.75% 24.62% 23.00% 24.05%
19-Feb-16 22.64% 24.57% 23.00% 24.05%
26-Feb-16 22.68% 24.61% 23.00% 24.05%
04-Mar-16 22.61% 24.54% 23.00% 24.05%
11-Mar-16 22.51% 24.65% 23.00% 24.05%
18-Mar-16 22.61% 24.63% 23.00% 24.25%
24-Mar-16 22.72% 24.63% 23.00% 24.25%
01-Apr-16 22.66% 24.63% 23.00% 24.25%
08-Apr-16 22.68% 24.56% 23.00% 24.25%
15-Apr-16 22.77% 24.44% 23.00% 24.05%
24-Jun-16 22.82% 24.52% 23.00% 24.25%
30-Jun-16 22.79% 24.60% 23.00% 24.25%
08-Jul-16 22.79% 24.62% 23.00% 24.25%
15-Jul-16 22.78% 24.68% 24.00% 24.25%
22-Jul-16 22.71% 24.63% 23.00% 24.25%
29-Jul-16 22.80% 24.66% 23.00% 24.25%
05-Aug-16 22.80% 24.66% 23.00% 24.25%
12-Aug-16 22.84% 24.69% 23.00% 24.50%
19-Aug-16 22.84% 24.67% 23.50% 24.50%
26-Aug-16 22.85% 24.69% 23.50% 24.50%
02-Sep-16 22.87% 24.71% 23.50% 24.50%
09-Sep-16 22.87% 24.69% 23.50% 24.50%
16-Sep-16 22.86% 24.70% 23.50% 24.00%
23-Sep-16 22.87% 24.69% 23.50% 24.00%
30-Sep-16 22.87% 24.70% 23.50% 24.50%
07-Oct-16 22.87% 24.69% 23.25% 24.50%
14-Oct-16 22.85% 24.54% 23.50% 24.00%
21-Oct-16 22.81% 24.45% 23.50% 24.00%
28-Oct-16 22.73% 23.99% 23.50% 24.00%
04-Nov-16 22.54% 23.61% 23.50% 24.00%
160.00
210.00
260.00
310.00
360.00
410.00
21.00%
22.00%
23.00%
24.00%
25.00%
91 Days
182 days
1yr Note
2yr Note
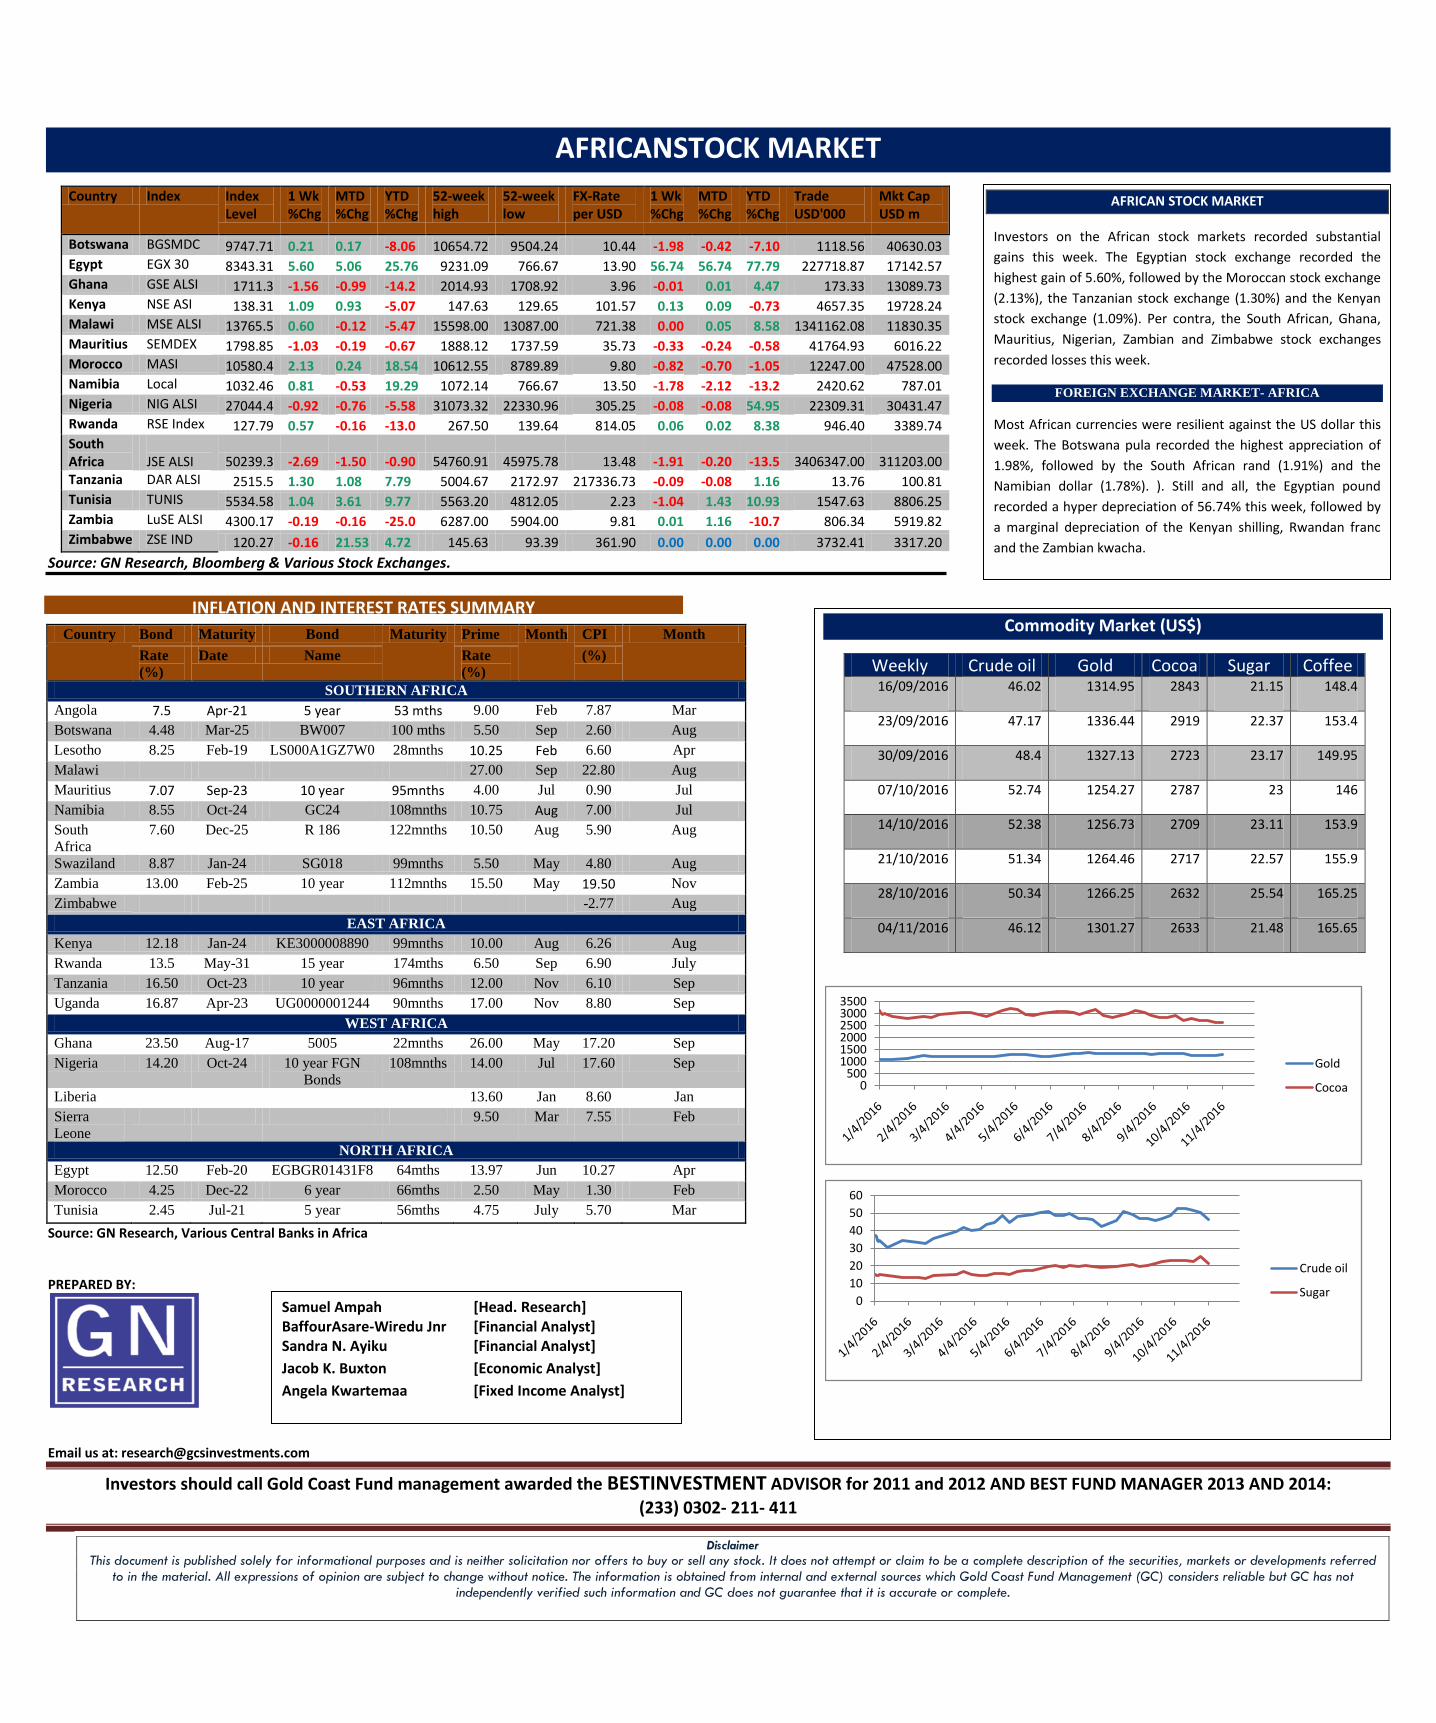
AFRICANSTOCK MARKET
Country Index Index Level
1 Wk %Chg
MTD %Chg
YTD %Chg
52-week high
52-week low
FX-Rate per USD
1 Wk %Chg
MTD %Chg
YTD %Chg
Trade USD'000
Mkt Cap USD m
Botswana BGSMDC 9747.71 0.21 0.17 -8.06 10654.72 9504.24 10.44 -1.98 -0.42 -7.10 1118.56 40630.03 Egypt EGX 30 8343.31 5.60 5.06 25.76 9231.09 766.67 13.90 56.74 56.74 77.79 227718.87 17142.57 Ghana GSE ALSI 1711.3 -1.56 -0.99 -14.2 2014.93 1708.92 3.96 -0.01 0.01 4.47 173.33 13089.73 Kenya NSE ASI 138.31 1.09 0.93 -5.07 147.63 129.65 101.57 0.13 0.09 -0.73 4657.35 19728.24 Malawi MSE ALSI 13765.5 0.60 -0.12 -5.47 15598.00 13087.00 721.38 0.00 0.05 8.58 1341162.08 11830.35 Mauritius SEMDEX 1798.85 -1.03 -0.19 -0.67 1888.12 1737.59 35.73 -0.33 -0.24 -0.58 41764.93 6016.22 Morocco MASI 10580.4 2.13 0.24 18.54 10612.55 8789.89 9.80 -0.82 -0.70 -1.05 12247.00 47528.00 Namibia Local 1032.46 0.81 -0.53 19.29 1072.14 766.67 13.50 -1.78 -2.12 -13.2 2420.62 787.01 Nigeria NIG ALSI 27044.4 -0.92 -0.76 -5.58 31073.32 22330.96 305.25 -0.08 -0.08 54.95 22309.31 30431.47 Rwanda RSE Index 127.79 0.57 -0.16 -13.0 267.50 139.64 814.05 0.06 0.02 8.38 946.40 3389.74 South Africa
JSE ALSI 50239.3 -2.69 -1.50 -0.90 54760.91 45975.78 13.48 -1.91 -0.20 -13.5 3406347.00 311203.00
Tanzania DAR ALSI 2515.5 1.30 1.08 7.79 5004.67 2172.97 217336.73 -0.09 -0.08 1.16 13.76 100.81 Tunisia TUNIS 5534.58 1.04 3.61 9.77 5563.20 4812.05 2.23 -1.04 1.43 10.93 1547.63 8806.25 Zambia LuSE ALSI 4300.17 -0.19 -0.16 -25.0 6287.00 5904.00 9.81 0.01 1.16 -10.7 806.34 5919.82 Zimbabwe ZSE IND 120.27 -0.16 21.53 4.72 145.63 93.39 361.90 0.00 0.00 0.00 3732.41 3317.20
Source: GN Research, Bloomberg & Various Stock Exchanges.
Country Bond Maturity Bond Maturity Prime Month CPI Month
Rate
(%)
Date Name Rate
(%)
(%)
SOUTHERN AFRICA
Angola 7.5 Apr-21 5 year 53 mths 9.00 Feb 7.87 Mar
Botswana 4.48 Mar-25 BW007 100 mths 5.50 Sep 2.60 Aug
Lesotho 8.25 Feb-19 LS000A1GZ7W0 28mnths 10.25 Feb 6.60 Apr
Malawi 27.00 Sep 22.80 Aug
Mauritius 7.07 Sep-23 10 year 95mnths 4.00 Jul 0.90 Jul
Namibia 8.55 Oct-24 GC24 108mnths 10.75 Aug 7.00 Jul
South
Africa
7.60 Dec-25 R 186 122mnths 10.50 Aug 5.90 Aug
Swaziland 8.87 Jan-24 SG018 99mnths 5.50 May 4.80 Aug
Zambia 13.00 Feb-25 10 year 112mnths 15.50 May 19.50 Nov
Zimbabwe -2.77 Aug
EAST AFRICA
Kenya 12.18 Jan-24 KE3000008890 99mnths 10.00 Aug 6.26 Aug
Rwanda 13.5 May-31 15 year 174mths 6.50 Sep 6.90 July
Tanzania 16.50 Oct-23 10 year 96mnths 12.00 Nov 6.10 Sep
Uganda 16.87 Apr-23 UG0000001244 90mnths 17.00 Nov 8.80 Sep
WEST AFRICA
Ghana 23.50 Aug-17 5005 22mnths 26.00 May 17.20 Sep
Nigeria 14.20 Oct-24 10 year FGN
Bonds
108mnths 14.00 Jul 17.60 Sep
Liberia 13.60 Jan 8.60 Jan
Sierra
Leone
9.50 Mar 7.55 Feb
NORTH AFRICA
Egypt 12.50 Feb-20 EGBGR01431F8 64mths 13.97 Jun 10.27 Apr
Morocco 4.25 Dec-22 6 year 66mths 2.50 May 1.30 Feb
Tunisia 2.45 Jul-21 5 year 56mths 4.75 July 5.70 Mar
Source: GN Research, Various Central Banks in Africa
PREPARED BY:
Email us at: [email protected]
Investors should call Gold Coast Fund management awarded the BESTINVESTMENT ADVISOR for 2011 and 2012 AND BEST FUND MANAGER 2013 AND 2014:
(233) 0302- 211- 411
Disclaimer
This document is published solely for informational purposes and is neither solicitation nor offers to buy or sell any stock. It does not attempt or claim to be a complete description of the securities, markets or developments referred to in the material. All expressions of opinion are subject to change without notice. The information is obtained from internal and external sources which Gold Coast Fund Management (GC) considers reliable but GC has not
independently verified such information and GC does not guarantee that it is accurate or complete.
INFLATION AND INTEREST RATES SUMMARY
Samuel Ampah [Head. Research] BaffourAsare-Wiredu Jnr [Financial Analyst] Sandra N. Ayiku [Financial Analyst]
Jacob K. Buxton [Economic Analyst]
Angela Kwartemaa [Fixed Income Analyst]
AFRICAN STOCK MARKET
Investors on the African stock markets recorded substantial
gains this week. The Egyptian stock exchange recorded the
highest gain of 5.60%, followed by the Moroccan stock exchange
(2.13%), the Tanzanian stock exchange (1.30%) and the Kenyan
stock exchange (1.09%). Per contra, the South African, Ghana,
Mauritius, Nigerian, Zambian and Zimbabwe stock exchanges
recorded losses this week.
FOREIGN EXCHANGE MARKET- AFRICA
Most African currencies were resilient against the US dollar this
week. The Botswana pula recorded the highest appreciation of
1.98%, followed by the South African rand (1.91%) and the
Namibian dollar (1.78%). ). Still and all, the Egyptian pound
recorded a hyper depreciation of 56.74% this week, followed by
a marginal depreciation of the Kenyan shilling, Rwandan franc
and the Zambian kwacha.
Commodity Market (US$)
Weekly Crude oil Gold Cocoa Sugar Coffee 16/09/2016 46.02 1314.95 2843 21.15 148.4
23/09/2016 47.17 1336.44 2919 22.37 153.4
30/09/2016 48.4 1327.13 2723 23.17 149.95
07/10/2016 52.74 1254.27 2787 23 146
14/10/2016 52.38 1256.73 2709 23.11 153.9
21/10/2016 51.34 1264.46 2717 22.57 155.9
28/10/2016 50.34 1266.25 2632 25.54 165.25
04/11/2016 46.12 1301.27 2633 21.48 165.65
0500
100015002000250030003500
Gold
Cocoa
0
10
20
30
40
50
60
Crude oil
Sugar