WEARABLE ELECTRONICS MARKET AND TECHNOLOGY ANALYSIS (2013
21
1 Comparing the Effects of Physical and Virtual Experimentation Sequence on Students’ Understanding of Mechanics Adrian Carmichael, Jacquelyn J. Chini, Elizabeth Gire and N. Sanjay Rebello Kansas State University Sadhana Puntambekar University of Wisconsin, Madison Please address all correspondence to: Adrian Carmichael Kansas State University Department of Physics 116 Cardwell Hall Manhattan, KS 66506-2601 Phone: 785-532-7167 Fax: 785-532-6806 [email protected] Paper presented at the Annual Meeting of the American Educational Research Association Denver, April 30–May 4, 2010
Transcript of WEARABLE ELECTRONICS MARKET AND TECHNOLOGY ANALYSIS (2013
1
Comparing the Effects of Physical and Virtual Experimentation
Sequence on Students’ Understanding of Mechanics
Adrian Carmichael, Jacquelyn J. Chini, Elizabeth Gire and N. Sanjay Rebello
Kansas State University
Sadhana Puntambekar
University of Wisconsin, Madison
Please address all correspondence to:
Adrian Carmichael
Kansas State University
Department of Physics
116 Cardwell Hall
Manhattan, KS 66506-2601
Phone: 785-532-7167
Fax: 785-532-6806
Paper presented at the
Annual Meeting of the American Educational Research Association
Denver, April 30–May 4, 2010
2
Comparing the Effects of Physical and Virtual Experimentation
Sequence on Students’ Understanding of Mechanics
Adrian Carmichael, Jacquelyn J. Chini, Elizabeth Gire and N. Sanjay Rebello
Kansas State University
Sadhana Puntambekar
University of Wisconsin, Madison
This study aims to understand how the sequence of physical and virtual activities affects student
conceptual understanding of pulleys. We compared pre-, mid- and post-test scores of two
treatment groups, which differed by the temporal order in which the physical and virtual
activities were completed. We examined overall scores as well as scores on individual questions.
In questions dealing with the concept of work, students who performed the virtual experiment
first seemed to have blocked information learned in the physical. In questions about force,
students in each treatment group showed similar gains from pre- to mid-test but from mid- to
post-test there was no gain, consistent with the primacy effect. Further, students who performed
the physical experiment first did better on force mid-test questions, consistent with advantages of
kinesthetic learning.
In this study we investigate the effects of sequence of physical and virtual activities on
student learning of various concepts in physics. The affordances and limitations of physical
laboratory experiments and computer simulation activities have increasingly been described in
science education research (De Jong & Van Joolingen, 1998; Finkelstein, et al., 2005; Triona &
Klahr, 2003; Klahr, Triona, & Williams, 2007; Zacharia & Constantinou, 2008; Zacharia,
Olympiou, & Papaevripidou, 2008). It has been shown that there are many advantages and
disadvantages to using each type of manipulative. Klahr, Triona, & Williams (2007) reported
that learning with a physical manipulative is advantageous as it is consistent with the concrete-
to-abstract nature of cognitive development, because it increases student interest and motivation
for learning and allows for more sources of brain activation because of the added kinesthetic
element. On the other hand, physical manipulatives can decrease efficiency and productivity of
learning, can allow students to spend time on activities that produce irrelevant information and
can have a higher logistical and financial cost (Klahr, Triona, & Williams, 2007). Virtual
manipulatives in the form of computer simulations have been found to be beneficial as they help
students visualize problems and solutions, provide an interactive learning environment, and
assist in the development of abstract concepts not available with physical materials (Zacharia &
Anderson, 2003). Simulations also allow for the use of dynamically changing graphs, (Triona &
Klahr, 2003) are less time consuming and don’t require specialized equipment (Thornton &
Sokoloff, 1990). Disadvantages of computer simulations include decontextualized
representations of the real world (Hofstein & Lunetta, 2003) and teaching students science
concepts in a different way than scientists initially learned them (Steinberg, 2000).
The growing body of research comparing physical and virtual manipulatives has yet to
reach a clear consensus on the relative effectiveness of virtual and physical activities on student

3
learning. Finkelstein et al. (2005) looked at how students learned about circuits differently with
virtual or physical manipulatives. The simulations used by the students were similar to the
physical materials, except that the simulations showed electron flow within the circuit, which the
physical materials could not. Finkelstein reported that students who had used the virtual
manipulatives, i.e. the simulations, scored better on an exam and were able to build physical
circuits more quickly than students who had used the physical manipulatives. Klahr, Triona and
Williams (2007) investigated how physical and virtual manipulatives affect student learning
about mouse-trap cars. Students used either physical or virtual manipulatives to design their cars.
The physical and virtual treatments showed the same effectiveness in helping students design
cars. Zacharia, Olympiou, & Papaevipidou (2008) looked at physical and virtual manipulatives
in the context of heat and temperature. One group of students used only physical manipulatives,
while another group of students used physical manipulatives followed by virtual manipulatives.
Students who used the physical and virtual manipulatives performed better on a conceptual test
than students who used just the physical manipulatives. The time required for manipulating each
type of equipment may have led to this result. The authors concluded that the simulation could
be manipulated more quickly than the physical manipulative, increasing student learning. In
another study, Zacharia & Constantinou (2008) once again used heat and temperature as a
context to study physical and virtual manipulatives. In this study, they kept all factors equivalent
for the physical and virtual conditions except the mode in which the experiment was performed.
They found that the physical and virtual manipulatives were equally effective in helping students
gain conceptual understanding.
In light of these studies, there is potential that the combination of physical and virtual
manipulatives will greatly enhance student learning. There are many aspects of integrating
physical and virtual activities that are worthy of investigation. The sequence of activities
performed is of particular interest to us. In our study, we investigate the effects of sequence of
physical and virtual activities on student learning in the context of pulleys. Our goal is to
understand the affordances and limitations of each sequence of activities and to investigate the
physics concepts that are most affected by sequence.
Theoretical Framework
This study examines the effect of temporal order of physical and virtual activities on
student learning of various concepts in physics. We hypothesize that blocking and the primacy
effect may contribute to observed differences between the physical-virtual sequence and the
virtual-physical sequence. Blocking (Kruschke, 2003) occurs when learners presented with two
cues in a sequence respond to the first cue over the second. The second cue is blocked when the
first cue was found to predict the outcome correctly. The response to the second cue can be
understood in light of two different models. The Rescorla-Wagner model explains that the
blocked information is not learned because it is deemed to be extraneous since the information
from the first cue predicted the outcome correctly (Rescorla & Wagner, 1972). A second model,
learned inattention, explains that blocked information is not disregarded as irrelevant, but instead
the students learn to ignore it (Kruschke and Blair, 2000). This theory is supported by the fact
that students showed attenuation in learning blocked ideas in subsequent activities. Heckler, et.
al. (2006) found that blocking can be affected by the relative salience of cues. Salience of the
first cue over the second enhances blocking. Conversely when the second cue is more salient
4
then the first blocking is reduced. For the purpose of this study we define saliency as how
noticeable a concept is.
Another relevant theory is the primacy and recency effect (Haugtvedt & Wegener, 1994).
Primacy occurs when learning is dominated by the first in a series of learning experiences.
Recency occurs when learning is most affected by the last or most recent learning experience.
Familiarity and personal significance with the material learned promotes the primacy effect
while low familiarity or personal relevance promotes the recency effect (Haugtvedt & Wegener,
1994). We investigate learning in the two sequences keeping in view the primacy and recency
effects.
Method
This study took place in a conceptual physics laboratory. Conceptual physics is a non-
mathematical physics course designed to introduce students to basic physics phenomena.
Students are typically non-science majors. This conceptual physics course consists of three 50-
minute lectures each week accompanied by a 110-minute lab. Students performed the activities
of this study as a part of their regular lab meeting. They were assigned completion credit for all
parts of the activities except the post-test, for which they received a portion of their lab grade
based on correctness. Students had not previously studied pulleys in the lecture portion of the
course, though they had been exposed to the underlying concepts used to describe pulleys.
The activities students completed are part of CoMPASS (Concept Mapped Project-based
Activity Scaffolding System), a design-based curriculum that integrates concept maps, hypertext,
and physical and virtual experiments (Puntambekar, Stylianou, & Hübscher, 2003 and
Puntambekar & Stylianou, 2002). This curriculum consists of several important parts. Learning
is framed by a design challenge, in this case one in which students are asked to design the best
pulley setup to lift a pool table into a moving van. To activate prior knowledge, students are
given opportunity to make individual and group predictions and brainstorm questions they would
like to know more about. To gather information related to the challenge, students navigate
through the CoMPASS website where they are presented with interactive concept maps
accompanied by textual descriptions of concepts related to pulleys as shown in Figure 1.
Students also learn about pulleys using both a physical pulley setup (physical manipulative) and
an interactive computer simulation (virtual manipulative) as shown in Figure 2. The temporal
order in which students completed the physical and virtual activities was varied by lab section.
The sequence of activities performed by the students is as follows. All students began by
individually completing a pre-test and then made individual and group predictions. Following
this, they learned more about pulleys using the CoMPASS website. After gathering information,
they performed the physical or virtual activity based on which lab section they were in. There
were five lab sections in total. Three lab sections were randomly assigned the Physical-Virtual
sequence (PV), while the other two lab sections were assigned the Virtual-Physical (VP)
sequence. Next, students took a mid-test. Finally they performed either the physical or virtual
experiment and completed a post-test. This sequence is illustrated in Figure 3.
5
The pre-, mid- and post-tests were identical and consisted of multiple-choice conceptual
questions. While students completed the physical and virtual activities, they recorded data and
answered open-ended questions on a worksheet. We coded and analyzed students’ responses to
the worksheet questions using a phenomenograhic approach (Marton, 1986). As per this
approach student responses to the worksheet questions are categorized based on the meanings
expressed in these responses. The categories are not predefined by the researcher. Rather, the
categories naturally emerge from the data.
We analyzed the pre-, mid- and post- test data statistically on basis of the overall scores
as well as scores on questions by concept. The instructions given to each lab section and the data
gathered from each section was identical. Except for the type of activity (physical or virtual), we
controlled for all conditions, such as the time on task and interaction with the instructor. Students
spent about 30 minutes on each activity, although students spent a few extra minutes on the
activity when working with the real pulleys. This extra time was mainly due to time required to
set up various pulley systems.
Results and Discussion
Overall Test Performance
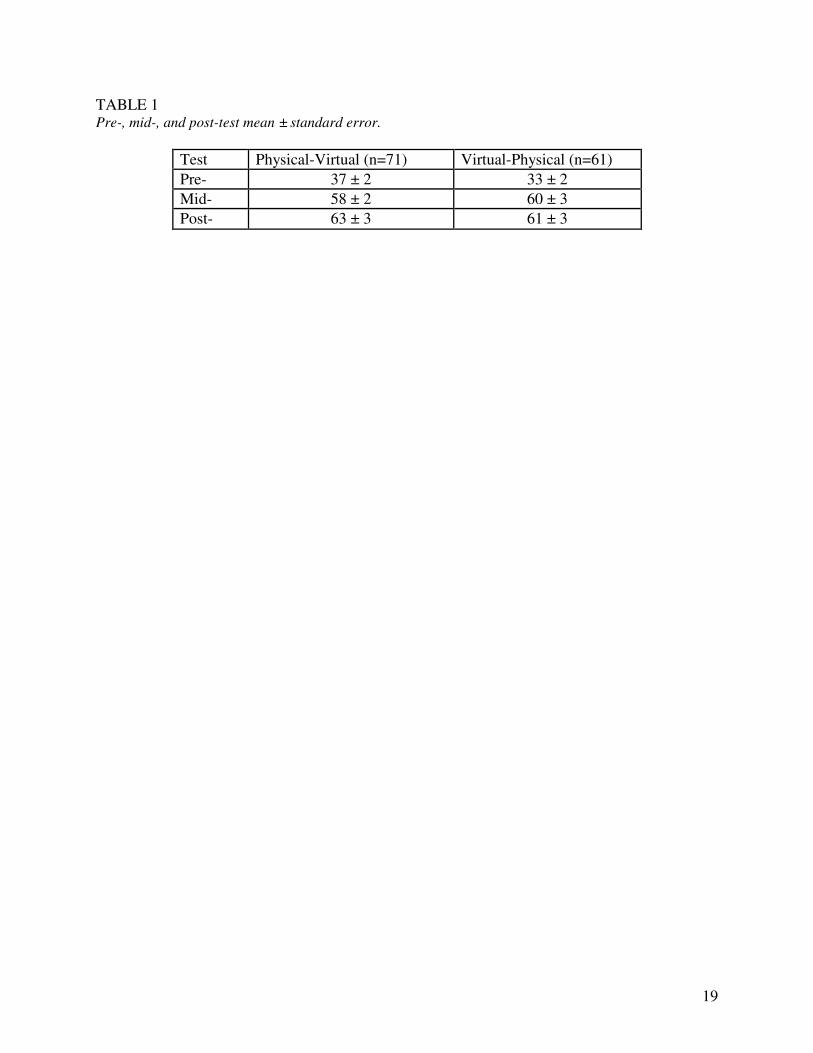
The overall pre-, mid- and post-test scores are shown in Table 1. The average overall test
score by sequence is shown in Figure 4. To compare the pre-, mid- and post-test data for all
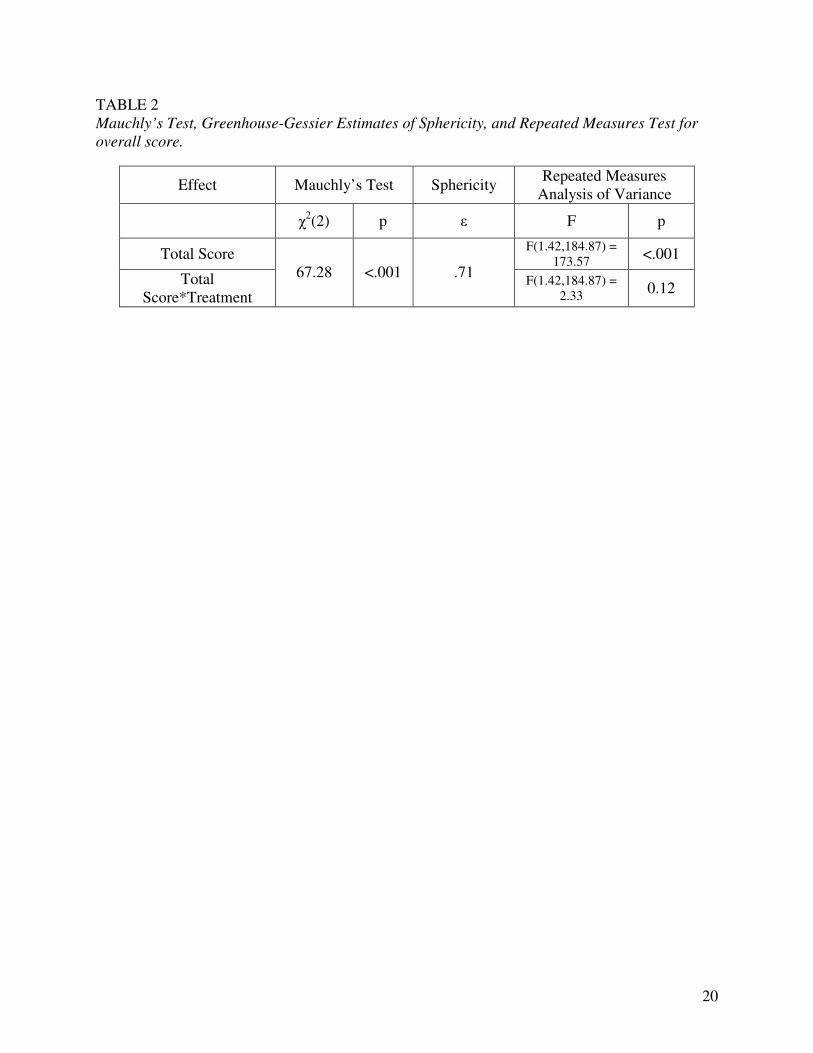
students, a Repeated Measures Analysis of Variance test was used. We found the assumption of
sphericity had been violated on all the comparisons using Mauchly’s test, therefore degrees of
freedom were corrected using Greenhouse-Geisser estimates of sphericity. Results from
Mauchly’s test and sphericity estimates are shown in Table 2.
The Repeated Measures analysis shows that students’ total scores changed significantly
between tests. The interaction between the total score and treatment condition is not significant.
This tells us the test scores changed in a similar way for the PV and VP sequences. Thus it seems
there is no difference between the PV and VP sequences in the overall understanding of pulleys
as measured by the test.
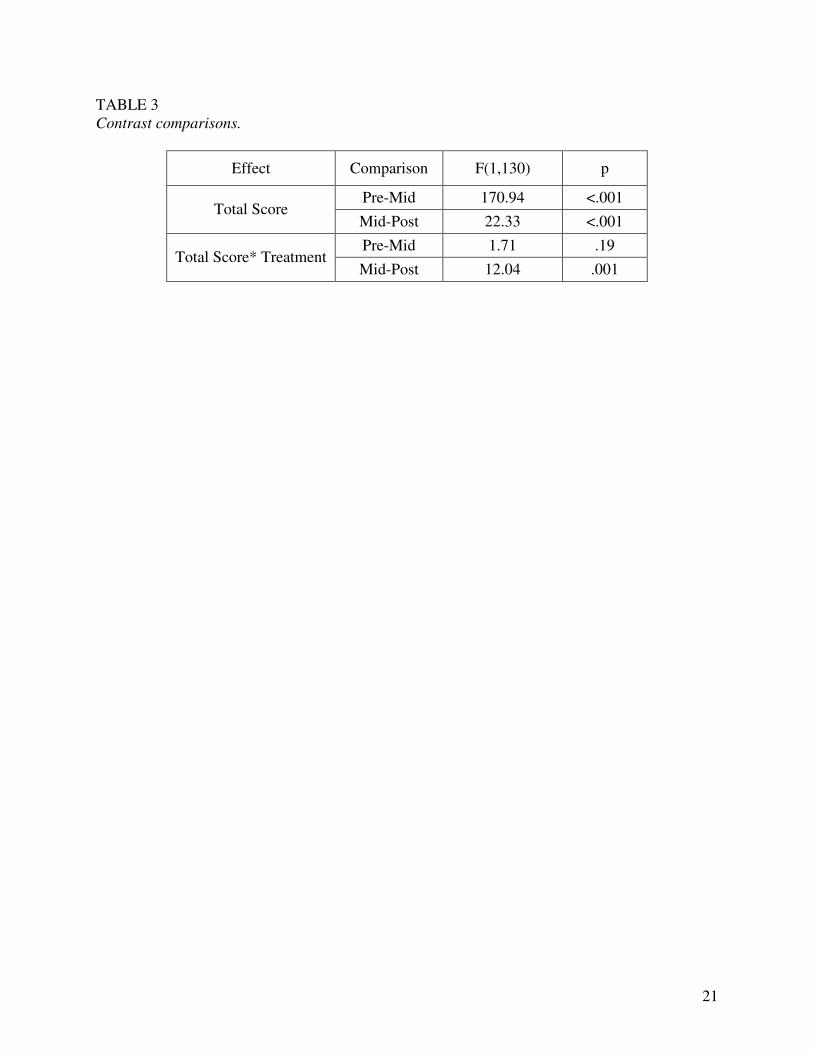
Significant changes in score from pre- to mid- and mid- to post-test were determined
using contrast comparisons (Table 3). Both groups showed statistically significant gains in total
score between the pre- and mid-tests. Only the PV group showed statistically significant gain
between the mid- and post-tests.
These results may be consistent with the virtual experiment blocking further learning in
the physical experiment. In the VP sequence, the pre- to mid-test gain was followed by no gain
from mid- to post-test. This could be because students ignored or put aside information learned
in the second activity. We speculate that the reason for this apparent blocking could be because
of certain features in the virtual experiment that were absent in the physical experiment. In the
PV sequence, there was a gain from pre- to mid-test, followed by a gain from mid- to post-test.
In this sequence, students seem to learn from both activities and we see no evidence of blocking.
These ideas will be explored further in the analysis of individual questions.
6
We also see evidence of the primacy effect in the overall test scores. In both the PV and
VP groups, the pre-post gain overwhelmed the mid-post gain. So, students appear to learn more
from whatever experiment, physical or virtual, that they experience first in the sequence.
Individual Questions
To gain more insight into the differences in learning because of temporal order of
physical and virtual activities, we analyzed test questions by concept being tested. This is
because we observed the same pattern in student response when we grouped questions by
concept. There were three main concepts tested. These were force and distance, work, and
mechanical advantage. The questions dealing with force and distance and those dealing with
work showed significant differences between treatment groups. We looked specifically at
questions Q1 and Q2-1, which dealt with the concepts of force and distance and questions Q9
and Q13, which dealt with the concept of work.
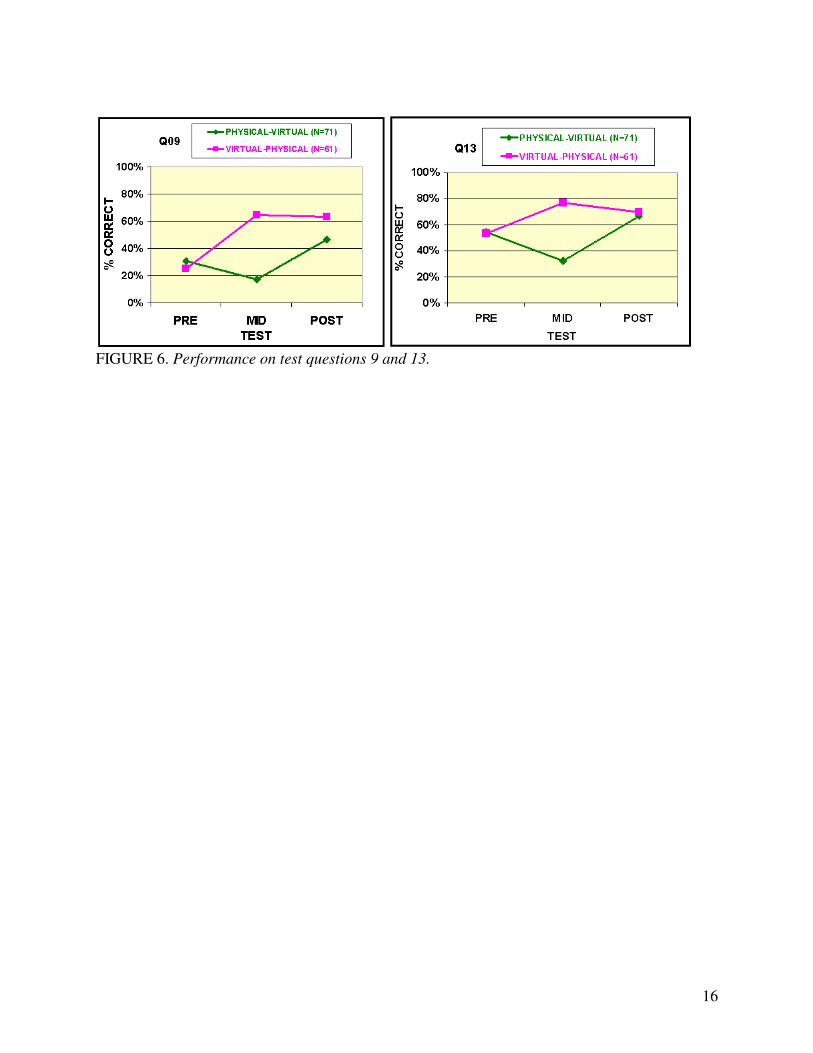
Questions About Work
Questions 9 and 13 (Figure 5) test student understanding of the constancy of work done
across pulley systems and the equality between work and potential energy. In looking at the
overall trends for these questions about work (Figure 6) there seem to be no differences between
the pre-test scores, but the mid-test scores are different in both questions with a gain for the VP
group versus a loss for the PV group. Then between mid- and post-test the VP group stays about
the same while the PV group shows an improvement.
The improvement of the VP group from pre- to mid-test, but not from mid- to post-test is
consistent with student learning from the virtual experiment blocking further learning from the
physical experiment. Salience of the concepts of work and potential energy in the virtual
experiment as compared to the physical experiment may have contributed to this effect. The
simulation included a dynamically increasing bar chart that represented the values of work and
potential energy as an object was lifted with a pulley system. In the physical experiment, the
students measured force and distance values with a spring scale and meter stick, then used these
to calculate and record the values of work and potential in a data table. Thus, it seems that the
concepts of work and potential energy were much more noticeable in the simulation as there was
a visualization of the concepts. Because of the increased salience of the work and energy
concepts in the simulation, students learned about work from the simulation and then may have
ignored or set aside the ambiguous work data collected in the physical experiment, thus blocking
this information.
The PV group showed a loss from pre- to mid-test and gain from mid- to post-test.
Apparently, this group learned incorrectly about work and potential energy from the physical
experiment as seen by losses in mid-test scores and then corrected their understanding after they
used the simulation. One factor that may have contributed to the PV group’s performance from
pre- to mid-test is the fact that only in a frictionless environment is work unchanged and equal to
potential energy. So after performing the physical experiment, the PV group would not have seen
data indicating that work is constant over different pulley systems and equal to potential energy

7
when moving objects to the same height. The constancy of work and equality with potential
energy was only seen after performing the physical experiment. But why do students change
their post-test answers to match the trends seen in the virtual experiment after they first
completed the physical? The framework on blocking explains that blocking can be significantly
reduced or eliminated if the second cue is much more salient than the first. In this case the
concepts of work and potential energy are more salient in the simulation, which was performed
second in the sequence. According to the framework we expect to see blocking reduced or
eliminated which is consistent with our data.
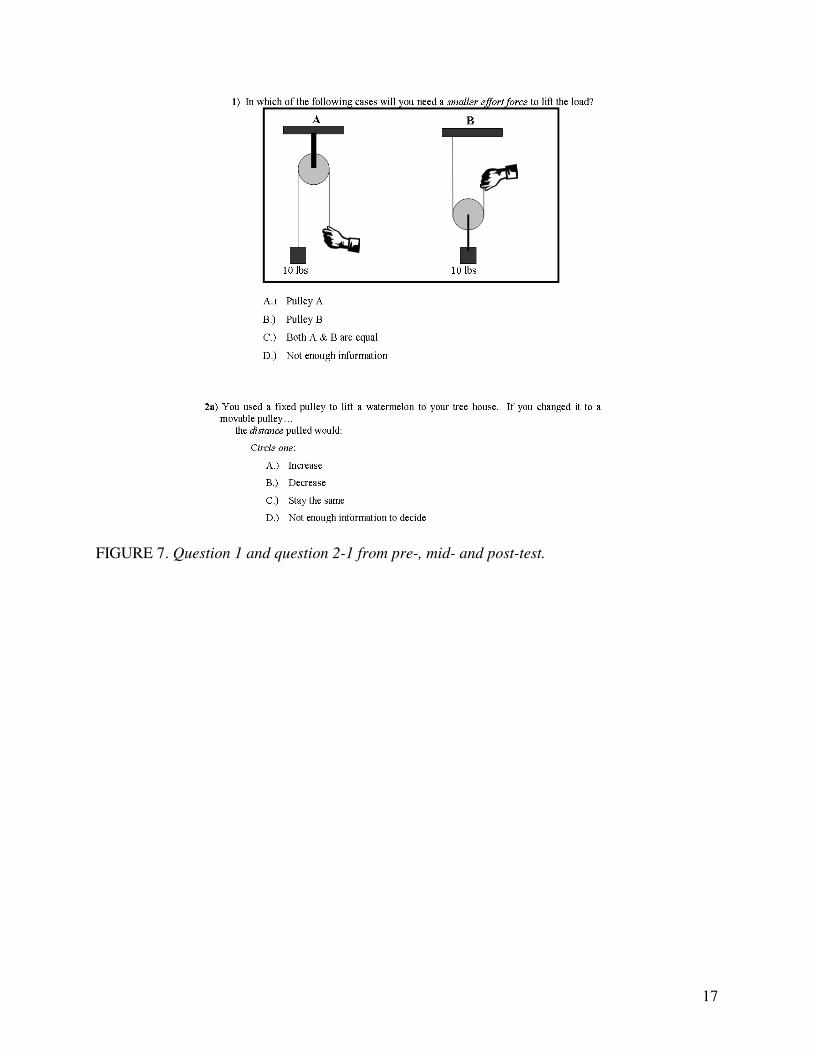
Questions About Force
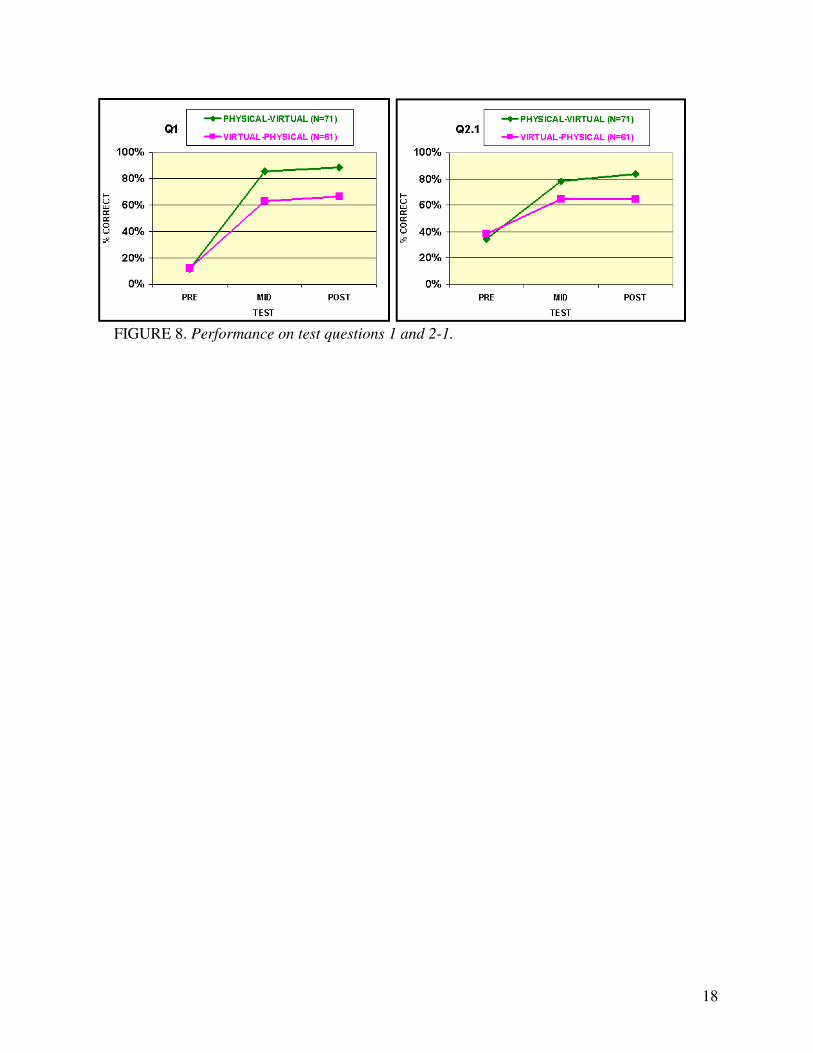
Questions 1 and 2.1 (Figure 7) focus on how force and distance change with different
pulley systems. The results are shown in Figure 8. There was an improvement from pre- to mid-
test for both the VP and PV groups while there was no difference from mid- to post-test scores
for either group. On average, the PV group performed better than the VP group on the post-test.
In the physical experiment, the students use a spring scale and meter stick to measure
force and distance for several pulley systems. In the simulation, the force and distance values are
displayed with dynamically increasing bar charts. So in both the physical and virtual
experiments, the concepts of force and distance have high salience. With equal salience in both
physical and virtual, we do not expect that blocking would be more likely to occur in one activity
or the other. If blocking occurs, it would be equally likely in both the PV sequence and the VP
sequence. In looking at the trends for the force questions, we do see students learning from the
first activity they perform, and not improving after the second activity consistent with blocking
of information from the second activity occurring equally for both sequences.
These trends observed in the force questions also appear to be consistent with the
primacy effect. The primacy effect explains that students learn most from the first in a series of
learning experiences. Studies have also shown that familiarity with an idea has been seen to
induce primacy. Force and distance are typically more familiar concepts to students as compared
to the idea of work and potential energy. So data consistent with the primacy effect can be
expected for questions pertaining to the former concepts, such as Q1 and Q2.1 rather than the
latter.
Additionally, the PV group performed better than the VP group on the mid- and post-test
Q1 and Q2.1. Thus, it seems that performing the physical experiment first enhances student
understanding of force and distance. These results are consistent with the idea promoted by
physics educators such as Arons (1997) who states that to enhance learning the concepts must be
‘explicitly connected with an immediate, visible or kinesthetic experience.’ Thus, we speculate
that the fact the students physically measured force and distance could possibly be related to
their better performance on the mid- and post-test questions pertaining to these concepts.
Although the VP group also physically measured these quantities in their second experiment,
they did not show an increased performance in the post-test. This result is consistent with the
notion that blocking of the subsequent physical experiment by the previous virtual experiment
caused them to disregard their experience in the subsequent physical experiment.
8
Discussion and Conclusion
This study adds to prior research (e.g. De & van Joolingen, 1998; Finkelstein, et al.,
2005; Klahr, Triona & Williams, 2007; Zacharia, 2005; Zacharia & Anderson, 2003), which has
not reached a clear consensus on the relative effectiveness of simulations and physical activities
on student learning. Research has also shown that combining physical and virtual experiments
can benefit learning. This study investigates ways in which these can be combined most
effectively in the context of pulleys.
In looking at the overall scores, we found that students who completed the physical
activity before the virtual activity improved their scores after performing the virtual activity,
whereas those who completed the virtual activity before the physical activity, showed no
improvement after the physical activity. This result is consistent with the notion that the
simulation provides high salience on certain concepts and induces blocking of further learning
from the physical activity. We also observe evidence of the primacy effect in the students’
overall scores. The students seem to learn from whatever experiment they performed first
evidenced by the improvement in score from pre- to mid-tests in both groups.
We also found evidence of blocking and the primacy effect when looking at individual
questions about the concepts of work and force. The high salience of the concepts of work and
energy in the simulation may contribute to students blocking learning of these ideas in a
subsequent physical experiment. Ideas such as force and distance are equally salient in both, thus
blocking may have occurred equally in both sequences. When learning about force and distance,
neither sequence is preferred based on saliency.
We also observed a primacy effect on questions dealing with familiar concepts of force
and distance. In addition, the PV group scored higher than the VP group on these questions.
When dealing with concrete and easily measurable quantities like force and distance, the
kinesthetic act of measuring seems to improve student understanding. It is important for this to
occur first in the sequence so that blocking will not disregard this important experience.
REFERENCE LIST
Arons, Arnold B. (1997). Teaching Introductory Physics. New York: John Wiley & Sons.
De Jong, T. & Van Joolingen W.R. (1998) Scientific Discovery Learning With Computer
Simulations of Conceptual Domains, Review of Educational Research, 68, 179-201.
Finkelstein, N. D., Adams, W. K., Keller, C. J., Kohl, P. B., Kohl, K. K., Podolefskey, N.S., et
al. (2005). When learning about the real world is better done virtually: A study of
substituting simulations for laboratory equipment. Physical Review Special Topics-
Physics Education Research, 1, 010103.
Haugtvedt, C.P. & Wegener, D.T. (1994). Message Order Effects in Persuasion: An Attitude
Strength Perspective. The Journal of Consumer Research, 21, 205-218.
9
Heckler, A.F., Kaminski J., & Sloutsky V.M. (2006). Differential Cue Salience, Blocking and
Learned Inattention. Proceedings of the XXVIII Annual Conference of the Cognitive
Science Society, 1167-1172. Mahwah, NJ: Erlbaum.
Hofstein, A. & Lunetta, V.N. (2003) The laboratory in science education: Foundations for the
twenty-first century. Science Education, 88(1), 28-54.
Klahr, D., Triona, L. M., & Williams, C. (2007). Hands on what? The relative effectiveness of
physical versus virtual materials in an engineering design project by middle school
children. Journal of Research in Science Teaching, 44(1), 183-203.
Kruschke, J. K. (2003). Attention in learning. Current Directions in Psychological Science, 12,
171-175.
Kruschke, J. K. & Blair, N. J. (2000). Blocking and backward blocking involve learned
inattention. Psychonomic Bulletin & Review, 7, 636-645.
Marton, F. (1986). Phenomenography- a research approach to investigating different
understanding of reality. Journal of Thought, 21, 29-39.
Puntambekar, S. & Stylianou, A. (2002). CoMPASS: Students’ use of external representations in
science learning. In P. Bell, R. Stevens & T. Satwicz (Eds.), Keeping Learning Complex:
The Proceedings of the Fifth International Conference of the Learning Sciences (ICLS)
(pp.352-358). Mahwah, NJ: Erlbaum.
Puntambekar, S., Stylianou, A., & Hübscher, R. (2003). Improving navigation and learning in
hypertext environments with navigable concept maps. Human-Computer Interaction, 18,
395-428.
Rescorla, R. A., & Wagner, A. R., (1972). A theory of Pavlovian conditioning: Variation in the
effectiveness of reinforcement and non-reinforcement. In A. H. Black & W. F. Prokasy
(Eds.), Classical conditioning: II. Current research and theory. New York: Appleton-
Century-Crofts.
Steinberg, R.N. (2000). Computers in teaching science: To simulate or not to simulate?
American Journal of Physics, 68(S1), S37-S41.
Thornton, R.K. & Sokoloff, D.R., (1990) Learning motion concepts using real time micro-
computer based laboratory tools. American Journal of Physics, 58(9), 858-867.
Triona, L. M. & Klahr, D. (2003). Point and click or grab and heft: Comparing the influence of
physical and virtual instructional materials on elementary school students’ ability to
design experiments. Cognition and Instruction, 21(2), 149-173.
10
Zacharia, Z. C. (2005). The impact of interactive computer simulations on the nature and quality
of postgraduate science teachers’ explanations in physics. International Journal of
Science Education, 27(14), 1741-1767.
Zacharia, Z. & Anderson, O. R. (2003). The effects of an interactive computer-based simulation
prior to performing a laboratory inquiry-based experiment on students’ conceptual
understanding of physics. American Journal of Physics, 71(6), 618-629.
Zacharia, Z. C. & Constantinou, C. P. (2008). Comparing the influence of physical and virtual
manipulatives in the context of the Physics by Inquiry curriculum: The case of
undergraduate students’ conceptual understanding of heat and temperature. American
Journal of Physics, 76(4&5), 425-430.
Zacharia, Z. C., Olympiou, G., & Papaevripidou, M. (2008). Effects of experimenting with
physical and virtual manipulatives on students’ conceptual understanding in heat and
temperature. Journal of Research in Science Teaching, 45(9), 1021-1035.

11
FIGURE 1. CoMPASS, dynamic concept maps and hypertext-based environment.

12
FIGURE 2. Virtual manipulative (computer simulation) and physical manipulatives (pulleys,
spring scale, string and mass).

13
Virtual-Physical Sequence Physical-Virtual Sequence
Pre-Test
Virtual Experiment
Predictions & CoMPASS
Mid-Test
Post-Test
Physical Experiment Virtual Experiment
Physical Experiment
FIGURE 3. Activities performed by treatment groups.

14
FIGURE 4. Mean score on pre-, mid- and post-tests of physical-virtual and virtual-physical
groups. The error bars represent the standard error.

15
FIGURE 5. Question 9 and question 13 from pre-, mid- and post-test.
16
FIGURE 6. Performance on test questions 9 and 13.
17
FIGURE 7. Question 1 and question 2-1 from pre-, mid- and post-test.
18
FIGURE 8. Performance on test questions 1 and 2-1.
19
TABLE 1 Pre-, mid-, and post-test mean ± standard error.
Test Physical-Virtual (n=71) Virtual-Physical (n=61)
Pre- 37 ± 2 33 ± 2
Mid- 58 ± 2 60 ± 3
Post- 63 ± 3 61 ± 3
20
TABLE 2
Mauchly’s Test, Greenhouse-Gessier Estimates of Sphericity, and Repeated Measures Test for
overall score.
Effect Mauchly’s Test Sphericity Repeated Measures
Analysis of Variance
χ2(2) p ε F p
Total Score F(1.42,184.87) =
173.57 <.001
Total
Score*Treatment
67.28 <.001 .71 F(1.42,184.87) =
2.33 0.12
21
TABLE 3
Contrast comparisons.
Effect Comparison F(1,130) p
Pre-Mid 170.94 <.001 Total Score
Mid-Post 22.33 <.001
Pre-Mid 1.71 .19 Total Score* Treatment
Mid-Post 12.04 .001