WBG Infrastructure Response to the Crisis
23
1 WBG Infrastructure Response to the Crisis April 2009
-
Upload
preston-blanchard -
Category
Documents
-
view
33 -
download
0
description
WBG Infrastructure Response to the Crisis. April 2009. Outline. Context and Background Infrastructure and the Crisis WBG Response to the Crisis: INFRA. “The Vulnerability Fund” 0.7 Percent of Stimulus Packages. Bilateral Organizations. United Nations Organizations. Non-Governmental - PowerPoint PPT Presentation
Transcript of WBG Infrastructure Response to the Crisis

1
WBG Infrastructure Response to the Crisis
April 2009

2
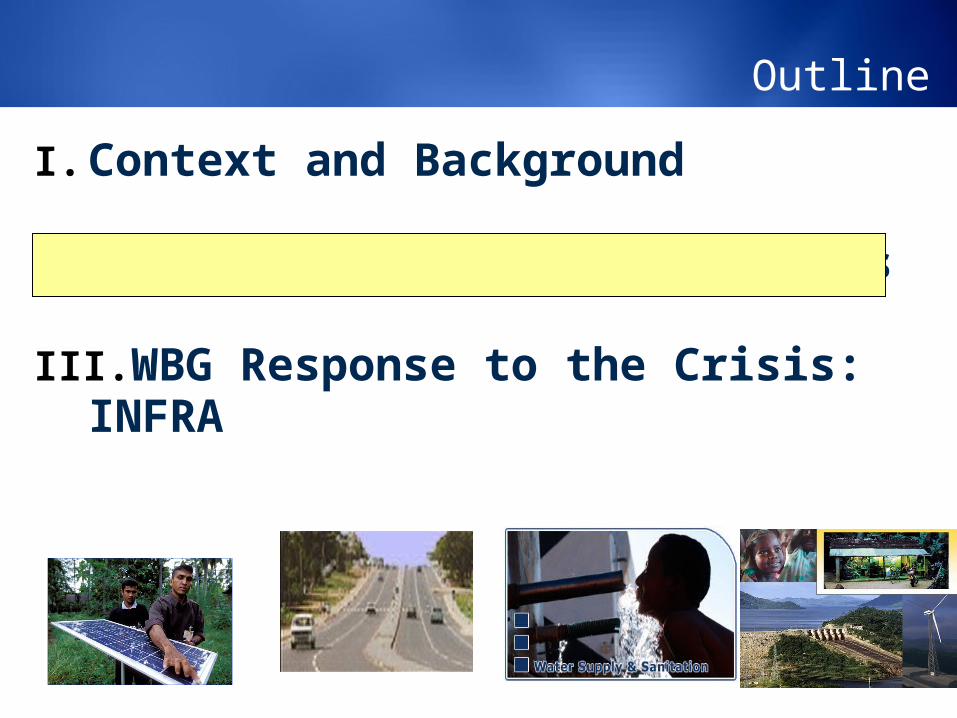
Outline
I. Context and Background
II. Infrastructure and the Crisis
III. WBG Response to the Crisis: INFRA

3
“The Vulnerability Fund”0.7 Percent of Stimulus Packages
Bilateral Organizations
United Nations Organizations
Non-Governmental Organizations
Multilateral Development Banks
The World Bank Group
Vulnerability Financing Facility (VFF)
Infrastructure Recovery Assets Platform (INFRA)
IFC Private SectorPlatform
GFRPIDAFast
Track Energyfor the
Poor
Trust Funds
Bank Recap
Trade Finance
Infrastructure Facility
Microfinance Facility
Advisory facility
• Direct Finance• Parallel Finance• Concessional finance
Rapid Social
Response
4
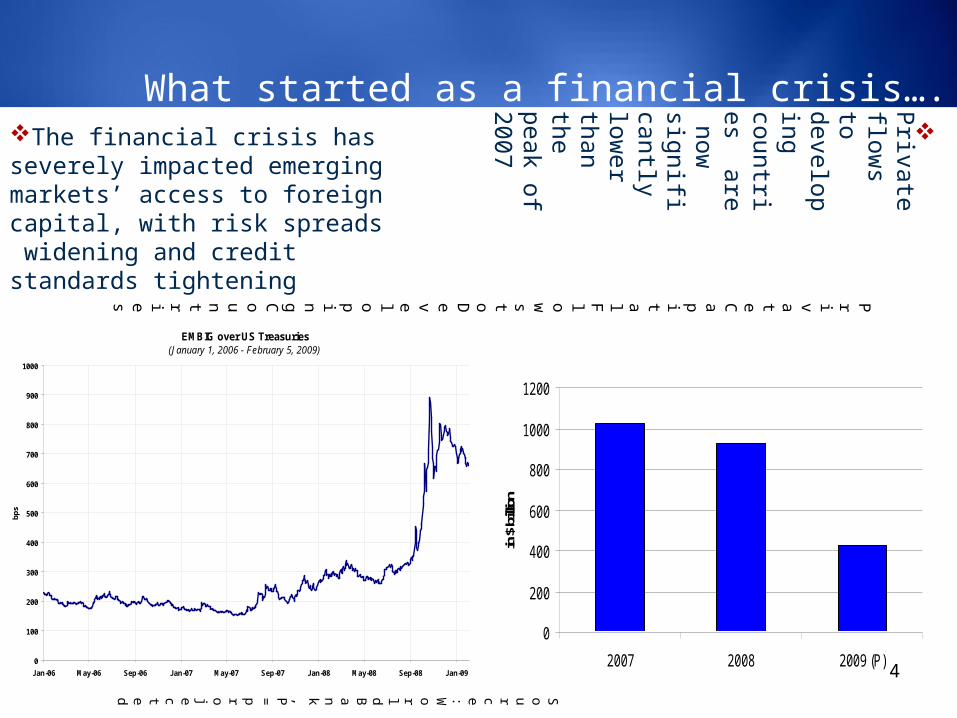
What started as a financial crisis….
EMBIG over US Treasuries(January 1, 2006 - February 5, 2009)
0
100
200
300
400
500
600
700
800
900
1000
Jan-06 May-06 Sep-06 Jan-07 May-07 Sep-07 Jan-08 May-08 Sep-08 Jan-09
bps
Private
Capit
al
Flows
to
Developing
Countri
es
Source :
World Bank, P=
projected
The financial crisis has severely impacted emerging markets’ access to foreign capital, with risk spreads widening and credit standards tightening
Private
flows to
developing countries are now
significantly low
er than the peak of 2007
0
200
400
600
800
1000
1200
2007 2008 2009 (P)
in $
billi
on
5
0
1
2
3
4
5
6
7
8
9
2007 2008 2009
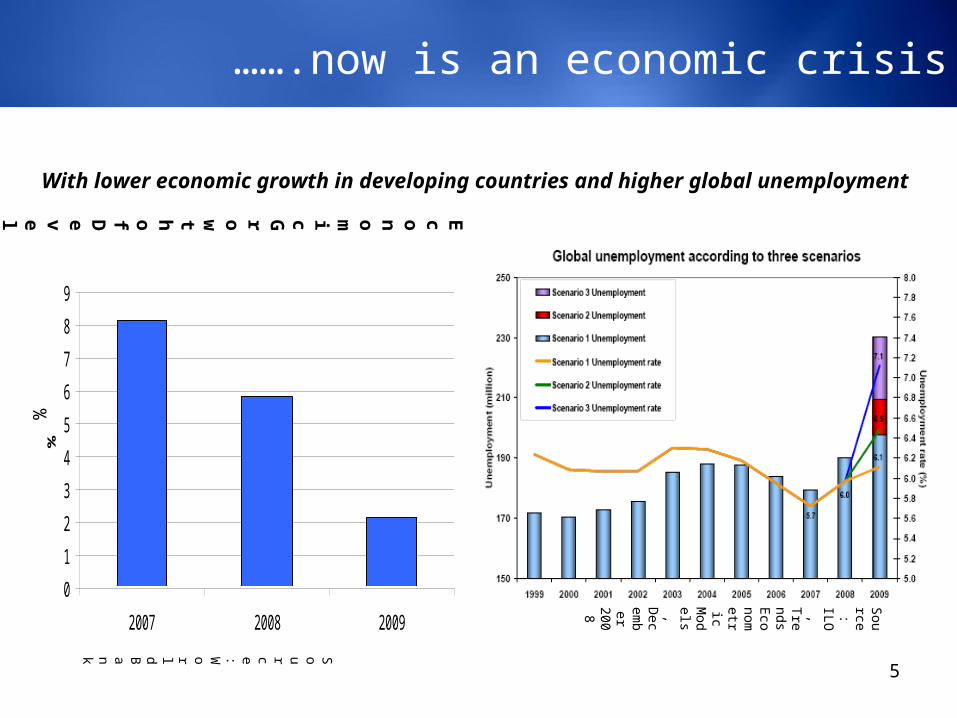
%…….now is an economic crisis
With lower economic growth in developing countries and higher global unemployment
Source: World Bank
Source:
ILO,
Trends
Eco
nometric M
odels, D
ecem
ber
2008
%
Economic Growth
o
f Developing
Countries

6
Financing for infrastructure indeveloping countries is drying up
Capital market financing for developing countries’ infrastructure
0
50
100
150
200
250
in $
bill
ion
Bond issuance
Bank lending
Source: D
ialogic
2007 2008

7
Decline in infrastructure spending leads to decreased growth….
In Indonesia, decline in total infrastructure spending follow
ing the 1997 A
sian crisis w
as accom
panied by declining grow
th
Ind
on
esia
To
tal
Infra
structu
re
Inve
stmen
t(%
o
f G
DP
)
Indonesia Average GDP
Growth
Source: World Bank
76543210
199719981999 2000
%76543210
1988-1997
1998-2007
%8

8
….and decline in infrastructure spending on maintenance has costly consequences
Main
tenance Vs Repl
acement
Costs o
f Roads in
Developing
Countri
es
0
5
10
15
20
25
30
35
40
45
50
in $
bill
ion
Lo
ss
of
roa
d
as
se
t v
alu
e
(19
70
-8
9)
Co
st o
f m
ain
ten
an
ce
to
a
vo
id
los
s in
a
ss
et
va
lue
(1
97
0-
89
)
Source: World Bank

9
…Africa could lose a key source of growth Infrastructure investments are partly
responsible for the recent improved growth performance in Africa
– Infrastructure improvements were aided by surge in external capital flows from $ 4 billion in 2002 to $20 billion in 2007
– Regional integration had become a new focus of recent infrastructure finance helping provide effective linkages to regional and international markets
Additional investments could have yielded further dividends
– $40 billion additional spending necessary to meet economic and social needs over next decade
– Improving infrastructure in all African countries to the level of Mauritius could increase per capital economic growth in the region by 2.2 percent
The crisis threatens recent gains– Reduced private flows and fiscal space
for infrastructure investments and maintenance in African countries
0
0.2
0.4
0.6
0.8
1
1.2
%
Co
ntrib
utio
n to
p
er C
apita
Eco
no
mic
Gro
wth
in
Africa
(1990-
2005)
St
ructural
Poli
cie
s Impr
ovements
in
Infrastructure
Source: World Bank
10
Outline
I. Context and Background
II. Infrastructure and the Crisis
III. WBG Response to the Crisis: INFRA

11
Crisis ResponseInfrastructure spending as a fiscal stimulus measure
Counter-cyclical public spending in infrastructure is an effective tool to create jobs and provide the foundation for economic recovery and sustained growth
Transformational opportunity to invest in “green” Infrastructure
The share of infrastructure spending in announced
fiscal stimulus packages varies substantially across countries:– So far announced infrastructure spending for 2009 represents on
average 64 percent of the total stimulus in emerging market economies and 22 percent of the total stimulus in high income economies

12
Infrastructure and the Crisis: areas of action
1. Stabilize existing infrastructure assets
2. Ensure delivery of projects that remain government priority
3. Support PPPs in infrastructure
4. Support new infrastructure project development and implementation
13
Outline
I. Context and Background
II. Infrastructure and the Crisis
III. WBG Response to the Crisis: INFRA
14
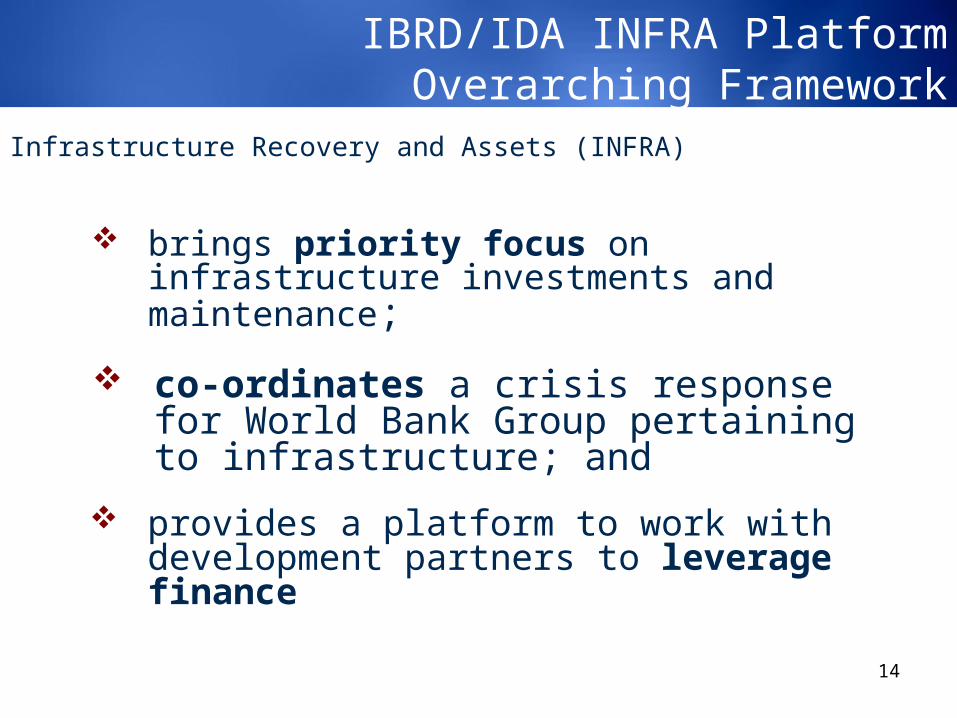
Infrastructure Recovery and Assets (INFRA)
brings priority focus on infrastructure investments and maintenance;
co-ordinates a crisis response for World Bank Group pertaining to infrastructure; and
provides a platform to work with development partners to leverage finance
IBRD/IDA INFRA PlatformOverarching Framework

15
WBG INFRA PlatformPlatform across WBG institutions
FINANCINGINFRA RESPONSE
IFC World
Bank MI
GAPRE-CRISISCURRENT
$2.7 to
3.7 billion/year
up
to $1
5 b
illion
/year
curren
tly b
eing
reasse
ssed
base
d
on
reg
ion
al sca
ns
and
co
un
try p
riorities
$2.1 billio
n
Up
to $0
.3 b
illion
in
Glo
bal
Eq
uity
Fu
nd
u
nd
er the
Infrastru
ctu
re Crisis
Facility (1
)
to b
e ad
justed
d
ow
nw
ard
s reflectin
g
low
er th
an
anticip
ated
FD
I flo
w in
to
INF
$0.7 to $1 billion/year
$11
to $13
billion/year
INSTRUMENTS
(1) Scale up constrained by balance sheet
IFC
Infrastructure C
risis Facility
(over 3 to 5 years)
Sup
port (IDA
/IFC
) pipe
lines
Sub
-national instrum
ents
Sca
led u
p R
espo
nse (o
ver 3 yea
rs):D
irect Fin
ance su
pp
ort
(IDA
/IFC
) pip
eline
s
Parallel fin
anc
e expan
sion
w
ith b
ilaterals/o
the
r IFIs
Co
ncessio
nal w
ind
ow
for
pro
ject prep
aration
pro
ject finan
cing
Sup
port (IDA
/IFC
) pipelines
Early 200
9 Board discussio
n. P
roposed reform
s include:
• N
ew P
roduct – covering
non-honorin
g of sovereign
financial obligations
•E
xpanded co
verage – m
ore
acquisition/restructuring
projects will be elig
ible•
Enh
ance Breach of C
ontract coverage for S
OE
s on selective
basis

16
IBRD/IDA INFRA PlatformAction points to respond to crisis
1.Stabilize existing
infrastructure assets
2.E
nsu
re d
elivery o
f p
rojec
tsthat
are a g
over
nm
ent
prio
rity
3.S
up
po
rt P
PP
s in
in
frastru
ctu
re
4.S
up
po
rt n
ew
in
frastru
ctu
re d
evelop
men
t an
d
imp
lemen
tation
Pro
ject restructu
ring
of
existing
p
ortfo
lio
Su
pp
ort co
un
tries to
m
anag
e curren
cy, in
tere
st rate, an
d
com
mo
dity
risk
Devel
op
me
nt
Po
licy
Op
eratio
ns
and
o
ther
lend
ing
o
perat
ion
s
Acceleratin
g
disb
urse
men
ts o
f exis
ting
p
rojects
Ad
ditio
na
l fin
an
cing
(loan
an
d g
uaran
tee) fo
r on
go
ing
p
rojects
“Green
” in
frastructu
re:
advan
ce clim
ate chan
ge
and
low
carb
on
ag
end
a
Ram
p u
p su
b-
sovereig
n
lend
ing
and
related
ad
visory
services
Deferred
D
raw
do
wn
O
ptio
n (D
DO
); n
on
-IBR
D
hed
gin
g
instru
men
ts
Su
pp
ort to
p
ub
lic co
mm
itme
nts to
PP
P
pro
jects (fin
an
ce
and
ad
visory)
Increa
sed
use o
f g
uaran
tees
Inn
ov
ative in
strum
ents
: OB
A
sub
sidie
s co
mp
lemen
ting
use
r fees
C
oo
rdin
ation
with
IFC
In
frastructu
re Crisis
Facility
Ad
vice to g
overn
me
nts
that la
un
ch g
row
th an
d
job
enh
ancem
ent
pro
gram
s
Su
pp
ort to
PE
Rs
, M
TE
Fs, in
crease g
overn
men
t capa
city to
plan
, prep
are
, im
plem
ent, an
d m
anag
e in
frastructu
re as
sets
Imp
lemen
t En
ergy fo
r th
e Po
or In
itiative
OBJECTIVES ACTIONS
17
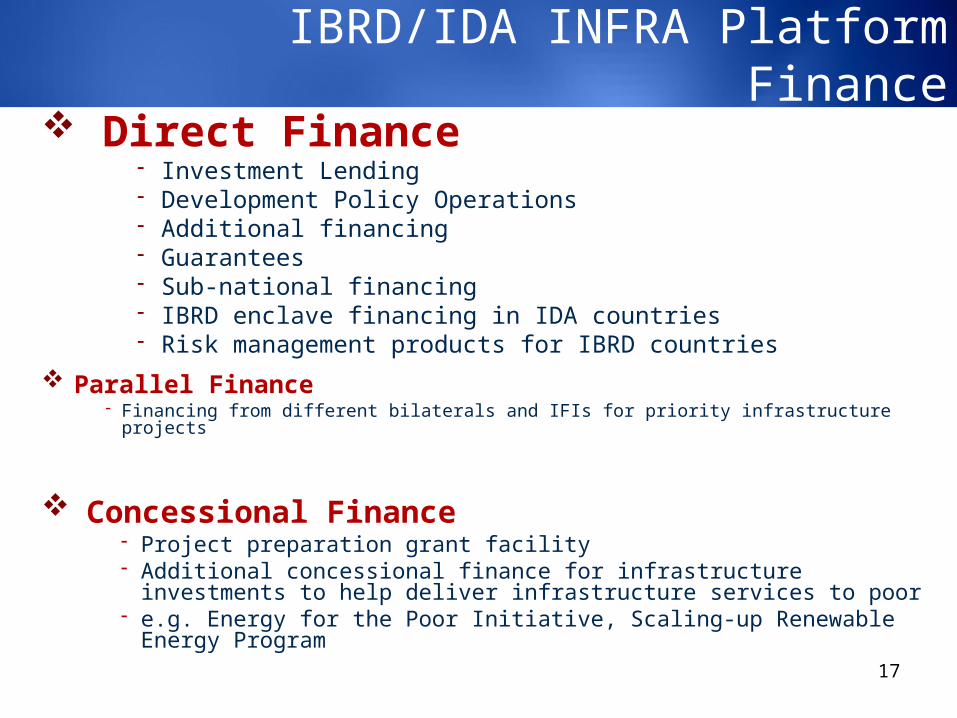
IBRD/IDA INFRA Platform Finance
Direct Finance Investment Lending Development Policy Operations Additional financing Guarantees Sub-national financing IBRD enclave financing in IDA countries Risk management products for IBRD countries
Concessional Finance Project preparation grant facility Additional concessional finance for infrastructure investments to help
deliver infrastructure services to poor e.g. Energy for the Poor Initiative, Scaling-up Renewable Energy Program
Parallel Finance Financing from different bilaterals and IFIs for priority infrastructure projects

18
IBRD/IDA INFRA Platform Energy for the Poor Initiative
Launched in June 2008, EFPI aims at preserving investments to enhance energy access to the poor during a period of changing global environment characterized by the global crisis and increasing volatility of oil prices
EFPI will
in the short term, raise grant financing to develop energy infrastructure programs with greater and direct impact on the poor; and
in the medium term, through co- and parallel financing with donors, scale up public and private sector projects that reduce the longer-term vulnerability of countries to higher oil prices.

19
The specific Africa INFRA focuses on– Regional integration e.g. large scale regional generation and transmission projects,
port facilities and access roads– Asset preservation, ‘saving’ of key projects and maintenance– Urban development e.g. expansion of basic urban services such as drainage, water,
sanitation, street lighting
Africa INFRA funds projects with a mix of short term employment generation and medium term growth impact
It targets countries willing to engage in complementary infrastructure policy reforms
The size of the Africa INFRA would be US $5-6 billion
IBRD/IDA INFRA Platform Africa INFRA

20
IBRD/IDA INFRA PlatformHow it works
REGIONAL MANAGEMENT PRIORITIZED PROJECTS
D
ES
IG
N
DIA
GN
OS
TIC
T
OO
L S
UP
PO
RT
F
RO
M
GP
P
S
EE
K
AD
DIT
IO
NA
L
CO
NC
ES
SIO
NA
L
FU
ND
IN
G S
EE
K
PA
RA
LL
EL
F
UN
DI
NG
SU
PP
OR
T
FR
OM
G
PP
SE
EK
A
DD
IT
ION
AL
C
ON
CE
SS
ION
AL
F
UN
DIN
G
GU
IDA
NC
E
NO
TE
S,
TR
AI
NIN
G, e.g
.. D
PL
, P
PP
, O
BA
MONITORING FRAMEWORK
PROCESSING
COUNTRY
MONITORI
NG
F
INANCE
D
IAGNOSTIC
ASSESSMENT
Re
gio
na
l S
en
ior
Ma
na
ge
me
nt
/Co
un
try
D
irec
tor
HOW
IT
WORKS
PROJECT
PREPARATION
SDN
COORDI
NATING
GROUP

21
IBRD/IDA INFRA Platform Diagnostic Assessment
Strategic Country Reviews Assessment of fiscal space constraints Assessment of actual needs and spending in the infrastructure
sector Assessment of sector policy, regulatory framework and
governance
Country Specific Diagnostics
INFRA Targeted Portfolio Performance Reviews Assessment of analytical gaps Identification of entry points for policy dialogue
To be partially funded through existing GPPs

22
IBRD/IDA INFRA Platform Monitoring and Reporting
INFRA Diagnostic Outcome Indicators (quarterly) At country level– Number of projects identified by RVP to have priority– Expected WBG INFRA intervention–“Green” infrastructure– Expected parallel financing– Expected numbers of jobs created or saved
INFRA Project Indicators (quarterly)– “Green” infrastructure– Status– Amount– Type of instrument: DPO, Investment Loan, Sub-sovereign, other– Amount of parallel financing
INFRA Priority Processing Indicator– Measures how quickly INFRA projects are processed against regional benchmarks
INFRA Concessional Window Indicators (quarterly)– By donor– By type of funding: TA, concessional
SIAP Portfolio Monitoring– Ongoing monitoring through Business Warehouse
COUNTRY
Re
gio
na
l S
en
ior
Ma
na
ge
me
nt
/Co
un
try
Dire
cto
r

23
IBRD/IDA INFRA PlatformNot business as usual
INFRA response will be characterized by:
Timeliness
Targeting
Productivity and growth
Swift response inthe short term e.g. projectsready for implementation
Projects that have employmentgeneration potential and are agovernment priority
Projects that remove infra. bottlenecks and enhancelong term productive capacity