Water Quality of the Great River Watershed, St. James ...nepa.gov.jm/projects/R2RW/R2RW CD -...
85
Water Quality of the Great River Water Quality of the Great River Watershed, St. James/Hanover/ Watershed, St. James/Hanover/ Westmoreland Westmoreland
Transcript of Water Quality of the Great River Watershed, St. James ...nepa.gov.jm/projects/R2RW/R2RW CD -...

Water Quality of the Great River Water Quality of the Great River Watershed, St. James/Hanover/Watershed, St. James/Hanover/
WestmorelandWestmoreland

Water Quality of the Great River Watershed, St. James/Hanover/.Westmoreland 1
Ridge to Reef Watershed Project USAID Contract No. 532-C-00-00-00235-00
Water Quality of the Great River Watershed, St. James/Hanover/
Westmoreland
March 10, 2004
Prepared for the
Government of Jamaica’s National Environment and Planning Agency
And the
United States Agency for International Development
Implemented by:
Associates in Rural Development, Inc. P.O. Box 1397
Burlington, Vermont 05402
Prepared by:
Dr. Anthony Greenaway Department of Chemistry & Centre for Marine Sciences
University of the West Indies

Water Quality of the Great River Watershed, St. James/Hanover/.Westmoreland 2
Water Quality of the Great River Watershed, St. James/Hanover/.Westmoreland 3
Table of Contents Acronyms 4 1. Scope of Report 5 2. Introduction 5 3. Sampling Methodologies 6 4. River Conditions During Study 8 5. River Water Quality Data 13
5.1 Data Presentation 13 5.2 Data Quality 37 5.3 Fresh Water Quality Standards 37 5.4 Discussion of River Sites Data 37
5.4.1 Temperature 37 5.4.2 Conductivity, pH, Acid Neutralizing Capacity, Calcium and Magnesium 38 5.4.3 Dissolved Oxygen and Chlorophyll 38 5.4.4 Total Suspended Solids 38 5.4.5 Nitrogen 39 5.4.6 Phosphorus 40 5.4.7 The Nitrogen – Phosphorus Balance 41 5.4.8 Silica 41 5.4.9 Faecal Coliforms 41 5.4.10 Pesticides 41
6. Estuarine and Marine Water Quality Data 41
6.1 Sampling Methodologies and Great River Bay Conditions during Sampling 41 6.2 Marine and Estuarine Data Presentations 42 6.3 Data Quality 68 6.4 Water Quality Standards 68 6.5 Discussion of Marine and Estuarine Data 68
6.5.1 Total Dissolved nitrogen and Phosphorus 68 6.5.2 Ammonium 69 6.5.3 Total Oxidises Nitrogen 69 6.5.4 Soluble Reactive Phosphorus 69 6.5.5 The Nitrogen – Phosphorus Balance 69 6.5.6 Silica 69 6.5.7 Total Suspended Solids 69 6.5.8 Faecal Coliforms 79
7. Conclusions 70 8. Recommendations 71 Appendices 73 Appendix I River Flow Data 73 Appendix II Analytical Methods 78
Water Quality of the Great River Watershed, St. James/Hanover/.Westmoreland 4
Appendix III Data Quality 80 Appendix IV References 81 Acronyms CC Cartagena Convention NEPA National Environment and Planning Agency NGO Non-governmental Organisation NWC National Water Commission R2RW Ridge to Reef Watershed Project UNEP-CEP United National Environmental Program-Caribbean Environmental Program USA United States of America USEPA United States Environmental Protection Agency UWI University of the West Indies WRA Water Resources Authority Figures Figure 1 Map of Watershed and Sampling Sites 7 Figure 2 River Flow at Sampling Sites 12 Tables Table 1 River Sampling Sites 6 Table 2 Flow Data for Sampling Days 8 Data Sheet 1 Flow at Lethe 1996 – July 2003. 10 Table 3 Data Quality Parameters 13 Data sheet 2 Site 1 – Stonehenge 15 Data sheet 3 Site 2 – Chesterfield Bridge 17 Data sheet 4 Site 3 – Marchmont 19 Data sheet 5 Site 4 – Retrieve 21 Data sheet 6 Site 4a – Quashies River 23 Data sheet 7 Site 5 – Ducketts 25 Data sheet 8 Site 6 – Hazylymph 27 Data sheet 9 Site 6a – Seven Rivers 29 Data sheet 10 Site 7 – Lethe 31 Data sheet 11 Site 8 – Unity Hall Dam 33 Data sheet 12 Site 9 – 150 meters below Unity Hall Dam 35 Data sheet 13 Marine and Estuarine Sites, March 8, April 7-8, 2002 44 Data sheet 14 Marine and Estuarine Sites, May 20-21, 2002 46 Data sheet 15 Marine and Estuarine Sites, July 3-4, 2002 48 Data sheet 16 Marine and Estuarine Sites, August 6-7, 2002 50 Data sheet 17 Marine and Estuarine Sites, September 11-12, 2002 52 Data sheet 18 Marine and Estuarine Sites, October 23-34, 2002 54 Data sheet 19 Marine and Estuarine Sites, November 26-27, 2002 56 Data sheet 20 Marine and Estuarine Sites, February 4-5, 2003 58 Data sheet 21 Marine and Estuarine Sites, March 25-26, 2003 60 Data sheet 22 Marine and Estuarine Sites, May 6-7, 2003 62 Data sheet 23 Marine and Estuarine Sites, June 3-4, 2003 64 Data sheet 24 Marine and Estuarine Sites, July 13-14, 2003 66 Table 4 Water Quality Standards for Embayments and Coastal
Waters in Hawaii 70

Water Quality of the Great River Watershed, St. James/Hanover/.Westmoreland 5
1. Scope of Report This report presents the data generated from the titled study and interprets those data to the extent of the following stated aims of the study: i) Quantify, with respect to the selected parameters the quality of the water in the Great River
and the coastal area at its mouth, ii) Illustrate, through the data generated, how the water quality varies along the river and
thereby identify possible point and non-point sources of contaminants to the river, iii) Quantify the impact of the river on the coastal waters in the area of the river’s mouth, iv) Recommend, after monitoring at the selected sampling sites for twelve months, a long term
water quality monitoring programme for the watershed. A stated fifth aim of the study was: v) To compare the water qualities of the Great River and the Rio Buneo, St Ann/Trelawny and
thereby assess the impacts of the extent of differing land-use practises on these two rivers which have similar origins.
This aim will not be addressed in this report but will be considered in the Masters of Philosophy thesis which Miss Kayan Campbell will be producing. Within that thesis she will also give a fuller interpretation of all data generated within the study. It is anticipated that the thesis will be available in the last quarter of 2004. 2. Introduction The study was developed after a geographical, geological and sociological description of the watershed had been completed (Hayman, 2001) and began in February/March 2002 with two field trips to select the study sampling sites and to generate some initial data. Regular sampling began in April 2002 and ended in July 2003. A total of thirteen sampling exercises were conducted. The sites and dates of sampling are detailed in the data tables that follow. The sites are shown on the map of the watershed (Figure 1). The data have been considered in three parts. Initially the sampling methodologies and the conditions that prevailed at the times of sampling are presented. The river site data are then illustrated and finally the impact of the river on Great River Bay assessed. Technical details are available through appendices. The report ends with a summary of the conclusions reached and some recommendations for actions within the watershed which could lead to improved water quality.
Water Quality of the Great River Watershed, St. James/Hanover/.Westmoreland 6
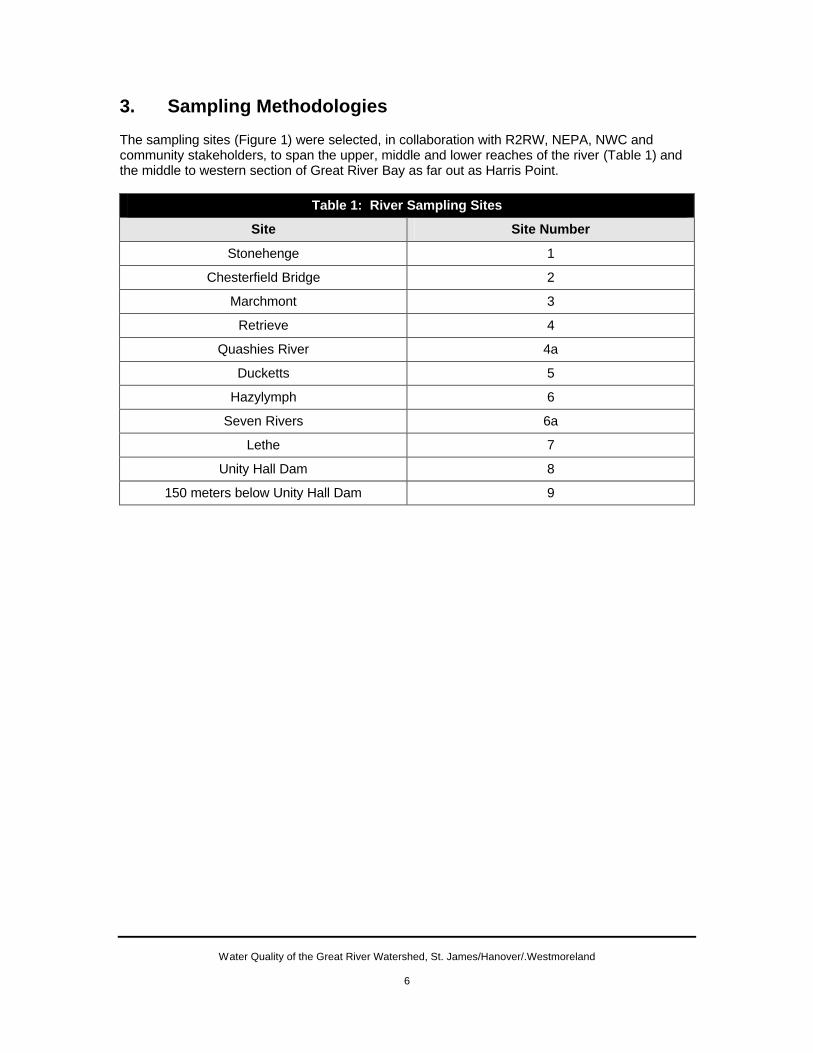
3. Sampling Methodologies The sampling sites (Figure 1) were selected, in collaboration with R2RW, NEPA, NWC and community stakeholders, to span the upper, middle and lower reaches of the river (Table 1) and the middle to western section of Great River Bay as far out as Harris Point.
Table 1: River Sampling Sites
Site Site Number
Stonehenge 1
Chesterfield Bridge 2
Marchmont 3
Retrieve 4
Quashies River 4a
Ducketts 5
Hazylymph 6
Seven Rivers 6a
Lethe 7
Unity Hall Dam 8
150 meters below Unity Hall Dam 9

Water Quality of the Great River Watershed, St. James/Hanover/.Westmoreland 7
Figure 1: Map of Watershed and Sampling Sites
Map by– T. Edwards, NEPA
6a. Seven Rivers
7. Lethe
Unity Hall, Estuarine & Marine
6 0 6 12 Kilometers
N
The Great River Watershed Management Unit
Contour 184 - 12431244 - 24982499 - 41024103 - 60836084 - 9991
Town or VillageRoadsRiversGreat River WMU
LEGEND
1: 50 000 Scale
#
Lambs River
York
Lethe
Copse
Amity
RAMBLE
Ruseas
Dundee
Content
Belmont Reading
ANCHOVY
Mafoota
CATADUPA
Rat Trap
Ducketts
Belvedere
Roehamton
CAMBRIDGE
Marchmont
Stonehenge
Guava Walk
Montpelier
Retrieve
Bickersteth
BETHEL TOWN
Seven Rivers
SEAFORD TOWN
Cacoon Castle
Chesterfield Bridge
Great River
Great River
#
#
#
#
#
#
#
#
#
#
#
#
##
#
#
#
#
#
#
#
#
#
#
#
##
#
# 1. Stonehenge
2. Chesterfield Bridge
3. Marchmont
4. Retrieve
4a. Quashies River
6 Hazylymph
6a Seven Rivers
5 Ducketts
7. Lethe
Harris Point
Unity Hall
Great River Bay

Water Quality of the Great River Watershed, St. James/Hanover/.Westmoreland 8
Stonehenge was selected to represent the river source waters because of the consistent flow at the site and it is a site where the NWC extract potable water. Sampling trips extended over two days with the river sites between Stonehenge (approximately 8.00am) and Lethe (approximately 3.00pm) being sampled on the first day and the marine (approximately 7.00am), estuarine and the Unity Hall river sites (approximately 11.00am) being sampled on the following morning. River sites were normally sampled in the same sequence (upper river to lower river), although afternoon heavy rains (trip 13) or time constraints (trips 5 and 8) occasionally made it impossible to complete the river sampling and so remaining sites (Lethe, Seven Rivers and Lethe respectively) were sampled after the marine sites on the following morning. Sampling normally involved the collection of water samples for faecal coliforms and chemical parameters, the instrumental recording of some parameters while at the sites and the measurement of flow at the river sites. All fresh water samples were taken at approximately mid-stream except at the Unity Hall Dam where samples were taken from the dam structure to the west of the river and at the end of the road. Marine and estuarine samples were collected from a small boat. Samples were immediately placed on ice for transportation to the laboratories. Coliform samples were couriered to NEPA’s Kingston laboratory on the day of their collection, samples arriving at the laboratory the following morning. During the September 2002 and February 2003 sampling trips sediment samples were collected for pesticide analyses. Miss Kayan Campbell led all sampling field trips and was assisted by, from time to time, Mr. Barrington Taylor (NEPA), Mrs. Debbie-Ann Gordon-Smith (UWI) and Dr. Anthony M. Greenaway (UWI). There were at least two persons on each field trip. Mr. Gary Hales from the Unity Hall community transported samplers to the coastal and estuarine sites in his boat.
4. River Conditions During the Study In order to assess how representative the data generated from the sampling exercises are of general river conditions, the flow of the river was routinely measured at all sites whenever possible. As will be shown the majority of the flow within the river occurs over only about 20% of the days of any year. It is during those times that the impact of the river water quality on the coastal waters will be most significant. On the other hand the impact of water quality on communities will be most significant during the lower flow regimes (more likely times for access to the river). Flow was determined by two methods and by cross comparisons best estimates of flow at the sites on each sampling occasion have been arrived at (Table 2). The details of the measurement and cross calibration procedures are detailed in Appendix I.
Table 2: Flow Data for Sampling Days
Flow percentiles based on Jan 1996 - July 2003 flow data at Lethe
Sampling Date Trip number Flow m3/sec Percentile
February 7/March 8, 2002 1 1.6 10
April 09, 2002 2 1.2 3
May 21, 2002 3 2.5 26
July 03, 2002 4 13.8 80
August 07, 2002 5 13.6 79
September 11, 2002 6 16.3 85

Water Quality of the Great River Watershed, St. James/Hanover/.Westmoreland 9
Table 2: Flow Data for Sampling Days
Flow percentiles based on Jan 1996 - July 2003 flow data at Lethe
Sampling Date Trip number Flow m3/sec Percentile
October 23, 2002 7 24.0 93
November 27, 2002 8 8.2 62
February 04, 2003 9 5.8 50
March 25, 2003 10 2.3 24
May 06, 2003 11 2.3 24
June 02, 2003 12 8.3 63
July 15, 2003 13 4.8 43 The WRA’s daily flow data for Lethe have been used as the accurate data. A summary of their data from January 1996 to July 2003 are presented on Data sheet 1. Each year’s data are presented graphically (flow vs day of year) with the water sampling days being indicated on the 2002 and 2003 graphs. The data were also ranked according to magnitude and flow percentiles identified. For example in 1996 the maximum daily flow was 50.4m3/sec (100%) and 50% of the time the flow was less than or equal to 8.6 m3/sec. The percentiles for the flow on sampling days are presented in Table 2.

Water Quality of the Great River Watershed, St. James/Hanover/.Westmoreland
10
Data Sheet 1 Flow at Lethe 1996 – July 2003
1996 1997 1998 1999 2000 2001 2002 1996 - 2003
50.4 100.0% 33.0 100.0% 46.6 100.0% 65.6 100.0% 40.6 100.0% 37.8 100.0% 481.4 100.0% 481.4 100.0%
32.8 97.3% 18.7 97.5% 27.6 97.5% 28.9 97.5% 29.9 97.5% 28.0 97.5% 65.5 97.5% 33.0 97.5%
29.3 94.9% 15.9 95.0% 19.4 95.0% 24.2 95.0% 23.6 95.0% 25.0 95.0% 45.1 95.0% 27.0 95.0%
24.5 90.1% 13.0 90.1% 14.0 89.8% 18.6 90.1% 17.9 90.1% 20.0 90.0% 30.1 90.1% 19.7 90.0%
17.8 79.9% 8.9 79.9% 10.1 79.9% 13.3 79.9% 12.5 80.0% 16.2 79.8% 19.3 79.9% 14.0 80.0%
14.4 70.3% 5.9 70.0% 8.4 69.2% 10.6 70.3% 9.6 70.4% 12.1 70.2% 14.6 70.0% 10.4 70.0%
11.4 60.1% 4.1 59.6% 7.1 60.1% 8.9 59.8% 7.0 60.2% 7.5 59.5% 11.8 60.1% 7.8 60.1%
8.6 50.0% 3.3 50.2% 5.6 50.2% 6.6 49.7% 5.4 49.8% 5.8 49.8% 8.4 50.0% 5.8 50.0%
6.5 39.8% 2.8 40.1% 3.3 40.6% 5.2 40.6% 4.2 40.5% 4.4 39.9% 5.2 40.3% 4.3 40.0%
5.2 29.9% 2.2 30.4% 1.8 30.4% 3.8 30.4% 2.3 30.6% 2.8 30.0% 2.6 29.6% 3.0 30.0%
4.0 20.3% 1.8 20.0% 1.4 18.4% 2.8 20.0% 1.8 20.0% 2.2 19.8% 1.7 19.7% 2.0 19.9%
2.8 10.1% 1.5 10.1% 1.3 10.9% 2.1 10.7% 1.3 9.8% 1.8 10.4% 1.5 8.7% 1.5 10.0%
1.8 0.0% 0.8 0.0% 1.1 0.0% 1.6 0.2% 1.0 0.0% 1.0 0.0% 1.2 0.0% 0.8 0.0%
Table Key - For each year: flow (m3/sec) in first column and percentile for that year in second column

Water Quality of the Great River Watershed, St. James/Hanover/.Westmoreland
11
Data sheet 1: Flow at Lethe 1996 - July 2003
Graph Key
Flow m3/sec on y axis Day of the year on x axis
Sampling days indicated with arrows

Water Quality of the Great River Watershed, St. James/Hanover/.Westmoreland
12
Flow is clearly variable from year to year. It is normally low during the first 80 to 160 days of the year and for 60 to 70% of the time the flow is less than about 10m3/sec. The final two columns of the Data sheet 1 table present a compilation of all of the data for the 1996 to 2003 period. The majority of the water flowing to the coast over the period occurred over only 20% of the time (the upper 80% of the flow). In fact 50% of the water reaching the coast during the 1996 – 2003 period (2700 days) was delivered over only 540 days (about 70 days per year). A significant point arising from the Lethe flow data is that the flow was unusually high from May 2002 to July 2003. This is detailed in Table 2 which gives the flow at Lethe on the sampling days and the 1996-2003 flow percentile. Eight of sampling occasions occurred during mid (trips 8, 9, 12 and 13) or high (trips 4 – 7) flow conditions. Only trips 1 – 3, 10 and 11 can be considered as representative of low flow conditions and trip 11 occurred 20 days after a significant flow. It will be important to remember this when interpreting the water quality data and when planning a long term monitoring programme. As detailed in Appendix I the flow at sites other than Lethe followed a similar trend, when the flow was high at Lethe it was usually also high at the other sites. The flows at all sites above Lethe however were relatively very low (Figure 2, Sites 4a and 6a are tributaries).
Figure 2: River Flow at Sampling Sites
0.00
5.00
10.00
15.00
20.00
25.00
1 2 3 4 4a 5 6 6a 7 9
site
flo
w (
m3 /
sec)
Apr-02
Mar-03
May-03
May-02
Feb-03
Nov-02
Jun-03
Jul-03
Aug-02
Jul-02
Sep-02
Oct-02
This suggests that the water quality at the above Lethe sites will be having minimal effect on the river water quality at down river sites. Contamination of the river above Lethe will be predominantly from localised rather than up-river sources and be of mainly local concern. The drop in flow between Lethe and below the Unity Hall dam is due to the Unity Hall NWC take-off (on average 8.5 million gallons per day or about 0.5m3/sec; the occasional very large changes are at the moment unexplained).

Water Quality of the Great River Watershed, St. James/Hanover/.Westmoreland
13
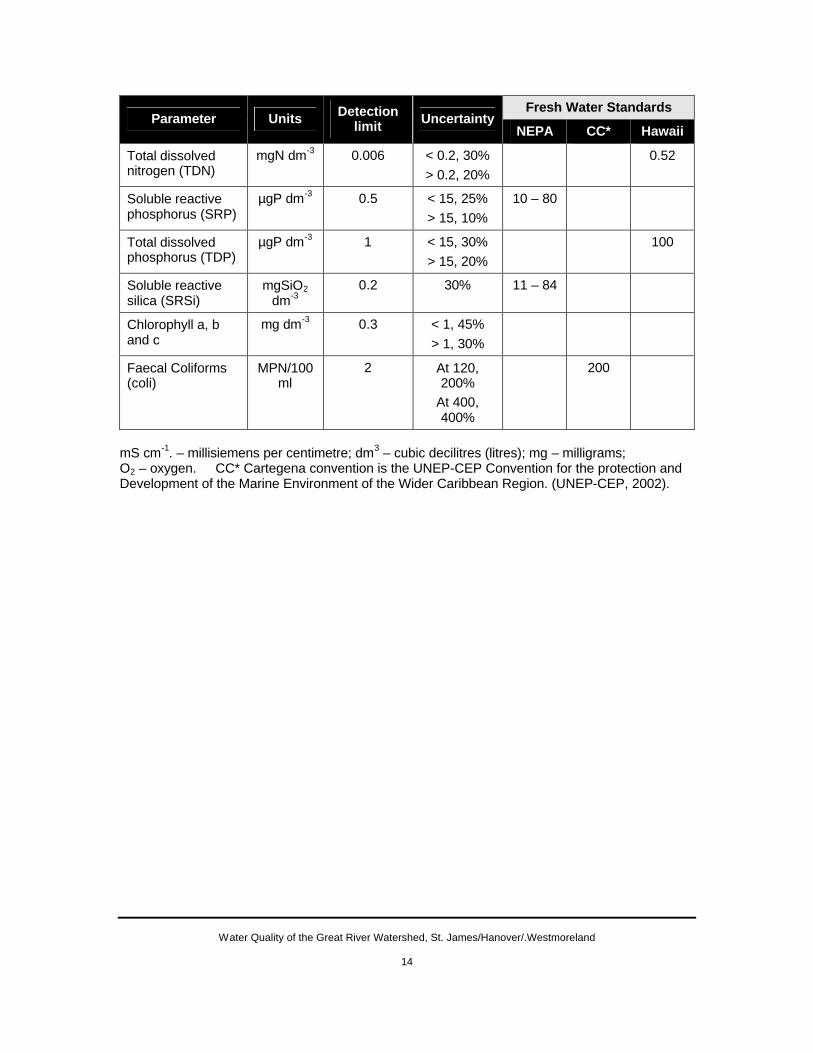
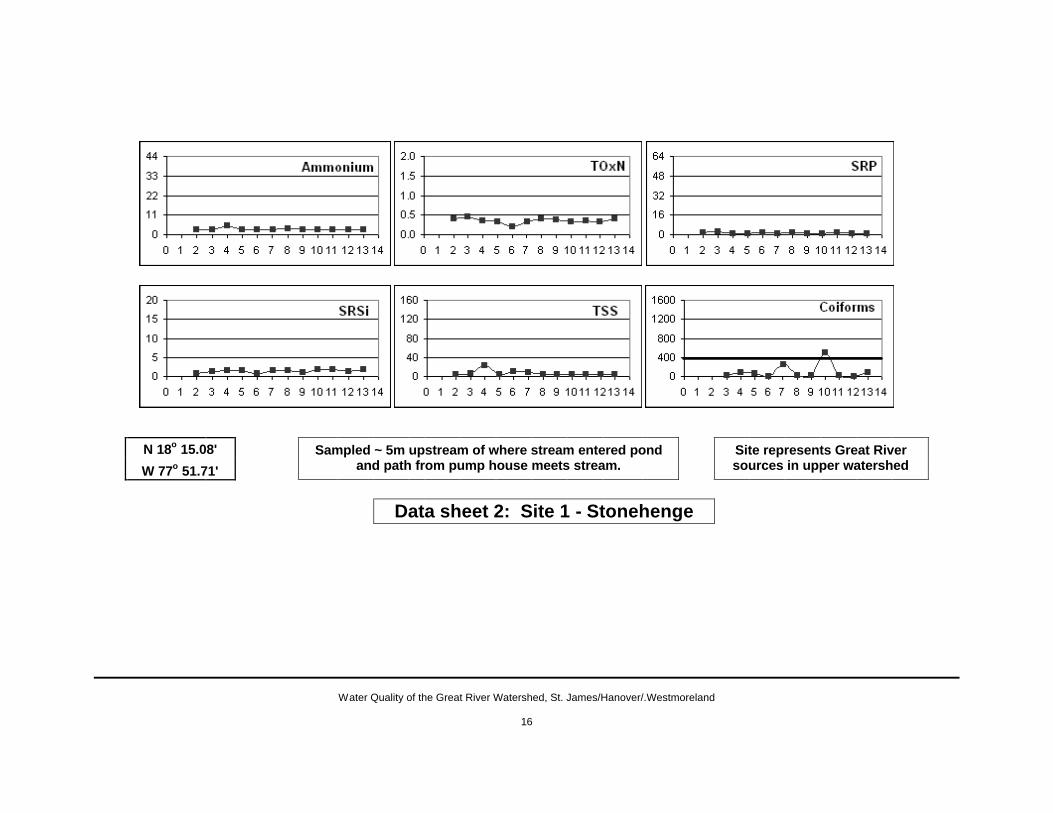
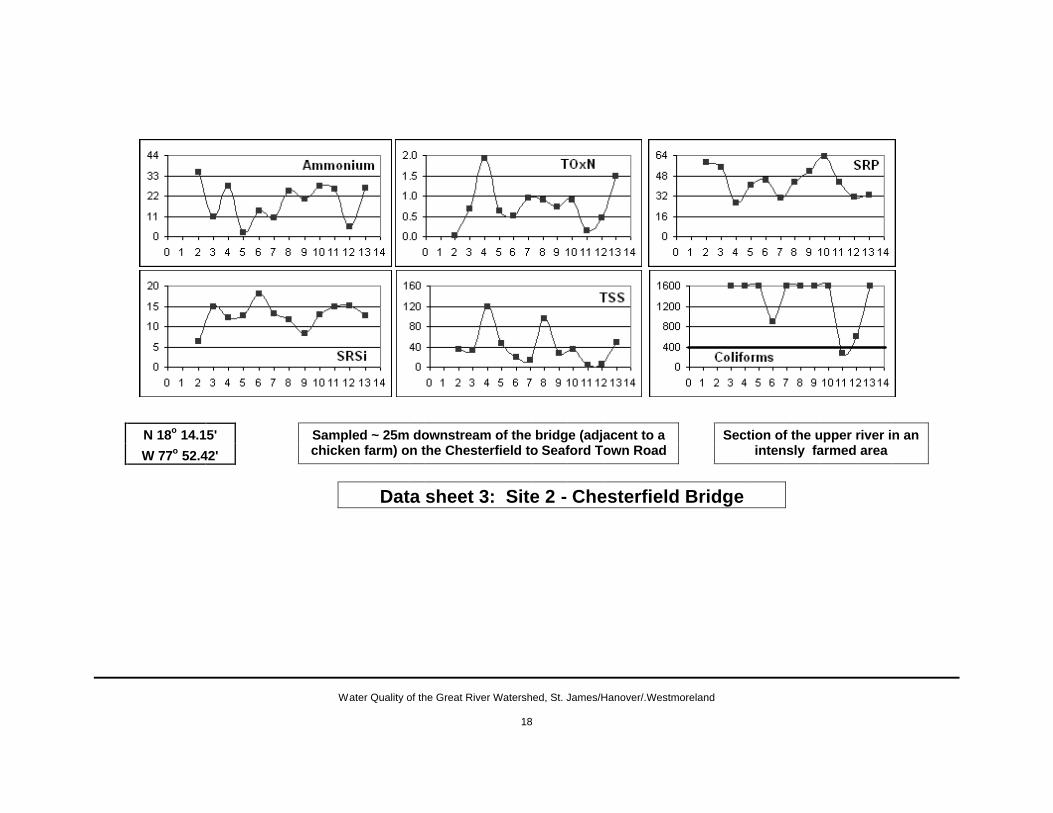
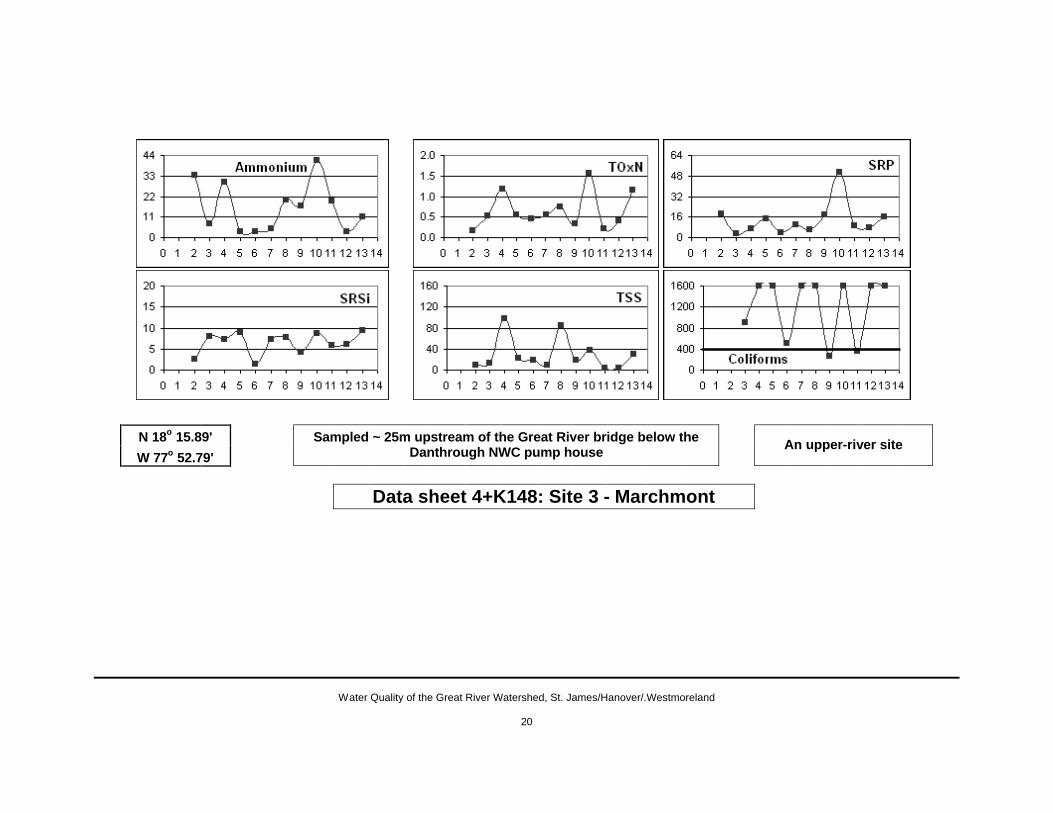
5. River Water Quality Data 5.1 Data Presentation The data for the river sites are presented on data sheets 2 – 12, one site per page. Abbreviations used in the table are explained (amongst other things) in Table 3 which also gives the units for each parameter. The first two columns of the Data sheet tables give the dates of sampling and the sampling trip number. The third column indicates the flow conditions that prevailed on each trip (l- low, m- medium, h – high; Table 2). The four parameters measured in the field are presented in the next four columns and the laboratory generated chemical and bacterial data in the remaining columns. For all laboratory chemical parameters samples were filtered prior to the analyses (Appendix II). Not all analytes were determined on all trips resulting in some gaps in the tables. Whenever analytes were not detected the concentration has been given as 2/3rds of the detection limit. The last two rows of the tables give the arithmetic averages and standard deviations (geometric average for faecal coliforms) for the parameters. Below the data tables are graphs of key water quality parameters. The concentrations (y axes) are plotted against trip number (x axes). For any one parameter the scales on the y axes are consistent for all sites. For TSS at site 8 on trip 4 the concentration of 279mg dm-3 exceeded the maximum for the y axis. The line at 400 MPN/100mL on the faecal coliform plots is the upper limit for safe use of recreational waters when occasional samples are analysed (section 5.3). Table 3 Data Quality Parameters
Fresh Water Standards Parameter Units Detection
limit Uncertainty NEPA CC* Hawaii
Conductivity (Cond)
mS cm-1 0.01 ± 0.01 150 – 600
300
Temperature Temp)
Celsius ± 0.1
Dissolved oxygen (DO)
mgO2 dm-
3 5%
pH ± 0.1 7.0 -8.4 5 – 10
Acid Neutralizing Capacity (ANC)
meq dm-
3 5%
Calcium (Ca) mgCa dm-
3 0.5 2% 40 –
101
Magnesium (Mg) mgMg dm-3
1 5% 3.6 – 27
Total suspended solids (TSS)
mg dm-3 4 <10, 50% >10, 20%
30 50
Ammonia (NH3) µgN dm-3 4 25%
Nitrate + nitrite (TOxN)
mgN dm-3 0.003 < 0.5, 20% > 0.5, 10%
0.1 – 7.5
0.18
Water Quality of the Great River Watershed, St. James/Hanover/.Westmoreland
14
Fresh Water Standards Parameter Units Detection
limit Uncertainty NEPA CC* Hawaii
Total dissolved nitrogen (TDN)
mgN dm-3 0.006 < 0.2, 30% > 0.2, 20%
0.52
Soluble reactive phosphorus (SRP)
µgP dm-3 0.5 < 15, 25% > 15, 10%
10 – 80
Total dissolved phosphorus (TDP)
µgP dm-3 1 < 15, 30% > 15, 20%
100
Soluble reactive silica (SRSi)
mgSiO2 dm-3
0.2 30% 11 – 84
Chlorophyll a, b and c
mg dm-3 0.3 < 1, 45% > 1, 30%
Faecal Coliforms (coli)
MPN/100ml
2 At 120, 200%
At 400, 400%
200
mS cm-1. – millisiemens per centimetre; dm3 – cubic decilitres (litres); mg – milligrams; O2 – oxygen. CC* Cartegena convention is the UNEP-CEP Convention for the protection and Development of the Marine Environment of the Wider Caribbean Region. (UNEP-CEP, 2002).

Water Quality of the Great River Watershed, St. James/Hanover/.Westmoreland
15
Data Sheet 2 Site 1 - Stonehenge
Cond Temp DO pH ANC Ca Mg TSS NH4+ TOxN TDN SRP TDP SRSi Chlorophyll
a b c Coli. Date trip
no. flow
Field Parameters Laboratory Parameters
7-Feb-02 1 l
8-Apr-02 2 l 0.23 22.0 6.5 7.8 1.25 42 5.1 4 3.0 0.40 1.9 0.9
21-May-02 3 l 0.23 22.0 9.0 7.8 7 3.0 0.45 2.5 0.6 1.4 0.6 0.9 1.1 30
3-Jul-02 4 h 0.24 22.0 8.1 7.8 22 4.8 0.35 0.5 1.7 80
7-Aug-02 5 h 0.24 21.9 7.1 7.8 4 3.0 0.33 0.5 5.0 1.7 1.1 1.3 1.8 70
11-Sep-02 6 h 0.23 22.0 8.8 7.9 11 3.0 0.20 1.7 1.6 0.8 1.2 1.6 1.8 5
23-Oct-02 7 h 0.21 21.9 8.7 8.0 2.16 38 0.5 8 3.0 0.33 0.30 0.5 2.5 1.6 240
26-Nov-02 8 m 0.22 22.0 8.3 8.2 4 3.5 0.40 1.2 1.5 0.1 0.1 0.1 13
4-Feb-03 9 m 0.23 21.9 8.5 8.2 3.48 35 5.6 4 3.0 0.39 0.62 0.5 2.8 1.0 0.1 0.1 0.1 13
25-Mar-03 10 l 0.29 22.8 8.1 8.3 4.27 4 3.0 0.33 0.34 0.5 4.7 1.9 1.8 1.6 1.7 500
6-May-03 11 l 0.19 21.9 8.6 8.0 4 3.0 0.36 0.07 1.2 2.3 1.9 0.1 0.1 0.2 14
2-Jun-03 12 m 0.21 22.0 9.4 8.0 3.02 4 3.0 0.34 0.38 0.5 2.5 1.4 4
14-Jul-03 13 m 0.22 22.1 8.6 8.1 4 3.0 0.40 0.41 0.6 2.5 1.7 0.1 0.1 0.4 80
average 0.23 22.0 8.3 8.0 2.84 38 3.7 7 3.2 0.36 0.35 1.0 2.7 1.5 0.6 0.7 0.9 34
std. dev. 0.02 0.2 0.8 0.2 1.17 3 2.8 5 0.5 0.06 0.18 0.7 1.4 0.4 0.7 0.7 0.8
Water Quality of the Great River Watershed, St. James/Hanover/.Westmoreland
16
N 18o 15.08'
W 77o 51.71'
Sampled ~ 5m upstream of where stream entered pond and path from pump house meets stream.
Site represents Great River sources in upper watershed
Data sheet 2: Site 1 - Stonehenge

Water Quality of the Great River Watershed, St. James/Hanover/.Westmoreland
17
Data Sheet 3 Site 2 – Chesterfield Bridge
Cond Temp DO pH ANC Ca Mg TSS NH4+ TOxN TDN SRP TDP SRSi Chlorophyll
a b c Coli. Date trip
no. flow
Field Parameters Laboratory Parameters
7-Feb-02 1 l
8-Apr-02 2 l 0.41 27.4 7.7 8.3 2.07 72 4.1 35 35 0.02 58 6.3 4.1
21-May-02 3 l 0.52 25.9 6.8 7.8 33 11 0.68 55 20 15 1.6 1.6 1.6 1601
3-Jul-02 4 h 0.33 24.3 6.8 7.7 119 28 1.92 27 12 1601
7-Aug-02 5 h 0.34 24.1 6.1 7.6 46 2.1 0.63 41 47 13 1.7 1.5 1.7 1600
11-Sep-02 6 h 0.49 25.4 7.0 7.9 20 14 0.50 45 28 18 1.6 1.9 3.4 900
23-Oct-02 7 h 0.40 23.6 7.7 8.2 3.89 68 0.5 14 9.9 0.95 0.93 30 7 13 1601
26-Nov-02 8 m 0.30 23.4 7.4 7.9 97 25 0.90 43 12 2.1 1.0 2.1 1601
4-Feb-03 9 m 0.39 22.0 6.9 8.0 3.43 57 12.4 28 20 0.74 1.49 51 60 8.4 0.8 0.2 0.1 1601
25-Mar-03 10 l 0.34 23.4 6.8 7.9 4.56 35 27 0.90 1.64 63 67 13 2.7 1.5 1.1 1601
6-May-03 11 l 0.39 24.4 7.3 8.0 4 26 0.15 0.21 43 31 15 1.0 0.1 0.1 280
2-Jun-03 12 m 0.46 23.9 8.1 8.0 5.98 6 5.3 0.47 0.68 31 28 15 600
14-Jul-03 13 m 0.32 23.5 7.8 8.0 48 26 1.49 1.56 33 37 13 0.9 0.4 0.3 1601
average 0.39 24.3 7.2 7.9 3.99 66 5.7 40 19 0.78 1.08 43 36 13 1.8 1.0 1.3 1186
std. dev. 0.07 1.4 0.6 0.2 1.44 8 6.1 35 10 0.53 0.58 12 19 3 1.0 0.7 1.1
Water Quality of the Great River Watershed, St. James/Hanover/.Westmoreland
18
N 18o 14.15'
W 77o 52.42'
Sampled ~ 25m downstream of the bridge (adjacent to a chicken farm) on the Chesterfield to Seaford Town Road
Section of the upper river in an intensly farmed area
Data sheet 3: Site 2 - Chesterfield Bridge

Water Quality of the Great River Watershed, St. James/Hanover/.Westmoreland
19
Data Sheet 4 Site 3 – Marchmont
Cond Temp DO pH ANC Ca Mg TSS NH4+ TOxN TDN SRP TDP SRSi Chlorophyll
a b c Coli. Date trip
no. flow
Field Parameters Laboratory Parameters
7-Feb-02 1 l
8-Apr-02 2 l 0.34 23.6 7.2 8.0 1.84 60 13.4 10 34 0.18 18 2.6 3.1
21-May-02 3 l 0.38 24.9 8.6 7.9 14 7.3 0.52 3.1 11 8.1 1.9 1.7 2.0 900
3-Jul-02 4 h 0.28 23.7 6.8 7.8 97 30 1.19 1.57 6.8 7.3 1601
7-Aug-02 5 h 0.36 24.0 6.9 7.8 22 3.0 0.54 15 17 9.0 1.8 1.9 3.1 1601
11-Sep-02 6 h 0.33 23.8 8.2 8.2 18 3.0 0.46 4.0 5.9 1.4 1.5 1.6 2.0 500
23-Oct-02 7 h 0.28 23.6 8.5 8.3 3.22 57 6.6 10 4.9 0.56 0.54 9.9 3.4 7.4 1600
26-Nov-02 8 m 0.28 24.0 7.6 8.0 85 20 0.74 6.2 7.8 1.7 0.1 0.1 1601
4-Feb-03 9 m 0.33 22.1 7.9 8.2 3.19 56 6.4 18 17 0.34 0.93 18 16 4.2 0.7 0.1 0.1 270
25-Mar-03 10 l 0.26 23.8 7.1 7.9 3.20 38 41 1.56 1.93 51 61 8.7 3.1 1.7 1.5 1601
6-May-03 11 l 0.27 23.9 8.0 8.1 4 20 0.22 0.55 9.0 9.6 5.8 0.6 0.1 0.1 350
2-Jun-03 12 m 0.31 22.9 9.2 8.1 4.22 4 3.0 0.41 0.50 7.8 8.1 6.1 1600
14-Jul-03 13 m 0.24 23.4 8.6 8.0 30 11 1.15 1.38 16 31 9.5 1.7 0.8 1.3 1601
average 0.31 23.6 7.9 8.0 3.13 58 8.8 29 16 0.66 1.06 14 18 6.5 1.8 1.0 1.3 1012
std. dev 0.04 0.7 0.8 0.2 0.85 2 4.0 31 13 0.43 0.57 13 18 2.6 0.9 0.8 1.1
Water Quality of the Great River Watershed, St. James/Hanover/.Westmoreland
20
N 18o 15.89'
W 77o 52.79'
Sampled ~ 25m upstream of the Great River bridge below the Danthrough NWC pump house
An upper-river site
Data sheet 4+K148: Site 3 - Marchmont

Water Quality of the Great River Watershed, St. James/Hanover/.Westmoreland
21
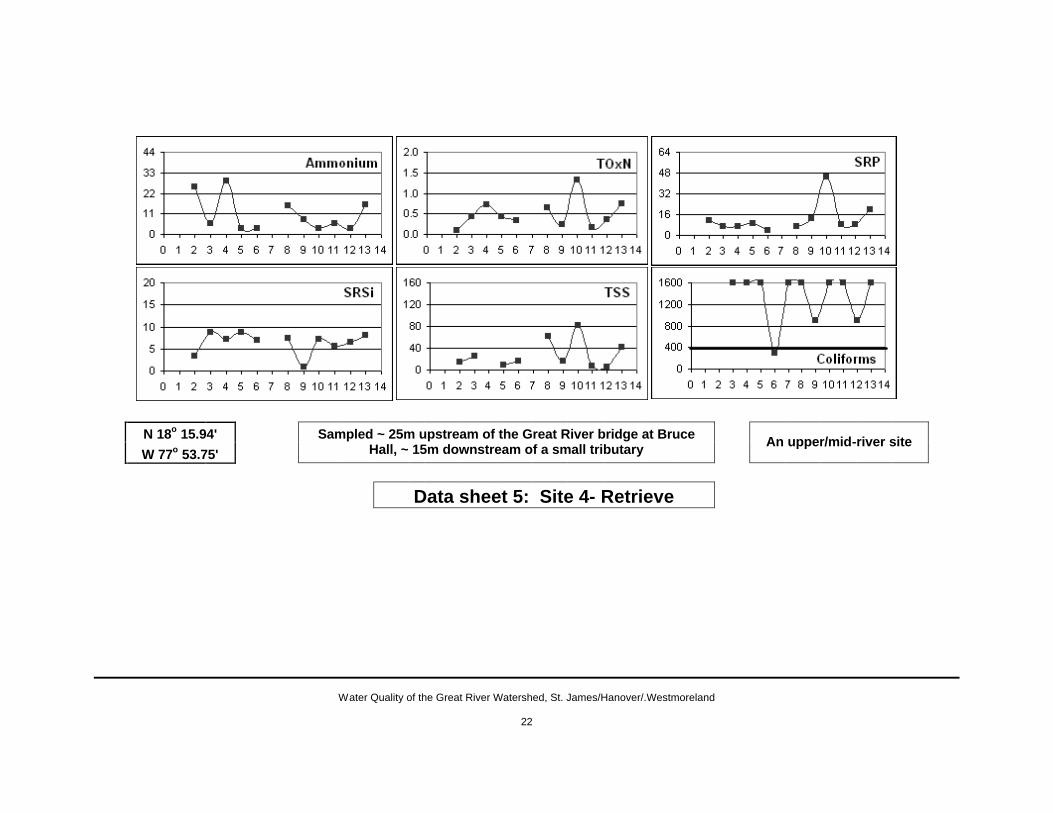
Data Sheet 5 Site 4 – Retrieve
Cond Temp DO pH ANC Ca Mg TSS NH4+ TOxN TDN SRP TDP SRSi
Chlorophyll a b c Coli.
Date trip no. flow Field Parameters Laboratory Parameters
7-Feb-02 1 l
8-Apr-02 2 l 0.34 26.0 6.1 8.1 1.80 62 5.8 14 25 0.09 11 3.4 2.5
21-May-02 3 l 0.38 25.3 8.9 8.2 25 5.9 0.45 6.8 18 8.8 1.9 1.7 1.8 1601
3-Jul-02 4 h 0.29 24.6 7.5 8.0 29 0.73 7.1 7.1 1601
7-Aug-02 5 h 0.36 24.4 7.0 8.2 9 3.0 0.44 9.3 17 8.8 1.9 1.8 2.2 1600
11-Sep-02 6 h 0.34 24.7 8.5 8.3 17 3.0 0.34 4.0 4.7 6.9 1.5 1.8 300
23-Oct-02 7 h 0.30 24.0 8.4 8.4 1601
26-Nov-02 8 m 0.26 23.9 7.9 8.2 62 15 0.64 6.8 7.5 1.6 0.6 0.8 1601
4-Feb-03 9 m 0.34 22.8 8.8 8.4 3.23 56 7.0 16 8.0 0.25 0.37 13 13 0.8 0.3 0.1 0.1 900
25-Mar-03 10 l 0.22 24.3 7.6 8.0 2.81 82 3.0 1.32 1.99 45 52 7.1 2.7 2.4 2.8 1601
6-May-03 11 l 0.26 25.7 8.9 8.3 7 5.9 0.17 0.15 8.1 9.0 5.7 0.4 0.1 0.2 1601
2-Jun-03 12 m 0.32 23.7 9.3 8.3 4.22 6 3.0 0.37 0.43 8.4 12 6.4 900
14-Jul-03 13 m 0.25 24.0 8.6 8.3 41 16 0.76 1.07 20 27 8.2 1.2 0.2 0.3 1601
average 0.30 24.5 8.1 8.2 3.02 59 6.4 28 11 0.50 0.80 13 19 6.4 1.6 1.1 1.2 1238
std. dev. 0.05 0.9 0.9 0.1 1.00 4 0.9 26 9 0.35 0.75 11 15 2.4 0.8 0.9 1.1
Water Quality of the Great River Watershed, St. James/Hanover/.Westmoreland
22
N 18o 15.94'
W 77o 53.75'
Sampled ~ 25m upstream of the Great River bridge at Bruce Hall, ~ 15m downstream of a small tributary
An upper/mid-river site
Data sheet 5: Site 4- Retrieve

Water Quality of the Great River Watershed, St. James/Hanover/.Westmoreland
23
Data Sheet 6 Site 4a – Quashies River
Cond Temp DO pH ANC Ca Mg TSS NH4+ TOxN TDN SRP TDP SRSi Chlorophyll
a b c Coli. Date trip
no. flow
Field Parameters Laboratory Parameters
7-Feb-02 1 l
8-Apr-02 2 l 0.45 25.7 2.0 7.6 2.49 72 3.4 12 28 0.01 64 9 8.5
21-May-02 3 l 0.42 25.2 7.6 8.0 26 3.0 0.20 31 38 11 1.5 1.8 1.6 1601
3-Jul-02 4 h 0.30 25.1 6.9 7.8 144 13 0.32 0.83 6.2 10 1601
7-Aug-02 5 h 0.40 24.9 6.3 7.8 16 3.0 0.21 20 16 12 1.4 1.6 1.8 1600
11-Sep-02 6 h 0.45 25.1 7.4 8.0 16 3.0 0.21 38 26 14 1.3 1.6 1.9 900
23-Oct-02 7 h 0.38 24.8 7.8 8.2 3.20 74 5.3 24 4.2 0.27 0.05 22 8 13 1601
26-Nov-02 8 m 0.39 24.4 7.1 8.1 12 11 0.27 26 12 0.5 0.1 0.1 1601
4-Feb-03 9 m 0.43 24.0 7.2 8.1 4.07 73 7.8 4 6.3 0.01 0.01 33 20 9 0.2 0.1 0.1 140
25-Mar-03 10 l 0.37 24.4 6.8 7.5 5.97 4 22 0.02 0.40 29 35 14 1.6 1.5 1.2 360
6-May-03 11 l 0.36 27.4 6.3 7.9 4 3.0 0.07 0.11 26 17 13 0.1 0.1 0.1 70
2-Jun-03 12 m 0.43 23.9 8.0 8.0 6.04 4 3.0 0.18 0.34 23 24 13 1601
14-Jul-03 13 m 0.25 23.8 7.8 8.1 53 6.3 0.18 0.49 19 24 10 1.2 0.4 0.7 1601
average 0.39 24.9 6.8 7.9 4.35 73 5.5 27 8.80 0.16 0.32 28 23 12 1.8 0.9 0.9 800
std. dev. 0.06 1.0 1.6 0.2 1.61 1 2.2 40 8.29 0.11 0.29 14 9.1 1.9 2.6 0.8 0.8

Water Quality of the Great River Watershed, St. James/Hanover/.Westmoreland
24
N 18o 16.94'
W 77o 53.75'
Sampled ~ 25m downstream of the bridge at sharp bend in road and downstream of Retieve All-age School
A southern tributary of the Great River.
Data sheet 6: Site 4a - Quashies River

Water Quality of the Great River Watershed, St. James/Hanover/.Westmoreland
25
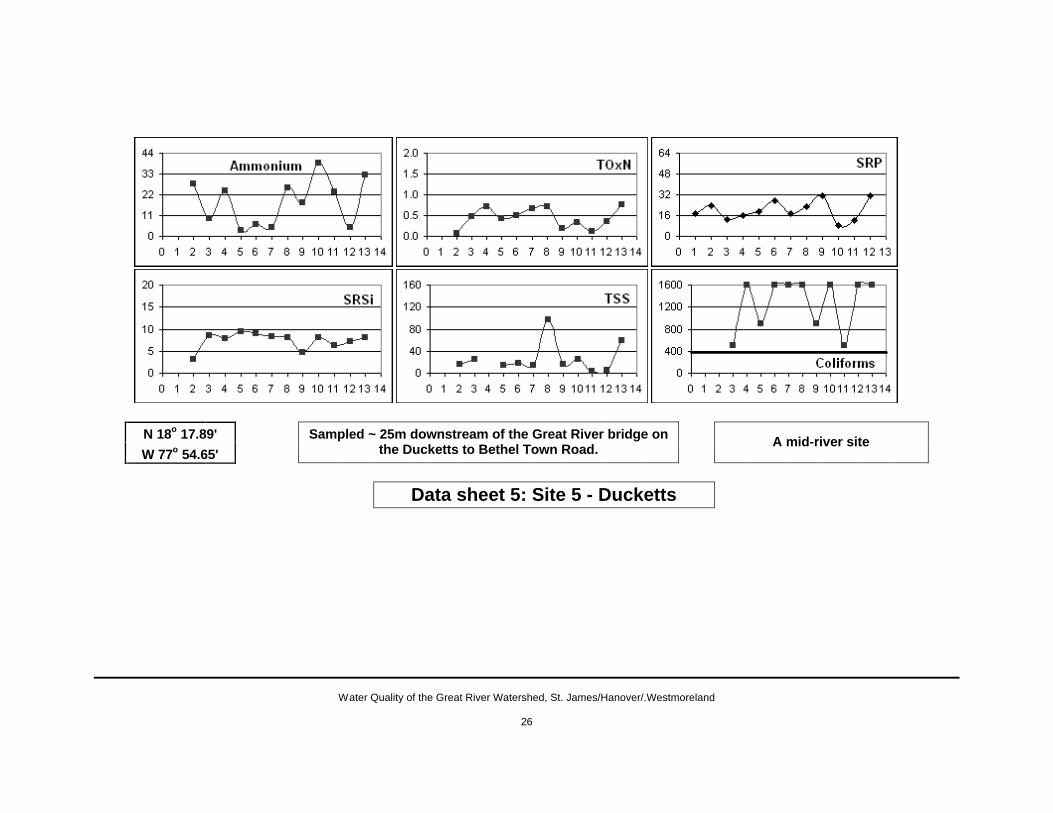
Data Sheet 7 Site 5 – Ducketts
Cond Temp DO pH ANC Ca Mg TSS NH4+ TOxN TDN SRP TDP SRSi Chlorophyll
a b c Coli. Date trip
no. flow
Field Parameters Laboratory Parameters
7-Feb-02 1 l
8-Apr-02 2 l 0.33 26.7 6.8 8.2 1.73 73 2.4 16 28 0.06 18 3.1 4.3
21-May-02 3 l 0.38 25.6 8.2 8.2 26 9.5 0.47 23 19 8.5 2.1 1.7 1.6 500
3-Jul-02 4 h 0.30 24.8 7.6 8.0 24 0.72 1.25 13 7.9 1601
7-Aug-02 5 h 0.36 24.8 7.2 8.0 15 3.0 0.43 16 16 9.4 1.6 1.6 2.1 900
11-Sep-02 6 h 0.37 25.2 8.6 8.3 18 6.3 0.50 19 22 9.1 1.4 1.6 1.9 1601
23-Oct-02 7 h 0.23 24.7 8.6 8.4 3.49 68 3.9 14 4.6 0.66 0.61 27 10 8.4 1601
26-Nov-02 8 m 0.28 24.4 7.8 8.2 97 26 0.71 17 8.2 2.1 0.1 0.1 1601
4-Feb-03 9 m 0.36 23.6 8.6 7.5 3.48 60 7.0 16 18 0.18 0.63 23 23 4.8 0.6 0.1 0.1 900
25-Mar-03 10 l 0.30 25.2 8.1 8.2 4.45 26 39 0.33 0.63 31 29 8.1 2.8 1.3 1.0 1601
6-May-03 11 l 0.27 26.6 8.9 8.3 4 23 0.12 0.17 8.4 11 6.3 0.3 0.1 0.1 500
2-Jun-03 12 m 0.34 24.3 9.7 8.3 4.47 6 4.6 0.36 0.35 13 14 7.3 1601
14-Jul-03 13 m 0.24 24.8 8.4 8.2 59 32 0.77 1.06 31 42 8.1 1.5 0.1 0.0 1601
average 0.31 25.1 8.2 8.1 3.52 67 4.5 27 18 0.44 0.67 20 20 7.4 1.9 0.8 0.9 1167
std. dev. 0.05 0.9 0.8 0.2 1.12 7 2.4 27 12 0.24 0.38 7 10 1.8 1.2 0.8 0.9
Water Quality of the Great River Watershed, St. James/Hanover/.Westmoreland
26
N 18o 17.89'
W 77o 54.65'
Sampled ~ 25m downstream of the Great River bridge on the Ducketts to Bethel Town Road.
A mid-river site
Data sheet 5: Site 5 - Ducketts

Water Quality of the Great River Watershed, St. James/Hanover/.Westmoreland
27
Data Sheet 8 Site 6 – Hazlymph
Cond Temp DO pH ANC Ca Mg TSS NH4+ TOxN TDN SRP TDP SRSi Chlorophyll
a b c Coli. Date trip
no. flow
Field Parameters Laboratory Parameters
7-Feb-02 1 l
8-Apr-02 2 l 0.36 24.9 6.3 7.8 1.91 71 5.3 13 17 0.55 9.6 3.3 2.6
21-May-02 3 l 0.40 25.6 8.3 8.1 28 9.2 0.63 30 24 8.1 1.8 1.8 2.0 1601
3-Jul-02 4 h 0.29 24.6 7.3 7.9 75 3.0 0.61 15 6.7 1601
7-Aug-02 5 h 0.38 24.8 6.9 7.7 23 3.0 0.43 13 15 8.2 1.5 1.6 1.9 1600
11-Sep-02 6 h 0.38 25.5 8.3 8.1 19 3.0 0.48 14 12 10 1.4 1.7 1.9 1600
23-Oct-02 7 h 0.33 24.8 8.6 8.4 3.59 69 4.0 15 5.9 0.65 0.49 28 11 8.0 1367
26-Nov-02 8 m 0.31 24.6 7.7 8.1 78 23 0.74 23 7.9 1.4 0.1 0.3 1601
4-Feb-03 9 m 0.39 23.8 7.8 8.1 3.71 69 7.2 17 10 0.56 0.97 24 19 4.8 0.4 0.1 0.1 633
25-Mar-03 10 l 0.34 26.1 8.2 8.1 4.97 25 4.9 0.39 0.66 19 24 9.0 1.9 1.1 0.6 1600
6-May-03 11 l 0.29 26.1 7.8 8.0 11 16 0.38 0.25 12 11 6.6 0.4 0.1 0.1 1600
2-Jun-03 12 m 0.35 24.6 8.8 8.1 4.87 8 5.5 0.48 0.52 13 16 6.9 1601
14-Jul-03 13 m 0.24 24.9 8.3 8.0 100 30 0.86 38 43 7.6 1.6 0.2 0.6 1601
average 0.34 25.0 7.8 8.0 3.81 70 5.5 34 10.9 0.56 0.58 20 19 7.3 1.4 0.8 0.9 1450
std. dev. 0.05 0.7 0.7 0.2 1.24 1 1.6 31 8.8 0.14 0.27 9 10 1.8 0.7 0.8 0.8
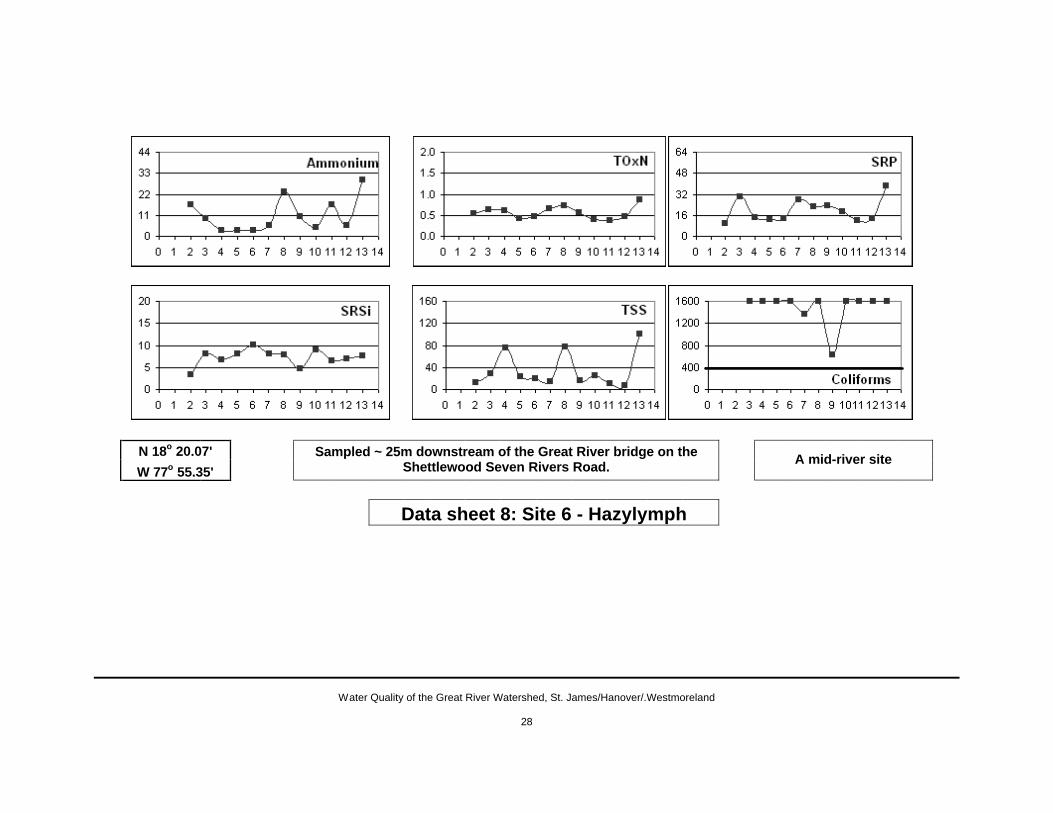
Water Quality of the Great River Watershed, St. James/Hanover/.Westmoreland
28
N 18o 20.07'
W 77o 55.35'
Sampled ~ 25m downstream of the Great River bridge on the Shettlewood Seven Rivers Road.
A mid-river site
Data sheet 8: Site 6 - Hazylymph
Water Quality of the Great River Watershed, St. James/Hanover/.Westmoreland
29
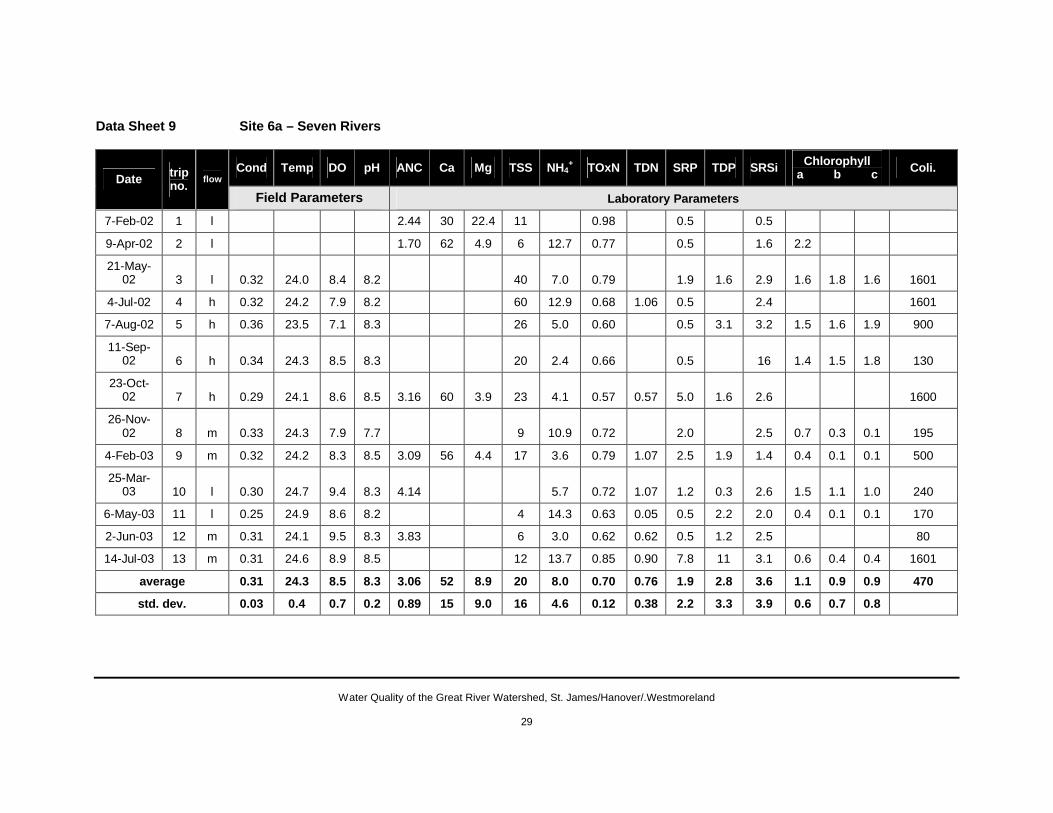
Data Sheet 9 Site 6a – Seven Rivers
Cond Temp DO pH ANC Ca Mg TSS NH4+ TOxN TDN SRP TDP SRSi Chlorophyll
a b c Coli. Date trip
no. flow
Field Parameters Laboratory Parameters
7-Feb-02 1 l 2.44 30 22.4 11 0.98 0.5 0.5
9-Apr-02 2 l 1.70 62 4.9 6 12.7 0.77 0.5 1.6 2.2
21-May-02 3 l 0.32 24.0 8.4 8.2 40 7.0 0.79 1.9 1.6 2.9 1.6 1.8 1.6 1601
4-Jul-02 4 h 0.32 24.2 7.9 8.2 60 12.9 0.68 1.06 0.5 2.4 1601
7-Aug-02 5 h 0.36 23.5 7.1 8.3 26 5.0 0.60 0.5 3.1 3.2 1.5 1.6 1.9 900
11-Sep-02 6 h 0.34 24.3 8.5 8.3 20 2.4 0.66 0.5 16 1.4 1.5 1.8 130
23-Oct-02 7 h 0.29 24.1 8.6 8.5 3.16 60 3.9 23 4.1 0.57 0.57 5.0 1.6 2.6 1600
26-Nov-02 8 m 0.33 24.3 7.9 7.7 9 10.9 0.72 2.0 2.5 0.7 0.3 0.1 195
4-Feb-03 9 m 0.32 24.2 8.3 8.5 3.09 56 4.4 17 3.6 0.79 1.07 2.5 1.9 1.4 0.4 0.1 0.1 500
25-Mar-03 10 l 0.30 24.7 9.4 8.3 4.14 5.7 0.72 1.07 1.2 0.3 2.6 1.5 1.1 1.0 240
6-May-03 11 l 0.25 24.9 8.6 8.2 4 14.3 0.63 0.05 0.5 2.2 2.0 0.4 0.1 0.1 170
2-Jun-03 12 m 0.31 24.1 9.5 8.3 3.83 6 3.0 0.62 0.62 0.5 1.2 2.5 80
14-Jul-03 13 m 0.31 24.6 8.9 8.5 12 13.7 0.85 0.90 7.8 11 3.1 0.6 0.4 0.4 1601
average 0.31 24.3 8.5 8.3 3.06 52 8.9 20 8.0 0.70 0.76 1.9 2.8 3.6 1.1 0.9 0.9 470
std. dev. 0.03 0.4 0.7 0.2 0.89 15 9.0 16 4.6 0.12 0.38 2.2 3.3 3.9 0.6 0.7 0.8
Water Quality of the Great River Watershed, St. James/Hanover/.Westmoreland
30
N 18o 20.40'
W 77o 55.03'
Sampled ~ 25m downstream of the road bridge on the Cambridge to Montpellier main road.
A nothern tributary of the Great River
Data sheet 9: Site 6a - Seven Rivers

Water Quality of the Great River Watershed, St. James/Hanover/.Westmoreland
31
Data Sheet 10 Site 7 – Lethe
Cond Temp DO pH ANC Ca Mg TSS NH4+ TOxN TDN SRP TDP SRSi Chlorophyll
a b c Coli. Date trip
no. flow
Field Parameters Laboratory Parameters
7-Feb-02 1 l 3.27 41 32.6 10 0.88 9.0 1.4
9-Apr-02 2 l 2.27 68 14.6 7 7.0 0.04 2.2 1.6 3.0
21-May-02 3 l 0.41 25.3 8.6 8.0 20 7.4 0.76 31 17 4.7 2.1 1.6 1.8 500
3-Jul-02 4 h 0.34 25.2 7.2 7.7 157 26 0.66 1.23 16 7.3 1601
7-Aug-02 5 h 0.39 24.9 6.8 7.6 17 3.0 0.65 22 20 8.3 1.7 1.7 2.1 900
11-Sep-02 6 h 0.40 25.6 8.4 7.7 19 4.2 0.84 35 26 12 1.6 1.7 2.1 1600
23-Oct-02 7 h 0.34 25.2 8.1 8.0 3.58 73 3.4 15 2.8 0.74 0.52 33 16 8.6 1601
26-Nov-02 8 m 0.34 24.9 7.6 7.9 69 9.8 0.69 27 8.1 1.0 0.1 0.1 1601
4-Feb-03 9 m 0.40 24.8 8.9 8.0 3.93 73 8.7 12 7.3 0.09 0.82 29 17 2.1 0.3 0.1 0.1 220
25-Mar-03 10 l 0.38 26.3 9.1 8.1 5.89 19 8.8 0.62 1.01 20 16 9.9 2.3 1.5 1.5 220
6-May-03 11 l 0.32 26.2 9.5 8.1 4 18 0.63 0.47 25 18 9.7 0.6 0.1 0.1 110
2-Jun-03 12 m 0.38 25.5 9.8 8.0 6.68 7 3.0 0.76 0.85 24 20 9.4 500
15-Jul-03 13 m 0.37 24.4 8.4 8.0 36 15 0.90 0.99 34 23 10 1.0 2.0 2.0 1601
average 0.37 25.3 8.4 7.9 4.27 64 14.8 30 9.4 0.64 0.84 24 19 7 1.5 1.1 1.2 672
std. dev. 0.03 0.6 0.9 0.2 1.67 15 12.7 42 7.2 0.27 0.27 10 3 4 0.9 0.8 0.9
Water Quality of the Great River Watershed, St. James/Hanover/.Westmoreland
32
N 18o 23.50'
W 77o 57.95' Sampled ~ 25m upstream of the Great River bridge at Lethe
A recreational area and a lower river site
Data sheet 10: Site 7 - Lethe

Water Quality of the Great River Watershed, St. James/Hanover/.Westmoreland
33
Data Sheet 11 Site 8 – Unity Hall Dam
Cond Temp DO pH ANC Ca Mg TSS NH4+ TOxN TDN SRP TDP SRSi Chlorophyll
a b c Coli. Date trip
no. flow
Field Parameters Laboratory Parameters
7-Feb-02 1 l 2.93 37 19.4 14 0.77 0.9 3.8
9-Apr-02 2 l 1.91 66 7.0 9 21 0.47 4.0 2.3 2.5
22-May-02 3 l 0.39 25.4 7.8 8.0 41 8.4 0.74 23 1.6 10 2.5 1.7 1.7 1600
4-Jul-02 4 h 0.33 26.1 7.6 8.5 279 35 0.56 24 22 7.6 1601
8-Aug-02 5 h 0.39 24.5 7.0 8.5 40 2.8 0.63 23 20 9.0 2.0 1.9 2.3 900
12-Sep-02 6 h 0.40 24.8 8.4 8.7 20 5.6 0.70 11 15 14 1.5 1.5 1.7 900
24-Oct-02 7 h 0.34 24.4 8.6 8.5 3.44 67 3.2 17 3.0 0.65 0.65 25 9.9 8.9 500
27-Nov-02 8 m 0.37 24.2 8.4 8.2 37 9.1 0.65 23 8.8 0.9 0.1 0.1 1601
5-Feb-03 9 m 0.39 24.5 8.9 8.5 3.49 59 9.5 8 4.8 0.85 1.05 11 9.6 5.8 0.3 0.1 0.1 1251
26-Mar-03 10 l 0.35 26.1 7.5 8.4 5.12 51 8.7 0.68 0.94 11 9.3 9.1 3.2 1.1 0.9 1601
7-May-03 11 l 0.32 26.0 8.5 8.4 6 15 0.60 0.38 6.5 5.6 10 0.6 0.1 0.1 220
3-Jun-03 12 m 0.38 24.7 9.5 8.5 5.23 8 4.8 0.71 0.75 4.0 5.3 9.8 360
15-Jul-03 13 m 0.36 24.2 7.5 8.6 61 22 0.80 1.03 32 31 11 1.4 0.6 0.7 1601
average 0.37 25.0 8.2 8.4 3.69 57 9.8 45 11.6 0.68 0.80 15 13.0 8.8 1.7 0.9 1.0 925
std. dev. 0.03 0.8 0.7 0.2 1.29 14 6.9 73 9.9 0.10 0.26 10 9.2 3.0 1.0 0.8 0.9
Water Quality of the Great River Watershed, St. James/Hanover/.Westmoreland
34
N 18o 26.36'
W 77o 59.37'
Sampled to the left of the dam (looking upstream) from the concrete wall at the end of the road
A NWC intake and lower river site.
Data sheet 11: Site 8 - Unity Hall Dam
2

Water Quality of the Great River Watershed, St. James/Hanover/.Westmoreland
35
Data Sheet 12 Site 9 – 150 Meters Below Unity Hall Dam
Cond Temp DO pH ANC Ca Mg TSS NH4+ TOxN TDN SRP TDP SRSi Chlorophyll
a b c Coli. Date trip
no. flow
Field Parameters Laboratory Parameters
8-Mar-02 1 l 3.81 72 0.5 13 14 1.04 2.8 5.9
9-Apr-02 2 l 1.89 58 10.4 8 25 0.45 3.1 6.7 2.4
22-May-02 3 l 0.39 25.4 8.5 8.3 38 9.6 0.70 24 18 10 2.7 1.9 2.0 900
4-Jul-02 4 h 0.30 25.6 8.0 8.3 157 3.0 0.45 1.01 20 7.2 1601
8-Aug-02 5 h 0.39 24.7 7.4 8.5 40 3.0 0.63 17 18 8.7 1.7 1.5 1.8 1600
12-Sep-02 6 h 0.39 25.0 8.5 8.6 19 3.0 0.68 9.3 23 6.2 2.2 1.6 2.2 195
24-Oct-02 7 h 0.34 24.6 8.5 8.5 3.44 67 2.4 42 3.0 0.60 0.77 24 13 8.6 300
27-Nov-02 8 m 0.36 24.2 8.4 8.4 33 8.7 0.65 20 1.1 0.1 0.1
5-Feb-03 9 m 0.39 24.3 8.9 8.4 3.39 63 6.3 14 5.6 0.83 0.46 11 10 5.9 0.5 0.0 0.1 900
26-Mar-03 10 l 0.35 26.4 8.2 8.3 5.12 50 3.0 0.66 0.88 7.4 5.6 8.5 4.0 1.8 1.6 1600
7-May-03 11 l 0.31 26.0 9.2 8.3 4 18 0.56 0.44 4.3 5.6 10 0.6 0.1 0.1 1050
3-Jun-03 12 m 0.37 24.9 10.0 8.4 4.80 6 3.0 0.67 0.84 6.7 7.4 9.2 280
15-Jul-03 13 m 0.36 24.4 8.7 8.5 30 3.8 0.86 0.93 31 24 10 1.6 0.8 0.9 1601
average 0.36 25.0 8.6 8.4 3.74 65 4.9 35 7.4 0.67 0.76 14 14 8.3 1.9 1.0 1.1 787
std. dev. 0.03 0.7 0.7 0.1 1.15 6 4.4 40 7.1 0.16 0.22 9 7 1.7 1.1 0.8 0.9

Water Quality of the Great River Watershed, St. James/Hanover/.Westmoreland
36
N 18o 26.36'
W 77o 59.29'
Sampled ~ 150m below dam where there is easy access from the road
A lower river site just up-stream of the estuary.
Data sheet 12: Site 9 - 150m below Unity Hall Dam

Water Quality of the Great River Watershed, St. James/Hanover/.Westmoreland
37
5.2 Data Quality A variety of techniques were used to assess the quality of the data generated, the details of which are presented in Appendix III. Table 3 gives key data quality information. The uncertainties are expressed as either one standard deviation (SD) or as coefficient of variation (CV). Any two results can, to a first approximation, be considered to be different if they differ by more than two to three SDs (where CVs are given multiply any actual concentration by the CV to get the SD). The uncertainties arise primarily from the sampling exercise and reflect in-homogeneities in the water at the site and variations arising during storage, transport and handling of the samples. Care should be taken to consider these uncertainties when comparing data. 5.3 Fresh Water Quality Standards The final three columns of Table 3 give the fresh water standards for some authorities. The NEPA standard defines concentration ranges for ambient Jamaican waters and was arrived at by considering available data. It does not define allowable maximum concentrations but rather indicates the ranges within which concentrations can be expected to be found. The Cartagena Convention (UNEP-CEP, 2002) standard refers to discharges to Class I marine waters which include, amongst others, recreational waters, and waters containing coral reefs, seagrass beds or mangroves. The Hawaiian standard (USEPA website) can be considered to be representative of water quality standards as applied in the USA where each state or territory defines its own standards according to USEPA guidelines. Parameters for which concentration limits are defined and the actually defined limits therefore vary from place to place and even in some cases from river to river. The most commonly agreed on limit, although not for the three cited autorities, is that faecal coliforms should not exceed 400MPN/100ml although even then some authorities use the number as absolute while others require that no more than 25% of the samples should exceed 400MPN/100ml. Another generally agreed on standard is that dissolved oxygen (DO) concentrations should not be lower than 5mgO2 dm-3 although the three authorities cited in Table 3 do not define a DO standard. Nutrient standards normally refer to total nitrogen and total phosphorus but limits are often not defined. Many USA state water quality standards say that nutrient concentrations shall not be altered so as to cause an imbalance in the natural populations of flora and fauna. Water quality data for a particular river should only be compared to standards that have been defined for that river although initially other standards can give guidance. To date Jamaica does not have such standards although it is moving towards developing them. An important step in developing standards is to define the required use of the water. In the case of the Great River this should be for recreational uses and potable water extraction as many people use the water in such a way that they are in intimate contact with the water and the NWC does extract water for potable uses. Since there are no present local standards of these types the interpretation of the data to follow will use the cited (Table 3) standards as guides but look more towards spatial and temporal variations in concentrations to identify possible areas of contamination. 5.4 Discussion of River Sites Data 5.4.1 Temperature The cool waters at Stonehenge are typical of water emerging from the ground. Temperatures increased slightly (2 or 3 degrees C) down-river due to normal warming processes. The variabilities will be due to the time of sampling and the depth of the water.

Water Quality of the Great River Watershed, St. James/Hanover/.Westmoreland
38
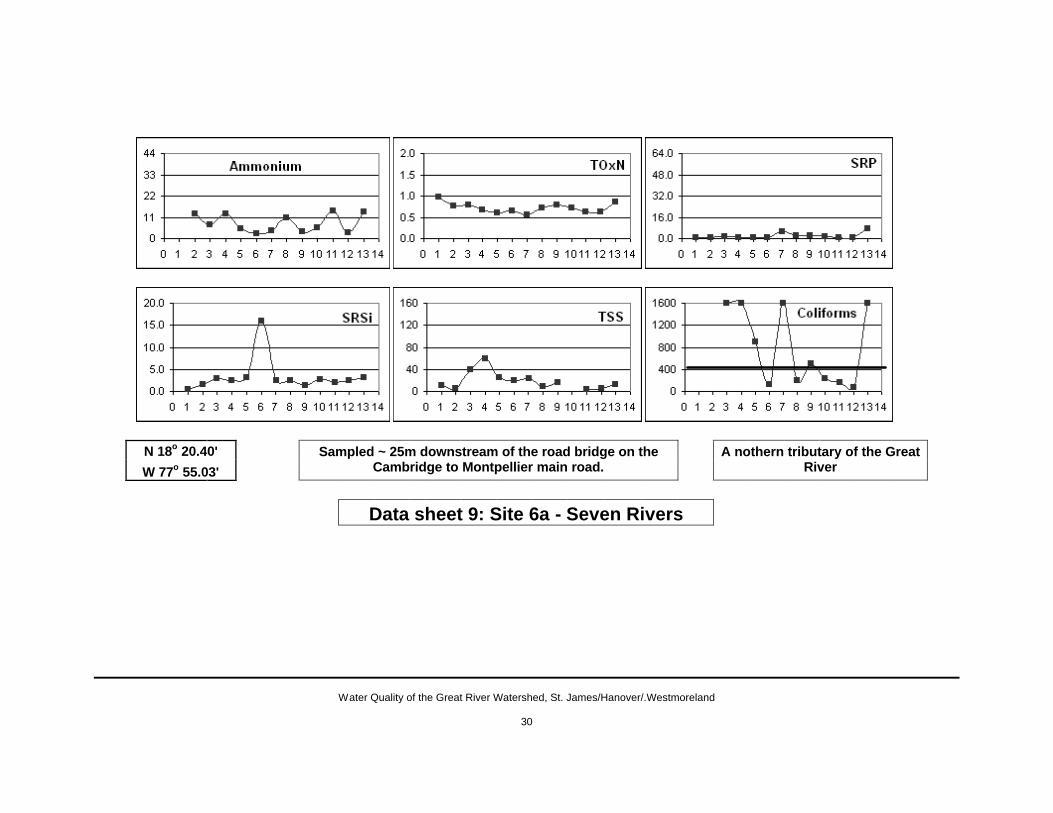
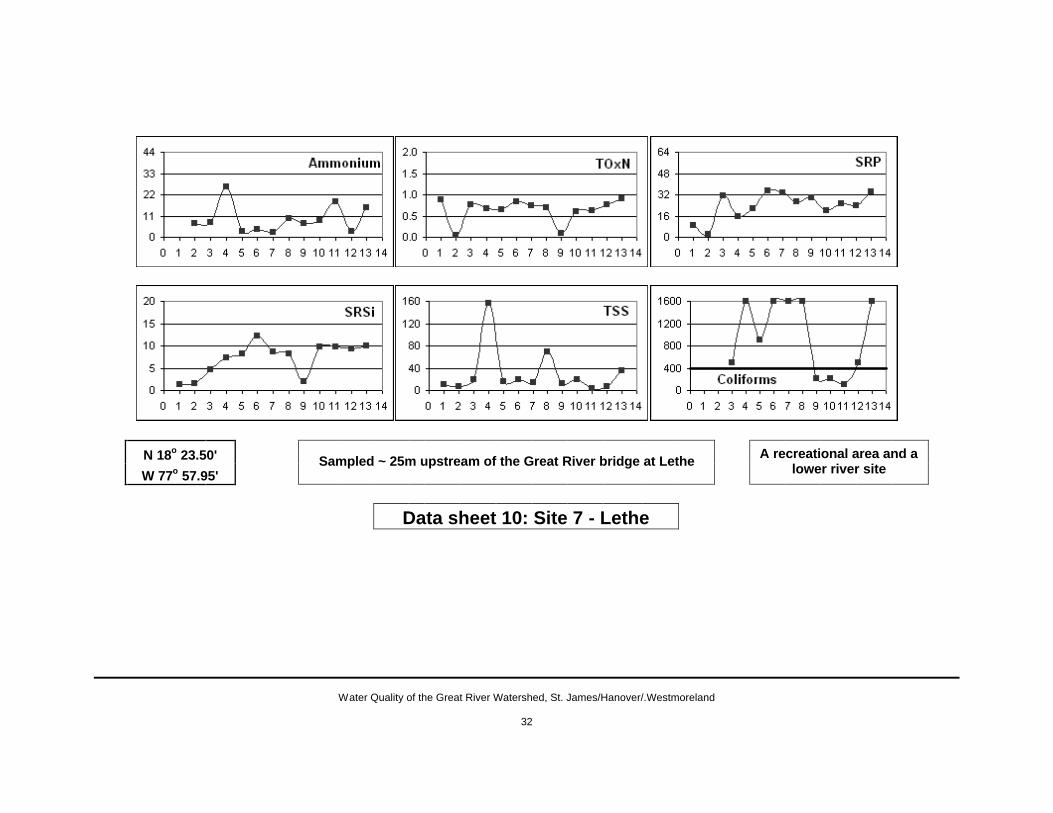
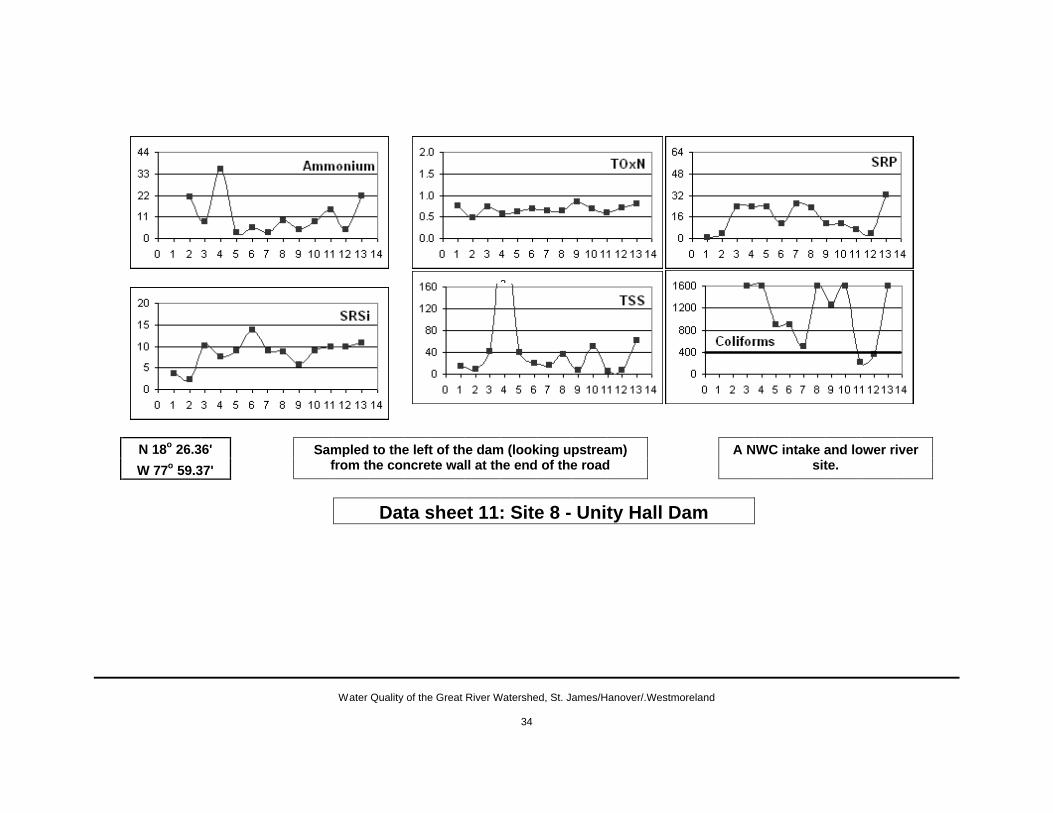
5.4.2 Conductivity, pH, Acid Neutralizing Capacity, Calcium and Magnesium These parameters relate to the most concentrated of the dissolved solids. Conductivity gives a measure of the amount of dissolved materials in the water while ANC and pH indicate the carbonate and bicarbonate concentrations. The majority of the dissolved materials in river waters come from the weathering of the rocks over which the water passes. Carbonates are also introduced by carbon dioxide dissolving from the atmosphere. In the case of the Great River the rocks are predominantly limestone and thus the major dissolved materials are carbonates and calcium and magnesium. The data are consistent with a limestone river system. Further interpretation will be presented in Miss Campbell’s thesis. 5.4.3 Dissolved Oxygen and chlorophyll The DO data show that the river was well oxygenated at all times. Oxygen dissolves in river water from the atmosphere to give concentrations of about 8 mgO2 dm-3. Oxygen is also produced during photosynthesis (microscopic plant growth) and this can lead to concentrations exceeding 8 mgO2 dm-3, as have been occasionally seen at all sites. The extent of photosynthesis should be reflected in the chlorophyll concentrations which give a measure of the amount of suspended microscopic plants (phytoplankton) in the water. These plants make the water green. By comparing the average concentrations of chlorophyll-a at Stonehenge (0.6mg/L) with those at the river sites (greater than 1mg/L and occasionally greater than 3mg/L) it can be concluded that there was photosynthesis occurring within the river. Such photosynthesis will convert carbonates and nitrogen and phosphorus nutrients into plant materials and thus decrease their concentrations within the water. The green water at the Unity Hall dam (at other sites the water was generally too shallow to be able to see the colour) is clear evidence of the importance of photosynthesis. The reverse of photosynthesis, the death of plants and respiration, uses up dissolved oxygen. On only one occasion during the study was a dissolved oxygen concentration found to be depleted and that was at Quashies River when it was stagnant (trip 2). The extent of photosynthesis within the Great River cannot be considered to be excessive. Miss Campbell will give a more extensive discussion of these issues in her thesis. 5.4.4 Total Suspended Solids (TSS) Total Suspended Solids are a combination of suspended plant material (see above) and suspended river sediment. River sediment generally comes from the natural wearing down of rocks and soil erosion. High rainfall leads to elevated concentrations of TSS as the river sediment is suspended by the high river flow and soil from surrounding lands is carried into the river (soil erosion). High TSS tend to make the river a brown chocolate colour. TSS were generally not detectable at Stonehenge but averaged between 25 and 40 at the Great River and Quashies River sites. Seven Rivers generally had slightly lower TSS. Most sites showed peaks in TSS on trips 4 (day 184, 2002) and 8 (day 296, 2002) both of which were about 20 days after the very significant floods of June (peak flow days 156 – 163) and September (peak flow days 272 - 277), 2002. No such peaks in TSS were detected on trips 6, 11 and 12 which were also within 20 days of moderately high flow. This suggests that for high TSS to be sustained in the river for 2 – 3 weeks very high flows are necessary.
Water Quality of the Great River Watershed, St. James/Hanover/.Westmoreland
39
The TSS concentrations at times other than after the very significant floods were generally below the Hawaiian and Cartegena standards and therefore possibly not a significant problem. When searching for fine sediment in the river during September 2002 on which to do pesticide analyses no significant amounts of sediment could be found except at the Unity Hall road bridge, a site within the estuary of the river. It would appear then that sediment does not accumulate in the river although it must be remembered that in general flow conditions during the study period were relatively high when compared to the previous five years. 5.4.5 Nitrogen Three forms of Nitrogen (N) nutrients were determined. Ammonium is the reduced inorganic form of nitrogen and has waste water, decaying organics (natural and anthropogenic) and fertilizer sources. It will usually be converted to nitrite and then nitrate in oxygenated waters such as found in the Great River. These oxidised forms of nitrogen (TOxN, nitrate + nitrite) are therefore expected to be the dominant inorganic nitrogen species. Total dissolved nitrogen includes the inorganic and organic forms of nitrogen. Nitrogen in organics can be converted to inorganic nitrogen through bacterially assisted reactions under both anaerobic and aerobic conditions. The nitrogen that is readily available as nutrients to plants includes both reduced and oxidised inorganic forms although some plants can utilize organic nitrogen. Like other plant nutrients nitrogen can be rapidly incorporated into plants during photosynthesis and therefore the concentrations found dissolved in the water are a balance between their rate of production (river contamination and/or release from decaying aquatic plants) and their rate of removal (to growing aquatic plants). The interpretation of dissolved inorganic nitrogen concentrations must therefore take into consideration the amount of aquatic plant material in the river, normally quantified through chlorophyll-a concentrations. This cycling of nitrogen between dissolved and plant forms makes it difficult to set standards for nitrogen, as discussed in section 5.3. Ammonium was seldom detected at Stonehenge, barely detectable at Seven Rivers and only occasionally elevated below the Unity Hall dam (site 9). Concentrations were however frequently elevated (greater than 15µgN dm-3) at Chesterfield, Marchmont and Ducketts. This suggests that there were sources of this nutrient to the river within those areas. The concentrations were however very much lower than the Puerto Rican potable water standard of 1000µgN dm-3. Nitrate (the significant component of TOxN) was readily detectable at all sites. The concentrations at Stonehenge were typical of other mid-island limestone springs (Black River ~ 0.5 mgN dm-3) and less than at the Rio Bueno headwaters (1.3mgN dm-3). The concentrations at Chesterfield were more variable than at other river sites and occasionally relatively high. This is in-keeping with the variablity and relatively elevated concentrations of ammonium and consistent with local sources of nitrogen to the river. The high concentration on trip 4 could be related to soil run-off from the June flood but there was not a corresponding peak on trip 8 (following the September flood). The concentrations at lower river sites became gradually less variable suggesting that a balance had been reached between inflows and utilization of nitrogen in those areas. The concentrations at Quashies River are generally lower than those at Stonehenge suggesting minimal if any nitrogen contamination reaching that river (see 5.4.7 however). The occasional very low concentrations (trips 1, 9 and 10) related to undetectable flow and stagnant conditions and to relatively higher (but still low) ammonium concentrations illustrating how these two forms of inorganic nitrogen are inter-convertible. The total dissolved nitrogen concentrations tended to be close to the TOxN concentrations, especially when taking into consideration the higher uncertainties in the TDN concentrations.
Water Quality of the Great River Watershed, St. James/Hanover/.Westmoreland
40
TDN is the sum of TOxN and reactive organic nitrogen and thus there was minimal reactive organic material in the river. Reactive organic nitrogen degrades to ammonium and oxidised inorganic nitrogen under favourable conditions (usually assisted by bacteria). 5.4.6 Phosphorus The two forms of the other major plant nutrient phosphorus, inorganic phosphorus (soluble reactive phosphorus (SRP; essentially phosphate) and total dissolved phosphorus (TDP the sum of inorganic and organic phosphorus species) were seldom distinguishable, especially when taking into consideration the relatively high uncertainties in the TDP data, suggesting that unreactive organic sources of this nutrient were low (see 5.4.5 for TDN). The concentrations of phosphate at Stonehenge and Seven Rivers were frequently barely detectable and concentrations remained relatively low (averaging between 13 and 24mgP dm-3) throughout the river with the exception of the Chesterfield site which had concentrations that were 2 to 3 times as high as the other main river sites, and Quashies River where concentrations were about 1.5 times those of most of the main river sites. Low phosphate concentrations are often found in limestone areas as phosphate readily adsorbs to limestone. The relatively high phosphate concentrations at Chesterfield suggest a local source of this nutrient to the river (see also the discussion on nitrogen for which there also appeared to be a local source of contamination). It is interesting to note the different behaviours of the two tributaries. Seven Rivers had very low phosphate but relatively high nitrogen while Quashies River had relatively high phosphate and low nitrogen. The flows at the two sites also differ significantly with Quashies River often having undetectable flow. 5.4.7 The Nitrogen – Phosphorus Balance Aquatic plants require approximately 10 – 20 times more nitrogen than phosphorus. If the ratio of N:P varies significantly from that range then photosynthesis can be inhibited as there is an insufficient amount of one of the nutrients. The ratio averaged 1100 at Stonehenge clearly indicating that the phosphorus concentrations were inadequate to support photosynthesis, the waters in the Stonehenge pond were a clear blue. A similarly very high ratio (1800) was observed at Seven Rivers. The ratios ranged between 50 and 70 at sites 2, 5, 6 and 7 and exceeded 100 at sites 3, 4, 8 and 9 suggesting that phosphorus was also probably limiting photosynthesis at those sites. The ratio of 23 at Quashies River suggests a more balanced ecosystem. At Stonehenge and Seven Rivers the phosphorus concentrations were kept very low by the limestone. At Quashies River the higher phosphorus concentrations which suggest a source of P to the river probably led to increased photosynthesis which kept the nitrogen concentrations relatively low. This is supported by the general green colour of the water in Quashies River which it must be remembered was often not flowing. The fact that the balance between nitrogen and phosphorus rarely corresponded to that required for photosynthesis can be interpreted in two ways. Either there was nitrogen contamination reaching the river but it was not being excessively converted to plant material (see 5.4.3) because of the limestone controlled low phosphorus concentrations or photosynthesis is effectively stripping the river of phosphorus. In both cases if any phosphorus contamination reached the river excessive photosynthesis could occur as there was plenty of available nitrogen. The higher N:P ratios at Marchmont, Retrieve, and Unity Hall dam suggest that nitrogen contamination at those sites was greater than at the other sites.
Water Quality of the Great River Watershed, St. James/Hanover/.Westmoreland
41
5.4.8 Silica Silica in the river will be coming predominantly from natural weathering of non-carbonate rocks. The concentrations were therefore typically low as expected for a predominantly limestone system (Hayman, 2001). When the silica concentrations were relatively high (Chesterfield and Quashies River) or low (Stonehenge and Seven Rivers) the phosphorus concentrations were also relatively high or low supporting the idea that the limestone was limiting the phosphorus concentrations within the river. Higher silica concentrations imply that a lower percentage of parent rocks in the area were limestones. 5.4.9 Faecal Coliforms Faecal coliforms have their origins in the intestines of warm blooded mammals along with some naturally occurring soil bacteria. They are usually used to indicate contamination from faeces and suggest the presence of bacteria which negatively affect human health. For recreational waters most water quality authorities state that concentrations on any occasion should not exceed 400MPN dm-3 (see section 5.3). This limit is indicated on the graphs of the coliform concentrations at each site. When determining the coliform concentrations an upper determination limit of 1600 MPN/100ml was set by the NEPA laboratory and so when concentrations exceeded that they reported > 1600MPN/100ml. Such concentrations have been reported as 1601 in the data sheets. On almost all occasions at all river sites except Stonehenge the faecal coliform concentrations exceeded the limit. There is a clear indication that there was faecal contamination of the river and its tributaries, the probable sources being animal farming and human waste disposals close to the river. 5.4.10 Pesticides Pesticides were analysed for on two occasions. Sediment were collected from the Unity Hall road bridge area in September 2002 (trip 6, high flow conditions) and water from Chesterfield, Lethe and the Unity Hall dam in February 2003 (trip 9, low flow). No pesticide residues (Mathalion, Bravo, Danitol and Pegasus were tested for) were detected in any of the samples.
There were no indications of pesticide contamination in the river. 6. Estuarine and Marine Water Quality Data 6.1 Sampling Methodologies and Great River Bay Conditions During Sampling
Samples were collected from a small boat at below the Unity Hall Road Bridge (UHRB), the opening to the sea (UHOS), Harris Point (HP), the Middle of Great River Bay (MOB) and at sites within the fresh water plume leaving the river mouth such as to obtain samples with salinities of about 10, 20 and 30 practical salinity units (psu). The later sites were usually within three to four hundred meters of the river mouth but varied from trip to trip with the flow of the river. While in the field salinities and temperatures were measured as a function of water depth at each site to determine the depth to which the fresh water penetrated. When fresh water from a river enters the marine environment it mixes with the saline marine water. Pure marine waters have salinities of 35 – 36 practical salinity units (psu, approximately grams dissolved solids per litre or parts per thousand). The salinity of a water formed by mixing

Water Quality of the Great River Watershed, St. James/Hanover/.Westmoreland
42
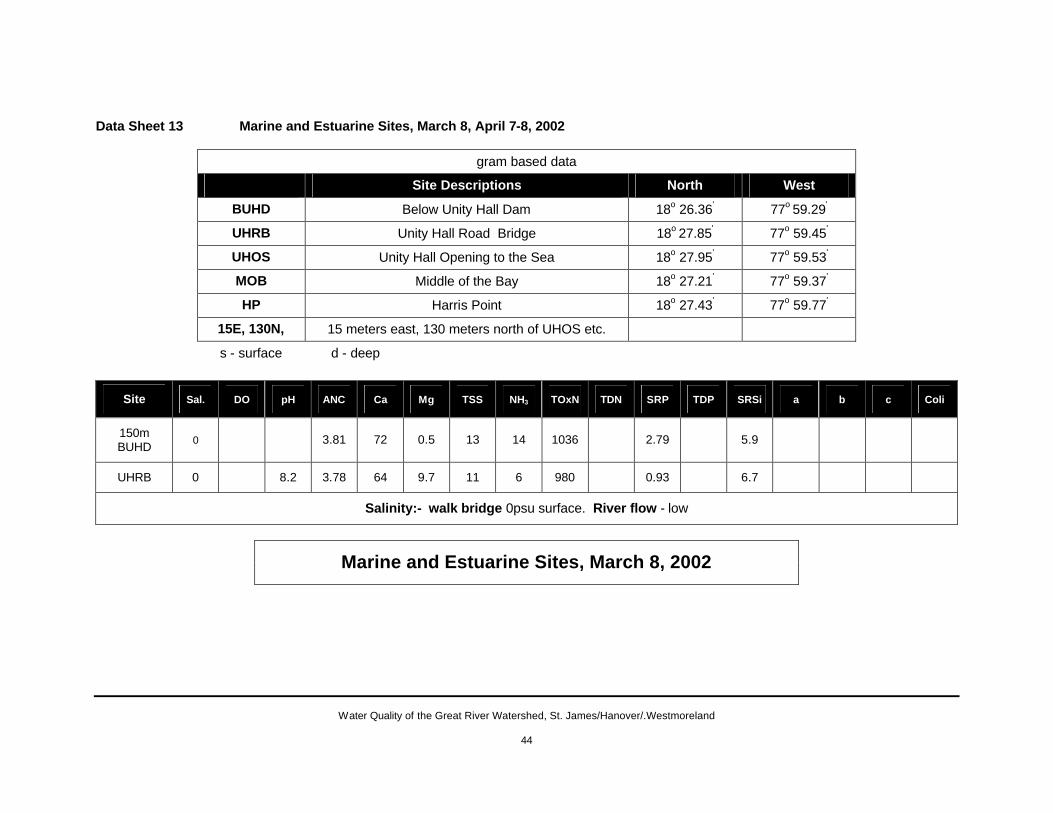
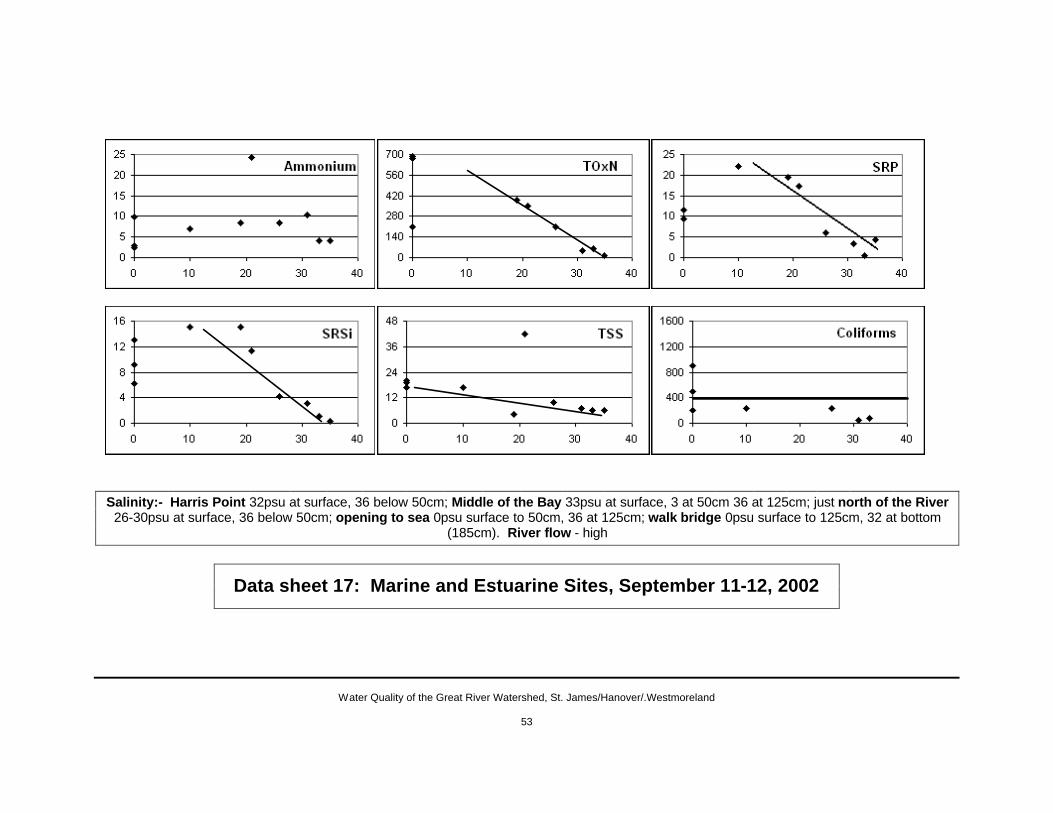
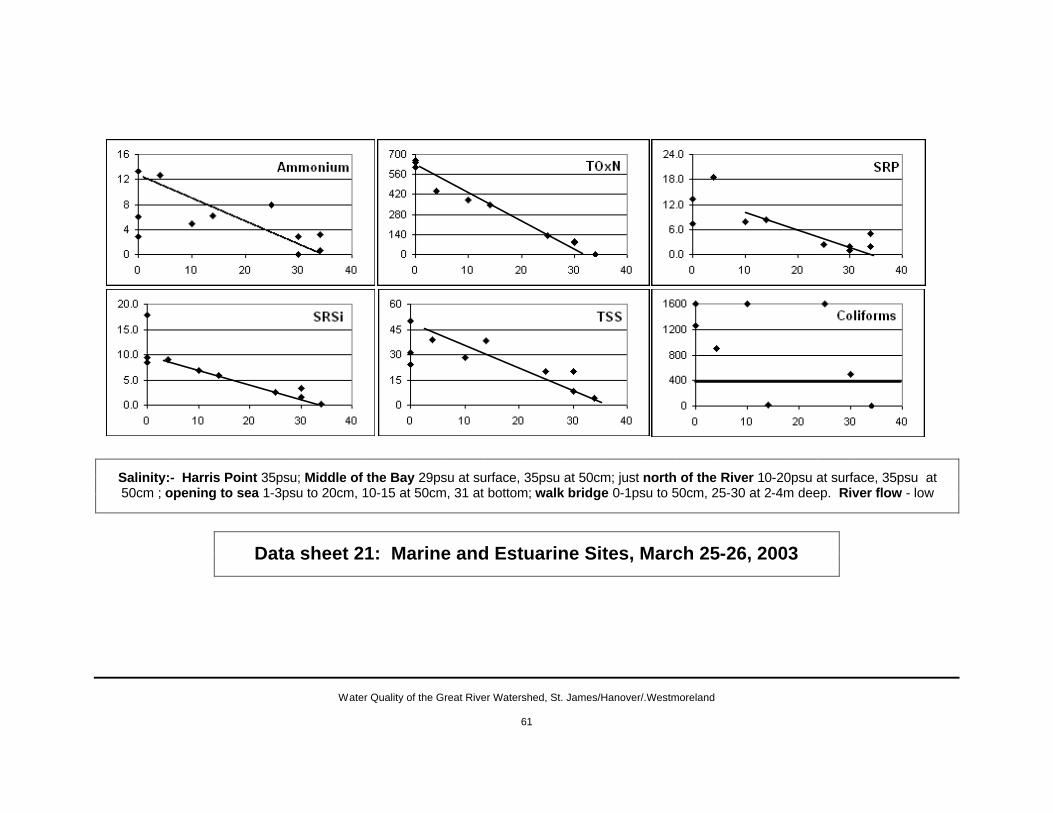
fresh (zero salinity) with marine water will depend on the relative amounts of the two waters. For example a 50% fresh 50% marine mixture will have a salinity of about 18psu (half that of the marine water), 25% fresh, 75% marine a salinity of about 27psu (3/4 of 36) and so on. Salinity can therefore be used to detect the presence of fresh water, any values less than 35 – 36 imply some dilution of the marine water with fresh water. During the first three field trips (February – May , 2002) under the low river flow regimes the river mouth opening was very narrow (4 – 6 meters) and the outflow only about 75cm deep. The waters at the opening were fresh but formed only a 10 – 15cm deep plume that was detectable to about 500m out into the bay. After the heavy rains of May-June 2002 the opening was considerably wider (20 - 50 meters) and marine water was always detectable at the bottom (usually about 2 meters deep). During the remaining field trips of 2002 fresh water was detectable (salinities 25-31) to 1 meter depths as far out as Harris Point (HP) and the Middle of the Bay (MOB). In February the Harris Point water was fully marine but fresh water was still detectable (salinity 26 at surface, 33 at 50cm, 36 at 1m) at the MOB site. Conditions were similar in March 2003 but the fresh water signal was much weaker in May (MOB surface salinity 33.5 at 50cm). The thin surface layer reached Harris Point again in June and July 2003 (surface salinities 32 - 33) and was readily detectable (surface salinity 24, 35 at 50cm) at the middle of the bay. Marine water was usually detectable at the Unity Hall road bridge. The river bar was slowly reforming during the latter part of the study. These observations are in-keeping with the river flow data. Throughout the study period the river plume headed essentially north out from the river mouth and was quickly diluted with the saline marine waters and seldom penetrated to more than 50 – 100cm below the surface. Under the higher flow regimes the plume seemed to tend towards the west. Local personnel report that the plume under flood conditions (as seen by the sediment load) often extends out to sea and to the east. Such flow was not seen on any of this studies field trips. 6.2 Marine and Estuarine Data Presentation The data for the marine and estuarine sites are presented in Data sheets 13 – 24. The data are organised by trip date. The site names are explained above and on Data sheet 13. The data for the river site below the dam (BUHD) have been included to indicate the water quality entering the estuary. Sal. stands for salinity while other abbreviations and units are as for the river sites except that the TOxN concentrations are in µgN dm-3 rather than mgN dm-3. The boxes under each table describe the salinity conditions at the sampling points and indicate river flow conditions. For the May 2002 and subsequent field trips key water quality parameters have been plotted against sample salinities. The scales on the graphs are not consistent from trip to trip. The concentrations of all parameters were much higher in the river than in the marine waters and therefore the concentrations decreased as the salinity increased (the fresh water and its associated components were being diluted by the marine water). If only dilution was occurring then the plots of concentration against salinity would be straight lines (called conservative mixing, the parameter was not reacting, it was only being dilute). If the line was curved upwards then some of that parameter was being added to the estuarine water in addition to that coming from
Water Quality of the Great River Watershed, St. James/Hanover/.Westmoreland
43
the river. If it curved downwards then some of what was coming in with the fresh water was being lost from the water body. The later two behaviours are termed non-conservative mixing. At times the data were too variable to allow for curves to be fitted to the data and occasionally some data points were not considered when deciding upon the best fit curve.
Water Quality of the Great River Watershed, St. James/Hanover/.Westmoreland
44
Data Sheet 13 Marine and Estuarine Sites, March 8, April 7-8, 2002
gram based data
Site Descriptions North West
BUHD Below Unity Hall Dam 18o 26.36' 77o 59.29'
UHRB Unity Hall Road Bridge 18o 27.85' 77o 59.45'
UHOS Unity Hall Opening to the Sea 18o 27.95' 77o 59.53'
MOB Middle of the Bay 18o 27.21' 77o 59.37'
HP Harris Point 18o 27.43' 77o 59.77'
15E, 130N, 15 meters east, 130 meters north of UHOS etc.
s - surface d - deep
Site Sal. DO pH ANC Ca Mg TSS NH3 TOxN TDN SRP TDP SRSi a b c Coli
150m BUHD 0 3.81 72 0.5 13 14 1036 2.79 5.9
UHRB 0 8.2 3.78 64 9.7 11 6 980 0.93 6.7
Salinity:- walk bridge 0psu surface. River flow - low
Marine and Estuarine Sites, March 8, 2002
Water Quality of the Great River Watershed, St. James/Hanover/.Westmoreland
45
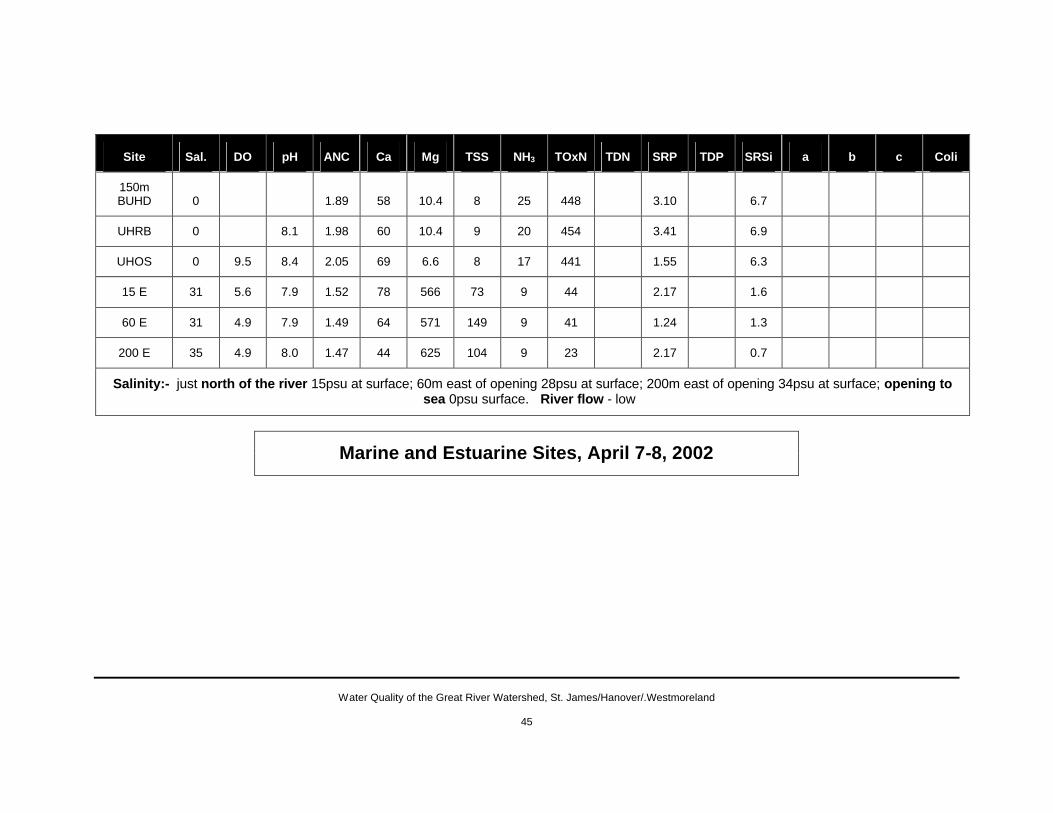
Site Sal. DO pH ANC Ca Mg TSS NH3 TOxN TDN SRP TDP SRSi a b c Coli
150m BUHD 0 1.89 58 10.4 8 25 448 3.10 6.7
UHRB 0 8.1 1.98 60 10.4 9 20 454 3.41 6.9
UHOS 0 9.5 8.4 2.05 69 6.6 8 17 441 1.55 6.3
15 E 31 5.6 7.9 1.52 78 566 73 9 44 2.17 1.6
60 E 31 4.9 7.9 1.49 64 571 149 9 41 1.24 1.3
200 E 35 4.9 8.0 1.47 44 625 104 9 23 2.17 0.7
Salinity:- just north of the river 15psu at surface; 60m east of opening 28psu at surface; 200m east of opening 34psu at surface; opening to sea 0psu surface. River flow - low
Marine and Estuarine Sites, April 7-8, 2002
Water Quality of the Great River Watershed, St. James/Hanover/.Westmoreland
46
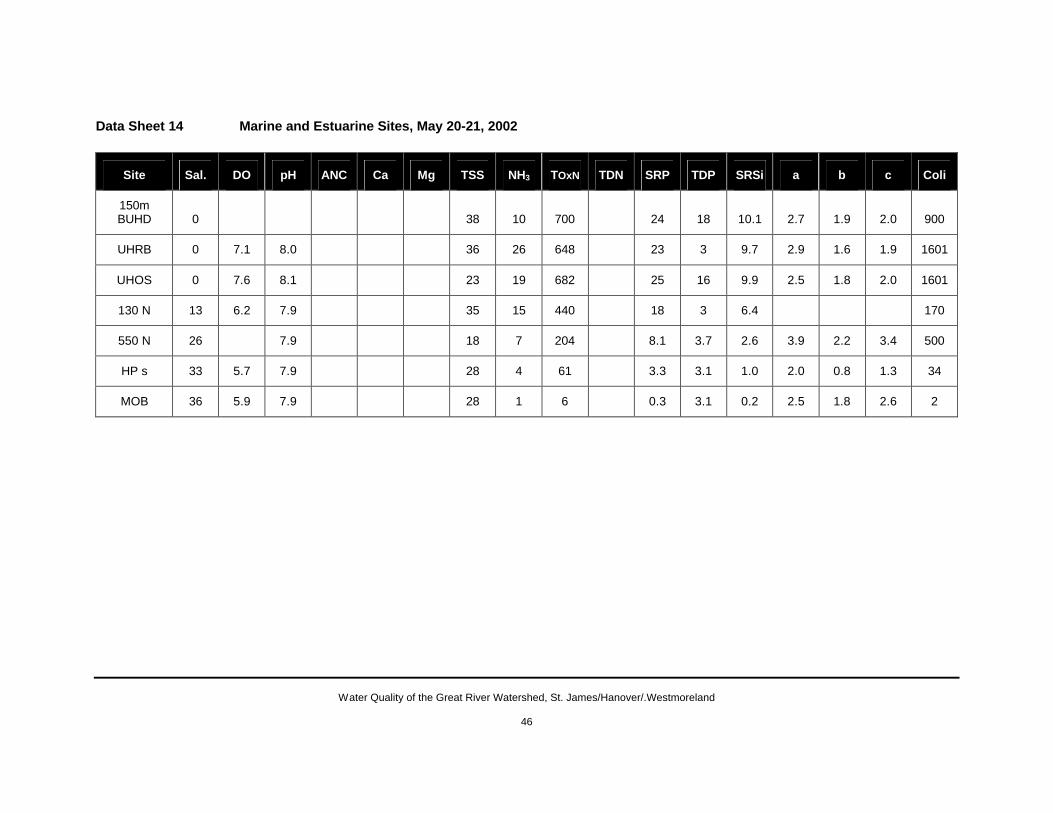
Data Sheet 14 Marine and Estuarine Sites, May 20-21, 2002
Site Sal. DO pH ANC Ca Mg TSS NH3 TOxN TDN SRP TDP SRSi a b c Coli
150m BUHD 0 38 10 700 24 18 10.1 2.7 1.9 2.0 900
UHRB 0 7.1 8.0 36 26 648 23 3 9.7 2.9 1.6 1.9 1601
UHOS 0 7.6 8.1 23 19 682 25 16 9.9 2.5 1.8 2.0 1601
130 N 13 6.2 7.9 35 15 440 18 3 6.4 170
550 N 26 7.9 18 7 204 8.1 3.7 2.6 3.9 2.2 3.4 500
HP s 33 5.7 7.9 28 4 61 3.3 3.1 1.0 2.0 0.8 1.3 34
MOB 36 5.9 7.9 28 1 6 0.3 3.1 0.2 2.5 1.8 2.6 2

Water Quality of the Great River Watershed, St. James/Hanover/.Westmoreland
47
Salinity:- Harris Point 33psu at surface, 36 below 50cm; Middle of the Bay 36psu at surface; just north of the river 28psu at surface, 36 at bottom; opening to sea 0psu surface ; walk bridge 0psu surface. River flow - low
Data sheet 14: Marine and Estuarine Sites, May 20-21, 2002

Water Quality of the Great River Watershed, St. James/Hanover/.Westmoreland
48
Data Sheet 15 Marine and Estuarine Sites, July 3-4, 2002
Site Sal. DO pH ANC Ca Mg TSS NH3 TOxN TDN SRP TDP SRSi a b c Coli
150m BUHD 0 157 3 448 1008 20 7.2 1601
UHRB 0 7.1 8.1 255 2 379 915 19 6.3 1601
UHOS 0 7.4 8.0 298 44 570 22 7.1 1601
100 N 10 7.5 8.1 346 41 426 635 18 5.2
200 W 17 7.1 194 30 259 513 11 3.4 1601
MOB 30 7.5 8.1 117 17 99 264 0.5 1.2 1600
60 E 32 6.7 141 19 72 156 0.5 1.1 1600
HP s 35 7.1 8.0 64 9 42 115 0.5 0.5 500

Water Quality of the Great River Watershed, St. James/Hanover/.Westmoreland
49
Salinity:- Harris Point 30psu at surface, 36 below 100cm; Middle of the Bay 31psu at surface, 36 at 100cm ; just north of the river 20psu at surface, 36 below 100cm; opening to sea 3-5psu surface ; walk bridge 0psu surface. River flow - high
Data sheet 15: Marine and Estuarine Sites, July 3-4, 2002

Water Quality of the Great River Watershed, St. James/Hanover/.Westmoreland
50
Data Sheet 16 Marine and Estuarine Sites, August 6-7, 2002
Site Sal. DO pH ANC Ca Mg TSS NH3 TOxN TDN SRP TDP SRSi a b c Coli
150m BUHD 0 40 3 630 17 18 8.8 1.7 1.5 1.8 1601
UHRB 0 6.4 8.0 107 5 552 22 25 8.5 2.2 1.8 2.0 1601
UHOS 0 7.0 8.1 56 2 606 23 20 8.6 1.5 1.5 1.8 1601
30 N 5 7.0 8.1 58 7 472 17 18 6.8 1.7 1.6 1.8 900
150 N 15 6.9 8.1 70 5 333 14 19 4.7 1.7 1.8 1.9 1601
300 N 25 6.5 8.1 57 5 193 5.9 9.3 2.4 1.4 1.5 1.8 1601
HP s 27 6.3 8.1 21 2 84 0.3 7.1 1.3 1.7 1.7 2.2 900
MOB 35 6.3 8.1 4 1 14 0.3 3.1 0.3 1.4 1.5 1.8 23

Water Quality of the Great River Watershed, St. James/Hanover/.Westmoreland
51
Salinity:- Harris Point 31psu at surface, 36 below 100cm; Middle of the Bay 35psu at surface, 36 at 200cm ; just north of the river 24psu at surface, 36 below 50cm; opening to sea 0psu surface to 100cm, 32 at 250cm; walk bridge 0psu surface. River flow - high
Data sheet 16: Marine and Estuarine Sites, August 6-7, 2002

Water Quality of the Great River Watershed, St. James/Hanover/.Westmoreland
52
Data Sheet 17 Marine and Estuarine Sites, September 11-12, 2002
Site Sal. DO pH ANC Ca Mg TSS NH3 TOxN TDN SRP TDP SRSi a b c Coli
150m BUHD 0 19 3 686 9 23 6.2 2.2 1.6 2.2 195
UHRB 0 8.3 17 2 210 11 9 13 1.3 1.5 1.7 500
UHOS 0 8.3 20 10 672 25 21 9 1.5 1.8 1.9 900
200 NE 10 7.6 17 7 22 20 15 1.9 2.1 2.4 240
150 N 19 4 8 392 20 20 15 1.9 2.1 2.4
UHRB d 21 8.3 42 24 347 17 11 11
300 N 26 7.4 10 8 210 5.9 15 4.1 1.7 1.9 2.4 240
HP s 31 7.2 7 10 47 3.4 2.8 3.1 1.6 1.8 2.2 40
MOB 33 7.5 6 4 57 0.5 2.2 1.1 1.5 1.5 1.9 80
Water Quality of the Great River Watershed, St. James/Hanover/.Westmoreland
53
Salinity:- Harris Point 32psu at surface, 36 below 50cm; Middle of the Bay 33psu at surface, 3 at 50cm 36 at 125cm; just north of the River 26-30psu at surface, 36 below 50cm; opening to sea 0psu surface to 50cm, 36 at 125cm; walk bridge 0psu surface to 125cm, 32 at bottom
(185cm). River flow - high
Data sheet 17: Marine and Estuarine Sites, September 11-12, 2002
Water Quality of the Great River Watershed, St. James/Hanover/.Westmoreland
54
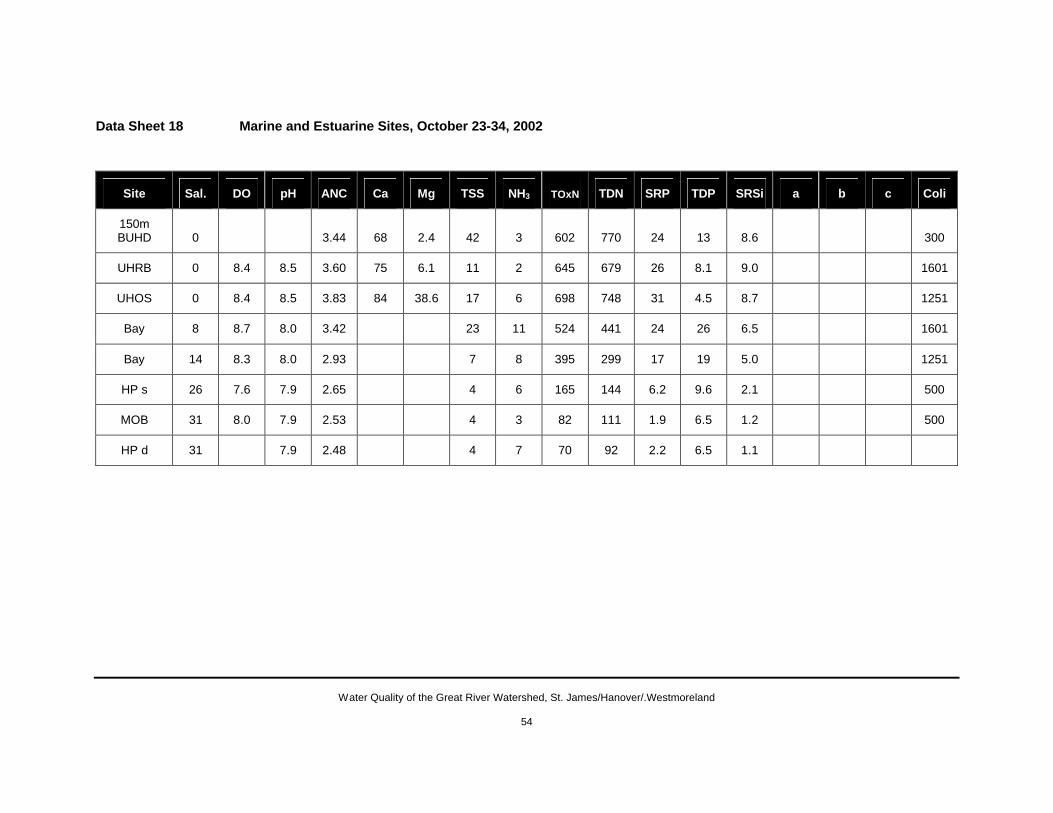
Data Sheet 18 Marine and Estuarine Sites, October 23-34, 2002
Site Sal. DO pH ANC Ca Mg TSS NH3 TOxN TDN SRP TDP SRSi a b c Coli
150m BUHD 0 3.44 68 2.4 42 3 602 770 24 13 8.6 300
UHRB 0 8.4 8.5 3.60 75 6.1 11 2 645 679 26 8.1 9.0 1601
UHOS 0 8.4 8.5 3.83 84 38.6 17 6 698 748 31 4.5 8.7 1251
Bay 8 8.7 8.0 3.42 23 11 524 441 24 26 6.5 1601
Bay 14 8.3 8.0 2.93 7 8 395 299 17 19 5.0 1251
HP s 26 7.6 7.9 2.65 4 6 165 144 6.2 9.6 2.1 500
MOB 31 8.0 7.9 2.53 4 3 82 111 1.9 6.5 1.2 500
HP d 31 7.9 2.48 4 7 70 92 2.2 6.5 1.1

Water Quality of the Great River Watershed, St. James/Hanover/.Westmoreland
55
Salinity:- Harris Point 25-33psu at surface, 36 below 100cm; Middle of the Bay 26-31psu at surface, 36 at 100cm; just north of the River 20-25psu at surface, 36 at 100cm; opening to sea 0psu at surface, 36 at 100cm; walk bridge 0psu surface to bottom. Rver flow - high
Data Sheet 18: Marine and Estuarine Sites, October 23-24, 2002

Water Quality of the Great River Watershed, St. James/Hanover/.Westmoreland
56
Data Sheet 19 Marine and Estuarine Sites, November 26-27, 2002
Site Sal. DO pH ANC Ca Mg TSS NH3 TOxN TDN SRP TDP SRSi a b c Coli
150m BUHD 0 33 8 658 20 1.1 0.1 0.1
UHRB S 0 7.9 23 13 610 16 0.8 0.1 0.1 1601
UHOS 0 8.0 8.3 25 14 619 26 8.6 0.9 0.1 0.1 1600
Bay 10 7.7 8.0 25 18 323 20 6.4 1.5 0.1 0.2 1601
80 N 13 7.5 22 16 316 16 5.1 1.5 0.1 0.5 900
UHOS d 25 21 16 225 8.1 2.4 4.3 0.1 0.7
MOB 26 7.4 20 16 231 8.4 2.1 1.1 0.1 0.1 1250
100 N 26 15 7 230 27 2.0 1.2 0.1 0.2 900
HP s 31 6.7 17 7 156 2.2 0.4 0.7 0.1 0.1 26
HP d 35 6.7 4 9 64 1.2 0.1 0.9 0.3 0.1 4

Water Quality of the Great River Watershed, St. James/Hanover/.Westmoreland
57
Salinity:- Harris Point 32psu at surface, 36 below 50cm; Middle of the Bay 34psu at surface, 35psu below 15cm; just north of the River 8-9psu at surface, 25-35 at 15cm, 35 below 50cm ; opening to sea 1-3psu at surface, 9-10 at 15cm, 29 at bottom; walk bridge 7-8psu surface to
bottom. River flow - medium
Data sheet 19: Marine and Estuarine Sites, November 26-27, 2002

Water Quality of the Great River Watershed, St. James/Hanover/.Westmoreland
58
Data Sheet 20 Marine and Estuarine Sites, February 4-5, 2003
Site Sal. DO pH ANC Ca Mg TSS NH3 TOxN TDN SRP TDP SRSi a b c Coli
150m BUHD 0 3.39 63 6.3 14 6 840 462 11 10 5.9 0.5 0.1 0.1 900
UHRB 0 8.3 8.4 3.70 76 14.3 9 4 903 1218 20 12 7.7 0.3 0.1 0.1 1601
UHOS 0 8.3 8.4 12 7 878 1260 22 11 7.0 0.4 0.1 0.1 900
UHOS d 12 10 594 728 17 17 5.8 0.9 0.1 0.1 900
40 S 13 9 20 529 533 17 19 6.1 1.6 0.1 0.5 170
20 S 20 21 9 396 550 12 16 4.0 1.1 0.1 0.1 220
MOB 33 8.2 15 2 45 83 1.2 4.3 1.1 0.2 0.1 0.1 33
Bay 34 7.4 8.3 4 6 20 83 0.5 2.8 1.1 0.4 0.1 0.1 80
Bay d 35 12 2 4 90 0.6 2.5 1.1 0.8 0.2 0.1 110
HPd 35 4 4 4 60 0.5 2.5 0.7
HP rocks 36 7.6 7.5 11 7 11 82 0.5 1.9 0.7 0.3 0.1 0.1 1
HPs 36 8.2 4 2 7 68 0.5 1.9 0.7 0.2 0.1 0.1 5

Water Quality of the Great River Watershed, St. James/Hanover/.Westmoreland
59
Salinity:- Harris Point 36psu; Middle of the Bay 26psu at surface, 36psu at 50cm; just north of the River 33psu at surface 36psu at 50cm ; opening to sea 1-3psu to 50cm, 20 at 75cm; between walk bridge and opening to sea 0-1psu to 50cm, 10-15 at 75cm and 20-25 at bottom (~
2-3m deep) River flow - medium
Data sheet 20: Marine and Estuarine Sites, February 4-5, 2003

Water Quality of the Great River Watershed, St. James/Hanover/.Westmoreland
60
Data Sheet 21 Marine and Estuarine Sites, March 25-26, 2003
Site Sal. DO pH ANC Ca Mg TSS NH3 TOxN TDN SRP TDP SRSi a b c Coli
150m BUHD 0 5.12 50 3 658 882 7.4 5.6 8.5 4.0 1.8 1.6 1601
UHRB 0 8.2 5.73 31 13 644 810 13 12 9.5 2.6 0.5 0.3 1601
UHOS 0 8.0 5.81 24 6 612 1129 13 11 17.8 4.1 1.9 2.1 1251
20 N 4 5.64 39 13 441 697 19 22 8.9 2.8 1.4 1.2 900
Bay 10 5.11 28 5 385 554 7.8 14 6.9 1600
Bay 14 4.88 38 6 344 440 8.4 12 5.9 2.3 1.3 1.0 23
Bay 25 7.8 4.14 20 8 132 192 2.5 5.3 2.6 2.7 1.8 1.4 1600
MOB 30 7.9 3.87 8 0 87 119 0.9 4.0 1.5 2.0 1.1 1.1 500
Bay 30 20 3 83 64 1.9 4.0 3.4 1.7 1.1 1.0 500
HP d 34 7.4 3.62 4 1 3 39 5.0 3.7 0.1 1.5 1.5 1.2 2
HP s 34 7.4 3.65 4 3 3 64 1.9 2.2 0.1 2
Water Quality of the Great River Watershed, St. James/Hanover/.Westmoreland
61
Salinity:- Harris Point 35psu; Middle of the Bay 29psu at surface, 35psu at 50cm; just north of the River 10-20psu at surface, 35psu at 50cm ; opening to sea 1-3psu to 20cm, 10-15 at 50cm, 31 at bottom; walk bridge 0-1psu to 50cm, 25-30 at 2-4m deep. River flow - low
Data sheet 21: Marine and Estuarine Sites, March 25-26, 2003

Water Quality of the Great River Watershed, St. James/Hanover/.Westmoreland
62
Data Sheet 22 Marine and Estuarine Sites, May 6-7, 2003
Site Sal. DO pH ANC Ca Mg TSS NH3 TOxN TDN SRP TDP SRSi a b c Coli
150m BUHD 0 4 18 560 434 4.3 5.6 10.4 0.6 0.1 0.1 1050
UHRB 1 8.0 7.9 16 17 562 428 11.8 13.0 10.7 0.7 0.1 1.5 300
30 N 8 20 22 433 500 7.8 10.2 8.8 2.5 0.1 0.4 220
30 N d 15 8.1 10 18 315 168 8.4 7.8 6.2 2.5 0.1 0.5 500
30 N d 21 8.1 10 11 204 73 4.7 9.9 4.0 2.8 0.1 0.3 220
UHOS 25 8.1 7.7 23 14 173 39 6.2 9.0 3.9 1.3 0.1 0.2 17
50 N 30 7.1 7.7 32 8 71 84 0.3 5.6 1.5 2.1 0.1 0.3 2
MOB 33 7.5 8.1 7 5 41 36 0.6 3.7 0.9 0.4 0.1 0.1 240
MOB d 35 4 2 2 2 0.3 3.1 0.2 0.1 0.1 0.1 1
HP-MOB 35 4 2 2 2 0.3 0.9 0.1 0.3 0.1 0.1 1
HP s 36 7.6 8.1 4 2 2 2 0.3 1.9 0.1 0.2 0.1 0.1 1

Water Quality of the Great River Watershed, St. James/Hanover/.Westmoreland
63
Salinity:- Harris Point 36psu; Middle of the Bay 34psu at surface, 35 at 10cm; just north of the River 12-15psu at surface, 30-32 at 50cm, 35psu at 150cm ; opening to sea 2-3psu to15cm, 9-11 at 20cm, 26 at 50cm, 34 at bottom; walk bridge 2-3psu to 20cm, 20 at 50cm, 30 at
150cm, 34 at bottom. River flow - low
Data sheet 22: Marine and Estuarine Sites, May 6-7, 2003
Water Quality of the Great River Watershed, St. James/Hanover/.Westmoreland
64
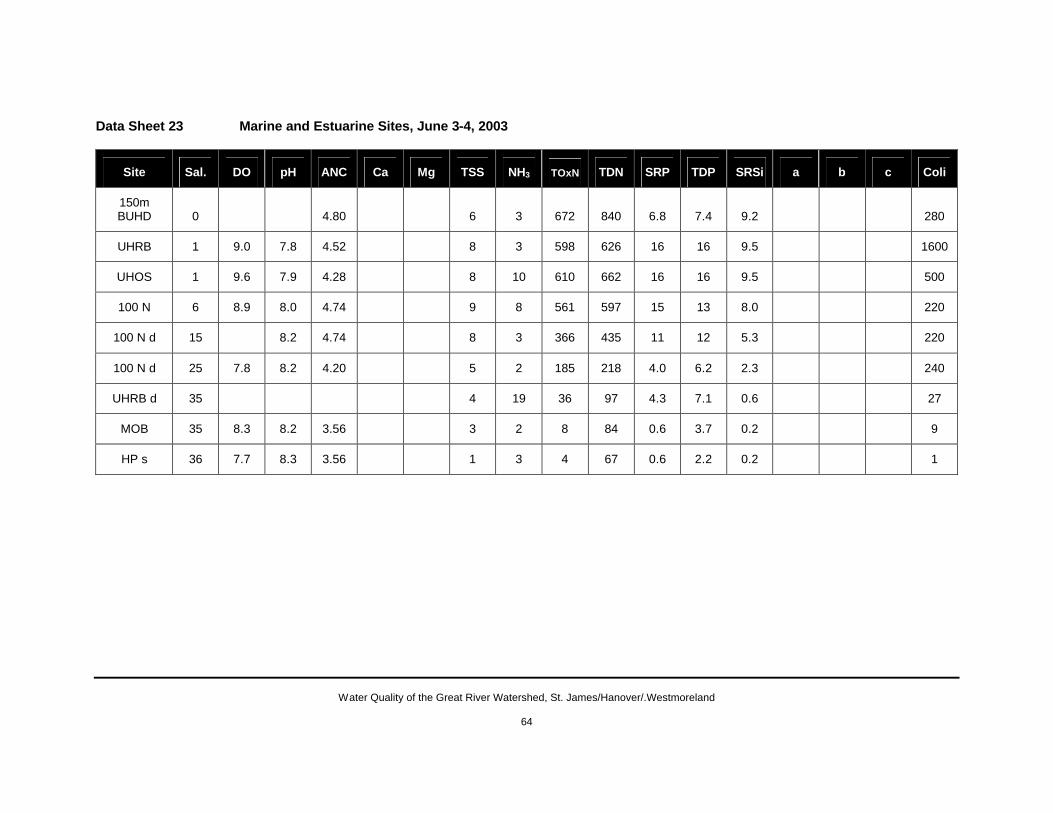
Data Sheet 23 Marine and Estuarine Sites, June 3-4, 2003
Site Sal. DO pH ANC Ca Mg TSS NH3 TOxN TDN SRP TDP SRSi a b c Coli
150m BUHD 0 4.80 6 3 672 840 6.8 7.4 9.2 280
UHRB 1 9.0 7.8 4.52 8 3 598 626 16 16 9.5 1600
UHOS 1 9.6 7.9 4.28 8 10 610 662 16 16 9.5 500
100 N 6 8.9 8.0 4.74 9 8 561 597 15 13 8.0 220
100 N d 15 8.2 4.74 8 3 366 435 11 12 5.3 220
100 N d 25 7.8 8.2 4.20 5 2 185 218 4.0 6.2 2.3 240
UHRB d 35 4 19 36 97 4.3 7.1 0.6 27
MOB 35 8.3 8.2 3.56 3 2 8 84 0.6 3.7 0.2 9
HP s 36 7.7 8.3 3.56 1 3 4 67 0.6 2.2 0.2 1

Water Quality of the Great River Watershed, St. James/Hanover/.Westmoreland
65
Salinity:- Harris Point 33psu at surface, 35 below 15 cm; Middle of the Bay 24psu at surface, 35 at 10cm; just north of the River 8-10psu at surface, 25-30 at 15cm, 35psu at 50cm ; opening to sea 1-2psu to15cm, 33-35 from 20cm to bottom; walk bridge 1-3psu to 240cm, 34-36
50cm - bottom. River flow - medium.
Data sheet 23: Marine and Estuarine Sites, June 3-4, 2003

Water Quality of the Great River Watershed, St. James/Hanover/.Westmoreland
66
Data Sheet 24 Marine and Estuarine Sites, July 13-14, 2003
Site Sal. DO pH ANC Ca Mg TSS NH3 TOxN TDN SRP TDP SRSi a b c Coli
150m BUHD 0 30 4 854 938 31 24 10.1 1.6 0.8 0.9 1601
UHRB 0 8.7 42 31 772 1747 34 25 9.9 1.1 0.5 0.9 1601
UHOS 1 8.7 43 42 837 840 32 30 10.0 1.0 0.1 0.2 1601
50 N 26 36 15 159 258 9.6 14 3.5 1.5 1.6 3.5 1600
50 N d 32 10 17 92 154 5.0 8.4 1.4 1.2 0.5 0.9
MOB 35 8.1 7 4 24 47 1.2 3.1 0.5 0.8 0.7 1.2 500
HP s 35 7.7 11 5 29 65 0.6 5.0 0.5 0.7 0.4 1.1 1250

Water Quality of the Great River Watershed, St. James/Hanover/.Westmoreland
67
Salinity:- Harris Point 32psu at surface, 36 below 50cm; Middle of the Bay 25-30psu at surface, 36 below 50cm; just north of the River 25psu at surface, 36 below 50cm ; opening to sea 2-3psu surface to bottom; walk bridge 1-3psu to 30cm, 32 at 125cm, 36 below 24cm. River flow -
medium
Data sheet 24: Marine and Estuarine Sites, July 13-14, 2003
Water Quality of the Great River Watershed, St. James/Hanover/.Westmoreland
68
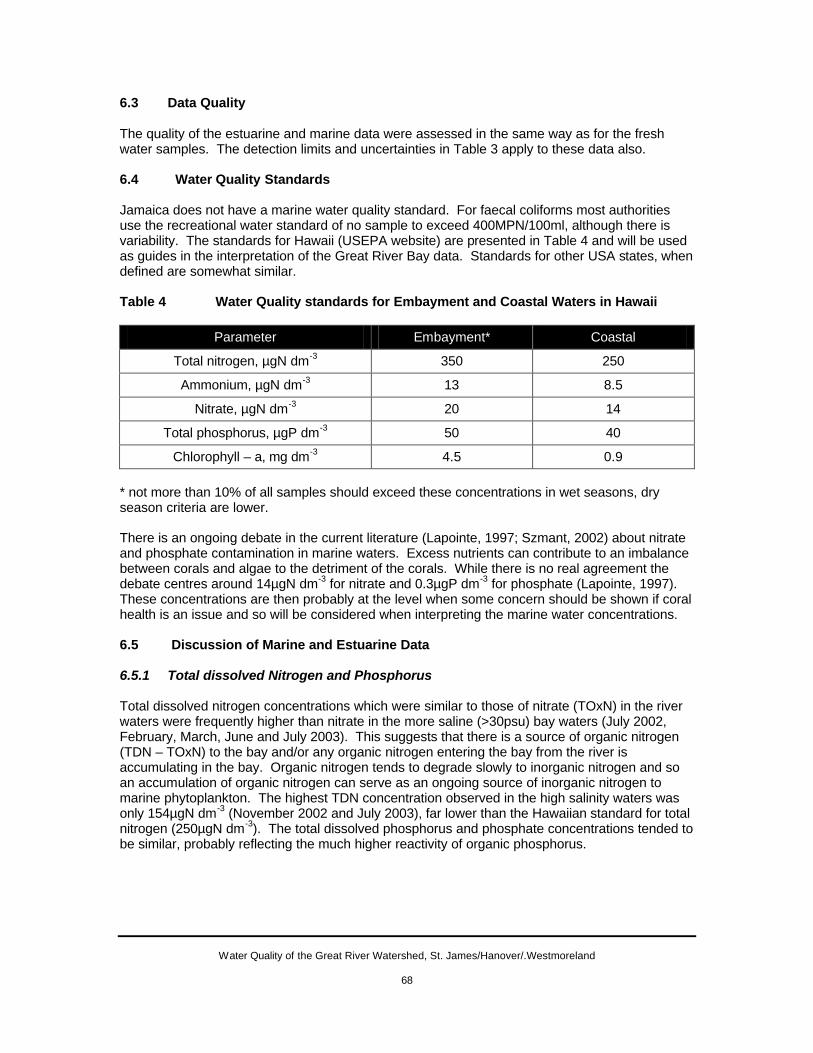
6.3 Data Quality The quality of the estuarine and marine data were assessed in the same way as for the fresh water samples. The detection limits and uncertainties in Table 3 apply to these data also. 6.4 Water Quality Standards Jamaica does not have a marine water quality standard. For faecal coliforms most authorities use the recreational water standard of no sample to exceed 400MPN/100ml, although there is variability. The standards for Hawaii (USEPA website) are presented in Table 4 and will be used as guides in the interpretation of the Great River Bay data. Standards for other USA states, when defined are somewhat similar.
Table 4 Water Quality standards for Embayment and Coastal Waters in Hawaii
Parameter Embayment* Coastal
Total nitrogen, µgN dm-3 350 250
Ammonium, µgN dm-3 13 8.5
Nitrate, µgN dm-3 20 14
Total phosphorus, µgP dm-3 50 40
Chlorophyll – a, mg dm-3 4.5 0.9 * not more than 10% of all samples should exceed these concentrations in wet seasons, dry season criteria are lower.
There is an ongoing debate in the current literature (Lapointe, 1997; Szmant, 2002) about nitrate and phosphate contamination in marine waters. Excess nutrients can contribute to an imbalance between corals and algae to the detriment of the corals. While there is no real agreement the debate centres around 14µgN dm-3 for nitrate and 0.3µgP dm-3 for phosphate (Lapointe, 1997). These concentrations are then probably at the level when some concern should be shown if coral health is an issue and so will be considered when interpreting the marine water concentrations. 6.5 Discussion of Marine and Estuarine Data 6.5.1 Total dissolved Nitrogen and Phosphorus Total dissolved nitrogen concentrations which were similar to those of nitrate (TOxN) in the river waters were frequently higher than nitrate in the more saline (>30psu) bay waters (July 2002, February, March, June and July 2003). This suggests that there is a source of organic nitrogen (TDN – TOxN) to the bay and/or any organic nitrogen entering the bay from the river is accumulating in the bay. Organic nitrogen tends to degrade slowly to inorganic nitrogen and so an accumulation of organic nitrogen can serve as an ongoing source of inorganic nitrogen to marine phytoplankton. The highest TDN concentration observed in the high salinity waters was only 154µgN dm-3 (November 2002 and July 2003), far lower than the Hawaiian standard for total nitrogen (250µgN dm-3). The total dissolved phosphorus and phosphate concentrations tended to be similar, probably reflecting the much higher reactivity of organic phosphorus.

Water Quality of the Great River Watershed, St. James/Hanover/.Westmoreland
69
6.5.2 Ammonium For ammonium the concentrations in the estuary tended to be higher than in the river water and then gradually fell off with increasing salinity, although there was a fair amount of scatter in the data. This suggests a source of ammonium to the estuary other than the river, possibly from the Unity Hall area or from the reduction of the oxidised forms of nitrogen within the sediment of the estuary. Sediment tends to accumulate in estuaries and when dying plants and other organics settle to the sediment oxygen can become depleted facilitating nitrogen reduction. Correlations of ammonium concentrations with salinity were not always apparent (on some graphs lines have not been drawn) and there were no clear trends with river flow. Concentrations never exceed the Hawaiian standard for coastal waters in the high salinity samples. 6.5.3 Total Oxidised Nitrogen These oxidised forms of nitrogen tended to behave conservatively through the estuary regardless of river flow conditions. Concentrations in the high salinity bay samples (2 – 84µgN dm-3) often tended to be at or above the 14µgN dm-3 concentration debated to be the concentration above which coral health may be threatened (section 6.2). The data suggest that the bay waters were slightly contaminated with oxidised nitrogen. 6.5.4 Soluble Reactive Phosphorus This essential plant nutrient behaved approximately conservatively through the estuary except that on nearly all occasions the concentrations were higher at the Unity Hall road bridge than at the below the dam site suggesting a source of phosphorus to the estuary at Unity Hall. The concentrations in the fully saline waters only exceeded the debated 3µgP dm-3 level once (September 2002). No trends with river flow were apparent. 6.5.5 The Nitrogen Phosphorus Balance The nitrogen to phosphorus ratio in the estuarine and marine samples exceeded 30 and often 100 on all but two occasions (September 2002 and March 2003). This suggests that as for the river waters phosphorus concentrations limiting phytoplankton growth (see section 5.4.7). The coastal waters were therefore susceptible to phosphorus contamination as there was sufficient nitrogen to sustain photosynthesis. 6.5.6 Silica The concentrations of silica within and through the estuary varied very little throughout the study period, behaved conservatively on all occasions except September 2002 and showed no variations with river flow. In September 2002, under high river flow conditions, there appeared to have been a significant source of silica to the estuary other than from the river which raised the concentrations close to the river mouth to about twice those normally observed. It is not clear what may have caused that. 6.5.7 Total Suspended Solids The suspended solids were normally barely detectable in the high salinity bay waters, as expected for tropical coastal systems. The behaviour through the estuary was somewhat erratic possibly due to the effect the narrow river mouth plays in channelling the outflow through breaking waves which will be picking up coastal sediment and thus adding solids to those flowing from the river. In July 2002 when the river flow was very high, the suspended load was very high

Water Quality of the Great River Watershed, St. James/Hanover/.Westmoreland
70
and reached out to the fully marine waters at Harris Point. In August 2002, also a high river flow occasion, the concentrations were lower but sediment was still reaching Harris Point. This is consistent with local knowledge of sediment flow to the bay during floods (Mr. Gary Hales, personal communication). 6.5.8 Faecal Coliforms Faecal coliforms in the fully marine waters only exceeded the 400MPN/1000ml standard on two occasions, July 2002 (high river flow) and July 2003 (medium river flow). On most other occasions (all except August (high flow), October (high flow), November (medium flow) 2002 and March (low flow) 2003) the concentrations dropped rapidly with increasing salinity. Faecal coliforms are known to die off quickly when exposed to sunlight and saline waters (Hazen, 1988). It is clear that the coliform contamination of the river was reaching the coastal waters under all river flow regimes. 7. Conclusions a) The study was conducted during mainly medium to high river flow conditions although
samples were not collected during the significant flood events. b) The river flow was minimal in the upper reaches of the river and only started to become
significant at Hazylymph. c) Because of the minimal river flow in the upper reaches of the river any contamination in those
areas would have minimal effect on down river sites. d) The major chemistry of the river wass determined by the limestone geology with minor
exceptions at Chesterfield and Quashies River. e) The suspended sediment load was seldom significantly elevated. f) The major contamination problem was from faecal matter and this occured throughout the
watershed. g) Nutrient concentrations were not significantly elevated at any site. h) Phosphorus concentrations tended to be particularly low and limited the extent of aquatic
plant growth, especially at Stonehenge and Seven Rivers. i) The phosphorus limitation to aquatic plant growth allowed for nitrogen concentrations to build
up to marginally elevated levels at most sites except at Quashies River where nitrogen and phosphorus seemed to be in balance with aquatic plant demands.
j) There was no detectable pesticide contamination in the watershed. k) The river plume flowed north from the river mouth and was generally detectable in the
surface waters in middle of the bay but only reached Harris Point under heavier river flow conditions, carrying its sediment load with it. The fresh water seldom penetrated to depths greater then 1 meter.

Water Quality of the Great River Watershed, St. James/Hanover/.Westmoreland
71
l) The Unity Hall area seemed to be a source of phosphorus and possibly ammonium to the river and its initial estuary.
m) Under the conditions that prevailed during the study the nutrients in the river had minimal
impact on Great River Bay, most simply being diluted as they reach the marine waters although there was a suggestion of slightly elevated nitrogen in the bay.
n) Faecal coliform contamination was detected in the bay waters on six of the eleven occasions
when that parameter was analysed for. On two occasions faecal coliforms were detectable in the fully marine waters.
8. Recommendations a) The faecal coliform contamination in the watershed and Great River Bay needs to be
addressed as it was consistently at the level considered to be threatening to human health. This will require improving sanitation conditions throughout the water shed and to restricting animal farming activities from the banks (50 – 100m) of the river.
b) Although nutrient concentrations were not significantly elevated efforts should be made to
limit any further nitrogen contamination. This would be predominantly achieved through recommendation a) and ensuring that farmers throughout the watershed use best fertilizer application practices.
c) Every effort should be made to avoid phosphorus contamination as photosynthesis will be
enhanced if such contamination occurs. This should be achieved through adopting recommendation b).
d) The river site that showed both faecal and nutrient contamination was Chesterfield. Within
the vicinity of the sampling site were a chicken farm, fruit farms and a small community with pit toilets (one within 10meters of the river). This community could be targeted for implementing best practices as a pilot study. Replacing the pit toilet (and others) with an appropriate alternative, restricting farming activities from the banks of the river and having farmers implement best agricultural practices could be undertaken. To illustrate the effects of these practices on river water quality the water will need to be monitored prior to and during the implementations. To my knowledge the is no Jamaican case study that clearly demonstrates that implementing these best practices actually leads to improved water quality. If it can be shown that it does then marketing the use of best practices should be easier.
e) Another possible demonstration site could be Unity Hall where there is a small residential
community involved in a wide variety of activities (fishing, goat, cattle and pig farming, crop growing, boat building, amongst others). This is within the estuary of the river and in addition to the ubiquitous coliform contamination there is evidence of nutrient contamination which could well be affecting the aquatic life of the estuary and the coastal waters.
f) A long term water quality monitoring programme should be implemented and managed by a
local interest group (The Great River Water and Sanitation Task Force or an NGO or similar body). This should follow the proposed National Water Quality Monitoring Programme and could serve as a pilot for that programme. The sites for monitoring should be Chesterfield (because of the contamination observed there), Lethe (because of the recreational activities) and Unity Hall (because of the potential impact to the river on the estuary and coastal
Water Quality of the Great River Watershed, St. James/Hanover/.Westmoreland
72
ecosystems). Flow monitoring gauges should be established at each site. Parameters to be determined should include faecal coliforms, total suspended solids, conductivity, ammonium, soluble reactive phosphorus and oxidised nitrogen. A biological monitoring programme should also be considered. Water quality monitoring should be at least monthly and strategies need to be put in place to allow for sampling during high flow conditions. The NWC should be encouraged to share any data they generate from their Stonehenge and Unity Hall extractions. Community persons should be identified and trained in observing water quality and in water sampling methods. Collected samples should be sent to approved laboratories who can supply the necessary sampling equipment and report directly to the managing body. An independent water quality expert should be contracted to monitor the programme and to prepare annual reports on the data.
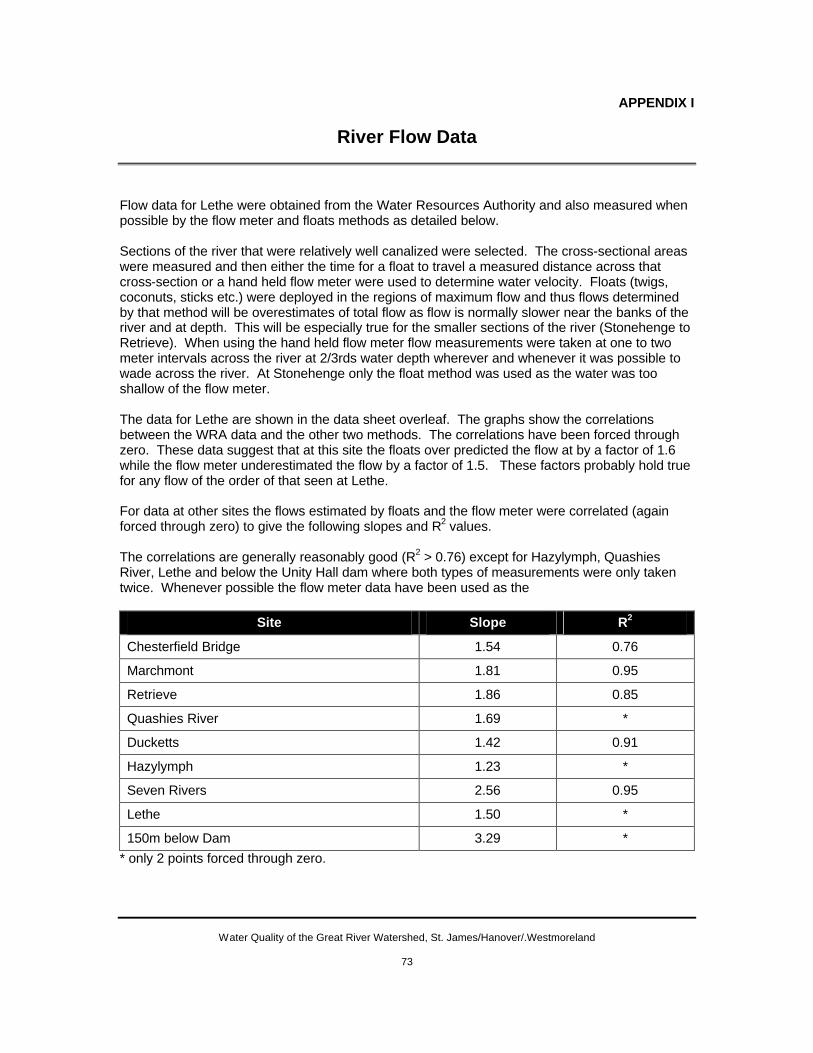
Water Quality of the Great River Watershed, St. James/Hanover/.Westmoreland
73
APPENDIX I
River Flow Data
Flow data for Lethe were obtained from the Water Resources Authority and also measured when possible by the flow meter and floats methods as detailed below. Sections of the river that were relatively well canalized were selected. The cross-sectional areas were measured and then either the time for a float to travel a measured distance across that cross-section or a hand held flow meter were used to determine water velocity. Floats (twigs, coconuts, sticks etc.) were deployed in the regions of maximum flow and thus flows determined by that method will be overestimates of total flow as flow is normally slower near the banks of the river and at depth. This will be especially true for the smaller sections of the river (Stonehenge to Retrieve). When using the hand held flow meter flow measurements were taken at one to two meter intervals across the river at 2/3rds water depth wherever and whenever it was possible to wade across the river. At Stonehenge only the float method was used as the water was too shallow of the flow meter. The data for Lethe are shown in the data sheet overleaf. The graphs show the correlations between the WRA data and the other two methods. The correlations have been forced through zero. These data suggest that at this site the floats over predicted the flow at by a factor of 1.6 while the flow meter underestimated the flow by a factor of 1.5. These factors probably hold true for any flow of the order of that seen at Lethe. For data at other sites the flows estimated by floats and the flow meter were correlated (again forced through zero) to give the following slopes and R2 values. The correlations are generally reasonably good (R2 > 0.76) except for Hazylymph, Quashies River, Lethe and below the Unity Hall dam where both types of measurements were only taken twice. Whenever possible the flow meter data have been used as the
Site Slope R2
Chesterfield Bridge 1.54 0.76
Marchmont 1.81 0.95
Retrieve 1.86 0.85
Quashies River 1.69 *
Ducketts 1.42 0.91
Hazylymph 1.23 *
Seven Rivers 2.56 0.95
Lethe 1.50 *
150m below Dam 3.29 * * only 2 points forced through zero.

Water Quality of the Great River Watershed, St. James/Hanover/.Westmoreland
74
Accurate estimate of the flow. Given the reasonable correlations between the floats and the flow meter measurements, whenever flow meter data were not available the floats estimates have been corrected using the appropriate slope. This is probably reasonable for the low flow sites. At the below dam site the floats measurements have been corrected using the Lethe correlations based on the assumption that the flows were comparable and thus the correlations are probably also comparable. The resulting estimates of flow are given in the data sheet and in Figure 2 (page 12) of the report. Without doubt the estimates of flow have high uncertainties, except for Lethe. However even given those uncertainties the flow in the upper reaches of the river were very low compared to Lethe, especially during medium to high flow conditions. Also the flows at the sites on any field trip follow approximately the same trends as the flows at Lethe (low, medium or high conditions at Lethe are also relevant to the other site flows). The estimates are therefore considered reasonable for the present study although better flow calibrations will be necessary for any long term monitoring.

Water Quality of the Great River Watershed, St. James/Hanover/.Westmoreland
75

Water Quality of the Great River Watershed, St. James/Hanover/.Westmoreland
76
Assessed Flow Data Sheet
site 7
date 1 2 3 4 4a 5 6 6a
WRA floats flow meter 9
8-Apr-02 0.04 0.09 0.04 0.06 0.07 0.19 0.07 1.22 2.59 0.86
25-Mar-03 0.03 0.05 0.22 0.12 0.01 0.45 1.50 0.15 2.32 3.78
6-May-03 0.05 0.07 0.20 0.29 0.01 0.40 1.00 0.06 2.32 4.51 1.15 1.60
21-May-02 0.11 0.06 0.35 0.71 0.06 0.71 0.83 0.98 2.55 1.99 0.63
4-Feb-03 0.04 0.05 0.23 0.17 0.00 0.34 0.43 0.30 5.77 5.21 4.01 6.20
26-Nov-02 0.14 0.16 0.46 0.72 0.02 1.44 1.52 0.57 8.15 11.59 9.10
2-Jun-03 0.21 0.54 0.74 0.03 1.37 2.18 0.46 8.32 10.53 7.20
14-Jul-03 0.05 0.19 0.68 0.76 0.11 1.42 0.56 8.83 17.75 5.00
7-Aug-02 0.16 0.16 0.76 1.07 0.05 1.85 1.06 13.58
3-Jul-02 0.09 0.19 0.65 13.81 5.30
11-Sep-02 0.42 0.06 0.60 0.89 0.09 1.86 2.42 0.77 16.30 27.04 7.30
23-Oct-02 0.33 0.20 0.91 1.31 0.03 24.00
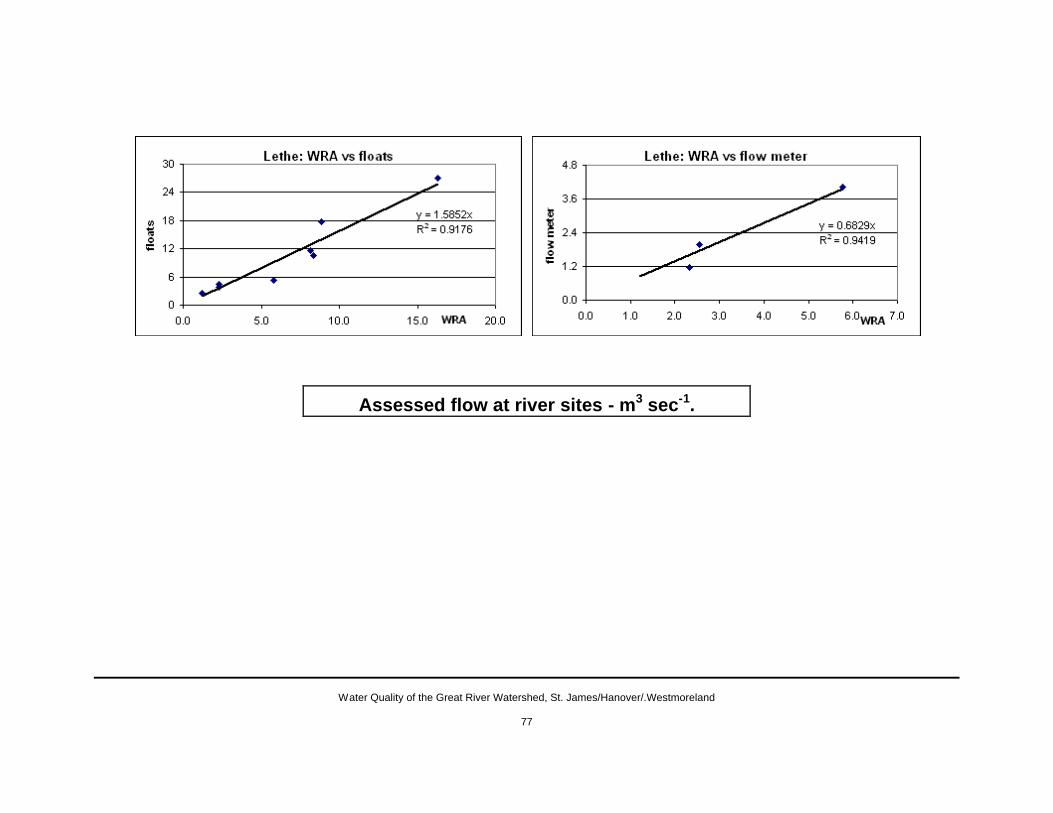
Water Quality of the Great River Watershed, St. James/Hanover/.Westmoreland
77
Assessed flow at river sites - m3 sec-1.

Water Quality of the Great River Watershed, St. James/Hanover/.Westmoreland
78
APPENDIX II
Analytical Methods Sample Collection, Transport and Storage Samples were collected in pre-cleaned (1M HCl) high density polyethylene bottles (HDPE) for chemical parameters (1 dm3) and chlorophylls (500ml) and in pre-cleaned (1M HCl) glass (2.5 dm3 for water, 500ml for sediment) bottles for pesticides. Autoclaved 200ml glass or HDPE bottles for faecal coliforms were supplied by NEPA. Collected samples were stored on ice until delivered to the laboratories. Coliform samples were couriered to NEPA on the day of collection, arriving at the laboratory the morning after sampling. All analyses were done at the Discovery Bay Marine Laboratory except for coliforms and pesticides which were done at the NEPA and UWI Department of Chemistry laboratories respectively. Samples for chemical analyses were filtered at 0.45µm upon arrival at the laboratory (at most 36 – 48 hours after sampling) and their conductivities (electrode) and for marine samples salinities (Licar® refractometer) were recorded prior to storage at 4C until analysed. Ammonium was normally analysed for immediately after filtration. The following standard analytical methods were used (full details including instrumental and reagent specifications are available on request from the Discovery Bay Marine Laboratory Chemical Analytical Facility): Field Measurements pH, DO, conductivity, salinity and temperature were recorded using an Horiba® water quality probe pre-calibrated as defined in the probe manual. Laboratory Measurements 1. Total Suspended Solids Known volumes of samples were filtered through 0.45µM membrane filters which were dried at 60C overnight and then weighed. Blank filters washed with an equivalent volume of distilled water or clean seawater were treated similarly and the mass of collected solids determined by difference. 2. Chlorophylls Samples collected for chlorophyll analyses were filtered through 0.45µm membrane filters and the collected residue extracted with 90% acetone, stored overnight in the dark at 4C, centrifuged and the supernatant decanted and absorbances measured at 750, 664, 647, and 630 nm using a 10-cm cell (Parsons et al., 1984).
Water Quality of the Great River Watershed, St. James/Hanover/.Westmoreland
79
3. Soluble Reactive and Total Dissolved Phosphorus Soluble reactive phosphorus (SRP) was determined using the antimony-phospho-molybdate-ascorbic method with absorbances measured at 880nm with a 5-cm cell (Parsons et al., 1984). Total dissolved phosphorus (TDP) was determined as for SRP after autoclaved the samples at 121ºC (15 psi) for 30 minutes in the presence of basic persulphate. 4. Ammonium Ammonium ions were determined using the phenol-hypochlorite-citrate method with the absorbances of the blue indophenol complex measured at 640nm using a 5-cm cell (Parsons et al., 1984). 5. Total Oxidized and Total Dissolved Nitrogen Total oxidised nitrogen (TOxN) was determined by the Cd column reduction and azo dye method with absorbances measured at 543nm in a 1-cm cell (Parsons et al., 1984). Total dissolved nitrogen was determined as for TOxN after autoclaved the samples at 121ºC (15 psi) for 30 minutes in the presence of basic persulphate and appropriate pH adjustment. 6. Soluble Reactive Silica Soluble reactive silica was determined using the silicomolybdate-metol-sulphite-oxalic acid method with absorbances measured at 810nm using a 1-cm cell (Parsons et al., 1984). 7. pH and Acid Neutralizing Capacity (Alkalinity) The pHs of the samples were determined using an Orion® triode combination electrode and an Orion® pH/mv meter following the electrode instruction manual. ANCs were determined by titration with standard acid and monitoring the pH with an electrode (Kramer, 1982). 8. Calcium and Magnesium Calcium plus magnesium was determined by titration with ethylene-diamine-tetraacetic acid at pH 10 using erichrome black-T as indicator (Jeffrey et al., 1989). Calcium was determined by titration with ethylene-glocol-tetraacetic acid at pH 10 using zincon as indicator (Jeffrey et al., 1989). Magnesium was calculated by difference. 9. Faecal Coliforms Faecal coliforms were determined by the most probable number method (Eaton et al., 1995). 10. Pesticides Pesticides were determined at the UWI Department of Chemistry Pesticide Residue Laboratory using a gas chromatography method developed from Jon B. Mann A Manual for Training in Pesticide Analysis and an electron capture detector. Detection limits for sediment and water samples were 50 and 10ppb. Further details are available from the laboratory.
Water Quality of the Great River Watershed, St. James/Hanover/.Westmoreland
80
APPENDIX III
Data Quality The quality of the data have been assessed by the techniques indicated below. Further information is available from the DBML-CAF and the procedures will be discussed in full detail in Miss Campbell’s thesis. a) Accuracy: For TOxN, TDN, ammonia, SRP, TDP and SRSi calibration curve details (slope
and intercept) were monitored and compared to expected values. Approximately 10% of all samples were spiked with known amounts of appropriate standard analytes and recoveries calculated and expressed as percentages of added spikes. Recoveries ranged between 90 and 120% and were considered appropriate for the present study. The laboratory is involved in an international inter-laboratory comparison programme (QUASIMEME, Wells et al. 1999) covering all of the above analytes. The laboratory also runs an intra-laboratory comparison programme between its own analysts. Performance details are available on request. Conductivity and salinity measurements on all samples and field measurements are compared by standard calculations and field and laboratory measurements cross-compared. When field measurements did not agree with laboratory measurements the laboratory values were used as these related directly to the solutions being analysed. Field measurements could differ because of natural variabilities at the sites, especially the mid-salinity sites.
b) Precision: Approximately 15% of all samples were collected in duplicate and approximately
15% of all collected samples were analysed in duplicate to yield precisions for both the analytical and sampling plus analytical uncertainties respectively (Taylor, 1987). In all cases sampling plus analytical precisions were greater than analytical precisions and the former have been cited in Table 3 of the report (page 9).

Water Quality of the Great River Watershed, St. James/Hanover/.Westmoreland
81
APPENDIX IV
References
Hayman, Alicia. 2001. Rapid Rural Appraisal of the Great River Watershed. ARD, Burlington, USA. Hazen, T.C. 1988. Fecal Coliforms as Indicators in Tropical Waters: A Review. Toxicity Assessment, 3, 461-477. Lapointe, Brian E., 1997. Nutrient Thresholds for Bottom-up Control of Macroalgal Blooms on Coral Reefs in Jamaica and Southeast Florida. Limonology and Oceanography, 42, 1119-1131. Parsons Timothy R., Yoshiaki Maita and Carol M. Lalli, 1984. A Manual of Chemical and Biological Methods for Seawater Analyses. Pergamon Press, Oxford, England. Szmant, Alina M., 2002. Nutrient Enrichment on Coral Reefs: Is it a Major Cause of Coral Reef Decline? Estuaries, 25, 743-766. Eaton A.D., L.S. Clesceri and A.E. Greenberg (eds), 1995. Standard Methods for Examination of Water and Waste Water. American Public Health Association, American Water Works Association and Water Environment Federation, 19th edition, Washington DC. Jeffrey G.H., J. Bassett, J. Mendham and R.C. Dennis, 1989. Vogels Textbook of Quantitative Chemical Analysis. 5th edition. Longman Scientific and Technical, London. Kramer J.K., 1982. Alkalinity and Acidity. In Water Analysis, volume 1, Inorganic Species, part 1. R.A. Minear and L.H Keith (eds). Academic Press Inc., London. Taylor J.K., 1987. Quality Assurance of Chemical Methods. Lewis Publishers, Boca raton, Florida. United Nations Environmental Programme – Caribbean Environmental Programme (UNEP-CEP), 2002. Convention for the Protection and Development of the Marine Environment of the Wider Caribbean Region. Kingston, Jamaica. Wells D.E., W.P. Cafino, P. Quevauviller and B. Griepink, 1997. Quality Assurance of Information in Marine Monitoring: A Holistic Approach. Marine Pollution Bulletin, 26, 368-375.


Ridge to Reef Watershed Project