WASDA Annual Conference - c.ymcdn.comc.ymcdn.com/.../resource/resmgr/annual_2017/Moneyball.pdf ·...
16
Moneyball: Building Your Championship Team In An Act 10 Free-Market Employment System WASDA Annual Conference May 12, 2017
Transcript of WASDA Annual Conference - c.ymcdn.comc.ymcdn.com/.../resource/resmgr/annual_2017/Moneyball.pdf ·...

Moneyball:Building Your Championship Team In An Act 10 Free-Market Employment System
WASDA Annual ConferenceMay 12, 2017

Presenter
Mike English
CEO/President
Forecast5 Analytics, Inc.
Questions…contact:
Or…
Wes Karsten at [email protected]
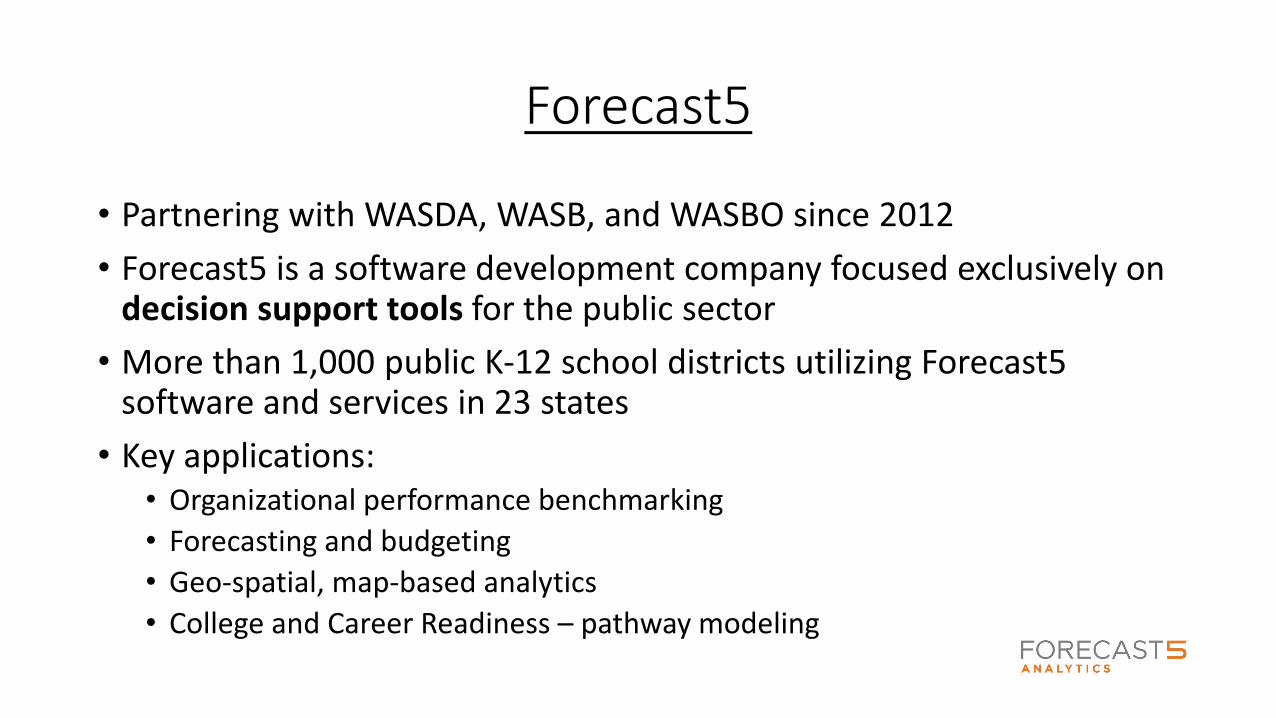
Forecast5
• Partnering with WASDA, WASB, and WASBO since 2012
• Forecast5 is a software development company focused exclusively on decision support tools for the public sector
• More than 1,000 public K-12 school districts utilizing Forecast5 software and services in 23 states
• Key applications:• Organizational performance benchmarking
• Forecasting and budgeting
• Geo-spatial, map-based analytics
• College and Career Readiness – pathway modeling

Today’s Presentation
Let’s…
• Look back
•Dig in
•Answer the big Act 10 questions
• Start a new leadership discussion

Looking Back to 2011
Start of the Moneyball era in Wisconsin
• National economic woes• Introduction of Act 10 • Expansion of Open Enrollment
The big questions in a free market system…

Wisconsin Total September Enrollment Counts
Measures CESA 2008 2009 2010 2011 2012 2013 2014 2015 2016 Green = High Enroll, Red = Low Enroll
September Enrollment Count CESA 01 268,672 266,542 265,712 266,117 263,730 263,141 263,373 261,317 258,673
CESA 02 146,385 147,357 148,195 149,127 152,091 154,149 154,633 155,179 155,005
CESA 03 20,167 19,997 19,794 19,773 19,518 19,425 19,554 19,591 19,531
CESA 04 35,904 35,978 36,045 36,081 36,072 35,995 36,145 36,300 36,323
CESA 05 55,793 55,251 55,075 54,930 54,463 54,186 53,751 53,430 53,069
CESA 06 101,009 101,121 100,776 101,037 101,116 100,845 101,908 101,663 101,645
CESA 07 85,849 87,265 87,325 86,932 86,900 87,152 87,504 87,533 87,750
CESA 08 22,767 22,285 21,966 21,429 21,241 21,127 20,922 20,455 20,421
CESA 09 35,365 35,025 34,677 34,694 34,453 34,670 34,885 34,435 34,088
CESA 10 36,998 36,709 36,781 36,417 36,317 36,372 36,362 36,380 36,380
CESA 11 48,174 48,498 48,861 49,157 48,979 48,869 49,008 48,933 48,979
CESA 12 16,607 16,283 16,055 15,856 15,590 15,620 15,486 15,436 15,273
Notes:Enrollment across the state has been stable since 2008…Notable: CESA 1 down 10K students, and CESA 2 up 10K students
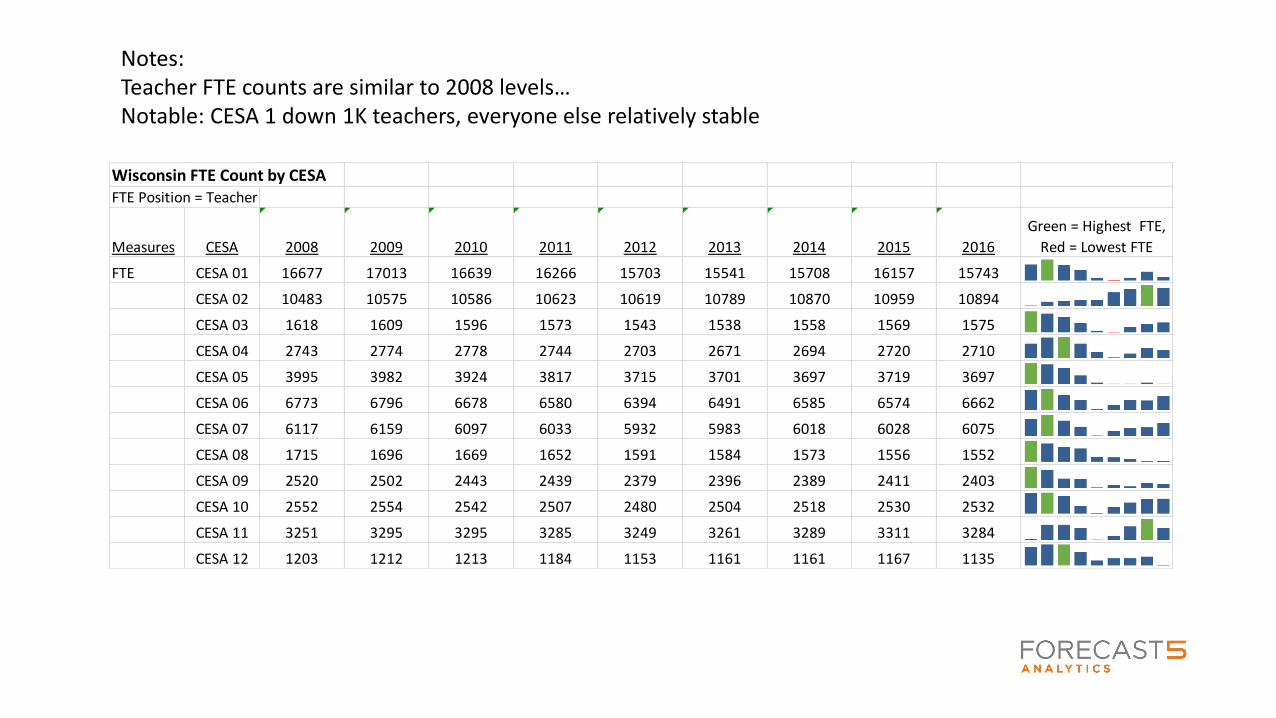
Wisconsin FTE Count by CESAFTE Position = Teacher
Measures CESA 2008 2009 2010 2011 2012 2013 2014 2015 2016
Green = Highest FTE,
Red = Lowest FTE
FTE CESA 01 16677 17013 16639 16266 15703 15541 15708 16157 15743
CESA 02 10483 10575 10586 10623 10619 10789 10870 10959 10894
CESA 03 1618 1609 1596 1573 1543 1538 1558 1569 1575
CESA 04 2743 2774 2778 2744 2703 2671 2694 2720 2710
CESA 05 3995 3982 3924 3817 3715 3701 3697 3719 3697
CESA 06 6773 6796 6678 6580 6394 6491 6585 6574 6662
CESA 07 6117 6159 6097 6033 5932 5983 6018 6028 6075
CESA 08 1715 1696 1669 1652 1591 1584 1573 1556 1552
CESA 09 2520 2502 2443 2439 2379 2396 2389 2411 2403
CESA 10 2552 2554 2542 2507 2480 2504 2518 2530 2532
CESA 11 3251 3295 3295 3285 3249 3261 3289 3311 3284
CESA 12 1203 1212 1213 1184 1153 1161 1161 1167 1135
Notes:Teacher FTE counts are similar to 2008 levels…Notable: CESA 1 down 1K teachers, everyone else relatively stable

Wisconsin Pupil to Certified FTE Ratio
Measures CESA 2008 2009 2010 2011 2012 2013 2014 2015 2016 Red = Highest Ratio, Blue = Lowest Ratio
Pupils Per Certified FTE CESA 01 13.35 12.8 12.95 13.35 13.81 13.83 13.67 13.14 13.48
CESA 02 11.39 11.36 11.39 11.44 11.72 11.69 11.61 11.49 11.56
CESA 03 10.51 10.49 10.46 10.6 10.66 10.59 10.52 10.37 10.23
CESA 04 10.88 10.82 10.8 10.97 11.13 11.19 11.16 11.1 11.13
CESA 05 11.69 11.64 11.74 11.99 12.23 12.18 12.07 11.81 11.78
CESA 06 12.43 12.45 12.57 12.79 13.13 12.92 12.87 12.75 12.61
CESA 07 11.59 11.72 11.85 11.93 12.14 12.06 12.04 11.95 11.85
CESA 08 11.06 10.91 10.89 10.69 11 10.94 10.84 10.67 10.67
CESA 09 11.47 11.55 11.76 11.83 12.05 12.09 12.16 11.81 11.72
CESA 10 12.07 12.01 12.11 12.19 12.27 12.17 12.06 11.93 11.91
CESA 11 12.39 12.32 12.42 12.51 12.64 12.59 12.49 12.37 12.48
CESA 12 11.28 10.96 10.83 10.94 11.03 11.05 10.89 10.8 10.96
Notes:With stable enrollment and stable FTE…Pupil to Certified FTE is stable
CESA 01 CESA 02 CESA 03 CESA 04 CESA 05 CESA 06 CESA 07 CESA 08 CESA 09 CESA 10 CESA 11 CESA 12
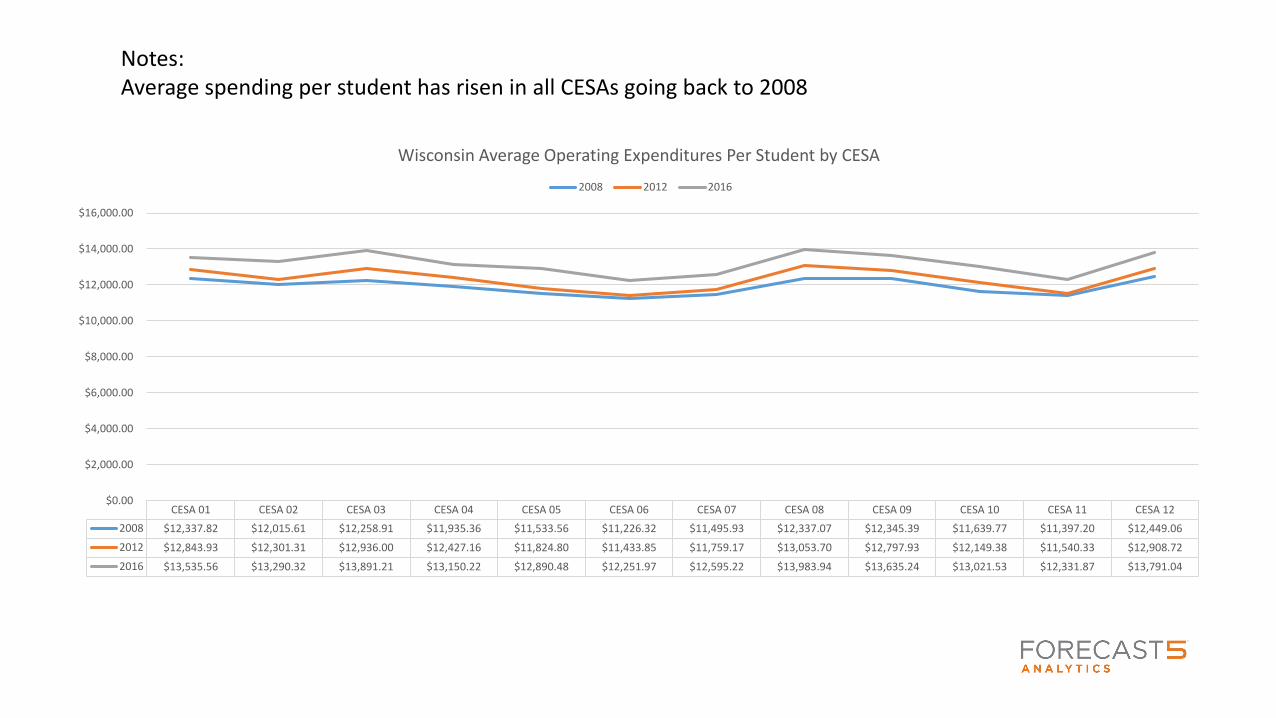
2008 $12,337.82 $12,015.61 $12,258.91 $11,935.36 $11,533.56 $11,226.32 $11,495.93 $12,337.07 $12,345.39 $11,639.77 $11,397.20 $12,449.06
2012 $12,843.93 $12,301.31 $12,936.00 $12,427.16 $11,824.80 $11,433.85 $11,759.17 $13,053.70 $12,797.93 $12,149.38 $11,540.33 $12,908.72
2016 $13,535.56 $13,290.32 $13,891.21 $13,150.22 $12,890.48 $12,251.97 $12,595.22 $13,983.94 $13,635.24 $13,021.53 $12,331.87 $13,791.04
$0.00
$2,000.00
$4,000.00
$6,000.00
$8,000.00
$10,000.00
$12,000.00
$14,000.00
$16,000.00
Wisconsin Average Operating Expenditures Per Student by CESA
2008 2012 2016
Notes:Average spending per student has risen in all CESAs going back to 2008

Wisconsin Change in Certified Salaries by CESA
Measures CESA 2008 2012Annualized Change from 2008 to 2012 2016
Annualized Change from 2012 to 2016
Average Certified Salary CESA 01 $55,926.51 $62,203.84 2.24% $60,103.65 -0.68%
CESA 02 $50,163.56 $53,979.62 1.52% $55,370.67 0.52%
CESA 03 $46,248.18 $50,021.30 1.63% $51,303.49 0.51%
CESA 04 $46,188.93 $49,688.90 1.52% $51,391.50 0.69%
CESA 05 $50,019.94 $53,227.11 1.28% $53,994.29 0.29%
CESA 06 $51,553.01 $56,353.10 1.86% $56,099.02 -0.09%
CESA 07 $50,770.55 $54,682.46 1.54% $55,434.00 0.27%
CESA 08 $45,702.62 $49,670.05 1.74% $50,613.17 0.38%
CESA 09 $51,654.48 $56,555.53 1.90% $56,389.92 -0.06%
CESA 10 $47,697.84 $49,726.80 0.85% $51,373.37 0.66%
CESA 11 $48,952.84 $52,770.52 1.56% $54,036.73 0.48%
CESA 12 $48,141.74 $50,039.14 0.79% $51,870.92 0.73%
Notes:Average certified salaries…on average, salaries are flat over the five years since Act 10

Sample peer group of large districts…total expenditures per student have remained locked in to a tight range since 2008.
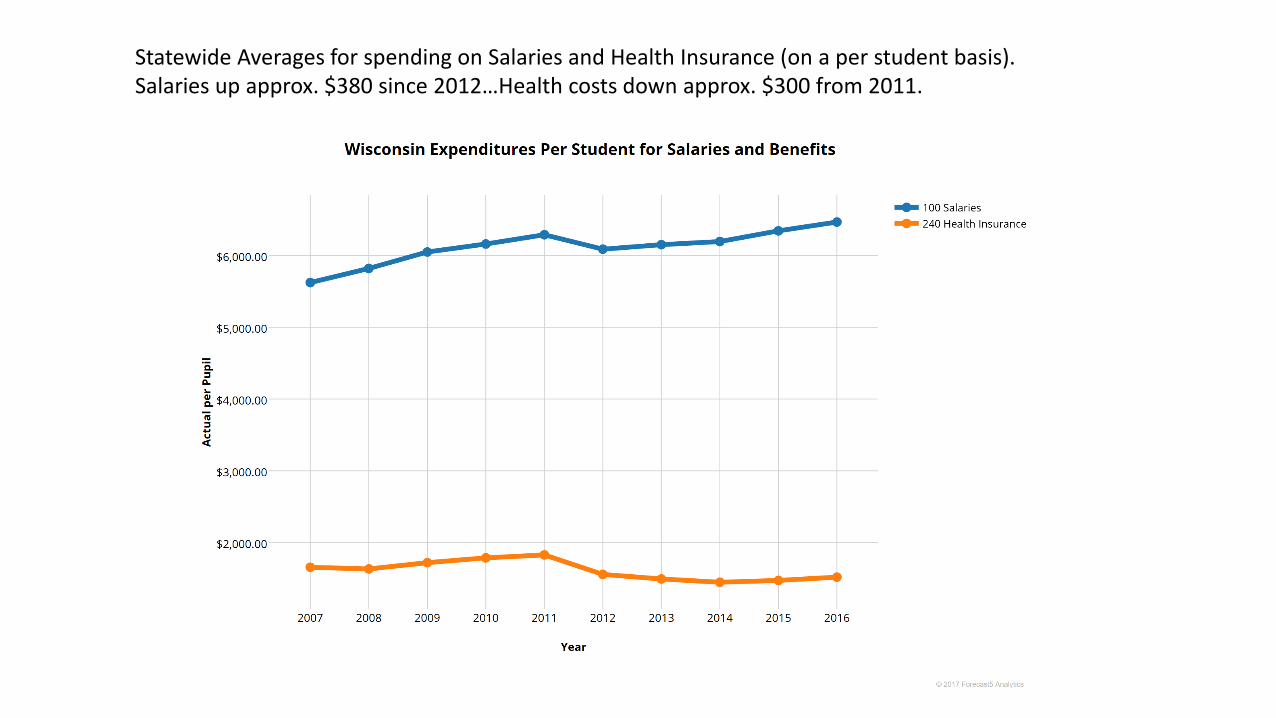
Statewide Averages for spending on Salaries and Health Insurance (on a per student basis). Salaries up approx. $380 since 2012…Health costs down approx. $300 from 2011.

Sample peer group of large districts spending on Health Insurance – many schools took advantage of the opportunity to re-work their health benefit plans in 2012.

Wisconsin Statewide Average Salary Change Per Position
Measures Position 2008 2012
Annualized Change
from 2008 to 2012 2016
Annualized Change
from 2008 to 2012
Dollar Change from
2012 to 2016
Average Salary per FTE Assistant Director of Special Education $78,685.52 $78,456.52 -0.06% $83,516.05 1.29% $5,059.53
Assistant District Administrator $105,296.58 $116,242.84 2.08% $128,632.90 2.13% $12,390.06
Assistant Principal $76,634.13 $81,734.21 1.33% $82,839.17 0.27% $1,104.96
Business Manager $90,142.31 $98,749.07 1.91% $101,810.36 0.62% $3,061.29
Career and Technical Education Coordinator $74,672.15
Central Office Administrator $92,415.26 $107,167.05 3.19% $109,500.99 0.44% $2,333.94
Department Head $55,483.76 $56,795.54 0.47% $63,652.31 2.41% $6,856.77
Director of Human Relations/Multicultural Education/Equity$105,508.69 $108,207.40 0.51% $109,433.24 0.23% $1,225.84
Director of Instruction/Program Supervisor $89,558.92 $92,092.29 0.57% $98,919.85 1.48% $6,827.56
Director of Special Education and/or Pupil Services $84,707.01 $90,501.61 1.37% $93,212.94 0.60% $2,711.33
District Administrator $109,203.99 $119,738.72 1.93% $128,305.89 1.43% $8,567.17
District Instructional Technology Coordinator $73,637.31 $86,356.08 3.45% $92,853.25 1.50% $6,497.17
Educational Interpreter $31,352.64 $35,499.19 2.65% $34,589.84 -0.51% ($909.35)
Guidance Counselor $53,329.08 $57,825.87 1.69% $56,640.42 -0.41% ($1,185.45)
Instructional Technology Integrator $59,003.54 $60,594.85 0.54% $61,328.94 0.24% $734.09
Librarian $56,234.80 $58,044.02 0.64% $55,018.30 -1.04% ($3,025.72)
Library Media Specialist $53,643.10 $57,093.91 1.29% $58,200.51 0.39% $1,106.60
Library Media Supervisor $63,477.25 $76,307.02 4.04% $82,118.19 1.52% $5,811.17
Principal $85,436.65 $90,693.91 1.23% $95,537.98 1.07% $4,844.07
Program Coordinator $58,840.33 $60,578.36 0.59% $63,318.09 0.90% $2,739.73
Reading Specialist $57,383.07 $61,308.44 1.37% $61,949.71 0.21% $641.27
School Audiologist $56,428.50 $59,627.04 1.13% $58,769.41 -0.29% ($857.63)
School Nurse $43,023.10 $44,928.72 0.89% $43,648.89 -0.57% ($1,279.83)
School Occupational Therapy $46,376.96 $50,083.21 1.60% $47,393.73 -1.07% ($2,689.48)
School Physical Therapy $51,123.17 $52,277.21 0.45% $49,507.54 -1.06% ($2,769.67)
School Psychologist $58,320.16 $62,334.69 1.38% $63,150.45 0.26% $815.76
School Social Worker $59,189.40 $64,050.33 1.64% $61,004.19 -0.95% ($3,046.14)
Speech/Language Pathologist $53,956.72 $60,047.36 2.26% $56,563.60 -1.16% ($3,483.76)
Subject Coordinator $64,999.59 $68,839.96 1.18% $70,007.55 0.34% $1,167.59
Teacher in Charge $54,313.56 $46,309.30 -2.95% $53,910.93 3.28% $7,601.63
Teacher $48,998.01 $53,299.48 1.76% $53,071.83 -0.09% ($227.65)

Wisconsin DPI data allows you to evaluate cost trends over time by Assignment – below is an example of spending per student on the Assignment of Technology Education across CESA 2.

Sample peer group of large districts evaluating expenditure on a Detail Function basis to determine the areas of out-sized investment or resource allocation.