WANTED: Property Tax Fairness in Saskatchewan · 2018-01-28 · WANTED: Property Tax Fairness in...
52
Research September 2012 www.cfib.ca WANTED: Property Tax Fairness in Saskatchewan A small business perspective on commercial- to- residential property tax inequities in Saskatchewan Brett Goldhawk, Public Policy and Entrepreneurship Intern, Prairie Commercial property owners in Saskatchewan continued to pay more than their fair share of property taxes in 2011. On average, commercial property owners paid more than two times the amount of property taxes paid by residents. While important steps have been taken by the province toward reforming education financing, the inequalities presented in this report show more work needs to be done by municipal governments. If Saskatchewan plans on maintaining its recent economic momentum, it is important that governments work toward a more fair and equitable balance between commercial and residential property taxes. Introduction Small business owners in Saskatchewan bore a greater property tax burden than their residential counterparts in 2011. On average, businesses in Saskatchewan municipalities with over 1,000 residents paid 2.18 times (down from 2.22 in 2010) the amount of property taxes paid by residents on an equally valued property. This difference in property taxes is referred to as the “property tax gap”. This inequality is present in every Saskatchewan municipality. Most troubling is there is no relationship between taxes paid and services received. This is the fifth in a series of CFIB reports on property taxes in Saskatchewan, which examines municipal and total property tax gaps for 63 municipalities across the province. Unfortunately for small business owners, findings indicate that there has been very little progress in narrowing property tax gaps in Saskatchewan from 2010 levels. In fact, the majority of the province’s municipalities (37) saw their municipal property tax gaps either worsen or stay the same from 2010 to 2011. For example, North Battleford saw its
Transcript of WANTED: Property Tax Fairness in Saskatchewan · 2018-01-28 · WANTED: Property Tax Fairness in...
Research September 2012
www.cfib.ca
WANTED: Property Tax Fairness in Saskatchewan A small business perspective on commercial- to- residential property tax inequities in Saskatchewan
Brett Goldhawk, Public Policy and Entrepreneurship Intern, Prairie
Commercial property owners in Saskatchewan continued to pay more than their fair share of property taxes in 2011. On average, commercial property owners paid more than two times the amount of property taxes paid by residents. While important steps have been taken by the province toward reforming education financing, the inequalities presented in this report show more work needs to be done by municipal governments. If Saskatchewan plans on maintaining its recent economic momentum, it is important that governments work toward a more fair and equitable balance between commercial and residential property taxes.
Introduction
Small business owners in Saskatchewan bore a greater property tax burden than their residential counterparts in 2011. On average, businesses in Saskatchewan municipalities with over 1,000 residents paid 2.18 times (down from 2.22 in 2010) the amount of property taxes paid by residents on an equally valued property. This difference in property taxes is referred to as the “property tax gap”. This inequality is present in every Saskatchewan municipality. Most troubling is there is no relationship between taxes paid and services received.
This is the fifth in a series of CFIB reports on property taxes in Saskatchewan, which examines municipal and total property tax gaps for 63 municipalities across the province. Unfortunately for small business owners, findings indicate that there has been very little progress in narrowing property tax gaps in Saskatchewan from 2010 levels. In fact, the majority of the province’s municipalities (37) saw their municipal property tax gaps either worsen or stay the same from 2010 to 2011. For example, North Battleford saw its
WANTED: Property Tax Fairness in Saskatchewan
2
municipal property tax gap rise from 2.99 to 3.32, which is unsustainable and hurts the local business environment. In addition, 51 of the province’s municipalities saw their total property tax gaps worsen from 2010 to 2011.
While the majority of municipalities did not progress toward a more fair tax structure, some have taken action and narrowed the tax gap. The greatest improvement from 2010 to 2011 was in Swift Current, where the municipal tax gap decreased from 4.04 to 2.60, but it is still worse than the average.
CFIB believes this report is crucial to enlightening municipalities and the province on the important issue of commercial-to-residential property tax inequities in Saskatchewan. This report will analyze the municipal and total property tax gaps across Saskatchewan municipalities and also provide recommendations for creating a more equitable property tax system.
Small Business in Saskatchewan
Small businesses are an invaluable part of the economy, and it is important that governments recognize their contribution. In Saskatchewan, 98.5 per cent of businesses are small1 (less than 100 employees) and contribute 35 per cent of Saskatchewan’s total GDP, the greatest percentage within any Canadian province2
With Saskatchewan small business owners currently among the most optimistic in Canada as found by CFIB’s Business Barometer, CFIB believes it is critical all levels of government (federal, provincial, and municipal) ensure their policies help fuel optimism, not dampen it.
.
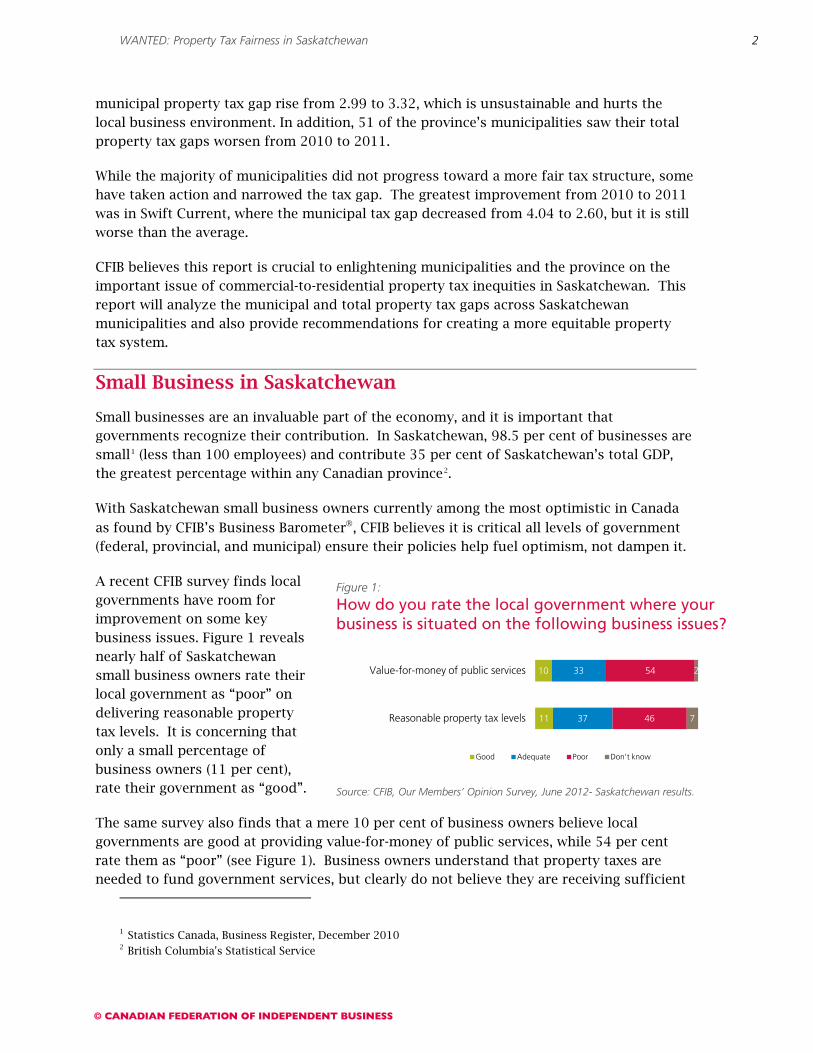
A recent CFIB survey finds local governments have room for improvement on some key business issues. Figure 1 reveals nearly half of Saskatchewan small business owners rate their local government as “poor” on delivering reasonable property tax levels. It is concerning that only a small percentage of business owners (11 per cent), rate their government as “good”.
The same survey also finds that a mere 10 per cent of business owners believe local governments are good at providing value-for-money of public services, while 54 per cent rate them as “poor” (see Figure 1). Business owners understand that property taxes are needed to fund government services, but clearly do not believe they are receiving sufficient
1 Statistics Canada, Business Register, December 2010 2 British Columbia's Statistical Service
Figure 1:
How do you rate the local government where your business is situated on the following business issues?
Source: CFIB, Our Members’ Opinion Survey, June 2012- Saskatchewan results.
10
11
33
37
54
46
2
7
Value-for-money of public services
Reasonable property tax levels
Good Adequate Poor Don't know
WANTED: Property Tax Fairness in Saskatchewan
3
value for their tax dollars. Business owners work hard to deliver value to their customers, local governments must do the same.
When one considers the importance of small business to the Saskatchewan and local economies, we cannot afford to continually over-burden entrepreneurs with property taxes because it hinders growth. Policy makers need to recognize the consequences of shifting property taxes from residents to businesses, and work towards more fair and equitable taxation.
Understanding Property Taxation in Saskatchewan
Property taxation is one of the oldest forms of taxation in Canada. Before the advent of income and sales taxes, municipal and provincial governments relied almost exclusively on the revenues provided by property-based taxation to fund things like municipal services and education systems. While income taxes, payroll taxes and sales taxes all rise and fall with fluctuations in income and consumption, property taxes do not hold such a distinction.
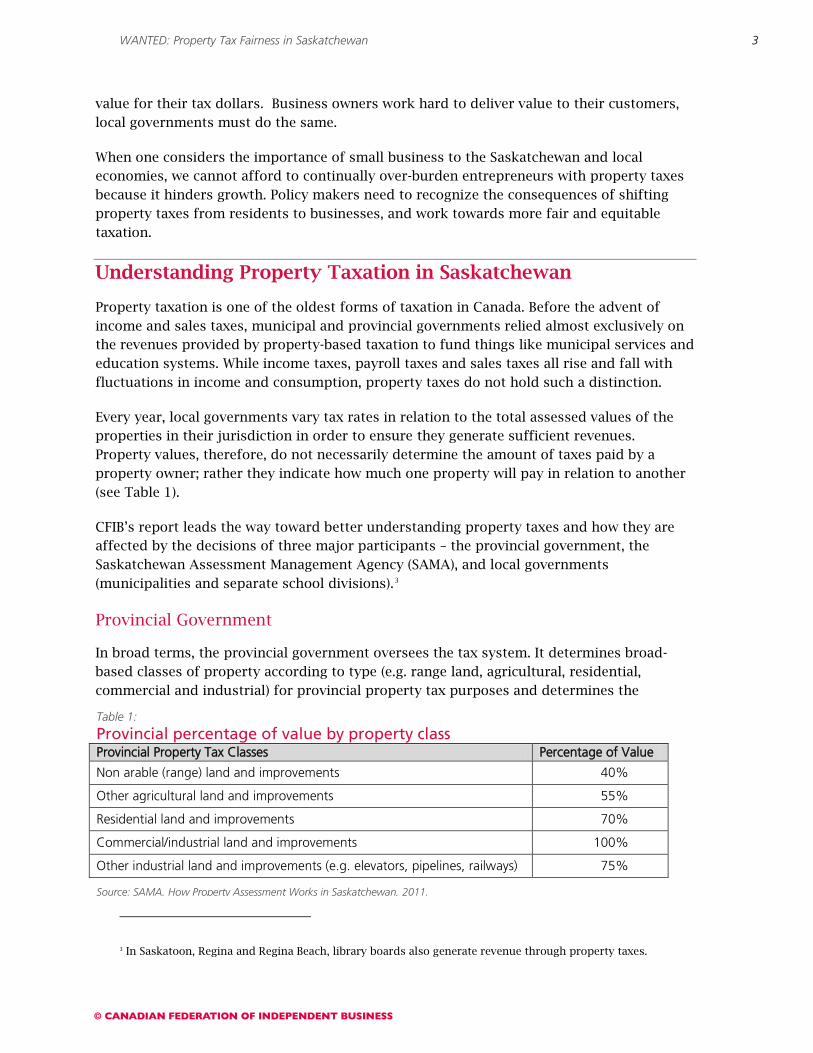
Every year, local governments vary tax rates in relation to the total assessed values of the properties in their jurisdiction in order to ensure they generate sufficient revenues. Property values, therefore, do not necessarily determine the amount of taxes paid by a property owner; rather they indicate how much one property will pay in relation to another (see Table 1).
CFIB’s report leads the way toward better understanding property taxes and how they are affected by the decisions of three major participants – the provincial government, the Saskatchewan Assessment Management Agency (SAMA), and local governments (municipalities and separate school divisions).3
Provincial Government
In broad terms, the provincial government oversees the tax system. It determines broad-based classes of property according to type (e.g. range land, agricultural, residential, commercial and industrial) for provincial property tax purposes and determines the
3 In Saskatoon, Regina and Regina Beach, library boards also generate revenue through property taxes.
Table 1:
Provincial percentage of value by property class Provincial Property Tax Classes Percentage of Value
Non arable (range) land and improvements 40%
Other agricultural land and improvements 55%
Residential land and improvements 70%
Commercial/industrial land and improvements 100%
Other industrial land and improvements (e.g. elevators, pipelines, railways) 75%
Source: SAMA, How Property Assessment Works in Saskatchewan, 2011.

WANTED: Property Tax Fairness in Saskatchewan
4
percentages of value to apply to those property taxes. The percentages of value are applied to the assessed value of properties, resulting in the taxable assessments for each property class. Table 1 shows the percentage of value applied to each property class.
Any property owner knows that in addition to municipal taxes, they are also responsible for paying education property taxes. In 2009 the provincial government assumed more control over Saskatchewan’s education property tax system. As of April 1, 2009, it became the Province’s responsibility to set education property tax mill rates, which were previously set by local school boards. The provincially-set mill rates apply to all public school divisions and may also be used by separate school divisions. However, separate school divisions have the constitutional authority to levy property taxes to fund their educational system. It is important to note that, under the new system, commercial property has a higher mill rate than residential property. Thus, in all instances, commercial property owners pay more education property tax than residential property owners.
Furthermore, the provincial government provides authority for local governments to use “tax tools” at their discretion to set local property tax policy. These tax tools will be discussed later in the report.
Saskatchewan Assessment Management Agency (SAMA)
The Saskatchewan Assessment Management Agency (SAMA) establishes the rules and principles used to determine assessment values and carries out assessment valuations for some municipalities4
There are three generally accepted techniques used to value property in a market value assessment system:
.
1. The sales comparison approach: The value of a property is determined by recent sale prices of similar properties. Although this approach has the advantage of being more transparent and unbiased, it is only useful if properties are frequently bought and sold on the market.
2. The cost approach: Typically used for new construction projects, the cost approach values property by adding the price of the land with the cost of improvements and subtracting for depreciation.
3. The property income approach: Introduced in 20095, the property income approach relies on property lease or rental information to determine value of properties. This approach provides the assessment appraiser with an additional property valuation tool. Where applicable and practical, this approach to value is expected to increase the accuracy of commercial property assessment.6
4 Saskatoon, Regina, Prince Albert, Swift Current, and 14 other urban municipalities across Saskatchewan have opted out of SAMA’s assessment valuations. (Source: SAMA, 2010 Annual Report, 15.)
5 SAMA, Revaluation 2009: Overview. 6 SAMA, The Income Approach to Value.
WANTED: Property Tax Fairness in Saskatchewan
5
Municipal Mill Rate = Total Property Tax Revenue Required Total Taxable Assessment
SAMA co-ordinates a full revaluation of properties in the province every four years to coincide with a new base date. The last revaluation of 2009 used June 30, 2006 as the base date and the upcoming revaluation in 2013 will update assessed values to reflect a new base date of January 1, 2011. Based on the strength of the real estate market between the 2006 and 2011 base dates, SAMA anticipates that assessment shifts will be higher than any revaluation since 19977
Local Governments
.
Municipalities use assessed values, along with the property classes and percentages of value set by the province, to establish mill rates based on their budget requirements. Municipal governments calculate their municipal mill rate as follows:
Source: Government of Saskatchewan, Ministry of Government Relations “A Guide to Municipal Property Tax Tools”
Municipal Mill Rate and Mill Rate Factors
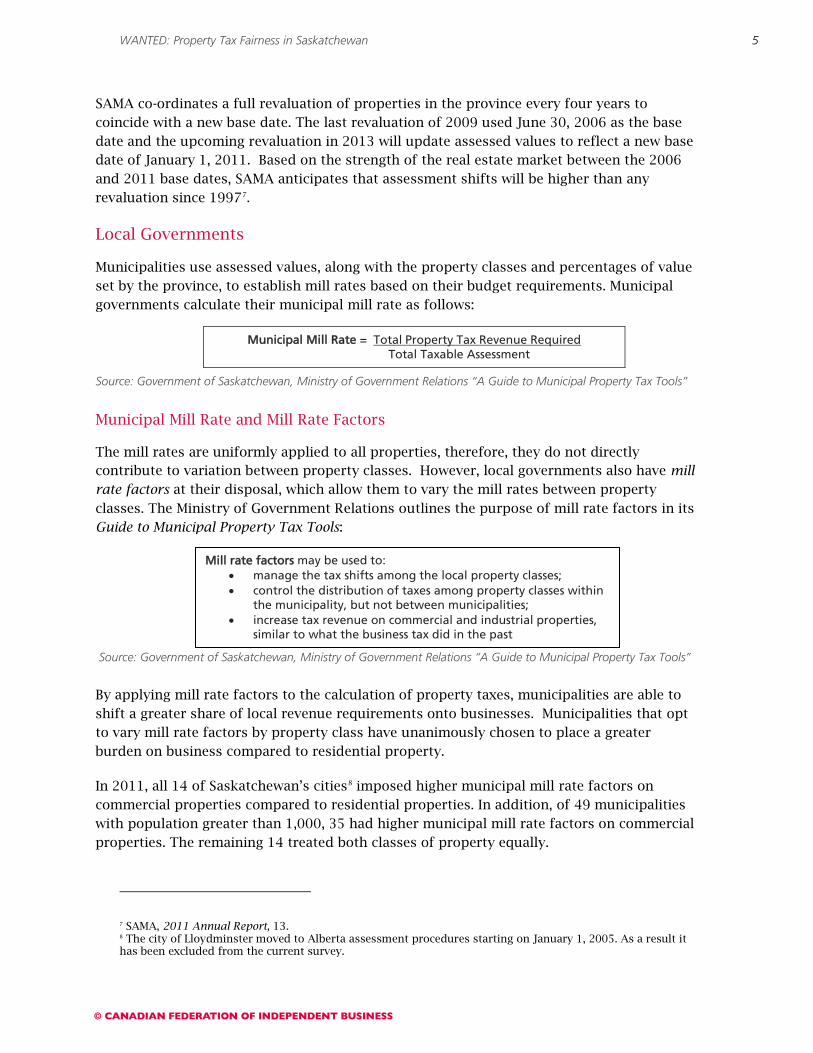
The mill rates are uniformly applied to all properties, therefore, they do not directly contribute to variation between property classes. However, local governments also have mill rate factors at their disposal, which allow them to vary the mill rates between property classes. The Ministry of Government Relations outlines the purpose of mill rate factors in its Guide to Municipal Property Tax Tools:
Source: Government of Saskatchewan, Ministry of Government Relations “A Guide to Municipal Property Tax Tools”
By applying mill rate factors to the calculation of property taxes, municipalities are able to shift a greater share of local revenue requirements onto businesses. Municipalities that opt to vary mill rate factors by property class have unanimously chosen to place a greater burden on business compared to residential property.
In 2011, all 14 of Saskatchewan’s cities8
7 SAMA, 2011 Annual Report, 13.
imposed higher municipal mill rate factors on commercial properties compared to residential properties. In addition, of 49 municipalities with population greater than 1,000, 35 had higher municipal mill rate factors on commercial properties. The remaining 14 treated both classes of property equally.
8 The city of Lloydminster moved to Alberta assessment procedures starting on January 1, 2005. As a result it has been excluded from the current survey.
Mill rate factors may be used to: • manage the tax shifts among the local property classes; • control the distribution of taxes among property classes within
the municipality, but not between municipalities; • increase tax revenue on commercial and industrial properties,
similar to what the business tax did in the past

WANTED: Property Tax Fairness in Saskatchewan
6
Additional Tax Tools
There are several other tax tools that the provincial government has given municipalities the authority to enforce:
Base tax – A set amount of property tax is levied, regardless of the assessed value of the property. Base taxes can be varied for each property class. CFIB’s property tax report includes base taxes in the calculation of property tax bills and gaps. In 2011, 45 of the 63 municipalities studied applied a base tax to residential and/or commercial property.
Minimum tax – If the calculated municipal property tax is less than the minimum tax set by the municipality, the minimum tax is applied instead.
Property tax phase- in provisions9
Local property subclasses – Most municipalities can only apply tax tools to three property classes: agricultural, residential and commercial. However, cities can break these local property tax classes further if so desired. For example, Moose Jaw has a golf course property subclass.
– Allows a municipality (cities only) to phase-in a tax increase or decrease for taxable property over a set period.
9 In 2004, the provincial government removed the authority of towns, villages, resort villages, rural municipalities and Northern municipalities to phase in property taxes.
WANTED: Property Tax Fairness in Saskatchewan
7
Municipal Property Taxes across the Province
Calculating the Municipal Property Tax Gap
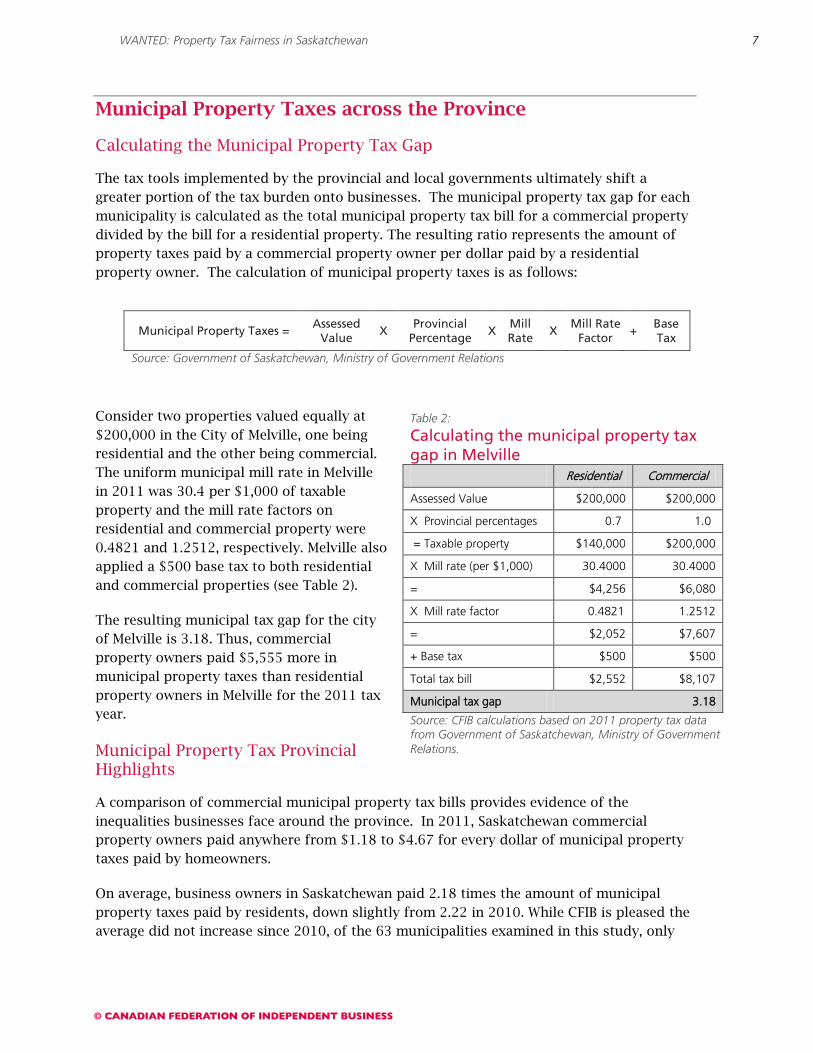
The tax tools implemented by the provincial and local governments ultimately shift a greater portion of the tax burden onto businesses. The municipal property tax gap for each municipality is calculated as the total municipal property tax bill for a commercial property divided by the bill for a residential property. The resulting ratio represents the amount of property taxes paid by a commercial property owner per dollar paid by a residential property owner. The calculation of municipal property taxes is as follows:
Source: Government of Saskatchewan, Ministry of Government Relations
Consider two properties valued equally at $200,000 in the City of Melville, one being residential and the other being commercial. The uniform municipal mill rate in Melville in 2011 was 30.4 per $1,000 of taxable property and the mill rate factors on residential and commercial property were 0.4821 and 1.2512, respectively. Melville also applied a $500 base tax to both residential and commercial properties (see Table 2).
The resulting municipal tax gap for the city of Melville is 3.18. Thus, commercial property owners paid $5,555 more in municipal property taxes than residential property owners in Melville for the 2011 tax year.
Municipal Property Tax Provincial Highlights
A comparison of commercial municipal property tax bills provides evidence of the inequalities businesses face around the province. In 2011, Saskatchewan commercial property owners paid anywhere from $1.18 to $4.67 for every dollar of municipal property taxes paid by homeowners.
On average, business owners in Saskatchewan paid 2.18 times the amount of municipal property taxes paid by residents, down slightly from 2.22 in 2010. While CFIB is pleased the average did not increase since 2010, of the 63 municipalities examined in this study, only
Municipal Property Taxes = Assessed
Value X
Provincial Percentage
X Mill Rate
X Mill Rate
Factor +
Base Tax
Table 2:
Calculating the municipal property tax gap in Melville Residential Commercial
Assessed Value $200,000 $200,000
X Provincial percentages 0.7 1.0
= Taxable property $140,000 $200,000
X Mill rate (per $1,000) 30.4000 30.4000
= $4,256 $6,080
X Mill rate factor 0.4821 1.2512
= $2,052 $7,607
+ Base tax $500 $500
Total tax bill $2,552 $8,107
Municipal tax gap 3.18
Source: CFIB calculations based on 2011 property tax data from Government of Saskatchewan, Ministry of Government Relations.
WANTED: Property Tax Fairness in Saskatchewan
8
26 improved their municipal tax gap. For an overall province-wide ranking of the municipalities, refer to Appendix A.
White City has lowest municipal property tax gap, Kamsack the highest
Across municipalities in this study, White City had the lowest municipal property tax gap at 1.18, an improvement from second place in 2010, followed closely by Dalmeny at 1.20 and Watrous at 1.30 (see Appendix A). On the other hand, the municipal property tax gap in Kamsack was the highest in the province at 4.67 for the second year in a row. Rounding out the bottom of the list are Yorkton and Weyburn with municipal property tax gaps of 3.79 and 3.47 respectively.
Swift Current boasts most improved municipal property tax gap, North Battleford sees largest increase
The city of Swift Current made the most progress in lowering its gap from 4.04 in 2010 to 2.60 in 2011, reducing it by 1.44 (see Appendix C). However, it is important to note that it is still worse than the average. Also making significant improvements to their municipal property tax gaps were Outlook and Eston, who improved by 0.62 and 0.40 respectively. Unfortunately for Saskatchewan business owners in North Battleford, the municipal property tax gap increased from 2.99 in 2010 to 3.32 in 2011 – or 0.33 – the largest jump in the province. Also worth noting are Yorkton and Gull Lake, which both increased their gaps by 0.22 and 0.21, respectively.
Kelvington has lowest municipal property tax bill, Eston the highest
Across Saskatchewan, municipal property taxes on a commercial property with an assessed value of $200,000 ranged from as low as $2,350 in Kelvington to $13,125 in Eston, and the provincial average was $5,212, up from the 2010 average of $4,940 (see Appendix B). In comparison, municipal residential property tax bills across the province ranged from $1,333 to $5,600 and the provincial average was $2,461. Lumsden, Regina Beach and White City also all had commercial property taxes below $2,500. However, commercial property owners in Kamsack and Foam Lake were footing large municipal property tax bills at $12,630 and $11,440 respectively.
The following section compares the municipal property tax gaps of Saskatchewan’s cities and towns with population over 1,000 by economic region10
Cities
.
11
In all Saskatchewan cities commercial property owners subsidized residential property owners by paying between 1.57 and 3.79 times the amount of municipal taxes on properties of the same value. On average, commercial property owners paid $2.56 in municipal
10 Based on 2006 Statistics Canada Census 11 The city of Lloydminster moved to Alberta assessment procedures starting on January 1, 2005. As a result it has been excluded from the current survey.
WANTED: Property Tax Fairness in Saskatchewan
9
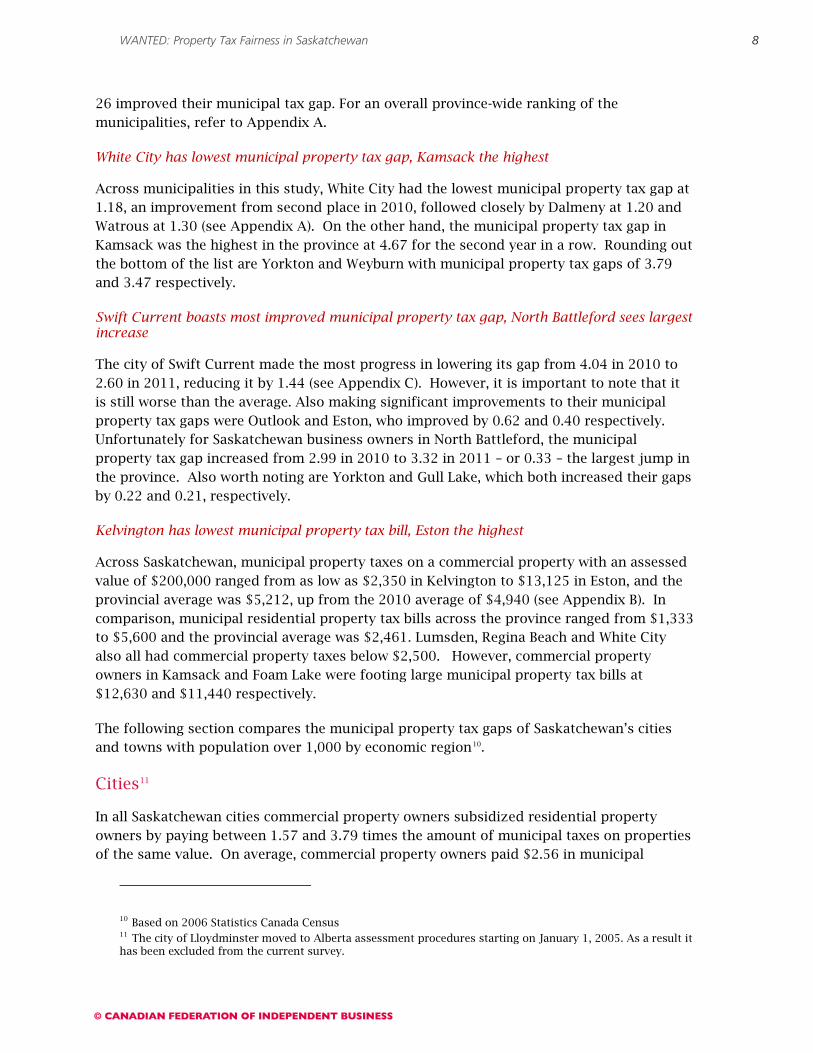
Table 3:
Cities: Municipal property tax gap ratios and municipal taxes per $200,000 of assessed value
Mun
icip
ality
Tota
l mun
icip
al c
omm
erci
al t
axes
pe
r $2
00,0
00
Tota
l mun
icip
al r
esid
entia
l tax
es
per
$200
,000
2011
Mun
icip
al T
ax G
ap
2010
Mun
icip
al t
ax G
ap
2010
to
2011
Yorkton $5,950 $1,568 3.79 3.57
Weyburn $5,482 $1,581 3.47 3.47 = North Battleford $6,596 $1,984 3.32 2.99
Melville $8,107 $2,552 3.18 3.37 Humboldt $6,084 $2,064 2.95 3.22
Swift Current $3,471 $1,334 2.60 4.04 Prince Albert $6,162 $2,394 2.57 2.37
Estevan $3,416 $1,523 2.24 2.27 Meadow Lake $5,365 $2,396 2.24 2.30
Melfort $5,946 $2,801 2.12 2.18 Moose Jaw $3,836 $1,840 2.08 2.11
Regina $3,575 $1,833 1.95 1.95 = Saskatoon $2,715 $1,526 1.78 1.75
Martensville $2,642 $1,681 1.57 1.59
Average $4,953 $1,934 2.56 2.66 gap worsened gap improved = gap same
Source: CFIB calculations based on 2011 property tax data from Government of Saskatchewan, Ministry of Government Relations.
property taxes for every dollar paid by residential property owners in 2011 (see Table 3). Fortunately, progress has been made, as the gap fell from the 2010 value of 2.66.
A majority of Saskatchewan cities (8) improved their municipal property tax gaps in 2011, with only 6 of the 14 cities seeing their gap worsen or remain the same. The biggest increase was in North Battleford, where the gap grew from 2.99 in 2010 to 3.32 in 2011. This is the result of the city decreasing its residential base tax from $765 to $559 while
commercial properties saw no tax savings. Yorkton, which boasted the greatest municipal property tax gap improvement from 2009 to 2010, erased most of those gains in 2011, as its gap grew to 3.79 from 3.57 in 2010.
Making up for last year’s distinction of having the highest municipal property tax gap amongst Saskatchewan cities, Swift Current can now claim the greatest improvement in its gap from 2010 to 2011. While Swift Current was able to reduce its 2011 municipal property tax gap to 2.60 from 4.04 in 2010, its municipal property tax gap still remains above the provincial average of 2.18 (see Appendix H-1).
Yorkton has distinction of highest municipal property tax gap
Of Saskatchewan’s 14 cities, Yorkton had the most unbalanced municipal property tax system with commercial property owners paying $3.79 for every dollar paid by residential property owners. Yorkton’s sizeable gap can be attributed to it having the lowest residential mill rate factor of 0.22, providing residents with a sizeable tax break
that leaves businesses footing the bill. Weyburn’s high municipal property tax gap of 3.47 is also worth noting and can be attributed to it having a relatively high commercial mill rate factor of 1.47. North Battleford and Melville had the next-highest municipal property tax gaps of 3.32 and 3.18, respectively. Municipalities like Humboldt (2.95), and Prince Albert (2.57) also had businesses paying more than two and a half times the amount paid by residents (see Table 3).
Melville has highest municipal property tax bill - 2nd year in a row
For the second year in a row, Melville had the highest commercial municipal property tax bill amongst Saskatchewan cities, costing business owners $8,107 per $200,000 of assessed

WANTED: Property Tax Fairness in Saskatchewan
10
Figure 2:
Cities: Commercial vs. residential municipal property taxes per $200,000 of assessed value
Source: CFIB calculations based on 2011 property tax data from Government of Saskatchewan, Ministry of Government Relations.
$5,950
$8,107
$2,642
$1,568
$2,552
$1,681
$0
$1,000
$2,000
$3,000
$4,000
$5,000
$6,000
$7,000
$8,000
$9,000
Yorkton Melville Martensville
Total municipal commercial taxes per $200,000
Total municipal residential taxes per $200,000
Tax Gap = 3.79
Tax Gap = 3.47
Tax Gap = 1.57
property value. This is because Melville utilized the highest municipal mill rate of all cities, 30.4, while employing a sizeable commercial mill rate factor of 1.2512. Other Saskatchewan cities with high commercial municipal property tax bills included North Battleford, Prince Albert, Humboldt, Yorkton, Melfort, Weyburn and Meadow Lake, all of which had commercial property owners paying greater than the average municipal property bill of $4,953 (see Table 3).
Martensville boasts lowest municipal property tax gap- 2nd year in a row
Martensville can pride itself on having the lowest municipal tax gap of all Saskatchewan cities for the second year in a row at 1.57, a drop from 1.59 in 2010. Saskatoon had a municipal property tax gap of 1.78, continuing to be among the fairest cities. It is important to note that in the year 2000 Saskatoon took decisive action towards reducing the commercial-to-residential tax gap, which included implementing a 10-year plan that reduced their tax gap to 1.75 in 2010. However, now that the 10-year plan has expired, Saskatoon’s gap has increased slightly – proving that there is still work to be done in creating a long term solution to property tax inequality. The province’s other major centre, Regina, had the third lowest municipal tax gap of Saskatchewan cities at 1.95. Moose Jaw and Melfort trailed close behind with the next lowest municipal tax gaps of 2.08 and 2.12, respectively.
Martensville has lowest municipal property tax bill – 2nd year in a row
In addition to having the lowest municipal property tax gap across Saskatchewan cities, Martensville also had 2011’s lowest commercial property tax bill at $2,642. This is due to the municipality using the lowest municipal mill rate in the region (6.65) and also using relatively equitable residential and commercial mill rate factors of 1.0 and 1.42 respectively. Saskatoon had the second lowest commercial property tax bill at $2,715 in 2011.
As can be seen in Figure 2, Saskatchewan cities display a wide variation of municipal property tax gaps and bills. Martensville out-performed other Saskatchewan cities by having the lowest municipal tax bill in the region and boasting a modest municipal tax gap of 1.57. Saskatoon followed closely behind with a property tax gap of 1.78 and a commercial municipal tax bill of $2,715.
WANTED: Property Tax Fairness in Saskatchewan
11
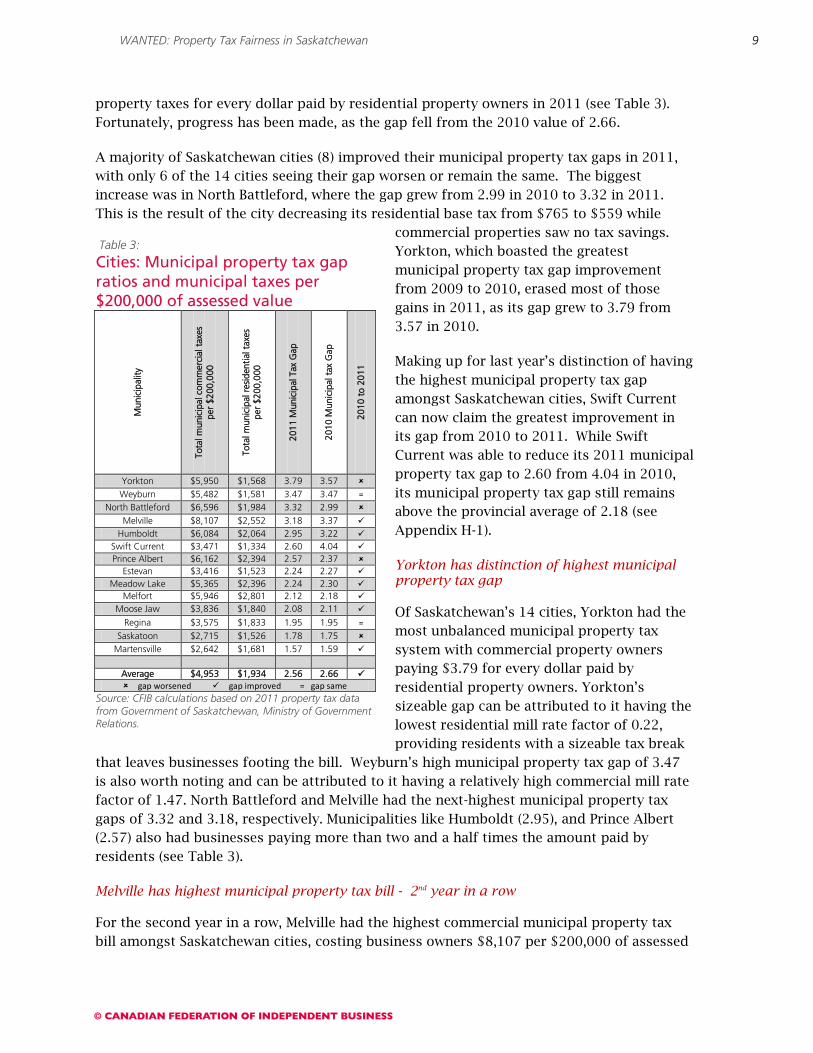
Table 4:
South West: Municipal property tax gap ratios and municipal taxes per $200,000 of assessed value
Mun
icip
ality
Tota
l mun
icip
al c
omm
erci
al t
axes
pe
r $2
00,0
00
Tota
l mun
icip
al r
esid
entia
l tax
es
per
$200
,000
2011
Mun
icip
al T
ax G
ap
2010
Mun
icip
al t
ax G
ap
2010
to
2011
Maple Creek $6,600 $2,320 2.84 2.83
Shaunavon $6,420 $2,301 2.79 3.06
Gull Lake $6,280 $2,351 2.67 2.46
Assiniboia $6,262 $3,566 1.76 1.83
Gravelbourg $4,450 $3,370 1.32 1.31
Average $6,002 $2,782 2.28 2.30
gap worsened gap improved = gap same
Source: CFIB calculations based on 2011 property tax data from Government of Saskatchewan, Ministry of Government Relations.
Figure 3:
South West: Commercial vs. residential municipal property taxes per $200,000 of assessed value
Source: CFIB calculations based on 2011 property tax data from Government of Saskatchewan, Ministry of Government Relations.
$6,600 $6,420
$4,450
$2,320 $2,301
$3,370
$0
$1,000
$2,000
$3,000
$4,000
$5,000
$6,000
$7,000
Maple Creek Shaunavon Gravelbourg
Total municipal commercial taxes per $200,000
Total municipal residential taxes per $200,000
Tax Gap = 2.84 Tax Gap = 2.79
Tax Gap = 1.32
South West
Although this region’s average municipal tax gap of 2.28 was generally in line with the provincial average of 2.18 (see Appendix A), municipal taxation varied across the five towns in this region. This is evident from municipal property tax gaps ranging from a high of 2.84 in Maple Creek to a comparatively low ratio of 1.32 in Gravelbourg, which was tied for the fifth lowest of the 63 municipalities examined in this report (see Table 4 and Figure 3).
There were only two municipalities (Shaunavon and Assiniboia) that improved their municipal tax gaps in the South West from 2010 to 2011. Three of the five municipalities increased their tax gap; with Gull Lake’s tax gap increasing the most by 0.21 (see Appendix H-2).
Maple Creek has highest municipal property tax gap and property tax bill
In 2011 Maple Creek emerged with the highest municipal property tax gap in the region at 2.84, and continued to have the highest commercial property tax bill for the second year in a row at $6,600, up from $6,090 in 2010. This large municipal property tax bill was the result of a fairly high mill rate of 25.0 coupled with a commercial mill rate factor of 1.15. Shaunavon had both the second highest tax gap at 2.79 and municipal property tax bill at $6,420. While Shaunavon’s tax gap experienced the greatest decline in the region from 2010 to 2011, its commercial property tax bill increased by $640 – the largest increase in the South West.
Gravelbourg has lowest municipal property tax gap and property tax bill - 2nd year in a row
A positive highlight was Gravelbourg, which displayed both the lowest municipal tax gap (1.32) and tax bill ($4,450) in the South West region. Correspondingly, the town utilized the

WANTED: Property Tax Fairness in Saskatchewan
12
Table 5:
South East: Municipal property tax gap ratios and municipal taxes per $200,000 of assessed value
Mun
icip
ality
Tota
l mun
icip
al c
omm
erci
al
taxe
s pe
r $2
00,0
00
Tota
l mun
icip
al r
esid
entia
l ta
xes
per
$200
,000
2011
Mun
icip
al T
ax G
ap
2010
Mun
icip
al t
ax G
ap
2010
to
2011
Moosomin $6,520 $2,499 2.61 2.61 = Pilot Butte $3,850 $1,540 2.50 2.60
Carlyle $4,290 $1,794 2.39 2.30 Oxbow $4,980 $2,385 2.09 2.06
Davidson $6,729 $3,232 2.08 2.09 Carnduff $4,796 $2,514 1.91 1.93 Kipling $3,200 $2,080 1.54 1.52
Fort Qu'Appelle $4,200 $2,772 1.52 1.50 Balgonie $2,822 $1,974 1.43 1.44
Indian Head $3,700 $2,590 1.43 1.43 = Lumsden $2,369 $1,658 1.43 1.43 =
Regina Beach $2,373 $1,796 1.32 1.31 Grenfell $3,600 $2,730 1.32 1.32 =
White City $2,480 $2,108 1.18 1.25
Average $3,994 $2,262 1.77 1.77 = gap worsened gap improved = gap same
Source: CFIB calculations based on 2011 property tax data from Government of Saskatchewan, Ministry of Government Relations.
lowest mill rate in the region and also did not apply mill rate factors. The limited use of municipal tax tools was responsible for keeping the tax gap low. Gravelbourg was also the only municipality in the region whose commercial municipal property tax bill was below the provincial average of $5,210 (see Table 4).
South East
Saskatchewan’s South East corner has fourteen urban municipalities with more than one thousand people. In 2011, the average municipal tax gap for the region was 1.77; the lowest among all the regions and well below the provincial average of 2.18 (see Appendix A). However, commercial property owners still paid more than their fair share in municipal taxes. Figure 4 displays the variation in municipal property tax gaps and bills that exists in the South East region. In addition to this, almost no progress was made in lowering municipal tax gaps between 2010 and 2011 – the tax gap for 9 of the 14 stayed the same or worsened (see Table 5).
Moosomin has highest municipal property tax gap – 2nd year in a row
In 2011 Moosomin had the largest municipal tax gap in the region at 2.61. The large gap can be attributed to Moosomin having the highest commercial mill rate factor in the region at 1.55. Pilot Butte and Carlyle were close behind with municipal tax gaps of 2.50 and 2.39 respectively.
Davidson has highest municipal property tax bill
Davidson had the region’s highest commercial tax bill at $6,729 which is nearly three times Lumsden’s commercial property tax bill of $2,369. Close behind Davidson was Moosomin, where commercial property owners paid $6,520 in municipal property taxes per $200,000 assessed value – well above the regional average of $3,994.
White City has lowest municipal property tax gap in South East and the entire province
Eleven of the fourteen municipalities had municipal tax gaps below the provincial average, ranging from 1.18 to 2.09. White City not only had the lowest municipal property tax gap in the region, but in the entire province at 1.18 (see Appendix A). White City achieves a small gap by not using mill rate factors to overburden businesses. Grenfell, Indian Head, Kipling
WANTED: Property Tax Fairness in Saskatchewan
13
Figure 4:
South East: Commercial vs. residential municipal property taxes per $200,000 of assessed value
Source: CFIB calculations based on 2011 property tax data from Government of Saskatchewan, Ministry of Government Relations.
$6,520
$3,850
$2,480$2,499
$1,540
$2,108
$0
$1,000
$2,000
$3,000
$4,000
$5,000
$6,000
$7,000
Moosomin Pilot Butte White City
Total municipal commercial taxes per $200,000
Total municipal residential taxes per $200,000
Tax Gap = 2.61
Tax Gap = 2.50
Tax Gap = 1.18
and Lumsden also chose not to apply mill rate factors and all had property tax gaps less than 1.60.
Lumsden has lowest municipal property tax bill
Another measure on which the South East region performed exceptionally well was the value of their municipal commercial property tax bill. Twelve of the fourteen urban municipalities were below the provincial average of $5,210. These low bills are due to a below average mill rate of 14.21 compared to the provincial average of 17.45, and also a relatively small average commercial mill rate factor of 1.24. Lumsden just edged out Regina Beach for the region’s lowest municipal commercial tax bill, with bills valued at $2,369 and $2,373 respectively.
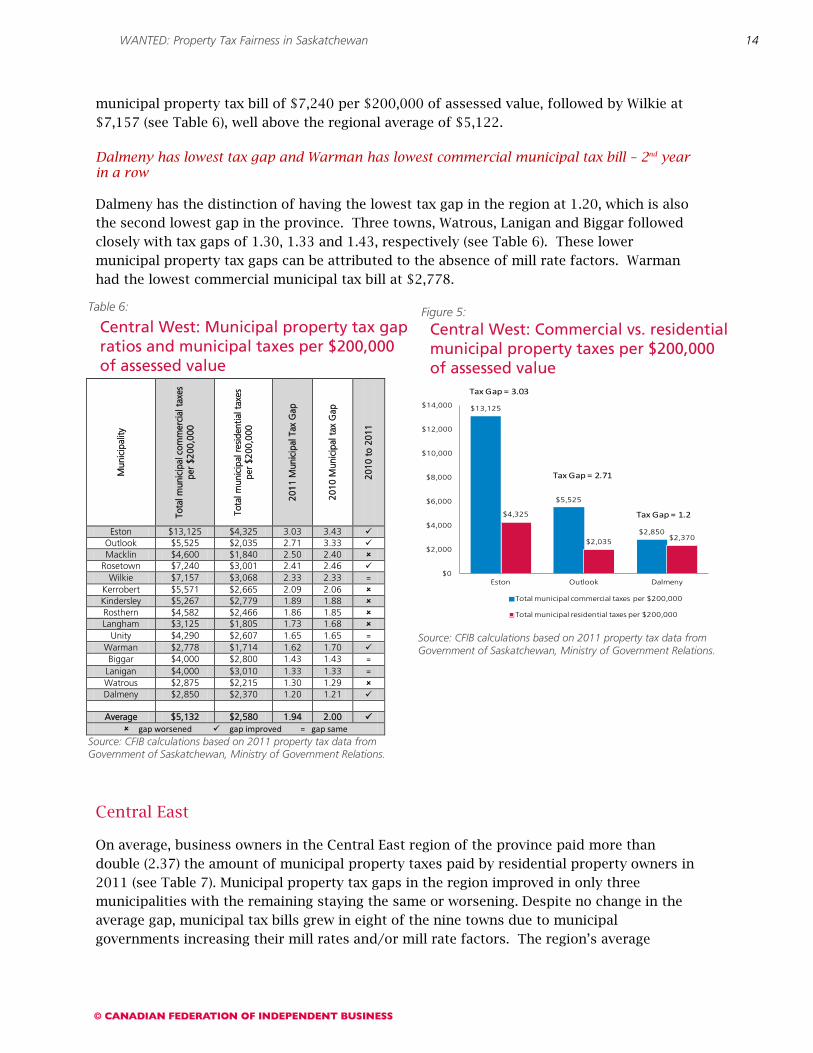
Central West
The Central West region, which includes fifteen municipalities, is the largest in CFIB’s study. From 2010 to 2011, CFIB’s research showed that the Central West region made little progress on the reduction of municipal tax gaps, with only five municipalities improving their gap. However, from 2010 to 2011, the average for the region fell from 2.00 to 1.94. Although this is an improvement over 2010, the majority of municipalities still worsened or made no improvements to their tax gap.
The greatest improvements were Outlook and Eston, which improved their gap by 0.62 and 0.40 respectively (see Table 6). Macklin and Langham, whose commercial mill rate factors are among the highest in the province, both worsened their gap by 0.10 and 0.05 respectively. The property tax gaps in the Central West region are extremely variable among municipalities as can be seen in Figure 5.
Eston has highest municipal tax gap and highest municipal tax bill - 2nd year in a row
In the Central West region, Eston displayed the highest municipal tax gap for the second year in a row with businesses paying $3.03 in municipal taxes for every dollar paid by residents per $200,000 of assessed value. Outlook trailed close behind Eston with a municipal property tax gap of 2.71. Eston also has the highest commercial municipal tax bill in both the region and the province at $13,125. Rosetown had the second highest
WANTED: Property Tax Fairness in Saskatchewan
14
Table 6:
Central West: Municipal property tax gap ratios and municipal taxes per $200,000 of assessed value
Mun
icip
ality
Tota
l mun
icip
al c
omm
erci
al t
axes
pe
r $2
00,0
00
Tota
l mun
icip
al r
esid
entia
l tax
es
per
$200
,000
2011
Mun
icip
al T
ax G
ap
2010
Mun
icip
al t
ax G
ap
2010
to
2011
Eston $13,125 $4,325 3.03 3.43 Outlook $5,525 $2,035 2.71 3.33 Macklin $4,600 $1,840 2.50 2.40
Rosetown $7,240 $3,001 2.41 2.46 Wilkie $7,157 $3,068 2.33 2.33 =
Kerrobert $5,571 $2,665 2.09 2.06 Kindersley $5,267 $2,779 1.89 1.88 Rosthern $4,582 $2,466 1.86 1.85 Langham $3,125 $1,805 1.73 1.68
Unity $4,290 $2,607 1.65 1.65 = Warman $2,778 $1,714 1.62 1.70 Biggar $4,000 $2,800 1.43 1.43 =
Lanigan $4,000 $3,010 1.33 1.33 = Watrous $2,875 $2,215 1.30 1.29 Dalmeny $2,850 $2,370 1.20 1.21
Average $5,132 $2,580 1.94 2.00
gap worsened gap improved = gap sameSource: CFIB calculations based on 2011 property tax data from Government of Saskatchewan, Ministry of Government Relations.
Figure 5:
Central West: Commercial vs. residential municipal property taxes per $200,000 of assessed value
Source: CFIB calculations based on 2011 property tax data from Government of Saskatchewan, Ministry of Government Relations.
$13,125
$5,525
$2,850
$4,325
$2,035 $2,370
$0
$2,000
$4,000
$6,000
$8,000
$10,000
$12,000
$14,000
Eston Outlook Dalmeny
Total municipal commercial taxes per $200,000
Total municipal residential taxes per $200,000
Tax Gap = 3.03
Tax Gap = 2.71
Tax Gap = 1.2
municipal property tax bill of $7,240 per $200,000 of assessed value, followed by Wilkie at $7,157 (see Table 6), well above the regional average of $5,122.
Dalmeny has lowest tax gap and Warman has lowest commercial municipal tax bill – 2nd year in a row
Dalmeny has the distinction of having the lowest tax gap in the region at 1.20, which is also the second lowest gap in the province. Three towns, Watrous, Lanigan and Biggar followed closely with tax gaps of 1.30, 1.33 and 1.43, respectively (see Table 6). These lower municipal property tax gaps can be attributed to the absence of mill rate factors. Warman had the lowest commercial municipal tax bill at $2,778.
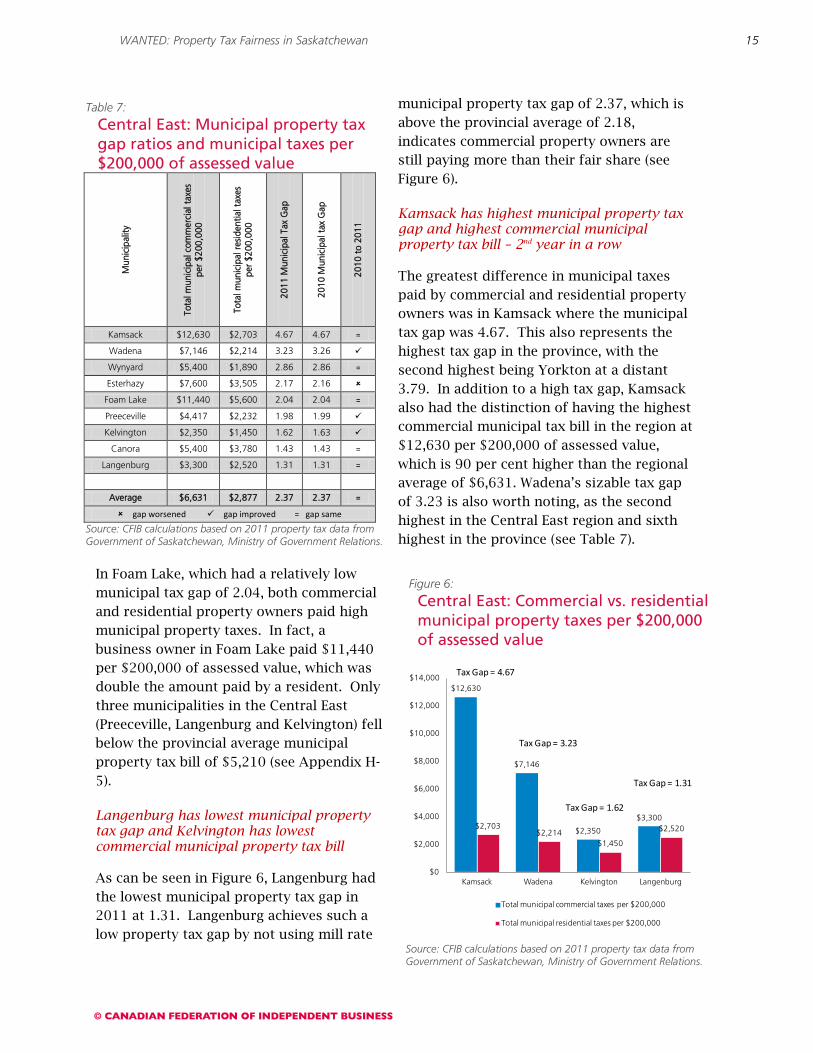
Central East
On average, business owners in the Central East region of the province paid more than double (2.37) the amount of municipal property taxes paid by residential property owners in 2011 (see Table 7). Municipal property tax gaps in the region improved in only three municipalities with the remaining staying the same or worsening. Despite no change in the average gap, municipal tax bills grew in eight of the nine towns due to municipal governments increasing their mill rates and/or mill rate factors. The region’s average
WANTED: Property Tax Fairness in Saskatchewan
15
Table 7:
Central East: Municipal property tax gap ratios and municipal taxes per $200,000 of assessed value
Mun
icip
ality
Tota
l mun
icip
al c
omm
erci
al t
axes
pe
r $2
00,0
00
Tota
l mun
icip
al r
esid
entia
l tax
es
per
$200
,000
2011
Mun
icip
al T
ax G
ap
2010
Mun
icip
al t
ax G
ap
2010
to
2011
Kamsack $12,630 $2,703 4.67 4.67 =
Wadena $7,146 $2,214 3.23 3.26
Wynyard $5,400 $1,890 2.86 2.86 =
Esterhazy $7,600 $3,505 2.17 2.16
Foam Lake $11,440 $5,600 2.04 2.04 =
Preeceville $4,417 $2,232 1.98 1.99
Kelvington $2,350 $1,450 1.62 1.63
Canora $5,400 $3,780 1.43 1.43 =
Langenburg $3,300 $2,520 1.31 1.31 =
Average $6,631 $2,877 2.37 2.37 =
gap worsened gap improved = gap same
Source: CFIB calculations based on 2011 property tax data from Government of Saskatchewan, Ministry of Government Relations.
Figure 6:
Central East: Commercial vs. residential municipal property taxes per $200,000 of assessed value
Source: CFIB calculations based on 2011 property tax data from Government of Saskatchewan, Ministry of Government Relations.
$12,630
$7,146
$2,350
$3,300$2,703
$2,214$1,450
$2,520
$0
$2,000
$4,000
$6,000
$8,000
$10,000
$12,000
$14,000
Kamsack Wadena Kelvington Langenburg
Total municipal commercial taxes per $200,000
Total municipal residential taxes per $200,000
Tax Gap = 4.67
Tax Gap = 3.23
Tax Gap = 1.62
Tax Gap = 1.31
municipal property tax gap of 2.37, which is above the provincial average of 2.18, indicates commercial property owners are still paying more than their fair share (see Figure 6).
Kamsack has highest municipal property tax gap and highest commercial municipal property tax bill – 2nd year in a row
The greatest difference in municipal taxes paid by commercial and residential property owners was in Kamsack where the municipal tax gap was 4.67. This also represents the highest tax gap in the province, with the second highest being Yorkton at a distant 3.79. In addition to a high tax gap, Kamsack also had the distinction of having the highest commercial municipal tax bill in the region at $12,630 per $200,000 of assessed value, which is 90 per cent higher than the regional average of $6,631. Wadena’s sizable tax gap of 3.23 is also worth noting, as the second highest in the Central East region and sixth highest in the province (see Table 7).
In Foam Lake, which had a relatively low municipal tax gap of 2.04, both commercial and residential property owners paid high municipal property taxes. In fact, a business owner in Foam Lake paid $11,440 per $200,000 of assessed value, which was double the amount paid by a resident. Only three municipalities in the Central East (Preeceville, Langenburg and Kelvington) fell below the provincial average municipal property tax bill of $5,210 (see Appendix H-5).
Langenburg has lowest municipal property tax gap and Kelvington has lowest commercial municipal property tax bill
As can be seen in Figure 6, Langenburg had the lowest municipal property tax gap in 2011 at 1.31. Langenburg achieves such a low property tax gap by not using mill rate
WANTED: Property Tax Fairness in Saskatchewan
16
Table 8:
North: Municipal property tax gap ratios and municipal taxes per $200,000 of assessed value
Mun
icip
ality
Tota
l mun
icip
al c
omm
erci
al
taxe
s
per
$200
,000
Tota
l mun
icip
al r
esid
entia
l ta
xes
pe
r $2
00,0
00
2011
Mun
icip
al T
ax G
ap
2010
Mun
icip
al t
ax G
ap
2010
to
2011
Shellbrook $9,990 $3,082 3.24 3.24 =
Tisdale $7,597 $2,359 3.22 3.46
Nipawin $4,960 $1,901 2.61 2.80
Carrot River $7,920 $3,080 2.57 2.57 =
Battleford $3,008 $1,776 1.69 1.69 =
Hudson Bay $2,947 $1,802 1.64 1.71
Average $6,070 $2,333 2.50 2.58
gap worsened gap improved = gap same
Source: CFIB calculations based on 2011 property tax data from Government of Saskatchewan, Ministry of Government Relations.
Figure 7:
North: Commercial vs. residential municipal property taxes per $200,000 of assessed value
Source: CFIB calculations based on 2011 property tax data from Government of Saskatchewan, Ministry of Government Relations.
$9,990
$3,008 $2,947$3,082
$1,776 $1,802
$0
$2,000
$4,000
$6,000
$8,000
$10,000
$12,000
Shellbrook Battleford Hudson Bay
Total municipal commercial taxes per $200,000
Total municipal residential taxes per $200,000
Tax Gap = 3.24
Tax Gap = 1.69 Tax Gap = 1.64
factors. The lowest municipal tax bill in the region belonged to Kelvington with a value of $2,350. There is a great deal of variation between tax schemes in the Central East. With municipal property tax gaps set aside, commercial property owners in Kamsack are paying over five times the amount of property taxes as business owners in Kelvington per $200,000 of assessed value.
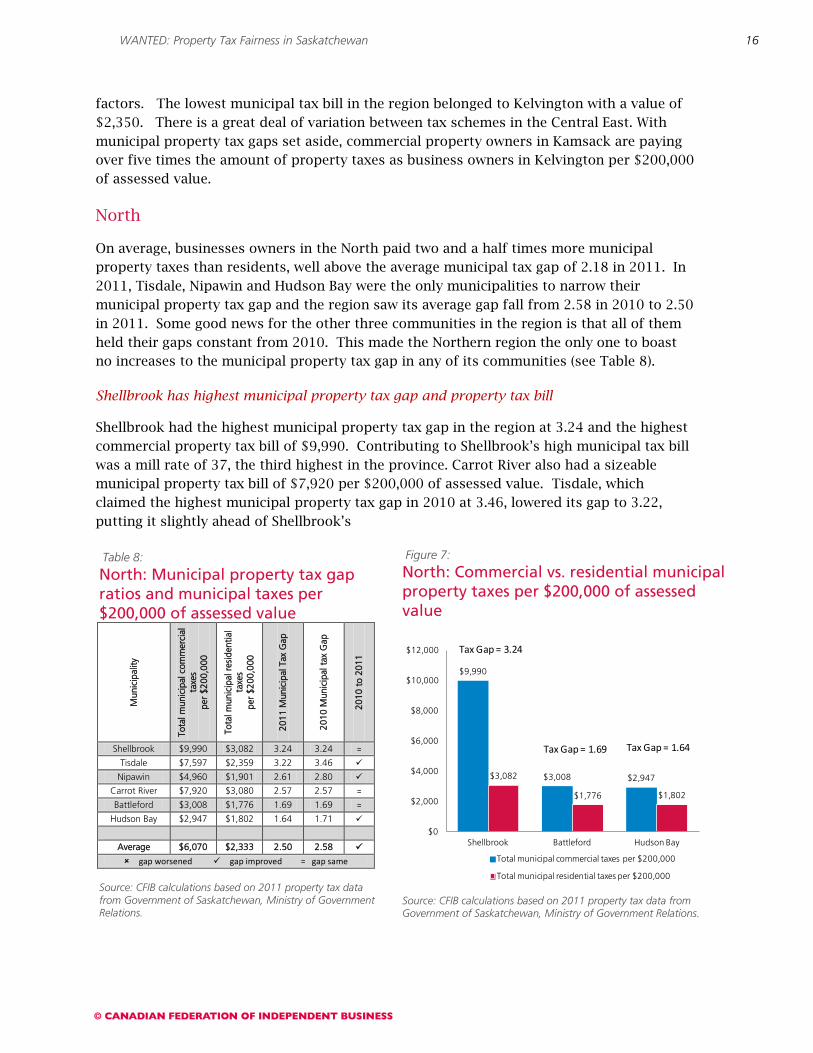
North
On average, businesses owners in the North paid two and a half times more municipal property taxes than residents, well above the average municipal tax gap of 2.18 in 2011. In 2011, Tisdale, Nipawin and Hudson Bay were the only municipalities to narrow their municipal property tax gap and the region saw its average gap fall from 2.58 in 2010 to 2.50 in 2011. Some good news for the other three communities in the region is that all of them held their gaps constant from 2010. This made the Northern region the only one to boast no increases to the municipal property tax gap in any of its communities (see Table 8).
Shellbrook has highest municipal property tax gap and property tax bill
Shellbrook had the highest municipal property tax gap in the region at 3.24 and the highest commercial property tax bill of $9,990. Contributing to Shellbrook’s high municipal tax bill was a mill rate of 37, the third highest in the province. Carrot River also had a sizeable municipal property tax bill of $7,920 per $200,000 of assessed value. Tisdale, which claimed the highest municipal property tax gap in 2010 at 3.46, lowered its gap to 3.22, putting it slightly ahead of Shellbrook’s
WANTED: Property Tax Fairness in Saskatchewan
17
gap of 3.24 in 2011.
Hudson Bay has lowest municipal property tax gap and lowest commercial municipal property tax bill
Hudson Bay not only had the lowest municipal property tax gap in the region at 1.64, but it also had the lowest municipal property tax bill at $2,947, well below the region’s average tax bill of $6,070. Not far behind Hudson Bay was Battleford, which had the second lowest municipal property tax gap and commercial tax bill at 1.69 and $3,008 respectively. Figure 7 displays the contrast in municipal property taxes applied by different Northern municipalities and shows that, with respect to commercial property taxes, Battleford and Hudson Bay are the most affordable places for commercial property owners to locate in the region.

WANTED: Property Tax Fairness in Saskatchewan
18
No appetite for Municipal Property Tax Hikes
Small business owners work hard to live within their means and count on their local governments to do the same. CFIB is concerned many Saskatchewan municipalities will continue on the path of unsustainable spending and introduce property tax hikes in 2013 to cover their costs. Such tax hikes continue to erode the savings from the education property tax relief delivered by the Province to small business owners and their customers.
In 2012-2013 the Government of Saskatchewan committed one full point of the Provincial Sales Tax (PST) or $237.4 million to municipalities through the Municipal Operating Grant (MOG). This is an increase of 9.5 per cent from the previous year and 87 per cent from 2007-2008 levels (see Table 9).
With the province providing this long-term, sustainable and predictable revenue sharing, municipalities should use this new revenue prudently and avoid property tax hikes in 2013.
In total, the 63 municipalities CFIB studied in this report saw municipal revenue sharing to their communities increase by 131 per cent since 2007-2008 (Table 10). Regionally, Saskatchewan cities received the largest increase at 134 per cent, followed by the Central West and South East regions at 124 per cent and 118 per cent respectively. While municipal revenue sharing has increased significantly, CFIB is concerned that many municipalities across Saskatchewan continue to hike property taxes – which eats into provincial education property tax relief. CFIB is worried those education property tax savings delivered in recent years are quickly being eroded by municipalities introducing property tax hikes.
Table 9:
Provincial-municipal revenue sharing commitments for the past five years
Saskatchewan Municipalities
2007-08 Municipal
Operating Grant
2012-13 Revenue Sharing
Estimate
% Increase in Revenue Sharing
Urban $67.4 M $151.9M 125%
Rural $49.6 M $68.9M 39%
Northern $10.2 M $16.6M 63%
Total $127.3 M $237.4M 87%
Source: Government of Saskatchewan, Ministry of Government Relations.
Table 10:
Municipal revenue sharing by region
Regi
on
2007
-200
8 M
unic
ipal
O
pera
ting
Gra
nt
2012
-13
Reve
nue
Shar
ing
Estim
ate
Ove
rall
Incr
ease
in
Reve
nue
Shar
ing
% In
crea
se in
Re
venu
e Sh
arin
g
Cities $47,817,640 $111,759,236 $63,941,596 134%
South West $852,408 $1,701,063 $848,655 100%
South East $1,979,590 $4,306,192 $2,326,602 118%
Central West $3,014,239 $6,741,528 $3,727,289 124%
Central East $1,369,399 $2,781,925 $1,412,526 103%
North $1,520,330 $3,096,037 $1,575,707 104%
Total $56,553,606 $130,385,981 $73,832,375 131%
Source: Government of Saskatchewan, Ministry of Government Relations.
WANTED: Property Tax Fairness in Saskatchewan
19
Figure 9:
How should municipalities reduce spending?
Source: CFIB Focus on Saskatchewan, October 2010
10
14
31
57
58
64
No spending reduction is needed
Cut specific recreational services
Impose a hiring freeze in non-core areas
Put a wide range of city services out for competitive bidding
Bring municipal compensation packages in line with the private sector
Focus on core municipal services (e.g. roads, sewers, etc.)
% response
Figure 8:
The provincial government has committed one per cent of the PST to Saskatchewan municipalities in 2011. Given this additional revenue, should municipalities avoid a property tax increase in 2011?
Source: CFIB Focus on Saskatchewan, October 2010
Yes(83%)
No (9%)
Don't Know(8%)
“Federal and provincial politicians would be mad to think taxpayers would shrug at a raise in income or corporate taxes by several percentage points year after year. Only, it seems, in our cities – where the average family drops roughly 10% of its tax dollars – do we take a bigger yearly grab for granted.”
-Kevin Libin, National Post
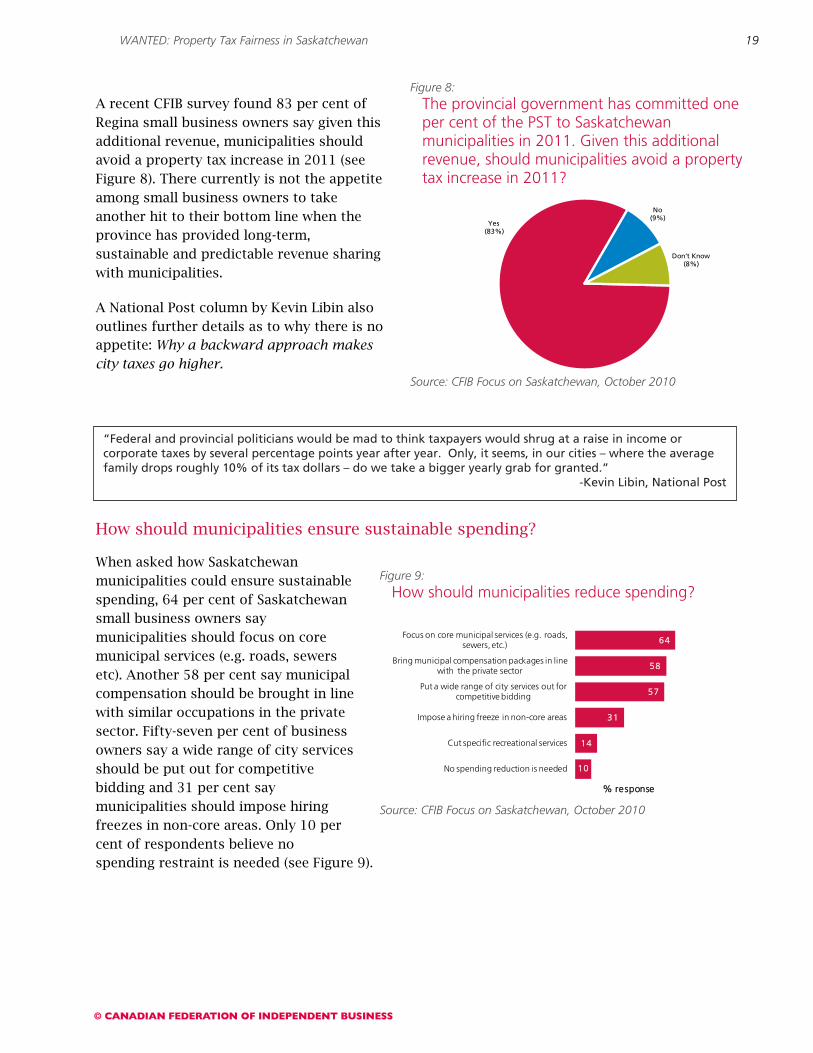
A recent CFIB survey found 83 per cent of Regina small business owners say given this additional revenue, municipalities should avoid a property tax increase in 2011 (see Figure 8). There currently is not the appetite among small business owners to take another hit to their bottom line when the province has provided long-term, sustainable and predictable revenue sharing with municipalities.
A National Post column by Kevin Libin also outlines further details as to why there is no appetite: Why a backward approach makes city taxes go higher.
How should municipalities ensure sustainable spending?
When asked how Saskatchewan municipalities could ensure sustainable spending, 64 per cent of Saskatchewan small business owners say municipalities should focus on core municipal services (e.g. roads, sewers etc). Another 58 per cent say municipal compensation should be brought in line with similar occupations in the private sector. Fifty-seven per cent of business owners say a wide range of city services should be put out for competitive bidding and 31 per cent say municipalities should impose hiring freezes in non-core areas. Only 10 per cent of respondents believe no spending restraint is needed (see Figure 9).
WANTED: Property Tax Fairness in Saskatchewan
20
Figure 10:
Should Saskatchewan municipalities introduce a plan to reduce the size of their civil service?
Source: CFIB Mandate 239, July 2010
Yes (60%)
No (16%)
No Interest (2%)
Undecided(22%)
A plan to reduce the size and cost of the municipal civil service
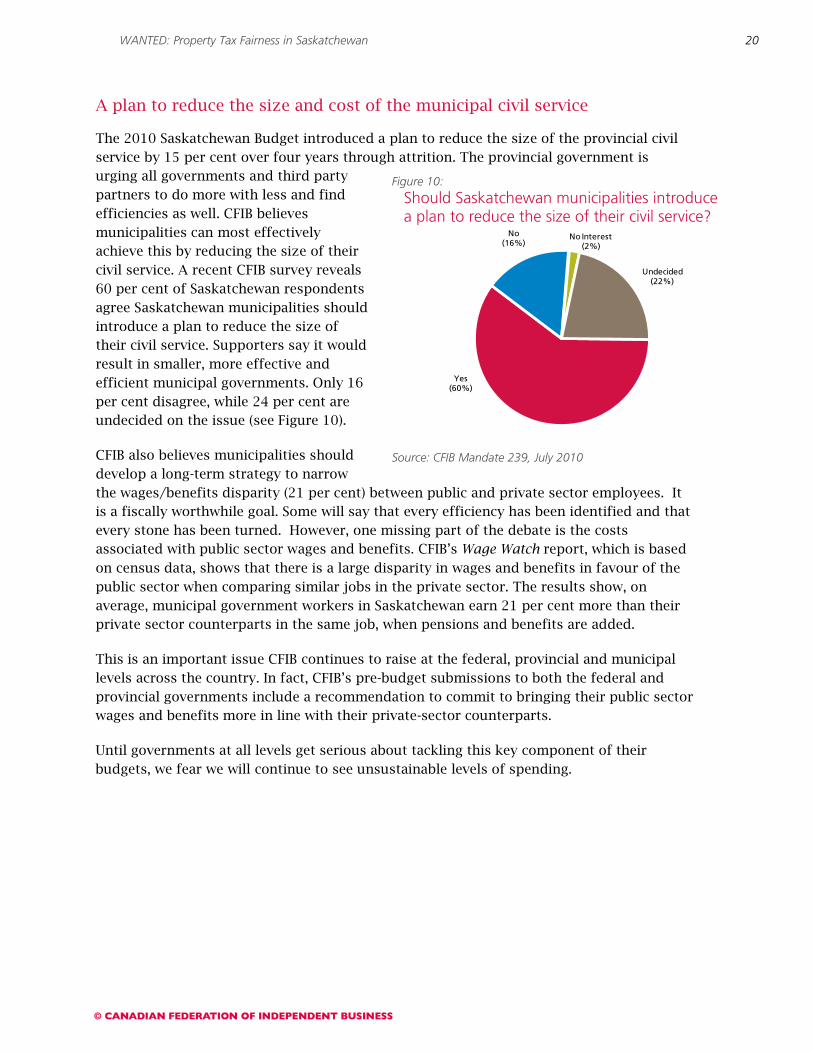
The 2010 Saskatchewan Budget introduced a plan to reduce the size of the provincial civil service by 15 per cent over four years through attrition. The provincial government is urging all governments and third party partners to do more with less and find efficiencies as well. CFIB believes municipalities can most effectively achieve this by reducing the size of their civil service. A recent CFIB survey reveals 60 per cent of Saskatchewan respondents agree Saskatchewan municipalities should introduce a plan to reduce the size of their civil service. Supporters say it would result in smaller, more effective and efficient municipal governments. Only 16 per cent disagree, while 24 per cent are undecided on the issue (see Figure 10).
CFIB also believes municipalities should develop a long-term strategy to narrow the wages/benefits disparity (21 per cent) between public and private sector employees. It is a fiscally worthwhile goal. Some will say that every efficiency has been identified and that every stone has been turned. However, one missing part of the debate is the costs associated with public sector wages and benefits. CFIB’s Wage Watch report, which is based on census data, shows that there is a large disparity in wages and benefits in favour of the public sector when comparing similar jobs in the private sector. The results show, on average, municipal government workers in Saskatchewan earn 21 per cent more than their private sector counterparts in the same job, when pensions and benefits are added.
This is an important issue CFIB continues to raise at the federal, provincial and municipal levels across the country. In fact, CFIB’s pre-budget submissions to both the federal and provincial governments include a recommendation to commit to bringing their public sector wages and benefits more in line with their private-sector counterparts.
Until governments at all levels get serious about tackling this key component of their budgets, we fear we will continue to see unsustainable levels of spending.
WANTED: Property Tax Fairness in Saskatchewan
21
Saskatchewan business owners say ‘no’ to expanding taxing authority or new provincial taxes to fund infrastructure
While we recognize the fiscal pressures Canadian municipalities face, we are opposed to municipalities gaining authority for new sources of revenue such as a municipal fuel or hotel tax, a local vehicle registration surcharge, a land transfer tax, or even a sales or income tax.
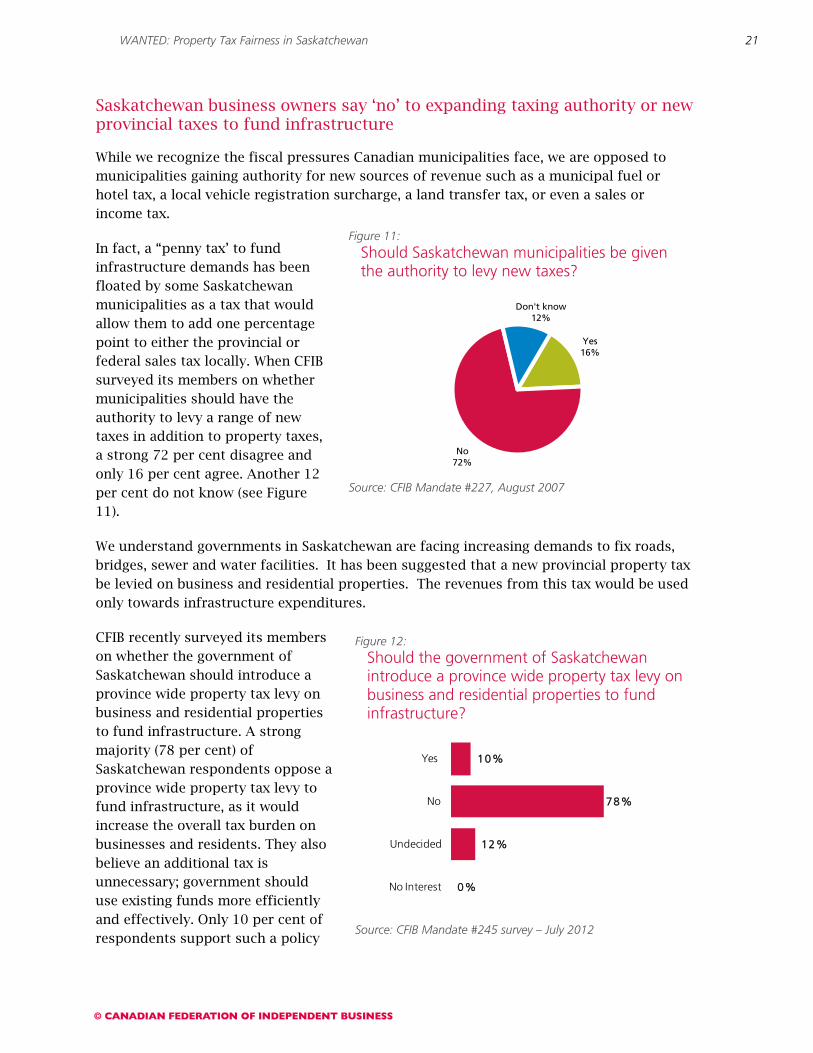
In fact, a “penny tax’ to fund infrastructure demands has been floated by some Saskatchewan municipalities as a tax that would allow them to add one percentage point to either the provincial or federal sales tax locally. When CFIB surveyed its members on whether municipalities should have the authority to levy a range of new taxes in addition to property taxes, a strong 72 per cent disagree and only 16 per cent agree. Another 12 per cent do not know (see Figure 11).
We understand governments in Saskatchewan are facing increasing demands to fix roads, bridges, sewer and water facilities. It has been suggested that a new provincial property tax be levied on business and residential properties. The revenues from this tax would be used only towards infrastructure expenditures.
CFIB recently surveyed its members on whether the government of Saskatchewan should introduce a province wide property tax levy on business and residential properties to fund infrastructure. A strong majority (78 per cent) of Saskatchewan respondents oppose a province wide property tax levy to fund infrastructure, as it would increase the overall tax burden on businesses and residents. They also believe an additional tax is unnecessary; government should use existing funds more efficiently and effectively. Only 10 per cent of respondents support such a policy
Figure 11:
Should Saskatchewan municipalities be given the authority to levy new taxes?
Source: CFIB Mandate #227, August 2007
Yes 16%
No 72%
Don't know 12%
Figure 12:
Should the government of Saskatchewan introduce a province wide property tax levy on business and residential properties to fund infrastructure?
Source: CFIB Mandate #245 survey – July 2012
0%
12%
78%
10%
No Interest
Undecided
No
Yes

WANTED: Property Tax Fairness in Saskatchewan
22
and believe it would provide a new revenue stream to invest in ageing road and infrastructure. They also believe it would result in better infrastructure which in turn supports business development (see Figure 12).
As Saskatchewan’s economy grows, so too will the revenue share to municipalities. Therefore it is not acceptable for municipalities to continually increase taxes. It must be remembered that while there are three levels of government, there is only one taxpayer
Recommendations for sustainable municipal spending:
With the province providing long-term, sustainable and predictable revenue sharing, CFIB believes municipalities should use this revenue prudently and work to avoid property tax hikes by acting on a number of the following key recommendations to further contain costs:
1. Develop and implement a plan over time to reduce the commercial- to- residential property tax gap.
2. Limit year- over- year spending growth to a maximum of inflation plus population growth and ensure the funds from the Province’s Municipal Operating Grant are used prudently.
3. Review current programs and services with a view to identifying programs and service areas that can be eliminated, streamlined, contracted out to the private sector, or sold. CFIB commends those municipalities that have conducted Core Services Review. CFIB believes the municipalities should focus on delivering core services (roads, sewers) and continue to look for ways to deliver these services more efficiently and effectively.
4. Introduce a plan to reduce the size and cost of the municipal civil service.
Introduce a plan to reduce the size of the civil service (primarily through attrition).
Develop a long-term strategy to narrow the wages/benefits disparity (21.0 per cent) between public and private sector employees.
5. Work toward additional revenue sharing, rather than new taxing authority or provincial tax increases to finance municipal infrastructure (e.g. penny tax, vehicle tax). CFIB is concerned some municipal leaders continue to call for new taxing authority for alternative revenue sources such as a penny tax, local fuel tax, a local vehicle registration surcharge, a share land transfer tax, a hotel tax and/or a local sales tax. Small business owners also believe a provincial tax increase such as a Vehicle Tax or a provincial property tax levy is unnecessary and has called on the Government of Saskatchewan to reject calls for such tax increases.
6. Consider the introduction of a base tax for all homeowners. Currently 45 of the 65 municipalities studied in this report have a base tax. When surveyed, 70 per cent of small business owners agreed a base tax for basic core services should be implemented for all homeowners. CFIB believes that local government services are enjoyed by all taxpayers and the costs must be shared by all taxpayers.

WANTED: Property Tax Fairness in Saskatchewan
23
Education Property Taxes
For years, small business owners have raised their concerns with the high property taxes in Saskatchewan – particularly, high education taxes.
Prior to 2009, individual school divisions set education property tax mill rates to fund their education systems and had the ability to apply these mill rate factors to different property classes. This resulted in Saskatchewan’s education system being increasingly funded by property taxes and the proportion of education funding generated from property taxes being among the highest in Canada. The legal authority to levy property taxes by setting mill rates and applying mill rate factors complicated the province’s education property tax system and created disparities between the amount paid by commercial and residential property owners across the province.
CFIB is pleased the Province of Saskatchewan took important steps toward reforming education financing in 2009. As of April 1, 2009, the provincial government assumed the responsibility of setting province-wide education property tax mill rates for each of the three major property classes; residential, commercial, and agricultural. The residential and agricultural property classes use fixed rates; while the commercial property class consists of three tiers related to assessed property value (see Table 11).
The provincially set mill rates apply to all public school divisions, but separate school divisions retain the constitutional authority to levy their own property taxes to fund their educational system. In effect, the education tax rate changes created a fairer and more equitable education property tax system, and resulted in education tax savings for Saskatchewan taxpayers. In 2011, the amount of tax savings increased by $55.6 million because of mill rate reductions12
In conjunction with setting universal education mill rates, the provincial government also increased education funding. In 2009, the Province boosted education financing by $241 million, funding 63 per cent of the operating costs for Pre-kindergarten to Grade 12 education
. Unfortunately the reductions did not apply to Commercial Tier 1, meaning many small businesses saw no decrease in education property taxes.
13
12 Saskatchewan Provincial Budget Summary 2011- 2012.
, and in 2011, 65 per cent of Saskatchewan’s education system was funded by
13 Saskatchewan Provincial Budget Summary 2009- 2010.
Table 11:
Saskatchewan education mill rates, 2009-2012
Property Class 2009 2010 2011 2012
Agricultural 7.08 7.08 3.91 3.91
Residential 10.08 10.08 9.51 9.51
Commercial Tier 1 (< $500,000)
12.25 12.25 12.25 12.25
Commercial Tier 2 ($500,000 to $5,999,999)
15.75 15.75 14.75 14.75
Commercial Tier 3 (> $6,000,000)
18.55 18.55 18.55 18.55
Source: Government of Saskatchewan, 2012.
WANTED: Property Tax Fairness in Saskatchewan
24
the Province14. In the 2012-2013 budget, the Saskatchewan government committed an additional $82 million toward education operating costs15
As always, CFIB will continue to lobby on behalf of our members to raise the thresholds and lower the commercial mill rates, just as CFIB successfully has with corporate and other forms of taxation. Raising the threshold means raising the level before which businesses have to pay higher taxes at a certain assessment level.
.
Total Property Taxes (Municipal + Education) Across the Province
Calculating the Education Property Tax Gap
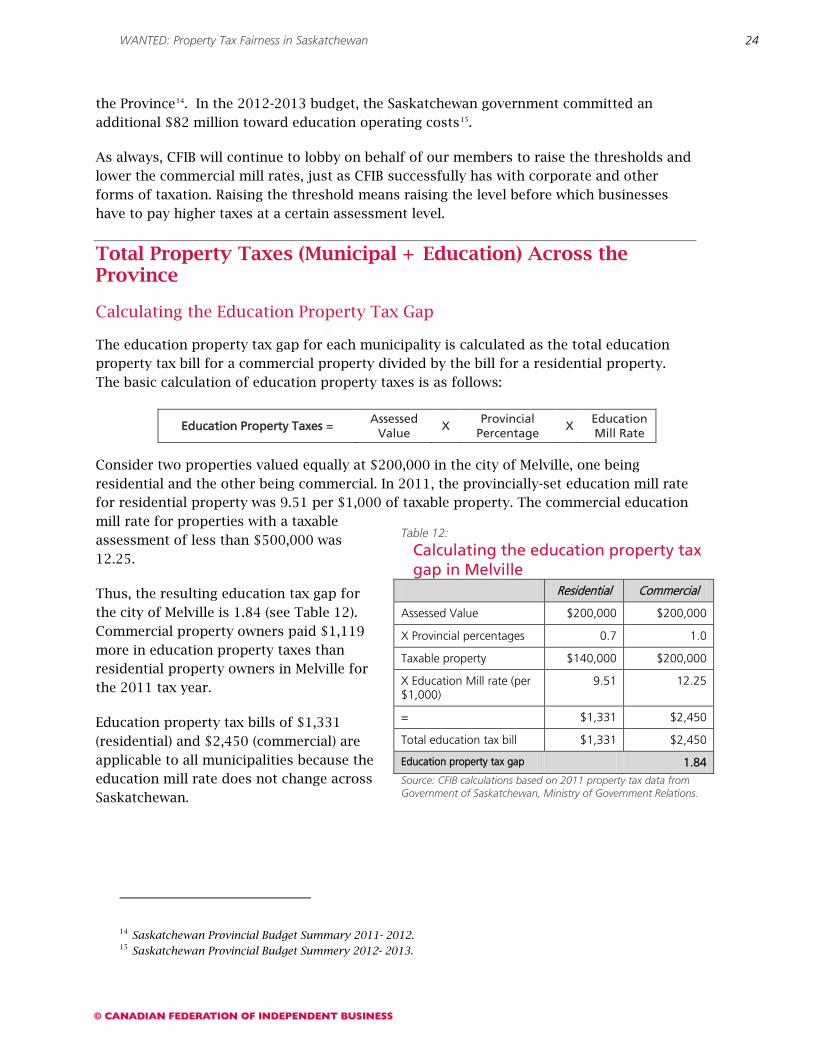
The education property tax gap for each municipality is calculated as the total education property tax bill for a commercial property divided by the bill for a residential property. The basic calculation of education property taxes is as follows:
Consider two properties valued equally at $200,000 in the city of Melville, one being residential and the other being commercial. In 2011, the provincially-set education mill rate for residential property was 9.51 per $1,000 of taxable property. The commercial education mill rate for properties with a taxable assessment of less than $500,000 was 12.25.
Thus, the resulting education tax gap for the city of Melville is 1.84 (see Table 12). Commercial property owners paid $1,119 more in education property taxes than residential property owners in Melville for the 2011 tax year.
Education property tax bills of $1,331 (residential) and $2,450 (commercial) are applicable to all municipalities because the education mill rate does not change across Saskatchewan.
14 Saskatchewan Provincial Budget Summary 2011- 2012. 15 Saskatchewan Provincial Budget Summery 2012- 2013.
Education Property Taxes = Assessed
Value X
Provincial Percentage
X Education Mill Rate
Table 12:
Calculating the education property tax gap in Melville
Residential Commercial
Assessed Value $200,000 $200,000
X Provincial percentages 0.7 1.0
Taxable property $140,000 $200,000
X Education Mill rate (per $1,000)
9.51 12.25
= $1,331 $2,450
Total education tax bill $1,331 $2,450
Education property tax gap 1.84
Source: CFIB calculations based on 2011 property tax data from Government of Saskatchewan, Ministry of Government Relations.
WANTED: Property Tax Fairness in Saskatchewan
25
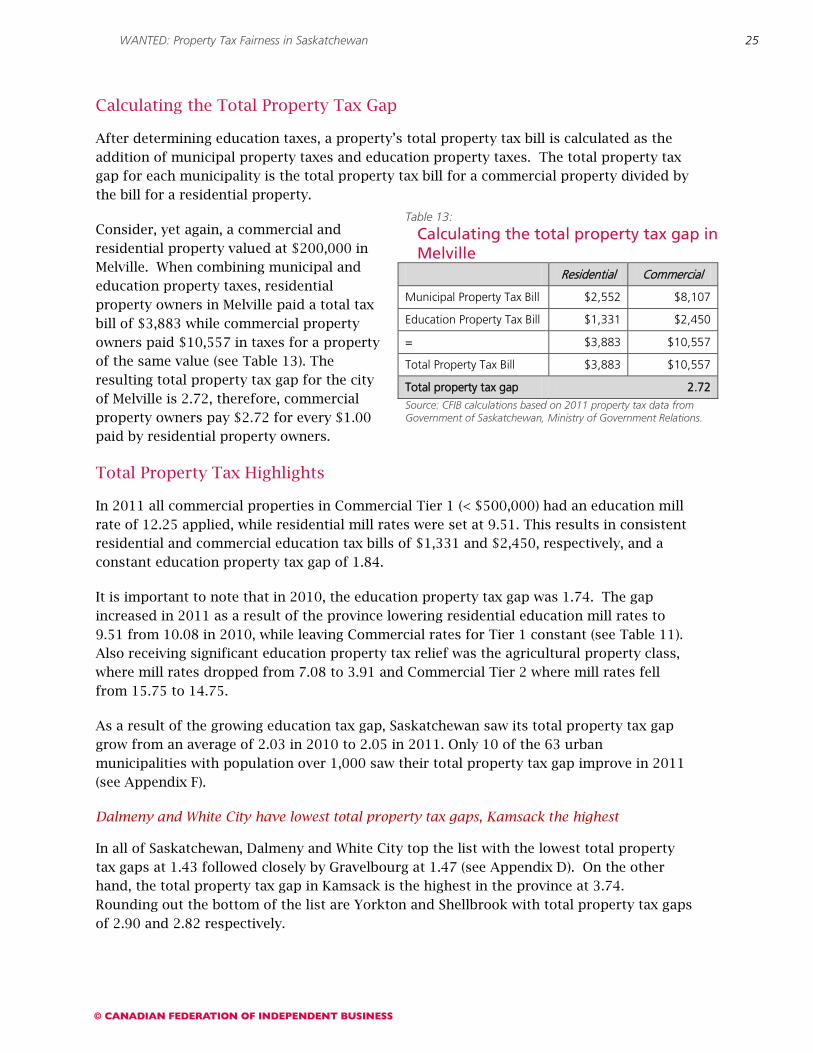
Calculating the Total Property Tax Gap
After determining education taxes, a property’s total property tax bill is calculated as the addition of municipal property taxes and education property taxes. The total property tax gap for each municipality is the total property tax bill for a commercial property divided by the bill for a residential property.
Consider, yet again, a commercial and residential property valued at $200,000 in Melville. When combining municipal and education property taxes, residential property owners in Melville paid a total tax bill of $3,883 while commercial property owners paid $10,557 in taxes for a property of the same value (see Table 13). The resulting total property tax gap for the city of Melville is 2.72, therefore, commercial property owners pay $2.72 for every $1.00 paid by residential property owners.
Total Property Tax Highlights
In 2011 all commercial properties in Commercial Tier 1 (< $500,000) had an education mill rate of 12.25 applied, while residential mill rates were set at 9.51. This results in consistent residential and commercial education tax bills of $1,331 and $2,450, respectively, and a constant education property tax gap of 1.84.
It is important to note that in 2010, the education property tax gap was 1.74. The gap increased in 2011 as a result of the province lowering residential education mill rates to 9.51 from 10.08 in 2010, while leaving Commercial rates for Tier 1 constant (see Table 11). Also receiving significant education property tax relief was the agricultural property class, where mill rates dropped from 7.08 to 3.91 and Commercial Tier 2 where mill rates fell from 15.75 to 14.75.
As a result of the growing education tax gap, Saskatchewan saw its total property tax gap grow from an average of 2.03 in 2010 to 2.05 in 2011. Only 10 of the 63 urban municipalities with population over 1,000 saw their total property tax gap improve in 2011 (see Appendix F).
Dalmeny and White City have lowest total property tax gaps, Kamsack the highest
In all of Saskatchewan, Dalmeny and White City top the list with the lowest total property tax gaps at 1.43 followed closely by Gravelbourg at 1.47 (see Appendix D). On the other hand, the total property tax gap in Kamsack is the highest in the province at 3.74. Rounding out the bottom of the list are Yorkton and Shellbrook with total property tax gaps of 2.90 and 2.82 respectively.
Table 13:
Calculating the total property tax gap in Melville
Residential Commercial
Municipal Property Tax Bill $2,552 $8,107
Education Property Tax Bill $1,331 $2,450
= $3,883 $10,557
Total Property Tax Bill $3,883 $10,557
Total property tax gap 2.72
Source: CFIB calculations based on 2011 property tax data from Government of Saskatchewan, Ministry of Government Relations.
WANTED: Property Tax Fairness in Saskatchewan
26
Swift Current boasts most improved total property tax gap, North Battleford sees largest increase
The city of Swift Current was the most improved, reducing its gap by 0.35 from 2.57 in 2010 to 2.22 in 2011 (see Appendix F). Also making significant improvements to their total property tax gaps were Outlook and Eston, which improved by 0.26 and 0.20 respectively. Unfortunately for business owners in North Battleford, the total property tax gap increased by 0.24 – the largest jump in the province, going from 2.49 in 2010 to 2.73 in 2011. Also worth noting are Yorkton, and Prince Albert, which both increased their gaps by 0.18.
Kelvington has lowest total property tax bill, Eston the highest
Across Saskatchewan, total property taxes on a commercial property with an assessed value of $200,000 ranged from as low as $4,800 in Kelvington to $15,575 in Eston, and the provincial average was $7,660 (see Appendix E). In comparison, total residential property tax bills across the province ranged from $2,203 to $6,801 and the provincial average was $3,793. Lumsden, Regina Beach and White City all had commercial property taxes below $5,000. However, commercial property owners in Kamsack and Foam Lake were footing large total property tax bills at $15,080 and $13,890 respectively.
The following section compares the total property tax gaps of Saskatchewan’s cities and towns over 1,000 by economic region.
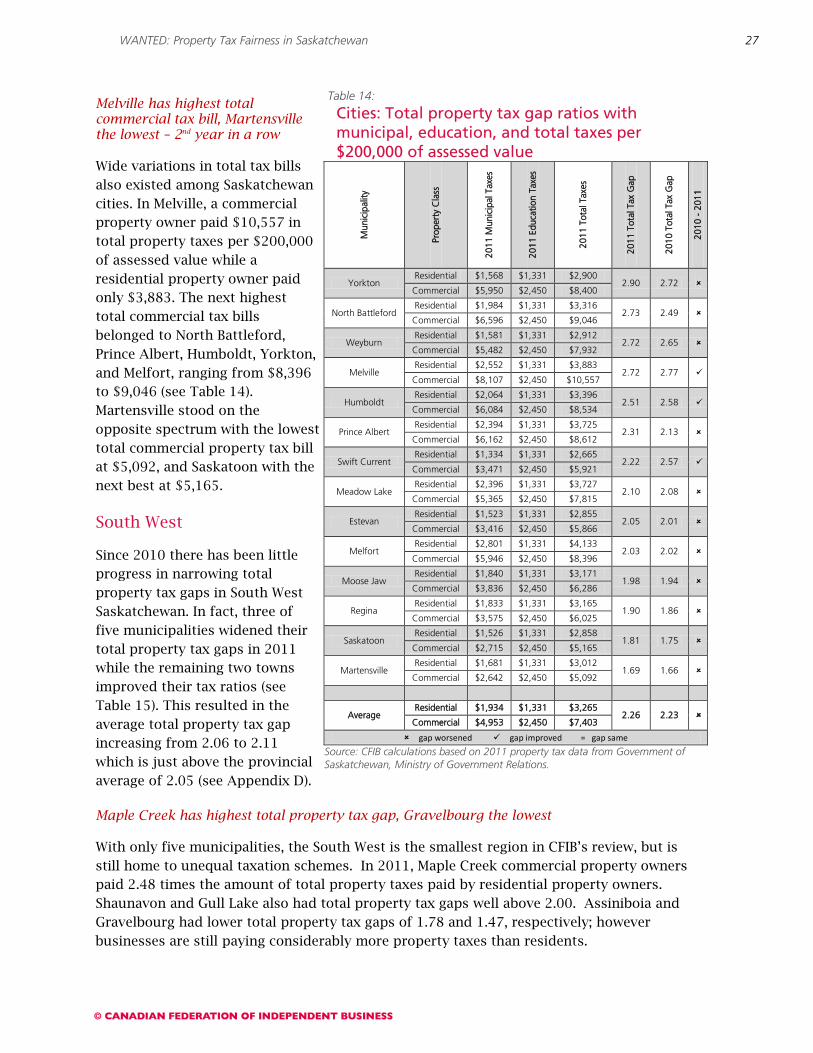
Cities16
When including education taxes, commercial property owners in Saskatchewan’s cities are still subsidizing residential property owners by paying considerably more taxes. On average, businesses in Saskatchewan cities are paying 2.26 times more total property taxes than residents (see Table 14). This is a slight increase from the 2010 average total property tax gap of 2.23. While Saskatchewan cities had 8 of the 14 cities improving their municipal property tax gap, the total property tax gap increased in all but three cities. The limited gains made at improving the gap at the municipal level were not enough to offset the widening gap created by unbalanced education taxes.
Yorkton has highest total property tax gap, Martensville the lowest
Yorkton tops the list as the worst offender in the region for 2011 with a total property tax gap of 2.90. However, North Battleford, Weyburn, Melville and Humboldt followed close behind by all having total tax gaps above 2.50; well above the provincial average of 2.05. Martensville leads the region with the lowest total tax gap of 1.69 while other municipalities including Saskatoon, Regina, and Moose Jaw all had gaps below 2.00. Meanwhile, businesses in the remaining five municipalities were paying between two and two and a half times the amount of property taxes paid by residents.
16 The city of Lloydminster moved to Alberta assessment procedures starting on January 1, 2005. As a result it has been excluded from the current calculations
WANTED: Property Tax Fairness in Saskatchewan
27
Table 14:
Cities: Total property tax gap ratios with municipal, education, and total taxes per $200,000 of assessed value
Mun
icip
ality
Prop
erty
Cla
ss
2011
Mun
icip
al T
axes
2011
Edu
catio
n Ta
xes
2011
Tot
al T
axes
2011
Tot
al T
ax G
ap
2010
Tot
al T
ax G
ap
2010
- 2
011
Yorkton Residential $1,568 $1,331 $2,900
2.90 2.72 Commercial $5,950 $2,450 $8,400
North Battleford Residential $1,984 $1,331 $3,316
2.73 2.49 Commercial $6,596 $2,450 $9,046
Weyburn Residential $1,581 $1,331 $2,912
2.72 2.65 Commercial $5,482 $2,450 $7,932
Melville Residential $2,552 $1,331 $3,883
2.72 2.77 Commercial $8,107 $2,450 $10,557
Humboldt Residential $2,064 $1,331 $3,396
2.51 2.58 Commercial $6,084 $2,450 $8,534
Prince Albert Residential $2,394 $1,331 $3,725
2.31 2.13 Commercial $6,162 $2,450 $8,612
Swift Current Residential $1,334 $1,331 $2,665
2.22 2.57 Commercial $3,471 $2,450 $5,921
Meadow Lake Residential $2,396 $1,331 $3,727
2.10 2.08 Commercial $5,365 $2,450 $7,815
Estevan Residential $1,523 $1,331 $2,855
2.05 2.01 Commercial $3,416 $2,450 $5,866
Melfort Residential $2,801 $1,331 $4,133
2.03 2.02 Commercial $5,946 $2,450 $8,396
Moose Jaw Residential $1,840 $1,331 $3,171
1.98 1.94 Commercial $3,836 $2,450 $6,286
Regina Residential $1,833 $1,331 $3,165
1.90 1.86 Commercial $3,575 $2,450 $6,025
Saskatoon Residential $1,526 $1,331 $2,858
1.81 1.75 Commercial $2,715 $2,450 $5,165
Martensville Residential $1,681 $1,331 $3,012
1.69 1.66 Commercial $2,642 $2,450 $5,092
Average Residential $1,934 $1,331 $3,265
2.26 2.23 Commercial $4,953 $2,450 $7,403
gap worsened gap improved = gap same
Source: CFIB calculations based on 2011 property tax data from Government of Saskatchewan, Ministry of Government Relations.
Melville has highest total commercial tax bill, Martensville the lowest – 2nd year in a row
Wide variations in total tax bills also existed among Saskatchewan cities. In Melville, a commercial property owner paid $10,557 in total property taxes per $200,000 of assessed value while a residential property owner paid only $3,883. The next highest total commercial tax bills belonged to North Battleford, Prince Albert, Humboldt, Yorkton, and Melfort, ranging from $8,396 to $9,046 (see Table 14). Martensville stood on the opposite spectrum with the lowest total commercial property tax bill at $5,092, and Saskatoon with the next best at $5,165.
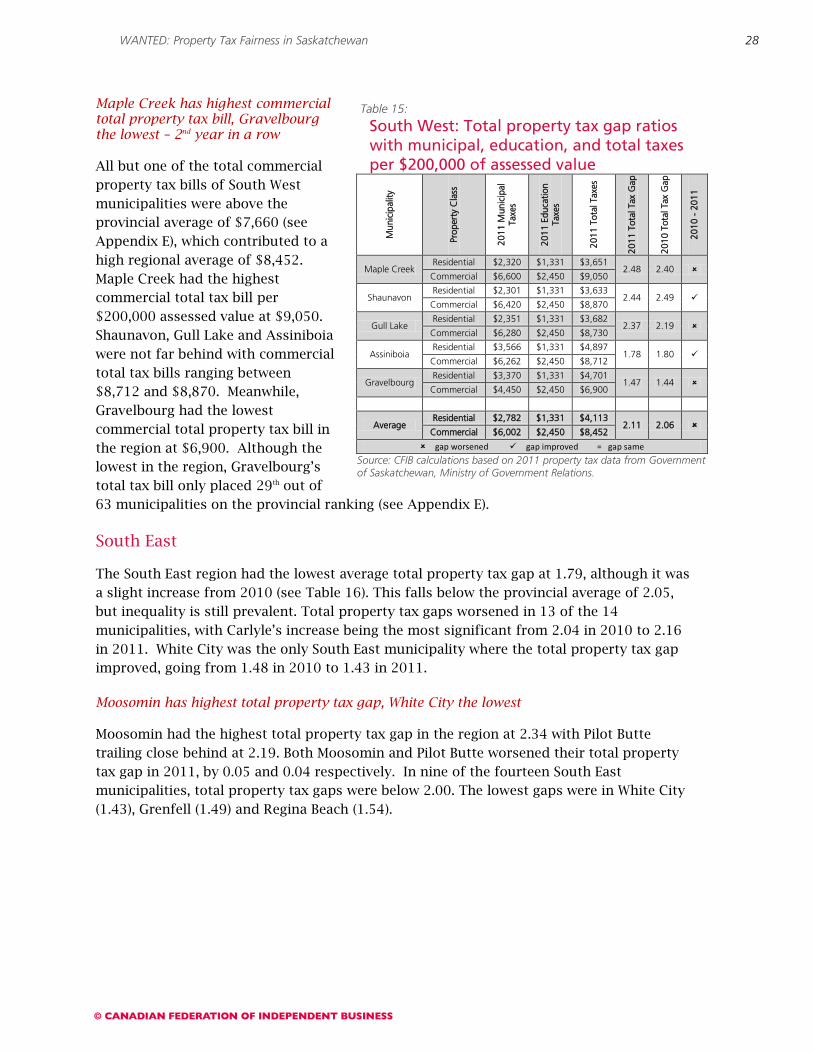
South West
Since 2010 there has been little progress in narrowing total property tax gaps in South West Saskatchewan. In fact, three of five municipalities widened their total property tax gaps in 2011 while the remaining two towns improved their tax ratios (see Table 15). This resulted in the average total property tax gap increasing from 2.06 to 2.11 which is just above the provincial average of 2.05 (see Appendix D).
Maple Creek has highest total property tax gap, Gravelbourg the lowest
With only five municipalities, the South West is the smallest region in CFIB’s review, but is still home to unequal taxation schemes. In 2011, Maple Creek commercial property owners paid 2.48 times the amount of total property taxes paid by residential property owners. Shaunavon and Gull Lake also had total property tax gaps well above 2.00. Assiniboia and Gravelbourg had lower total property tax gaps of 1.78 and 1.47, respectively; however businesses are still paying considerably more property taxes than residents.
WANTED: Property Tax Fairness in Saskatchewan
28
Maple Creek has highest commercial total property tax bill, Gravelbourg the lowest – 2nd year in a row
All but one of the total commercial property tax bills of South West municipalities were above the provincial average of $7,660 (see Appendix E), which contributed to a high regional average of $8,452. Maple Creek had the highest commercial total tax bill per $200,000 assessed value at $9,050. Shaunavon, Gull Lake and Assiniboia were not far behind with commercial total tax bills ranging between $8,712 and $8,870. Meanwhile, Gravelbourg had the lowest commercial total property tax bill in the region at $6,900. Although the lowest in the region, Gravelbourg’s total tax bill only placed 29th out of 63 municipalities on the provincial ranking (see Appendix E).
South East
The South East region had the lowest average total property tax gap at 1.79, although it was a slight increase from 2010 (see Table 16). This falls below the provincial average of 2.05, but inequality is still prevalent. Total property tax gaps worsened in 13 of the 14 municipalities, with Carlyle’s increase being the most significant from 2.04 in 2010 to 2.16 in 2011. White City was the only South East municipality where the total property tax gap improved, going from 1.48 in 2010 to 1.43 in 2011.
Moosomin has highest total property tax gap, White City the lowest
Moosomin had the highest total property tax gap in the region at 2.34 with Pilot Butte trailing close behind at 2.19. Both Moosomin and Pilot Butte worsened their total property tax gap in 2011, by 0.05 and 0.04 respectively. In nine of the fourteen South East municipalities, total property tax gaps were below 2.00. The lowest gaps were in White City (1.43), Grenfell (1.49) and Regina Beach (1.54).
Table 15:
South West: Total property tax gap ratios with municipal, education, and total taxes per $200,000 of assessed value
Mun
icip
ality
Prop
erty
Cla
ss
2011
Mun
icip
al
Taxe
s
2011
Edu
catio
n Ta
xes
2011
Tot
al T
axes
2011
Tot
al T
ax G
ap
2010
Tot
al T
ax G
ap
2010
- 2
011
Maple Creek Residential $2,320 $1,331 $3,651
2.48 2.40 Commercial $6,600 $2,450 $9,050
Shaunavon Residential $2,301 $1,331 $3,633
2.44 2.49 Commercial $6,420 $2,450 $8,870
Gull Lake Residential $2,351 $1,331 $3,682
2.37 2.19 Commercial $6,280 $2,450 $8,730
Assiniboia Residential $3,566 $1,331 $4,897
1.78 1.80 Commercial $6,262 $2,450 $8,712
Gravelbourg Residential $3,370 $1,331 $4,701
1.47 1.44 Commercial $4,450 $2,450 $6,900
Average Residential $2,782 $1,331 $4,113
2.11 2.06 Commercial $6,002 $2,450 $8,452
gap worsened gap improved = gap same
Source: CFIB calculations based on 2011 property tax data from Government of Saskatchewan, Ministry of Government Relations.
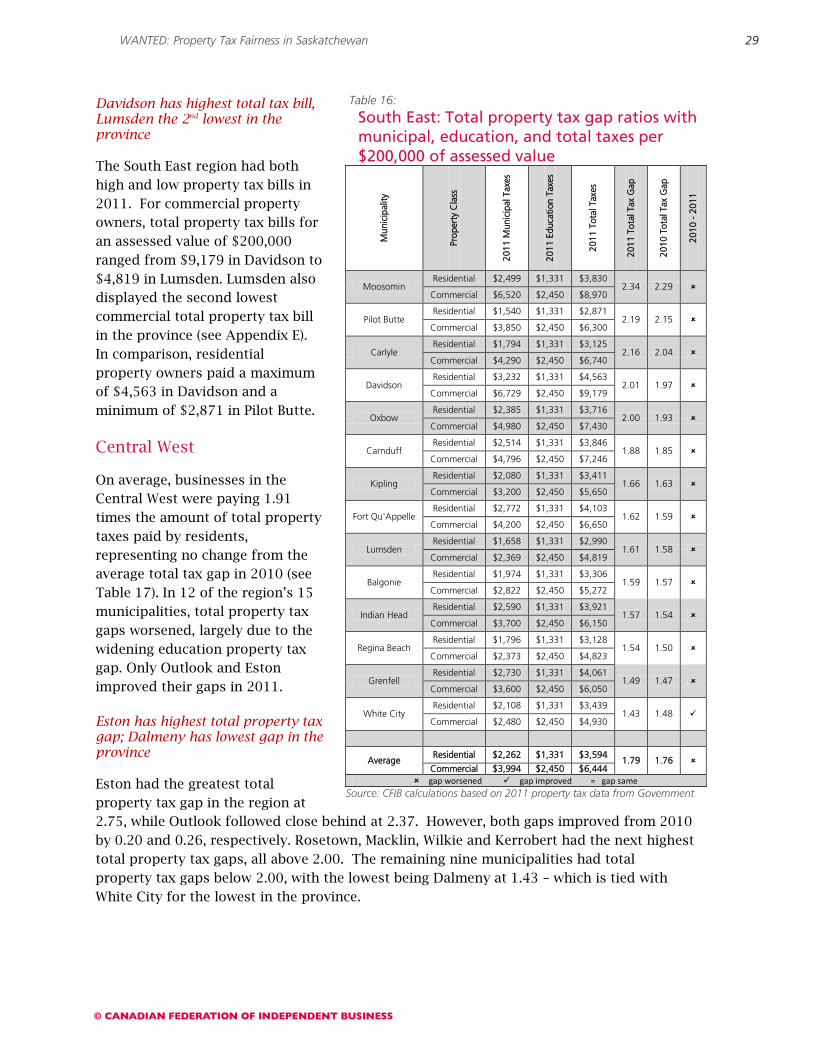
WANTED: Property Tax Fairness in Saskatchewan
29
Davidson has highest total tax bill, Lumsden the 2nd lowest in the province
The South East region had both high and low property tax bills in 2011. For commercial property owners, total property tax bills for an assessed value of $200,000 ranged from $9,179 in Davidson to $4,819 in Lumsden. Lumsden also displayed the second lowest commercial total property tax bill in the province (see Appendix E). In comparison, residential property owners paid a maximum of $4,563 in Davidson and a minimum of $2,871 in Pilot Butte.
Central West
On average, businesses in the Central West were paying 1.91 times the amount of total property taxes paid by residents, representing no change from the average total tax gap in 2010 (see Table 17). In 12 of the region’s 15 municipalities, total property tax gaps worsened, largely due to the widening education property tax gap. Only Outlook and Eston improved their gaps in 2011.
Eston has highest total property tax gap; Dalmeny has lowest gap in the province
Eston had the greatest total property tax gap in the region at 2.75, while Outlook followed close behind at 2.37. However, both gaps improved from 2010 by 0.20 and 0.26, respectively. Rosetown, Macklin, Wilkie and Kerrobert had the next highest total property tax gaps, all above 2.00. The remaining nine municipalities had total property tax gaps below 2.00, with the lowest being Dalmeny at 1.43 – which is tied with White City for the lowest in the province.
Table 16:
South East: Total property tax gap ratios with municipal, education, and total taxes per $200,000 of assessed value
Mun
icip
ality
Prop
erty
Cla
ss
2011
Mun
icip
al T
axes
2011
Edu
catio
n Ta
xes
2011
Tot
al T
axes
2011
Tot
al T
ax G
ap
2010
Tot
al T
ax G
ap
2010
- 2
011
Moosomin Residential $2,499 $1,331 $3,830
2.34 2.29 Commercial $6,520 $2,450 $8,970
Pilot Butte Residential $1,540 $1,331 $2,871
2.19 2.15 Commercial $3,850 $2,450 $6,300
Carlyle Residential $1,794 $1,331 $3,125
2.16 2.04 Commercial $4,290 $2,450 $6,740
Davidson Residential $3,232 $1,331 $4,563
2.01 1.97 Commercial $6,729 $2,450 $9,179
Oxbow Residential $2,385 $1,331 $3,716
2.00 1.93 Commercial $4,980 $2,450 $7,430
Carnduff Residential $2,514 $1,331 $3,846
1.88 1.85 Commercial $4,796 $2,450 $7,246
Kipling Residential $2,080 $1,331 $3,411
1.66 1.63 Commercial $3,200 $2,450 $5,650
Fort Qu'Appelle Residential $2,772 $1,331 $4,103
1.62 1.59 Commercial $4,200 $2,450 $6,650
Lumsden Residential $1,658 $1,331 $2,990
1.61 1.58 Commercial $2,369 $2,450 $4,819
Balgonie Residential $1,974 $1,331 $3,306
1.59 1.57 Commercial $2,822 $2,450 $5,272
Indian Head Residential $2,590 $1,331 $3,921
1.57 1.54 Commercial $3,700 $2,450 $6,150
Regina Beach Residential $1,796 $1,331 $3,128
1.54 1.50 Commercial $2,373 $2,450 $4,823
Grenfell Residential $2,730 $1,331 $4,061
1.49 1.47 Commercial $3,600 $2,450 $6,050
White City Residential $2,108 $1,331 $3,439
1.43 1.48 Commercial $2,480 $2,450 $4,930
Average Residential $2,262 $1,331 $3,594
1.79 1.76 Commercial $3,994 $2,450 $6,444
gap worsened gap improved = gap sameSource: CFIB calculations based on 2011 property tax data from Government
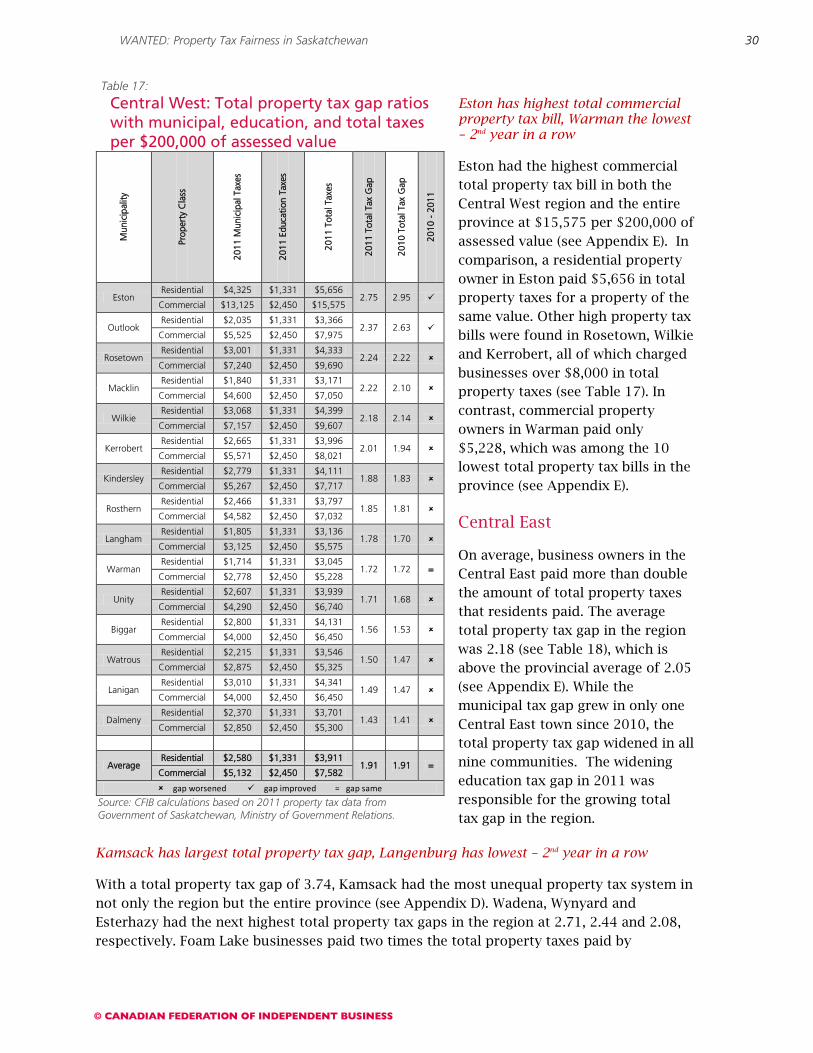
WANTED: Property Tax Fairness in Saskatchewan
30
Eston has highest total commercial property tax bill, Warman the lowest – 2nd year in a row
Eston had the highest commercial total property tax bill in both the Central West region and the entire province at $15,575 per $200,000 of assessed value (see Appendix E). In comparison, a residential property owner in Eston paid $5,656 in total property taxes for a property of the same value. Other high property tax bills were found in Rosetown, Wilkie and Kerrobert, all of which charged businesses over $8,000 in total property taxes (see Table 17). In contrast, commercial property owners in Warman paid only $5,228, which was among the 10 lowest total property tax bills in the province (see Appendix E).
Central East
On average, business owners in the Central East paid more than double the amount of total property taxes that residents paid. The average total property tax gap in the region was 2.18 (see Table 18), which is above the provincial average of 2.05 (see Appendix E). While the municipal tax gap grew in only one Central East town since 2010, the total property tax gap widened in all nine communities. The widening education tax gap in 2011 was responsible for the growing total tax gap in the region.
Kamsack has largest total property tax gap, Langenburg has lowest – 2nd year in a row
With a total property tax gap of 3.74, Kamsack had the most unequal property tax system in not only the region but the entire province (see Appendix D). Wadena, Wynyard and Esterhazy had the next highest total property tax gaps in the region at 2.71, 2.44 and 2.08, respectively. Foam Lake businesses paid two times the total property taxes paid by
Table 17:
Central West: Total property tax gap ratios with municipal, education, and total taxes per $200,000 of assessed value
Mun
icip
ality
Prop
erty
Cla
ss
2011
Mun
icip
al T
axes
2011
Edu
catio
n Ta
xes
2011
Tot
al T
axes
2011
Tot
al T
ax G
ap
2010
Tot
al T
ax G
ap
2010
- 2
011
Eston Residential $4,325 $1,331 $5,656
2.75 2.95 Commercial $13,125 $2,450 $15,575
Outlook Residential $2,035 $1,331 $3,366
2.37 2.63 Commercial $5,525 $2,450 $7,975
Rosetown Residential $3,001 $1,331 $4,333
2.24 2.22 Commercial $7,240 $2,450 $9,690
Macklin Residential $1,840 $1,331 $3,171
2.22 2.10 Commercial $4,600 $2,450 $7,050
Wilkie Residential $3,068 $1,331 $4,399
2.18 2.14 Commercial $7,157 $2,450 $9,607
Kerrobert Residential $2,665 $1,331 $3,996
2.01 1.94 Commercial $5,571 $2,450 $8,021
Kindersley Residential $2,779 $1,331 $4,111
1.88 1.83 Commercial $5,267 $2,450 $7,717
Rosthern Residential $2,466 $1,331 $3,797
1.85 1.81 Commercial $4,582 $2,450 $7,032
Langham Residential $1,805 $1,331 $3,136
1.78 1.70 Commercial $3,125 $2,450 $5,575
Warman Residential $1,714 $1,331 $3,045
1.72 1.72 = Commercial $2,778 $2,450 $5,228
Unity Residential $2,607 $1,331 $3,939
1.71 1.68 Commercial $4,290 $2,450 $6,740
Biggar Residential $2,800 $1,331 $4,131
1.56 1.53 Commercial $4,000 $2,450 $6,450
Watrous Residential $2,215 $1,331 $3,546
1.50 1.47 Commercial $2,875 $2,450 $5,325
Lanigan Residential $3,010 $1,331 $4,341
1.49 1.47 Commercial $4,000 $2,450 $6,450
Dalmeny Residential $2,370 $1,331 $3,701
1.43 1.41 Commercial $2,850 $2,450 $5,300
Average Residential $2,580 $1,331 $3,911
1.91 1.91 = Commercial $5,132 $2,450 $7,582
gap worsened gap improved = gap same
Source: CFIB calculations based on 2011 property tax data from Government of Saskatchewan, Ministry of Government Relations.
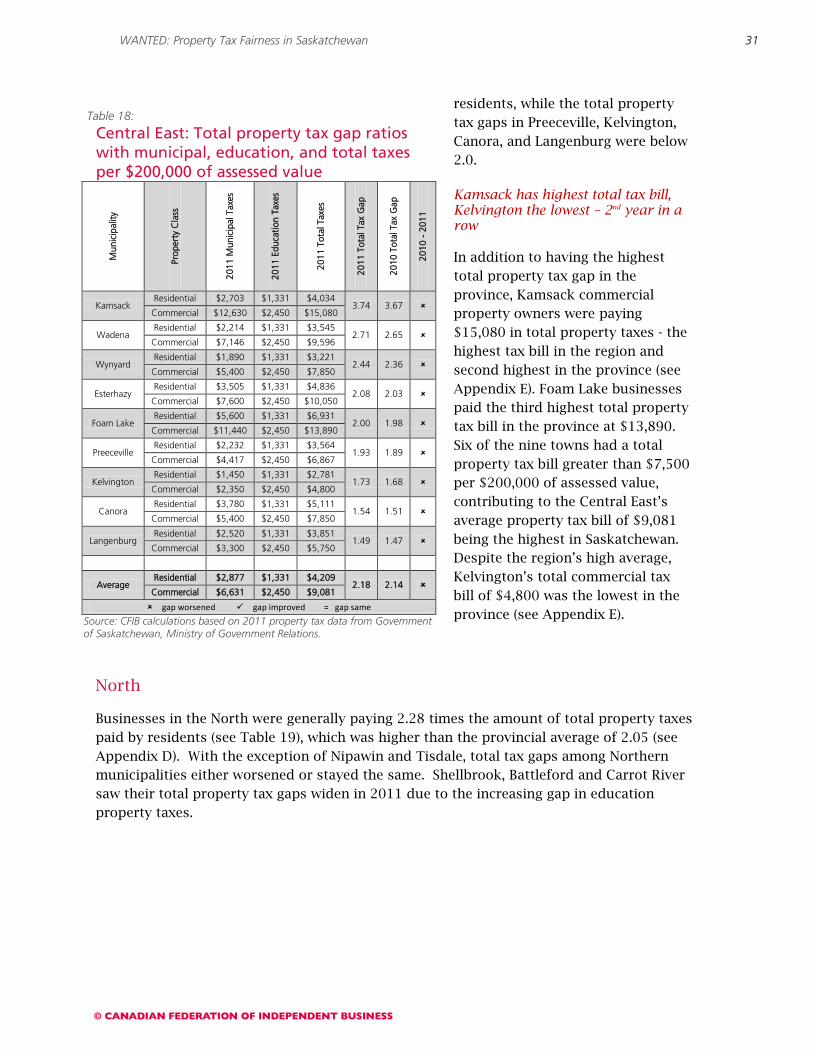
WANTED: Property Tax Fairness in Saskatchewan
31
residents, while the total property tax gaps in Preeceville, Kelvington, Canora, and Langenburg were below 2.0.
Kamsack has highest total tax bill, Kelvington the lowest – 2nd year in a row
In addition to having the highest total property tax gap in the province, Kamsack commercial property owners were paying $15,080 in total property taxes - the highest tax bill in the region and second highest in the province (see Appendix E). Foam Lake businesses paid the third highest total property tax bill in the province at $13,890. Six of the nine towns had a total property tax bill greater than $7,500 per $200,000 of assessed value, contributing to the Central East’s average property tax bill of $9,081 being the highest in Saskatchewan. Despite the region’s high average, Kelvington’s total commercial tax bill of $4,800 was the lowest in the province (see Appendix E).
North
Businesses in the North were generally paying 2.28 times the amount of total property taxes paid by residents (see Table 19), which was higher than the provincial average of 2.05 (see Appendix D). With the exception of Nipawin and Tisdale, total tax gaps among Northern municipalities either worsened or stayed the same. Shellbrook, Battleford and Carrot River saw their total property tax gaps widen in 2011 due to the increasing gap in education property taxes.
Table 18:
Central East: Total property tax gap ratios with municipal, education, and total taxes per $200,000 of assessed value
Mun
icip
ality
Prop
erty
Cla
ss
2011
Mun
icip
al T
axes
2011
Edu
catio
n Ta
xes
2011
Tot
al T
axes
2011
Tot
al T
ax G
ap
2010
Tot
al T
ax G
ap
2010
- 2
011
Kamsack Residential $2,703 $1,331 $4,034
3.74 3.67 Commercial $12,630 $2,450 $15,080
Wadena Residential $2,214 $1,331 $3,545
2.71 2.65 Commercial $7,146 $2,450 $9,596
Wynyard Residential $1,890 $1,331 $3,221
2.44 2.36 Commercial $5,400 $2,450 $7,850
Esterhazy Residential $3,505 $1,331 $4,836
2.08 2.03 Commercial $7,600 $2,450 $10,050
Foam Lake Residential $5,600 $1,331 $6,931
2.00 1.98 Commercial $11,440 $2,450 $13,890
Preeceville Residential $2,232 $1,331 $3,564
1.93 1.89 Commercial $4,417 $2,450 $6,867
Kelvington Residential $1,450 $1,331 $2,781
1.73 1.68 Commercial $2,350 $2,450 $4,800
Canora Residential $3,780 $1,331 $5,111
1.54 1.51 Commercial $5,400 $2,450 $7,850
Langenburg Residential $2,520 $1,331 $3,851
1.49 1.47 Commercial $3,300 $2,450 $5,750
Average Residential $2,877 $1,331 $4,209
2.18 2.14 Commercial $6,631 $2,450 $9,081
gap worsened gap improved = gap same
Source: CFIB calculations based on 2011 property tax data from Government of Saskatchewan, Ministry of Government Relations.

WANTED: Property Tax Fairness in Saskatchewan
32
Shellbrook has highest total property tax gap - 2nd year in a row, Hudson Bay the lowest
Shellbrook had the highest total property tax gap in the region at 2.82 with Tisdale trailing close behind at 2.72. Carrot River and Nipawin had the next widest total tax gaps at 2.35 and 2.29 respectively. Battleford and Hudson Bay had the lowest total tax gaps of 1.76 and 1.72.
Shellbrook has highest total tax bill, Hudson Bay the lowest – 2nd year in a row
The North, with an average total commercial property tax bill of $8,520, was above the provincial average of $7,660 (see Appendix E). This is due to municipalities with high commercial property tax bills such as Shellbrook at $12,440, Carrot River at $10,370 and Tisdale at $10,047. Commercial property owners in Hudson Bay paid the lowest total property tax bill in the region at $5,397 per $200,000 of assessed value. In comparison, residential property owners in the North paid anywhere from $3,107 in Battleford to $4,414 in Shellbrook in total property taxes for a property valued at $200,000.
Table 19:
North: Total property tax gap ratios with municipal, education, and total taxes per $200,000 of assessed value
Mun
icip
ality
Prop
erty
Cla
ss
2011
Mun
icip
al T
axes
2011
Edu
catio
n Ta
xes
2011
Tot
al T
axes
2011
Tot
al T
ax G
ap
2010
Tot
al T
ax G
ap
2010
- 2
011
Shellbrook Residential $3,082 $1,331 $4,414
2.82 2.77 Commercial $9,990 $2,450 $12,440
Tisdale Residential $2,359 $1,331 $3,690
2.72 2.76 Commercial $7,597 $2,450 $10,047
Carrot River Residential $3,080 $1,331 $4,411
2.35 2.31 Commercial $7,920 $2,450 $10,370
Nipawin Residential $1,901 $1,331 $3,233
2.29 2.32 Commercial $4,960 $2,450 $7,410
Battleford Residential $1,776 $1,331 $3,107
1.76 1.71 Commercial $3,008 $2,450 $5,458
Hudson Bay Residential $1,802 $1,331 $3,133
1.72 1.72 = Commercial $2,947 $2,450 $5,397
Average Residential $2,333 $1,331 $3,665
2.28 2.27 Commercial $6,070 $2,450 $8,520
gap worsened gap improved = gap same
Source: CFIB calculations based on 2011 property tax data from Government of Saskatchewan, Ministry of Government Relations.
WANTED: Property Tax Fairness in Saskatchewan
33
There is no justification for comparatively high taxation of businesses
Many people believe businesses should pay higher property taxes than residents and that the tax gap is warranted. It has been argued that businesses are more reliant on municipal services than residents; therefore, higher taxes on business are justified. It is also a commonly held view that businesses should pay more because they have a greater ability to pay and are able to deduct property taxes from income taxes. Unfortunately, these notions are false. It is important that CFIB sets the record straight, and lays out the facts:
Businesses do not consume more public services than residents
Businesses, especially small ones, actually use fewer services than homeowners. For example, a study done by MMK Consulting for the City of Vancouver shows non-residential taxpayers pay 55 per cent of property-based taxes, but consumed 24 per cent of local tax-supported services.17
The report’s analysis on the consumption of municipal services shows Vancouver residential properties consumed 73 per cent of police services (such as the work of the traffic, patrol and major crimes divisions) while businesses consumed 27 per cent of police services. It is reasonable to assume these ratios would be similar in Saskatchewan, particularly in major centers.
While residential properties pay $0.56 in property taxes for every dollar of tax-supported services consumed, non-residential properties pay approximately $2.42 in taxes for each dollar of service they consume.
Not all businesses have a greater capacity to pay – especially small business
A lasting, but inaccurate justification for imposing higher property taxes on businesses has been that they are better able to afford it. In reality, however, the business sector is not so easily characterized. Most Saskatchewan businesses are small businesses: 98.5 per cent of businesses are small18
The tax deductibility of property taxes does not level the playing field
(less than 100 employees) and contribute 35 per cent of Saskatchewan’s total GDP. Many small firms operate on very tight profit margins and when high property taxes squeeze these margins further, they have fewer resources to put back in the business. While businesses can affect profitability by changing product prices, most businesses do not have much control over price levels because they have to set them according to market conditions—often competing against products produced in lower taxed jurisdictions.
To argue that the deductability of property taxes justifies higher taxation assumes that all businesses are able to benefit from tax deductions. Businesses that are struggling, just breaking even, or losing money do not receive a deductibility “benefit.” Even if we assume
17 MMK Consulting, Consumption of Tax- Supported Municipal Services, January 2007 18 Statistics Canada, Business Register, December 2010
WANTED: Property Tax Fairness in Saskatchewan
34
that the ability to deduct property tax expenses gives business properties an advantage, it still does not account for the inequity between residential and business properties.
Consider a commercial property located in Swift Current worth $200,000. The owner would have paid $3,471 in taxes in 2011. Assuming the business earns less than $450,000 for the year (which most small businesses do), the effective income tax rate on this amount would be 13 per cent.19
The tax deduction on the $3,471 would be $451.23. Subtracting this from the property tax payable, the business owner is left paying $3,019.77. An equally valued residential property in Swift Current, without access to the deduction, pays $1,334 in property taxes. When the deduction is taken into account, commercial property owners are still paying 2.26 times more in property taxes than on a residential property, compared to 2.60 if the deduction is not taken into account.
19 Tax rate based on the Saskatchewan small business rate of 2 per cent and the federal small business rate of 11 per cent in 2011.
WANTED: Property Tax Fairness in Saskatchewan
35
Policy Recommendations
It is clear commercial taxpayers are subsidizing residential property owners, but the ability to reduce the property tax gap does not lie solely on one level of government. On the one hand, the provincial government sets the provincial percentage and education mill rate, and municipal governments are in control of the mill rate factors they impose on different property classes. Rather than pointing fingers, the provincial and municipal governments both contribute to the property tax gap, and it is also within both their abilities to reduce it. CFIB hopes the following suggestions will help rectify the inequities in Saskatchewan’s current property tax system:
Provincial Government Should:
1. Continue to finance a greater portion of education through general revenues by raising the commercial thresholds and lowering the commercial mill rates.
2. “Cap the Gap” – Because the property tax gap continues to exist without much concern by municipalities, the province must step in and show leadership. The province should cap the difference in the mill rate factor between residential and commercial properties and introduce a long-term strategy to phase out the use of mill rate factors all together.
3. Reject any proposal that would provide increased taxation powers to municipalities. While we recognize the fiscal pressures Canadian municipalities face, we are opposed to them gaining authority for new sources of revenue such as municipal fuel or hotel taxes; or even a sales or income tax. In the minds of business owners, many local politicians have not been able to use the property tax system fairly, so there is little trust that they could reasonably administer any additional taxes. It must be remembered that while there are three levels of government, there is only one taxpayer.
4. Reject calls for provincial tax increases to finance municipal infrastructure (e.g. Vehicle tax, province wide property tax levy on business and residential properties). An additional tax is unnecessary and governments should use the existing funds more efficiently and effectively.
Local Governments Should:
1. Develop and implement a plan over time to reduce the commercial- to- residential property tax gap.
2. Limit year- over- year spending growth to a maximum of inflation plus population growth and ensure the funds from the Province’s Municipal Operating Grant are used prudently. Recent spending by municipalities has exceeded levels necessary to keep pace with population and inflation growth. Local politicians should actively seek ways to deliver cost savings in the provision of municipal services.

WANTED: Property Tax Fairness in Saskatchewan
36
3. Review current programs and services with a view to identifying programs and service areas that can be eliminated, streamlined, contracted out to the private sector, or sold.
4. Introduce a plan to reduce the size and cost of the municipal civil service:
Introduce a plan to reduce the size of the civil service (primarily through attrition).
Develop a long-term strategy to narrow the wages/benefits disparity (21 per cent) between public and private sector employees.
5. Work toward additional revenue sharing, rather than new taxing authority or provincial tax increases to finance municipal infrastructure.
6. Consider the introduction of a base tax for all homeowners. Currently 45 of the 63 municipalities studied in this report have a base tax. When surveyed, 70 per cent of small business owners agree that a base tax for basic core services should be implemented for all homeowners. Local government services are enjoyed by all taxpayers and the costs must be shared by all taxpayers.
WANTED: Property Tax Fairness in Saskatchewan
37
Feedback on CFIB’s approach
CFIB’s property tax report puts a spotlight on property tax fairness, always garnering a great deal of attention from media outlets and municipal leaders across Saskatchewan. The feedback CFIB’s research has received makes it evident that the report is making a difference and having an impact on policy makers.
Following the release of both the 2009 and 2010 property tax reports, several municipal officials complimented CFIB for its research, citing the importance of fair taxation:
The Mayor of Battleford made big changes in response to CFIB’s report: The report ranked Battleford as 63rd out of 67 communities in the province in Saskatchewan for taxes unfair to business. “I took that to heart,” said Mayor Odishaw. He said he is determined to turn it around, saying “I never aspired to be 63rd out of 67.”… He noted the CFIB now ranks Battleford as 15 out of 63 reporting communities and the town is now considered one of the most business-friendly municipalities. The Battleford’s News-Optimist, May 11, 2012 City and town on a roll: mayors
The Mayor of Estevan was pleased his town had improved their property tax gap: "That is one of the things we wanted to do is make the ratio better," said Mayor St. Onge. "We wanted to lower it and we have gotten it down. Two times at least we raised residential and didn't raise commercial to try and get the ratio better." Estevan Mercury, Nov 23, 2011 Estevan taxes among provinces fairest: CFIB report
Melville reduces commercial taxes because of CFIB’s report: "We attacked the commercial tax because of CFIB's annual report in 2011 which stated Melville had the highest commercial municipal tax bill. The CFIB does this report every year, and every year Melville has the highest commercial taxes,” said Shannon Bell, Assistant City Treasurer. Melville Mayor Walter Streelasky also noted, “The CFIB report was a concern of ours. We don't like that reputation.", Melville Advance, January 25, 2012 Slight hike in Taxes
With each edition of the property tax report CFIB seeks to improve its methodology using feedback from the Ministry of Government Relations and municipal leaders:
The Mayor of Swift Current defends his city’s taxation policy: “There's more to the taxation picture for commercial business and residential taxation in communities than just the tax gap,” he emphasized. “One of the most important things whether it be a person or a corporation is the amount of tax they are paying, not necessarily so much the tax gap that exists.” Prairie Post, Nov 18, 2011 City of Swift Current disagrees with CFIB’s tax findings
CFIB’s property tax report highlights both property tax gaps and property tax bills, stressing the importance of both fairness and affordability. Other improvements include the independent analysis of municipal taxes and total taxes better highlights the separation between taxes imposed by the province and those by municipalities. Further strengthening the report was the inclusion of base taxes in calculating the municipal and total tax loads –
WANTED: Property Tax Fairness in Saskatchewan
38
which has been included since the 2009 property tax report. To ensure the accuracy of tax data, CFIB gathers information directly from municipal offices and cross references these numbers with the Mill Rate Survey collected by the Ministry of Government Relations. With each iteration of the property tax report, CFIB’s approach has been to address various feedback raised in the past.
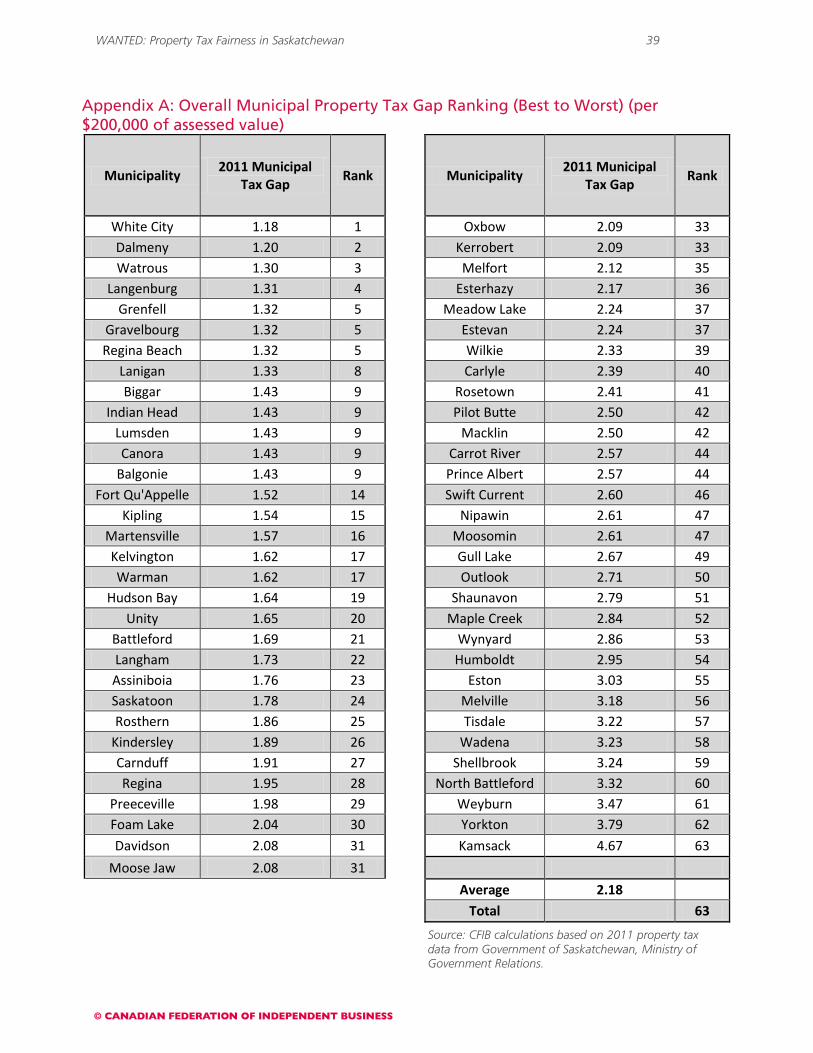
WANTED: Property Tax Fairness in Saskatchewan 39
Appendix A: Overall Municipal Property Tax Gap Ranking (Best to Worst) (per $200,000 of assessed value)
Municipality 2011 Municipal
Tax Gap Rank
Municipality 2011 Municipal
Tax Gap Rank
White City 1.18 1
Oxbow 2.09 33 Dalmeny 1.20 2
Kerrobert 2.09 33
Watrous 1.30 3
Melfort 2.12 35 Langenburg 1.31 4
Esterhazy 2.17 36
Grenfell 1.32 5
Meadow Lake 2.24 37 Gravelbourg 1.32 5
Estevan 2.24 37
Regina Beach 1.32 5
Wilkie 2.33 39 Lanigan 1.33 8
Carlyle 2.39 40
Biggar 1.43 9
Rosetown 2.41 41 Indian Head 1.43 9
Pilot Butte 2.50 42
Lumsden 1.43 9
Macklin 2.50 42 Canora 1.43 9
Carrot River 2.57 44
Balgonie 1.43 9
Prince Albert 2.57 44 Fort Qu'Appelle 1.52 14
Swift Current 2.60 46
Kipling 1.54 15
Nipawin 2.61 47 Martensville 1.57 16
Moosomin 2.61 47
Kelvington 1.62 17
Gull Lake 2.67 49 Warman 1.62 17
Outlook 2.71 50
Hudson Bay 1.64 19
Shaunavon 2.79 51 Unity 1.65 20
Maple Creek 2.84 52
Battleford 1.69 21
Wynyard 2.86 53 Langham 1.73 22
Humboldt 2.95 54
Assiniboia 1.76 23
Eston 3.03 55 Saskatoon 1.78 24
Melville 3.18 56
Rosthern 1.86 25
Tisdale 3.22 57 Kindersley 1.89 26
Wadena 3.23 58
Carnduff 1.91 27
Shellbrook 3.24 59 Regina 1.95 28
North Battleford 3.32 60
Preeceville 1.98 29
Weyburn 3.47 61 Foam Lake 2.04 30
Yorkton 3.79 62
Davidson 2.08 31
Kamsack 4.67 63
Moose Jaw 2.08 31
Average 2.18
Total 63
Source: CFIB calculations based on 2011 property tax data from Government of Saskatchewan, Ministry of Government Relations.

WANTED: Property Tax Fairness in Saskatchewan 40
Appendix B: Overall Municipal Commercial Property Tax Bill Ranking (Best to Worst) (per $200,000 of assessed value)
Municipality 2011 Municipal
Taxes -Commercial Rank
Municipality 2011 Municipal
Taxes -Commercial Rank
Kelvington $2,350 1
Nipawin $4,960 33 Lumsden $2,369 2
Oxbow $4,980 34
Regina Beach $2,373 3
Kindersley $5,267 35 White City $2,480 4
Meadow Lake $5,365 36
Martensville $2,642 5
Canora $5,400 37 Saskatoon $2,715 6
Wynyard $5,400 37
Warman $2,778 7
Weyburn $5,482 39 Balgonie $2,822 8
Outlook $5,525 40
Dalmeny $2,850 9
Kerrobert $5,571 41 Watrous $2,875 10
Melfort $5,946 42
Hudson Bay $2,947 11
Yorkton $5,950 43 Battleford $3,008 12
Humboldt $6,084 44
Langham $3,125 13
Prince Albert $6,162 45 Kipling $3,200 14
Assiniboia $6,262 46
Langenburg $3,300 15
Gull Lake $6,280 47 Estevan $3,416 16
Shaunavon $6,420 48
Swift Current $3,471 17
Moosomin $6,520 49 Regina $3,575 18
North Battleford $6,596 50
Grenfell $3,600 19
Maple Creek $6,600 51 Indian Head $3,700 20
Davidson $6,729 52
Moose Jaw $3,836 21
Wadena $7,146 53 Pilot Butte $3,850 22
Wilkie $7,157 54
Lanigan $4,000 23
Rosetown $7,240 55 Biggar $4,000 23
Tisdale $7,597 56
Fort Qu'Appelle $4,200 25
Esterhazy $7,600 57 Carlyle $4,290 26
Carrot River $7,920 58
Unity $4,290 26
Melville $8,107 59 Preeceville $4,417 28
Shellbrook $9,990 60
Gravelbourg $4,450 29
Foam Lake $11,440 61 Rosthern $4,582 30
Kamsack $12,630 62
Macklin $4,600 31
Eston $13,125 63
Carnduff $4,796 32
Average $5,212
Total 63
Source: CFIB calculations based on 2011 property tax data from Government of Saskatchewan, Ministry of Government Relations.

WANTED: Property Tax Fairness in Saskatchewan 41
Appendix C: Overall Municipal Property Tax Gap Change 2010 to 2011 (Best to Worst) (per $200,000 of assessed value)
Municipality 2010-2011
Municipal Tax Gap Change
Rank
Municipality 2010-2011
Municipal Tax Gap Change
Rank
Swift Current -1.44 1
Wilkie 0.00 27 Outlook -0.62 2
Canora 0.00 27
Eston -0.40 3
Foam Lake 0.00 27 Humboldt -0.27 4
Kamsack 0.00 27
Shaunavon -0.27 4
Wynyard 0.00 27 Tisdale -0.24 6
Battleford 0.00 27
Nipawin -0.19 7
Carrot River 0.00 27 Melville -0.19 7
Shellbrook 0.00 27
Pilot Butte -0.10 9
Regina 0.00 27 Warman -0.08 10
Weyburn 0.00 27
Hudson Bay -0.07 11
Langenburg 0.00 27 Assiniboia -0.07 11
Grenfell 0.00 27
White City -0.07 11
Rosthern 0.01 45 Meadow Lake -0.06 14
Watrous 0.01 45
Melfort -0.06 14
Gravelbourg 0.01 45 Rosetown -0.05 16
Kindersley 0.01 45
Wadena -0.03 17
Esterhazy 0.01 45 Estevan -0.03 17
Regina Beach 0.01 45
Moose Jaw -0.03 17
Maple Creek 0.01 45 Carnduff -0.02 20
Fort Qu'Appelle 0.02 52
Martensville -0.02 20
Kipling 0.02 52 Kelvington -0.01 22
Saskatoon 0.03 54
Balgonie -0.01 22
Oxbow 0.03 54 Preeceville -0.01 22
Kerrobert 0.03 54
Davidson -0.01 22
Langham 0.05 57 Dalmeny -0.01 22
Carlyle 0.09 58
Lanigan 0.00 27
Macklin 0.10 59 Biggar 0.00 27
Prince Albert 0.20 60
Indian Head 0.00 27
Gull Lake 0.21 61 Lumsden 0.00 27
Yorkton 0.22 62
Moosomin 0.00 27
North Battleford 0.33 63
Unity 0.00 27
Average -0.05
Total 63
Source: CFIB calculations based on 2011 property tax data from Government of Saskatchewan, Ministry of Government Relations.

WANTED: Property Tax Fairness in Saskatchewan 42
Appendix D: Overall Total Property Tax Gap Ranking (Best to Worst) (per $200,000 of assessed value)
Municipality 2011 Total Tax
Gap Rank
Municipality 2011 Total Tax
Gap Rank
Dalmeny 1.43 1
Kerrobert 2.01 33 White City 1.43 1
Davidson 2.01 33
Gravelbourg 1.47 3
Melfort 2.03 35 Lanigan 1.49 4
Estevan 2.05 36
Grenfell 1.49 4
Esterhazy 2.08 37 Langenburg 1.49 4
Meadow Lake 2.10 38
Watrous 1.50 7
Carlyle 2.16 39 Canora 1.54 8
Wilkie 2.18 40
Regina Beach 1.54 8
Pilot Butte 2.19 41 Biggar 1.56 10
Swift Current 2.22 42
Indian Head 1.57 11
Macklin 2.22 42 Balgonie 1.59 12
Rosetown 2.24 44
Lumsden 1.61 13
Nipawin 2.29 45 Fort Qu'Appelle 1.62 14
Prince Albert 2.31 46
Kipling 1.66 15
Moosomin 2.34 47 Martensville 1.69 16
Carrot River 2.35 48
Unity 1.71 17
Outlook 2.37 49 Hudson Bay 1.72 18
Gull Lake 2.37 49
Warman 1.72 18
Wynyard 2.44 51 Kelvington 1.73 20
Shaunavon 2.44 51
Battleford 1.76 21
Maple Creek 2.48 53 Langham 1.78 22
Humboldt 2.51 54
Assiniboia 1.78 22
Wadena 2.71 55 Saskatoon 1.81 24
Melville 2.72 56
Rosthern 1.85 25
Tisdale 2.72 56 Kindersley 1.88 26
Weyburn 2.72 56
Carnduff 1.88 26
North Battleford 2.73 59 Regina 1.90 28
Eston 2.75 60
Preeceville 1.93 29
Shellbrook 2.82 61 Moose Jaw 1.98 30
Yorkton 2.90 62
Oxbow 2.00 31
Kamsack 3.74 63
Foam Lake 2.00 31
Average 2.05
Total 63
Source: CFIB calculations based on 2011 property tax data from Government of Saskatchewan, Ministry of Government Relations.

WANTED: Property Tax Fairness in Saskatchewan 43
Appendix E: Overall Total Commercial Property Tax Bill Ranking (Best to Worst) (per $200,000 of assessed value)
Municipality 2011 Total Taxes -
Commercial Rank
Municipality 2011 Total Taxes -
Commercial Rank
Kelvington $4,800 1
Nipawin $7,410 33 Lumsden $4,819 2
Oxbow $7,430 34
Regina Beach $4,823 3
Kindersley $7,717 35 White City $4,930 4
Meadow Lake $7,815 36
Martensville $5,092 5
Canora $7,850 37 Saskatoon $5,165 6
Wynyard $7,850 37
Warman $5,228 7
Weyburn $7,932 39 Balgonie $5,272 8
Outlook $7,975 40
Dalmeny $5,300 9
Kerrobert $8,021 41 Watrous $5,325 10
Melfort $8,396 42
Hudson Bay $5,397 11
Yorkton $8,400 43 Battleford $5,458 12
Humboldt $8,534 44
Langham $5,575 13
Prince Albert $8,612 45 Kipling $5,650 14
Assiniboia $8,712 46
Langenburg $5,750 15
Gull Lake $8,730 47 Estevan $5,866 16
Shaunavon $8,870 48
Swift Current $5,921 17
Moosomin $8,970 49 Regina $6,025 18
North Battleford $9,046 50
Grenfell $6,050 19
Maple Creek $9,050 51 Indian Head $6,150 20
Davidson $9,179 52
Moose Jaw $6,286 21
Wadena $9,596 53 Pilot Butte $6,300 22
Wilkie $9,607 54
Lanigan $6,450 23
Rosetown $9,690 55 Biggar $6,450 23
Tisdale $10,047 56
Fort Qu'Appelle $6,650 25
Esterhazy $10,050 57 Carlyle $6,740 26
Carrot River $10,370 58
Unity $6,740 26
Melville $10,557 59 Preeceville $6,867 28
Shellbrook $12,440 60
Gravelbourg $6,900 29
Foam Lake $13,890 61 Rosthern $7,032 30
Kamsack $15,080 62
Macklin $7,050 31
Eston $15,575 63
Carnduff $7,246 32
Average $7,662
Total
63 Source: CFIB calculations based on 2011 property tax
data from Government of Saskatchewan, Ministry of Government Relations.

WANTED: Property Tax Fairness in Saskatchewan 44
Appendix F: Overall Total Property Tax Gap Change 2010 to 2011 (Best to Worst) (per $200,000 of assessed value)
Municipality 2010-2011 Total Tax Gap Change
Rank
Municipality 2010-2011 Total Tax Gap Change
Rank
Swift Current -0.35 1
Preeceville 0.04 32 Outlook -0.26 2
Davidson 0.04 32
Eston -0.20 3
Wilkie 0.04 32 Humboldt -0.07 4
Regina Beach 0.04 32
Melville -0.05 5
Rosthern 0.04 32 Shaunavon -0.05 5
Carrot River 0.04 32
White City -0.05 5
Moose Jaw 0.04 32 Tisdale -0.04 8
Pilot Butte 0.04 32
Nipawin -0.03 9
Estevan 0.04 32 Assiniboia -0.02 10
Regina 0.04 32
Hudson Bay 0.00 11
Battleford 0.05 43 Warman 0.00 11
Esterhazy 0.05 43
Melfort 0.01 13
Kindersley 0.05 43 Rosetown 0.02 14
Moosomin 0.05 43
Meadow Lake 0.02 14
Kelvington 0.05 43 Lanigan 0.02 14
Shellbrook 0.05 43
Dalmeny 0.02 14
Wadena 0.06 49 Grenfell 0.02 14
Saskatoon 0.06 49
Langenburg 0.02 14
Oxbow 0.07 51 Foam Lake 0.02 14
Kerrobert 0.07 51
Balgonie 0.02 14
Kamsack 0.07 51 Gravelbourg 0.03 22
Weyburn 0.07 51
Kipling 0.03 22
Langham 0.08 55 Lumsden 0.03 22
Wynyard 0.08 55
Canora 0.03 22
Maple Creek 0.08 55 Biggar 0.03 22
Carlyle 0.12 58
Carnduff 0.03 22
Macklin 0.12 58 Indian Head 0.03 22
Gull Lake 0.18 60
Martensville 0.03 22
Prince Albert 0.18 60 Unity 0.03 22
Yorkton 0.18 60
Fort Qu'Appelle 0.03 22
North Battleford 0.24 63
Watrous 0.04 32
Average 0.03
Total
63
Source: CFIB calculations based on 2011 property tax data from Government of Saskatchewan, Ministry of Government Relations.
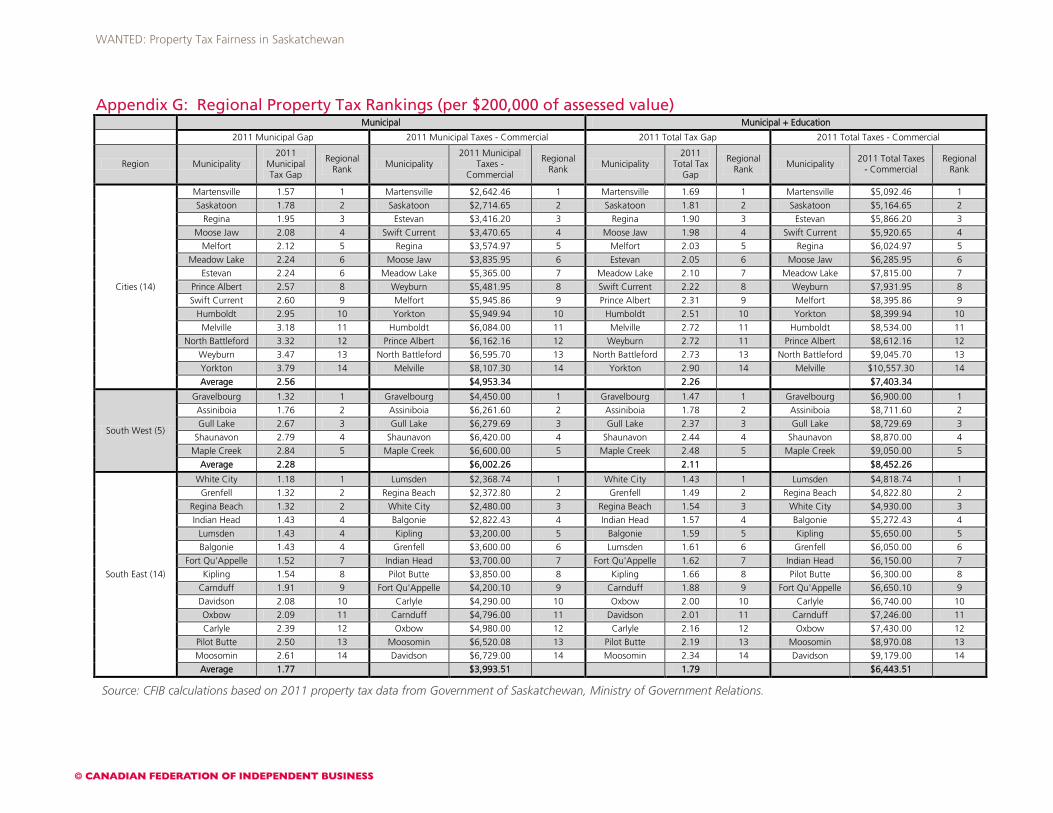
WANTED: Property Tax Fairness in Saskatchewan
Appendix G: Regional Property Tax Rankings (per $200,000 of assessed value)
Municipal Municipal + Education
2011 Municipal Gap 2011 Municipal Taxes - Commercial 2011 Total Tax Gap 2011 Total Taxes - Commercial
Region Municipality 2011
Municipal Tax Gap
Regional Rank
Municipality 2011 Municipal
Taxes - Commercial
Regional Rank
Municipality 2011
Total Tax Gap
Regional Rank
Municipality 2011 Total Taxes
- Commercial Regional
Rank
Cities (14)
Martensville 1.57 1 Martensville $2,642.46 1 Martensville 1.69 1 Martensville $5,092.46 1
Saskatoon 1.78 2 Saskatoon $2,714.65 2 Saskatoon 1.81 2 Saskatoon $5,164.65 2
Regina 1.95 3 Estevan $3,416.20 3 Regina 1.90 3 Estevan $5,866.20 3
Moose Jaw 2.08 4 Swift Current $3,470.65 4 Moose Jaw 1.98 4 Swift Current $5,920.65 4
Melfort 2.12 5 Regina $3,574.97 5 Melfort 2.03 5 Regina $6,024.97 5
Meadow Lake 2.24 6 Moose Jaw $3,835.95 6 Estevan 2.05 6 Moose Jaw $6,285.95 6
Estevan 2.24 6 Meadow Lake $5,365.00 7 Meadow Lake 2.10 7 Meadow Lake $7,815.00 7
Prince Albert 2.57 8 Weyburn $5,481.95 8 Swift Current 2.22 8 Weyburn $7,931.95 8
Swift Current 2.60 9 Melfort $5,945.86 9 Prince Albert 2.31 9 Melfort $8,395.86 9
Humboldt 2.95 10 Yorkton $5,949.94 10 Humboldt 2.51 10 Yorkton $8,399.94 10
Melville 3.18 11 Humboldt $6,084.00 11 Melville 2.72 11 Humboldt $8,534.00 11
North Battleford 3.32 12 Prince Albert $6,162.16 12 Weyburn 2.72 11 Prince Albert $8,612.16 12
Weyburn 3.47 13 North Battleford $6,595.70 13 North Battleford 2.73 13 North Battleford $9,045.70 13
Yorkton 3.79 14 Melville $8,107.30 14 Yorkton 2.90 14 Melville $10,557.30 14
Average 2.56
$4,953.34
2.26
$7,403.34
South West (5)
Gravelbourg 1.32 1 Gravelbourg $4,450.00 1 Gravelbourg 1.47 1 Gravelbourg $6,900.00 1
Assiniboia 1.76 2 Assiniboia $6,261.60 2 Assiniboia 1.78 2 Assiniboia $8,711.60 2
Gull Lake 2.67 3 Gull Lake $6,279.69 3 Gull Lake 2.37 3 Gull Lake $8,729.69 3
Shaunavon 2.79 4 Shaunavon $6,420.00 4 Shaunavon 2.44 4 Shaunavon $8,870.00 4
Maple Creek 2.84 5 Maple Creek $6,600.00 5 Maple Creek 2.48 5 Maple Creek $9,050.00 5
Average 2.28
$6,002.26
2.11
$8,452.26
South East (14)
White City 1.18 1 Lumsden $2,368.74 1 White City 1.43 1 Lumsden $4,818.74 1
Grenfell 1.32 2 Regina Beach $2,372.80 2 Grenfell 1.49 2 Regina Beach $4,822.80 2
Regina Beach 1.32 2 White City $2,480.00 3 Regina Beach 1.54 3 White City $4,930.00 3
Indian Head 1.43 4 Balgonie $2,822.43 4 Indian Head 1.57 4 Balgonie $5,272.43 4
Lumsden 1.43 4 Kipling $3,200.00 5 Balgonie 1.59 5 Kipling $5,650.00 5
Balgonie 1.43 4 Grenfell $3,600.00 6 Lumsden 1.61 6 Grenfell $6,050.00 6
Fort Qu'Appelle 1.52 7 Indian Head $3,700.00 7 Fort Qu'Appelle 1.62 7 Indian Head $6,150.00 7
Kipling 1.54 8 Pilot Butte $3,850.00 8 Kipling 1.66 8 Pilot Butte $6,300.00 8
Carnduff 1.91 9 Fort Qu'Appelle $4,200.10 9 Carnduff 1.88 9 Fort Qu'Appelle $6,650.10 9
Davidson 2.08 10 Carlyle $4,290.00 10 Oxbow 2.00 10 Carlyle $6,740.00 10
Oxbow 2.09 11 Carnduff $4,796.00 11 Davidson 2.01 11 Carnduff $7,246.00 11
Carlyle 2.39 12 Oxbow $4,980.00 12 Carlyle 2.16 12 Oxbow $7,430.00 12
Pilot Butte 2.50 13 Moosomin $6,520.08 13 Pilot Butte 2.19 13 Moosomin $8,970.08 13
Moosomin 2.61 14 Davidson $6,729.00 14 Moosomin 2.34 14 Davidson $9,179.00 14
Average 1.77
$3,993.51
1.79
$6,443.51
Source: CFIB calculations based on 2011 property tax data from Government of Saskatchewan, Ministry of Government Relations.
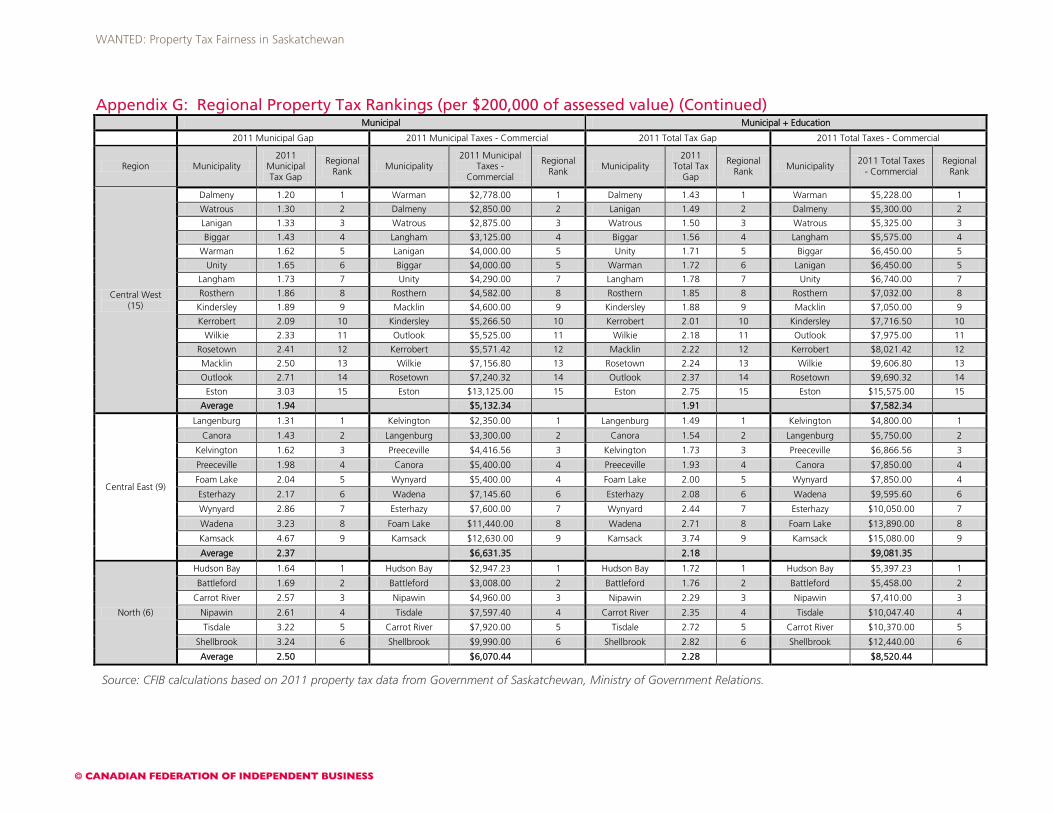
WANTED: Property Tax Fairness in Saskatchewan
Appendix G: Regional Property Tax Rankings (per $200,000 of assessed value) (Continued) Municipal Municipal + Education
2011 Municipal Gap 2011 Municipal Taxes - Commercial 2011 Total Tax Gap 2011 Total Taxes - Commercial
Region Municipality 2011
Municipal Tax Gap
Regional Rank
Municipality 2011 Municipal
Taxes - Commercial
Regional Rank
Municipality 2011
Total Tax Gap
Regional Rank
Municipality 2011 Total Taxes
- Commercial Regional
Rank
Central West (15)
Dalmeny 1.20 1 Warman $2,778.00 1 Dalmeny 1.43 1 Warman $5,228.00 1
Watrous 1.30 2 Dalmeny $2,850.00 2 Lanigan 1.49 2 Dalmeny $5,300.00 2
Lanigan 1.33 3 Watrous $2,875.00 3 Watrous 1.50 3 Watrous $5,325.00 3
Biggar 1.43 4 Langham $3,125.00 4 Biggar 1.56 4 Langham $5,575.00 4
Warman 1.62 5 Lanigan $4,000.00 5 Unity 1.71 5 Biggar $6,450.00 5
Unity 1.65 6 Biggar $4,000.00 5 Warman 1.72 6 Lanigan $6,450.00 5
Langham 1.73 7 Unity $4,290.00 7 Langham 1.78 7 Unity $6,740.00 7
Rosthern 1.86 8 Rosthern $4,582.00 8 Rosthern 1.85 8 Rosthern $7,032.00 8
Kindersley 1.89 9 Macklin $4,600.00 9 Kindersley 1.88 9 Macklin $7,050.00 9
Kerrobert 2.09 10 Kindersley $5,266.50 10 Kerrobert 2.01 10 Kindersley $7,716.50 10
Wilkie 2.33 11 Outlook $5,525.00 11 Wilkie 2.18 11 Outlook $7,975.00 11
Rosetown 2.41 12 Kerrobert $5,571.42 12 Macklin 2.22 12 Kerrobert $8,021.42 12
Macklin 2.50 13 Wilkie $7,156.80 13 Rosetown 2.24 13 Wilkie $9,606.80 13
Outlook 2.71 14 Rosetown $7,240.32 14 Outlook 2.37 14 Rosetown $9,690.32 14
Eston 3.03 15 Eston $13,125.00 15 Eston 2.75 15 Eston $15,575.00 15
Average 1.94
$5,132.34
1.91
$7,582.34
Central East (9)
Langenburg 1.31 1 Kelvington $2,350.00 1 Langenburg 1.49 1 Kelvington $4,800.00 1
Canora 1.43 2 Langenburg $3,300.00 2 Canora 1.54 2 Langenburg $5,750.00 2
Kelvington 1.62 3 Preeceville $4,416.56 3 Kelvington 1.73 3 Preeceville $6,866.56 3
Preeceville 1.98 4 Canora $5,400.00 4 Preeceville 1.93 4 Canora $7,850.00 4
Foam Lake 2.04 5 Wynyard $5,400.00 4 Foam Lake 2.00 5 Wynyard $7,850.00 4
Esterhazy 2.17 6 Wadena $7,145.60 6 Esterhazy 2.08 6 Wadena $9,595.60 6
Wynyard 2.86 7 Esterhazy $7,600.00 7 Wynyard 2.44 7 Esterhazy $10,050.00 7
Wadena 3.23 8 Foam Lake $11,440.00 8 Wadena 2.71 8 Foam Lake $13,890.00 8
Kamsack 4.67 9 Kamsack $12,630.00 9 Kamsack 3.74 9 Kamsack $15,080.00 9
Average 2.37
$6,631.35
2.18
$9,081.35
North (6)
Hudson Bay 1.64 1 Hudson Bay $2,947.23 1 Hudson Bay 1.72 1 Hudson Bay $5,397.23 1
Battleford 1.69 2 Battleford $3,008.00 2 Battleford 1.76 2 Battleford $5,458.00 2
Carrot River 2.57 3 Nipawin $4,960.00 3 Nipawin 2.29 3 Nipawin $7,410.00 3
Nipawin 2.61 4 Tisdale $7,597.40 4 Carrot River 2.35 4 Tisdale $10,047.40 4
Tisdale 3.22 5 Carrot River $7,920.00 5 Tisdale 2.72 5 Carrot River $10,370.00 5
Shellbrook 3.24 6 Shellbrook $9,990.00 6 Shellbrook 2.82 6 Shellbrook $12,440.00 6
Average 2.50
$6,070.44
2.28
$8,520.44
Source: CFIB calculations based on 2011 property tax data from Government of Saskatchewan, Ministry of Government Relations.
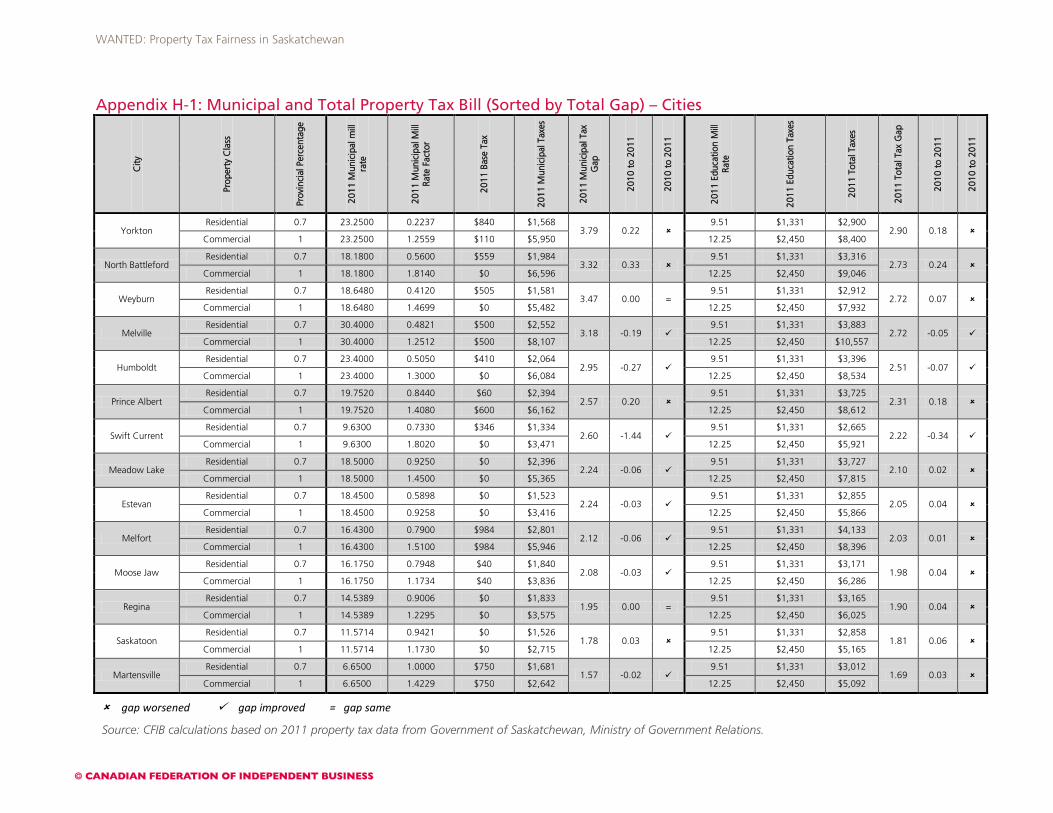
WANTED: Property Tax Fairness in Saskatchewan
Appendix H-1: Municipal and Total Property Tax Bill (Sorted by Total Gap) – Cities
City
Prop
erty
Cla
ss
Prov
inci
al P
erce
ntag
e
2011
Mun
icip
al m
ill
rate
2011
Mun
icip
al M
ill
Rate
Fac
tor
2011
Bas
e Ta
x
2011
Mun
icip
al T
axes
2011
Mun
icip
al T
ax
Gap
2010
to
2011
2010
to
2011
2011
Edu
catio
n M
ill
Rate
2011
Edu
catio
n Ta
xes
2011
Tot
al T
axes
2011
Tot
al T
ax G
ap
2010
to
2011
2010
to
2011
Yorkton Residential 0.7 23.2500 0.2237 $840 $1,568
3.79 0.22 9.51 $1,331 $2,900
2.90 0.18 Commercial 1 23.2500 1.2559 $110 $5,950 12.25 $2,450 $8,400
North Battleford Residential 0.7 18.1800 0.5600 $559 $1,984
3.32 0.33 9.51 $1,331 $3,316
2.73 0.24 Commercial 1 18.1800 1.8140 $0 $6,596 12.25 $2,450 $9,046
Weyburn Residential 0.7 18.6480 0.4120 $505 $1,581
3.47 0.00 = 9.51 $1,331 $2,912
2.72 0.07 Commercial 1 18.6480 1.4699 $0 $5,482 12.25 $2,450 $7,932
Melville Residential 0.7 30.4000 0.4821 $500 $2,552
3.18 -0.19 9.51 $1,331 $3,883
2.72 -0.05 Commercial 1 30.4000 1.2512 $500 $8,107 12.25 $2,450 $10,557
Humboldt Residential 0.7 23.4000 0.5050 $410 $2,064
2.95 -0.27 9.51 $1,331 $3,396
2.51 -0.07 Commercial 1 23.4000 1.3000 $0 $6,084 12.25 $2,450 $8,534
Prince Albert Residential 0.7 19.7520 0.8440 $60 $2,394
2.57 0.20 9.51 $1,331 $3,725
2.31 0.18 Commercial 1 19.7520 1.4080 $600 $6,162 12.25 $2,450 $8,612
Swift Current Residential 0.7 9.6300 0.7330 $346 $1,334
2.60 -1.44 9.51 $1,331 $2,665
2.22 -0.34 Commercial 1 9.6300 1.8020 $0 $3,471 12.25 $2,450 $5,921
Meadow Lake Residential 0.7 18.5000 0.9250 $0 $2,396
2.24 -0.06 9.51 $1,331 $3,727
2.10 0.02 Commercial 1 18.5000 1.4500 $0 $5,365 12.25 $2,450 $7,815
Estevan Residential 0.7 18.4500 0.5898 $0 $1,523
2.24 -0.03 9.51 $1,331 $2,855
2.05 0.04 Commercial 1 18.4500 0.9258 $0 $3,416 12.25 $2,450 $5,866
Melfort Residential 0.7 16.4300 0.7900 $984 $2,801
2.12 -0.06 9.51 $1,331 $4,133
2.03 0.01 Commercial 1 16.4300 1.5100 $984 $5,946 12.25 $2,450 $8,396
Moose Jaw Residential 0.7 16.1750 0.7948 $40 $1,840
2.08 -0.03 9.51 $1,331 $3,171
1.98 0.04 Commercial 1 16.1750 1.1734 $40 $3,836 12.25 $2,450 $6,286
Regina Residential 0.7 14.5389 0.9006 $0 $1,833
1.95 0.00 = 9.51 $1,331 $3,165
1.90 0.04 Commercial 1 14.5389 1.2295 $0 $3,575 12.25 $2,450 $6,025
Saskatoon Residential 0.7 11.5714 0.9421 $0 $1,526
1.78 0.03 9.51 $1,331 $2,858
1.81 0.06 Commercial 1 11.5714 1.1730 $0 $2,715 12.25 $2,450 $5,165
Martensville Residential 0.7 6.6500 1.0000 $750 $1,681
1.57 -0.02 9.51 $1,331 $3,012
1.69 0.03 Commercial 1 6.6500 1.4229 $750 $2,642 12.25 $2,450 $5,092
gap worsened gap improved = gap same
Source: CFIB calculations based on 2011 property tax data from Government of Saskatchewan, Ministry of Government Relations.
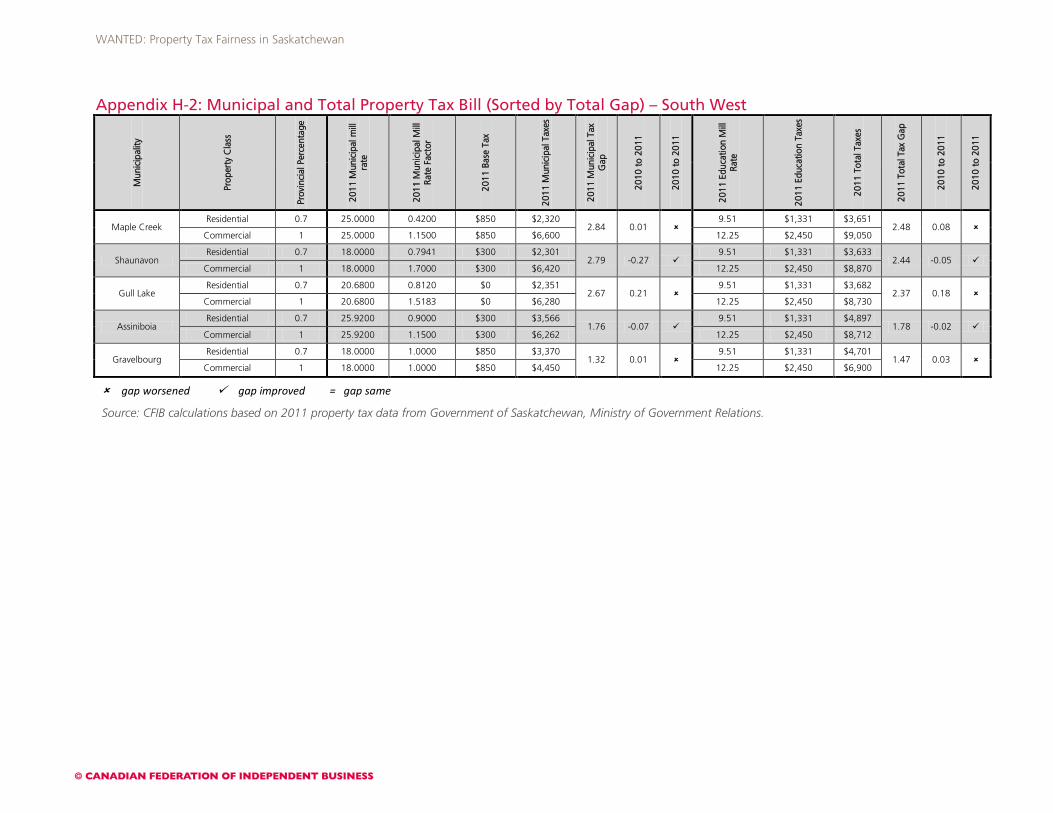
WANTED: Property Tax Fairness in Saskatchewan
Appendix H-2: Municipal and Total Property Tax Bill (Sorted by Total Gap) – South West
Mun
icip
ality
Prop
erty
Cla
ss
Prov
inci
al P
erce
ntag
e
2011
Mun
icip
al m
ill
rate
2011
Mun
icip
al M
ill
Rate
Fac
tor
2011
Bas
e Ta
x
2011
Mun
icip
al T
axes
2011
Mun
icip
al T
ax
Gap
2010
to
2011
2010
to
2011
2011
Edu
catio
n M
ill
Rate
2011
Edu
catio
n Ta
xes
2011
Tot
al T
axes
2011
Tot
al T
ax G
ap
2010
to
2011
2010
to
2011
Maple Creek Residential 0.7 25.0000 0.4200 $850 $2,320
2.84 0.01 9.51 $1,331 $3,651
2.48 0.08 Commercial 1 25.0000 1.1500 $850 $6,600 12.25 $2,450 $9,050
Shaunavon Residential 0.7 18.0000 0.7941 $300 $2,301
2.79 -0.27 9.51 $1,331 $3,633
2.44 -0.05 Commercial 1 18.0000 1.7000 $300 $6,420 12.25 $2,450 $8,870
Gull Lake Residential 0.7 20.6800 0.8120 $0 $2,351
2.67 0.21 9.51 $1,331 $3,682
2.37 0.18 Commercial 1 20.6800 1.5183 $0 $6,280 12.25 $2,450 $8,730
Assiniboia Residential 0.7 25.9200 0.9000 $300 $3,566
1.76 -0.07 9.51 $1,331 $4,897
1.78 -0.02 Commercial 1 25.9200 1.1500 $300 $6,262 12.25 $2,450 $8,712
Gravelbourg Residential 0.7 18.0000 1.0000 $850 $3,370
1.32 0.01 9.51 $1,331 $4,701
1.47 0.03 Commercial 1 18.0000 1.0000 $850 $4,450 12.25 $2,450 $6,900
gap worsened gap improved = gap same
Source: CFIB calculations based on 2011 property tax data from Government of Saskatchewan, Ministry of Government Relations.
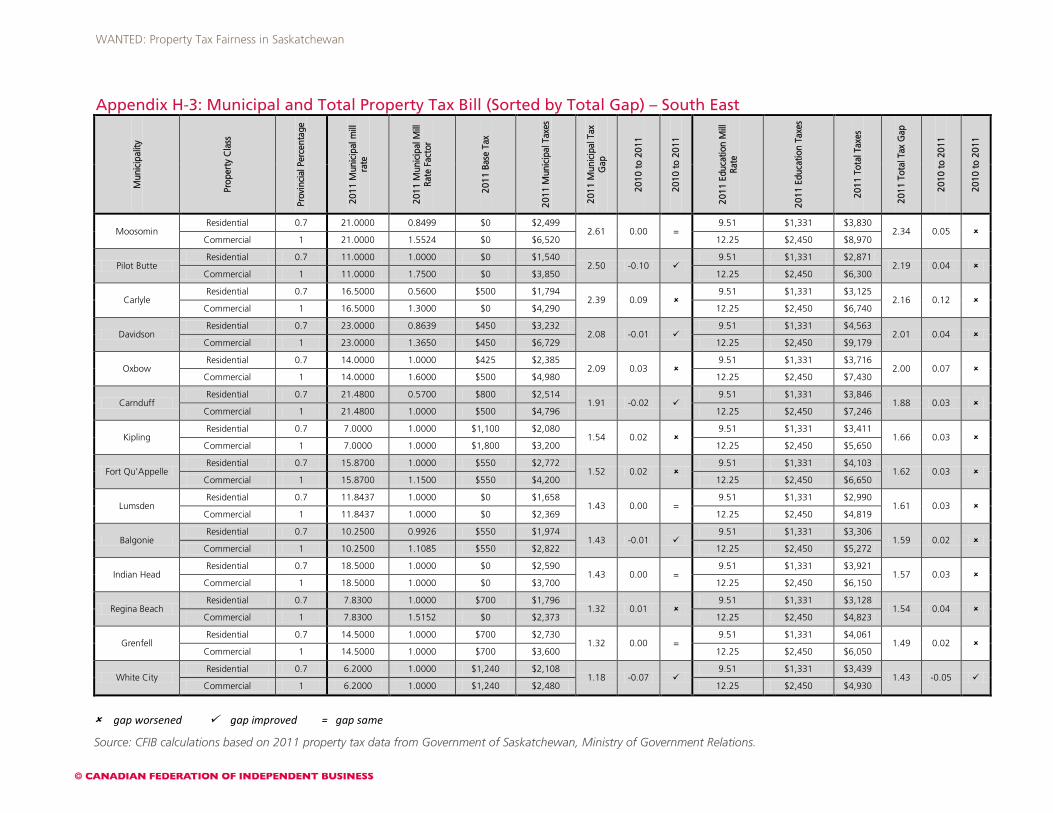
WANTED: Property Tax Fairness in Saskatchewan
Appendix H-3: Municipal and Total Property Tax Bill (Sorted by Total Gap) – South East
Mun
icip
ality
Prop
erty
Cla
ss
Prov
inci
al P
erce
ntag
e
2011
Mun
icip
al m
ill
rate
2011
Mun
icip
al M
ill
Rate
Fac
tor
2011
Bas
e Ta
x
2011
Mun
icip
al T
axes
2011
Mun
icip
al T
ax
Gap
2010
to
2011
2010
to
2011
2011
Edu
catio
n M
ill
Rate
2011
Edu
catio
n Ta
xes
2011
Tot
al T
axes
2011
Tot
al T
ax G
ap
2010
to
2011
2010
to
2011
Moosomin Residential 0.7 21.0000 0.8499 $0 $2,499
2.61 0.00 = 9.51 $1,331 $3,830
2.34 0.05 Commercial 1 21.0000 1.5524 $0 $6,520 12.25 $2,450 $8,970
Pilot Butte Residential 0.7 11.0000 1.0000 $0 $1,540
2.50 -0.10 9.51 $1,331 $2,871
2.19 0.04 Commercial 1 11.0000 1.7500 $0 $3,850 12.25 $2,450 $6,300
Carlyle Residential 0.7 16.5000 0.5600 $500 $1,794
2.39 0.09 9.51 $1,331 $3,125
2.16 0.12 Commercial 1 16.5000 1.3000 $0 $4,290 12.25 $2,450 $6,740
Davidson Residential 0.7 23.0000 0.8639 $450 $3,232
2.08 -0.01 9.51 $1,331 $4,563
2.01 0.04 Commercial 1 23.0000 1.3650 $450 $6,729 12.25 $2,450 $9,179
Oxbow Residential 0.7 14.0000 1.0000 $425 $2,385
2.09 0.03 9.51 $1,331 $3,716
2.00 0.07 Commercial 1 14.0000 1.6000 $500 $4,980 12.25 $2,450 $7,430
Carnduff Residential 0.7 21.4800 0.5700 $800 $2,514
1.91 -0.02 9.51 $1,331 $3,846
1.88 0.03 Commercial 1 21.4800 1.0000 $500 $4,796 12.25 $2,450 $7,246
Kipling Residential 0.7 7.0000 1.0000 $1,100 $2,080
1.54 0.02 9.51 $1,331 $3,411
1.66 0.03 Commercial 1 7.0000 1.0000 $1,800 $3,200 12.25 $2,450 $5,650
Fort Qu'Appelle Residential 0.7 15.8700 1.0000 $550 $2,772
1.52 0.02 9.51 $1,331 $4,103
1.62 0.03 Commercial 1 15.8700 1.1500 $550 $4,200 12.25 $2,450 $6,650
Lumsden Residential 0.7 11.8437 1.0000 $0 $1,658
1.43 0.00 = 9.51 $1,331 $2,990
1.61 0.03 Commercial 1 11.8437 1.0000 $0 $2,369 12.25 $2,450 $4,819
Balgonie Residential 0.7 10.2500 0.9926 $550 $1,974
1.43 -0.01 9.51 $1,331 $3,306
1.59 0.02 Commercial 1 10.2500 1.1085 $550 $2,822 12.25 $2,450 $5,272
Indian Head Residential 0.7 18.5000 1.0000 $0 $2,590
1.43 0.00 = 9.51 $1,331 $3,921
1.57 0.03 Commercial 1 18.5000 1.0000 $0 $3,700 12.25 $2,450 $6,150
Regina Beach Residential 0.7 7.8300 1.0000 $700 $1,796
1.32 0.01 9.51 $1,331 $3,128
1.54 0.04 Commercial 1 7.8300 1.5152 $0 $2,373 12.25 $2,450 $4,823
Grenfell Residential 0.7 14.5000 1.0000 $700 $2,730
1.32 0.00 = 9.51 $1,331 $4,061
1.49 0.02 Commercial 1 14.5000 1.0000 $700 $3,600 12.25 $2,450 $6,050
White City Residential 0.7 6.2000 1.0000 $1,240 $2,108
1.18 -0.07 9.51 $1,331 $3,439
1.43 -0.05 Commercial 1 6.2000 1.0000 $1,240 $2,480 12.25 $2,450 $4,930
gap worsened gap improved = gap same
Source: CFIB calculations based on 2011 property tax data from Government of Saskatchewan, Ministry of Government Relations.
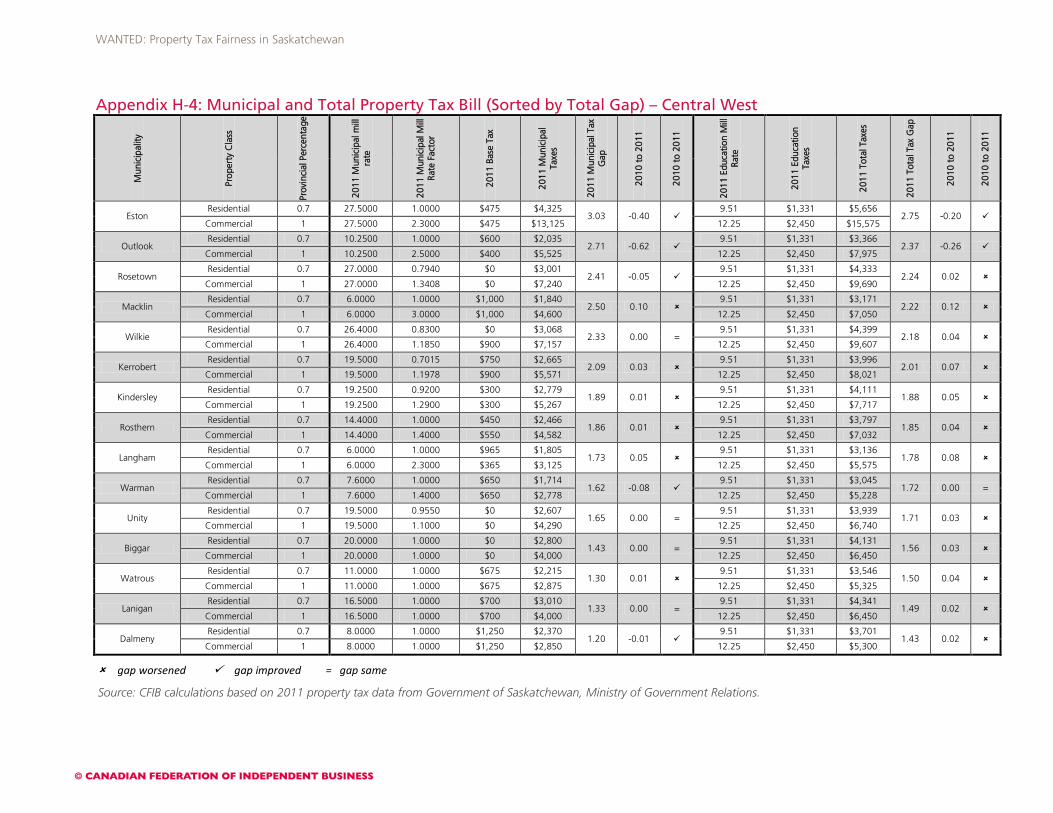
WANTED: Property Tax Fairness in Saskatchewan
Appendix H-4: Municipal and Total Property Tax Bill (Sorted by Total Gap) – Central West
Mun
icip
ality
Prop
erty
Cla
ss
Prov
inci
al P
erce
ntag
e
2011
Mun
icip
al m
ill
rate
2011
Mun
icip
al M
ill
Rate
Fac
tor
2011
Bas
e Ta
x
2011
Mun
icip
al
Taxe
s
2011
Mun
icip
al T
ax
Gap
2010
to
2011
2010
to
2011
2011
Edu
catio
n M
ill
Rate
2011
Edu
catio
n Ta
xes
2011
Tot
al T
axes
2011
Tot
al T
ax G
ap
2010
to
2011
2010
to
2011
Eston Residential 0.7 27.5000 1.0000 $475 $4,325
3.03 -0.40 9.51 $1,331 $5,656
2.75 -0.20 Commercial 1 27.5000 2.3000 $475 $13,125 12.25 $2,450 $15,575
Outlook Residential 0.7 10.2500 1.0000 $600 $2,035
2.71 -0.62 9.51 $1,331 $3,366
2.37 -0.26 Commercial 1 10.2500 2.5000 $400 $5,525 12.25 $2,450 $7,975
Rosetown Residential 0.7 27.0000 0.7940 $0 $3,001
2.41 -0.05 9.51 $1,331 $4,333
2.24 0.02 Commercial 1 27.0000 1.3408 $0 $7,240 12.25 $2,450 $9,690
Macklin Residential 0.7 6.0000 1.0000 $1,000 $1,840
2.50 0.10 9.51 $1,331 $3,171
2.22 0.12 Commercial 1 6.0000 3.0000 $1,000 $4,600 12.25 $2,450 $7,050
Wilkie Residential 0.7 26.4000 0.8300 $0 $3,068
2.33 0.00 = 9.51 $1,331 $4,399
2.18 0.04 Commercial 1 26.4000 1.1850 $900 $7,157 12.25 $2,450 $9,607
Kerrobert Residential 0.7 19.5000 0.7015 $750 $2,665
2.09 0.03 9.51 $1,331 $3,996
2.01 0.07 Commercial 1 19.5000 1.1978 $900 $5,571 12.25 $2,450 $8,021
Kindersley Residential 0.7 19.2500 0.9200 $300 $2,779
1.89 0.01 9.51 $1,331 $4,111
1.88 0.05 Commercial 1 19.2500 1.2900 $300 $5,267 12.25 $2,450 $7,717
Rosthern Residential 0.7 14.4000 1.0000 $450 $2,466
1.86 0.01 9.51 $1,331 $3,797
1.85 0.04 Commercial 1 14.4000 1.4000 $550 $4,582 12.25 $2,450 $7,032
Langham Residential 0.7 6.0000 1.0000 $965 $1,805
1.73 0.05 9.51 $1,331 $3,136
1.78 0.08 Commercial 1 6.0000 2.3000 $365 $3,125 12.25 $2,450 $5,575
Warman Residential 0.7 7.6000 1.0000 $650 $1,714
1.62 -0.08 9.51 $1,331 $3,045
1.72 0.00 =Commercial 1 7.6000 1.4000 $650 $2,778 12.25 $2,450 $5,228
Unity Residential 0.7 19.5000 0.9550 $0 $2,607
1.65 0.00 = 9.51 $1,331 $3,939
1.71 0.03 Commercial 1 19.5000 1.1000 $0 $4,290 12.25 $2,450 $6,740
Biggar Residential 0.7 20.0000 1.0000 $0 $2,800
1.43 0.00 = 9.51 $1,331 $4,131
1.56 0.03 Commercial 1 20.0000 1.0000 $0 $4,000 12.25 $2,450 $6,450
Watrous Residential 0.7 11.0000 1.0000 $675 $2,215
1.30 0.01 9.51 $1,331 $3,546
1.50 0.04 Commercial 1 11.0000 1.0000 $675 $2,875 12.25 $2,450 $5,325
Lanigan Residential 0.7 16.5000 1.0000 $700 $3,010
1.33 0.00 = 9.51 $1,331 $4,341
1.49 0.02 Commercial 1 16.5000 1.0000 $700 $4,000 12.25 $2,450 $6,450
Dalmeny Residential 0.7 8.0000 1.0000 $1,250 $2,370
1.20 -0.01 9.51 $1,331 $3,701
1.43 0.02 Commercial 1 8.0000 1.0000 $1,250 $2,850 12.25 $2,450 $5,300
gap worsened gap improved = gap same
Source: CFIB calculations based on 2011 property tax data from Government of Saskatchewan, Ministry of Government Relations.
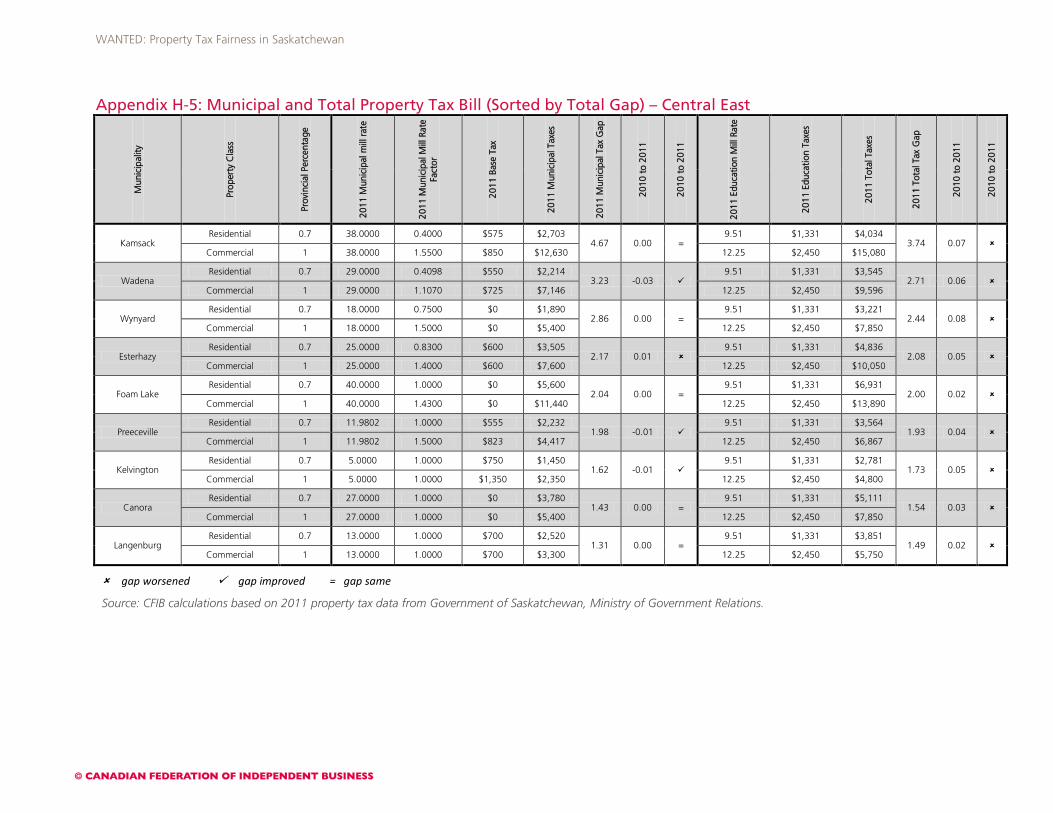
WANTED: Property Tax Fairness in Saskatchewan
Appendix H-5: Municipal and Total Property Tax Bill (Sorted by Total Gap) – Central East
Mun
icip
ality
Prop
erty
Cla
ss
Prov
inci
al P
erce
ntag
e
2011
Mun
icip
al m
ill r
ate
2011
Mun
icip
al M
ill R
ate
Fact
or
2011
Bas
e Ta
x
2011
Mun
icip
al T
axes
2011
Mun
icip
al T
ax G
ap
2010
to
2011
2010
to
2011
2011
Edu
catio
n M
ill R
ate
2011
Edu
catio
n Ta
xes
2011
Tot
al T
axes
2011
Tot
al T
ax G
ap
2010
to
2011
2010
to
2011
Kamsack Residential 0.7 38.0000 0.4000 $575 $2,703
4.67 0.00 = 9.51 $1,331 $4,034
3.74 0.07 Commercial 1 38.0000 1.5500 $850 $12,630 12.25 $2,450 $15,080
Wadena Residential 0.7 29.0000 0.4098 $550 $2,214
3.23 -0.03 9.51 $1,331 $3,545
2.71 0.06 Commercial 1 29.0000 1.1070 $725 $7,146 12.25 $2,450 $9,596
Wynyard Residential 0.7 18.0000 0.7500 $0 $1,890
2.86 0.00 = 9.51 $1,331 $3,221
2.44 0.08 Commercial 1 18.0000 1.5000 $0 $5,400 12.25 $2,450 $7,850
Esterhazy Residential 0.7 25.0000 0.8300 $600 $3,505
2.17 0.01 9.51 $1,331 $4,836
2.08 0.05 Commercial 1 25.0000 1.4000 $600 $7,600 12.25 $2,450 $10,050
Foam Lake Residential 0.7 40.0000 1.0000 $0 $5,600
2.04 0.00 = 9.51 $1,331 $6,931
2.00 0.02 Commercial 1 40.0000 1.4300 $0 $11,440 12.25 $2,450 $13,890
Preeceville Residential 0.7 11.9802 1.0000 $555 $2,232
1.98 -0.01 9.51 $1,331 $3,564
1.93 0.04 Commercial 1 11.9802 1.5000 $823 $4,417 12.25 $2,450 $6,867
Kelvington Residential 0.7 5.0000 1.0000 $750 $1,450
1.62 -0.01 9.51 $1,331 $2,781
1.73 0.05 Commercial 1 5.0000 1.0000 $1,350 $2,350 12.25 $2,450 $4,800
Canora Residential 0.7 27.0000 1.0000 $0 $3,780
1.43 0.00 = 9.51 $1,331 $5,111
1.54 0.03 Commercial 1 27.0000 1.0000 $0 $5,400 12.25 $2,450 $7,850
Langenburg Residential 0.7 13.0000 1.0000 $700 $2,520
1.31 0.00 = 9.51 $1,331 $3,851
1.49 0.02 Commercial 1 13.0000 1.0000 $700 $3,300 12.25 $2,450 $5,750
gap worsened gap improved = gap same
Source: CFIB calculations based on 2011 property tax data from Government of Saskatchewan, Ministry of Government Relations.
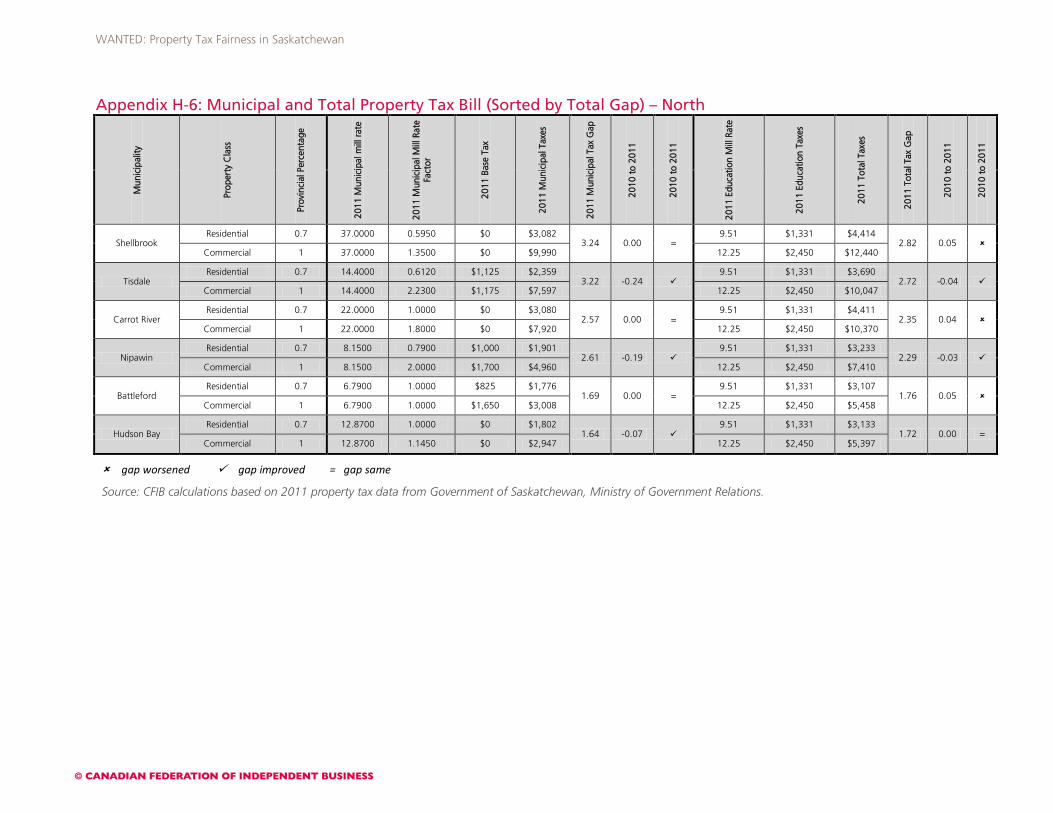
WANTED: Property Tax Fairness in Saskatchewan
Appendix H-6: Municipal and Total Property Tax Bill (Sorted by Total Gap) – North
Mun
icip
ality
Prop
erty
Cla
ss
Prov
inci
al P
erce
ntag
e
2011
Mun
icip
al m
ill r
ate
2011
Mun
icip
al M
ill R
ate
Fact
or
2011
Bas
e Ta
x
2011
Mun
icip
al T
axes
2011
Mun
icip
al T
ax G
ap
2010
to
2011
2010
to
2011
2011
Edu
catio
n M
ill R
ate
2011
Edu
catio
n Ta
xes
2011
Tot
al T
axes
2011
Tot
al T
ax G
ap
2010
to
2011
2010
to
2011
Shellbrook Residential 0.7 37.0000 0.5950 $0 $3,082
3.24 0.00 = 9.51 $1,331 $4,414
2.82 0.05 Commercial 1 37.0000 1.3500 $0 $9,990 12.25 $2,450 $12,440
Tisdale Residential 0.7 14.4000 0.6120 $1,125 $2,359
3.22 -0.24 9.51 $1,331 $3,690
2.72 -0.04 Commercial 1 14.4000 2.2300 $1,175 $7,597 12.25 $2,450 $10,047
Carrot River Residential 0.7 22.0000 1.0000 $0 $3,080
2.57 0.00 = 9.51 $1,331 $4,411
2.35 0.04 Commercial 1 22.0000 1.8000 $0 $7,920 12.25 $2,450 $10,370
Nipawin Residential 0.7 8.1500 0.7900 $1,000 $1,901
2.61 -0.19 9.51 $1,331 $3,233
2.29 -0.03 Commercial 1 8.1500 2.0000 $1,700 $4,960 12.25 $2,450 $7,410
Battleford Residential 0.7 6.7900 1.0000 $825 $1,776
1.69 0.00 = 9.51 $1,331 $3,107
1.76 0.05 Commercial 1 6.7900 1.0000 $1,650 $3,008 12.25 $2,450 $5,458
Hudson Bay Residential 0.7 12.8700 1.0000 $0 $1,802
1.64 -0.07 9.51 $1,331 $3,133
1.72 0.00 = Commercial 1 12.8700 1.1450 $0 $2,947 12.25 $2,450 $5,397
gap worsened gap improved = gap same
Source: CFIB calculations based on 2011 property tax data from Government of Saskatchewan, Ministry of Government Relations.