
Voluntary Disclosure, Greenhouse Gas Emissions …Voluntary Disclosure, Greenhouse Gas Emissions and...
34
SEEDS SURREY Surrey Energy Economics ENERGY Discussion paper Series ECONOMICS CENTRE Voluntary Disclosure, Greenhouse Gas Emissions and Business Performance: Assessing the First Decade of Reporting David C. Broadstock, Alan Collins, Lester C Hunt and Konstantinos Vergos October 2014 SEEDS 149 School of Economics ISSN 1749-8384 University of Surrey
Transcript of Voluntary Disclosure, Greenhouse Gas Emissions …Voluntary Disclosure, Greenhouse Gas Emissions and...
SEEDS SURREY
Surrey Energy Economics ENERGY
Discussion paper Series ECONOMICS
CENTRE
Voluntary Disclosure, Greenhouse
Gas Emissions and Business
Performance: Assessing the First
Decade of Reporting
David C. Broadstock, Alan Collins, Lester C Hunt and Konstantinos Vergos
October 2014
SEEDS 149 School of Economics ISSN 1749-8384 University of Surrey
The Surrey Energy Economics Centre (SEEC) consists of members of the School of Economics who work on energy economics, environmental economics and regulation. The School of Economics has a long-standing tradition of energy economics research from its early origins under the leadership of Professor Colin Robinson. This was consolidated in 1983 when the University established SEEC, with Colin as the Director; to study the economics of energy and energy markets.
SEEC undertakes original energy economics research and since being established it has conducted research across the whole spectrum of energy economics, including the international oil market, North Sea oil & gas, UK & international coal, gas privatisation & regulation, electricity privatisation & regulation, measurement of efficiency in energy industries, energy & development, energy demand modelling & forecasting, and energy & the environment.
SEEC research output includes SEEDS - Surrey Energy Economic Discussion paper Series and SEERS - Surrey Energy Economic Report Series (details at www.seec.surrey.ac.uk/Research/SEEDS.htm) as well as a range of other academic papers, books and monographs. SEEC also runs workshops and conferences that bring together academics and practitioners to explore and discuss the important energy issues of the day
SEEC also attracts a large proportion of the School’s PhD students and oversees the MSc in Energy Economics & Policy. Many students have successfully completed their MSc and/or PhD in energy economics and gone on to very interesting and rewarding careers, both in academia and the energy industry.
Enquiries:
Director of SEEC and Editor of SEEDS: Lester C Hunt SEEC, School of Economics, University of Surrey, Guildford GU2 7XH, UK. Tel: +44 (0)1483 686956 Fax: +44 (0)1483 689548 Email: [email protected] www.seec.surrey.ac.uk

i
___________________________________________________________
Surrey Energy Economics Centre (SEEC)
School of Economics University of Surrey
SEEDS 149 ISSN 1749-8384
___________________________________________________________ VOLUNTARY DISCLOSURE, GREENHOUSE GAS EMISSIONS
AND BUSINESS PERFORMANCE: ASSESSING THE FIRST DECADE OF REPORTING
David C. Broadstock, Alan Collins, Lester C Hunt and
Konstantinos Vergos
October 2014 ___________________________________________________________
This paper may not be quoted or reproduced without permission.
ii
ABSTRACT
This study explores patterns in the voluntary disclosure of greenhouse gas (GHG) emissions and empirical relationships between GHG emissions and an extensive range of business performance measures for UK FTSE-350 listed firms over the first decade of such reporting and highlighting the level of consistency among these measures. Despite the popular and policy generated environmental imperatives over this period, an extensive pattern of non-reporting of such emissions is apparent by year and sector. Accordingly, a two-stage (Heckman type) selection model is used to analyse the emissions-performance nexus conditional upon the firm choosing to report, using bootstrap inference to further ensure robustness of the results. The results demonstrate firstly that emissions reporting are not directly influenced by the social/governance disclosure attitudes of a firm, thus suggesting that firms disassociate environmental responsibility from social responsibility. Additionally it is demonstrated that for those firms that do report, there is a clear non-linear relationship, initially increasing with firm performance and then decreasing.
Key Words: voluntary disclosure, carbon emissions, business performance, environmental reporting

Voluntary Disclosure, Greenhouse Gas Emissions and Business Performance Page 1 of 28
Voluntary Disclosure, Greenhouse Gas Emissions and Business Performance: Assessing the First Decade of Reporting
David C. Broadstocka, Alan Collinsb, Lester C. Huntc and Konstantinos Vergosd Introduction
Since before climate change had become a recurring central policy issue there has been a
long-standing research imperative to better understand the relationship between pollutant
emissions and economic activities. Hitherto, empirical investigation into the relationship
between activity and emissions has been conducted at the household-level (see, for example,
Kahn 1998 and Cox et al 2012), but more extensively at the sectoral and economy-wide level
(see, for example, the considerable range of such studies surveyed in Dinda 2004, Stern 2004
and Nahman and Antrobus 2005a). With the exception of Konar and Cohen (2001) (who
analyse the relationship between U.S. toxic chemical release data and stock market value)
and Hsu and Wang (2013) (who analyse the impact of U.S. mandatory greenhouse gas
reductions on stock market value), relatively little methodologically comparable research, nor
similarly extensive and direct investigation of emissions exists at the firm-specific level.
More indirectly, however, there are many studies framed in terms of analysing environmental
management activities, environmental innovation, technology adoption and other
environmental performance measures, alongside participation in particular environmental
programmes requiring mandatory or voluntary compliance (see, for example, Wagner et al.
a Research Institute of Economics and Management, Southwestern University of Finance and Economics, Chengdu, Sichuan, China. b Corresponding Author. Portsmouth Business School, University of Portsmouth, Portsmouth, UK and Department of Economics and Economic History, Rhodes University, Grahamstown, Eastern Province, South Africa. Email: [email protected]. c Surrey Energy Economics Centre (SEEC), School of Economics, University of Surrey, Guildford, UK. d Portsmouth Business School, University of Portsmouth, Portsmouth, UK.

Voluntary Disclosure, Greenhouse Gas Emissions and Business Performance Page 2 of 28
2002, Brunnermeier et al. 2003, Cole et al. 2006, Frondel et al. 2008, Carrión-Flores and
Innes 2010, Kassinis and Vafeas 2006, Wagner 2010). Horváthová (2010) undertakes an
extensive review of this work and reports on a meta-regression of 64 outcomes from 37
empirical studies in the “firm-environmental performance nexus” and finds,
“….that the likelihood of finding a negative link between EP (environmental performance) and FP
(financial performance) significantly increases when using the correlation coefficients and portfolio
studies. On the other hand, the use of multiple regressions and panel data technique has no effect on the
outcome. This suggests that it is important to account for omitted variable biases such as unobserved
firm heterogeneity. The results also suggest that appropriate time coverage is important in order to
establish a positive link between EP and FP. This suggests that it takes time for environmental
regulation to materialise in financial performance.” p.56.
Horváthová’s (2010) review also seems to point to a paucity of robust, extensive empirical
GHG emissions-performance studies over a reasonable time frame at the firm-level. This is
despite numerous lobby group, media and Government policy-led exhortations to, and
initiatives for, firms to reduce their level of GHG emissions. These are generally framed as
parts of various concerted actions to combat climate change and encourage permanent
adoption of more environmentally sustainable modes of production.
Thus, this study explores the empirical relationship between a very extensive range of the
most typically reported and deployed business performance measures and reported GHG
emissions (all readily accessible via the Bloomberg (2013) database) for UK FTSE-350 listed
firms over the period 2000 to the end of 2011.
The remainder of this paper is organized as follows. The next section provides some
background to the basis, advantages and limitations of the most common business
performance indicators used. A brief retrospect on the guiding theoretical and empirical
literature pertaining to emission-firm performance linkages is then presented which informs
Voluntary Disclosure, Greenhouse Gas Emissions and Business Performance Page 3 of 28
the choice of key hypotheses investigated. Data issues and the modelling strategy employed
are considered in the following two sections. The results are then presented and discussed
with a summary of findings and some concluding remarks proffered in the final section.
Measuring Performance
It is important to consider a comprehensive range of different accepted measures of
performance, as businesses have many stakeholders (such as shareholders, bankers,
employees, and tax authorities) whose interests in the firm differ (Johnston and Pongatichat,
2008). Shareholders, for instance, may focus more on profits, whilst bankers focus on both
cash-flow-related performance metrics, such as operating cash flows and capital structure
(Leverage). On the contrary, tax authorities may focus on profit before tax and employees on
sales. Besides, accounting policies (e.g. depreciation method) or differences on capital
structure or financing decisions (e.g. leasing) induce performance asymmetries in the short
run that necessitate the need to account for alternative performance measures. The broad
range of business performance measures used in this study are Sales, Net Income, Operating
Profits, Before Tax Profits, Market Capitalisation, Stock price, Asset, Equity, ROA (Return
on Assets), ROE (Return on Equity), Tobin’s Q and EBITDA (Earnings Before Interest, Tax,
Depreciation and Amortization), and Leverage is examined as a capital structure measure.
Definitions and a brief explanation of the examined measures are set out in Table 1.

Voluntary Disclosure, Greenhouse Gas Emissions and Business Performance Page 4 of 28
Table 1. Measures of Business Performance and Capital Structure
Measure Variable name Definition and Explanation
Money metric based performance measures Sales (also called Turnover)
SALES Direct measure of business performance, because indicates business generating activity, and emission generating activity
EBITDA ‘Earnings Before Interest Tax Depreciation and Amortization
EBITDA Operating Profits before the deduction of non-cash items Depreciation and Amortization. Company performance measure. EBITDA margin is a measure of the profitability and short-term company performance.
Net Income, also known as After tax Profits
PROFITS Profit of the firm, after Tax deductions. Important for shareholders because a proportion of Net Income is given to shareholders as dividends.
Operating Profits, is also known as Earnings Before Interest and Tax.
OPROF Profits before interest and taxation. Proxy of company performance, and proxy of company’s operating cash flows.
Before Tax Profits, is the Profit before tax charges.
BTPROF Profits before taxation. Proxy of company performance.
Market Capitalisation is the value of the firm in capital markets.
MCAP Market Capitalisation is the number of shares outstanding times the share price. Measure of value and hence performance independent of the firms’ accounting policy. Measure of the company size, as well.
Asset, denotes the Total Assets at the end of the period.
ASSETS Measure of the size of the firm.
Equity, denotes Total Equity at the end of the period.
EQUITY Equity is a measure of the size of the firm, of the capital resources devoted to the firm by the shareholders and is a rough proxy of the liquidation value of the company.
Ratio based performance measures / measures that cannot be scaled by number of staffStock price
PRICE Reflects company performance as evaluated by the shareholders, scaled by the number of shares.
Leverage, denotes the financial leverage,
LEV Measured by the ratio of Debt over Equity. Proxy of capital structure.
ROA - Return on Assets
ROA Net Income over Average Total Assets. Average Total Assets denote the average Assets during a Fiscal Year. It is a measure of profitability when all the sources of capital, Equity and Debt, are taken into account.
ROE - Return on Equity ROE Net Income over Average Equity. Average Equity denotes the average Equity during a Fiscal Year. It is a measure of profitability from the perspective of the Shareholders.
Tobin’s Q
TOBQ Market Value of the company over the Replacement Value of its assets. Tobin Q over Total Assets is indication of long-term performance
Firm Performance and Polluting Emissions: Brief Theoretical Retrospect and Key Research Hypotheses
The analysis of pollution by firms, particularly in economic theory has a long and
distinguished history and its chronological context is set out in Kula (1998) and Pearce
(2002). Early contributions set out what has emerged to serve as a very durable stylized
picture of the profit maximizing firm treating the atmosphere and other environmental media,

Voluntary Disclosure, Greenhouse Gas Emissions and Business Performance Page 5 of 28
such as seas and river basins, as essentially free goods in which to emit or dispose waste.
Economic theory therefore suggests that these free goods would be over-consumed by such
firms to the material detriment of other firms and households. This was expected to become
manifest in terms of the external costs (negative externality) of pollution being imposed on
others through clean-up costs, deleterious health effects etc. Such simple stylized thinking,
supplemented by analyses of property rights (see, for example, Coase 1960, Dales, 1968) has
informed the structuring and application by environmental regulators of a range of command
and control instruments (total bans, emission standards, fines) as well as of economic
incentive instruments (taxes, subsidies, tradable permits); for an overview see Baumol and
Oates (1988). These were intended to reduce or optimize the level of polluting emissions and
were justified with reference to various measures or indicators of societal preferences.
In principle, however, such regulatory interventions would still need to be mindful of the
neoclassical economic implication of profit maximization that firms would only expend the
minimum cost necessary to comply with any given regulatory intervention and even weigh up
the net cost implications of bypassing such interventions if monitoring, enforcement and
punishment were weak.
Another theoretical strand, however, drawing initially and principally on case study evidence,
recasts this body of theory premised on the assertion that increasing regulatory stringency
may actually be profitable rather than costly (Porter 1991, Porter and van der Linde 1995).
This argument, generally labelled ‘the Porter hypothesis’ is explained in terms of the stimulus
to innovation afforded by tighter mandatory environmental regulations prompting cost-saving
productive efficiencies. The conceptual and empirical basis for the hypothesis has been
contested and augmented for testing in ‘weak’, ‘narrow’ and ‘strong’ forms (see, for example,

Voluntary Disclosure, Greenhouse Gas Emissions and Business Performance Page 6 of 28
Palmer et al 1995, Jaffe and Palmer 1998, Lanoie et al 2011, Ambec et al 2013). In weak
form it is simply asserted that environmental regulations can stimulate innovation. The
narrow form suggests that flexible environmental policy regimes can better incentivise
innovation than less flexible environmental policy regimes and the strong form suggests that
well designed regulation can induce cost-saving innovations outweighing the costs of
compliance with such regulations.
In a related vein, further theoretical strands of the firm-pollution emission discourse have also
explored the motivations and scope for actually fostering voluntary over-compliance – i.e.
abating emissions some way above the minimum (statutory) requirement (Arora and
Gangopadhyay, 1995 Anton et al. 2003). The very existence of this practice might appear to
pose a serious challenge to neoclassical economic conceptions of firm practice. This arises
since the required information to voluntarily indicate or demonstrate over-compliance entails
(i) disclosure of potentially strategically valuable information to competitors and regulators
and (ii) voluntarily incurring the costs of collecting the emissions information. At the very
least, such economic theory might be recalled to support the view that the practice would not
be widespread and perhaps related to distinct competitive environmental strategies where
signalling ‘green’ or climate change combative credentials offer ‘legitimacy’ (see, for
example, Cho and Patten, 2007) or has market value. Indeed in some other theoretical studies
voluntary over-compliance has simply been conceptualized as exercises in ‘greenwash’ i.e.
simply augmenting marketing spend (see, for example, Kim and Lyon 2011, Mahoney et al.
2013).
In other cases the undertaking of voluntary over-compliance has simply been related to
differences in regulatory stringency across countries and thereby offering, for example, some

Voluntary Disclosure, Greenhouse Gas Emissions and Business Performance Page 7 of 28
foreign direct investing firms competitive advantages by default, simply through their
experience in their host country. Essentially, if regulatory stringency is expected to be on an
upward trajectory in the country being invested in, then this intrinsic competitive advantage
could be reinforced via green branding and marketing tactics and also accentuated as
domestic firms struggle (in cost terms) to comply with tougher regulations. However, over-
compliance may also arise for both foreign direct investing and domestic firms due to a desire
to exploit cost-saving efficiency improvements that raise resource productivity by the firm,
i.e. leading to the generation of less waste or emissions per unit of natural resource inputs
used in production. This may emerge from resource productivity improvements in the
mainstream production process of the firm or the greater use of the waste by-products in new
or other production lines. Nevertheless, it remains an open empirical question in different
market contexts, whether or not more efficient firms spend more or less on pollution
abatement than less efficient firms. For instance, there are conspicuous contrasts in the
efficiency-pollution abatement spending relationship for the UK metal manufacturing and
chemical industries presented in Collins and Harris (2002 and 2005).
At the heart of this question lies an extensive related thread of literature concerned with
establishing the veracity or otherwise of the ‘Jevons Paradox’ and its more contemporary
evocation as ‘the rebound effect’ (Saunders 1992, Turner and Hanley 2011). Jevons
conjectured that technological progress leading to greater resource productivity (in his
context, more efficient use of coal) actually provided the scope and means for increasing coal
demand. Saunders (1992) assessed the gains specifically from energy resource efficiency
within the context of various economic growth assumptions and found that some level of
rebound effect was present. That energy resource efficiency may actually be a less
environmentally successful strategy than commonly thought has provided a source of fierce

Voluntary Disclosure, Greenhouse Gas Emissions and Business Performance Page 8 of 28
academic contention centring on the extent to which energy efficiency improvements in some
individual firms and markets are technically connected to sectoral and economy-wide energy
resource consumption
Among the extant literature there also features a voluminous number of studies focusing on a
conjecture termed the environmental Kuznets curve (EKC). This literature postulates with
various implicit and/or explicit assumptions and conditions that the rate of emissions reduces
with the scale of activity, but, moreover, after a certain level of activity, that the level of
emissions may also reduce in absolute terms (Dasgupta et al. 2002, Dinda 2005, Kijima et al.
2010).
Contradictory evidence has been found affirming and disputing the presence of curves at
different levels of aggregation (see, for example, Perman and Stern 2003, Millimet et al.
2003, Dinda 2004, Bertinelli and Strobl, 2005, Chimeli and Braden 2005, Fernández et al.
2012). Nevertheless, some extension of this thinking into the corporate sector might have
been expected to systematically investigate the potential widespread (cross-sectoral)
existence of such curves with respect to GHGs at the firm-level, even though more difficult
questions do arise as to the appropriate choice of a particular activity measure. In the related
literature at the macro, sectoral and household level, income is generally used as the measure
of activity. However, it would be reasonable to assert that business performance metrics are
the more appropriate activity indicator at the firm level. Firms who perform better have
arguably greater flexibility to invest in emissions-reducing activities, noting that these are
sometimes both high upfront cost investments as well as low direct return investments.

Voluntary Disclosure, Greenhouse Gas Emissions and Business Performance Page 9 of 28
Firms that are not performing so well will have less financial scope to take such emission
abating actions. However, measuring performance is itself a difficult task, and arguably there
is no clear single specific measure of performance for a firm. The main reason for this is that
firms have different stakeholders who are interested in different objectives, and also that
multinational firms may well have similar stakeholders from different geographic regions that
may well place more or less importance on the same objectives.
In the light of this theoretical and empirical discourse and particularly that situated in the
business performance-emissions nexus, three simple but key hypotheses warranting empirical
investigation are posited:
Hypothesis 1: Firms’ Greenhouse gas emissions are dependent on firm performance and
more specifically are subject to an environmental Kuznets-type curve.
Hypothesis 2: Business performance measures are not related to emissions identically.
Hypothesis 3: Voluntary disclosure of greenhouse gas emissions affects the nature of the
emissions-business performance relationship.
Data
The data are taken from the Bloomberg (2013) database and include all firms listed in the
FTSE 350 index since 2000, and includes all available data up to the end of 2011. In
principle, this data allows for several thousand firm-year observations, however, a significant
amount of non-reporting of emissions among firms substantially reduces the sample sizes.
Table 2 presents descriptive statistics for the FTSE 350 data, including measures for the firms
that report emissions, selected statistics for those that do not report and also for the full

Voluntary Disclosure, Greenhouse Gas Emissions and Business Performance Page 10 of 28
sample. Taking the ROA of a firm as an example, these are generally firms whose primary
business activity is in the UK, though most of the firms on the list are multinational firms,
hence, the data encapsulates exposure to international business practices and
standards/regulations.
The main variable of interest is the self-reported levels of emissions, which include all
greenhouse gas emissions reported by the business that were created by the activity of the
business. This includes a basket of gases that includes, but is not restricted to carbon dioxide
emissions. The definition of business activity is quite general and does potentially incorporate
both direct and indirect emissions, whereby the direct emissions are those which the reporting
firm has direct control over, and the indirect emissions are those in which the firm has little or
no direct control over, for instance elements of the wider supply chain.e
Modelling Strategy
The empirical model connecting firm level emissions and the various performance indicators
is based upon the type of models observed in the environmental Kuznets curve (EKC)
literature, in which the model allows for a non-linear relationship in the form of a quadratic
curve (see, for example, Kijima et al (2010). Equation 1 depicts the equation to be estimated:
T
ttt
I
iiiititit DDppe
22
221 (1)
e There is a possible concern that since firms have proxy over their reporting standards, they may not report perfectly comparable pollutant levels. There is no way for this to be confirmed with the available data, though it is assumed that the reporting practices will be, by and large, consistent and hence comparable across firms.

Voluntary Disclosure, Greenhouse Gas Emissions and Business Performance Page 11 of 28
Where e is the greenhouse gas emissions divided by the number of staff, and p is the
performance indicator. The performance indicators are of two types, some are money metrics,
and others are ratios: the money metric performance measures are divided by the number of
staff, while the remaining measures (stock price, leverage, ROA, ROE and TOBQ) are not.
iD and tD are dummy variables to control for industry specific and time specific effects,
where the model intercept represents the base industry and base time period. Firm specific
fixed effects were considered, but limitations in data reporting preclude this as being viable.
1 and 2 , which are the coefficients describing the existence and nature of relationship
between firm performance and emissions, are the main parameters of interest.
To provide the most robust estimates possible, and ensure that parameter inference is robust
to any heteroskedasticity the linear equations in (1) are estimated using a non-parametric
Bootstrap. The (residual based) bootstrap procedure provides inference upon a statistical
model by using the ordinary least squares (OLS) residuals to represent the empirical
distribution of shocks. These residuals are recorded, and re-ordered across the observations to
allow any given observation to be subject to a different error, subsequently the model is re-
estimated by OLS and the coefficients are recorded as individual runs of a bootstrap. Thus,
the bootstrap process evaluates how stable the estimated coefficients are to different data,
where the differences in data are based on observed (unexplainable) variability. This is in
effect the purpose of conventional (asymptotic) inference, but no longer depends on either
normality of the residuals nor large sample sizes. See Efron and Tibsharini (1993) and
Davison and Hinkley (1997) for further detailed discussion of non-parametric regression by
least squares. The results reported in the following section concentrate on the mean
coefficient value and the 95% confidence interval from 1,000 bootstrap replications.

Voluntary Disclosure, Greenhouse Gas Emissions and Business Performance Page 12 of 28
Table 2: Descriptive statistics
Performance measure:
Estimation data (reporting firm‐years) All firm‐years Non‐reporting firm‐years
means max min sd skew kurtosis observed missing means sd observed missing means sd observed missing
CO2_FULL 4211.789 73200.012 0.000 12436.529 3.929 16.395 258 0 4282.502 12399.385 262 3643
GHG_FULL 4264.028 73220.012 1.400 12486.620 3.913 16.253 256 2 4334.774 12448.334 260 3645
SALES 14824.250 361143.000 ‐10269.000 45611.762 5.195 28.923 258 0 7194.593 33260.774 2895 1010 6445.903 31732.560 262 1010
EBITDA 2082.072 41761.000 ‐28.313 6461.635 4.665 22.347 225 33 1098.727 4791.594 2697 1208 1009.772 4602.792 2470 1173
PROFITS 1015.762 22341.000 ‐21916.000 3825.226 2.661 19.538 258 0 526.382 2580.945 2821 1084 477.177 2417.994 2559 1084
OPROF 1546.383 30776.000 ‐105.391 4744.114 4.623 22.087 221 37 796.419 3540.513 2666 1239 729.027 3405.378 2443 1200
BTPROF 1544.610 34642.000 ‐14853.000 5308.517 4.265 21.285 258 0 831.646 4174.039 2907 998 762.585 4042.633 2647 996
PRICE 701.798 4392.390 13.500 634.405 2.072 6.423 258 0 622.151 1587.580 3464 441 616.102 1641.253 3202 441
MCAP 10827.872 127864.500 69.742 24359.872 3.282 10.151 258 0 6108.832 16931.425 3010 895 5669.910 16006.155 2748 895
LEV 4.815 61.215 ‐103.105 11.928 ‐1.852 28.646 258 0 3.923 88.554 2512 1393 3.823 93.441 2252 1391
ASSETS 79550.060 2527465.000 120.755 337292.601 6.096 37.685 258 0 25521.614 154516.483 2815 1090 20083.747 120553.341 2555 1088
EQUITY 8975.501 154915.000 ‐533.600 24628.408 3.779 14.228 258 0 3734.995 14950.305 2815 1090 3207.282 13497.118 2555 1088
ROA 6.363 52.767 ‐37.364 8.868 0.107 6.481 258 0 5.897 11.507 2735 1170 5.847 11.752 2475 1168
ROE 24.939 682.653 ‐103.731 61.425 8.208 80.044 241 17 18.780 39.107 2712 1193 18.182 36.180 2469 1174
TOBQ 1.593 5.339 0.638 0.748 1.857 4.600 258 0 1.615 2.243 2762 1143 1.617 2.344 2502 1141
ind_1 0.004 1.000 0.000 0.062 15.876 251.023 258 0 0.054 0.225 3905 0 0.057 0.232 3643 0
ind_2 0.240 1.000 0.000 0.428 1.209 ‐0.542 258 0 0.172 0.377 3905 0 0.167 0.373 3643 0
ind_3 0.097 1.000 0.000 0.296 2.709 5.362 258 0 0.062 0.241 3905 0 0.060 0.237 3643 0
ind_4 0.287 1.000 0.000 0.453 0.937 ‐1.126 258 0 0.166 0.372 3905 0 0.157 0.364 3643 0
ind_5 0.186 1.000 0.000 0.390 1.604 0.576 258 0 0.161 0.367 3905 0 0.159 0.365 3643 0
ind_6 0.004 1.000 0.000 0.062 15.876 251.023 258 0 0.065 0.246 3905 0 0.069 0.254 3643 0
ind_7 0.000 0.000 0.000 0.000 NA NA 258 0 0.023 0.148 3905 0 0.024 0.154 3643 0
ind_8 0.035 1.000 0.000 0.184 5.040 23.496 258 0 0.025 0.157 3905 0 0.025 0.155 3643 0
ind_9 0.050 1.000 0.000 0.219 4.087 14.761 258 0 0.023 0.148 3905 0 0.021 0.142 3643 0 Note: SALES, EBITDA, PROFITS , OPROF, BTPROF, MCAP, ASSETS, EQUITY are in million British pounds. ROA, ROE in percentage terms, PRICE in British Pounds

Voluntary Disclosure, Greenhouse Gas Emissions and Business Performance Page 13 of 28
Correcting for self-reporting bias
To account for possible selection bias, the emissions function is re-estimated as a Heckman
type selection problem. The latent system equations can be written as:
itSSS
it Disclosuree 1*
T
t
Ot
Ot
I
i
Oi
Oi
Oit
OOit
OOOit DDppe
22
2
21*
(2)
Where:
Otherwise
0 if 0*
*
Oit
SOit
e
ee
That is to say that the emissions for any given firm are only observed when the selection
variable eS*is positive. The Bloomberg database includes proprietary measures of
environmental disclosure (ED), social disclosure (SD) and governance disclosure (GD),
which are a natural choice of instruments for the selection equation:
itS
itS
itSSS
it GDSDEDe 321*
Results and Discussion
This section presents and discusses the main results, taking each of the aforementioned
hypotheses in turn.
Hypothesis 1: Firms’ Greenhouse gas emissions are dependent on firm performance and
more specifically are subject to an environmental Kuznets-type curve. If either of the linear
or squared emissions terms is insignificant, then the Kuznets relationship can be rejected.
This implies the following null hypothesis:
Voluntary Disclosure, Greenhouse Gas Emissions and Business Performance Page 14 of 28
0 and Both :1 21)1( H
Tested against the null hypothesis that either one of these are equal to zero. This can be
evaluated using individual coefficient significance testing procedures.
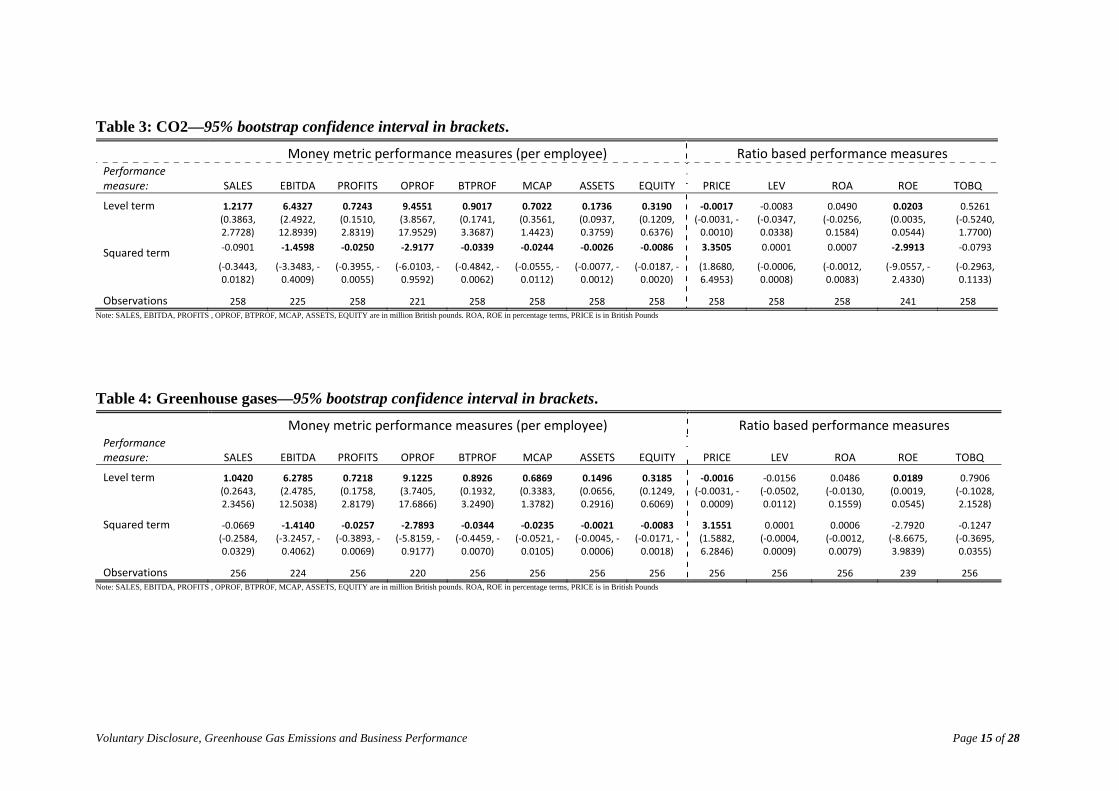
Tables 3 and 4 report the estimation results for CO2 and GHG emissions respectively based
on Equation (1). Across the columns of these tables it is evident that there is a broad
dichotomy between the two types of performance measures. For each of the alternative
money metric based performance measures, with the exception of SALES, give strong
evidence of a non-linear inverted U-shape relationship between performance and emissions.
For SALES the coefficient values broadly support the idea of an inverted U-shape, however
the 95% confidence interval for the quadratic term passes through zero i.e. the confidence
interval includes both positive and negative values, but whose range is predominantly
negative. The absolute values of the coefficients in each of the columns vary, but this is to be
expected given the different definitions of performance.
For the performance measures that are based on ratios, a slightly different picture emerges.
There are five measures falling into this category. Three of these measures, LEV, ROA and
TOBQ appear to have no direct relationship with the emissions of a firm, neither for CO2 or
GHG. The remaining two measures are related to emissions but not in the same way: for
PRICE there is U-shape relationship e.g. with low stock prices a firm should expect higher
emissions per-employee, gradually decreasing until some optimal point, and then increasing
again after that; for ROE there is a an inverted U-shape relation with CO2 while only the
linear performance measure is significant in the GHG equation.
Voluntary Disclosure, Greenhouse Gas Emissions and Business Performance Page 15 of 28
Table 3: CO2—95% bootstrap confidence interval in brackets.
Money metric performance measures (per employee) Ratio based performance measures Performance measure: SALES EBITDA PROFITS OPROF BTPROF MCAP ASSETS EQUITY PRICE LEV ROA ROE TOBQ
Level term 1.2177 6.4327 0.7243 9.4551 0.9017 0.7022 0.1736 0.3190 ‐0.0017 ‐0.0083 0.0490 0.0203 0.5261 (0.3863, 2.7728)
(2.4922, 12.8939)
(0.1510, 2.8319)
(3.8567, 17.9529)
(0.1741, 3.3687)
(0.3561, 1.4423)
(0.0937, 0.3759)
(0.1209, 0.6376)
(‐0.0031, ‐0.0010)
(‐0.0347, 0.0338)
(‐0.0256, 0.1584)
(0.0035, 0.0544)
(‐0.5240, 1.7700)
Squared term ‐0.0901 ‐1.4598 ‐0.0250 ‐2.9177 ‐0.0339 ‐0.0244 ‐0.0026 ‐0.0086 3.3505 0.0001 0.0007 ‐2.9913 ‐0.0793
(‐0.3443, 0.0182)
(‐3.3483, ‐0.4009)
(‐0.3955, ‐0.0055)
(‐6.0103, ‐0.9592)
(‐0.4842, ‐0.0062)
(‐0.0555, ‐0.0112)
(‐0.0077, ‐0.0012)
(‐0.0187, ‐0.0020)
(1.8680, 6.4953)
(‐0.0006, 0.0008)
(‐0.0012, 0.0083)
(‐9.0557, ‐2.4330)
(‐0.2963, 0.1133)
Observations 258 225 258 221 258 258 258 258 258 258 258 241 258 Note: SALES, EBITDA, PROFITS , OPROF, BTPROF, MCAP, ASSETS, EQUITY are in million British pounds. ROA, ROE in percentage terms, PRICE is in British Pounds
Table 4: Greenhouse gases—95% bootstrap confidence interval in brackets.
Money metric performance measures (per employee) Ratio based performance measures Performance measure: SALES EBITDA PROFITS OPROF BTPROF MCAP ASSETS EQUITY PRICE LEV ROA ROE TOBQ
Level term 1.0420 6.2785 0.7218 9.1225 0.8926 0.6869 0.1496 0.3185 ‐0.0016 ‐0.0156 0.0486 0.0189 0.7906 (0.2643, 2.3456)
(2.4785, 12.5038)
(0.1758, 2.8179)
(3.7405, 17.6866)
(0.1932, 3.2490)
(0.3383, 1.3782)
(0.0656, 0.2916)
(0.1249, 0.6069)
(‐0.0031, ‐0.0009)
(‐0.0502, 0.0112)
(‐0.0130, 0.1559)
(0.0019, 0.0545)
(‐0.1028, 2.1528)
Squared term ‐0.0669 ‐1.4140 ‐0.0257 ‐2.7893 ‐0.0344 ‐0.0235 ‐0.0021 ‐0.0083 3.1551 0.0001 0.0006 ‐2.7920 ‐0.1247 (‐0.2584, 0.0329)
(‐3.2457, ‐0.4062)
(‐0.3893, ‐0.0069)
(‐5.8159, ‐0.9177)
(‐0.4459, ‐0.0070)
(‐0.0521, ‐0.0105)
(‐0.0045, ‐0.0006)
(‐0.0171, ‐0.0018)
(1.5882, 6.2846)
(‐0.0004, 0.0009)
(‐0.0012, 0.0079)
(‐8.6675, 3.9839)
(‐0.3695, 0.0355)
Observations 256 224 256 220 256 256 256 256 256 256 256 239 256 Note: SALES, EBITDA, PROFITS , OPROF, BTPROF, MCAP, ASSETS, EQUITY are in million British pounds. ROA, ROE in percentage terms, PRICE is in British Pounds

Voluntary Disclosure, Greenhouse Gas Emissions and Business Performance Page 16 of 28
The U-shape finding for PRICE stands out clearly among the various performance measures.
Compared with the other performance measures PRICE is arguably more exogenous to the
firm, with the actions and choices of financial analysts and investors being the primary
determinant of stock prices, but also recognizing that the wider stability or otherwise of the
financial market will also in part determine PRICE. An interesting implication of this finding
is that environmentally conscious investors might have a preference towards mid-priced
stocks, where ‘mid’ is loosely used here to refer to the region of the optimum on the U-
shaped curve. Taking the results together, the evidence strongly supports the first hypothesis
stating that emissions are functionally dependent on firm performance.
As discussed, Tables 3 and 4 suggest that a relationship between emissions and firm
performance does exist and moreover is broadly in favour of a non-linear Kuznets-type
relationship, albeit one that is slightly sensitive to the definition of performance. The
performance measures considered here have been grouped into two types, based on their
ability to be scaled by the number of firm employees. The difference between these two
groups therefore can be attributed in part to the scale effect embedded in the per-employee
transformation. In light of this the findings have one rationale being that when the physical
scale of a firm is taken into account, it is much more likely that a relationship with emissions
will be revealed. A complementary interpretation to this is that the ratio-based performance
measures do not take sufficient account of the physical operations of the firm and their
associated emission rates. Since these latter performance measures are arguably framed more
towards illuminating financial performance/stability than the other measures, then this might
indicate that financial stability or instability need not be a justification for sustaining yet
higher levels of emissions.

Voluntary Disclosure, Greenhouse Gas Emissions and Business Performance Page 17 of 28
Hypothesis 2: Business performance measures are not related to emissions identically.
Each of the performance measures are defined in different metrics, which is a direct result of
their unique purposes. For example, TOBQ is a ratio intended to reflect an eclectic snapshot
of overall firm performance and has a fundamentally different metric to SALES, with the
latter being expressed in an easy to understand money metric. It stands to reason that their
relationships with emissions should differ. To evaluate this hypothesis requires comparing in
some way the same coefficients from the same model structures, but with different
performance measures included on the right hand side. There are a number of ways that such
hypotheses could be formulated, but a pragmatic approach is taken here.
As discussed with regard to the previous hypothesis, there are some substantial differences in
how performance measures of different types are related to emissions. The fact that some
illustrates significant Kuznet’s-type curves, and others do not, is sufficient evidence so as to
be unable to reject hypothesis 2. No effort is made here to reconcile such differences; rather
the purpose here is to highlight their existence. These differences pose interesting concerns
for environmental impact management, inasmuch as firms pursuing different performance
objectives may be reasonably able to justify several alternative emissions levels as being
admissible. Although not a focus of the present paper, it is abundantly clear that to reconcile
their differences is a pressing priority for future study.
Hypothesis 3: Voluntary disclosure of greenhouse gas emissions affects the nature of the
emissions-business performance relationship.
This hypothesis is evaluated using the coefficient values from a Heckman selection type
model which makes corrections for self-selection into emissions reporting.

Voluntary Disclosure, Greenhouse Gas Emissions and Business Performance Page 18 of 28
The results to this point provide compelling evidence that a firm-level environmental Kuznet-
curve does exist, but that it can be sensitive to the choice of performance measure used. The
aim here is to consider the possibility that the conclusions so far might be sensitive to
possible bases that can arise when modelling data involving self-selection (or pre-determined
choices). Table 2 highlights the level of attrition in the dataset regarding the reporting of
emissions, with only 256 observations being available from an initial sample of over 3,500
observations in principle. For the performance measures used, there is virtually full and
complete data either from the stock market or from the mandatory company accounts. Hence,
the level of attrition in reported emissions is due to self-selected non-reporting. In general
over the sample period there has been no specific requirement on firms to report their
emissions; however, some firms have chosen to adopt transparency principles as part of their
corporate social responsibility activities. Giving a transparent view of emissions levels
potentially serves as a signal to stakeholders of the integrity of a given firm, which could in
turn generate some intangible added-value for the firm in terms of environmental warm-glow
and/or customer and investor loyalty. An alternative view is that it simply provides another
basis to question management performance in a difficult to control area such that widespread
withholding of GHG data or deliberate neglect to measure GHG emissions may be implicitly
deemed preferable.
The results of the selection models are reported in Tables 5 and 6 respectively. The results in
Tables 5 and 6 compare fairly closely with Tables 3 and 4, suggesting that the possible
concerns that self-selection in to reporting may not be a source of major bias. Two notable
differences come from the insignificance of the ASSETS and EQUITY performance
measures under the selection model, although if a 20% significance level is seen as
acceptable, then they both support the EKC hypothesis. Taken together the implications of
Voluntary Disclosure, Greenhouse Gas Emissions and Business Performance Page 19 of 28
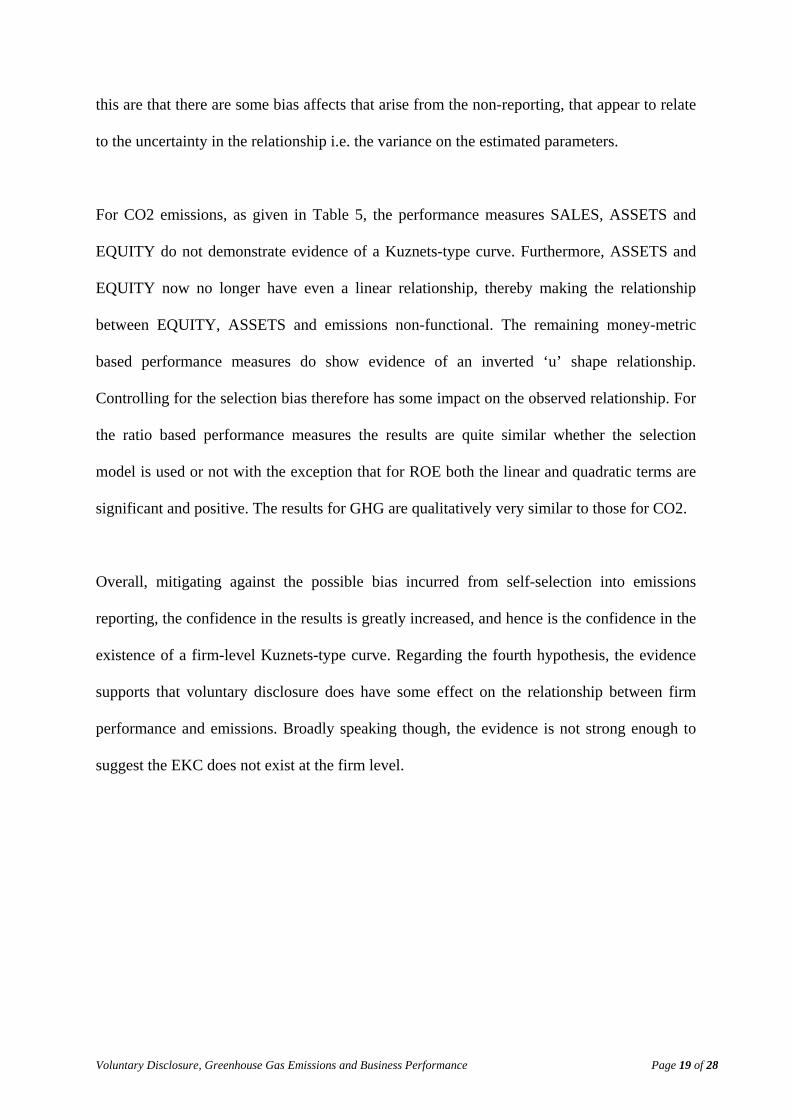
this are that there are some bias affects that arise from the non-reporting, that appear to relate
to the uncertainty in the relationship i.e. the variance on the estimated parameters.
For CO2 emissions, as given in Table 5, the performance measures SALES, ASSETS and
EQUITY do not demonstrate evidence of a Kuznets-type curve. Furthermore, ASSETS and
EQUITY now no longer have even a linear relationship, thereby making the relationship
between EQUITY, ASSETS and emissions non-functional. The remaining money-metric
based performance measures do show evidence of an inverted ‘u’ shape relationship.
Controlling for the selection bias therefore has some impact on the observed relationship. For
the ratio based performance measures the results are quite similar whether the selection
model is used or not with the exception that for ROE both the linear and quadratic terms are
significant and positive. The results for GHG are qualitatively very similar to those for CO2.
Overall, mitigating against the possible bias incurred from self-selection into emissions
reporting, the confidence in the results is greatly increased, and hence is the confidence in the
existence of a firm-level Kuznets-type curve. Regarding the fourth hypothesis, the evidence
supports that voluntary disclosure does have some effect on the relationship between firm
performance and emissions. Broadly speaking though, the evidence is not strong enough to
suggest the EKC does not exist at the firm level.

Voluntary Disclosure, Greenhouse Gas Emissions and Business Performance Page 20 of 28
Table 5: CO2 with control for sample selection—asymptotic p-value in brackets.
Money metric performance measures (per employee) Ratio based performance measures
Performance measure: SALES EBITDA PROFITS OPROF BTPROF MCAP ASSETS EQUITY PRICE LEV ROA ROE TOBQ
Selection equation
Environmental disclosure 0.034 0.029 0.034 0.029 0.034 0.034 0.034 0.034 0.034 0.034 0.034 0.034 0.034
0.00 0.00 0.00 0.00 0.00 0.00 0.00 0.00 0.00 0.00 0.00 0.00 0.00
Social disclosure ‐0.004 0.001 ‐0.004 ‐0.001 ‐0.004 ‐0.004 ‐0.004 ‐0.004 ‐0.004 ‐0.004 ‐0.004 ‐0.004 ‐0.004 0.36 0.81 0.36 0.89 0.36 0.36 0.36 0.36 0.36 0.36 0.36 0.31 0.36
Governance disclosure ‐0.004 ‐0.009 ‐0.004 ‐0.008 ‐0.004 ‐0.004 ‐0.004 ‐0.004 ‐0.004 ‐0.004 ‐0.004 ‐0.002 ‐0.004 0.49 0.16 0.49 0.20 0.49 0.49 0.49 0.49 0.49 0.49 0.49 0.71 0.49
Stage 1 observations 908 908 908 908 908 908 908 908 908 908 908 908 908
Emissions equation
Level term 1.229 6.488 0.728 9.682 0.906 0.701 0.175 0.320 ‐0.002 ‐0.008 0.049 0.020 0.523
0.02 0.00 0.06 0.00 0.02 0.00 0.07 0.13 0.03 0.83 0.35 0.03 0.63
Squared term ‐0.088 ‐1.467 ‐0.025 ‐2.965 ‐0.034 ‐0.024 ‐0.003 ‐0.009 0.000 0.000 0.001 0.000 ‐0.081
0.27 0.00 0.07 0.00 0.02 0.00 0.12 0.18 0.20 0.81 0.64 0.06 0.71
Stage 2 observations 258 225 258 221 258 258 258 258 258 258 258 241 258 Note: SALES, EBITDA, PROFITS , OPROF, BTPROF, MCAP, ASSETS, EQUITY are in million British pounds. ROA, ROE in percentage terms, PRICE is in British Pounds
Voluntary Disclosure, Greenhouse Gas Emissions and Business Performance Page 21 of 28
Table 6: Greenhouse gasses with control for sample selection—asymptotic p-value in brackets.
Money metric performance measures (per employee) Ratio based performance measures
Performance measure: SALES EBITDA PROFITS OPROF BTPROF MCAP ASSETS EQUITY PRICE LEV ROA ROE TOBQ
Selection equation
Environmental disclosure 0.034 0.029 0.034 0.029 0.034 0.034 0.034 0.034 0.034 0.034 0.034 0.034 0.034 0.00 0.00 0.00 0.00 0.00 0.00 0.00 0.00 0.00 0.00 0.00 0.00 0.00
Social disclosure ‐0.004 0.001 ‐0.004 ‐0.001 ‐0.004 ‐0.004 ‐0.004 ‐0.004 ‐0.004 ‐0.004 ‐0.004 ‐0.004 ‐0.004 0.42 0.81 0.42 0.90 0.42 0.42 0.42 0.42 0.42 0.42 0.42 0.37 0.42
Governance disclosure ‐0.005 ‐0.009 ‐0.005 ‐0.009 ‐0.005 ‐0.005 ‐0.005 ‐0.005 ‐0.005 ‐0.005 ‐0.005 ‐0.003 ‐0.005
0.39 0.13 0.39 0.16 0.39 0.39 0.39 0.39 0.39 0.39 0.39 0.59 0.39
Stage 1 observations 908 908 908 908 908 908 908 908 908 908 908 908 908
Emissions equation
Level term 1.052 6.328 0.723 9.329 0.894 0.689 0.150 0.319 ‐0.002 ‐0.016 0.049 0.019 0.791
0.04 0.00 0.06 0.00 0.02 0.00 0.12 0.13 0.04 0.68 0.34 0.04 0.46
Squared term ‐0.066 ‐1.421 ‐0.026 ‐2.832 ‐0.035 ‐0.024 ‐0.002 ‐0.008 0.000 0.000 0.001 0.000 ‐0.124
0.40 0.00 0.06 0.00 0.02 0.00 0.19 0.19 0.23 0.74 0.69 0.07 0.56
Stage 2 observations 256 224 256 220 256 256 256 256 256 256 256 239 256 Note: SALES, EBITDA, PROFITS , OPROF, BTPROF, MCAP, ASSETS, EQUITY are in million British pounds. ROA, ROE in percentage terms, PRICE is in British Pounds

Voluntary Disclosure, Greenhouse Gas Emissions and Business Performance Page 22 of 28
Summary and Concluding Remarks
The aim of this paper has been to examine the extent of UK firms’ emissions reporting over
the first decade of the 21st century and to test whether firm performance and emissions levels
are related to each other. Additionally whether the kinds of functional relationships discussed
in the empirical environmental literature have some validity at the firm level are considered.
A wide range of performance measures are considered, to help validate the generality of the
conclusions, as well as two definitions of emissions CO2 and the more encompassing
measure of GHG. The measures are split into two types: money metric performance measures
such as PROFITS or EQUITY, and ratio based performance measures such as LEV and
TOBQ. A clear inverted U-shape is found when benchmarking against money metric based
performance measures, while the evidence is less strong when using ratio based performance
measures. These patterns are consistent across both types of emissions considered, albeit
stronger for CO2 than GHG, and are also robust to possible biases that might arise from self-
reporting.
To some degree the results pose questions regarding the role of environmental performance
management and the possible conflict that may arise from environmental targets that can be
potentially benchmarked against a range of alternative business performance measures. A
more specific quandary emerging from the analysis, deserving of future study, relates to the
apparent sensitivity of the results to money-metric versus ratio based measures of firm
performance. TOBQ could arguably conflate several aspects of performance, making it more
difficult for a stable result to emerge using this measure, but other ratios such as LEV and
ROA are more difficult to defend. The model here embeds simple linear specifications,
implying one of two things, either these performance measures share no relation with
emissions, or on the other hand, maybe a relationship does exist, but is non-linear of a higher

Voluntary Disclosure, Greenhouse Gas Emissions and Business Performance Page 23 of 28
order than a simple inverted U-shape can handle. Both options are worth exploring further,
though perhaps the former holds greater weight, since these two measures in particular are
arguably more uniquely connected to the financial wealth of a firm, whereas the other
performance measures more closely reflect, to a greater or lesser degree, the physical
operations which will ultimately be the source of the emissions.

Voluntary Disclosure, Greenhouse Gas Emissions and Business Performance Page 24 of 28
References
Ambec, S, Cohen, M.A., Elgie, S. and Lanoie, P. 2013. ‘The Porter hypothesis at 20: Can
environmental regulation enhance innovation and competitiveness’ Review of
Environmental Economics and Policy, online, doi: 10.1093/reep/res016.
Anton, W.R.Q., Deltas, G. and Khanna, M. 2004. ‘Incentives for environmental self-
regulation and implications for environmental performance’, Journal of Environmental
Economics and Management 48(1): 632–654.
Arora, S. and Gangopadhyay, S. 1995. ‘Towards a theoretical model of voluntary over
compliance’, Journal of Economic Behavior and Organization. 28(3): 289-309.
Baumol, W. and Oates. W. (1988). Theory of Environmental Policy (Second edition)
Cambridge: Cambridge University Press.
Bertinelli, L.T., and Strobl, E. 2005. ‘The Environmental Kuznets Curve semi-parametrically
revisited”, Economics Letters 88(3): 350–357.
Bloomberg L.P. 2013. Accounting/corporate data. Retrieved Mar. 1, 2013 from Bloomberg
database.
Brunnermeier, S.B. and Cohen, M.A. 2003. “Determinants of environmental innovation in
US manufacturing industries”, Journal of Environmental Economics and Management
45(2): 278–29.
Carrión-Flores, C.E., and Innes, R. 2010. “Environmental innovation and environmental
performance”, Journal of Environmental Economics and Management 59(1): 27–42.
Chimeli, A.B. and Braden, J.B. 2005. ‘Total factor productivity and the environmental
Kuznets curve”, Journal of Environmental Economics and Management 49(2): 366–
380.
Cho, C.H, and Patten, D.M. 2007. “The role of environmental disclosures as tools of
legitimacy: A research note”. Accounting, Organizations and Society. 32(7–8): 639–
647.
Coase, R.H. 1960. ‘The problem of social cost’, Journal of Law and Economics 3(1): 1-44.

Voluntary Disclosure, Greenhouse Gas Emissions and Business Performance Page 25 of 28
Cole, M.A., Elliott, R.J.R. and Shimamoto, K. 2006. “Globalization, firm-level characteristics
and environmental management: A study of Japan”, Ecological Economics 59(3): 312-
323.
Collins, A., and Harris, R.I.D. 2002. “Does plant ownership affect the level of pollution
abatement expenditure?”, Land Economics 78(2): 171-189.
Collins, A., and Harris, R.I.D. 2005. ‘The impact of foreign ownership and efficiency on
pollution abatement expenditure by chemical plants: Some UK evidence”, Scottish
Journal of Political Economy 52(5): 747-768.
Cox, A., Collins, A, Woods, L. And Ferguson N. 2012. “A household-level environmental
Kuznets curve? Recent evidence on transport emissions and household income”,
Economics Letters 115(2): 187-189.
Dales, J.H. 1968. Pollution, Property & Prices: An Essay in Policy-Making and Economics.
Toronto: University of Toronto Press.
Dasgupta, S., Laplante, B., Wang, H. and Wheeler, D. 2002. “Confronting the Environmental
Kuznets Curve”, Journal of Economic Perspectives 16(1): 147-168.
Davison, A.C., and Hinkley, D.V. 1997. Bootstrap Methods and Their Application,
Cambridge, MA: Cambridge University Press.
Dinda, S. 2004 “Environmental Kuznets curve hypothesis: a survey”, Ecological Economics
49(4): 431–455.
Dinda, S. 2005. “A theoretical basis for the environmental Kuznets curve”, Ecological
Economics 53(3): 403– 413.
Efron, B and Tibshirani, R.J. 1993. Introduction to the Bootstrap, Boca Raton Florida:
Chapman& Hall/CRC
Fernández, E., Peréz, R. and Ruiz, J. 2012. ‘The environmental Kuznets curve and
equilibrium indeterminacy”, Journal of Economic Dynamics & Control 36(11): 1700–
1717.

Voluntary Disclosure, Greenhouse Gas Emissions and Business Performance Page 26 of 28
Frondel, M., Horbach, J. and Rennings, K. 2008. “What triggers environmental management
and innovation? Empirical evidence for Germany”, Ecological Economics 66(1): 153-
160.
Galeotti, M., Lanza, A. and Pauli, F. 2006. “Reassessing the environmental Kuznets curve for
CO2 emissions: a robustness exercise”, Ecological Economics 57(1): 152– 163.
Grant II, D.S., Bergesen, A.J. and Jones, A.W. 2002. “Organizational size and pollution: the
case of the U.S. chemical industry”, American Sociological Review 67(3): 389-407.
Hartman, R. and Kwon, O-S. 2005. “Sustainable growth and the environmental Kuznets
curve”, Journal of Economic Dynamics & Control 29(10): 1701–1736.
He, J. 2006. “Pollution haven hypothesis and environmental impacts of foreign direct
investment: the case of industrial emission of sulfur dioxide (SO2) in Chinese
provinces”, Ecological Economics 60(1): 228-1736.
Horváthová, E. 2010. “Does environmental performance affect financial performance? A
meta-analysis”, Ecological Economics 70(1): 52–59.
Jaffe, A.B. and Palmer, K. 1997. “Environmental regulation and innovation: a panel data
study”, Review of Economics and Statistics 79(4): 610-619.
Johnston, R. and Pongatichat, P. 2008. “Managing the tension between performance
measurement and strategy: coping strategies”, International Journal of Operations &
Production Management 28(10): 941-967.
Kahn, M.E. 1998. “A household level environmental Kuznets curve”, Economics Letters
59(2): 269–273.
Kassinis, G. and Vafeas, N. 2006. “Stakeholder pressures and environmental performance”,
Academy of Management Journal 49(1): 145-159.
Kijima, M., Nishide, K. and Ohyama, A. 2010. “Economic models for the environmental
Kuznets curve: a survey”, Journal of Economic Dynamics & Control 34(7): 1187–
1201.

Voluntary Disclosure, Greenhouse Gas Emissions and Business Performance Page 27 of 28
Kim, E.H., and Lyon, T. 2011. “When does institutional investor activism increase
shareholder value?: the carbon disclosure project”, The BE Journal of Economic
Analysis & Policy 11online doi: 10.2202/1935-1682.2676
Konar, S. and Cohen, M.A. 2001. “Does the market value environmental performance?”,
Review of Economics and Statistics, 83(2): 281-289.
Kraus A., Litzenberger R.H. 1973. “A State-preference model of optimal financial leverage”,
Journal of Finance 28(4): 911-922.
Kula, E. 1998. History of Environmental Economic Thought, London: Routledge.
Lanoie, P., Laurent-Lucchetti, J., Johnstone, N. and Ambec, S. 2011. “Environmental policy,
innovation and performance: New insights on the Porter hypothesis”, Journal of
Economics & Management Strategy 20(3): 803-842.
Mahoney, L.S., Thorne, L., Cecil, L., LaGore, W. 2013. “A research note on standalone
corporate social responsibility reports: Signaling or greenwashing?”, Critical
Perspectives on Accounting, 24(4-5): 350-359.
Millimet, D.L., List, J.A. and Stengos, T. 2003. ‘The environmental Kuznets curve: real
progress or misspecified models?”, Review of Economics and Statistics 85(4): 1038–
1047.
Nahman, A. and Antrobus, G. (2005a). ‘The environmental Kuznets curve: a literature
survey”, South African Journal of Economics 73(1): 105–120.
Nahman, A. and Antrobus, G. (2005b). “Trade and the environmental Kuznets curve: Is
South Africa a pollution haven?”, South African Journal of Economics 73(4): 803-814.
Pearce, D. 2002. “An intellectual history of environmental economics”, Annual Review of
Energy and the Environment 27: 57-81.
Perman, R. and Stern, D.I. 2003. “Evidence from panel unit root and cointegration tests that
the environmental Kuznets curve does not exist”, Australian Journal of Agricultural
and Resource Economics 47(3): 325–347.
Porter , M.E. 1991. “America’s green strategy”, Scientific American, 264: 168.

Voluntary Disclosure, Greenhouse Gas Emissions and Business Performance Page 28 of 28
Porter, M.E,. and van der Linde, C. 1995. “Toward a new conception of the environment-
competitiveness relationship”, Journal of Economic Perspectives, 9(4): 97-118.
Shadbegian, R.J. and Gray, W.B. 2005. “Pollution abatement expenditures and plant-level
productivity: a production function approach”, Ecological Economics 54(2-3): 196–
208.
Stern, D. 2004 “The rise and fall of the environmental Kuznets curve”, World Development
32(8): 1419–1439.
Turner, K. and Hanley, N. 2011. “Energy efficiency, rebound effects and the environmental
Kuznets curve”, Ecological Economics, 33(5): 709-720.
Wagner, M. 2010, “The role of corporate sustainability performance for economic
performance: a firm-level analysis of moderation effects”, Ecological Economics 69(7):
1553–1560.
Wagner, M., Van Phu, N., Wehrmeyer, W. and Azomahou, T. 2002. “The relationship
between the environmental and economic performance of firms: an empirical analysis
of the European paper industry”, Corporate Social Responsibility and Environmental
Management, 9(3): 133–146.
Wen-Hsin Hsu, A., and Wang, T. 2013. “Does the market value corporate response to
climate change?”, Omega 41(2): 195-206.

Note:
This paper may not be quoted or reproduced without permission
Surrey Energy Economics Centre (SEEC)
School of Economics
University of Surrey
Guildford
Surrey GU2 7XH

SURREY
ENERGY
ECONOMICS
DISCUSSION PAPER
SERIES
For further information about SEEC please go to:
www.seec.surrey.ac.uk


![Greenhouse Gas Emissions and Emissions Trading in North … · 2020. 2. 23. · 2002] Stephenson-Greenhouse Gas Emissions, Kyoto and U.S. Response 45 greenhouse gas molecules. This](https://static.fdocuments.in/doc/165x107/60facf56e286b02f9b10de99/greenhouse-gas-emissions-and-emissions-trading-in-north-2020-2-23-2002-stephenson-greenhouse.jpg)


