Volume Metrology in Mexico and the USA - NIST
56
Volume Metrology in Mexico and the USA Roberto Arias Romero Dirección Flujo y Volumen Centro Nacional de Metrologia, Mexico John D. Wright Fluid Metrology Group National Institute of Standards and Technology, USA SIM Metrology School 2013; Gaithersburg, MD
Transcript of Volume Metrology in Mexico and the USA - NIST
Volume Metrology in Mexico and the USA
Roberto Arias Romero Dirección Flujo y Volumen
Centro Nacional de Metrologia, Mexico
John D. Wright Fluid Metrology Group
National Institute of Standards and Technology, USA
SIM Metrology School 2013; Gaithersburg, MD
Outline
1. Consumption and Distribution 2. Calibration and Traceability Chain 3. Volume Calibrations at NIST 4. Volume Calibrations at CENAM 5. CCM.FF-K4 6. Questions and comments
SIM Metrology School 2013; Gaithersburg, MD
1 Impact of volume measurements
SIM Metrology School 2013; Gaithersburg, MD

Major Oil Trade Movements
SIM Metrology School 2013; Gaithersburg, MD
Presenter
Presentation Notes
Each year US consumes 1200 metric tons of petroleum, 11 L/day for each person, half imported from… Japan is #3 consumer, 310 metric tons, 7 L/day/person
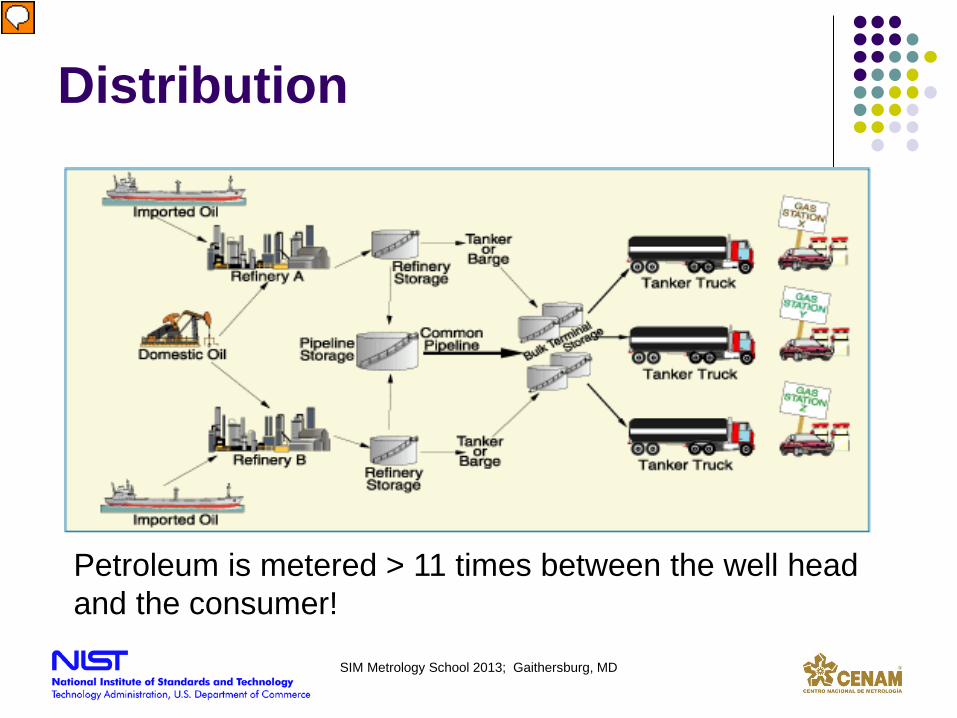
Distribution
Petroleum is metered > 11 times between the well head and the consumer!
SIM Metrology School 2013; Gaithersburg, MD
Presenter
Presentation Notes
Errors in flow measurements lead to very large amounts of money

Selected Crude Oil Trunkline Systems
SIM Metrology School 2013; Gaithersburg, MD
Presenter
Presentation Notes
Crude oil moves through pipelines from the US, Canada and the Gulf of Mexico to refineries (Gulf and Midwest)
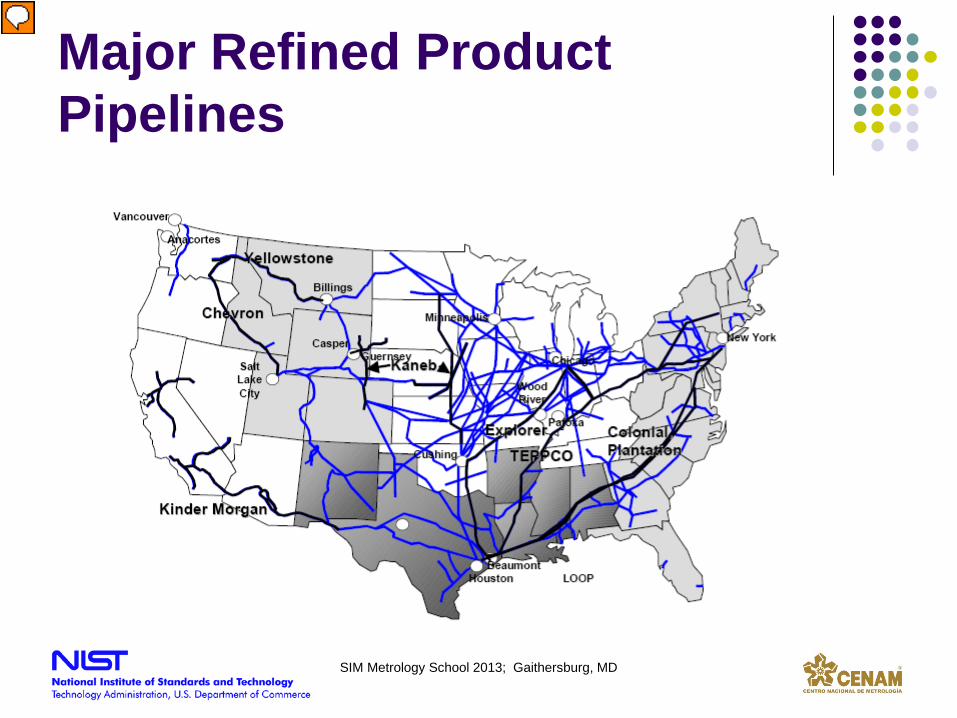
Major Refined Product Pipelines
SIM Metrology School 2013; Gaithersburg, MD
Presenter
Presentation Notes
2/3 of petroleum shipments in the US are by pipelines, cheap, adds only 2% to price of gas 6 to 16 km/hr, 14 to 22 days from Houston to NY. Batches move in the same pipeline, flowmeters calibrated in each product.
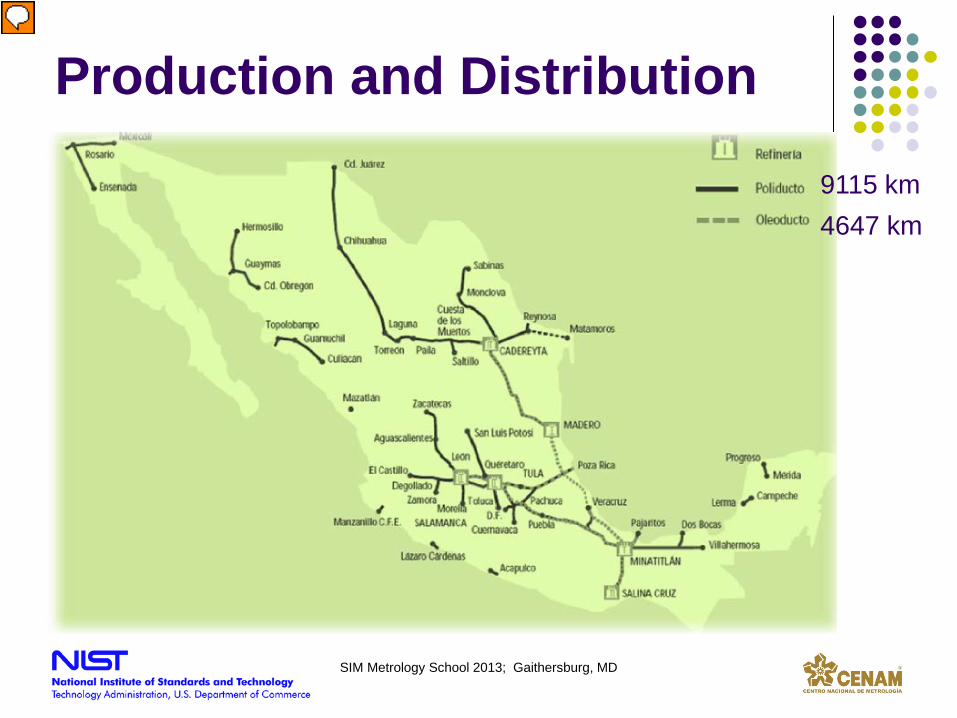
Production and Distribution
9115 km 4647 km
SIM Metrology School 2013; Gaithersburg, MD
Presenter
Presentation Notes
Pipelines cover just part of Mexican Territory. A lot of custody transfer operations take place by using road and rail tanks.
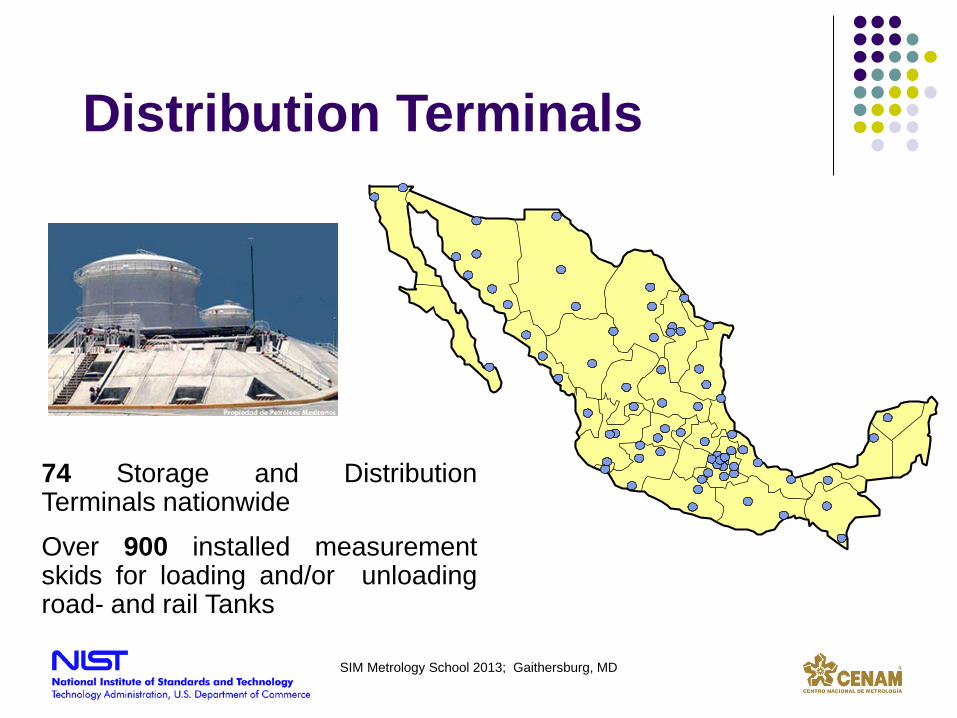
Distribution Terminals
74 Storage and Distribution Terminals nationwide Over 900 installed measurement skids for loading and/or unloading road- and rail Tanks
SIM Metrology School 2013; Gaithersburg, MD
2 Calibration and Traceability Chain
SIM Metrology School 2013; Gaithersburg, MD
Presenter
Presentation Notes
How to assure accuracy and fair sales of valuable petroleum products? Custody transfer operations
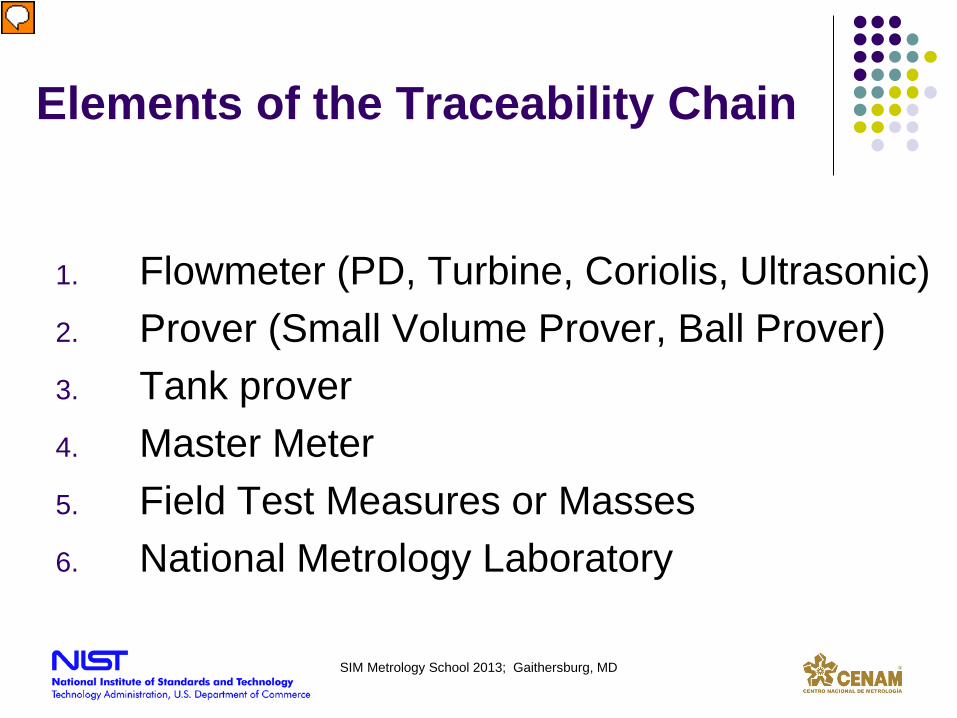
Elements of the Traceability Chain
1. Flowmeter (PD, Turbine, Coriolis, Ultrasonic) 2. Prover (Small Volume Prover, Ball Prover) 3. Tank prover 4. Master Meter 5. Field Test Measures or Masses 6. National Metrology Laboratory
SIM Metrology School 2013; Gaithersburg, MD
Presenter
Presentation Notes
JW: petroleum industry has developed a testing methods that connect flow measurements to national standards. Use the following elements. We describe them individually and then their usage in various combinations (different traceability chains)
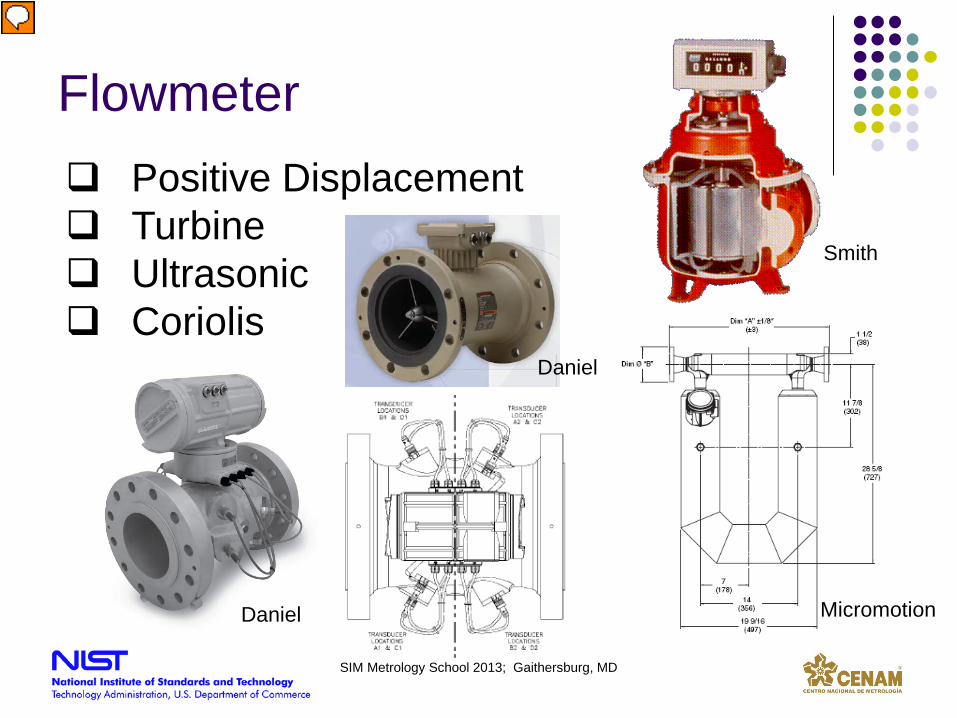
Flowmeter
Daniel
Positive Displacement Turbine Ultrasonic Coriolis
Daniel
Smith
SIM Metrology School 2013; Gaithersburg, MD
Micromotion
Presenter
Presentation Notes
JW: typical types used in petroleum in the US and Mexico… In general, PD and turbine for refined products, coriolis for fuel oil, PD and ultrasonic for crude oil.

Small Volume Prover
Brooks
SIM Metrology School 2013; Gaithersburg, MD
Presenter
Presentation Notes
RA Mostly, compact provers are used in cases where space is limited. Common use in offshore applications. Make use of the double chronometry method to diminish the impact of the reduced number of collected pulses.
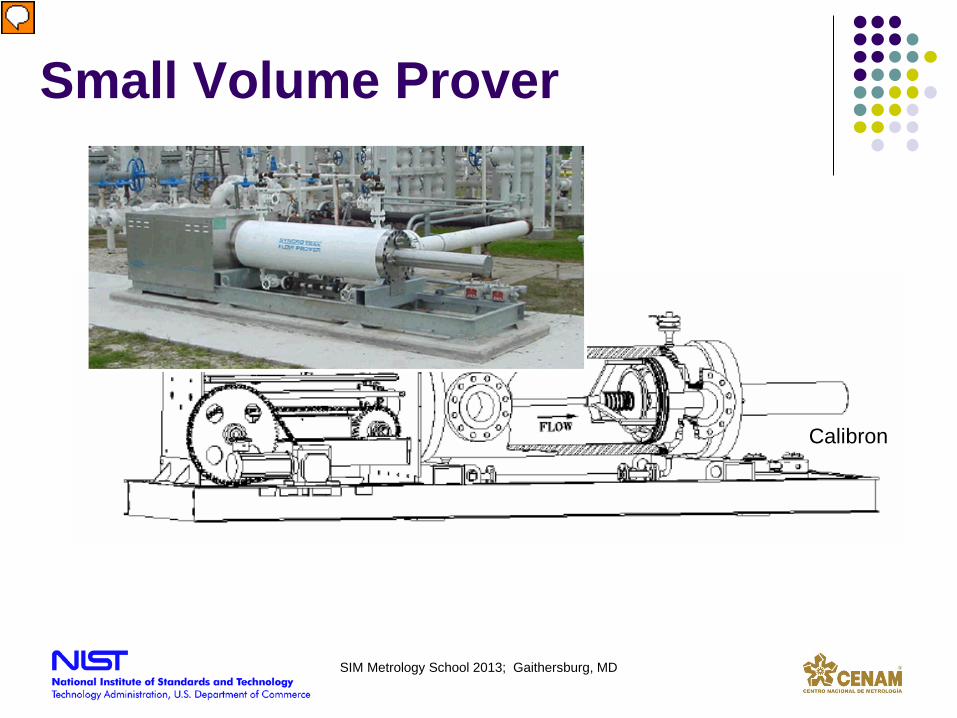
Small Volume Prover
Calibron
SIM Metrology School 2013; Gaithersburg, MD
Presenter
Presentation Notes
RA Care has to be taken in some SVP due to fact that upstream and downstream volumes can be different!! Pressure variations could affect the results of meter provings.
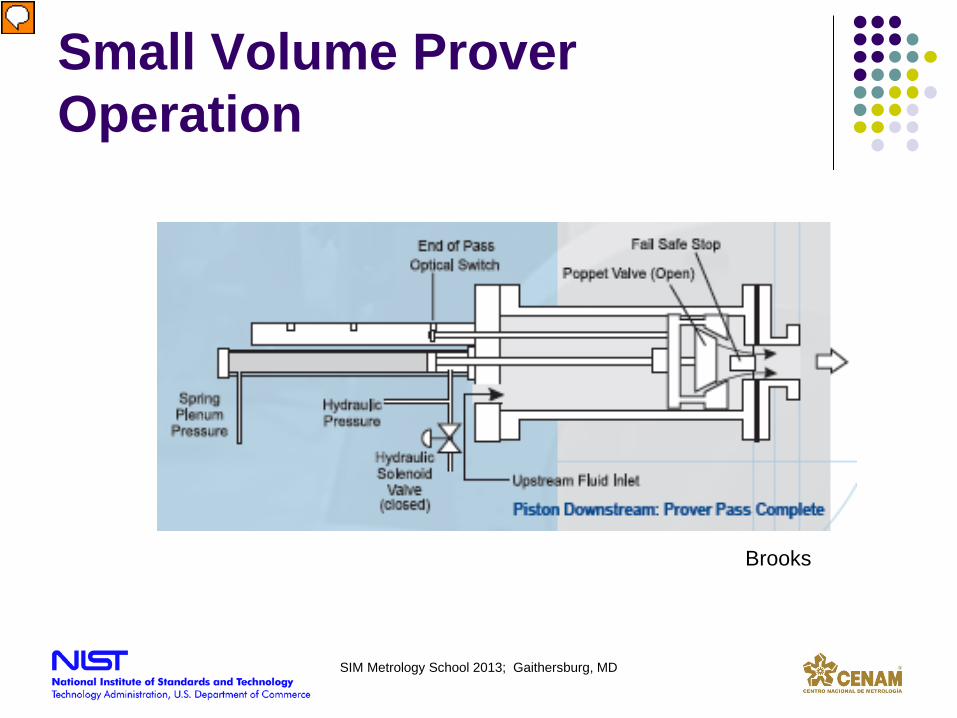
Small Volume Prover Operation
Brooks
SIM Metrology School 2013; Gaithersburg, MD
Presenter
Presentation Notes
RA
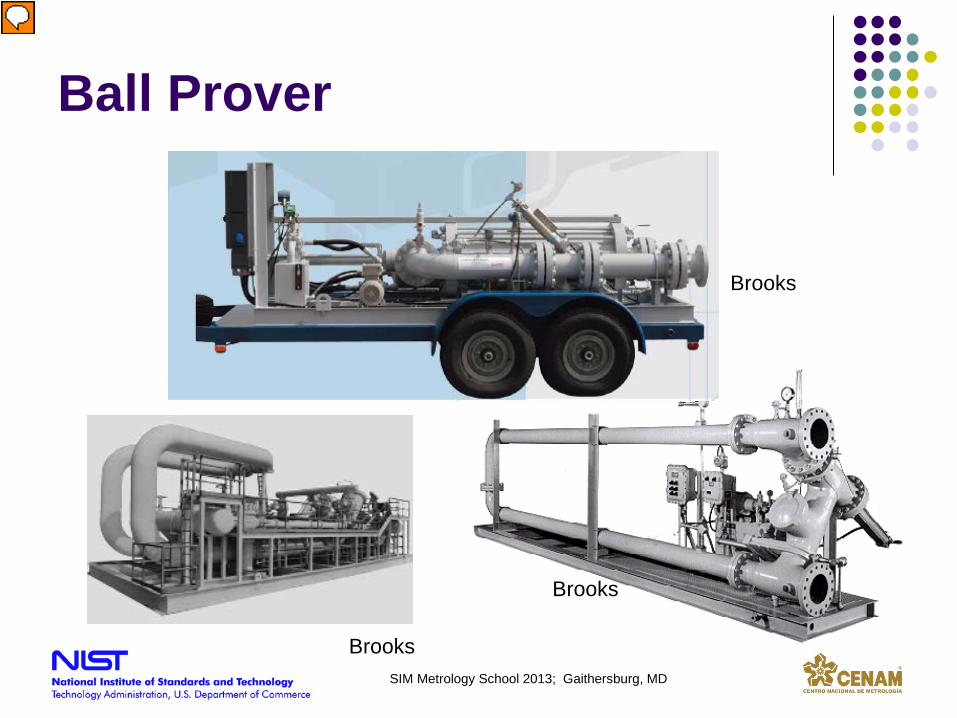
Ball Prover
Brooks
Brooks
Brooks SIM Metrology School 2013; Gaithersburg, MD
Presenter
Presentation Notes
RA
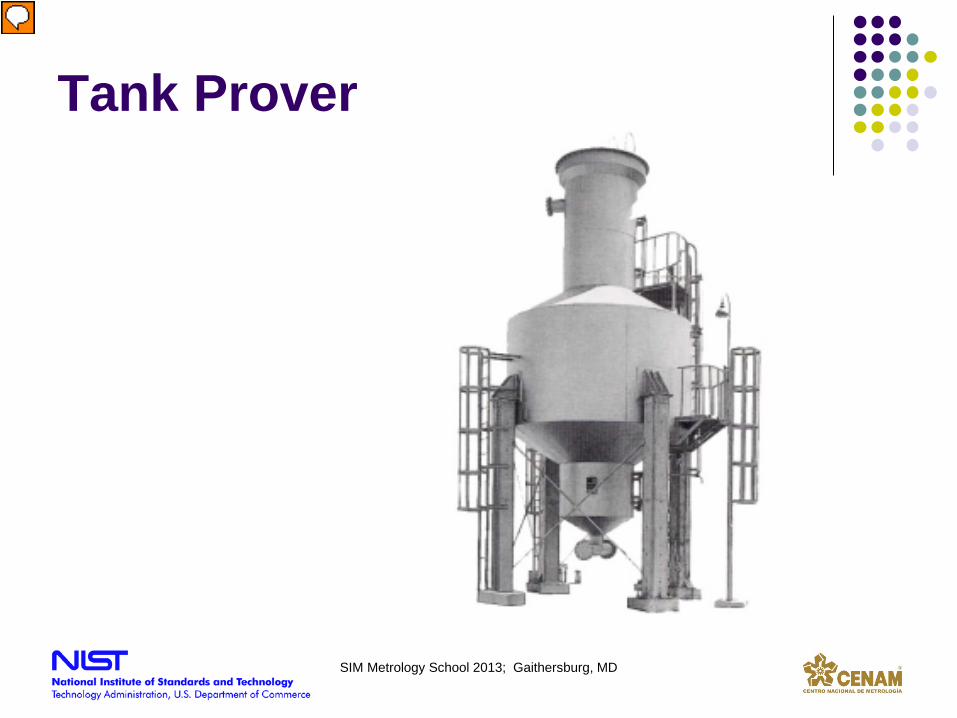
Tank Prover
SIM Metrology School 2013; Gaithersburg, MD
Presenter
Presentation Notes
JW: a permanently located calibrated volume used to determine MF for flowmeters. It is calibrated wit field test measures.
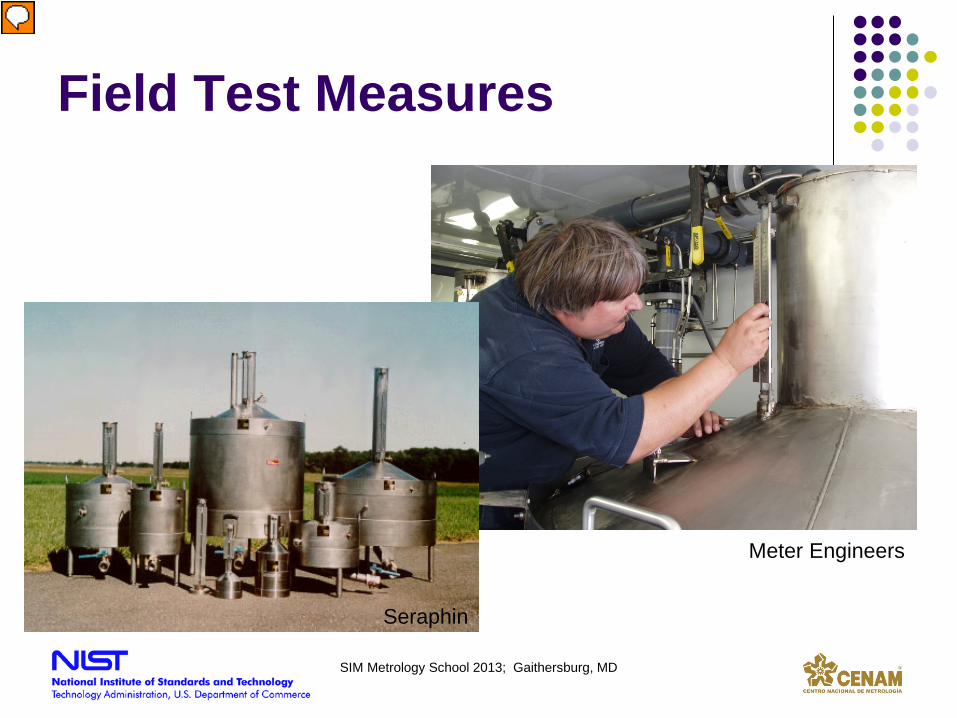
Field Test Measures
Meter Engineers
Seraphin
SIM Metrology School 2013; Gaithersburg, MD
Presenter
Presentation Notes
JW: Volumes calibrated gravimetrically or by volume transfer in the national labs. Various sizes added together can calibrate tank , SV, or ball provers.

Master Meters
mmm
mpmb
CPLCTLIVCTLCTSSRu)(V
MF⋅⋅⋅⋅⋅
=
SIM Metrology School 2013; Gaithersburg, MD
Presenter
Presentation Notes
RA: flowmeters with highest metrological qualities: repeatability, linearity, robustness, understood behavior for environmental effects, liquid property changes, installation effects. Cost effective method to verify performance of in line meters.
Definition of Traceability
JCGM 200:2008 2.41 (6.10) metrological traceability property of a measurement result whereby the result can be related to a reference through a documented unbroken chain of calibrations, each contributing to the measurement uncertainty.
SIM Metrology School 2013; Gaithersburg, MD
Presenter
Presentation Notes
JW
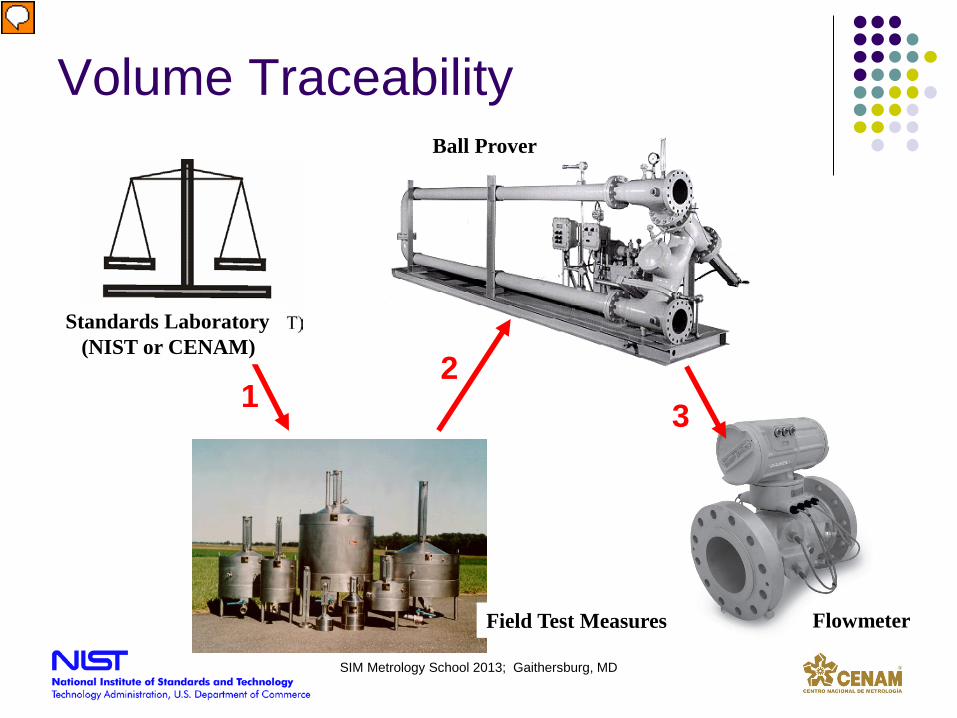
Volume Traceability
1 2
3
Standards Laboratory (NIST or CENAM)
Ball Prover
Flowmeter Field Test Measures
SIM Metrology School 2013; Gaithersburg, MD
Presenter
Presentation Notes
We show the most commonly used arrangements of the traceability elements. JW
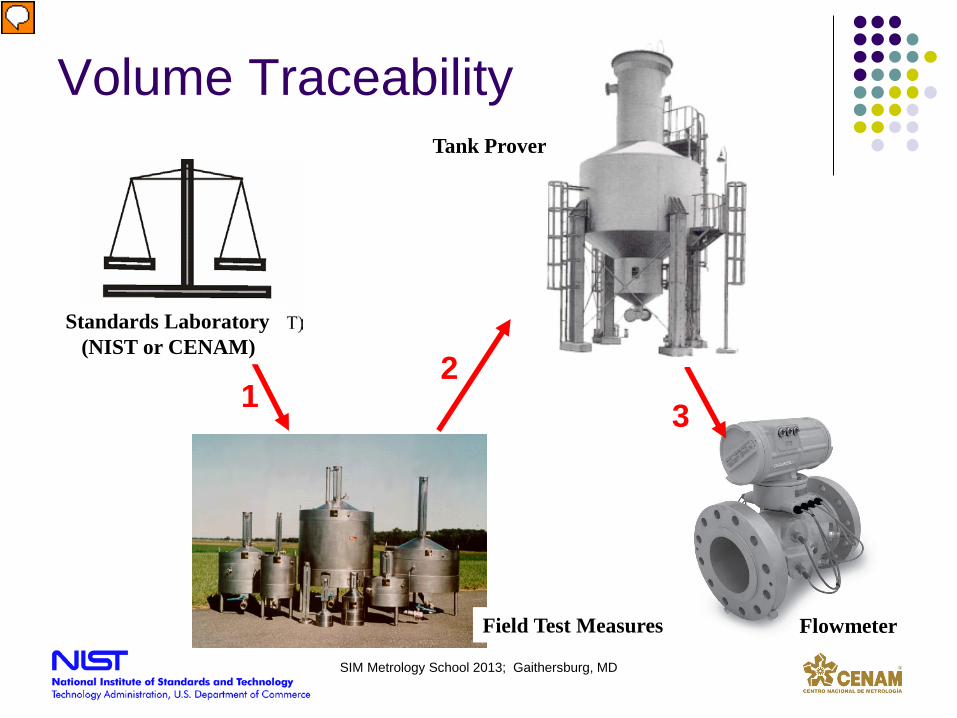
Volume Traceability
1 2
3
Standards Laboratory (NIST or CENAM)
Flowmeter Field Test Measures
Tank Prover
SIM Metrology School 2013; Gaithersburg, MD
Presenter
Presentation Notes
JW
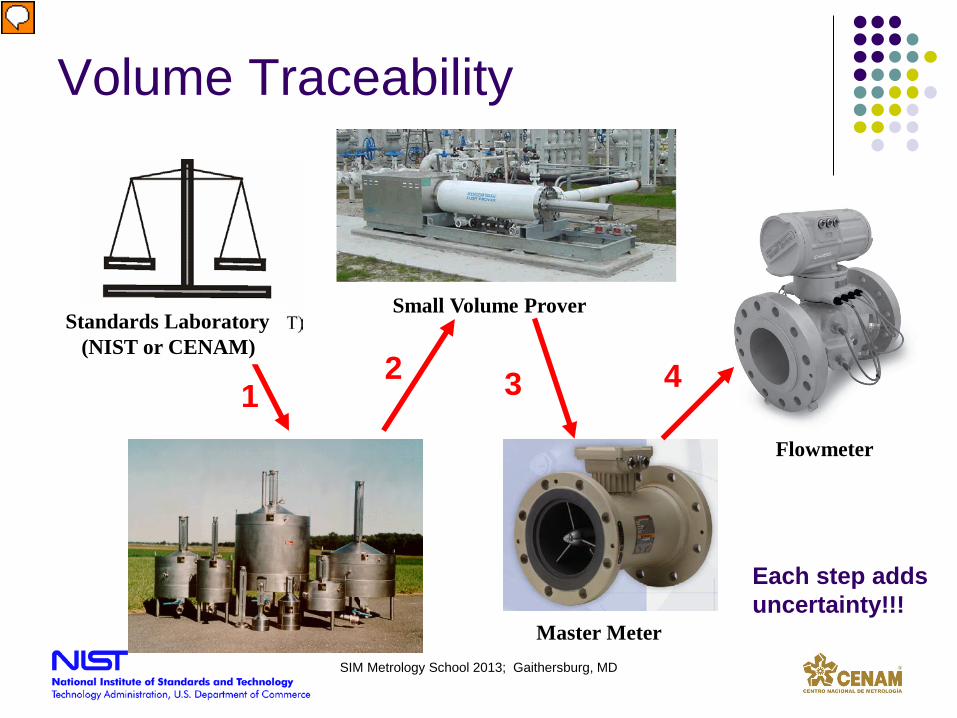
Volume Traceability
1 2 3
Standards Laboratory (NIST or CENAM)
Flowmeter
Small Volume Prover
Master Meter
4
Each step adds uncertainty!!!
SIM Metrology School 2013; Gaithersburg, MD
Presenter
Presentation Notes
JW
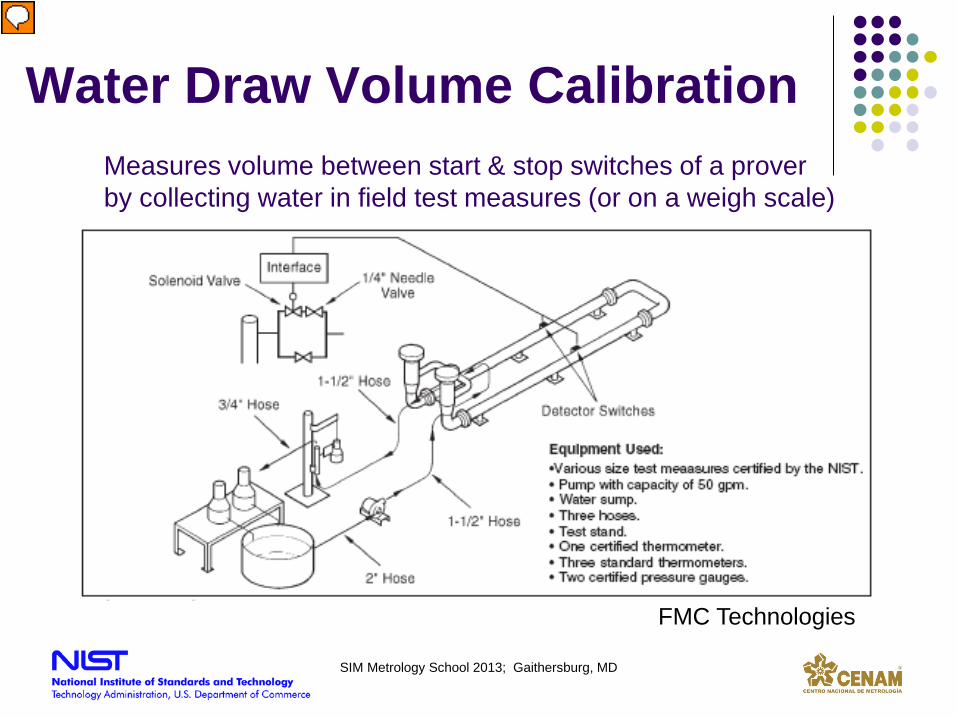
Water Draw Volume Calibration
FMC Technologies
Measures volume between start & stop switches of a prover by collecting water in field test measures (or on a weigh scale)
SIM Metrology School 2013; Gaithersburg, MD
Presenter
Presentation Notes
JW

Meter Proving
Calibration performed by comparing a flowmeter totalized volume to:
1. ball prover 2. small volume prover 3. tank prover 4. master meter
SIM Metrology School 2013; Gaithersburg, MD
Presenter
Presentation Notes
RA, we will cover ball prover
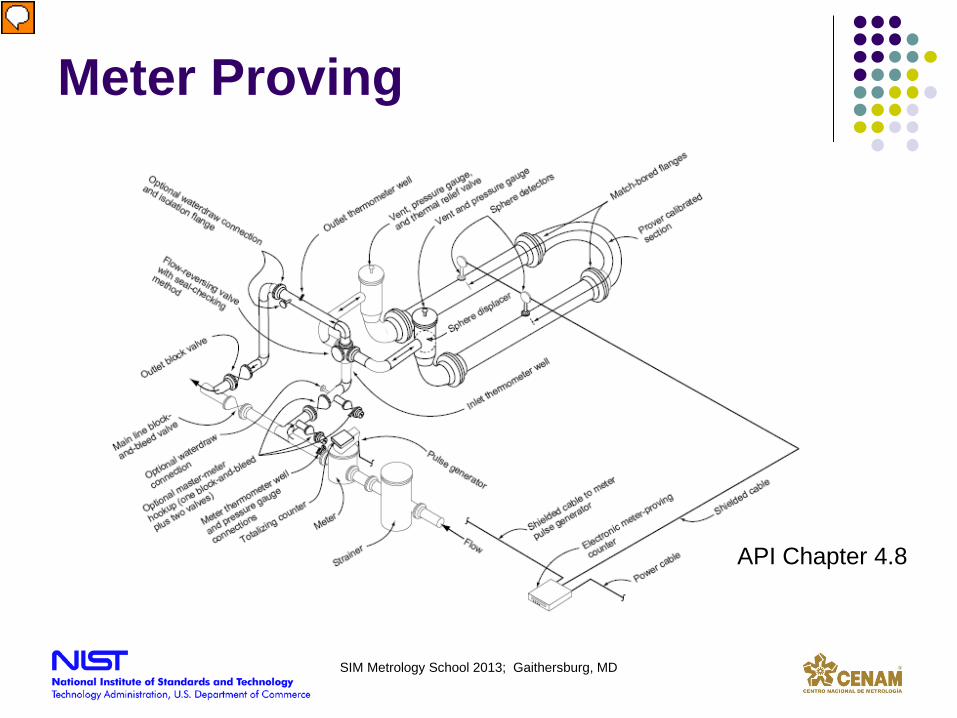
Meter Proving
API Chapter 4.8
SIM Metrology School 2013; Gaithersburg, MD
Presenter
Presentation Notes
RA
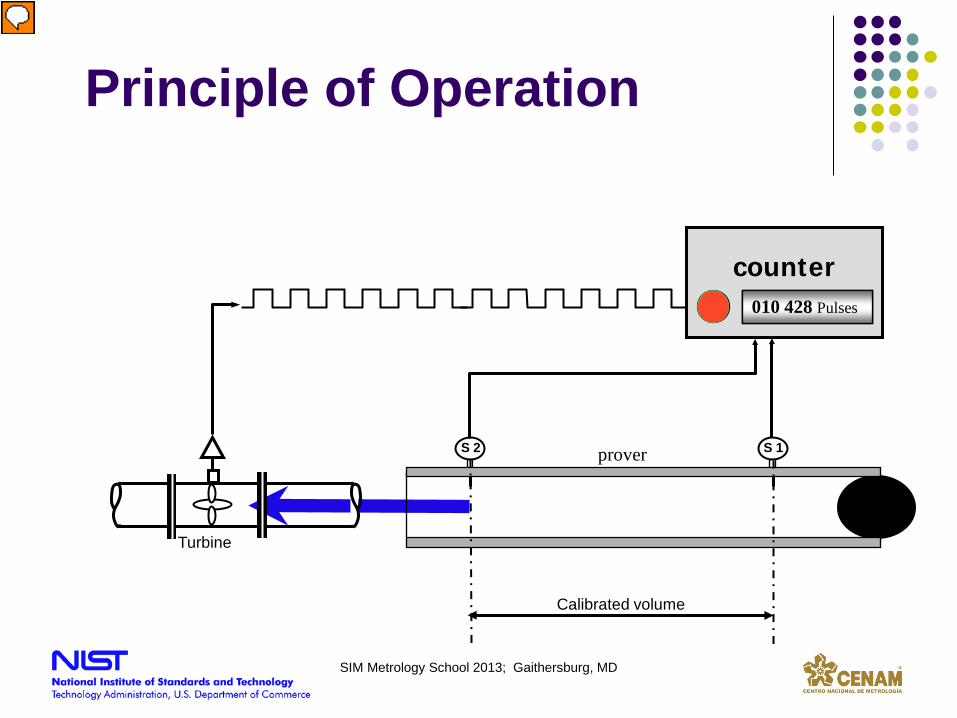
counter
S 2 S 1
Calibrated volume
000 000 Pulsos 005 326 Pulsos 010 428 Pulses
prover
Turbine
Principle of Operation
SIM Metrology School 2013; Gaithersburg, MD
Presenter
Presentation Notes
RA
3 Volume Calibrations at NIST
SIM Metrology School 2013; Gaithersburg, MD
NIST Special Publication 250-72
www.nist.gov Documentation for
customers Methods and
equations Uncertainty analysis Sample reports
SIM Metrology School 2013; Gaithersburg, MD
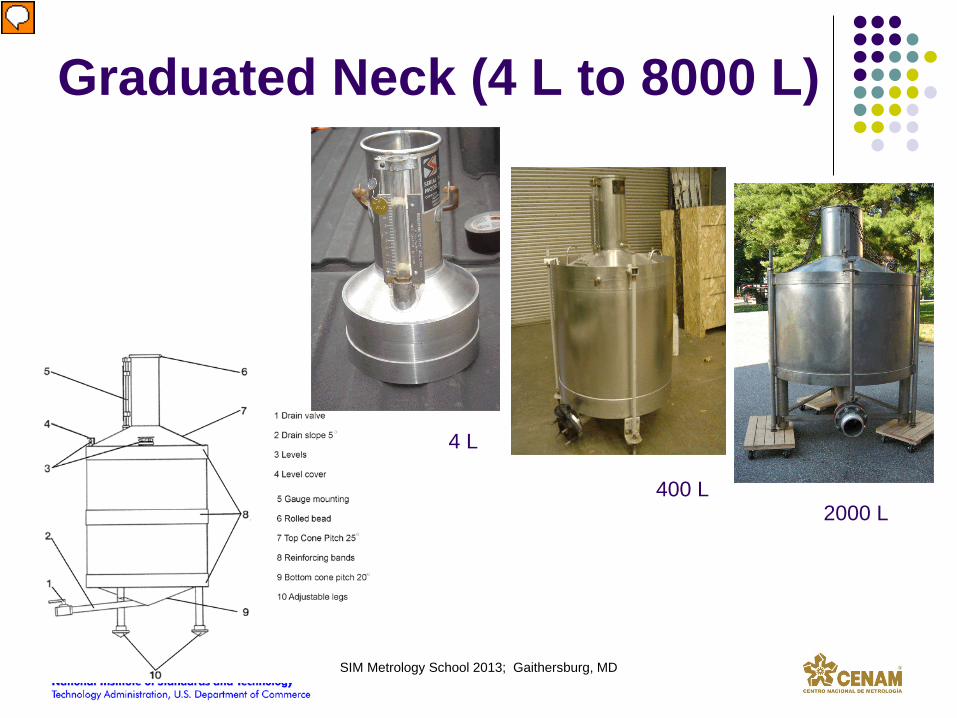
Graduated Neck (4 L to 8000 L)
2000 L
4 L
400 L
SIM Metrology School 2013; Gaithersburg, MD
Presenter
Presentation Notes
& methods used at NIST, volume transfer, etc. I will cover the most common, direct weighing.
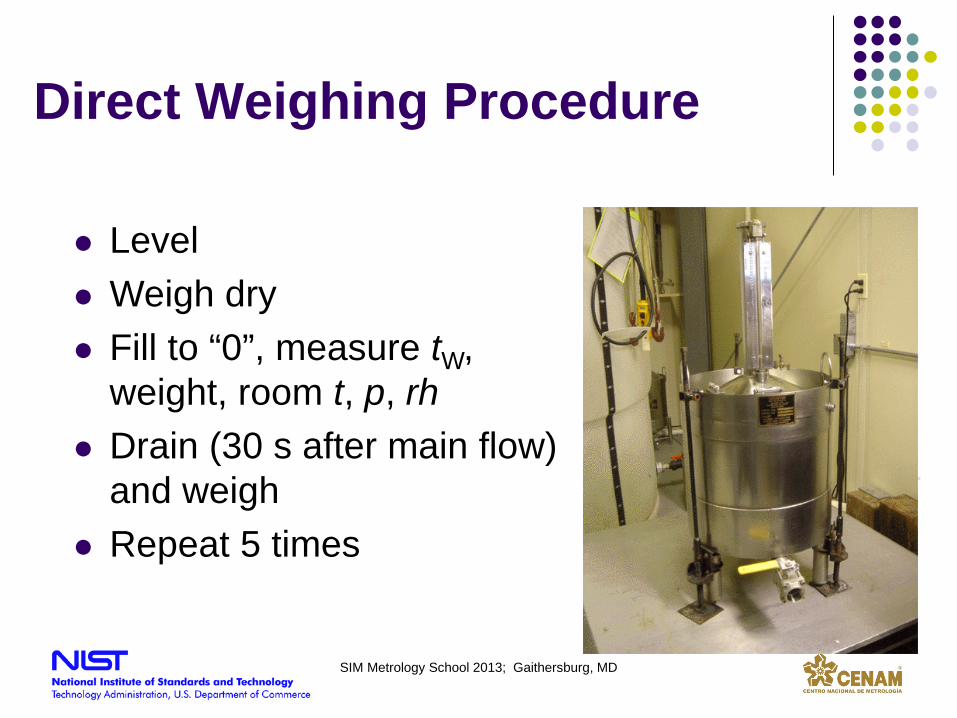
Direct Weighing Procedure
Level Weigh dry Fill to “0”, measure tW,
weight, room t, p, rh Drain (30 s after main flow)
and weigh Repeat 5 times
SIM Metrology School 2013; Gaithersburg, MD
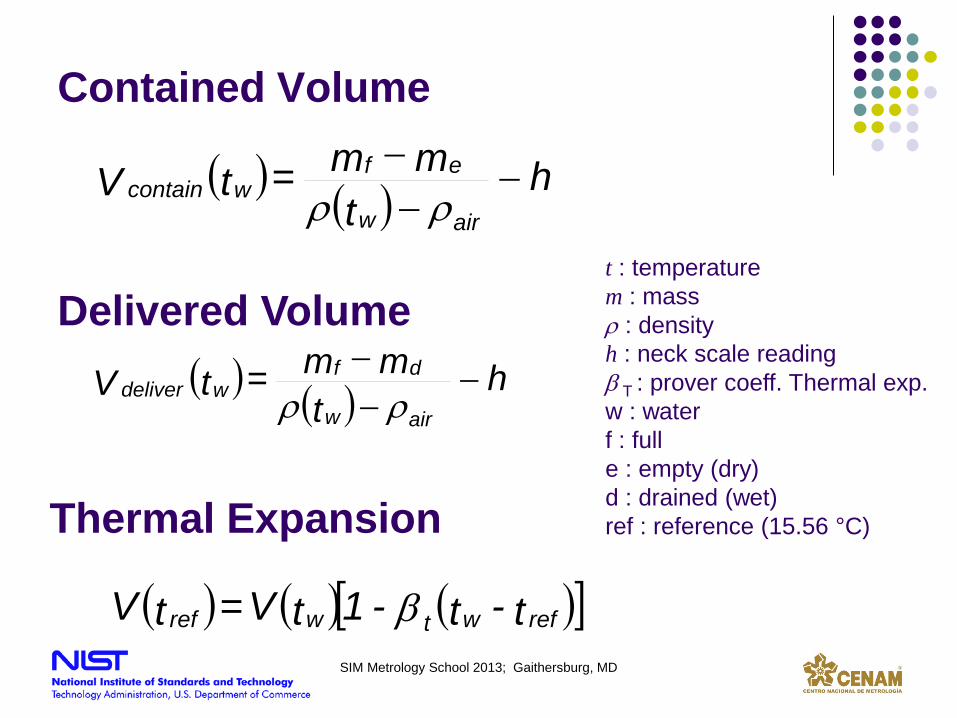
Contained Volume
( ) ( ) h t
m m = tVairw
dfwdeliver −
−−ρρ
( ) ( ) h t
m m = tVairw
efwcontain −
−−
ρρ
( ) ( ) ( )[ ]t- t- 1tV= tV refwtwref β
Delivered Volume
Thermal Expansion
t : temperature m : mass ρ : density h : neck scale reading β T : prover coeff. Thermal exp. w : water f : full e : empty (dry) d : drained (wet) ref : reference (15.56 °C)
SIM Metrology School 2013; Gaithersburg, MD
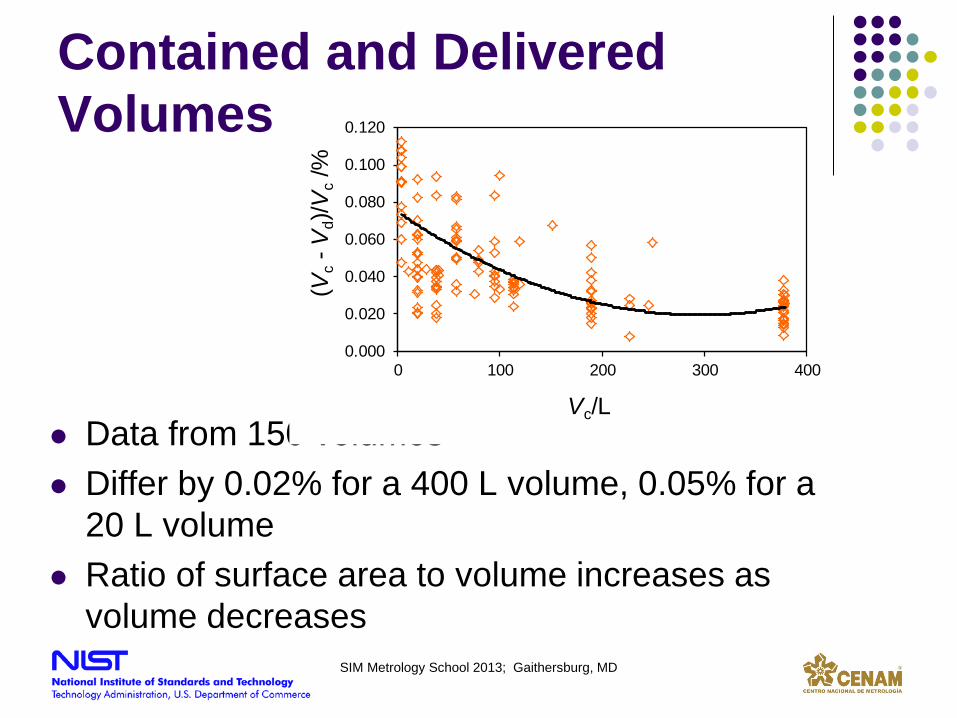
Contained and Delivered Volumes
Data from 150 volumes Differ by 0.02% for a 400 L volume, 0.05% for a
20 L volume Ratio of surface area to volume increases as
volume decreases
0.000
0.020
0.040
0.060
0.080
0.100
0.120
0 100 200 300 400
(Vc
-Vd)
/Vc
/%
Vc/L
SIM Metrology School 2013; Gaithersburg, MD
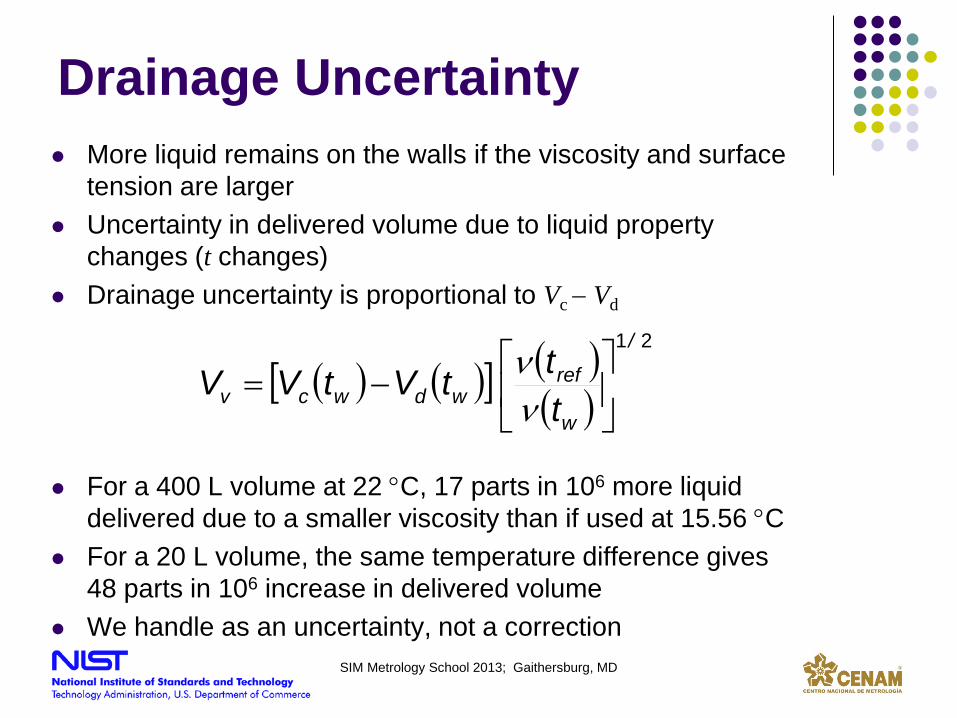
Drainage Uncertainty More liquid remains on the walls if the viscosity and surface
tension are larger Uncertainty in delivered volume due to liquid property
changes (t changes) Drainage uncertainty is proportional to Vc − Vd
For a 400 L volume at 22 °C, 17 parts in 106 more liquid delivered due to a smaller viscosity than if used at 15.56 °C
For a 20 L volume, the same temperature difference gives 48 parts in 106 increase in delivered volume
We handle as an uncertainty, not a correction
( ) ( )[ ] ( )( )
21/
w
refwdwcν t
ttVtVV
−=
νν
SIM Metrology School 2013; Gaithersburg, MD
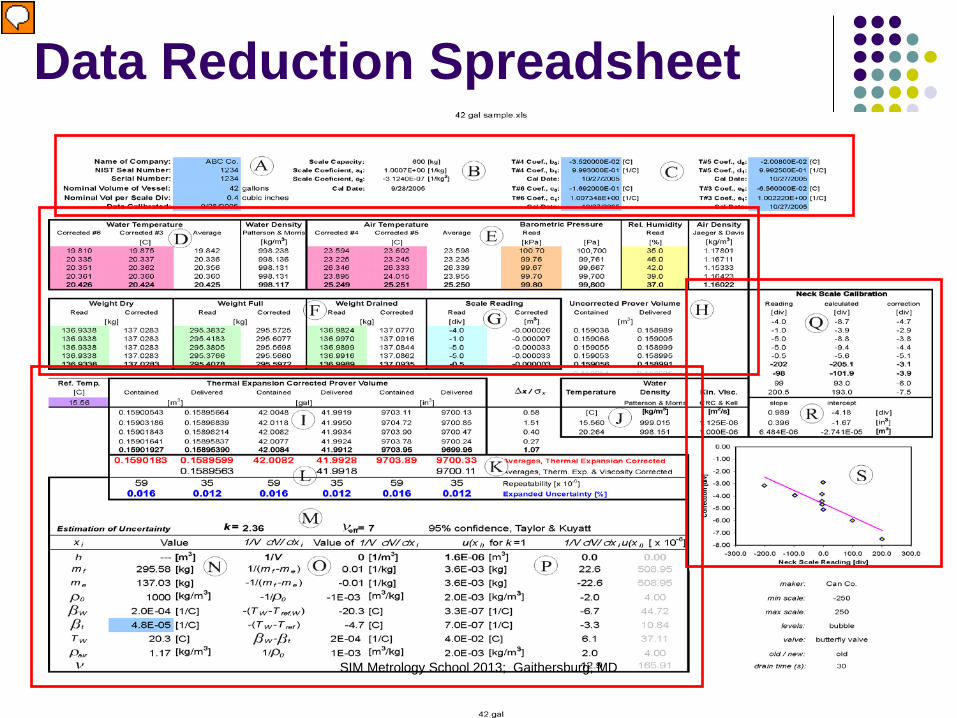
Data Reduction Spreadsheet
SIM Metrology School 2013; Gaithersburg, MD
Presenter
Presentation Notes
1 prover info, sensor calibrations, 2 data from 5 repeats, 3 neck scale calibration, 4 uncertainty analysis
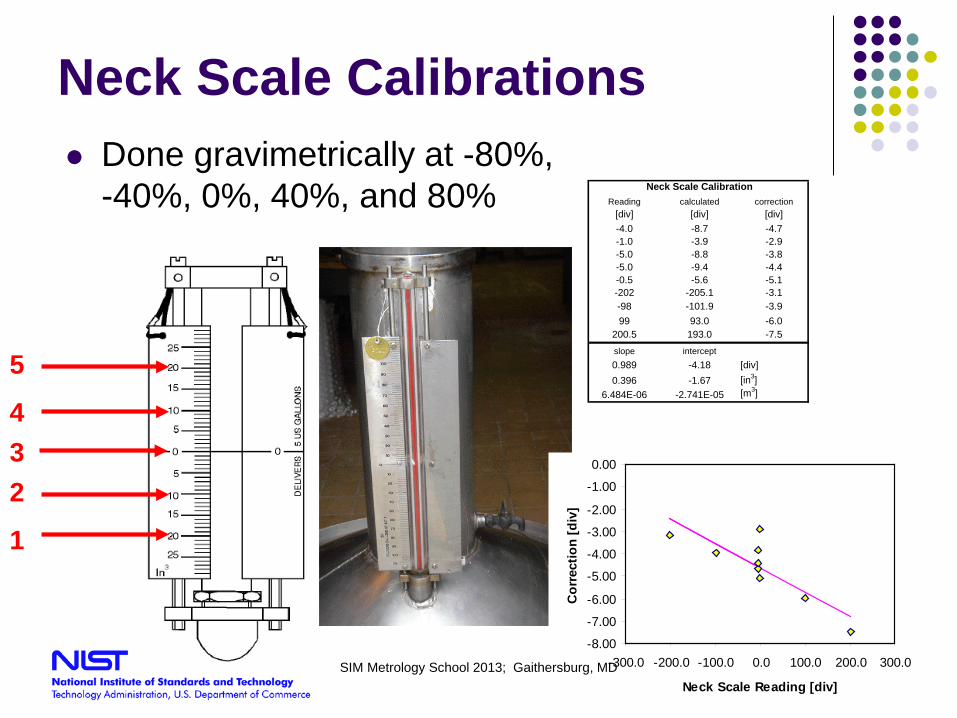
Neck Scale Calibrations Done gravimetrically at -80%,
-40%, 0%, 40%, and 80% Neck Scale CalibrationReading calculated correction
[div] [div] [div]-4.0 -8.7 -4.7-1.0 -3.9 -2.9-5.0 -8.8 -3.8-5.0 -9.4 -4.4-0.5 -5.6 -5.1-202 -205.1 -3.1-98 -101.9 -3.999 93.0 -6.0
200.5 193.0 -7.5slope intercept0.989 -4.18 [div]0.396 -1.67 [in3]
6.484E-06 -2.741E-05 [m3]
1
2
5
3 4
-8.00
-7.00
-6.00
-5.00
-4.00
-3.00
-2.00
-1.00
0.00
-300.0 -200.0 -100.0 0.0 100.0 200.0 300.0
Neck Scale Reading [div]
Cor
rect
ion
[div
]
SIM Metrology School 2013; Gaithersburg, MD
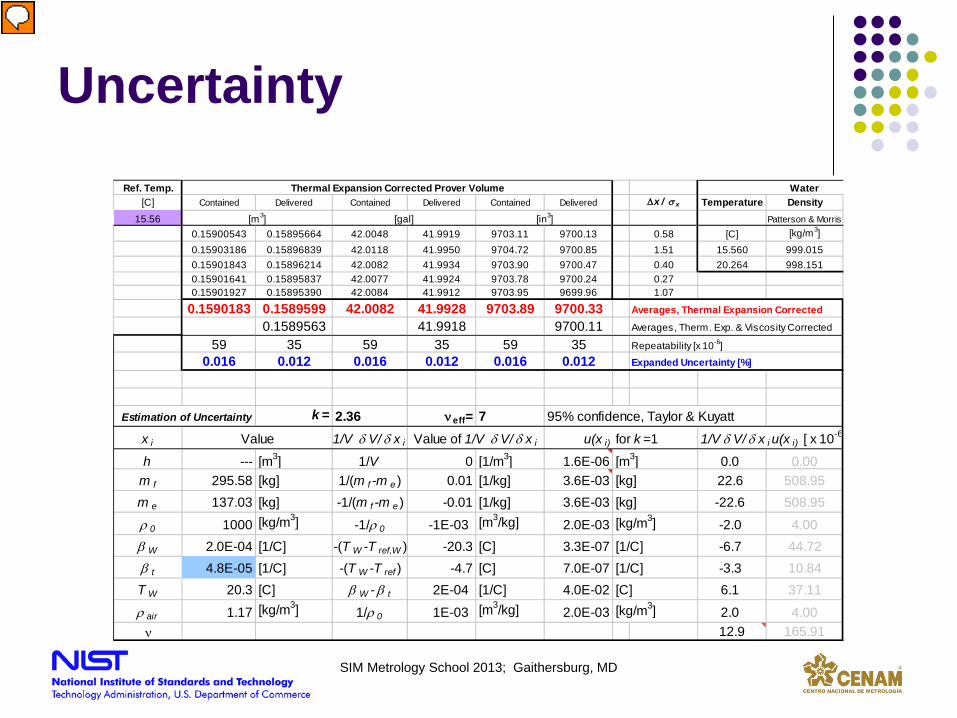
Uncertainty Ref. Temp.
[C] Contained Delivered Contained Delivered Contained Delivered ∆x / σ x Temperature Density15.56 Patterson & Morris
0.15900543 0.15895664 42.0048 41.9919 9703.11 9700.13 0.58 [C] [kg/m3]0.15903186 0.15896839 42.0118 41.9950 9704.72 9700.85 1.51 15.560 999.0150.15901843 0.15896214 42.0082 41.9934 9703.90 9700.47 0.40 20.264 998.1510.15901641 0.15895837 42.0077 41.9924 9703.78 9700.24 0.270.15901927 0.15895390 42.0084 41.9912 9703.95 9699.96 1.07
0.1590183 0.1589599 42.0082 41.9928 9703.89 9700.33 Averages, Thermal Expansion Corrected0.1589563 41.9918 9700.11 Averages, Therm. Exp. & Viscosity Corrected
59 35 59 35 59 350.016 0.012 0.016 0.012 0.016 0.012
Estimation of Uncertainty k = 2.36 νeff= 7 95% confidence, Taylor & Kuyattx i 1/V δ V/ δ x i
h --- [m3] 1/V 0 [1/m3] 1.6E-06 0.0 0.00m f 295.58 [kg] 1/(m f -m e ) 0.01 [1/kg] 3.6E-03 22.6 508.95m e 137.03 [kg] -1/(m f -m e ) -0.01 [1/kg] 3.6E-03 -22.6 508.95ρ 0 1000 [kg/m3] -1/ρ 0 -1E-03 [m3/kg] 2.0E-03 -2.0 4.00β W 2.0E-04 [1/C] -(T W -T ref,W ) -20.3 [C] 3.3E-07 -6.7 44.72β t 4.8E-05 [1/C] -(T W -T ref ) -4.7 [C] 7.0E-07 -3.3 10.84T W 20.3 [C] β W - β t 2E-04 [1/C] 4.0E-02 6.1 37.11ρ air 1.17 [kg/m3] 1/ρ 0 1E-03 [m3/kg] 2.0E-03 2.0 4.00ν 12.9 165.91
Repeatability [x 10-6]Expanded Uncertainty [%]
Water
Value Value of 1/V δ V/ δ x i u(x i) for k =1
[m3] [gal] [in3]
Thermal Expansion Corrected Prover Volume
[kg/m3]
[kg/m3]
[1/C][1/C][C]
1/V δ V/ δ x i u(x i) [ x 10-6
[m3][kg][kg]
SIM Metrology School 2013; Gaithersburg, MD
Presenter
Presentation Notes
H 1/3 division, … repeatability, Welch-Satterthwaite. Each prover has a different uncertainty.
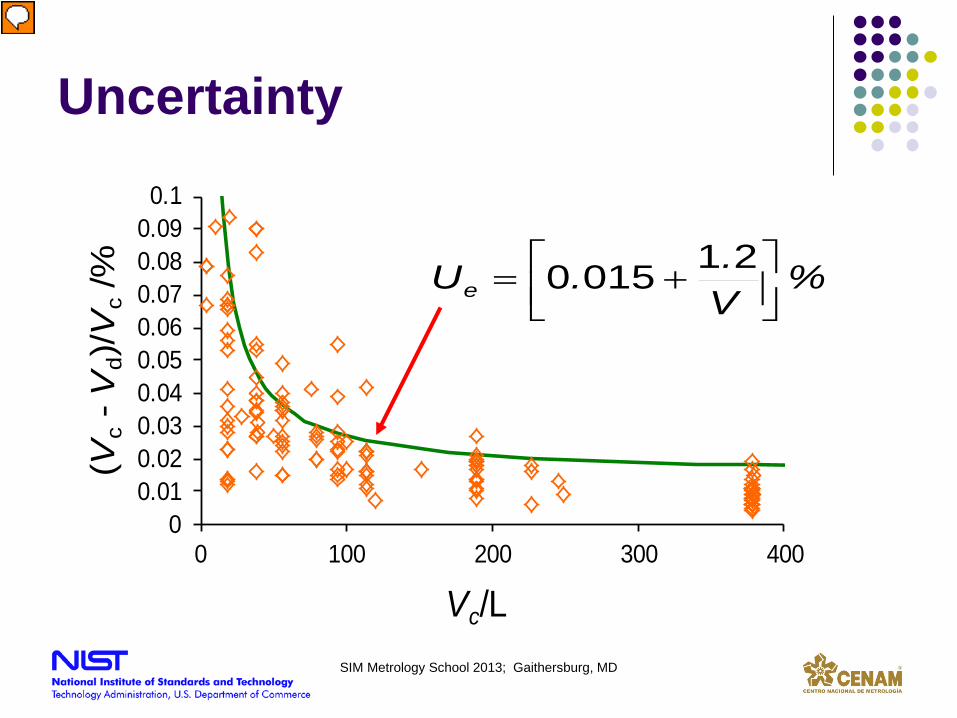
Uncertainty
00.010.020.030.040.050.060.070.080.090.1
0 100 200 300 400
(Vc
-Vd)
/Vc
/%
Vc/L
%V..Ue
+=
210150
SIM Metrology School 2013; Gaithersburg, MD
Presenter
Presentation Notes
Past 2 years of data
4 Volume Calibrations at CENAM
SIM Metrology School 2013; Gaithersburg, MD
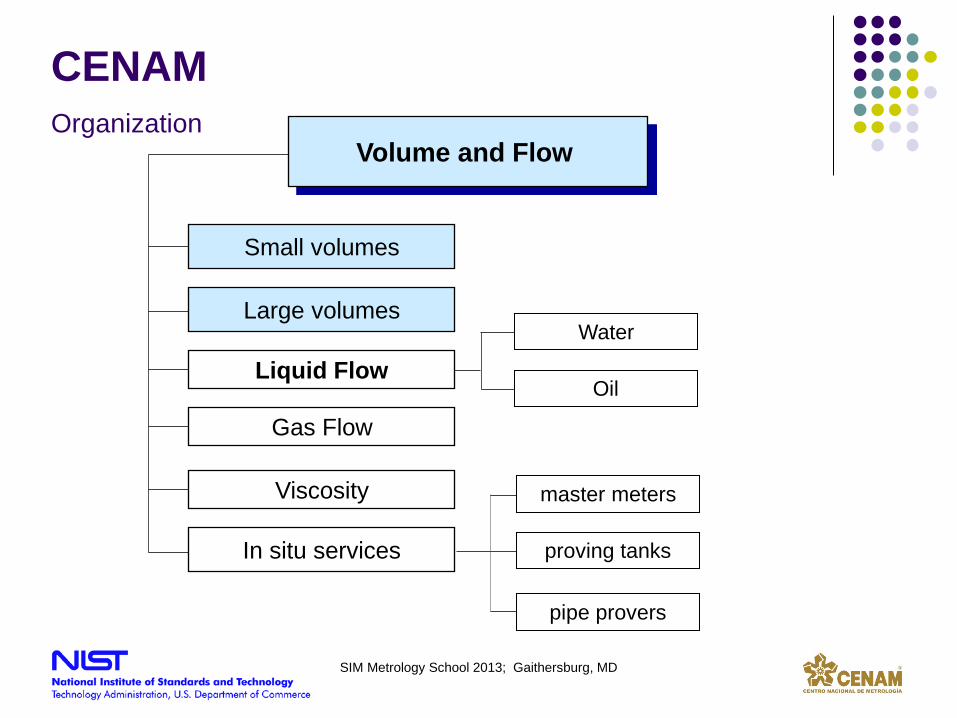
Volume and Flow
In situ services
Small volumes
Large volumes
Liquid Flow
Gas Flow
Viscosity
CENAM Organization
Water
Oil
master meters
proving tanks
pipe provers
SIM Metrology School 2013; Gaithersburg, MD
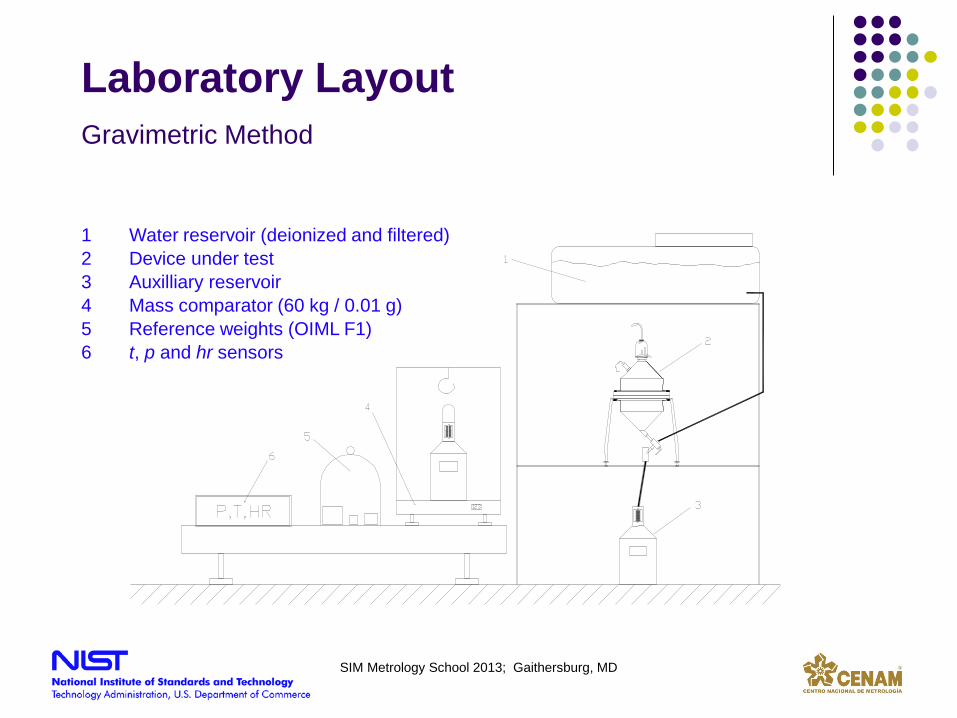
1 Water reservoir (deionized and filtered) 2 Device under test 3 Auxilliary reservoir 4 Mass comparator (60 kg / 0.01 g) 5 Reference weights (OIML F1) 6 t, p and hr sensors
Laboratory Layout Gravimetric Method
SIM Metrology School 2013; Gaithersburg, MD
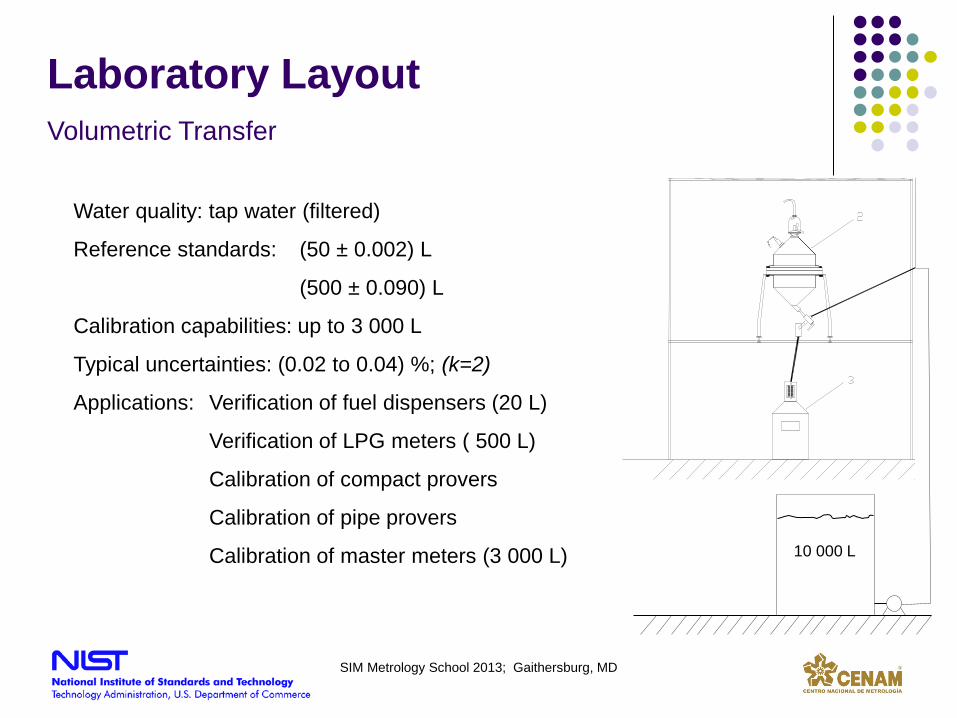
Laboratory Layout Volumetric Transfer
Water quality: tap water (filtered)
Reference standards: (50 ± 0.002) L
(500 ± 0.090) L
Calibration capabilities: up to 3 000 L
Typical uncertainties: (0.02 to 0.04) %; (k=2)
Applications: Verification of fuel dispensers (20 L)
Verification of LPG meters ( 500 L)
Calibration of compact provers
Calibration of pipe provers
Calibration of master meters (3 000 L)
10 000 L
SIM Metrology School 2013; Gaithersburg, MD
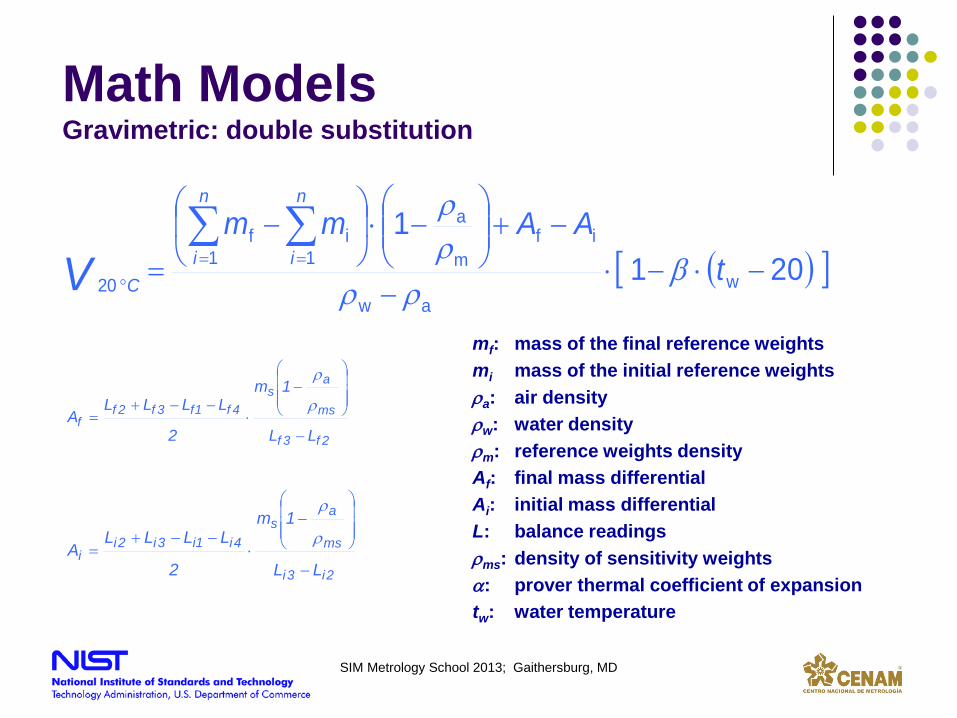
Math Models Gravimetric: double substitution
( )[ ] 20 1 1
waw
ifm
a
1i
1f
20 −⋅−⋅−
−+
−⋅
−
=∑∑==
°t
AAmmn
i
n
iCV β
ρρρρ
2f3f
ms
as
4f1f3f2ff
LL
1m
2
LLLLA
−
−
⋅−−+
=ρ
ρ
2i3i
ms
as
4i1i3i2ii
LL
1m
2
LLLLA
−
−
⋅−−+
=ρ
ρ
mf: mass of the final reference weights mi mass of the initial reference weights ρa: air density ρw: water density ρm: reference weights density Af: final mass differential Ai: initial mass differential L: balance readings ρms: density of sensitivity weights α: prover thermal coefficient of expansion tw: water temperature
SIM Metrology School 2013; Gaithersburg, MD
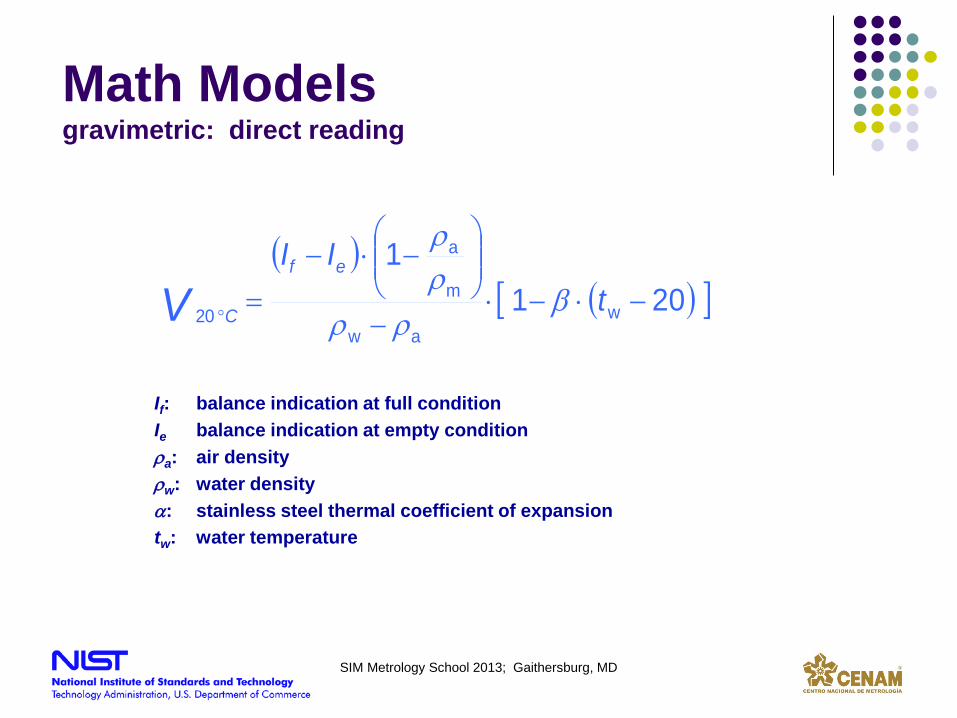
Math Models gravimetric: direct reading
( )( )[ ] 20 1
1 w
aw
m
a
20 −⋅−⋅−
−⋅−
=°
tII ef
CV βρρ
ρρ
If: balance indication at full condition Ie balance indication at empty condition ρa: air density ρw: water density α: stainless steel thermal coefficient of expansion tw: water temperature
SIM Metrology School 2013; Gaithersburg, MD

Math Models water density; Tanaka et. al.
Other models:
Patterson & Morris Bettin
Masui & Fujii Kell
Watanabe IAPWS
SIM Metrology School 2013; Gaithersburg, MD
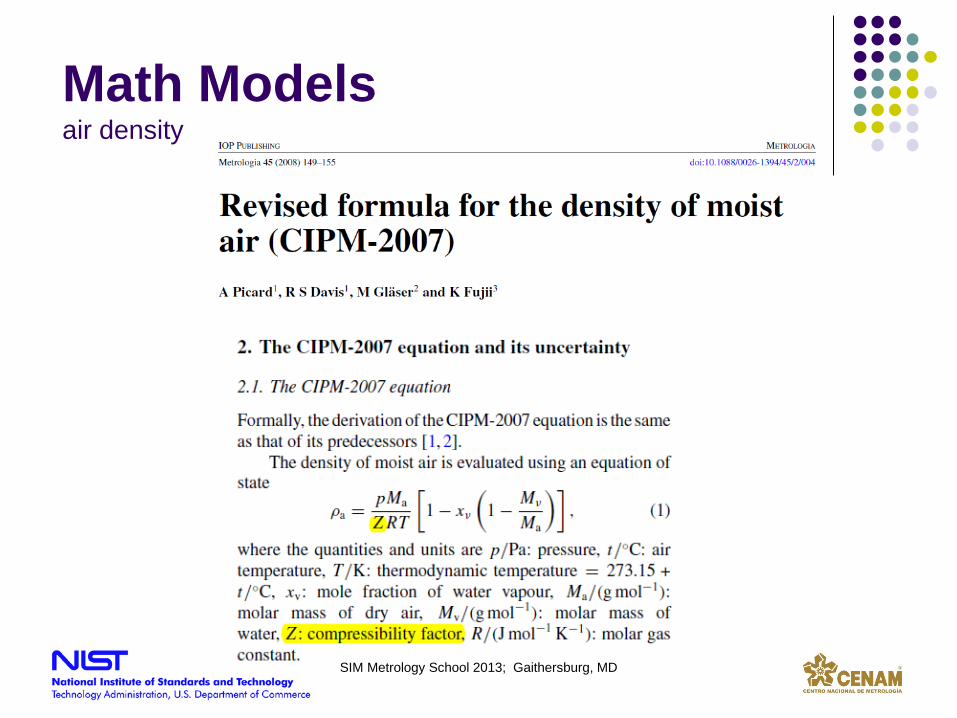
Math Models air density
SIM Metrology School 2013; Gaithersburg, MD
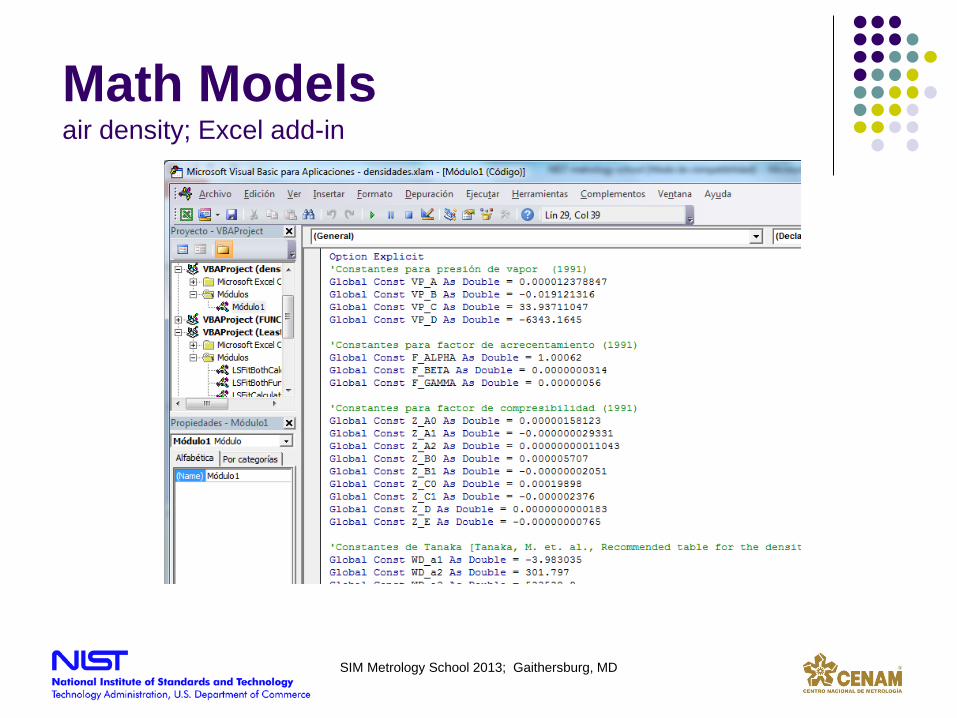
Math Models air density; Excel add-in
SIM Metrology School 2013; Gaithersburg, MD

Math Models data processing
SIM Metrology School 2013; Gaithersburg, MD
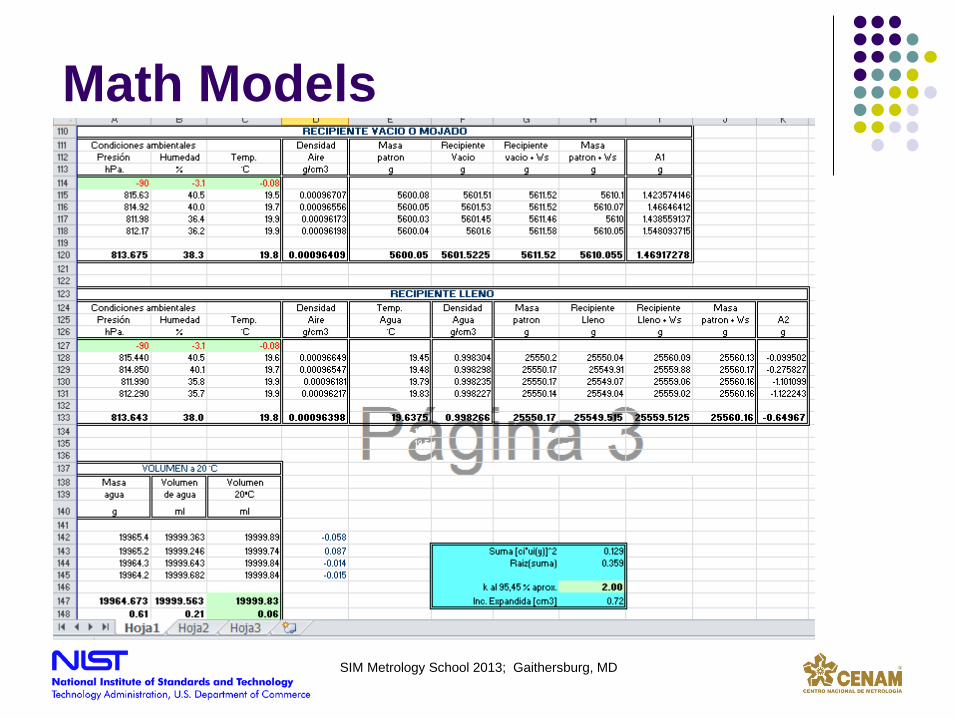
Math Models data processing
SIM Metrology School 2013; Gaithersburg, MD
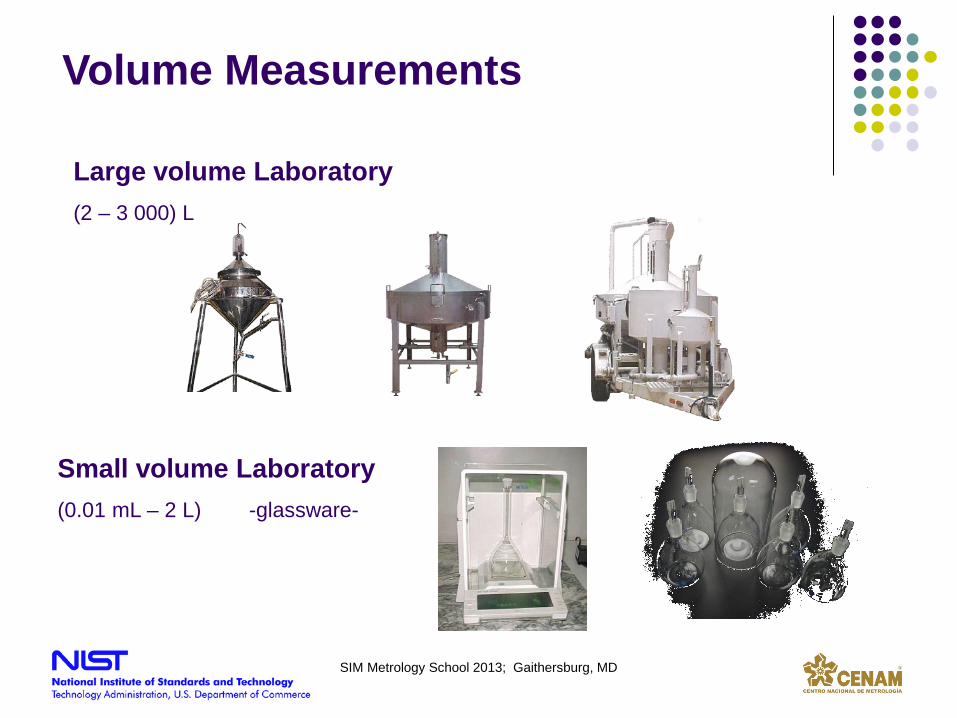
Volume Measurements
Large volume Laboratory (2 – 3 000) L
Small volume Laboratory (0.01 mL – 2 L) -glassware-
SIM Metrology School 2013; Gaithersburg, MD
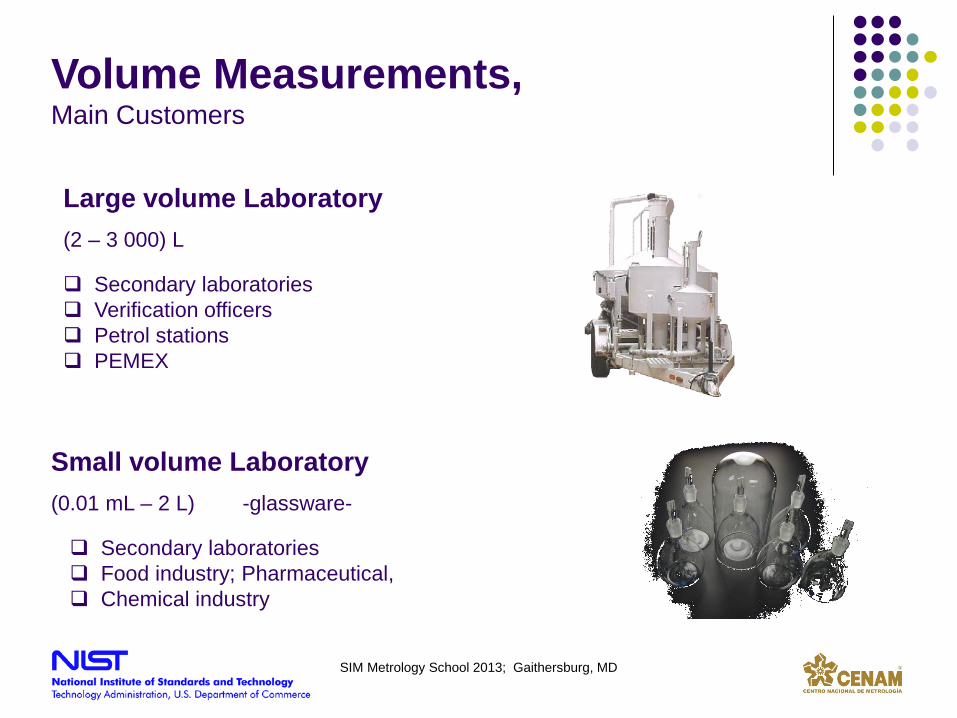
Volume Measurements, Main Customers
Large volume Laboratory (2 – 3 000) L
Secondary laboratories Verification officers Petrol stations PEMEX
Small volume Laboratory (0.01 mL – 2 L) -glassware-
Secondary laboratories Food industry; Pharmaceutical, Chemical industry
SIM Metrology School 2013; Gaithersburg, MD
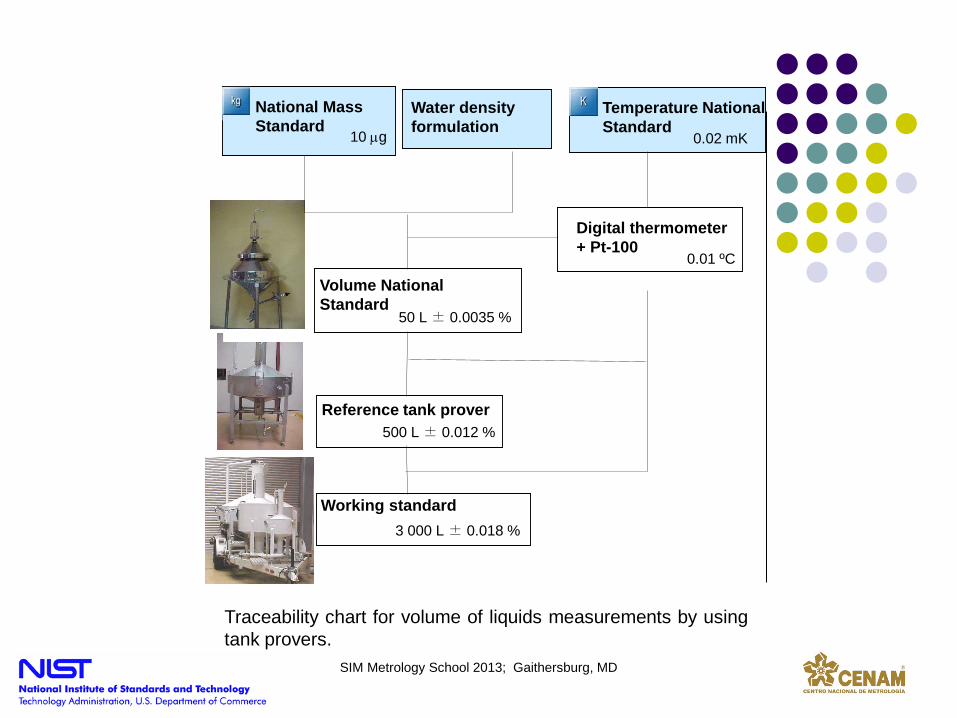
National Mass Standard
10 µg
Water density formulation
Volume National Standard
50 L ± 0.0035 %
Temperature National Standard
0.02 mK
Reference tank prover 500 L ± 0.012 %
Working standard 3 000 L ± 0.018 %
Digital thermometer + Pt-100
0.01 ºC
Traceability chart for volume of liquids measurements by using tank provers.
SIM Metrology School 2013; Gaithersburg, MD
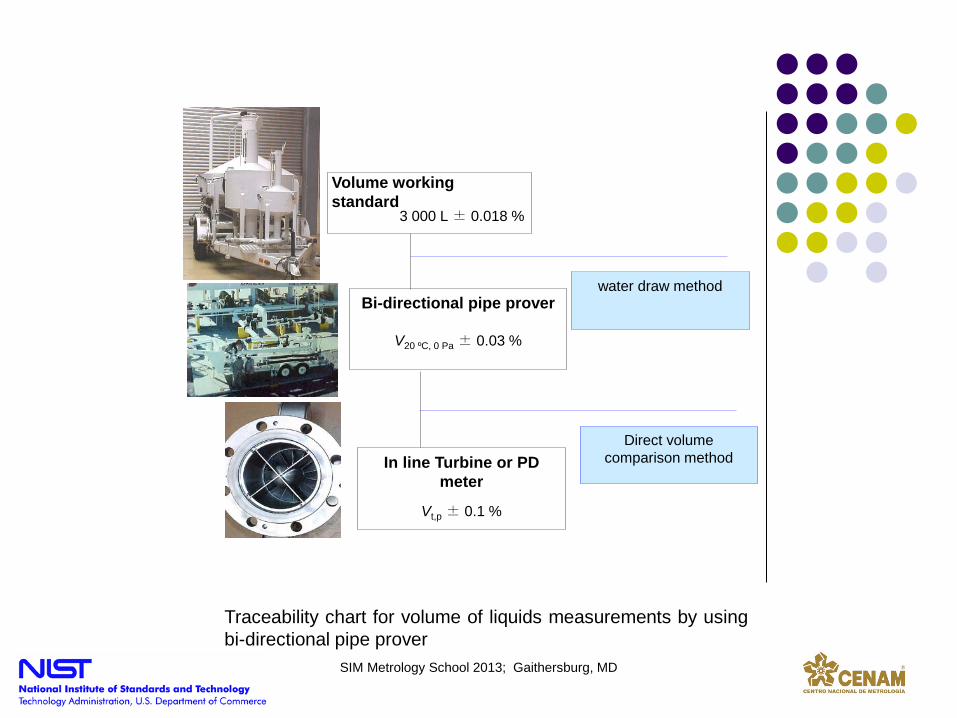
Traceability chart for volume of liquids measurements by using bi-directional pipe prover
Volume working standard
3 000 L ± 0.018 %
Bi-directional pipe prover
V20 ºC, 0 Pa ± 0.03 %
water draw method
In line Turbine or PD meter
Vt,p ± 0.1 %
Direct volume comparison method
SIM Metrology School 2013; Gaithersburg, MD
5 International comparability
SIM Metrology School 2013; Gaithersburg, MD

CCM.FF-K4 Transfer standard artifacts
Glass pycnometer (6 items)
Type: Gay-Lussac
Volume: 100 mL
Stainless steel pipette (3 items)
Type: overflow
Volume: 20 L
Temperature: Pt-100
Design: to deliver
SIM Metrology School 2013; Gaithersburg, MD
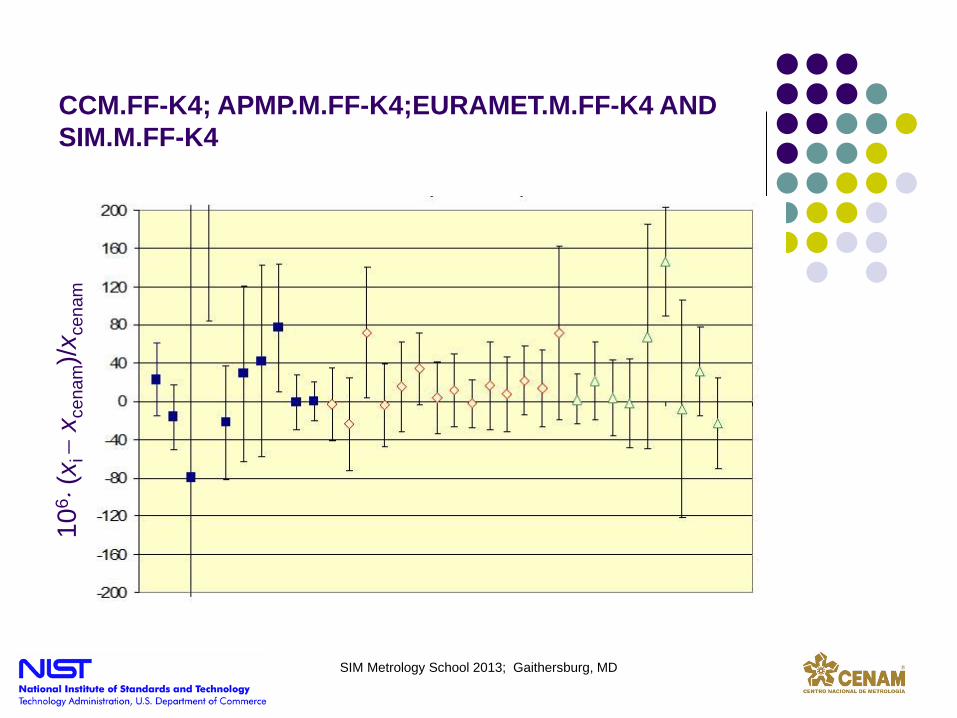
CCM.FF-K4; APMP.M.FF-K4;EURAMET.M.FF-K4 AND SIM.M.FF-K4
106 ⋅
(xi −
xce
nam)/x
cena
m
SIM Metrology School 2013; Gaithersburg, MD


![OIML R60-1 WD - NIST...conforms to OIML V 1 International Vocabulary of Basic and General Terms in Metrology (VIM) [2], to OIML V 2 International Vocabulary of Terms in Legal Metrology](https://static.fdocuments.in/doc/165x107/5f0c10017e708231d4338f5a/oiml-r60-1-wd-nist-conforms-to-oiml-v-1-international-vocabulary-of-basic.jpg)