Vladislav Toronov, Ph. D. Using Physics to Image Brain Function.
59
Vladislav Toronov, Ph. D. Using Physics to Image Brain Function
-
Upload
doreen-curtis -
Category
Documents
-
view
219 -
download
1
Transcript of Vladislav Toronov, Ph. D. Using Physics to Image Brain Function.

Vladislav Toronov, Ph. D.
Using Physics to Image Brain Function
Functional MRI: lack of physiological specificity
Principles of Near Infrared Spectro-Imaging
NIR study of the physiological basis of fMRI signal
NIR imaging of brain function
outline

Quantities used in MRI
Longitudinal relaxation time T1
Transverse relaxation time T2 (T2*)
Proton density

Why MRI provides nice structural images?
Due to the large differences in T1 or T2 between tissues

Can MRI be used for metabolic measurements?
Answer: it is very difficult to do because T1 and T2 can depend on many parameters
Example:
Changes in the blood content during functional activity

Oxygen Transport to Tissue
Oxygen is transported in hemoglobin molecules of red blood cells:
Deoxy-hemoglobin HHb
Oxy-hemoglobin: HbO2
Metabolic measurement: Can MRI be used to
measure [HHb] and [HbO2]?

Blood Oxygen Level Dependent effect: Oxygen in the blood modifies T2*
Functional brain mapping
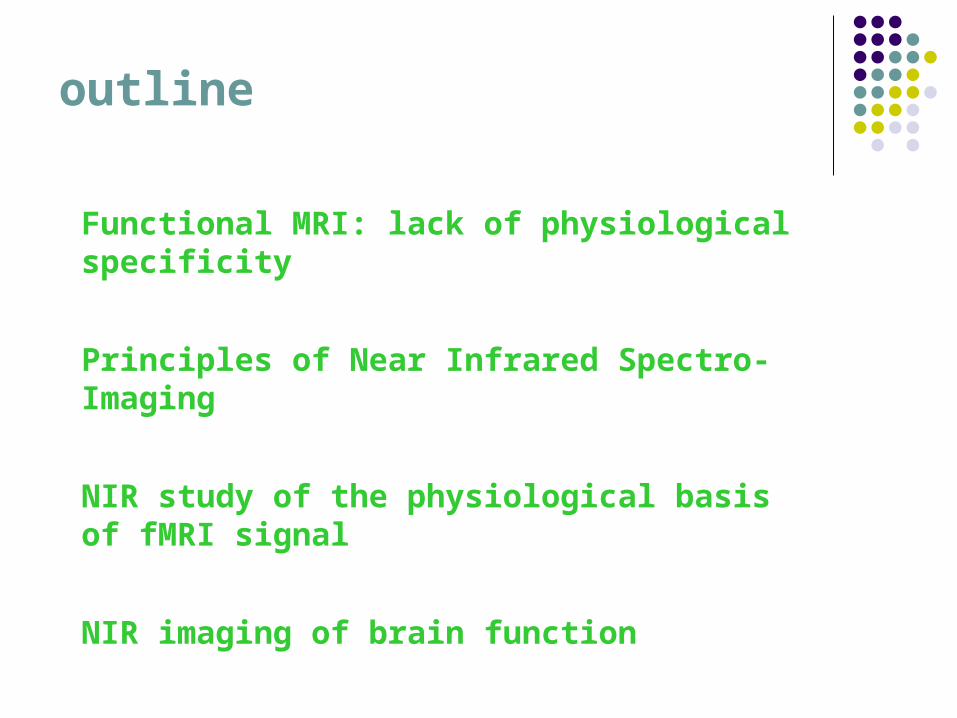
Quantitative physiological model of the BOLD signal:
R. Buxton, 1998
q=[HHb]/[HHb]0 v=[tHb]/[tHb]0
where
v21 qS
Conclusion: MRI does not allow simple separation of oxygenation effects from blood volume effects

Near-Infrared Spectro-Imaging
(NIRSI)

Optical Spectroscopy
i
iia c
Beer’s law:
NIRSI

Light Propagation in Tissues
NIRSI
Scattering
’s ~ 10 cm-1
Absorption
a ~0.1 cm-1

Boltzmann Transport Equation
Where - radiance [W cm-2 steradian-1]L t
S t
a
s
( , , )
( , , )
r
r
- scattering coefficient [cm-1]
- absorption coefficient [cm-1]
- source term [W cm-3 steradian-1 s-1]
),ˆ,(ˆ)ˆ,ˆ(),ˆ,(
),ˆ,()(ˆ),ˆ,(),ˆ,(
v
1
trSdftrL
trLtrLt
trL
s
sa

Diffusion Approximation
20
1, ,a
Dr r t q r t
c t c
Photon Density
SourceAbsorption
Diffusion coefficient (scattering)
Diffusion Equation:
a s s ' ( cos )1

Type of the source modulation:
Continuous Wave
Time Domain (pulse)
Frequency-Domain

Frequency-domain approach
Light Source: Modulation frequency: >=100 MHz AC, DC and phase
NIRSI
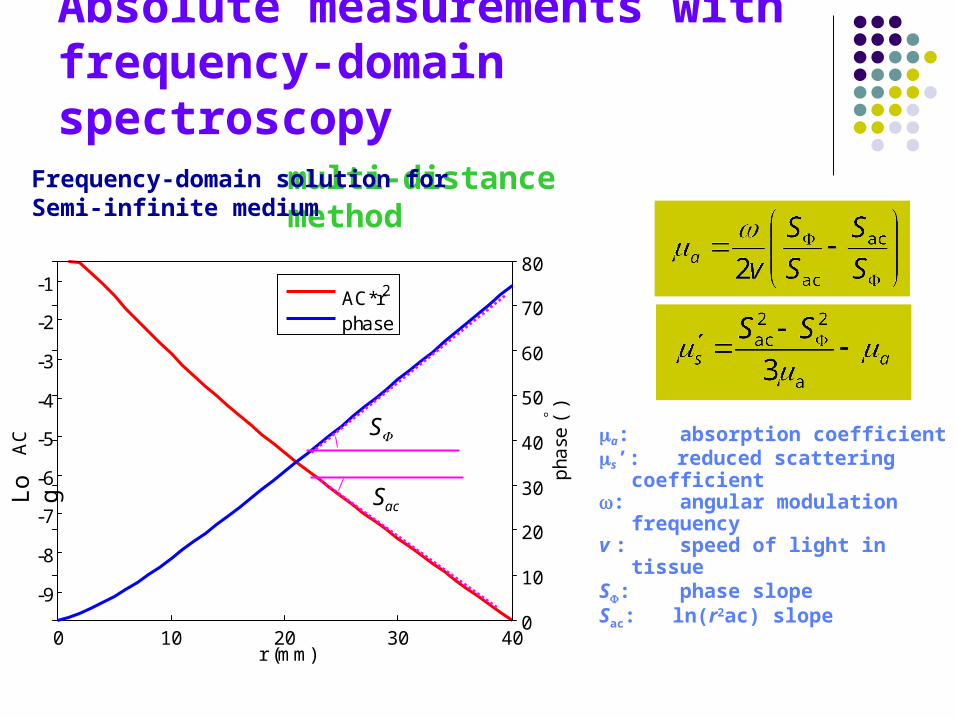
Absolute measurements withfrequency-domain spectroscopy
a: absorption coefficients’: reduced scattering
coefficient
: angular modulation frequency
v : speed of light in tissue S: phase slopeSac: ln(r2ac) slope
multi-distance method
0 10 20 30 40
-9
-8
-7
-6
-5
-4
-3
-2
-1
AC
r (mm)
0
10
20
30
40
50
60
70
80
pha
se (
)
AC*r2
phase
S
SacLog
Frequency-domain solution for Semi-infinite medium

Method of quantitative FD measurements: Multi-distance
Flexible pad
Detector fiber bundle
Source fibers
Direct light block

Estimation of physiological parameters
22][][ 2 HHbHbO HHbHbOa
],[][][ 2 HHbHbOtHB
(%),100][][
][
2
2
HHbHbO
HbOOx
NIRSI
Beer’s law:
Total HB ~CBV
Oxygenation

source fibers
pmt a
RF electronics
multiplexing circuit
laser driver 1
pmt b
laser diodes
laser driver 2
detector bundles
Near-infrared tissue oximeter
NIRSI Instrumentation

NIR Imaging System

Advantages of NIRSI
Non-invasive
Fast (~ 1 ms)
Highly specific (spectroscopy)
Relatively inexpensive (~$100 K)
Can be easily combined with MRI

Study of the physiology of the BOLD effect
BOLD= Blood Oxygen Level Dependent
NIRSI in Functional Magnetic Resonance Imaging
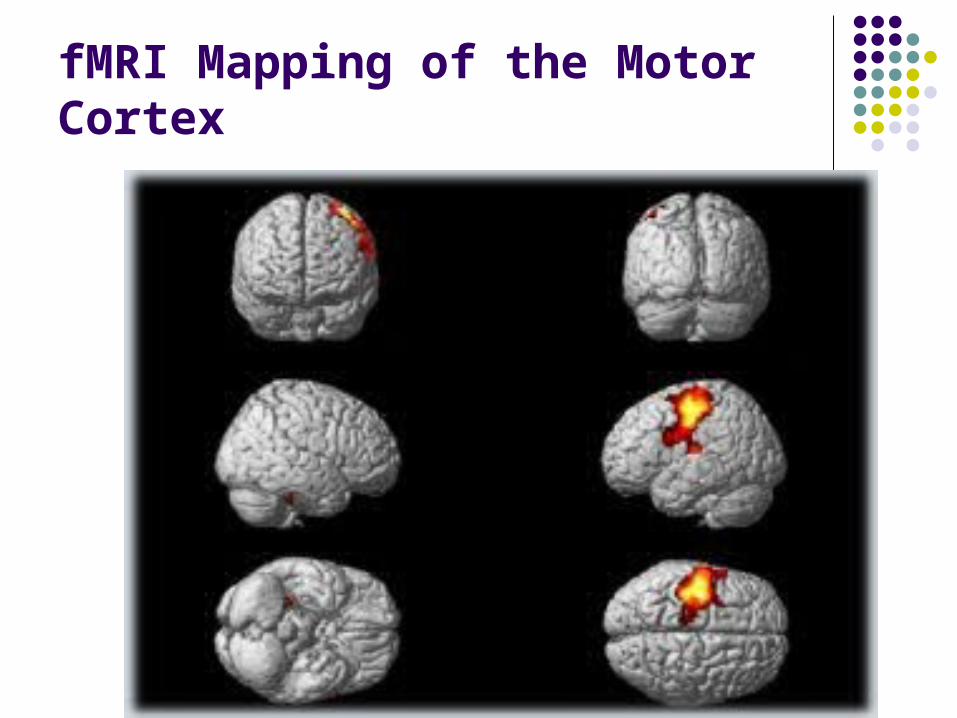
fMRI Mapping of the Motor Cortex
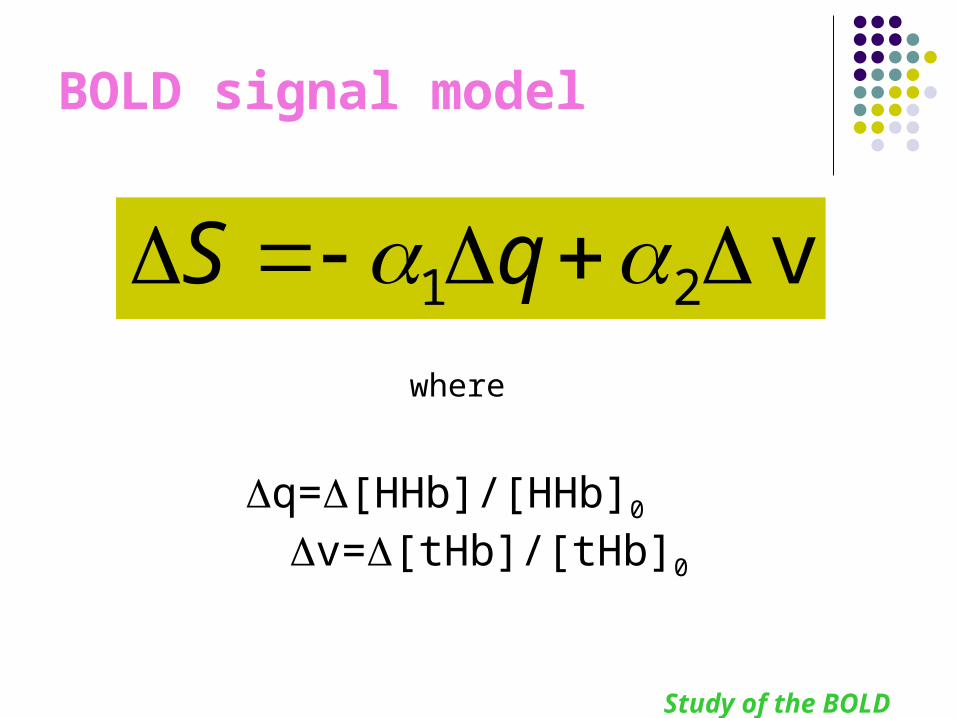
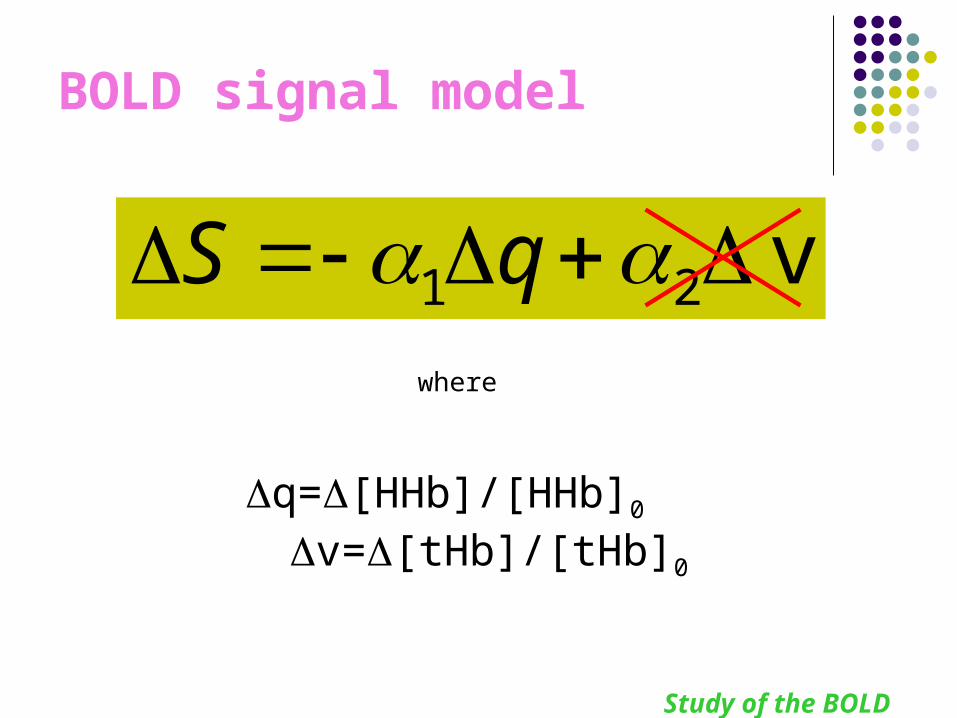
BOLD signal model
q=[HHb]/[HHb]0 v=[tHb]/[tHb]0
where
v21 qS
Study of the BOLD effect

Multi-distance optical probe
Study of the BOLD effect
Detector fiber
Laser diodes690 nm&830 nm

Collocation of fMRI signal and optical sensor
Study of the BOLD effect
Motor Cortex
Optical probe

Activation paradigmActivation paradigm
Sti
mul
atio
n
Rel
axat
ion
Motor activation
Вlock Design - 10s/17s
Study of the BOLD effect
Time

Data analysis:Folding (time-locked) average
Raw data
Folded data
Study of the BOLD effect

Time course of hemodynamicand BOLD signals
Study of the BOLD effect
stimulation
BOLD signal model
q=[HHb]/[HHb]0 v=[tHb]/[tHb]0
where
v21 qS
Study of the BOLD effect

Biophysical Modeling of Functional Cerebral
Hemodynamics

O2 Diffusion Between Blood and Tissue Cells
fin
fout
Modeling

“Balloon” Model
in
outin
fE
tv
tqf
E
tEf
dt
dq
)(
)()(1
0q- normalized Deoxy Hb
v- normalized Total Hb
=V0/F0 – mean transit time
Oxygen Extraction Fraction
Modeling

OEF as function of CBF(Buxton and Frank, 1997)
infin EfE /1
0 )1(1
Modeling

“Balloon” Model
infin
outin
outin
EfE
ffdt
dv
tv
tqf
E
tEf
dt
dq
/10
0
)1(1
1
)(
)()(1
q- normalized Deoxy Hb
v- normalized Total Hb
Oxygen Extraction Fraction
Modeling
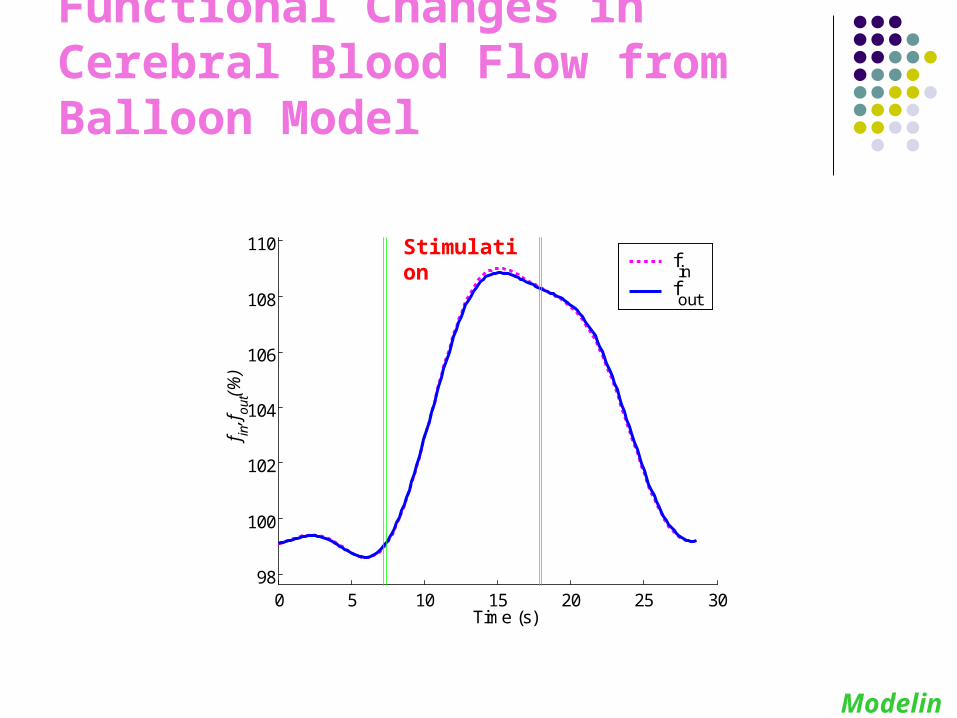
Functional Changes in Cerebral Blood Flow from Balloon Model
0 5 10 15 20 25 3098
100
102
104
106
108
110f in,fout(%)
Time (s)
finfout
Stimulation
Modeling
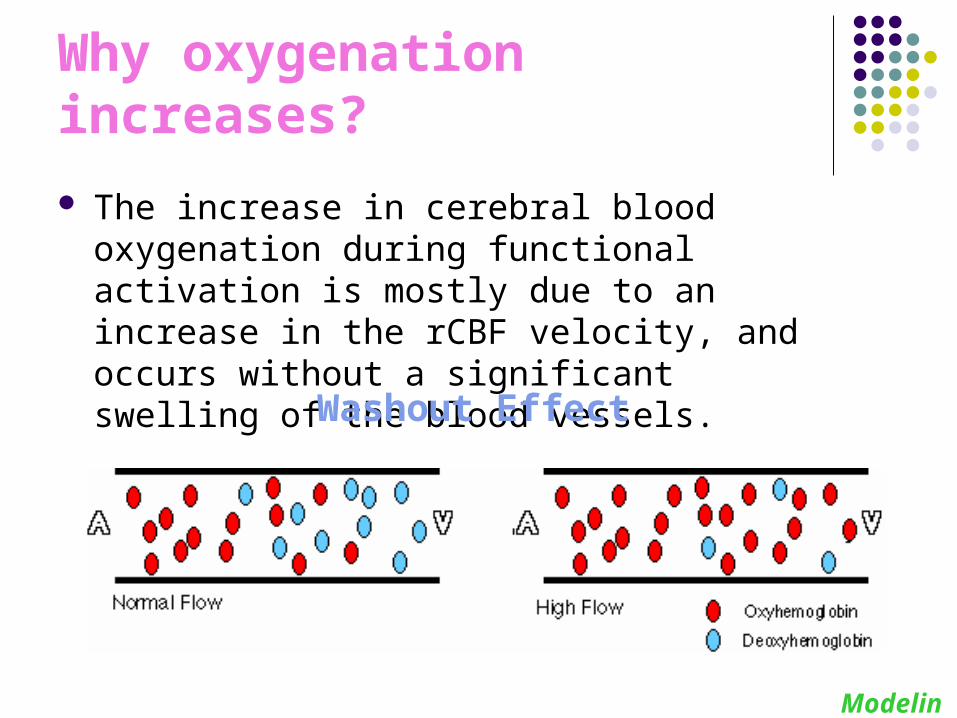
Why oxygenation increases?
The increase in cerebral blood oxygenation during functional activation is mostly due to an increase in the rCBF velocity, and occurs without a significant swelling of the blood vessels.
Modeling
Washout Effect

Outcomes
The time course of the BOLD fMRI signal corresponds to the changes in the deoxy-hemoglobin concentration
BOLD fMRI provides no information about the functional changes in the blood volume
This information can be obtained using NIRSI

Optical Mapping of Brain Activity
in real time

detectors
light sources5
67
123
4 3 cmB A 8
Locations of the sources and detectors of light on the human
head
Brain mapping
Motor Cortex

Backprojection Scheme
detectors
light sources(758 and 830 nm)
Brain mapping
3&4 3 3 3 3 2&3 2 2 2 2 2 2 1&2 1 1 1 1 1&8
3&4 3 3 3 2&3 2 2 2 2 2 2 2 2 1&2 1 1 1 1&8
4 4 3 3 2&3 2 2 2 2&2 2&2 2 2 2 1&2 1 1 8 8
4 4 43&4
2&3 2 2 2&6 2&6 2&6 2&6 2 2 1&2 1&8 8 8 8
4 4 44&5
5&6 6 6 6&2 2&6 2&6 6&2 6 6 6&7 7&8 8 8 8
4 4 5 5 5&6 6 6 6 6&6 6&6 6 6 6 6&7 7 7 8 8
4&5 5 5 5 5&6 6 6 6 6 6 6 6 6 6&7 7 7 7 7&8
4&5 5 5 5 5 5&6 6 6 6 6 6 6 6&7 7 7 7 7 1&8
C34=.75*S3+.25*S413
6
7
8
2
4AB
5
C34=.5*S3 + .5*S4

[Hb] (M)
-1.0
-0.5 0.0
0.5
Real time video of brain activation
Brain mapping
67
8
1
2
3
4AB
5

3D NIR imaging of brain function using structural
MRIS D

A small change in absorption
S D
an
nna
sd
sd LU
U
sdU
Ln –the mean time photon spends in voxel n relative to the total travel time

Solve an equation:
Underdetermined Problem
Number of measurements<< number of voxels
3D imaging
n
nna
sd
sd LU
U

Sensitivity is high near the surface and low in the brain
Source Detector3D imaging

Cerebro-SpinalFluid
Scalp
Scull
BrainCONSTRAINT
3D imaging
Using structural MRI info

How do we find Ln –the relative voxel time?
n
nna
sd
sd LU
U

Monte Carlo Simulation
Structural MR imageis segmented infour tissue types:
• Scalp• Skull• CSF• Brain
10,000,000 “photons”
Source Detector3D imaging

Image Reconstruction
Solution: Simultaneous Iterative Reconstruction Technique
Y=Ax
3D imaging
n
nna
sd
sd LU
U
Underdetermined Problem

Activation of Human Visual Cortex
Flashing or reversing checkerboard

EXPERIMENT
40 mm
10 mm
40 mm
10 mm
40 mm
10 mm
3D imaging
50 mm

Probe for imaging human visual cortexin the MRI scanner

Placement of the optical probe on the head inside the “birdcage” head coil of the MRI scanner
To/from the NIR spectrometer
Optical fibersOptical probe
Birdcage head coil
B0
Magnetic bore of the MRI scanner

Time course of hemodynamic changes in the activated region
0 10 20 30 40 50 60-1
-0.5
0
0.5
1
1.5
2x 10
-4
Time (sec)
Ave
rage
hem
o ch
ange
s (m
M)
Average changes in [HbR] and [HbO] at 2 Hz
[HbO]
[HbR]Vis. Stim.

Results of the group statistical analysis of variance
BOLD -[Hb] [HbO2] 3D imaging
Using AFNI medicalImage processingsoftware

Outcomes
In combination with structural MRI,NIRSI can be used for non-invasive 3D imaging of physiological processes in the human brain
A two-wavelength NIR imaging provides independent spatially-resolved measurements of changes in oxy- and deoxyhemoglobin concentrations.

General Conclusion and Perspective
Alone or in combination with other imaging techniques, NIRSI can be used as a quantitative metabolic imaging tool in a variety of biomedical applications: Neuronal activity ~10 ms temporal resolution Neonatology ~Baby’s head has low size and
absorption Mammography ~ Non-ionizing, specific
Small animals ~ Neuroimaging, fast assessment in cancer
research