
Visual Interrogation of Gyrokinetic Particle Simulations
6
Visual Interrogation of Gyrokinetic Particle Simulations Chad Jones and Kwan-Liu Ma Department of Computer Science, University of California at Davis Allen Sanderson and Lee Roy Myers Jr SCI Institute, University of Utah E-mail: {cejjones,klma}@ucdavis.edu, [email protected], and [email protected] Abstract. Gyrokinetic particle simulations are critical to the study of anomalous energy transport associated with plasma microturbulence in magnetic confinement fusion experiments. The simulations are conducted on massively parallel computers and produce large quantities of particles, variables, and time steps, thus presenting a formidable challenge to data analysis tasks. We present two new visualization techniques for scientists to improve their understanding of the time-varying, multivariate particle data. One technique allows scientists to examine correlations in multivariate particle data with tightly coupled views of the data in both physical space and variable space, and to visually identify and track features of interest. The second technique, built into SCIRun, allows scientists to perform range-based queries over a series of time slices and visualize the resulting particles using glyphs. The ability to navigate the multiple dimensions of the particle data, as well as query individual or a collection of particles, enables scientists to not only validate their simulations but also discover new phenomena in their data. 1. Introduction As simulations evolve and grow into the peta-scale size it becomes increasingly important to have tools that allow scientists to explore their data in multiple ways. This is especially true when working with data that does not have any spatial coherence, which is often found when using particle in cell (PIC) codes or other codes that also utilize particles as part of their simulation. Fusion research is one important area that uses the PIC method to study the loss of energy due to microturbulence. Multi-dimensional visualizations, such as the ones we describe in this paper, expand the way scientists can explore and understand their data. The approach described in Section 2 is a multivariate exploration interface that provides scientists a way of exploring and visualizing both physical and variable spaces from a global view to a refined selection of particles and field data over time [6]. Within the SCIRun Problem Solving Environment, the technique described in Section 3 allows the application scientist to create query driven visualizations of particle data. 2. Multivariate Exploration Interface The system described here was designed with two goals for particle visualization: to allow scientists to visually confirm expected phenomena and to provide an exploration tool that
Transcript of Visual Interrogation of Gyrokinetic Particle Simulations

Visual Interrogation of Gyrokinetic Particle
Simulations
Chad Jones and Kwan-Liu Ma
Department of Computer Science, University of California at Davis
Allen Sanderson and Lee Roy Myers Jr
SCI Institute, University of Utah
E-mail: {cejjones,klma}@ucdavis.edu, [email protected], and [email protected]
Abstract. Gyrokinetic particle simulations are critical to the study of anomalous energytransport associated with plasma microturbulence in magnetic confinement fusion experiments.The simulations are conducted on massively parallel computers and produce large quantities ofparticles, variables, and time steps, thus presenting a formidable challenge to data analysis tasks.We present two new visualization techniques for scientists to improve their understanding of thetime-varying, multivariate particle data. One technique allows scientists to examine correlationsin multivariate particle data with tightly coupled views of the data in both physical space andvariable space, and to visually identify and track features of interest. The second technique, builtinto SCIRun, allows scientists to perform range-based queries over a series of time slices andvisualize the resulting particles using glyphs. The ability to navigate the multiple dimensionsof the particle data, as well as query individual or a collection of particles, enables scientists tonot only validate their simulations but also discover new phenomena in their data.
1. Introduction
As simulations evolve and grow into the peta-scale size it becomes increasingly important to havetools that allow scientists to explore their data in multiple ways. This is especially true whenworking with data that does not have any spatial coherence, which is often found when usingparticle in cell (PIC) codes or other codes that also utilize particles as part of their simulation.Fusion research is one important area that uses the PIC method to study the loss of energydue to microturbulence. Multi-dimensional visualizations, such as the ones we describe in thispaper, expand the way scientists can explore and understand their data.
The approach described in Section 2 is a multivariate exploration interface that providesscientists a way of exploring and visualizing both physical and variable spaces from a globalview to a refined selection of particles and field data over time [6].
Within the SCIRun Problem Solving Environment, the technique described in Section 3allows the application scientist to create query driven visualizations of particle data.
2. Multivariate Exploration Interface
The system described here was designed with two goals for particle visualization: to allowscientists to visually confirm expected phenomena and to provide an exploration tool that
assists in scientific discovery. The challenge is how to relate multiple variables, both simulatedvalues and post calculations with those values, within the visualization framework while stillmaintaining the advantage of interactivity. Our system addresses this issue by displaying thedata using multiple views, which are grouped into either variable or physical visualization.Multiple-view interfaces have been widely used in the visualization community, and our workis closely related to the work of Akiba and Ma [1] and Rubel et al. [11], who also use parallelcoordinates for data exploration. Introducing a variable space visualization not only expands theamount of displayed information, it also provides a tightly coupled user interface for intuitivelyselecting subsets of the particle data. In addition, the physical visualization provides interactive3D exploration with transparency, lighting, and view control.
2.1. Physical VisualizationSince the particle data is time-varying, there are two ways the system can render the data. Ifonly a single time step is being viewed, the particles are rendered as spherical glyphs. If a timeinterval is being viewed, the particles are rendered using illuminated pathlines. In both cases,a single scalar variable is mapped to color and opacity for that primitive using a 1D transferfunction. The variable associated with the transfer function can be interactively chosen from alist of variables which have been read from the data or from an equation defined by the user.
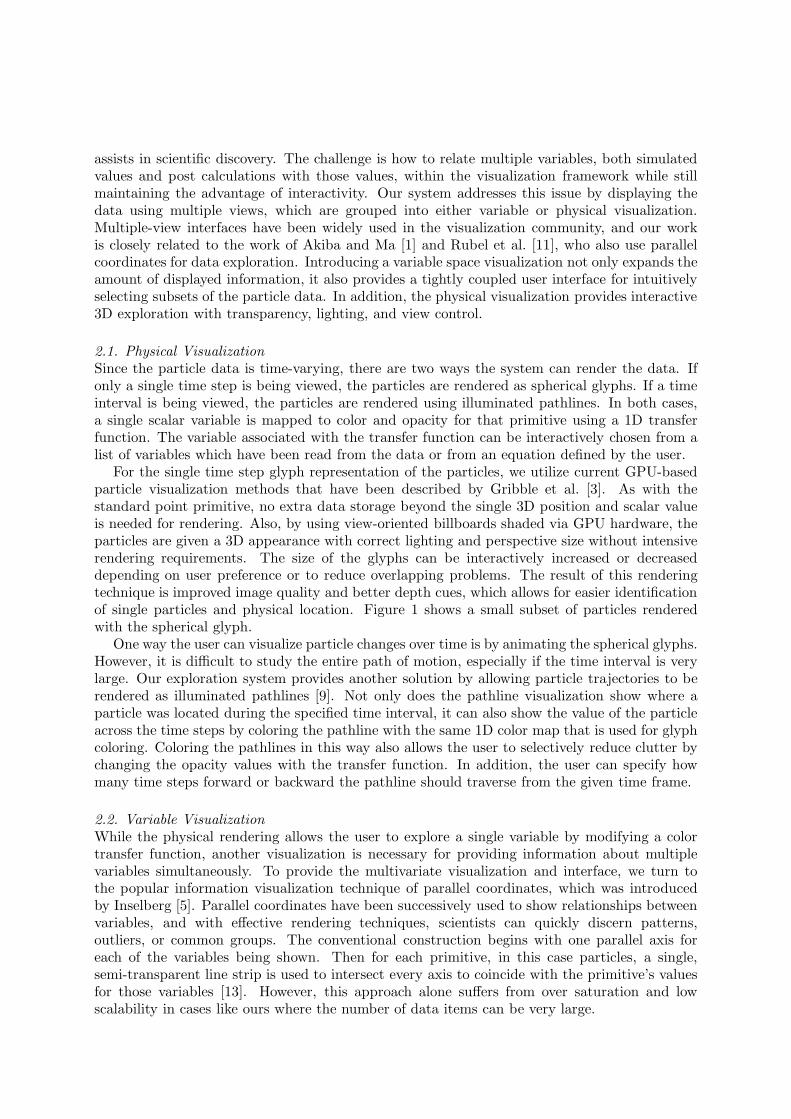
For the single time step glyph representation of the particles, we utilize current GPU-basedparticle visualization methods that have been described by Gribble et al. [3]. As with thestandard point primitive, no extra data storage beyond the single 3D position and scalar valueis needed for rendering. Also, by using view-oriented billboards shaded via GPU hardware, theparticles are given a 3D appearance with correct lighting and perspective size without intensiverendering requirements. The size of the glyphs can be interactively increased or decreaseddepending on user preference or to reduce overlapping problems. The result of this renderingtechnique is improved image quality and better depth cues, which allows for easier identificationof single particles and physical location. Figure 1 shows a small subset of particles renderedwith the spherical glyph.
One way the user can visualize particle changes over time is by animating the spherical glyphs.However, it is difficult to study the entire path of motion, especially if the time interval is verylarge. Our exploration system provides another solution by allowing particle trajectories to berendered as illuminated pathlines [9]. Not only does the pathline visualization show where aparticle was located during the specified time interval, it can also show the value of the particleacross the time steps by coloring the pathline with the same 1D color map that is used for glyphcoloring. Coloring the pathlines in this way also allows the user to selectively reduce clutter bychanging the opacity values with the transfer function. In addition, the user can specify howmany time steps forward or backward the pathline should traverse from the given time frame.
2.2. Variable VisualizationWhile the physical rendering allows the user to explore a single variable by modifying a colortransfer function, another visualization is necessary for providing information about multiplevariables simultaneously. To provide the multivariate visualization and interface, we turn tothe popular information visualization technique of parallel coordinates, which was introducedby Inselberg [5]. Parallel coordinates have been successively used to show relationships betweenvariables, and with effective rendering techniques, scientists can quickly discern patterns,outliers, or common groups. The conventional construction begins with one parallel axis foreach of the variables being shown. Then for each primitive, in this case particles, a single,semi-transparent line strip is used to intersect every axis to coincide with the primitive’s valuesfor those variables [13]. However, this approach alone suffers from over saturation and lowscalability in cases like ours where the number of data items can be very large.
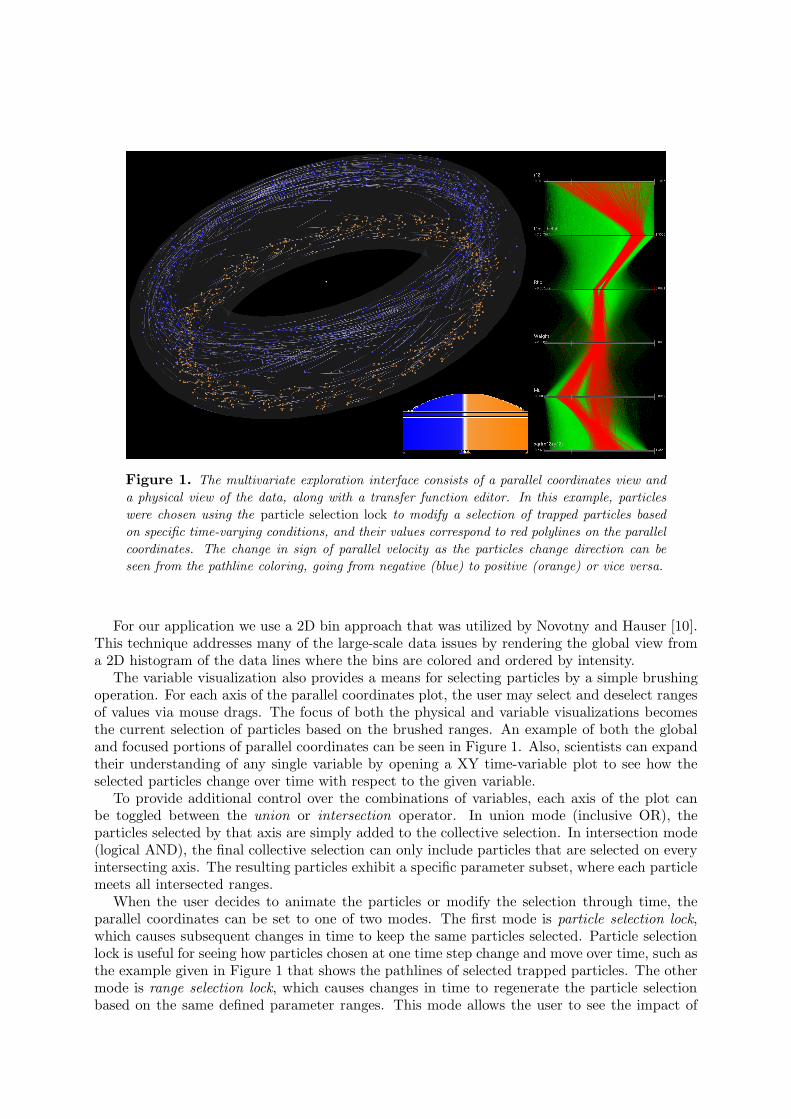
Figure 1. The multivariate exploration interface consists of a parallel coordinates view and
a physical view of the data, along with a transfer function editor. In this example, particles
were chosen using the particle selection lock to modify a selection of trapped particles based
on specific time-varying conditions, and their values correspond to red polylines on the parallel
coordinates. The change in sign of parallel velocity as the particles change direction can be
seen from the pathline coloring, going from negative (blue) to positive (orange) or vice versa.
For our application we use a 2D bin approach that was utilized by Novotny and Hauser [10].This technique addresses many of the large-scale data issues by rendering the global view froma 2D histogram of the data lines where the bins are colored and ordered by intensity.
The variable visualization also provides a means for selecting particles by a simple brushingoperation. For each axis of the parallel coordinates plot, the user may select and deselect rangesof values via mouse drags. The focus of both the physical and variable visualizations becomesthe current selection of particles based on the brushed ranges. An example of both the globaland focused portions of parallel coordinates can be seen in Figure 1. Also, scientists can expandtheir understanding of any single variable by opening a XY time-variable plot to see how theselected particles change over time with respect to the given variable.
To provide additional control over the combinations of variables, each axis of the plot canbe toggled between the union or intersection operator. In union mode (inclusive OR), theparticles selected by that axis are simply added to the collective selection. In intersection mode(logical AND), the final collective selection can only include particles that are selected on everyintersecting axis. The resulting particles exhibit a specific parameter subset, where each particlemeets all intersected ranges.
When the user decides to animate the particles or modify the selection through time, theparallel coordinates can be set to one of two modes. The first mode is particle selection lock,which causes subsequent changes in time to keep the same particles selected. Particle selectionlock is useful for seeing how particles chosen at one time step change and move over time, such asthe example given in Figure 1 that shows the pathlines of selected trapped particles. The othermode is range selection lock, which causes changes in time to regenerate the particle selectionbased on the same defined parameter ranges. This mode allows the user to see the impact of
a specific variable constraint over time by showing the amount and location of particles withinthe collection at each new frame.
3. Query-Driven Visualization
Query driven visualizations are particularly useful in the verification and validation process ofdeveloping a simulation code as it allows the application scientist to interrogate their simulationresults very precisely. Two examples of other query-driven visualization systems that are mostclosely related to ours is that of Swift-3D [7] and TimeFinder [4]. Swift-3D utilizes C-stylequery expressions that are translated into C-code, complied into shared libraries, and thendynamically linked into the application. The advantage of this type of approach is its speed andflexibility. SCIRun also makes use of dynamic compilation not only for query based operationsbut many other operations. TimeFinder allows for interactive exploration of time varying datasets, presenting the query results in a manner that allows for subsequent data-mining.
When performing a query on a single time the results can immediately be visualized. This isbecause all of the data has been fully interrogated. When the data is a series of times slices, itis possible to visualize the query results on a slice-by-slice basis. However, this may not give thedesired results. For instance, when interrogating particle in cell data, a particle may pass thequery in one or more time slices. If the particle is visualized only when it passes the query, itwill appear and disappear during the course of the visualization. As such, we have implementeda two-pass operation, performing the query over all of the particles in all of the time steps in thefirst pass and visualizing the results during the second pass. During the second pass a particleis displayed if it has passed the query for at least one or more time steps. For example, eventhough a particle may pass only the last time step, it will be displayed through all time steps.This provides visual continuity throughout the entire visualization.
It is also possible for the user to further refine the query in between passes. For instance, ahistogram that shows the range of the number of time steps particles have passed a particularquery is presented to the user. From this they can refine the query simply by stating that theparticles must not only pass the query but pass the query for at least N time steps. The abilityto produce histograms or other meta data and incorporate it into queries, which themselves maybe composed of multivariate data, is an important part of the visualization and analysis process,as it allows the application scientist to more actively interrogate their data.
3.1. Multivariate GlyphsFor our initial application of magnetic fusion PIC data, it was desirable to visualize three datavalues associated with each particle, the velocity parallel to magnetic field, the radius of thecharged ring about which the particle gyrates (gyro-radius), and the statistical weight based ontheir departure from equilibrium, Figure (2). Visualizing multivariate data that represents bothscalar and vector values presents several unique challenges, [12].
For instance, taking the naive approach and representing each data value as a separateglyph leads to unacceptable results as shown in Figure (3) where the weight sphere occluded thevelocity vector in one case. This is just one example of occlusion that can be shown. To visualizemultivariate data, a single glyph with enough degrees-of-freedom to represent each data valuemust be used or, if multiple glyphs are used, they must be unified to prevent occlusion. Wehave taken the latter approach and utilized two glyphs, a cone and a torus, each of which hastwo degrees of freedom. We have unified them through the radius, which is common to both(implicit in this is the orientation which is also common to both). As such, there is a total ofthree degrees-of-freedom that can have data values mapped to them. For the cone, the velocitymagnitude naturally maps the length and the gyro-radii maps to the radius. While for the torus,the gyro-radii maps to the major radius and the weight to the minor radius, Figure (4). Becausethe gyro-radii is used in both glyphs, it is not possible for either glyph to occlude the other.

Figure 2. The physical represen-
tation of a particle that is traveling
along a magnetic field B while gyrating
around a charged ring, [2].
Figure 3. A visualization of five
particles using three disinct glyphs.
Note the velocity arrow for one paticle
is occluded by the weight glyph.
Figure 4. A visualization of five
particles using two unified glyphs, a
cone and a torus.
3.2. ColormappingAlthough not necessary, utilizing color reinforces the physical mapping. For multivariate glyphs,colormaps were needed that would emphasize the changes in the paired signed values of theparallel velocity magnitude and the weight. At the same time, the colormaps had to contrasteach other no matter where in the color spectrum a pair of values layed. We accomplished thisusing a tetrad grouping of colors from the color wheel [8]. A tetrad are four colors equally spacedapart on the color wheel, giving a high contrast between each color, Figure (5). This resulted ina blue and a red-violet tint colormap, with a narrow band of white in the center for the velocitymagnitude and a yellow-green and a orange bivariate shade colormap with a narrow band ofblack in the center for the weight. These colormaps are used in Figures (4) and (6).
4. Conclusion
In this paper we have described two new applications that have advanced the way plasmascientists visually explore particle simulation data. The ability to find individual particles withina multi-dimensional space means that troublesome particles can be singled out for detailed study.For example, the systems allow for easy selection and rendering of trapped particles, whichhave significantly more impact on plasma transport than do passing particles. In addition, themultivariate exploration interface provides a visualization for displaying a global context of allthe variables, and conditions such as the influence of other variables or location in toroidal spacecan be examined for individual particles. The understanding provided by our system may leadto discovering solutions to problems facing turbulent plasma flow.
5. Acknowledgments
We would like to thank Dr. Stephane Ethier and Dr. Wei-Li Lee at the Princeton PlasmaPhysics Laboratory for providing data and feedback. The multivariate exploration interfacework was sponsored in part by the NSF ITR program and DOE SciDAC IUSV. The query
Figure 5. A tetrad
on a color wheel, four
colors equally spaced
apart from each other,
giving a high contrast
between each.Figure 6. A visualization of particles from one time
step using the unified glyphs.
driven visualization research was done under the DOE SciDAC VACET program.
References[1] Akiba, H., and Ma, K.-L. A tri-space visualization interface for analyzing time-varying multivariate volume
data. In Proceedings of Eurographics/IEEE VGTC Symposium on Visualization (May 2007).[2] Ethier, S., Tang, W., and Lin, Z. Gyrokinetic particle-in-cell simulations of plasma microturbulence
on advanced computing platforms. In Proceedings of SciDAC 2005 Conference - Journal of Physics:Conference Series 16 (Philadelphia, 2005), Institute of Physics Publishing, pp. 1–16.
[3] Gribble, C. P., Stephens, A. J., Guilkey, J. E., and Parker, S. G. Visualizing particle-basedsimulation datasets on the desktop. In Workshop on Combining Visualization and Interaction to FacilitateScientific Exploration and Discovery (2006), pp. 111–118.
[4] Hochheiser, H., and Shneiderman, B. Visual specification of queries for finding patterns in time-seriesdata. In Discovery Science 2001, Lecture Notes in Artificial Intelligence #2226, Springer-Verlag, pp. 441–446.
[5] Inselberg, A. The plane with parallel coordinates. The Visual Computer V1, 4 (December 1985), 69–91.[6] Jones, C., Ma, K.-L., Ethier, S., and Lee, W.-L. An integrated visual exploration approach to particle
data analysis. Tech. Rep. CSE-2007-20, University of California at Davis, March 2007.[7] Koutsofios, E., North, S., Truscott, R., and Keim, D. Visualizing large-scale telecommunication
networks and services (case study). In Visualization ’99: Proceedings of the conference on Visualization’04 (Washington, DC, USA, 1999), IEEE Computer Society, pp. 457–461.
[8] MacDonald, L. Using color effectively in computer graphics. Computer Graphics and Applications 19(1999), 20–35.
[9] Mallo, O., Peikert, R., Sigg, C., and Sadlo, F. Illuminated lines revisited. In IEEE Visualization2005 Conference Proceedings (2005), p. 3.
[10] Novotny, M., and Hauser, H. Outlier-preserving focus+context visualization in parallel coordinates.IEEE Transactions on Visualization and Computer Graphics 12, 5 (2006), 893–900.
[11] Rubel, O., Weber, G., Keranen, S., Fowlkes, C., Hendriks, C. L., Simirenko, L., Shah, N.,
Eisen, M., Biggin, M., Hagen, H., Sudar, D., Malik, J., Knowles, D., and Hamann, B.
Pointcloudxplore: Visual analysis of 3d gene expression data using physical views and parallel coordinates.Eurographics/IEEE-VGTC Symposium on Visualization Proceedings (2006), 203–210.
[12] Walsum, T. V., Silver, F. P. D., and Post, F. Feature extraction and iconic visualization. IEEETransactions on Visualization and Computer Graphics 2 (1996), 111–119.
[13] Wegman, E. J., and Luo, Q. High dimensional clustering using parallel coordinates and the grand tour.Computing Science and Statistics 28 (1997), 361–368.


![Gyrokinetic simulations of turbulent arpticle and heat ...publications.lib.chalmers.se/records/fulltext/216388/216388.pdf · The world energy use in 2012 was around 17TWy [5]. According](https://static.fdocuments.in/doc/165x107/5f43aca57c4c40169d26b850/gyrokinetic-simulations-of-turbulent-arpticle-and-heat-the-world-energy-use.jpg)