View/Open - DiscoverArchive - Vanderbilt University
35
THE POLITICAL ECONOMY OF STATE FAIR-HOUSING LAWS PRIOR TO 1968 by William J. Collins Working Paper No. 04-W13 June 2004 DEPARTMENT OF ECONOMICS VANDERBILT UNIVERSITY NASHVILLE, TN 37235 www.vanderbilt.edu/econ
Transcript of View/Open - DiscoverArchive - Vanderbilt University

THE POLITICAL ECONOMY OF STATE FAIR-HOUSING LAWS PRIOR TO 1968
by
William J. Collins
Working Paper No. 04-W13
June 2004
DEPARTMENT OF ECONOMICSVANDERBILT UNIVERSITY
NASHVILLE, TN 37235
www.vanderbilt.edu/econ

THE POLITICAL ECONOMY OF STATE FAIR-HOUSING LAWS PRIOR TO 1968
William J. Collins
[March 2004]
Word Count: 11,200
Contact: William J. Collins, Department of Economics, Box 1819-B, Vanderbilt University, Nashville, TN37235; [email protected].
Collins is Associate Professor of Economics at Vanderbilt University, Faculty Research Fellow of theNational Bureau of Economic Research (NBER), and Model-Okun Fellow of Brookings Institution (2003-2004). Robert Driskill, Thomas Haskell, Robert Margo, Jacob Vigdor, John Wallis, Gavin Wright, andeconomics seminar participants at the University of Maryland and UCLA provided numerous helpfulsuggestions. Kathleen Albers, David Rivers, and Daniel Ramsey provided timely research assistance. Support from the Oak Ridge Associated Universities (Ralph E. Powe Award), NBER (National Fellowship),National Science Foundation (SES 0095943), and Harvard’s Du Bois Institute (Non-Resident Fellowship) isgratefully acknowledged. All views expressed in the paper are those of the author and not necessarily thoseof the individuals or institutions mentioned.

THE POLITICAL ECONOMY OF STATE FAIR-HOUSING LAWS PRIOR TO 1968
Abstract: The confluence of the Great Migration and the Civil Rights Movement propelled the drive for“fair-housing” legislation which attempted to curb overt discrimination in housing markets. This driveculminated in the passage of the federal Civil Rights Act of 1968. By that time, 57 percent of the U.S.population and 41 percent of the African-American population already resided in states with a fair-housinglaw. Despite laying the political and administrative groundwork for the federal Fair Housing Act of 1968,the origins and diffusion of these state laws have not received much attention from scholars, let alone beensubject to statistical efforts to disentangle multiple influences. This paper uses hazard models to analyze thediffusion of fair-housing legislation to shed new light on the combination of economic and political forcesthat facilitated the laws’ adoption. Ceteris paribus, outside the South, states with larger union memberships,more Jewish residents, and more NAACP members passed fair-housing laws sooner than others. Theestimated effects are not undermined by including controls for a variety of competing factors and aresupported by historical accounts of the legislative campaigns.
1
1. Introduction
Between 1910 and 1970, millions of African Americans moved from rural areas in the South to
urban neighborhoods throughout the United States (Gill 1979, Marks 1989). Consequently, although blacks
were only half as likely as whites to live in central cities in 1910 (14 percent compared to 28), they were
twice as likely as whites to reside in central cities by 1970 (58 percent compared to 28). Within these
metropolitan areas, the scope of residential choices faced by African Americans was constrained not only by
their income and wealth, but also by a variety of discriminatory practices: informal but strong norms against
selling or renting property to blacks, racially restrictive covenants embedded in property deeds, barriers to
mortgage finance, and outright violence against and intimidation of blacks attempting to move into white
neighborhoods (Myrdal 1944, Abrams 1955, Meyer 2000, Brooks 2002).
Eventually, the confluence of the Great Migration and the Civil Rights Movement propelled a drive
for “fair-housing” legislation which attempted to curb overt discrimination in housing markets. The drive
culminated in the passage of the federal Fair Housing Act in 1968, the impact of which has been discussed
in numerous studies (Bianchi, Farley, and Spain 1982; Goering 1986; Leigh 1988, 1991; Denton 1999;
Yinger 1999). Several states implemented fair-housing legislation long before the federal government did.
In fact, by the time Congress passed the Fair Housing Act, 22 states had already passed fair-housing
legislation, implying that approximately 57 percent of the U.S. population and 41 percent of the African-
American population resided in states with some form of fair-housing law applied to private housing.
The adoption of fair-housing laws dramatically reoriented race-related housing policy in the United
States, which until the early 1950s had explicitly promoted the use of racially restrictive covenants to
maintain “neighborhood stability”. Despite their clear influence on the form of and campaign for the federal
Fair Housing Act, scholars have devoted comparatively little attention to the diffusion of the state laws.
Notable contributions include Eley and Casstevens (1968), a volume of case studies of local and state fair-
housing initiatives, and Lockard (1968), which devotes a chapter to discussing the politics and operation of
sub-federal fair-housing policies. Additional detail may be extracted from the bi-monthly newsletter of the
National Committee Against Discrimination in Housing. But to date, although the descriptive accounts teem
with testable hypotheses, statistical evidence rarely informs the story of the origins and impacts of fair-
housing laws.
This paper studies the laws’ geographic diffusion to shed new light on the combination of economic
2
and political forces that promoted the policy reversal. The state laws provide visible markers of the Civil
Rights Movement’s legislative progress. A careful empirical examination of those landmarks can clarify and
reshape the existing view of the ascendancy of anti-discrimination policy. This paper’s analysis cannot
encompass the full range of the Civil Rights Movement’s goals and efforts, but the fair-housing laws are one
of the Movement’s central legislative legacies, and the paper’s exploration is firmly situated in the
Movement’s broader context.
This story should interest social scientists and historians for three reasons. First, the Civil Rights
Movement was arguably the most important American social movement of the 20th century. An economic
perspective may yield important insights into what made its legislative successes possible (Alston and Ferrie
1999, Wright 1999). Second, scholars should be fully cognizant of the origins of the policies they study,
even if primarily concerned with policy effects (Stigler 1973, Heckman 1976). Third, urban policymakers
continue to grapple with problems rooted in the history of residential segregation and racial discrimination.
Current policy debates should be informed by the interplay of policy, race, and housing markets over the
past several decades.
The idea of applying anti-discrimination policy to private housing markets was among the least
popular initiatives of the Civil Rights Movement (in both the South and elsewhere), and yet, nearly two
dozen states enacted laws prior to the federal legislation. Using hazard model estimates, the paper finds
strong empirical evidence that activism by black civil rights groups was complemented by legislative support
from Jewish groups and from organized labor. This complementary support was quantitatively important in
determining the timing of adoption of fair-housing laws. It also squares well with contemporary descriptions
of the grass-roots campaigns for fair-housing, though it tends to be overlooked in broader histories of the
Civil Rights Movement.
2. The History and Character of Fair-Housing Laws
The legislative disputes over housing-market discrimination sprang from a tension between
competing American ideals: the freedom of individuals to dispose of their property and conduct their
business freely versus the promise of equal opportunity and “fair” treatment regardless of race, religion, and
national origin. Although the notion that the government itself ought not discriminate was embedded in
many state constitutions and sometimes applied to public housing (owned and operated by the government),

1 Nonetheless, there was more heterogeneity among the sub-federal fair-housing statutes than therewas among the sub-federal fair employment statutes which were also based on New York’s pioneeringefforts.
3
it was a leap from there to the enactment and enforcement of anti-discrimination policy in private housing.
For example, New York State enacted the first law upholding a non-discriminatory standard for public
housing in 1939 but did not extend anti-discrimination legislation to private housing until 1961. More
generally, fair-housing laws usually lagged years behind those pertaining to employment and public
accommodations (Lockard 1968, p. 24).
In December 1957, New York City adopted the nation’s first fair-housing ordinance which,
according to Lockard (1968, p. 118), became a model for several of the state laws and municipal ordinances
that followed.1 Initially, the ordinance covered only buildings with multiple units and housing developments
(Robison 1968). By 1964, the range of coverage had been extended to all housing except the rental of
rooms in owner-occupied units and housing operated by religious organizations. The ordinance stated that,
“no owner, ... real estate broker, ... or other person having the right to sell, rent, lease, ...or otherwise dispose of a housing accommodation ... shall refuse to sell, rent, lease ... orotherwise deny or withhold from any person or group of persons such housingaccommodations, or represent that such housing accommodations are not available forinspection, when in fact they are so available, because of the race, color, religion, nationalorigin or ancestry of such persons” (Housing and Home Finance Agency 1964, p. 287).
It went on to bar discrimination in the terms of sale or rental of housing, advertisements expressing
discriminatory preferences, and discrimination by banks and lending institutions, and it outlined a procedure
for handling complaints of discriminatory treatment.
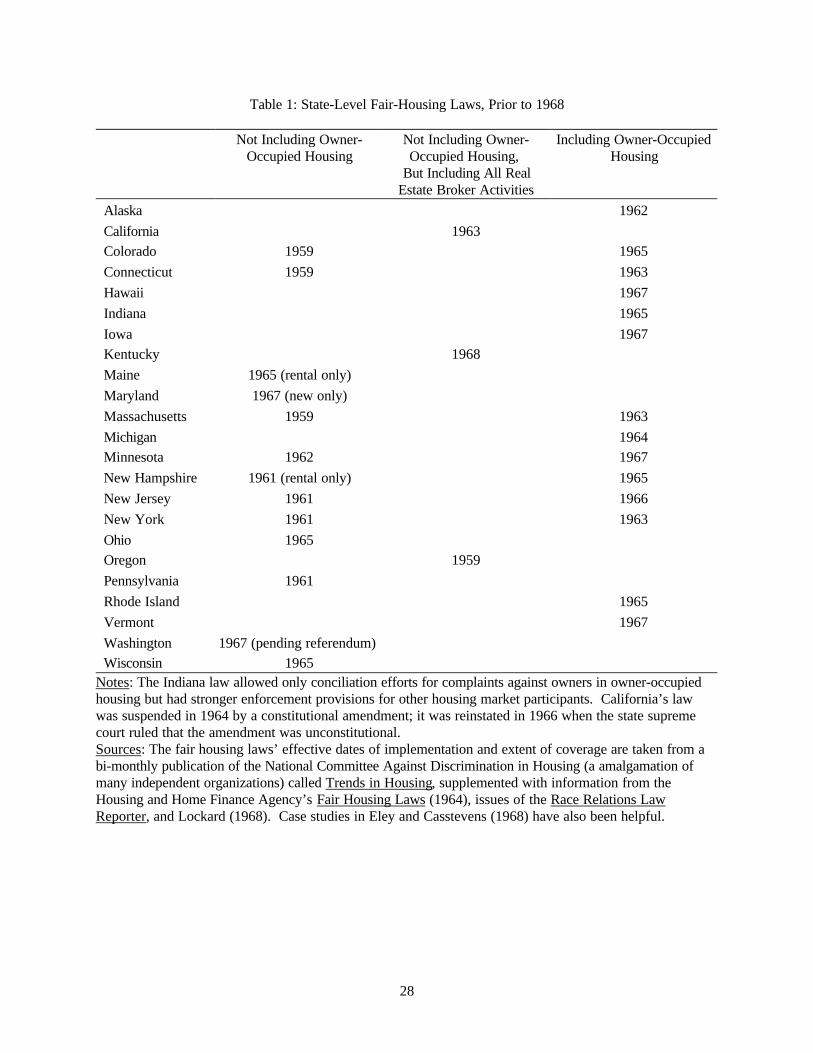
As shown in table 1, Colorado, Massachusetts, Connecticut, and Oregon enacted the first state-level
fair-housing laws in 1959. The nature of housing market transactions, in combination with the hurdles of
legislative politics, often delivered fair-housing statutes with incomplete coverage. Table 1 documents the
timing of each state’s initial adoption and subsequent extension of fair-housing laws prior to 1968. Almost
all states exempted the rental of rooms within or attached to an owner-occupied residence (the “Mrs.
Murphy rule”). As listed in column 1, some laws also exempted activities associated with the sale or rental
of owner-occupied single-family homes. Other laws, listed in column 2, allowed owner-occupiers to sell to
whomever they wished, but simultaneously prohibited discriminatory actions by real-estate brokers,
2 Title VIII of the Civil Rights Act of 1968 was designed along these lines: brokers, builders, andlenders were covered; houses sold without public advertising or a broker’s services were not (U.S.Commission on Civil Rights 1973).
3 The laws sometimes included prohibitions of “blockbusting” and “panic selling” in which realestate agents would attempt to convince white residents that African Americans were moving into theneighborhood, that property values were bound to fall, and that therefore whites should sell immediately. Few of the laws specifically dealt with restrictive covenants. The Supreme Court had ruled themunenforceable in 1948 (Shelley v. Kraemer), but they were still common (Lockard 1968, p. 120).
4
advertisers, lenders, and builders.2 That is, owner-occupiers could discriminate legally if they were willing
to sell the house on their own. By 1968, however, most of the states with laws had converged to a standard
which covered virtually all sales and rentals (except those by Mrs. Murphy).3
In keeping with the already-established fair-employment mode of operation, administrative agencies
enforced the fair-housing laws primarily by responding to individual complaints rather than by seeking out
discriminatory practices. Although there were some differences in procedures across states, when presented
with a complaint, the typical agency would ensure that the case fell within the law’s coverage, would
conduct an investigation, and given evidence of discrimination, would attempt to persuade the discriminatory
party to “adjust” its practices. When “conciliation” was refused, the agency could hold a public hearing,
issue a cease and desist order or a fine, initiate court proceedings, and potentially suspend or revoke an
agent’s real estate license. In addition to their enforcement duties, the fair-housing agencies undertook
“educational” campaigns and advised community leaders and builders regarding integration.
The nationwide, long-run effects of the federal Fair Housing Act remain unclear, but the early state
laws did not have an immediate, discernable impact on blacks’ housing market outcomes relative to whites’
during the 1960s (Collins 2003a). This may be significant because both the drive for and opposition to such
laws could have been influenced by perceptions of their effectiveness, as discussed below. It is important to
note that the passage of the federal Fair Housing Act in 1968 did not obviate the state laws. Rather, if a
state had a fair-housing law, discrimination complaints were typically left in the state’s hands. The state
laws often included enforcement powers that the federal law did not, and the federal agency’s powers were
not expanded significantly until 1988.
3. Political Mobilization and Legislation in Theory and Context
A full account of twentieth-century politics regarding matters of race and discrimination would range

4 Consistent housing discrimination questions were not asked over as long a time period as theemployment question. Similarly, surveys of black attitudes toward discrimination and residential segregationdo not appear until late in the period under study. See Schuman et al. (1985).
5 For example, the figures just cited might overstate the true magnitude of change in racialsentiment if respondents lied to be in accordance with what was considered socially or publically acceptable(Kuran 1995, Wright 1999).
5
far beyond the scope of this paper, but a relatively simple framework in which public opinion, political
agents, and government institutions interact to produce legislation can help fix ideas. The framework has
two fundamental, dynamic parts: the distribution of public sentiment regarding race-related policy, and the
strength of the connection between public sentiment and policy outcomes.
Between 1940 and 1970, the shift in the distribution of white Americans’ opinions on racial
discrimination was large. In 1944, only 45 percent of white respondents to a National Opinion Research
Center (NORC) survey agreed that “Negroes should have as good a chance as white people to get any kind
of job” (the others thought that whites “should have the first chance”). In 1972, nearly 97 percent agreed
with the “as good a chance” sentiment (Schuman et al. 1985, 104-105).4 Interpreting survey data may have
pitfalls.5 And it is clear that whites were considerably less supportive of equal opportunity in residential
competition than in job competition: in 1968, 56 percent of white respondents agreed that whites “have a
right to keep Negroes out of their neighborhoods if they want to . . .” (Schuman et al. 1985, p. 106). But
the general point that there was a significant change in the distribution of public opinion after 1940 is
unambiguous.
At the individual level, one’s opinion on discrimination and the appropriate policy response to it (if
any) may depend on exposure to particular ideas and experiences at home, in school, in church, and in one’s
community. A person could change his mind about an issue when presented with new evidence and
arguments, thereby shifting the overall distribution of sentiment (incrementally). Or, as younger cohorts
replace older cohorts, the population’s distribution of sentiment may change if younger cohorts have
adopted a different set of views.
In this paper’s context, the potential contributing factors to the shift in public opinion over time are
numerous, including: campaigns for anti-lynching legislation prior to World War II (Zangrando 1980); the
experience under the wartime Fair Employment Practices Committee which imposed a temporary anti-
discrimination norm in war-related industries (Reed 1991); post-World War II revulsion to the holocaust and

6 The collective action literature is too extensive and multi-faceted to synthesize here. See Oliver(1993) for a survey of the theoretical literature. See Olzak (1989) for a discussion of empirical approachesto studying collective events.
7 If the government’s position on fair housing were completely determined by the underlyingpreferences of the electorate, then discussing “responsiveness” and independent “inclination” would beunnecessary. However, legislators’ positions on any particular issue may be somewhat misaligned withvoters’ positions, and the institutional features of the legislative process (e.g., committee structure, log-rolling, and veto authority) ensure that legislatures are not passive conduits of the electorate’s will.
8 In the case of fair housing, this appears to be an accurate characterization. In describing the earlyactivism of pro-fair-housing forces and early passivity of anti-fair-housing forces, Eley wrote that “Thiscontrast in behavior is understandable, since the proponents were seeking new policies, while the opponentsmerely wanted to maintain the status quo.” (1968, p. 14).
6
the racist ideology that motivated it; the Great Migration of blacks from the South which made race-related
policy issues a more proximate concern for non-southern whites; the emergent rhetoric of “fairness” and
legal arguments from the Civil Rights Movement (Moreno 1997); the desegregation of the military
(Dalfiume 1969); widely distributed reports and images of violence against Civil Rights activists; civil
disturbances in non-southern cities; and the glaring incompatibility of discrimination and disenfranchisement
with the “American Creed” in the context of the Cold War competition of ideas (Myrdal 1944).
But clearly, popular sentiment is not automatically registered in political activism and public policy
(e.g., see Burstein et al. 2001). The links between public sentiment and policy outcomes can be formulated
in a simple collective action model, similar to that of Chong (1991).6 Suppose the net level of support for
fair-housing legislation is a function of the strength of the political forces mobilized in favor of and in
opposition to the legislation, the government’s responsiveness to those forces, and the government’s
inclination, independent of local demand, toward the legislation.7 At this level of the model, a fair-housing
law is enacted when the net level of support exceeds a certain threshold. But what underlying currents
determine the degree of support, opposition, or government responsiveness? And how might those factors
evolve over time and differ across locations?
Following Chong (1991), one may suppose that since the opposition is defending the status quo, it
mobilizes in response to the rise in pro-fair-housing forces.8 Because there are costs to such mobilization,
pecuniary and otherwise, the opposition’s strength of response will depend on what is perceived to be at
stake in the law’s enactment and on the likelihood of its being passed in the absence of opposition. For
example, whites’ fear of a decline in neighborhood housing values associated with racial integration might
have led to strong resistance to anti-discrimination legislation. On the other hand, “white flight” to suburban
9 It is also possible, however, that publicity of such violence could spur previously apatheticindividuals to support the legislation.
7
neighborhoods might have represented a relatively low cost way to accommodate anti-discrimination laws.
The rise of the pro-fair-housing forces are somewhat more complex. First, the “idea” or “blueprint”
for fair housing laws and enforcement had to be generated. It is clear that fair-housing laws are patterned
directly after fair-employment laws (which began getting passed in the 1940s), and the fair-employment idea
itself is rooted in long-standing prohibitions of religious tests for political office and in the emergence of a
model regulatory apparatus in the National Labor Relations Board (Bonfield 1967). Given that the idea
exists, one’s expected gains from an anti-discrimination law’s implementation (V), multiplied by one’s ex
ante view of the change in the probability of passage associated with one’s support (p1 - p0), reflects (part
of) the direct benefit from providing support relative to not doing so. For influential members of the
community, p1 - p0 might not appear to be a trivial difference.
Also, one may receive utility from participation that is independent of the movement’s success or
failure (A), perhaps associated with one’s perception of “doing the right thing”. Additional utility from
participation (Z) might depend on the law’s passage, perhaps associated with being on the winning side of
the legislative contest (bZ, where b is the perceived probability of passage). Importantly, the perceived
overall gains to supporting the legislative campaign may be broad in nature, including utility not only from
improved access to housing (for those protected by the law), but also from contributing to what one views
as a worthy cause and from esteem bestowed by others. The expected gains to supporting the legislation
are then: A + bZ + (p1 - p0)V.
Several factors would influence a potential supporter’s perceived costs (C), including time, effort,
monetary costs, and reprisal from opponents (ranging from ostracism to intimidation and violence).9 Note
that this opposition has an indirect effect on the legislative outcome (by dampening support), distinct from
the direct effect associated with legislators’ responsiveness to opposition forces. If the movement gains
strength over time, the perceived costs to participating could fall, further spurring the movement; for
example, the fixed costs to organization could be spread more thinly, or there may be a perception of
“safety in numbers”.
In this framework, an individual will support the movement if the expected benefits from doing so
exceed the expected costs, A + bZ + (p1 - p0)V - C > 0. By extension, the degree of any person’s support
10 In this regard, my description of “contagion” deviates from Chong (1991). Chong emphasizesthat a larger mobilized group will raise “assessments of the power of collective action” (p. 147), essentiallycorresponding to the b parameter in the framework I have outlined. I emphasize that a larger mobilizedgroup can influence public perceptions of the importance of the issue and the potential payoffs to supportingit (moral and otherwise), while lowering the costs of joining the movement.
8
or opposition may reflect the size of the gap between the expected benefits and expected costs, and the
proportion of the population expressing support will rise as the expected benefits rise or the expected costs
decline. Initially, people with the most to gain, with the most optimistic view of their potential impact on the
movement’s success (perhaps expecting that others will follow their lead), and those strongly motivated by a
sense of “doing the right thing” or by just being a part of a political movement are most likely to jumpstart
the fair-housing campaign and lead it (also see Oberschall 1980). Conversely, those who think that the gains
conditional on passage are small, that the probably of making a difference is low, and that the utility derived
from political participation per se is negligible, are unlikely to support the movement, at least at the outset.
At any point in time, there is a distribution of expected net gains over the population. Importantly,
different places are unlikely to have identically distributed net gains over their populations. Therefore,
summing the net expected benefits within states at some “initial” date (such as when the legislative idea
appears), the model suggests that different states may have different starting points and take different
trajectories in the political dynamics that follow.
The level of support for a law may feed on itself and on related political success. Specifically, there
may be a “contagion” effect, whereby support is augmented through peer effects and changing perceptions
about the potential benefits (particularly, A, Z, and V) and costs of expressing legislative support.10 There
may also be “bandwagon” effects, whereby support is augmented because political successes in other arenas
(perhaps judicial, or other types of legislation, or other localities) have raised expectations regarding the
effectiveness of political action (raising b or p1). On the other hand, support may be quashed by the rise of
strong opposition forces.
Although much of the underlying process is unobservable in practice, the timing of legislative
adoption is clearly observable and forms the basis of this paper’s empirical investigation. Moreover, as the
next section’s discussion illustrates, easily observable differences in state economic, demographic, and
political characteristics are likely to have influenced the popular and governmental predisposition toward
anti-discrimination laws. Geographic spillovers and rising legislative support over time (reflecting
11 For the sake of brevity, I will proceed as if each “group” took a particular position on the issue,though there certainly may have been considerable dissent within any particular group. If such dissentundermined effective political action, the empirical framework used below should reflect thatineffectiveness.
9
bandwagon and contagion effects) may also register empirically.
4. The Politics of Fair Housing
In reading historical accounts of the campaigns for fair-housing laws, it is clear that the perceived
costs and benefits were not randomly distributed over the national population. Rather, the legislation
appealed to particular ethnic, economic, and political groups that championed the cause in the face of
substantial resistance (various issues Trends in Housing, Eley and Casstevens 1968, Lockard 1968).
Brandishing the rhetoric of inviolable property rights and the fear of property devaluation, the opponents of
fair housing posed a formidable challenge. This section discusses the positions and motives of the groups
that are commonly cited as contributors to the drive for fair housing.11 The next section provides an
empirical framework within which the various strands of this historical narrative are disentangled and
measured for the first time.
African Americans
By the time the fair-housing movement was in full swing (the mid- to late-1950s), African-American
groups had surged to the forefront of the Civil Rights Movement, especially in the South with the
ascendance of Martin Luther King, Jr. Given that African Americans had the most to gain from the
expansion of housing opportunities and, more broadly, from the establishment of non-discriminatory social
norms, and that earlier judicial (e.g., Brown vs. Board) and legislative (e.g., fair employment) successes may
have increased the perceived payoff to political activism, the participation of African-American political
groups in the state fair-housing campaigns is not surprising. Of course, some African Americans,
particularly those with the means and desire to move out of central city ghettos, might have had more to
gain from fair housing than others.
Outside of the South, however, blacks made up a relatively small and relatively poor segment of
each state’s population. Summoning much legislative leverage from this political base would have been
12 Keech (1968, pp. 95-99) concludes his study of the impact of black voting in the South by notingthat black votes are likely to be less influential on matters of housing than in other areas, such asemployment, the equitable distribution of public goods, and public accommodations.
13 McGreevy notes, “The cultural separation of residence from work helps explain the phenomenonnoted as early as the 1919 Chicago riot and emphasized later by a wide array of observers – that the sameindividuals accepting of an African-American presence in the workplace violently resisted neighborhoodintegration” (1996, p. 107).
10
difficult (Lockard 1968), even allowing for potential bandwagon and contagion effects.12 Given the general
unpopularity of fair housing, as manifested in a number of state referenda on the issue (Eley 1968), support
from other politically powerful groups might have been crucial to any campaign’s success. The incentives
facing these groups, as discussed below, were less clear cut than those facing African Americans.
Labor Unions
Unions exercised a great deal of political influence during the period under study. Their use of this
influence, and the implied expenditure of political capital, on behalf of fair housing makes sense as an
extension of their commitment to the broader Civil Rights Movement, which itself derived from unions’
growing black membership, ideological roots (at least in the CIO’s case), and the legacy of the New Deal
political coalition. The CIO in particular emphasized fair-employment policies in its postwar political agenda
(Gray 1970, Rosen 1971). Various issues of Trends in Housing (published by the National Committee
Against Discrimination in Housing) report that labor organizations contributed to the fair-housing
movement’s successes. Lockard notes that in Connecticut, “the major force not only for employment but
also for housing laws was the union movement; union lobbyists drafted the laws, union men in the
legislature work for their passage; labor representatives were always prominent supporters at hearings, and
legislative leaders often negotiated directly with labor leaders in hammering out compromises” (1968, p. 37).
Nevertheless, at the grass-roots level, unions’ enthusiasm for fair housing might have been undercut
by the concerns of rank-and-file white members. White workers’ neighborhoods were often most
proximate to existing black neighborhoods, most affordable for black families looking to move, and therefore
most likely to be affected by the expansion of black residential options.13 Furthermore, the AFL’s support
for anti-discrimination policies, both internally and legislatively, had always been less enthusiastic than the
CIO’s, a reflection of the exclusive nature of craft unions compared to the inclusive tendencies of industrial
14 See Ashenfelter (1972) for an extended discussion of why supporting anti-discriminationlegislation was in the economic interest of the CIO, more so than the AFL. The main idea is that excludedand disgruntled black workers could substitute for unskilled whites (predominantly CIO), therebyundercutting the effectiveness of strikes and the threat of strikes. It made sense to align blacks’ interestswith the union’s. In general, the AFL did not rely on strikes to extract rents, and excluded blacks could noteasily compete with skilled whites.
15 The eight groups are: Anglo-Saxon, German, and Scandinavian Protestants (three groups); Irish,German, Southern European, and Slavic Catholics (four groups); and Jews.
16 See Abrams (1955, pp. 81-90) or Sugrue (1996, pp. 231-258) for several descriptions of effortsto intimidate blacks who were attempting to move into white neighborhoods.
11
unions.14 This support dwindled further during the 1960s as Civil Rights organizations tried to pry open the
skilled building trades by altering the existing rules for selection into apprenticeship programs (Lockard 1968,
pp. 38-39). Thus, by the time of the AFL and CIO’s merger in 1955, labor’s endorsement of anti-
discrimination legislation might have been substantially tempered, even if it had not waned entirely.
White Ethnic and Religious Groups
In 1944, Gunnar Myrdal noted that “Few white property owners in white neighborhoods would
ever consider selling or renting to Negroes; and even if a few Negro families did succeed in getting a
foothold, they would be made to feel the spontaneous hatred of the whites both socially and physically” (p.
622). Even given a strong trend toward greater social acceptance of African Americans, it is clear that fair-
housing laws and the racial integration of neighborhoods remained an unpopular proposition among whites in
the 1960s. In 1970, after passage of the federal Fair Housing Act, none of the northern white ethnic groups
identified in a NORC survey had a majority in favor of fair-housing laws (Greeley and Sheatsley 1971, p.
18).15
The strength of some whites’ resistance derived from a self-reinforcing set of economic incentives
and racial beliefs. Housing equity was the largest single component of most households’ net worth, and
crime, property values, and immobile neighborhood institutions (e.g., schools and churches) were assumed
to be adversely affected by the presence of African-American neighbors. Whites resisted fair-housing and
residential integration by intimidating new black neighbors, and if need be, by moving out of the
neighborhood themselves.16 Fair-housing advocates attempted to defuse this mechanism by citing studies
(e.g., Laurenti 1960) that found no strong evidence of an adverse impact on property values due to racial
integration.

17 The most infamous example, circa 1960, of systematic housing discrimination against Jews wasrevealed in Grosse Pointe, Michigan, a wealthy suburb of Detroit. Jews had to score 85 points on the basisof “swarthiness”, accent, lifestyle, occupation, education, dress, reputation, and so forth to be allowed topurchase a home in the suburb. Anglo-Saxon Protestants needed a score of 50 (Dinnerstein 1994, p. 157). Blacks and Asians were excluded entirely (Walker 1968).
18 The photos can be seen in issues of Trends in Housing, published by the National CommitteeAgainst Discrimination in Housing.
12
Given this backdrop, it may seem surprising that some predominantly white ethnic and religious
groups were often cited as being in the vanguard of the fair-housing movement (Trends in Housing various
issues, Lockard 1968, Eley and Casstevens 1968). Several factors led to their political support. First, the
laws’ language always prohibited discrimination on the basis of “race, color, creed, or national origin.”
Thus, they protected a fairly broad ethnic expanse, and it is possible that this protection (or the broader
campaign against discrimination) held direct benefits for some members of white ethnic groups (Robison
1968). Second, white ethnic groups which had been (or were still) subject to discrimination might have
been responsive to the campaign’s broad non-discriminatory message, independent of whether they would
directly benefit from new anti-discrimination laws. Third, especially in the wake World War II and the
holocaust, there was a strong moral and religious appeal to opposing unjust treatment of minority groups.
Leaders of many faiths responded to that appeal. Fourth, the (non-southern) Democratic Party and labor
unions favored the Civil Rights Movement’s agenda, and they might have influenced both legislators and
their white constituents on matters of race-related policy.
At mid-century, employment, housing, and social discrimination against Jews was common, and
according to Dinnerstein (1994, pp. 128-174), American anti-Semitism had reached a “high tide” during the
1940s.17 Jewish groups, such as the American Jewish Congress, were determined to promote non-
discriminatory norms and policies, and they took an early leadership role in the Civil Rights Movement’s
campaigns for both fair employment and fair-housing laws. According to Lockard, “In every state there is
evidence of some major contribution from Jewish groups: money to finance campaigns, staff to coordinate
and direct activities, lobbying and intralegislative assistance, substantial legal advice and assistance in the
drafting and in the defense of civil rights laws” (1968, p. 41). Consistent with this view, representatives of
Jewish groups figured prominently in photos of fair-housing bill-signing ceremonies.18
According to the 1970 NORC survey, Catholics appear to have been favorably disposed toward
Civil Rights issues in general, at least relative to other non-Jewish, northern whites (Greeley and Sheatsley

19 Comparing a list of member organizations of the FCCCA in 1950 with the Churches and ChurchMembership publication indicates that the four largest FCCCA denominations were: the Methodist Church,the Protestant Episcopal Church, the Presbyterian Church of the U.S.A, and Disciples of Christ,International Convention.
13
1971, Greeley 1977, Fowler 1985). Moreover, the involvement of local Catholic Interracial Councils in
promoting Civil Rights legislation, Monsignor Francis J. Haas’ temporary chairmanship of the federal Fair
Employment Practice Committee during World War II, and the church hierarchy’s official position on racial
equality all suggest that as a group, Catholics might have lent political weight to the advancement of the Civil
Rights agenda. However, faced with fair-housing legislation and with the actual integration of predominantly
Catholic neighborhoods, local resistance was sometimes fierce (Sugrue 1996, Meyer 2000), perhaps
suggesting a large gap between liberal clergy and many members of the laity (McGreevy 1996).
Among Protestants, relatively liberal denominations might have contributed to the advancement of
the Civil Rights legislative agenda through the Federal Council of Churches of Christ in America (FCCCA)
or its successor, the National Council of Churches (NCC).19 Again, however, there was apparently
considerable distance between liberal clergy and less liberal laity on matters of Civil Rights (Fowler 1985).
Political Parties
In any legislative debate, the positions of various groups are roughly translated into policy outcomes
by legislators who owe loyalty not only to their constituents, but also to a particular party organization.
Thus, there may be some misalignment of the electorate and the legislators on an issue like fair housing for
at least two reasons: first, fair housing would be only one of many issues that voters considered in choosing
a representative; and second, national political parties might have policy positions that are independent of the
local electorate’s sentiments. In such a setting, the relative strength of political parties might have an
independent influence on the adoption of fair-housing laws.
Throughout the period under study, outside of the South at least, the Democratic Party (and its
affiliated politicians) tended to favor the extension of anti-discrimination laws to the private sector.
Republicans tended to be aligned with the business interests that opposed government interference with free
enterprise. Whether or not party strength had an influence on fair-housing laws’ adoption that was
empirically independent of more primitive characteristics of the state’s electorate will be examined below.

20 The general econometric approach is similar to Collins (2003b) which studied fair-employmentlegislation.
21 The National Committee Against Discrimination in Housing was formed in July 1950 (Robison1968), and so 1950 seems like a reasonable starting date for the empirics. Ultimately, the choice of startingdate does not matter to the Cox estimates. The Weibull β coefficients are rather insensitive to changes inthe starting date by a few years.
14
5. Empirical Strategy
On the basis of the existing historical narrative, it is difficult to discern what factors, on average,
facilitated or hindered fair-housing legislation, let alone how much those factors mattered. In this section, I
exploit variation in state characteristics and state legislation to lend econometric perspective to the story.20 I
start with a framework that assumes that a set of state characteristics is exogenous and fixed over the period
of study. Later, I allow for four potentially important time-varying characteristics: changes in the size of the
black population; changes in policy in neighboring states (essentially a geographic spillover effect); changes
in fair-employment policy (essentially a within-state policy spillover); and changes in the party of the
governor. Other broad changes in the national political environment are assumed to influence (non-
southern) states evenly and are reflected in a rising time trend in the likelihood of fair-housing adoption.
Throughout the empirical analysis, the focus is on the non-southern states because the southern
states were far from “at risk” of adopting this sort of anti-discrimination legislation. As will become clear as
the results unfold, given the demographic, economic, and political characteristics of the South, the empirical
results certainly are not weakened when the South is included in the sample. Nearly all of the factors that
are shown to promote fair-housing’s adoption outside the South are weak or absent within the South.
Hazard models make effective use of the information embedded in the timing of legislative changes.
Let h(t) = h0(t)eXβ, where h(t) is the hazard function, describing the rate at which spells of “without a fair-
housing law” end. h0(t) is the baseline hazard function which may rise or fall over time and is proportionally
scaled by the eXβ term. In this paper, each state’s “spell” is defined as the time between 1950 and the time
of fair-housing adoption.21 Interest lies in whether a set of state characteristics, X, influences the hazard
function, h(t), in the way that is consistent with the paper’s historical narrative and simple model. The
estimated β parameters indicate whether or not the state characteristics affected the timing of adoption. The
baseline hazard function is also of interest because it may reflect the increasing momentum of the Civil
Rights Movement.
22 Table 3, column 1's coefficients using “full coverage” dates would be as follows, with z-statisticsin parentheses: Black = 0.21 (2.04); Jewish = 2.55 (1.95); Catholic = 1.06 (0.71); FCCCA = 1.46 (2.78);Urban = 0.93 (0.61); CIO = 6.32 (2.01); AFL = 1.14 (0.44); Pol. Comp. = 1.22 (0.71); Pol. Comp.2 =0.998 (0.42).
15
I estimate two different forms of proportional hazard models here. First, supposing that h(t) = ptp-1
eXβ, I estimate Weibull models in which p and β are estimated by maximum likelihood. If p > 1, then the
baseline hazard rate tends to rise over time. The Weibull approach assumes that the baseline hazard has a
particular parametric form, but one can avoid assumptions about the functional form of h0(t) and still
estimate the β parameters by using a Cox model. The main difference is that the Cox model estimation
relies on the order of adoptions to identify the coefficients rather than on the actual time of adoption. I
report estimates of both Weibull and Cox specifications in tables 3 and 4, and the results are similar.
State Data
The fair-housing laws’ effective dates of implementation and extent of coverage are based on
reports in Trends in Housing (published bi-monthly by the National Committee Against Discrimination in
Housing), supplemented with information from the Housing and Home Finance Agency’s Fair Housing
Laws (1964), issues of the Race Relations Law Reporter, and Lockard (1968). In the language of hazard
models, the date of implementation marks the timing of the “failure”, and the states that had not passed laws
before the 1968 Civil Rights Act are treated as censored observations. In general, I use the year of
implementation of each state’s first fair-housing law (as long as it covered more than just new units or
rentals), but I have also experimented with using the month of implementation and with counting only laws
qualifying for the last column of table 1 (those with close to “full coverage”). The qualitative results are
similar.22
Summary statistics of the main independent variables are reported in table 2. I used the 1960
Integrated Public Use Microdata Series (IPUMS, Ruggles and Sobek 1997) sample to calculate the
proportion of each state’s adult population that was black. A larger adult black population might wield more
political power through its voting power or its generation of larger pools of economic and political resources.
But, to the extent that whites viewed a large black population as a potential threat to neighborhood
homogeneity and to the value of their homes, larger black populations might have dampened support for
23 After 1955, the Bureau of Labor Statistics occasionally reports AFL-CIO membership but doesnot distinguish between the two groups at the state level (see Cohany 1961). Total membership levelsappear to be flat from 1953 to 1960.
16
fair-housing legislation ceteris paribus. Blacks with higher levels of education may have had more to gain
from the fair-housing legislation (e.g., access to white suburbs) and may have been more engaged in local
politics. Therefore, the average educational attainment of black adults, as calculated using the 1960 IPUMS
samples, is entered in several of the hazard model specifications.
Given the concentration of non-southern blacks in urban areas, white opposition to fair-housing
laws might have been stronger in states with higher proportions of urban whites. That is, the perceived
threat of a change in exposure to black neighbors might have been greater in such places, and therefore
resistance to fair housing might have been stronger. The proportion of each state’s white population
residing in urban areas in 1960 is taken from the published volumes of the 1960 census.
Troy (1957) provides carefully constructed union membership levels for each state in 1953. Using
Troy’s figures, I calculated the proportion of each state’s population that belonged to the AFL and the CIO.
The AFL and CIO merged in 1955, before the passage of the first state-level fair-housing laws, but I allow
their empirical influence to differ because of their long-standing differences in support for anti-discrimination
measures.23
To help assess the role of religious organizations in promoting fair-housing legislation, I estimated
the proportion of each state’s population that was Jewish, Catholic, or members of the four largest
denominations supporting the FCCCA. The membership data are from the 1952 survey of Churches and
Church Membership in the United States.
I collected NAACP membership data to help capture the organizational vitality of local civil rights
groups. The data are taken from the 1951 NAACP Annual Report and provide a measure of organized
activism at the beginning of the period under study. Unfortunately, later reports offer less detailed
information on membership. In 1951, precise membership figures are reported for the largest branches
(more than 2,000 members), and categorical indications are given for smaller branches (e.g., Boston had
between 1,000 and 2,000 members). I formed state-level estimates by assigning branches with categorical
indicators the midpoint value of that category’s range and then adding those figures to the more precise

24 Branches with fewer than 500 members are not reported at all, and so they cannot beincorporated into the state-level estimates. Note that the NAACP variable is(10,000*membership/population). This scaling is chosen to make the coefficient’s magnitude easier tointerpret.
25 I believe that Bergman and Lyle (1971) were the first to use the Wallace votes as a metric fordiscriminatory tastes. Voting statistics are from The World Almanac and Book of Facts (1970, p. 365).
26 The personal income per capita figure is for 1960 from Historical Statistics of the United States. The relative income measure is estimated using male household heads from the 1960 IPUMS sample. Themanufacturing employment variable is also estimated from the 1960 IPUMS.
17
figures for larger branches in the state. These sums are scaled by state population in the analysis.24
Potential endogeneity issues are discussed below.
To identify differences and changes in government responsiveness to underlying political pressures,
I use two measures. First, Ranney (1965) calculated an index of inter-party competition for each state using
data from 1946 to 1963 based on the average percent of the popular vote won by Democratic gubernatorial
candidates, the average percent of seats in the state senate held by Democrats, the average percent of seats
held in the state house of representatives held by Democrats, and the percent of all terms for governor,
senate, and house in which Democrats had control. The index runs from 0 (complete Republican control)
to 100 (complete Democratic control). Since state lawmakers might be most responsive to black voters’
demands in places were party competition is fierce, I enter the index as a quadratic, thereby allowing the
effect to rise as the index approaches the middle range and then decline as the index value moves beyond it,
if driven to do so by the data. Later, in the time-varying covariates version of the model, I introduce a
“governor” variable compiled from The Book of the States (Council of State Governments, various years).
Following Ranney’s metric, the governor variable is set equal to one when a Democrat is in office and equal
to zero at other times, so that the effect of changes in leadership can be assessed.
To control for discriminatory sentiment in some specifications, I include a measure of the
proportion of each state’s voters that favored George Wallace in the 1968 presidential election.25 I also
check the robustness of the basic results to the inclusion of state per capita income measures, racial
disparities in income, manufacturing employment, and alternative proxies for discrimination or
“liberalness”.26

18
State-Level Results: Fixed Covariates
Columns 1 to 3 of table 3 report results from Weibull model estimates, and columns 4 to 6 report
Cox model estimates. Hazard ratios greater than 1 indicate that an increase in a particular variable increased
the “risk” of adoption (i.e., scaled up the hazard function); hazard ratios less than 1 imply the opposite.
Specifically, each reported hazard ratio is eb, where b is an element of the estimated β vector, and so each
hazard ratio reflects the increased risk associated with a unit increase in a particular variable (usually, a
percentage point). Some readers might find the Weibull model coefficients in appendix table A1 easier to
interpret; they transform the estimates into an “accelerated failure time” framework in which the coefficients
represent the effect of a unit change in X on the log time of adoption. There is no comparable
transformation for Cox models.
A higher black proportion of the population was associated with a lower likelihood of fair-housing
passage, ceteris paribus. This is consistent with there being stronger resistance to fair housing in states with
relatively large black populations, perhaps because the perceived threat to white neighborhoods was greater.
However, if blacks tended to migrate to states that were less discriminatory, then this correlation could
reflect a lower demand for anti-discrimination legislation in places where discrimination was less prevalent.
Such a scenario is inconsistent with the positive correlation that is evident between the black proportion of
the population and the proportion of voters supporting George Wallace’s 1968 presidential candidacy (in
same non-southern sample, the correlation coefficient is 0.50, p-value of 0.004), at least to the extent that
one is willing to accept support for Wallace as a barometer of discriminatory racial sentiment. Thus, adding
the votes-for-Wallace variable to column 3's specification does not dispel the depressing effect of a larger
black population.
Minorities with higher levels of education might have been more politically engaged, had more
resources to contribute to the Civil Rights Movement, and had more to gain from the opening of new
residential areas. Along these lines, in describing the operations of the anti-discrimination agencies in 1963,
Trends in Housing notes that “the typical complainant” was black and relatively well-educated (Sept.-Oct.
issue, p. 3). Columns 2, 3, 5, and 6 include the average education level for black adults in 1960
(constructed using the IPUMS), and the results are consistent with the hypothesis that, ceteris paribus, a
27 Even with the votes-for-Wallace measure included, it is possible that black education levelsreflect unobserved differences in states’ treatment of their black residents. A “favorable” state couldprovide both more education and more legal protection for blacks. But fully 77 percent of the black adultsin these non-southern states were born (and likely educated) in a different state. It seems more likely that ifthe correlation is spurious, it operates somehow through migrant selection. See Vigdor (2001) on selectionamong black migrants before and after 1940.
28 Excluding New York from the basic hazard regressions of columns 1 (Weibull) and 4 (Cox) intable 3 results in a Jewish coefficient of 12.3 in column 1 and 5.3 in column 4. The CIO variable alsoincreases substantially, to 4.7 in column 1 and 3.0 in column 4. The black population coefficient becomessmaller, 0.2 in column 1 and 0.3 in column 4. All these coefficients are statistically significant (differentfrom 1).
19
more educated nonwhite population increased the likelihood of fair housing’s adoption.27
Even after controlling for average levels of black educational attainment, the NAACP membership
coefficient is significantly larger than 1, implying that, ceteris paribus, non-southern states with larger
NAACP chapters tended to adopt fair-housing legislation sooner than other states. This coefficient is not
intended to measure a narrow “NAACP effect” because it may capture a broader spectrum of black political
engagement. Plus, NAACP membership might not be exogenous to the state’s unobserved level of
discrimination (e.g., a highly discriminatory environment could drive minorities to form political
organizations; or, it could discourage the formation of such organizations through intimidation). But again,
using the votes-for-Wallace variable to proxy for the prevalence of discriminatory attitudes, the NAACP
coefficient remains significantly positive, implying that stronger black political organizations expedited fair-
housing legislation.
States with higher proportions of Jews, Catholics, and relatively liberal Protestant denominations
tended to pass anti-discrimination laws sooner than others, but the Jewish coefficient is more consistently
strong and positive than the others. This finding confirms the historical narrative’s emphasis on the
leadership role played by Jewish organizations in the fair-housing movement. The results are also consistent
with the 1970 NORC survey which consistently identified Jews as being more in favor of anti-discrimination
laws than other whites. New York state had by far the largest proportion of Jews in the sample, more than
three times the proportion in the next highest states (New Jersey, Connecticut, Massachusetts). The
positive estimated influence of the Jewish population variable, however, is not dependent on the New York
observation. In fact, the coefficient is larger in magnitude when New York is excluded from the sample.28
Table 3 suggests that the proportion of whites living in urban areas did not have a substantial
independent influence on the timing of policy change. But states with higher levels of union membership
29 Specifically, the political competition coefficients suggest that the likelihood is maximized near avalue of 40, slightly on the Republican side of the index’s mid-point and close to the sample’s mediancompetition index value.
30 Nevada, Idaho, Ohio, Indiana, Missouri, Kansas, and Michigan were the nonsouthern states withthe highest proportions of votes for Wallace (over 10 percent).
20
tended to pass anti-discrimination legislation sooner than others, ceteris paribus. Unions were very active in
state-level legislative debates on matters of economic policy, and according to the historical literature, a
direct effect on fair-housing legislation is certainly plausible. The positive union effect is not just a reflection
of differences in economic structure across states. In the base columns 1 and 4, adding the manufacturing
proportion of employment, the average level of personal income, or a measure of relative income
(nonwhite/white) to the list of economic variables already in place does not dispel the strong positive union
effect on the likelihood of passage. Likewise, adding dummy variables for the Midwest and West regions
does not diminish the strong positive union membership effects.
The political competition coefficients are neither individually nor jointly statistically significant, but
the nonlinearity does suggest that more competitive party systems were more likely to adopt fair-housing
laws. They do not support the hypothesis that states with a preponderance of elected Democrats were more
likely to enact legislation than other states, ceteris paribus.29 But the results in the next section suggest that
Democratic governors tended to facilitate fair-housing’s passage. As one might expect, more votes for
George Wallace in 1968 were associated with a lower likelihood of fair-housing passage, but again, the
coefficients in columns 3 and 6 are not statistically precise.30
It seems highly unlikely that the results in table 3 are nothing more than a series of spurious
correlations driven by unobserved, independent “liberalness” or “ideology”. First, the historical accounts of
the fair-housing campaigns are consistent with this section’s causal interpretation. Second, adding direct
controls for indices of “liberalness” (or lack thereof), such as the votes-for-Wallace (1968) variable or
similar votes-for-Roosevelt (1932) and votes-for-McGovern (1972) variables do not undercut table 3's
results. Furthermore, as shown below, even when one controls for the timing of the passage of fair-
employment laws, the main empirical results stand.
State-Level Results: Time-Varying Covariates
Table 4 reports results from models in which some of the X characteristics, particularly those

31 This correlation is open to interpretation. For example, it is possible that whites were moreamenable to racial integration in high income states, even after controlling for other state characteristics. Or,it is possible that ceteris paribus, whites in high income states found it easier to insulate themselves fromblack neighbors by residing in expensive neighborhoods. Greeley and Sheatsley (1971) report that, onaverage, higher income whites were more favorably disposed towards racial integration (in a general sense),but not by a wide margin.
21
refelcting current political conditions, are allowed to change over time. The new specifications replace the
political variables of the previous table with three dummy variables: the “governor’s party” variable is set to
1 when a Democrat holds office (0 otherwise); the “neighbor” variable is set to 1 after a contiguous state
adopts a fair-housing law; and the “fair employment law” variable is set to 1 after the state adopts a fair
employment law (if adopted prior to 1964 Civil Rights Act). The black population variable, which reflects
migration flows, is interpolated between census dates.
In many respects, table 4's results complement those of table 3. Non-southern states with fewer
black residents, more Jewish residents, and larger union memberships passed fair-housing laws sooner than
others, ceteris paribus. The FCCCA membership variable, reflecting liberal Protestant denominations, also
seems positively correlated with the likelihood of fair-housing adoption, but less strongly than in the previous
table. The Catholic variable never comes close to achieving statistical significance. Although not statistically
significant, the coefficients indicate that states were more likely to pass fair-housing laws when Democrats
held the governorship. The income per capita variable was added primarily as a control variable to capture
unobserved state characteristics associated with higher levels of economic development. Its addition does
not undermine the main findings from columns 1 and 4, although the CIO point estimate increases
somewhat and the Jewish population point estimate declines somewhat. It does appear that states with
higher levels of income per capita at the beginning of the period were more likely to adopt fair-housing laws,
though the correlation is weaker in table 3.31
Interestingly, there is no evidence of a positive geographic spillover, ceteris paribus. But there is
strong evidence that once states passed fair-employment laws, they were much more likely to pass fair-
housing laws. This kind of legislative spillover within states is not surprising – it reflects both the political
groundwork laid by the fair-employment movements and any omitted state characteristics that tend to make
some states more likely to pursue anti-discrimination policies than others. The more surprising outcome is
that even with this strong control for a state’s inclination to adopt anti-discrimination legislation (or

32Ordinarily in the hazard model context, one would be concerned that the estimates of durationdependence are biased downward because states that are more predisposed to adopting the legislation tendto exit the sample earlier than others (Kiefer 1988).
22
“liberalness” with respect to racial issues), the black, Jewish, and CIO variables remain statistically and
economically significant predictors of fair-housing laws’ passage.
In tables 3 and 4, the Weibull p parameters are much greater than 1, implying that the likelihood of
adoption increased greatly over time.32 The large p coefficients on the p parameter testify to the surge of
strength in the Civil Rights Movement during the 1960s. It is clear that, even allowing for this strong time
trend associated with the broader Civil Rights Movement, the variation in state characteristics mediated the
pattern of legislative diffusion for fair housing.
7. Conclusion
The passage of anti-discrimination legislation that covers private transactions marked a significant
shift in the balance between the freedom to do what one pleases with one’s property and the right to be
treated equitably in the marketplace. Although the economics literature has extensively investigated the
economic impact of this shift, particularly the federal policy shift with respect to labor market discrimination,
it has largely neglected the underlying political economy that produced anti-discrimination legislation. At the
same time, much of the existing theoretical and historical work on the political economy of the Civil Rights
Movement, though insightful, lacks empirical grounding.
The model of political economy outlined in section 3 suggests that whether or not an anti-
discrimination initiative gains support depends critically on the population’s perception of the benefits and
costs associated with supporting the policy, and on the legislature’s responsiveness to the electorate’s
sentiment. The historical narrative, in turn, suggests that each state’s demographic and economic
characteristics influenced the distribution of these perceptions within the population, and that each state’s
political characteristics influenced the government’s role in forestalling or facilitating anti-discrimination
policy. But the magnitude, and sometimes even the direction, of such influences are difficult to discern
from the historical accounts; hence the usefulness of a statistical analysis of the process.
Ultimately, the econometric evidence demonstrates that differences in some fundamental economic
and demographic characteristics played an important role in determining differences in the timing of fair

23
housing’s acceptance across states. Ceteris paribus, outside the South, states with larger union
memberships, more Jewish residents, and more NAACP members passed fair-housing laws sooner than
others. The estimated effects are not undermined by including controls for a wide variety of competing
economic, demographic, political factors. The forces that catalyzed the drive for fair-housing legislation
outside of the South were much weaker in the South, where no laws were passed prior to federal
intervention in 1968. Thus, adding southern states to the sample would simply reinforce the paper’s basic
empirical findings and would underscore how far southern legislatures were from adopting fair-housing
legislation on their own.

24
References
Abrams, Charles. Forbidden Neighbors: A Study of Prejudice in Housing. New York: Harper & Brothers,1955.
Alston, Lee J. and Joseph P. Ferrie. Southern Paternalism and the American Welfare State: Economics,Politics, and Institutions in the South, 1865-1965. Cambridge: Cambridge University Press, 1999.
Ashenfelter, Orley. “Racial Discrimination and Trade Unionism.” Journal of Political Economy 80 (1972):435-464.
Bianchi, Suzanne M., Reynolds Farley, Daphne Spain. “Racial Inequalities in Housing: An Examination ofRecent Trends.” Demography 19, 1 (1982): 37-51.
Burstein, Paul, Shawn Bauldry, and Paul Froese. “Public Opinion and Congressional Support for PolicyChange.” Working paper, University of Washington, 2001.
Chong, Dennis. Collective Action and the Civil Rights Movement. Chicago: University of Chicago Press,1991.
Cohany, Harry P. “Membership of American Trade Unions, 1960.” Monthly Labor Review (December1961): 1299-1308.
Collins, William J. “The Housing Market Impact of State-Level Anti-Discrimination Laws, 1960-1970.”NBER Working Paper 9562 (2003a).
Collins, William J. “The Political Economy of State-Level Fair Employment Laws, 1940-1964.” Explorations in Economic History 40, 1 (2003b): 24-51.
Council of State Governments. The Book of the States. Lexington, KY: various years.
Dalfiume, Richard M. Desegregation of the U.S. Armed Forces: Fighting on Two Fronts, 1939-1953. Columbia, MO: University of Missouri Press, 1969.
Denton, Nancy A. “Half Empty or Half Full: Segregation and Segregated Neighborhoods 30 Years Afterthe Fair Housing Act.” Cityscape 4, 3 (1999): 107- 122.
Dinnerstein, Leonard. Antisemitism in America. New York: Oxford University Press, 1994.
Eldridge, Hope T. and Dorothy Swaine Thomas. Population Redistribution and Economic Growth, UnitedState, 1870-1950: Demographic Analyses and Interrelations. Philadelphia: American PhilosophicalSociety, 1964.
Eley, Lynn W. and Thomas W. Casstevens (eds.). The Politics of Fair-Housing Legislation: State andLocal Case Studies. San Francisco: Chandler Publishing Company, 1968.
Fowler, Robert Booth. Religion and Politics in America. Metuchen, N.J.: Scarecrow Press, 1985.
Gill, Flora. Economics and the Black Exodus. New York: Garland Publishing, 1979.
Goering, John M. (ed.) Housing Desegregation and Federal Policy. Chapel Hill, NC: University of North

25
Carolina Press, 1986.
Gray, Gibson Hendrix. The Lobbying Game: A Study of the 1953 Campaign of the State Council for aPennsylvania Fair Employment Practice Commission. Tyler, TX: published by author, 1970.
Greeley, Andrew M. The American Catholic: A Social Portrait. New York: Basic Books, 1977.
Greeley, Andrew M. and Paul B. Sheatsley. “Attitudes toward Racial Integration.” Scientific American225, 6 (December 1971).
Heckman, James J. “Simultaneous Equation Models with Continuous and Discrete Endogenous Variablesand Structural Shifts.” In Studies in Non-Linear Estimation, edited by S.M. Goldfeld and R.E.Quandt, 235-272. Cambridge: Ballinger, 1976.
Housing and Home Finance Agency. Fair Housing Laws: Summaries and Text of State and MunicipalLaws. Washington, D.C.: GPO 1964.
Keech, William R. The Impact of Negro Voting: The Role of the Vote in the Quest for Equality. Chicago:Rand McNally & Company, 1968.
Laurenti, Luigi M. Property Values and Race: Studies in Seven Cities. Berkeley, CA: University ofCalifornia Press, 1960.
Leigh, Wilhelmina A. “The Social Preference for Fair Housing: During the Civil Rights Movement andSince.” American Economic Review, AEA Papers and Proceedings 78, 2 (1988): 156-162.
Leigh, Wilhelmina A. “Civil Rights Legislation and the Housing Status of Black Americans: An Overview.” Review of Black Political Economy (1991): 5-28.
Lockard, Duane. Toward Equal Opportunity: A Study of State and Local Antidiscrimination Laws. NewYork: Macmillan Company, 1968.
Marks, Carole. Farewell – We’re Good and Gone: The Great Black Migration. Bloomington, IN: IndianaUniversity Press, 1989.
McGreevy, John T. Parish Boundaries: The Catholic Encounter with Race in the Twentieth-Century UrbanNorth. Chicago: University of Chicago Press, 1996.
Meyer, Stephan Grant. As Long As They Don’t Move Next Door: Segregation and Racial Conflict inAmerican Neighborhoods. New York: Rowman & Littlefield Publishers, 2000.
Moreno, Paul D. From Direct Action to Affirmative Action: Fair Employment Law and Policy in America,1933 - 1972. Baton Rouge, LA: Louisiana State University Press, 1997.
Myrdal, Gunnar. An American Dilemma: The Negro Problem and Modern Democracy. New York: Harper& Row, 1962 (originally 1944).
National Association for the Advancement of Colored People. Annual Report, 1951. New York, NAACP,1952.
National Council of the Churches of Christ in the United States of America. Churches and Church
26
Membership in the United States. New York: 1956.
National Committee Against Discrimination in Housing. Trends in Housing. New York: NCDH, variousissues.
National Committee Against Discrimination in Housing. The Fair Housing Statutes and Ordinances, as ofJune 1, 1966. New York: NCDH, 1966.
Oberschall, Anthony. “Loosely Structured Collective Conflict: A Theory and an Application.” Research inSocial Movements, Conflicts, and Change 3 (1980): 45-68.
Oliver, Pamela E. “Formal Models of Collective Action.” Annual Review of Sociology 19 (1993): 271-300.
Olzak, Susan. “Analysis of Events in the Study of Collective Action.” Annual Review of Sociology 15(1989): 119-141.
Ranney, Austin. “Parties in State Politics.” In Politics in the American States: A Comparative Analysis,edited by Herbert Jacob and Kenneth N. Vines, 61-99. Boston: Little, Brown and Company, 1965.
Reed, Merl E. Seedtime for the Modern Civil Rights Movement: The President’s Committee on FairEmployment Practice, 1941-1946. Baton Rouge, LA: Louisiana State University Press, 1991.
Robison, Joseph B. “Fair Housing Legislation in the City and State of New York.” In The Politics of FairHousing Legislation: State and Local Case Studies, edited by Lynn W. Eley and Thomas W.Casstevens. San Francisco, CA: Chandler Publishing Company, 1968.
Rosen, Sumner M. “The CIO Era, 1935-1955.” In Black Workers and Organized Labor, edited by John H.Bracey, Jr., August Meier, and Elliott Rudwick. Belmont, CA: Wadsworth Publishing Co., 1971.
Ruggles, Steven and Matthew Sobek. Integrated Public Use Microdata Series. Minneapolis: HistoricalCensus Projects, University of Minnesota, 1997.
Stigler, George. “The Sources of Economic Legislation – 1: Fair Employment Legislation.” Manuscript,1973.
Sugrue, Thomas J. The Origins of the Urban Crisis: Race and Inequality in Postwar Detroit. Princton, NJ:Princeton University Press, 1996.
Troy, Leo. “Distribution of Union Membership among the States, 1939 and 1953.” NBER OccasionalPaper 56 (1957).
U.S. Commission on Civil Rights. Understanding Fair Housing. Washington, D.C.: Government PrintingOffice, 1973.
Vigdor, Jacob L. “The Pursuit if Opportunity: Explaining Selective Black Migration.” Journal of UrbanEconomics 51 (2002): 391-417.
Walker, Jack L. “Fair Housing in Michigan.” In The Politics of Fair Housing Legislation: State and LocalCase Studies, edited by Lynn W. Eley and Thomas W. Casstevens. San Francisco, CA: ChandlerPublishing Company, 1968.
27
World Almanac and Book of Facts. New York: Doubleday, 1970.
Wright, Gavin. “The Civil Rights Revolution as Economic History.” Journal of Economic History 59(1999): 267-289.
Yinger, John. “Sustaining the Fair Housing Act.” Cityscape 4, 3 (1999): 93-106.
Zangrando, Robert L. The NAACP Crusade Against Lynching, 1909-1950. Philadelphia, PA: TempleUniversity Press, 1980.
28
Table 1: State-Level Fair-Housing Laws, Prior to 1968
Not Including Owner-Occupied Housing
Not Including Owner-Occupied Housing,
But Including All RealEstate Broker Activities
Including Owner-OccupiedHousing
Alaska 1962California 1963Colorado 1959 1965Connecticut 1959 1963Hawaii 1967Indiana 1965Iowa 1967Kentucky 1968Maine 1965 (rental only)Maryland 1967 (new only)Massachusetts 1959 1963Michigan 1964Minnesota 1962 1967New Hampshire 1961 (rental only) 1965New Jersey 1961 1966New York 1961 1963Ohio 1965Oregon 1959Pennsylvania 1961Rhode Island 1965Vermont 1967Washington 1967 (pending referendum) Wisconsin 1965
Notes: The Indiana law allowed only conciliation efforts for complaints against owners in owner-occupiedhousing but had stronger enforcement provisions for other housing market participants. California’s lawwas suspended in 1964 by a constitutional amendment; it was reinstated in 1966 when the state supremecourt ruled that the amendment was unconstitutional. Sources: The fair housing laws’ effective dates of implementation and extent of coverage are taken from abi-monthly publication of the National Committee Against Discrimination in Housing (a amalgamation ofmany independent organizations) called Trends in Housing, supplemented with information from theHousing and Home Finance Agency’s Fair Housing Laws (1964), issues of the Race Relations LawReporter, and Lockard (1968). Case studies in Eley and Casstevens (1968) have also been helpful.
Check original write up on RI. Appears to cover all sales in 1965.

29
Table 2: Summary Statistics for Non-Southern States
Fair-Housing States Non-Fair-Housing States All States
Economic Variables White Urban 65.20
(12.89)54.21
(11.62)60.39
(13.36) CIO 3.73
(2.44)1.00
(0.89)2.54
(2.34) AFL 7.36
(2.85)5.87
(3.33)6.70
(3.11) Income per capita (100's) 23.24
(2.67)20.89(3.21)
22.21(3.10)
Black Education 9.33(0.64)
9.40(1.10)
9.36(0.86)
Race/Religion Variables Black 3.61
(3.03)2.43
(2.97)3.09
(3.02) Jewish 2.82
(3.93)0.75
(1.13)1.91
(3.18) Catholic 26.77
(13.35)19.19
(10.00)23.46
(12.42) FCCCA 9.31
(3.49)9.63
(4.93)9.45
(4.11)Political Variables Political Competition 38.96
(11.44)42.61
(18.06)40.56
(14.56) NAACP per 10,000 Pop. 4.49
(3.90)1.46
(3.40)3.17
(3.94) Wallace Votes 6.77
(2.61)8.30
(3.11)7.44
(2.90)States 18 14 32
Notes: Standard deviations are reported in parentheses underneath unweighted sample averages.Sources: The black proportion and average years of education of the adult (over 20 years old) populationare calculated using the IPUMS sample for 1960 (Ruggles and Sobek 1997). The Jewish, Catholic, andFCCCA memberships (in 1952) are calculated from the Survey of Churches and Church Membership,divided by the population figures from Eldridge and Thomas (1964). The urban variable is from thepublished volumes of the 1960 Census of Population. The segregation variable is a weighted average ofmetro area indices calculated by Cutler, Glaeser, and Vigdor (1999). The CIO and AFL variables arecalculated with membership data from Troy (1957) and population data from Eldridge and Thomas (1964). The political competition index is from Ranney (1965). The NAACP membership data are from theorganization’s 1951 Annual Report. The Wallace Votes variable is calculated with data from the WorldAlmanac and Book of Facts (1970).
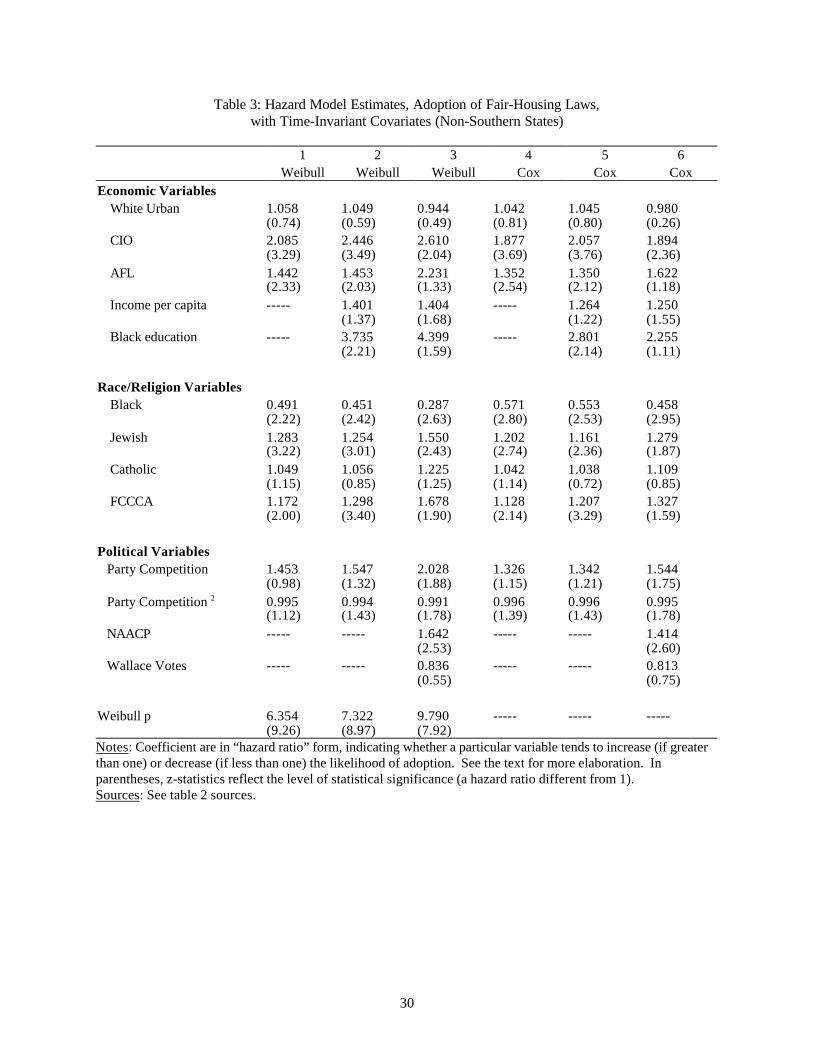
30
Table 3: Hazard Model Estimates, Adoption of Fair-Housing Laws,with Time-Invariant Covariates (Non-Southern States)
1 2 3 4 5 6Weibull Weibull Weibull Cox Cox Cox
Economic Variables White Urban 1.058
(0.74)1.049(0.59)
0.944(0.49)
1.042(0.81)
1.045(0.80)
0.980(0.26)
CIO 2.085(3.29)
2.446(3.49)
2.610(2.04)
1.877(3.69)
2.057(3.76)
1.894(2.36)
AFL 1.442(2.33)
1.453(2.03)
2.231(1.33)
1.352(2.54)
1.350(2.12)
1.622(1.18)
Income per capita ----- 1.401(1.37)
1.404(1.68)
----- 1.264(1.22)
1.250(1.55)
Black education ----- 3.735(2.21)
4.399(1.59)
----- 2.801(2.14)
2.255(1.11)
Race/Religion Variables Black 0.491
(2.22)0.451(2.42)
0.287(2.63)
0.571(2.80)
0.553(2.53)
0.458(2.95)
Jewish 1.283(3.22)
1.254(3.01)
1.550(2.43)
1.202(2.74)
1.161(2.36)
1.279(1.87)
Catholic 1.049(1.15)
1.056(0.85)
1.225(1.25)
1.042(1.14)
1.038(0.72)
1.109(0.85)
FCCCA 1.172(2.00)
1.298(3.40)
1.678(1.90)
1.128(2.14)
1.207(3.29)
1.327(1.59)
Political Variables Party Competition 1.453
(0.98)1.547(1.32)
2.028(1.88)
1.326(1.15)
1.342(1.21)
1.544(1.75)
Party Competition 2 0.995(1.12)
0.994(1.43)
0.991(1.78)
0.996(1.39)
0.996(1.43)
0.995(1.78)
NAACP ----- ----- 1.642(2.53)
----- ----- 1.414(2.60)
Wallace Votes ----- ----- 0.836(0.55)
----- ----- 0.813(0.75)
Weibull p 6.354(9.26)
7.322(8.97)
9.790(7.92)
----- ----- -----
Notes: Coefficient are in “hazard ratio” form, indicating whether a particular variable tends to increase (if greaterthan one) or decrease (if less than one) the likelihood of adoption. See the text for more elaboration. Inparentheses, z-statistics reflect the level of statistical significance (a hazard ratio different from 1). Sources: See table 2 sources.

31
Table 4: Hazard Model Estimates, Adoption of Fair-Housing Laws,with Time-Varying Covariates (Non-Southern States)
1 2 3 4 5 6Weibull Weibull Weibull Cox Cox Cox
Economic Variables White Urban 1.014
(0.43)1.057(0.71)
1.031(0.75)
1.013(0.44)
1.042(0.84)
1.026(0.77)
CIO 1.975(4.90)
2.425(3.53)
1.922(3.08)
1.795(4.35)
2.006(4.30)
1.690(3.44)
AFL 1.281(3.23)
1.206(1.82)
0.848(1.15)
1.237(2.97)
1.170(1.69)
0.880(0.97)
Income per capita ----- 1.752(1.87)
1.490(2.01)
----- 1.490(2.01)
1.639(2.81)
Black education ----- 5.257(1.22)
3.318(1.91)
----- 3.640(1.43)
2.718(1.82)
Race/Religion Variables Black* 0.609
(3.52)0.511(2.90)
0.410(3.94)
0.663(3.20)
0.616(3.08)
0.539(4.30)
Jewish 1.350(4.20)
1.218(2.76)
1.364(2.95)
1.265(3.91)
1.143(2.22)
1.203(2.74)
Catholic 1.013(0.44)
0.991(0.15)
0.968(0.84)
1.010(0.37)
0.994(0.14)
0.967(0.97)
FCCCA 1.098(2.09)
1.251(1.88)
1.064(0.81)
1.076(1.59)
1.177(1.93)
1.060(0.85)
Political Variables Governor Party* 1.629
(1.03)1.325(0.67)
1.846(1.12)
1.493(0.81)
1.105(0.24)
1.351(0.66)
Neighbor* ----- ----- 0.172(2.05)
----- ----- 0.410(1.49)
Fair Emp. Law* ----- ----- 27.141(3.03)
----- ----- 13.654(3.08)
Weibull p 6.277(7.75)
7.300(8.81)
12.151(9.19
----- ----- -----
Notes: Variables marked with an asterisk (*) are entered in time-varying form. The black proportion of thepopulation is interpolated between census dates. The governor’s party variable switches from zero to onewhen a Democrat holds office. The “neighbor” variable switches from zero to one after a contiguous stateadopts a fair-housing law. The “fair employment law” variable switches from zero to one after the stateadopts a fair employment law.Sources: See table 2 sources.

32
Table A1: Accelerated Failure Time Model, with Time Invariant Covariates (Non-Southern States)
1: Weibull 2: Weibull 3: Weibull
Economic Variables White Urban -0.00891
(0.75)-0.00649(0.60)
0.00589(0.49)
CIO -0.116(3.32)
-0.122(4.10)
-0.0980(3.00)
AFL -0.0576(2.39)
-0.0510(2.05)
-0.0820(1.55)
Income per capita ----- -0.0461(1.51)
-0.0346(1.81)
Black education ----- -0.180(2.21)
-0.151(1.74)
Race/Religion Variables Black 0.112
(2.24)0.109(2.75)
0.127(4.11)
Jewish -0.0392(3.35)
-0.0309(3.19)
-0.0448(3.26)
Catholic -0.00753(1.18)
-0.00743(0.87)
-0.0207(1.42)
FCCCA -0.0250(2.02)
-0.0356(3.68)
-0.0528(2.55)
Political Variables Party Competition -0.0588
(1.00)-0.0596(1.44)
-0.0722(2.50)
Party Competition 2 0.000803(1.15)
0.000762(1.58)
0.000884(2.35)
NAACP ----- ----- -0.0507(2.78)
Wallace Votes ----- ----- 0.0183(0.56)
Constant 5.241(3.08)
7.971(5.71)
7.613(9.77)
Weibull p 6.354(9.26)
7.322(8.97)
9.790(7.92)
Notes: These results are restatements of those in columns 1 to 3 of table 3. The accelerated failure time(AFT) model can be written ln tj = Xjb + uj, where t is time of adoption and X is a set of characteristics. The b parameters in the AFT framework (in table A1) are equal to -b/p from the Weibull proportionalhazard framework (in table 3). There is no analogous AFT framework for Cox models.Sources: See table 2 sources.