Verwer Training and Consultancy...
11
Verwer Training and Consultancy Ltd Professional Training and Consultancy for the Automation and Control Industry ProfiTrace OPC exercise.doc 1 A. A. Verwer Copyright © Verwer Training & Consultancy Ltd, 2011 January 2011 Practical Exercise – ProfiTrace OPC server setup 1. Objective The aim of this practical exercise is to show how the ProfiTrace OPC server is set up and used within a commercial SCADA package. It is assumed that the reader has a basic familiarity with ProfiTrace. 2. Warning and Disclaimer This exercise is designed to be carried out on a demonstration network where the devices are not controlling a real plant. Some of the exercises suggest that you create faults on the network. These faults should not be created on any real working plant or machine. Such faults can cause loss of production and even dangerous situations to arise. Neither Verwer Training and Consultancy Ltd nor any of its employees, contractors or partners shall be liable for any direct, indirect, special, incidental or consequential damages arising out of the use or inability to use the information contained in this document or other training materials used. 3. Equipment Laptop running ProfiTrace (V2.5.1 or later), ProfiCore unit with leads, tap connector and a valid licence for the OPC server. E+H’s P-View SCADA package (note that a P-View licence is not required for this exercise). You will also need access to an operational PROFIBUS network with a running master (PLC) with piggy-back connector and at least one active DP device and at least one active PA instrument. 4. Getting Started Connect your ProfiCore unit to your laptop via the USB cable and attach the tap-connector. Ensure that the termination switch on the tap connector is on the “off” position and then plug in to the piggy back connector on your PROFIBUS master. Start the ProfiTrace software on your laptop and initialise the ProfiCore. You should see ProfiTrace auto-detect the network bit rate and after a short delay you should see a live list showing the devices that are active on the network. 5. Station statistics ProfiTrace monitors a number of useful statistics that provide network performance and health checks. Find the “Station statistics” tab within ProfiTrace and then select “Syncs” from the drop down list (Figure 1).
Transcript of Verwer Training and Consultancy...

Verwer Training and Consultancy Ltd Professional Training and Consultancy for the Automation and Control Industry
ProfiTrace OPC exercise.doc 1 A. A. Verwer
Copyright © Verwer Training & Consultancy Ltd, 2011 January 2011
Practical Exercise – ProfiTrace OPC server setup
1. Objective
The aim of this practical exercise is to show how the ProfiTrace OPC server is set up and used
within a commercial SCADA package. It is assumed that the reader has a basic familiarity
with ProfiTrace.
2. Warning and Disclaimer
This exercise is designed to be carried out on a demonstration network where the devices are
not controlling a real plant. Some of the exercises suggest that you create faults on the
network. These faults should not be created on any real working plant or machine. Such faults
can cause loss of production and even dangerous situations to arise.
Neither Verwer Training and Consultancy Ltd nor any of its employees, contractors or
partners shall be liable for any direct, indirect, special, incidental or consequential damages
arising out of the use or inability to use the information contained in this document or other
training materials used.
3. Equipment
Laptop running ProfiTrace (V2.5.1 or later), ProfiCore unit with leads, tap connector and a
valid licence for the OPC server. E+H’s P-View SCADA package (note that a P-View licence
is not required for this exercise). You will also need access to an operational PROFIBUS
network with a running master (PLC) with piggy-back connector and at least one active DP
device and at least one active PA instrument.
4. Getting Started
Connect your ProfiCore unit to your laptop via the USB cable and attach the tap-connector.
Ensure that the termination switch on the tap connector is on the “off” position and then plug
in to the piggy back connector on your PROFIBUS master.
Start the ProfiTrace software on your laptop and initialise the ProfiCore. You should see
ProfiTrace auto-detect the network bit rate and after a short delay you should see a live list
showing the devices that are active on the network.
5. Station statistics
ProfiTrace monitors a number of useful statistics that provide network performance and
health checks. Find the “Station statistics” tab within ProfiTrace and then select “Syncs” from
the drop down list (Figure 1).

Verwer Training and Consultancy Ltd Professional Training and Consultancy for the Automation and Control Industry
ProfiTrace OPC exercise.doc 2 A. A. Verwer
Copyright © Verwer Training & Consultancy Ltd, 2011 January 2011
Figure 1 – ProfiTrace statistics
The most important statistics for health checking a PROFIBUS network are:
• Syncs – showing when a slave has lost communication and the master tries to restart it.
• Retrys – showing when a master retries a request after a slave fails to respond.
• Retries (worst sequence) – shows repeated retries up to the maximum retry limit (an
option set in the master).
• Station lost – number of times a slave looses communication.
• Illegal responses to requests – number of corrupted responses (perhaps caused by
interference, reflections, duplicate addresses etc.).
• Diagnostic message from slave whilst in data exchange – shows possible
communication problems or peripheral errors (sensor, actuator or IO errors).
Have a look at these important statistics for your network. Hopefully all should be OK.
If you are working on a demonstration rig, rather than a real plant, you can generate some
errors. However please do not try the following in a real working system as generating faults
on a network can cause machines and processes to fail with corresponding loss of production.
Disconnect a DP slave from the network by pulling the PROFIBUS plug from the device.
Notice the bus fault (BF) on the device has gone red. After a few seconds replace the device
and make sure that the bus fault on the device has gone green again showing that the device is
back in communication with the master. Now re-examine the ProfiTrace statistics and you
should see the consequences of the missing station.
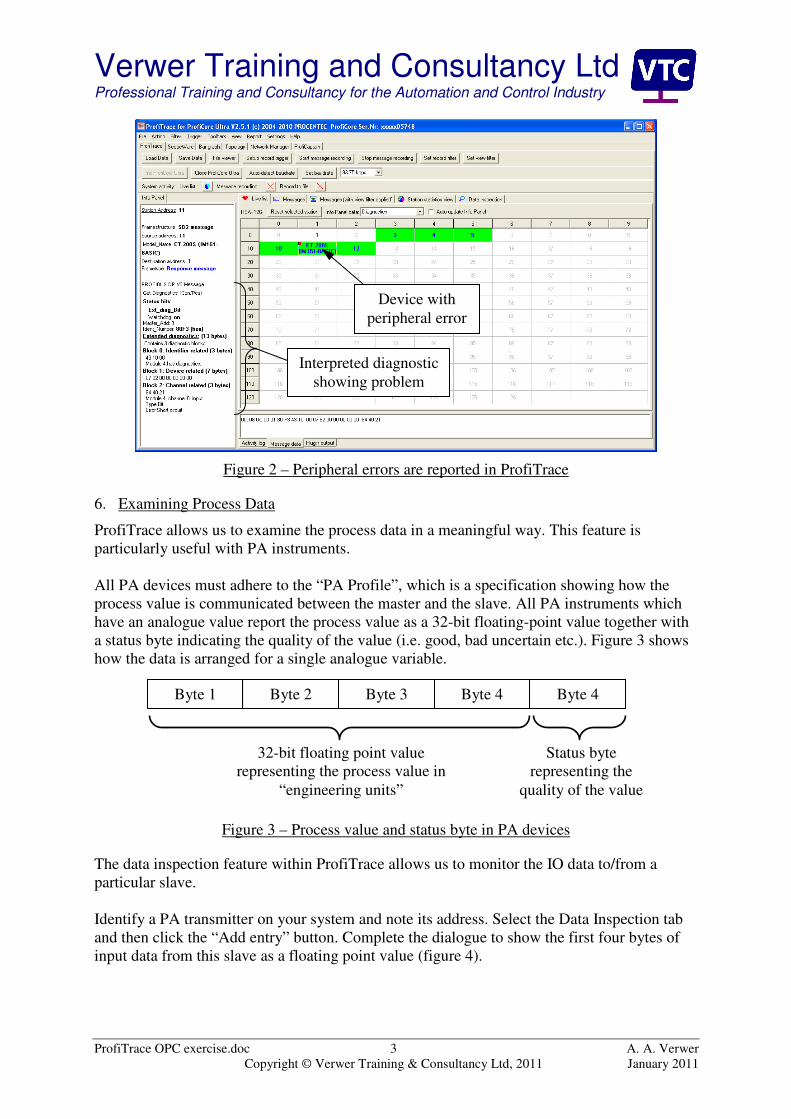
Some devices on VTC training racks have “Fault” switches which generate peripheral faults
when turned on. See if you can generate a peripheral fault now and examine the “Diagnostics
from slave whilst in data exchange” statistic. You can also go back to the live list and see how
the missing device and peripheral error are shown there. A single click on the faulty device in
the live list will show the device diagnostics in the ProfiTrace info panel panel (figure 2).
ProfiTrace Statistics tab
Drop down selector
Verwer Training and Consultancy Ltd Professional Training and Consultancy for the Automation and Control Industry
ProfiTrace OPC exercise.doc 3 A. A. Verwer
Copyright © Verwer Training & Consultancy Ltd, 2011 January 2011
Figure 2 – Peripheral errors are reported in ProfiTrace
6. Examining Process Data
ProfiTrace allows us to examine the process data in a meaningful way. This feature is
particularly useful with PA instruments.
All PA devices must adhere to the “PA Profile”, which is a specification showing how the
process value is communicated between the master and the slave. All PA instruments which
have an analogue value report the process value as a 32-bit floating-point value together with
a status byte indicating the quality of the value (i.e. good, bad uncertain etc.). Figure 3 shows
how the data is arranged for a single analogue variable.
Figure 3 – Process value and status byte in PA devices
The data inspection feature within ProfiTrace allows us to monitor the IO data to/from a
particular slave.
Identify a PA transmitter on your system and note its address. Select the Data Inspection tab
and then click the “Add entry” button. Complete the dialogue to show the first four bytes of
input data from this slave as a floating point value (figure 4).
32-bit floating point value
representing the process value in
“engineering units”
Status byte
representing the
quality of the value
Byte 1 Byte 2 Byte 3 Byte 4 Byte 4
Device with
peripheral error
Interpreted diagnostic
showing problem

Verwer Training and Consultancy Ltd Professional Training and Consultancy for the Automation and Control Industry
ProfiTrace OPC exercise.doc 4 A. A. Verwer
Copyright © Verwer Training & Consultancy Ltd, 2011 January 2011
Figure 4 – Data inspection for a PA instrument
After adding the process value, you can add the status byte. Click “Add entry” once again and
enter the same address as before, but this time make the “Offset” 4 and the “DataType” as
Unsigned8 (i.e. a byte) as shown in figure 5.
Figure 5 – Adding the status byte to the Data Inspector
Data inspection tab
Add entry PROFIBUS address

Verwer Training and Consultancy Ltd Professional Training and Consultancy for the Automation and Control Industry
ProfiTrace OPC exercise.doc 5 A. A. Verwer
Copyright © Verwer Training & Consultancy Ltd, 2011 January 2011
You should now see the process value and status shown in the Data Inspection window
(figure 6). A status value of 128 (hexadecimal 80) or above indicates that the measurement is
good.
Figure 6 – Data inspection window showing process value and status
7. The ProfiTrace OPC Server
We are now ready to explore the ProfiTrace OPC Server. From the ProfiTrace “Settings”
menu select “Setup OPC Tag Settings”. This should bring up the dialogue shown in figure 7.
You will see that the tags are divided into “User defined” and “System” tags. The System tags
are predefined and allow access to many of the standard values that are available within
ProfiTrace. In particular, all the ProfiTrace statistics are available for each slave on the
network. You can expand each group by clicking on the “+” sign to see the sub categories.
Figure 7 – OPC Server Tags dialogue
8. User-defined tags
User defined tags are used to inspect the process data that is passing between the master and
each slave, that is the same data that is available from the Data Inspection window within
ProfiTrace. We will now add a tag to look at the input data from the PA instrument.
Click the “Add Tag” button to bring up the “Edit OPC Tag” dialogue. The tag name can be
anything you wish, but it is best to use a name that describes what the data is (in this case
Slave 3 process value). The data type should a “Float” and the offset zero which means that
we start at the first byte (figure 8). Click OK when done.
Expand the
“Statistic” group
Add Tag button

Verwer Training and Consultancy Ltd Professional Training and Consultancy for the Automation and Control Industry
ProfiTrace OPC exercise.doc 6 A. A. Verwer
Copyright © Verwer Training & Consultancy Ltd, 2011 January 2011
Figure 8 – Adding a User defined tag for a PA instrument process value at address #3
You can then add a second tag, named perhaps “Slave_3_Status”, to show the device Status
byte as an “Unsigned8” (byte). Here you should remember to use an offset of 4 because the
status byte is the fifth byte in the telegram.
Other tags can of course be added, but that will be enough to show the principle for now. You
will need to save your tag database before proceeding so that you can pick it up again later.
Click the “Save Tag Data” button and enter a suitable name for the file.
Tag File Name: ____________________________________
9. Setting up the ProfiTrace OPC server
From the Settings menu select “Setup OPC Server(s)”. In the resulting dialogue you can see
any servers that are already set up. If this is the first time you have used this feature there will
be none set up of course. Click the “Add” button to add a new sever.
Figure 9 – OPC Server configuration screen
Verwer Training and Consultancy Ltd Professional Training and Consultancy for the Automation and Control Industry
ProfiTrace OPC exercise.doc 7 A. A. Verwer
Copyright © Verwer Training & Consultancy Ltd, 2011 January 2011
The default settings should do nicely for our exercise, but remember we have some User
defined tags saved in a Tag file. Set the Tag Selection to “Tag file (*.pto)” and click the
button, , which should open a file load dialoge where, with luck, you will see your saved
file. Click on the file and then “OK”. Your OPC Server configuration dialogue should look
something like figure 9. Make sure that you click “Accept” and then Close the dialogue.
Finally close down and exit from ProfiTrace, but please leave the ProfiCore unit plugged into
the network. Now we will look at how the data can be accessed from an OPC client.
10. The E+H P-View SCADA package
P-View is a full-fetured SCADA (Supervisory Control And Data Acquisition) package from
Enderess+Hauser. Here we will use a simple tool, “OPC DataSpy”, which is supplied as part
of the package. OPC DataSpy is an OPC client that allows us to monitor the OPC tags on any
OPC Server.
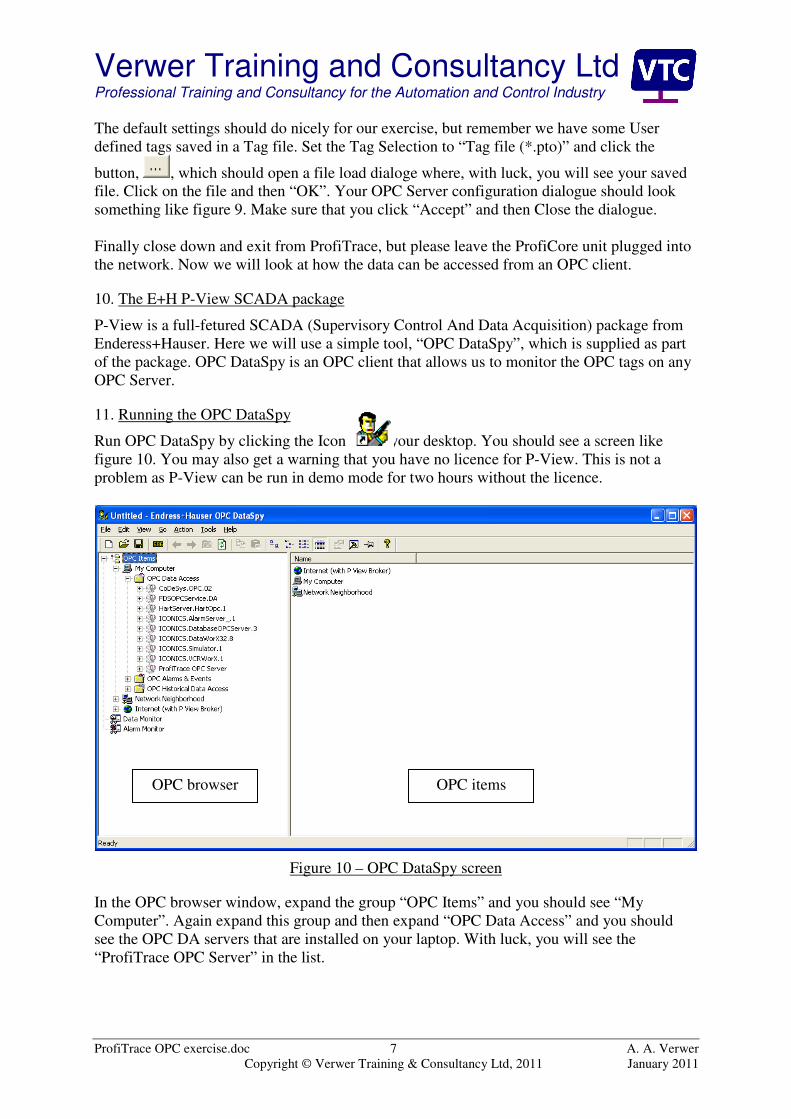
11. Running the OPC DataSpy
Run OPC DataSpy by clicking the Icon on your desktop. You should see a screen like
figure 10. You may also get a warning that you have no licence for P-View. This is not a
problem as P-View can be run in demo mode for two hours without the licence.
Figure 10 – OPC DataSpy screen
In the OPC browser window, expand the group “OPC Items” and you should see “My
Computer”. Again expand this group and then expand “OPC Data Access” and you should
see the OPC DA servers that are installed on your laptop. With luck, you will see the
“ProfiTrace OPC Server” in the list.
OPC browser OPC items

Verwer Training and Consultancy Ltd Professional Training and Consultancy for the Automation and Control Industry
ProfiTrace OPC exercise.doc 8 A. A. Verwer
Copyright © Verwer Training & Consultancy Ltd, 2011 January 2011
Click the ProfiTrace OPC Server item and several things should happen:
• Firstly, ProfiTrace will automatically run, the ProfiCore will be initialised and the
network bit rate should be auto detected.
• Secondly, the specified tag file will be automatically loaded making the user defined
tags available from the OPC Server.
• Finally, in the OPC DataSpy you will see the OPC server tags appear in the OPC
Items window.
You can minimise the ProfiTrace screen, but please do not close it.
In the OPC DataSpy browser window you will see a “Data Monitor” item. Click this now, but
you will see that we are not monitoring any of the items yet. Right click over the “Data
Monitor” item and select “Add P-View broker item…” from the popup menu (alternatively
just click the button on the toolbar). You will see the Unified Data Browser dialogue
(figure 11).
Figure 11 – Unified Data Browser
Select one of the user defined tags and click “OK”. This adds the selected tag to the Data
Monitor. The data monitor now shows the live value of the tag. Add the second user defined
tag to the data monitor and make sure that the displayed values are correct.
You can add any of the System tags from the ProfiTrace OPC Server so that you can check
the ProfiTrace statistics remotely. However, The DataSpy is not the best way to see your tags.
We will now see how to incorporate the tags into a SCADA screen. Close the OPC DataSpy
before proceeding.
12. A simple P-View Graph screen
P-View Graph is part of a comprehensive SCADA package that can be used to generate and
run animated and interactive screens representing plant operation. P-View Graph is an OPC
client which can easily exchange data with our OPC server.

Verwer Training and Consultancy Ltd Professional Training and Consultancy for the Automation and Control Industry
ProfiTrace OPC exercise.doc 9 A. A. Verwer
Copyright © Verwer Training & Consultancy Ltd, 2011 January 2011
Here we will generate a simple screen to monitor the PA instrument on our PROFIBUS
network.
Run the P-View Graph application, , and from the “File” menu, select “New”. Select the
Process point animation tool and click the blank canvas to place the object on the screen
(figure 12). As you release the button a “Property Inspector” dialogue will pop up allowing
the object properties to be changed. The dialogue has two tabs: The “Text” tab on the
Property inspector allows you to format the Text object and the “PPT/DE” tab (Process
PoinT/Data Entry) allows you to set up the animation.
Figure 12 – P-View editor screen
Select the PPT/DE tab and click the “Data Tags…” button. This opens up the OPC Unified
Data Browser that we used in the OPC DataSpy (figure 11). You may need to click the
“refresh” button and explore the items to see your user defined tags. Select the tag for the
process variable value for the PA instrument and click OK.
Next select the “Text” tab in the Property Inspector. Set the “Fill colour” as white (make sure
you tick the “Fill Colour” item) and the “3D Edge” as “Sunken” (figure 13). Click OK to
close the Property Inspector and you should see the object appearance alter in line with your
changes.
Click the Runtime item on the main menu – you should see the monitored value displayed.
That’s all there is to it, couldn’t be easier, could it?
Exit the Runtime mode by clicking the “Configure” main menu item.
Process point
tool
Place process
point object here
Verwer Training and Consultancy Ltd Professional Training and Consultancy for the Automation and Control Industry
ProfiTrace OPC exercise.doc 10 A. A. Verwer
Copyright © Verwer Training & Consultancy Ltd, 2011 January 2011
Figure 13 - Property Inspector dialogue showing Text tab
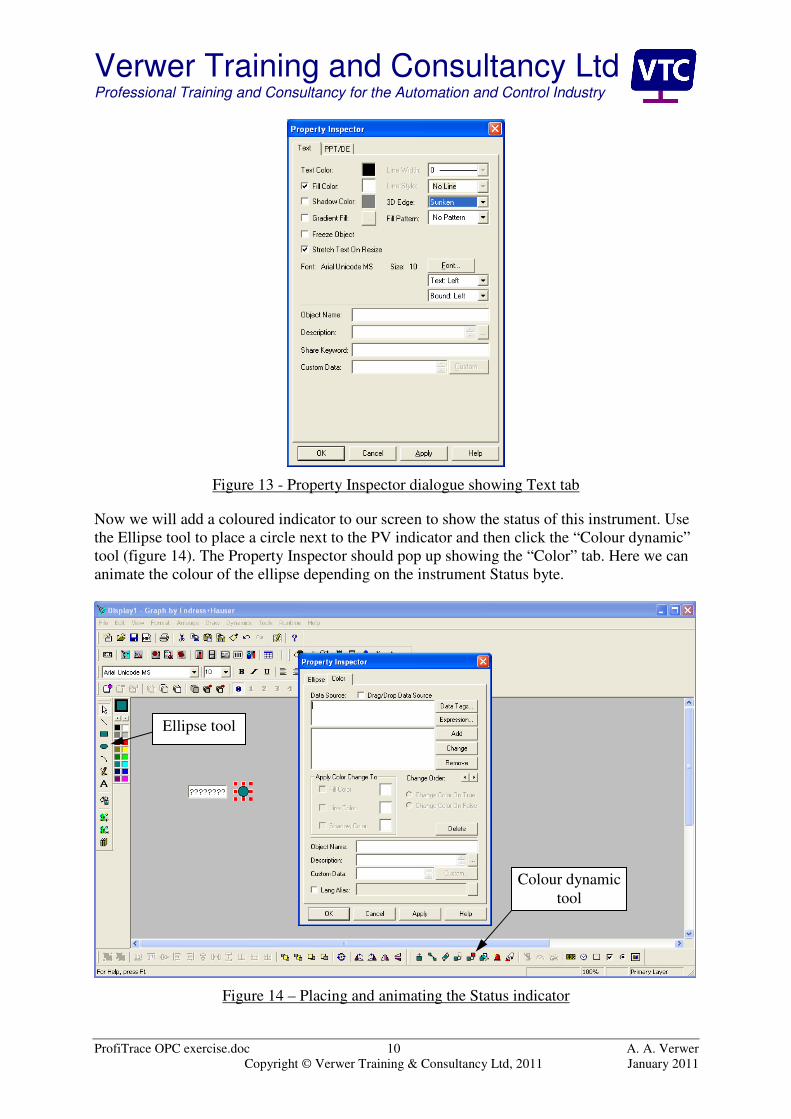
Now we will add a coloured indicator to our screen to show the status of this instrument. Use
the Ellipse tool to place a circle next to the PV indicator and then click the “Colour dynamic”
tool (figure 14). The Property Inspector should pop up showing the “Color” tab. Here we can
animate the colour of the ellipse depending on the instrument Status byte.
Figure 14 – Placing and animating the Status indicator
Ellipse tool
Colour dynamic
tool

Verwer Training and Consultancy Ltd Professional Training and Consultancy for the Automation and Control Industry
ProfiTrace OPC exercise.doc 11 A. A. Verwer
Copyright © Verwer Training & Consultancy Ltd, 2011 January 2011
Click the button “Expression” and then in the Edit Expression dialogue click “Tags”. An
option will appear “Unified Browser…”, which you should select. (figure 15).
Figure 15 – Edit Expression dialogue
Ftom the Unified Browser, find and select the tag for the instrument Status. We need to
compare this to 128, the minimum “Good” status value. Click the “Relational” button and
then select “>= Greater Than Or Equal”. Finally type the number “128” and click “OK”. You
should end up with the expression:
x= {{ProfiTrace OPC Server\Slave_3_Status}} >= 128
Click “OK” when the expression is complete. Back in the Property Inspector you must click
the “Add” button to add your expression to the element. Next we can set the animation colour
to green. Your dialogue should look something like figure 16. Finally, go back to the
“Ellipse” tab, set the default fill colour to red and click OK. Try out your screen by clicking
the Runtime item on the main menu. With luck you will see a green indicator.
Figure 16 – Property Inspector showing the fill colour will change to green when the
expression is true