Version 6.0.0 RAILER SMS Track Structure Condition Index (TSCI)
33
ion 6.0.0 RAILER SMS Track Structure Condition Index (TSCI)
-
Upload
brooklyn-clasby -
Category
Documents
-
view
226 -
download
0
Transcript of Version 6.0.0 RAILER SMS Track Structure Condition Index (TSCI)
Version 6.0.0
RAILER SMS
Track Structure Condition Index (TSCI)
TSCI Significance
Based on routine visual track inspections.
Reflects the track segment’s current ability to support routine traffic.
Indicates the maintenance and repair (M&R) requirements for restoring or sustaining the track to an acceptable condition.
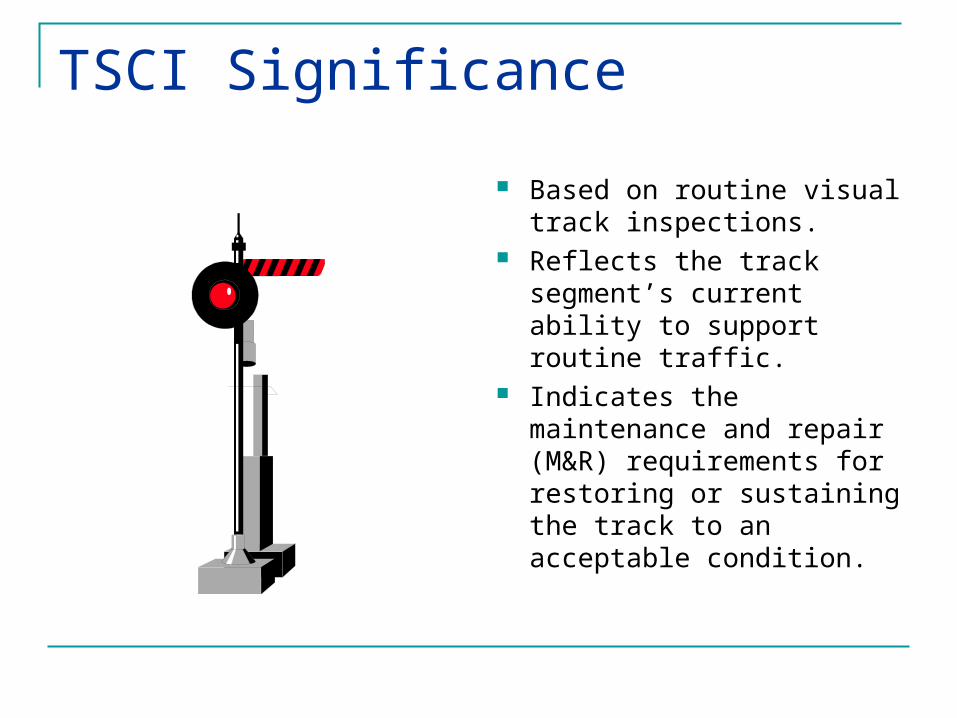
TSCI Scale
GOOD
SATISFACTORY
FAIR
POOR
VERY POOR
SERIOUS
FAILED
100
85
70
55
40
25
10
0
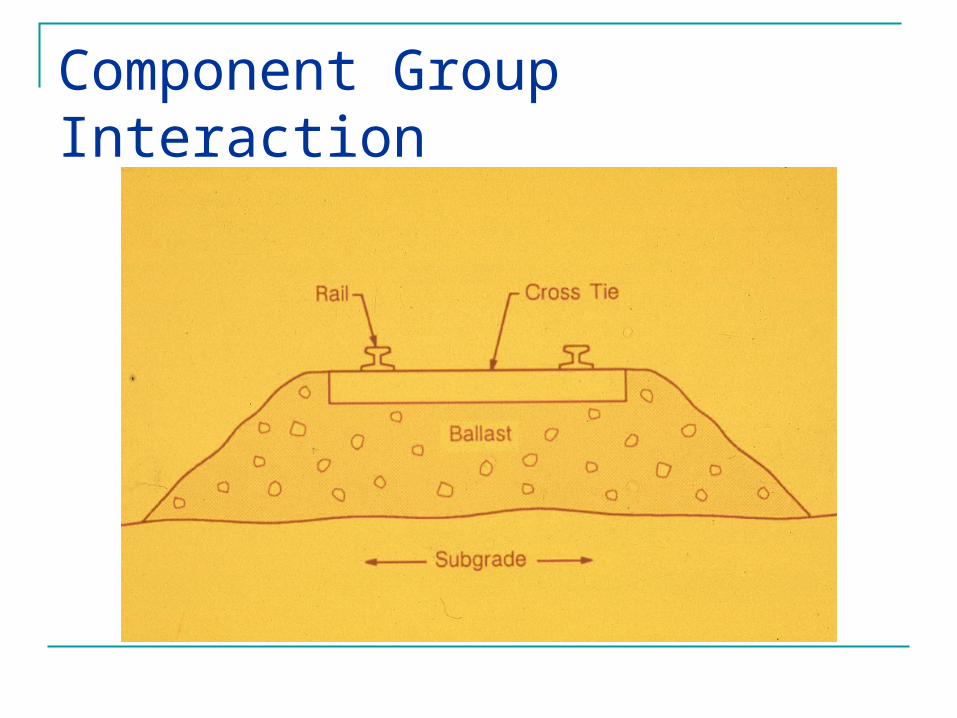
Component Group Interaction
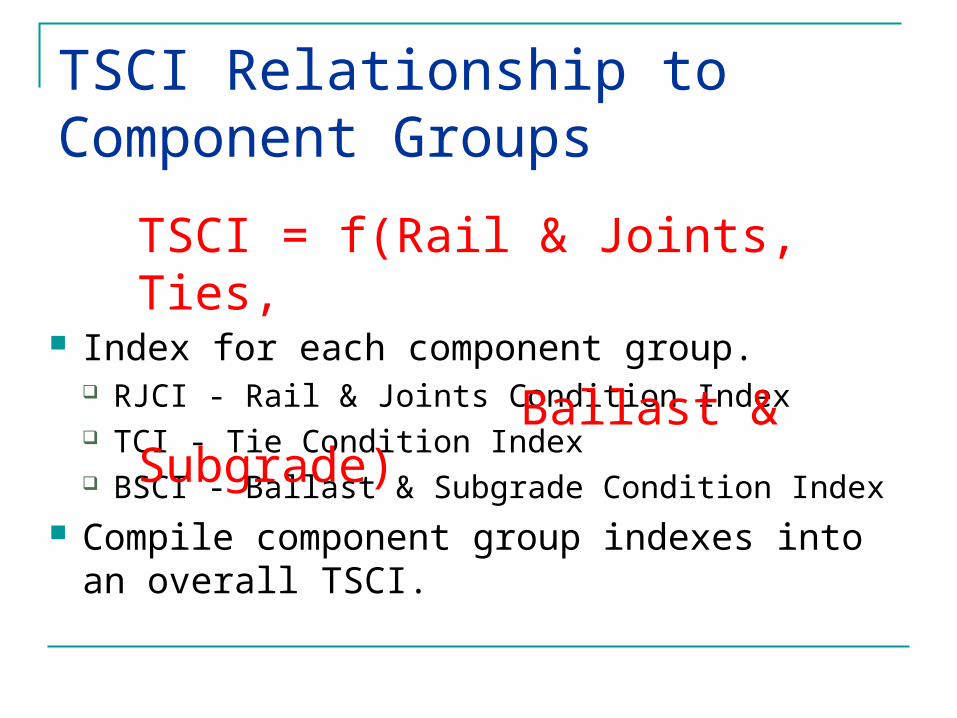
TSCI Relationship to Component Groups
Index for each component group. RJCI - Rail & Joints Condition Index TCI - Tie Condition Index BSCI - Ballast & Subgrade Condition Index
Compile component group indexes into an overall TSCI.
TSCI = f(Rail & Joints, Ties,
Ballast & Subgrade)
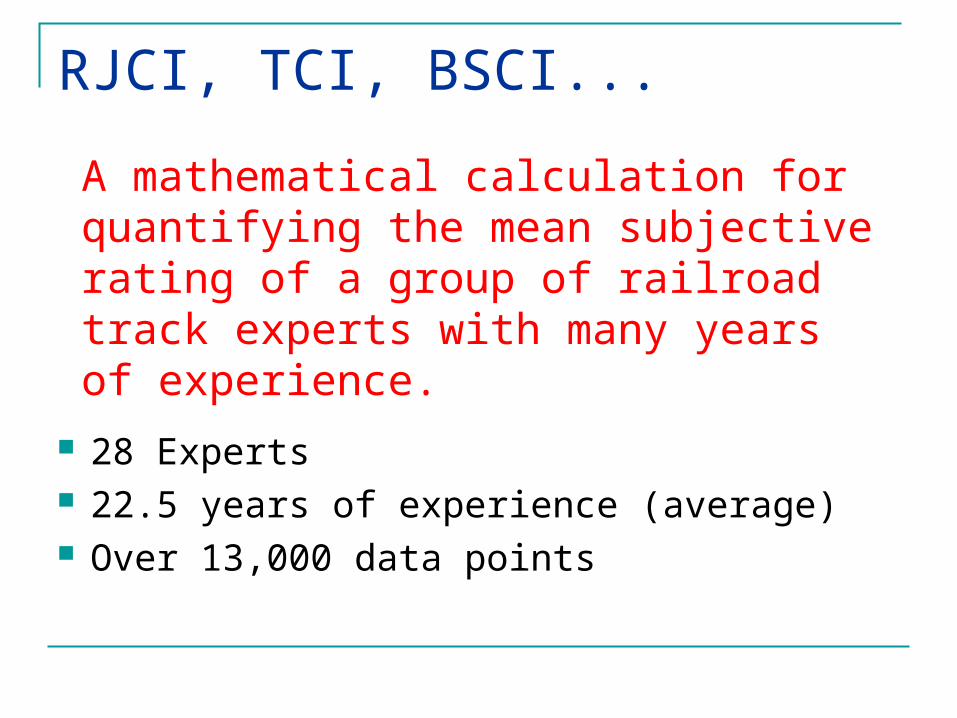
RJCI, TCI, BSCI...
28 Experts 22.5 years of experience (average) Over 13,000 data points
A mathematical calculation for quantifying the mean subjective rating of a group of railroad track experts with many years of experience.
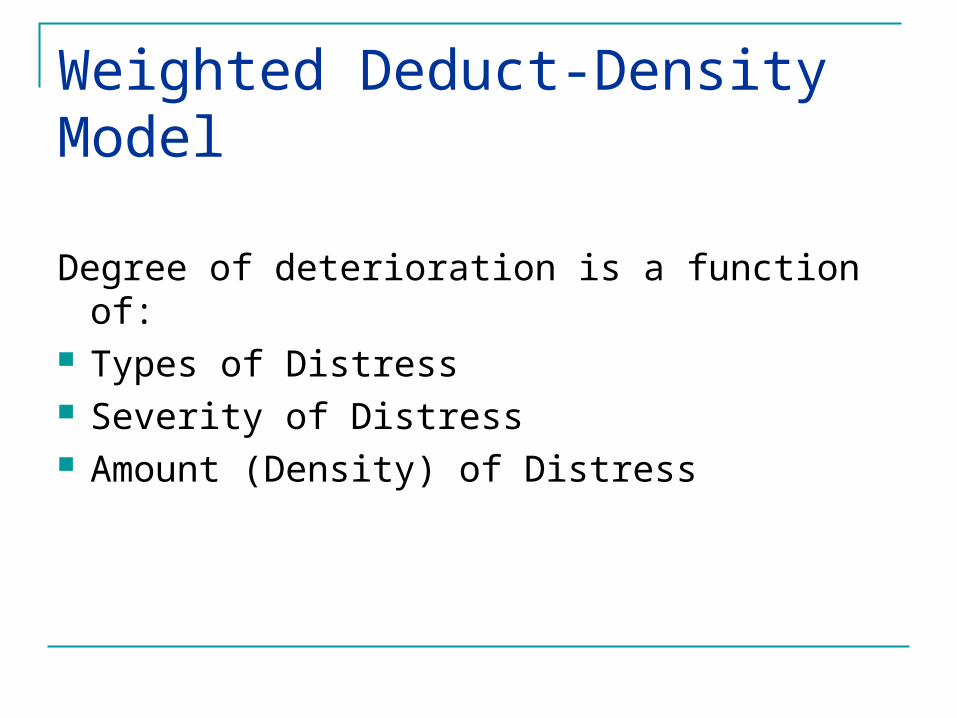
Weighted Deduct-Density Model
Degree of deterioration is a function of: Types of Distress Severity of Distress Amount (Density) of Distress
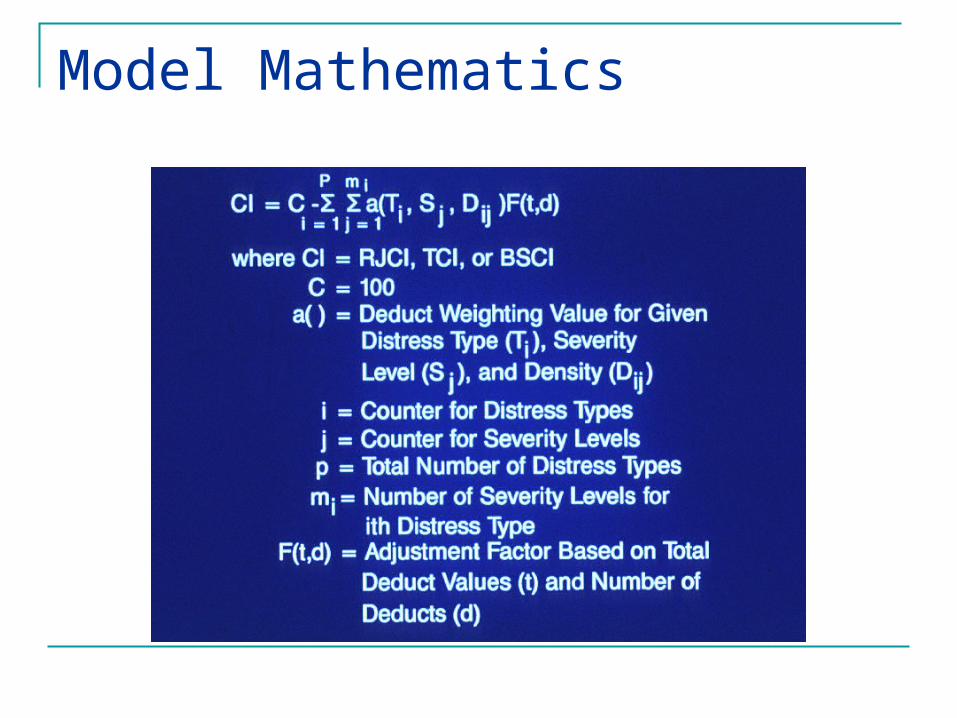
Model Mathematics
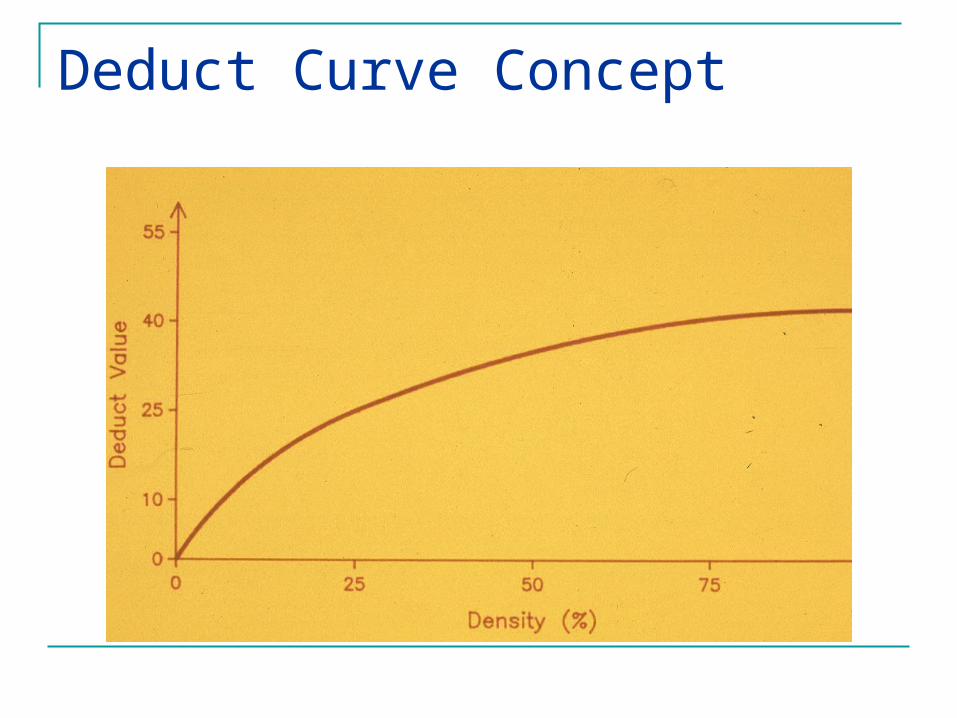
Deduct Curve Concept
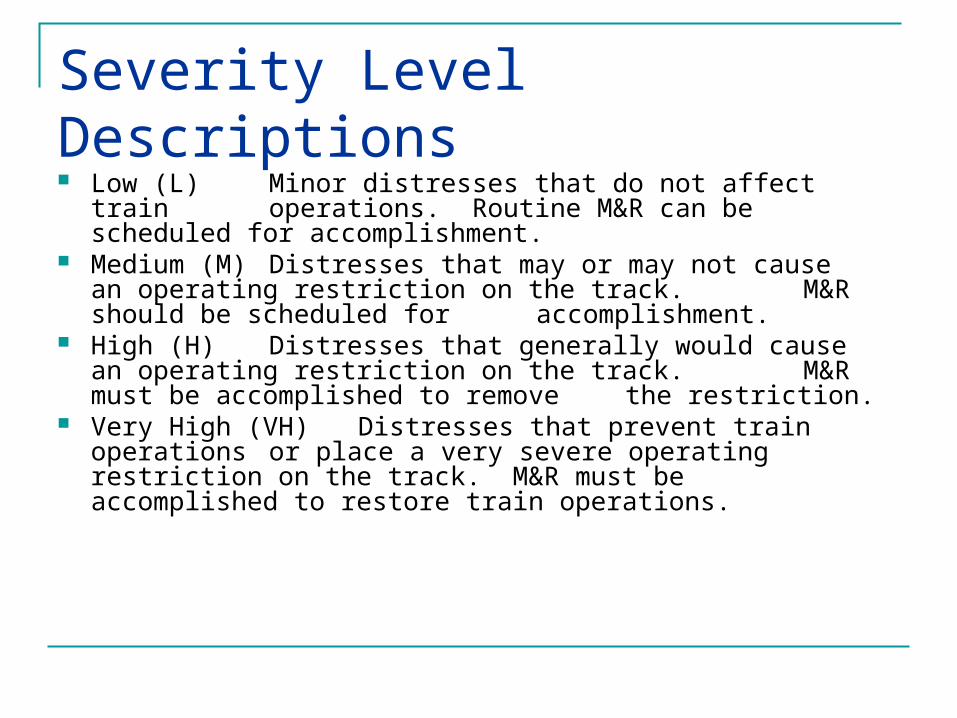
Severity Level Descriptions
Low (L) Minor distresses that do not affect train operations. Routine M&R can be scheduled for accomplishment.
Medium (M) Distresses that may or may not cause an operating restriction on the track. M&R should be scheduled for accomplishment.
High (H) Distresses that generally would cause an operating restriction on the track. M&R must be accomplished to remove the restriction.
Very High (VH) Distresses that prevent train operations or place a very severe operating restriction on the track. M&R must be accomplished to restore train operations.
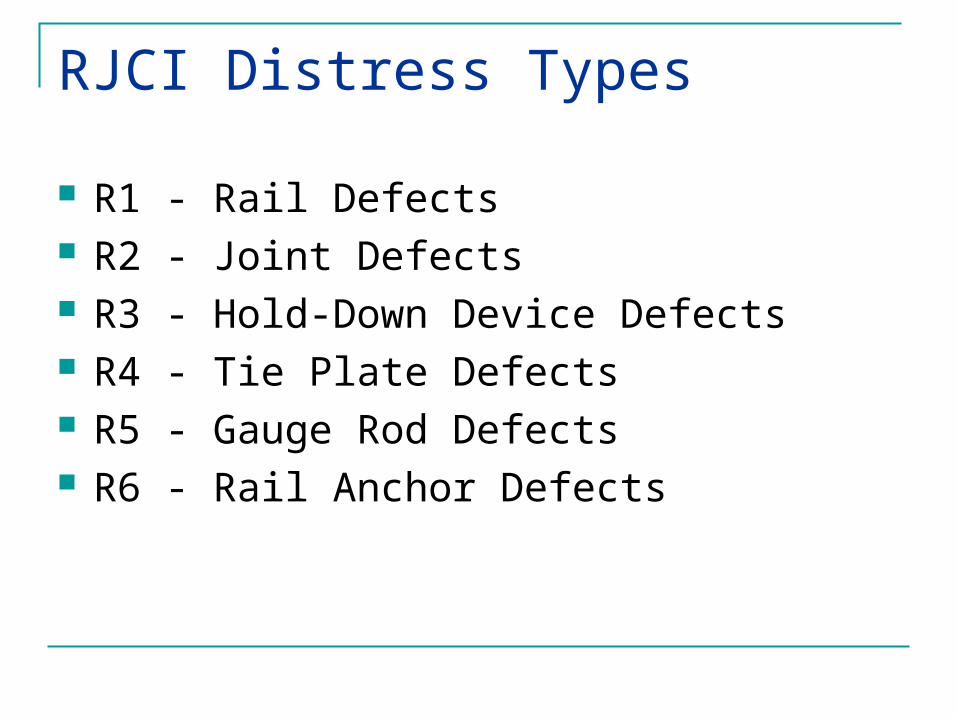
RJCI Distress Types
R1 - Rail Defects R2 - Joint Defects R3 - Hold-Down Device Defects R4 - Tie Plate Defects R5 - Gauge Rod Defects R6 - Rail Anchor Defects
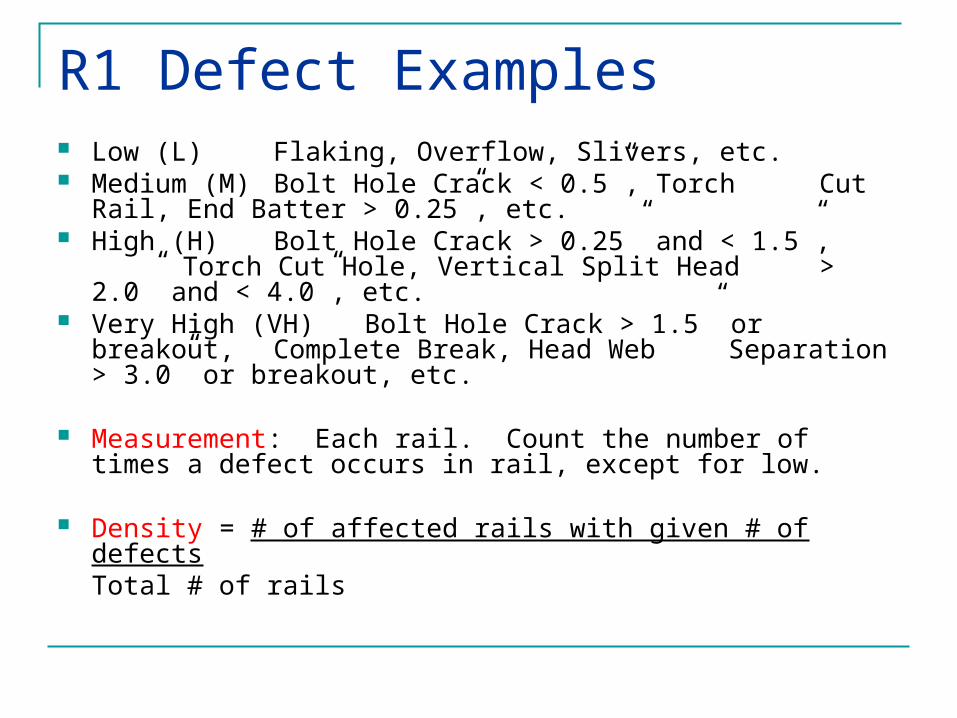
R1 Defect Examples Low (L) Flaking, Overflow, Slivers, etc. Medium (M) Bolt Hole Crack < 0.5”, Torch
Cut Rail, End Batter > 0.25”, etc. High (H) Bolt Hole Crack > 0.25” and < 1.5”,
Torch Cut Hole, Vertical Split Head > 2.0” and < 4.0”, etc.
Very High (VH) Bolt Hole Crack > 1.5” or breakout, Complete Break, Head Web Separation > 3.0” or breakout, etc.
Measurement: Each rail. Count the number of times a defect occurs in rail, except for low.
Density = # of affected rails with given # of defects Total # of rails
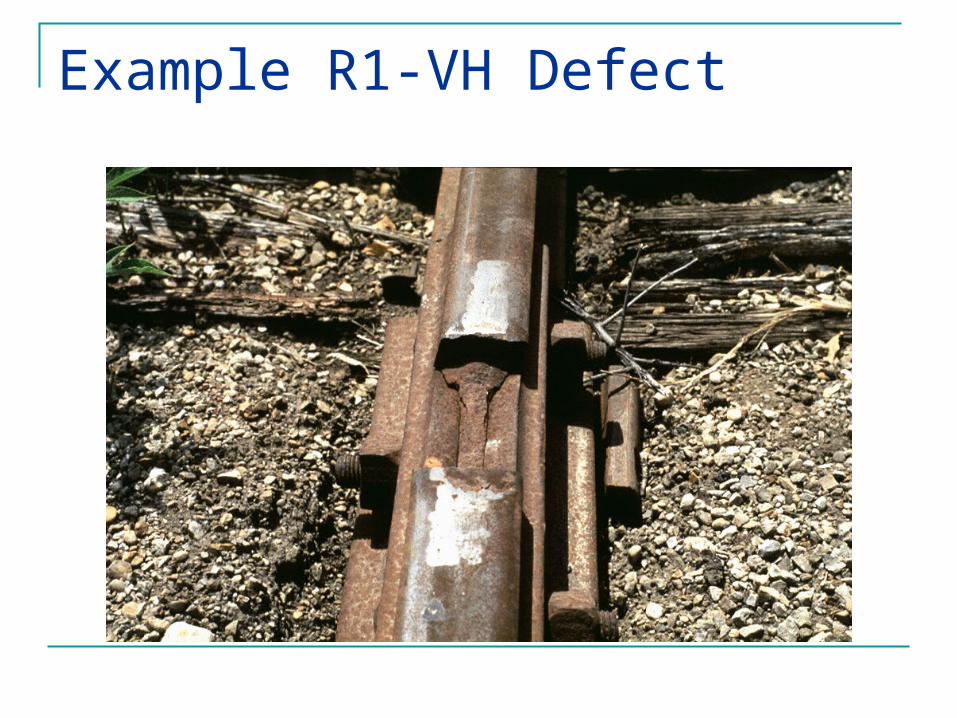
Example R1-VH Defect
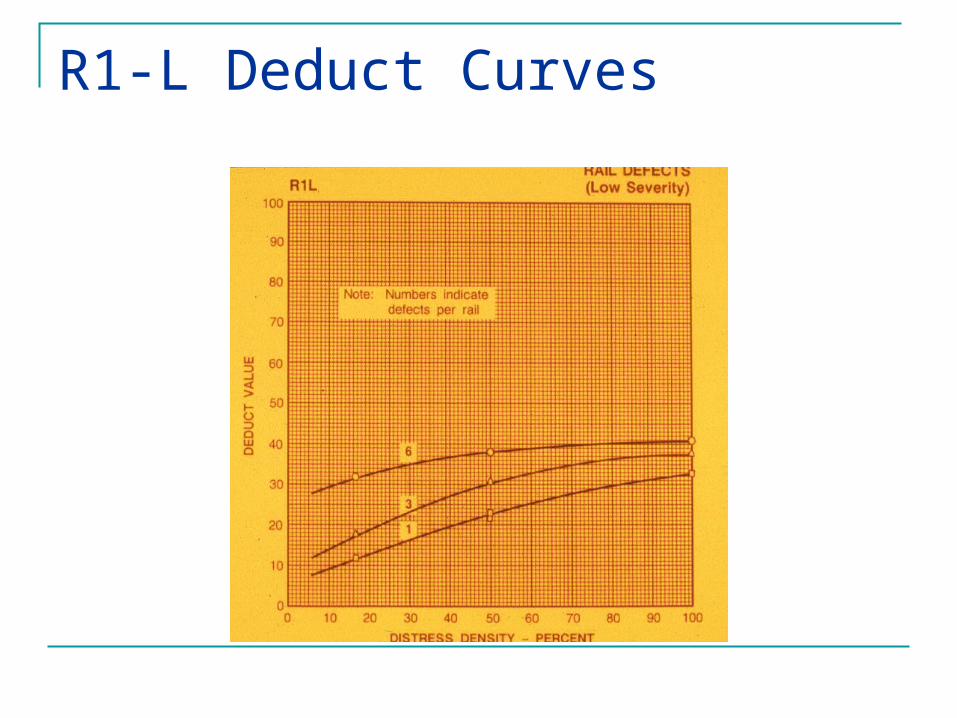
R1-L Deduct Curves
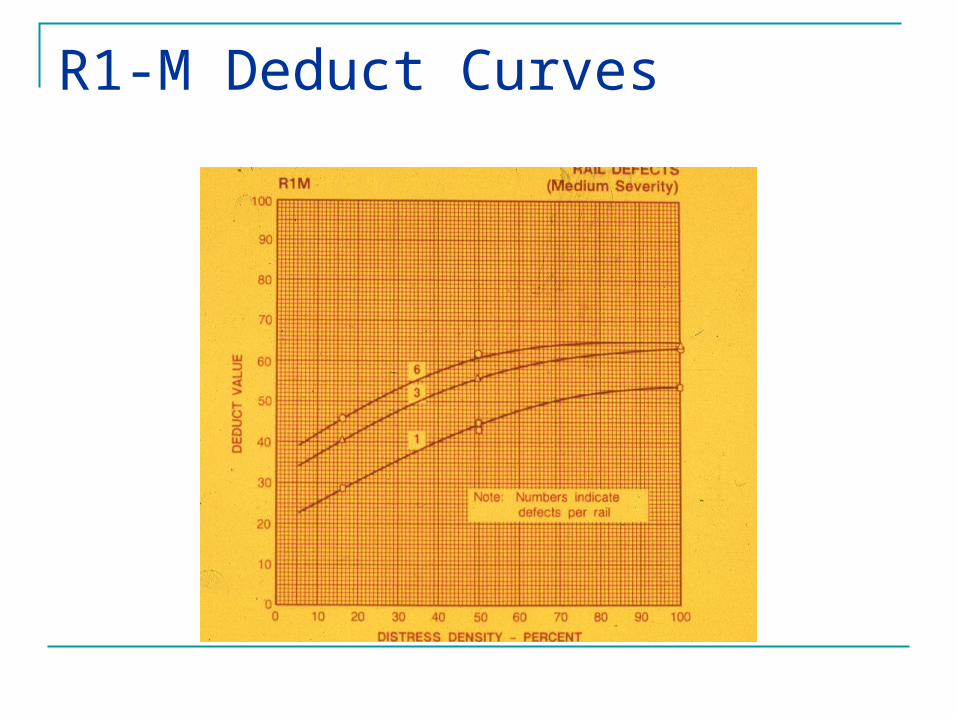
R1-M Deduct Curves
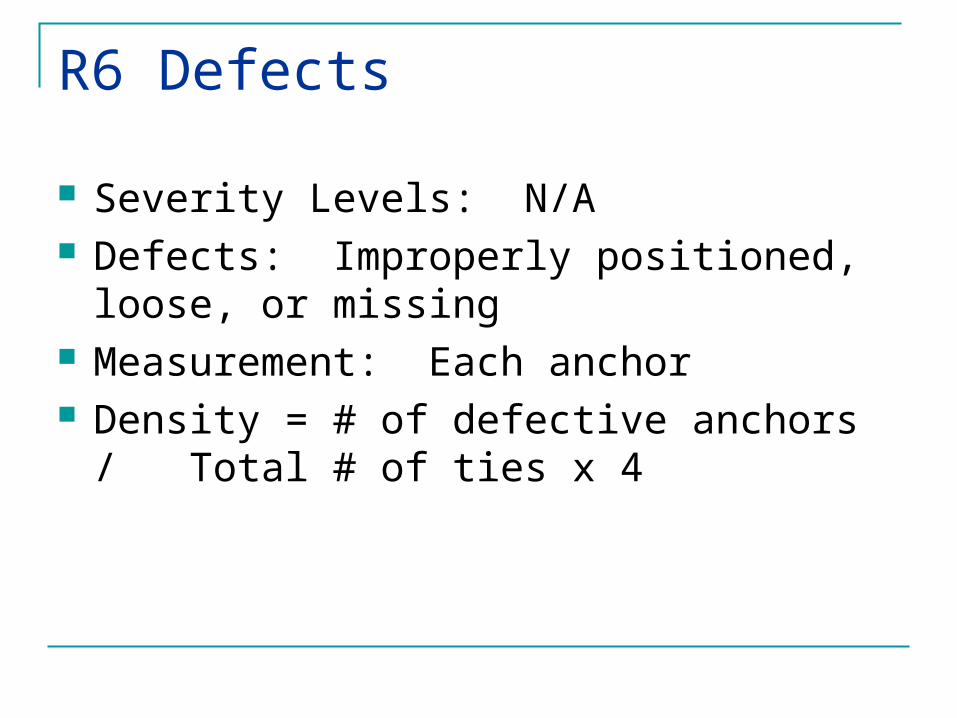
R6 Defects
Severity Levels: N/A Defects: Improperly positioned, loose, or
missing Measurement: Each anchor Density = # of defective anchors / Total #
of ties x 4
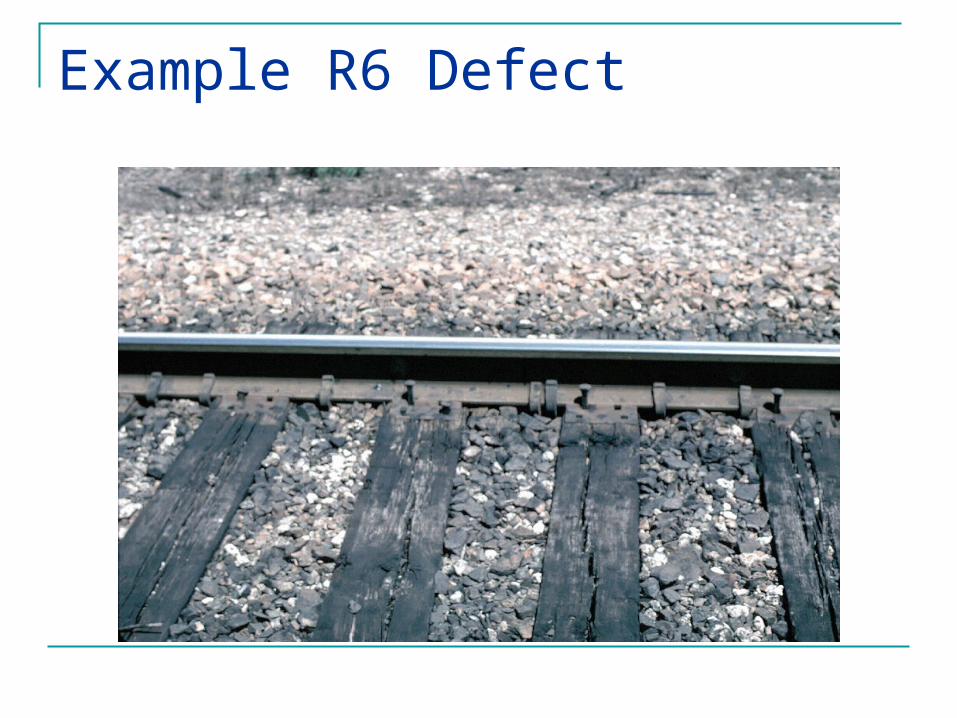
Example R6 Defect
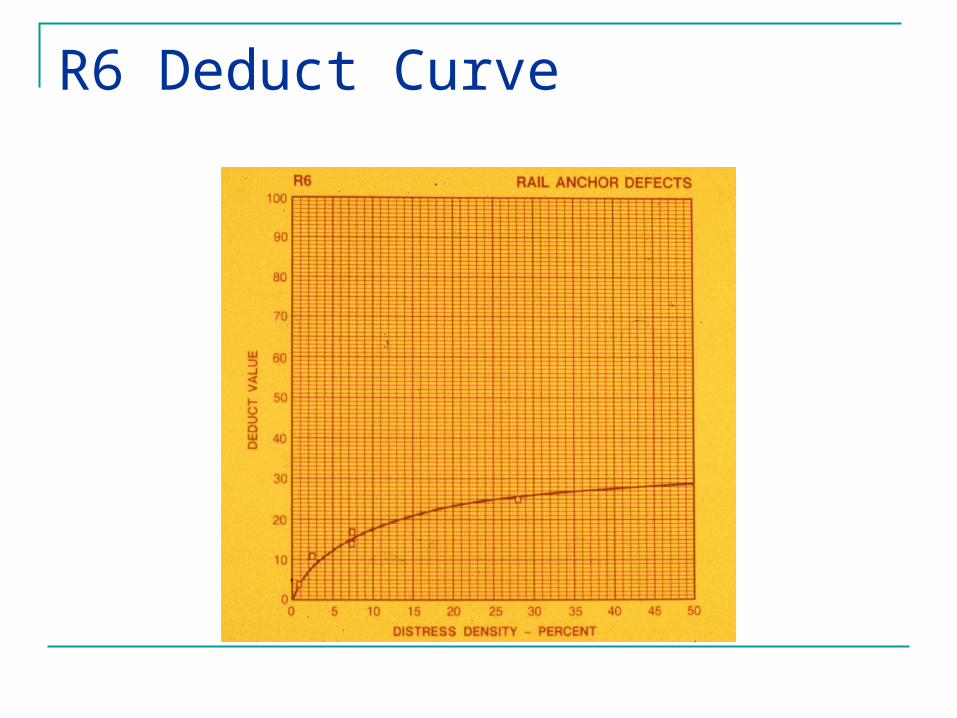
R6 Deduct Curve
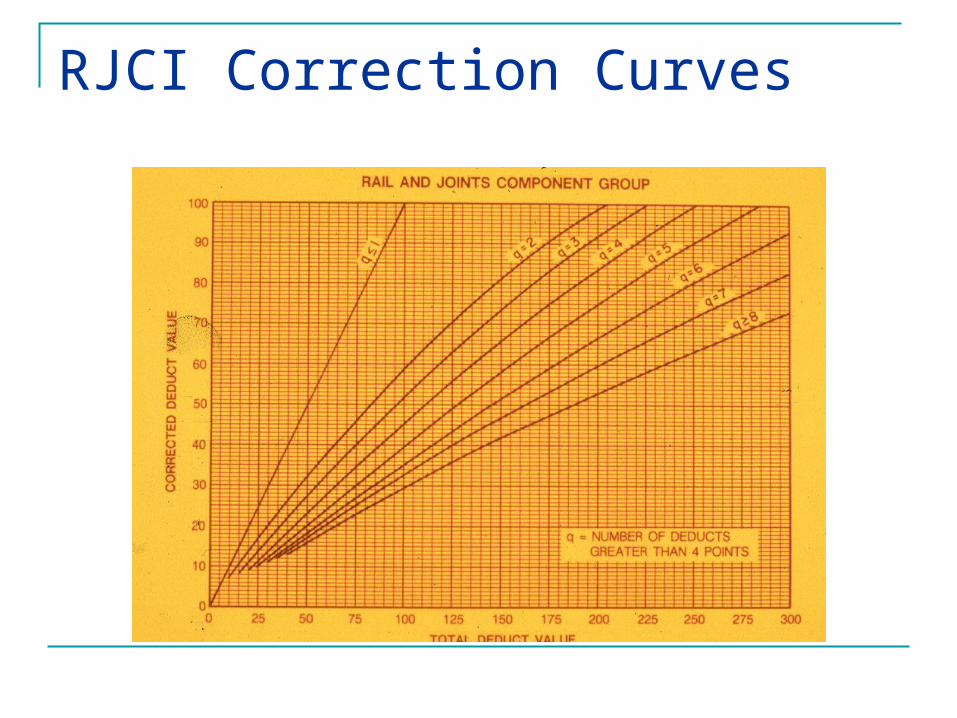
RJCI Correction Curves

TCI Distress Types
T1 - Single Defective Tie T2 - Isolated Defective Tie Cluster T3 - Isolated Defective Tie Cluster that
Includes One Joint Tie T4 - Adjacent Defective Tie Cluster T5 - Joint Tie Cluster T6 - Missing Tie T7 - All Joint Ties Missing T8 - Improperly Positioned Tie
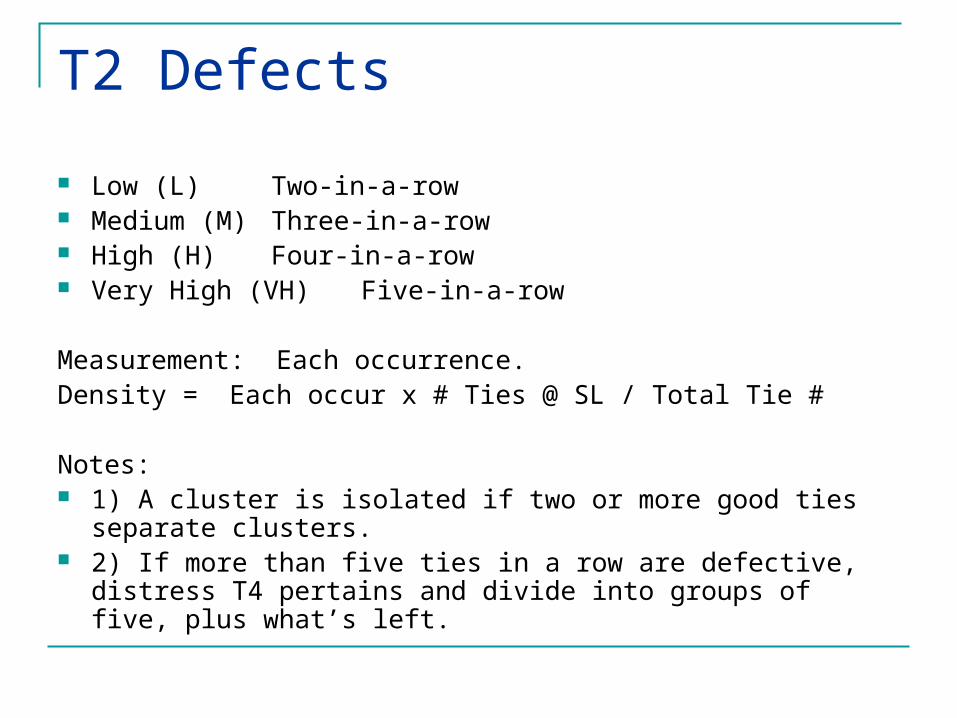
T2 Defects
Low (L) Two-in-a-row Medium (M) Three-in-a-row High (H) Four-in-a-row Very High (VH) Five-in-a-row
Measurement: Each occurrence.Density = Each occur x # Ties @ SL / Total Tie #
Notes: 1) A cluster is isolated if two or more good ties separate clusters. 2) If more than five ties in a row are defective, distress T4
pertains and divide into groups of five, plus what’s left.
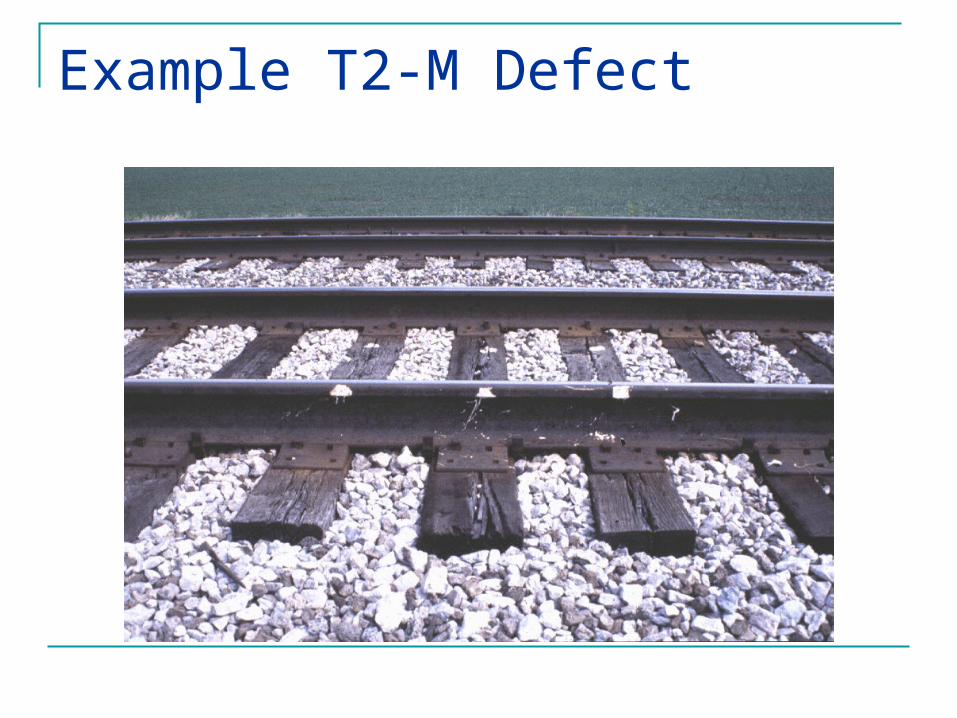
Example T2-M Defect
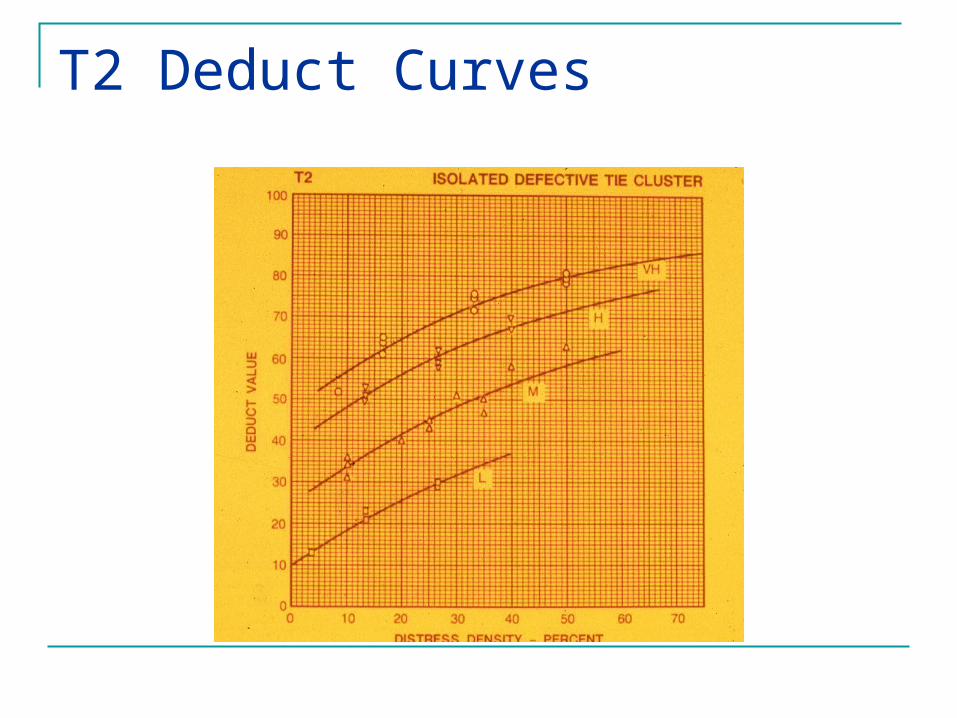
T2 Deduct Curves
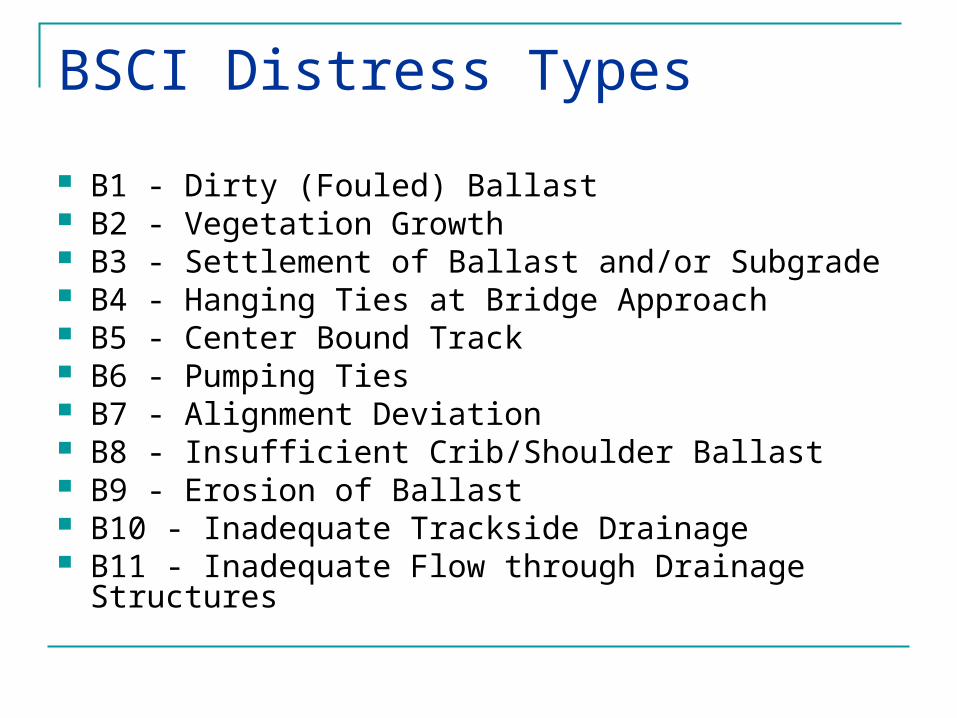
BSCI Distress Types
B1 - Dirty (Fouled) Ballast B2 - Vegetation Growth B3 - Settlement of Ballast and/or Subgrade B4 - Hanging Ties at Bridge Approach B5 - Center Bound Track B6 - Pumping Ties B7 - Alignment Deviation B8 - Insufficient Crib/Shoulder Ballast B9 - Erosion of Ballast B10 - Inadequate Trackside Drainage B11 - Inadequate Flow through Drainage Structures
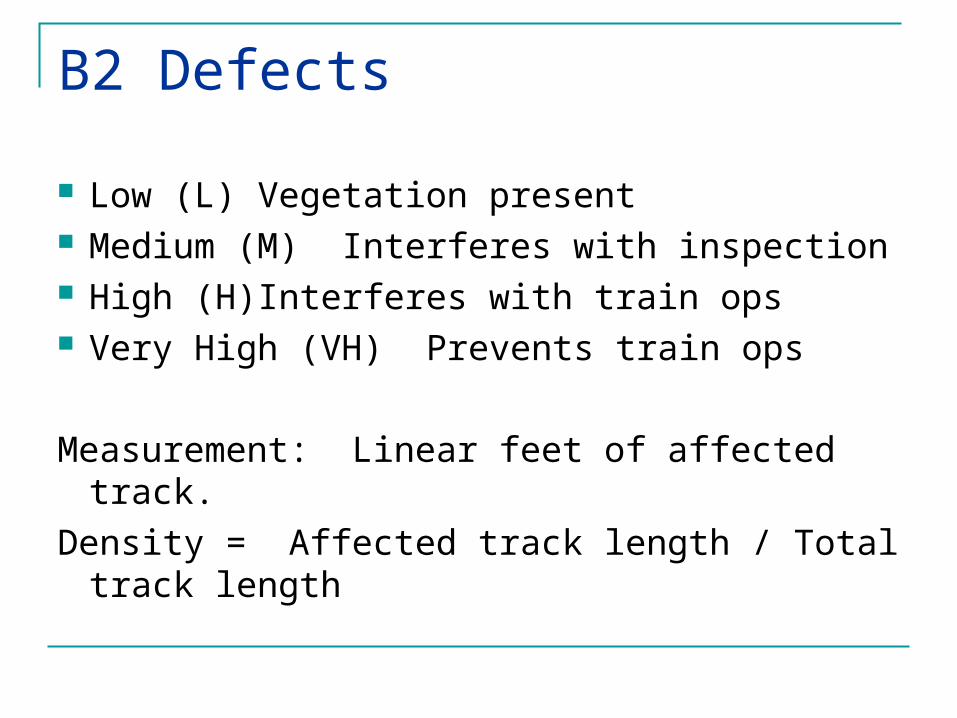
B2 Defects
Low (L) Vegetation present Medium (M) Interferes with inspection High (H) Interferes with train ops Very High (VH) Prevents train ops
Measurement: Linear feet of affected track.
Density = Affected track length / Total track length
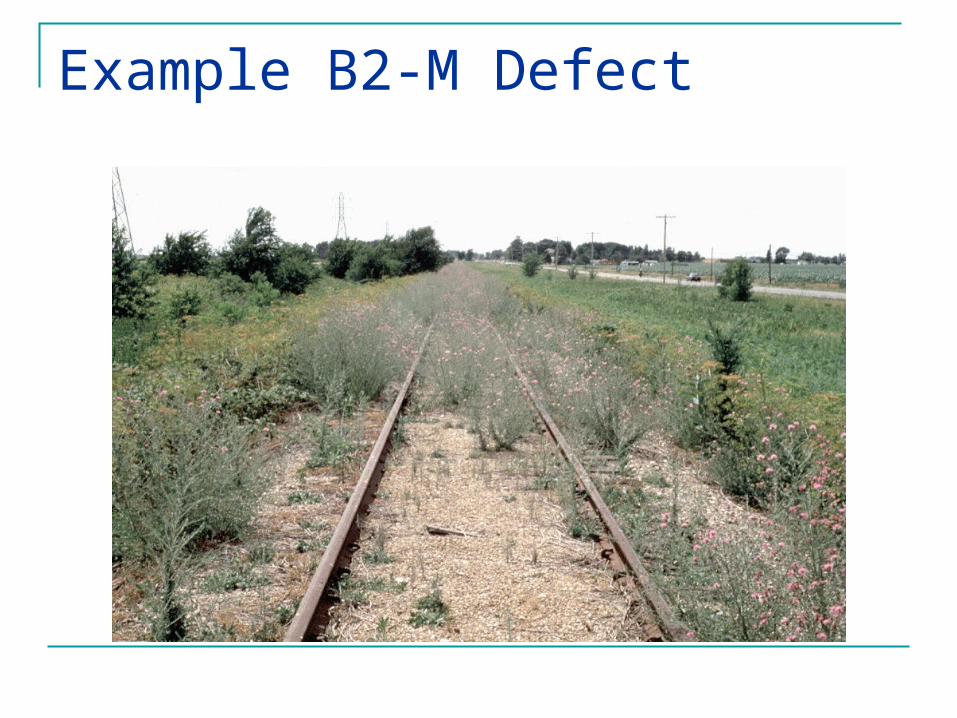
Example B2-M Defect
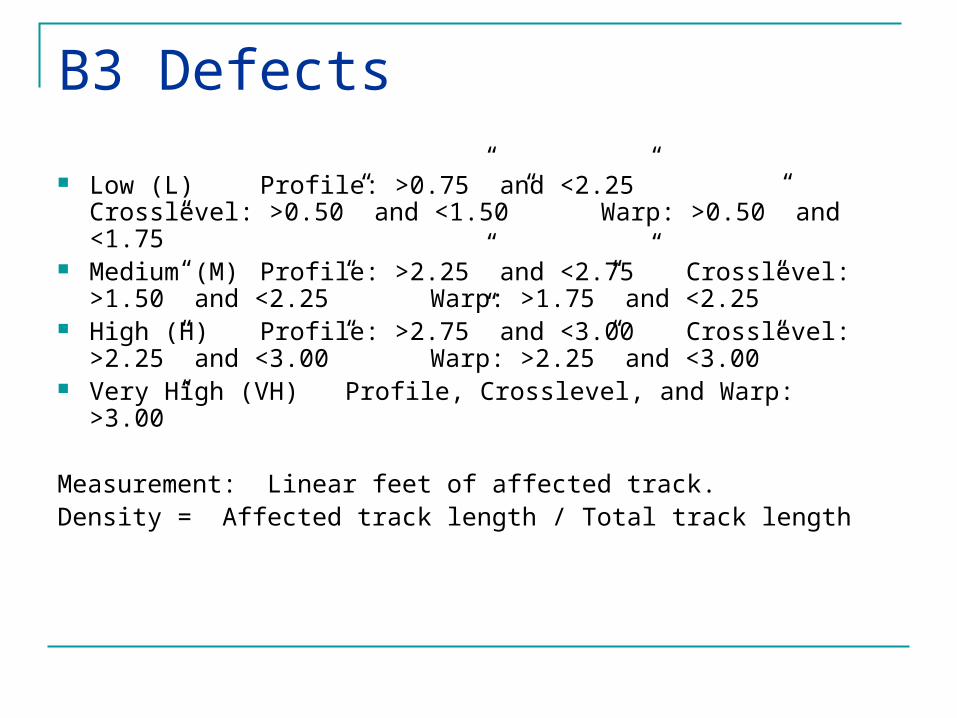
B3 Defects
Low (L) Profile: >0.75” and <2.25” Crosslevel: >0.50” and <1.50” Warp: >0.50” and <1.75”
Medium (M) Profile: >2.25” and <2.75” Crosslevel: >1.50” and <2.25” Warp: >1.75” and <2.25”
High (H) Profile: >2.75” and <3.00 Crosslevel: >2.25” and <3.00” Warp: >2.25” and <3.00”
Very High (VH) Profile, Crosslevel, and Warp: >3.00”
Measurement: Linear feet of affected track.Density = Affected track length / Total track length
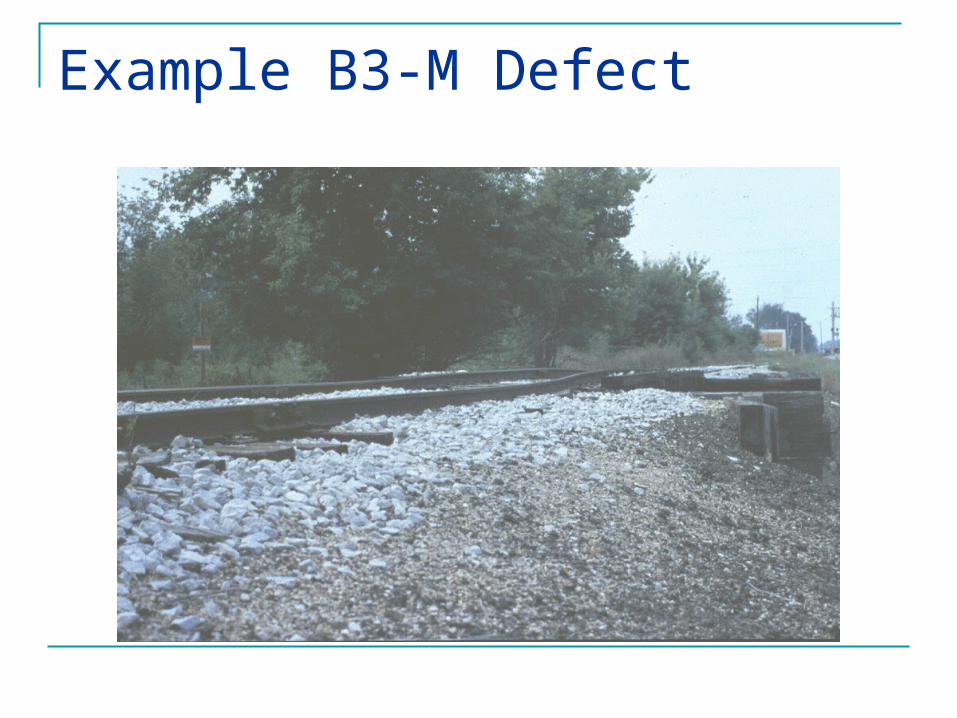
Example B3-M Defect
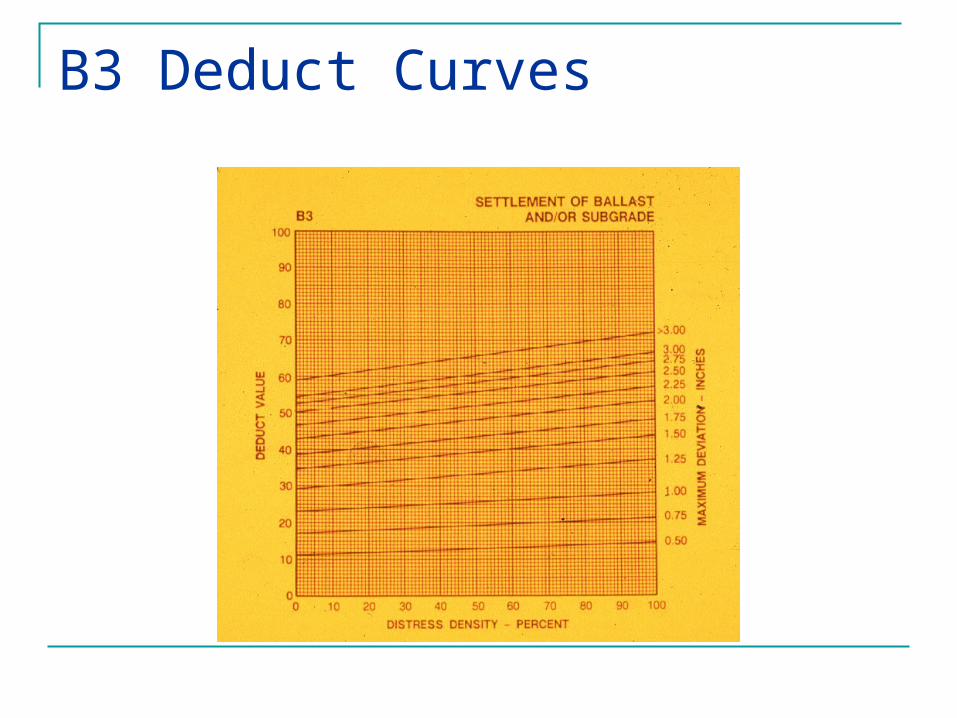
B3 Deduct Curves
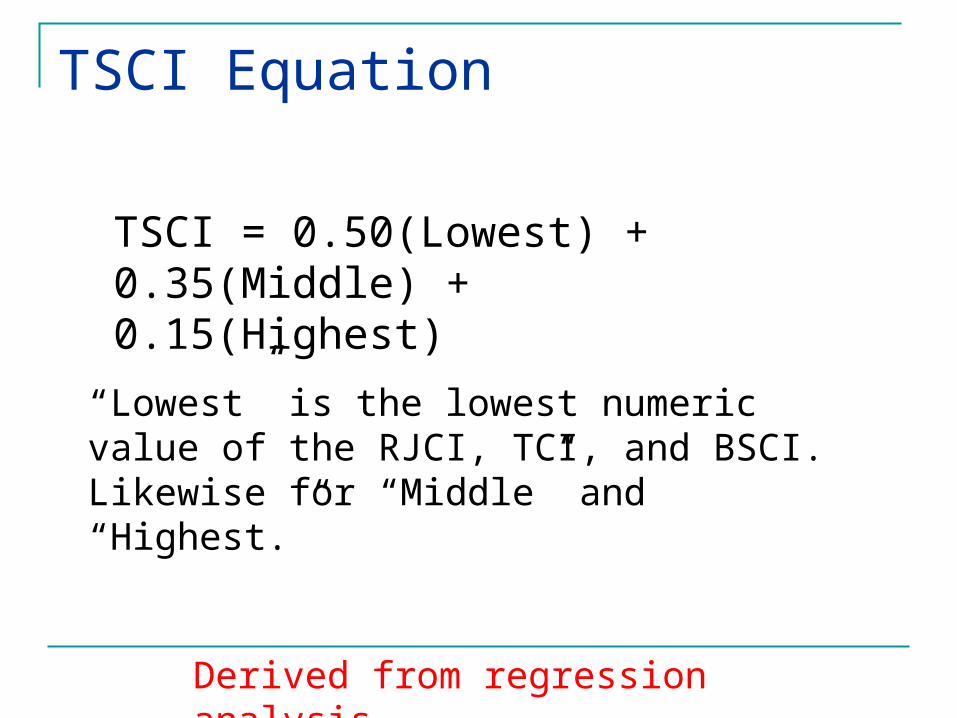
TSCI Equation
TSCI = 0.50(Lowest) + 0.35(Middle) + 0.15(Highest)
“Lowest” is the lowest numeric value of the RJCI, TCI, and BSCI. Likewise for “Middle” and “Highest.”
Derived from regression analysis.
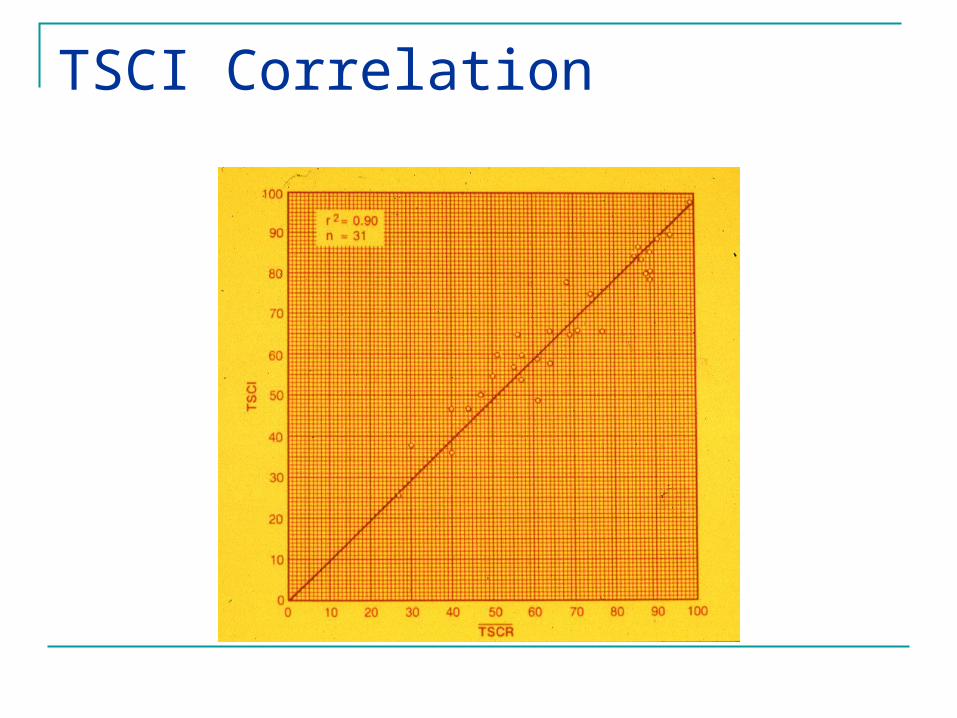
TSCI Correlation
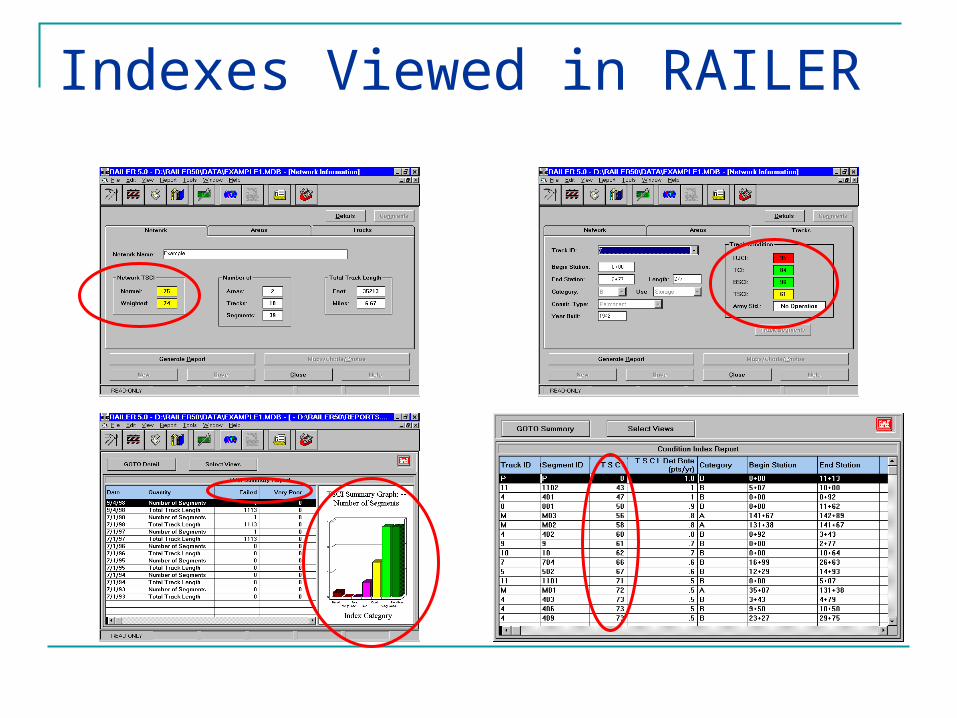
Indexes Viewed in RAILER
Summary
The TSCI measures track condition and deterioration rates based on routine visual track inspections.
The TSCI is a function of the RJCI, TCI, and BSCI.
The TSCI reflects the ability of a track to support routine expected traffic and loads.
The TSCI reflects the subjective numerical ratings of a group of track experts.