VARIATION IN THE S1 CALL TYPE OF SOUTHERN · PDF fileOF SOUTHERN RESIDENT KILLER WHALES...
32
VARIATION IN THE S1 CALL TYPE OF SOUTHERN RESIDENT KILLER WHALES (SRKW), Orcinus orca Emalie Garcia Beam Reach Marine Science and Sustainability School Seattle, Washington Spring 2011 [email protected]
Transcript of VARIATION IN THE S1 CALL TYPE OF SOUTHERN · PDF fileOF SOUTHERN RESIDENT KILLER WHALES...

VARIATION IN THE S1 CALL TYPEOF SOUTHERN RESIDENT KILLER WHALES (SRKW),
Orcinus orca
Emalie Garcia
Beam Reach Marine Science and Sustainability SchoolSeattle, Washington
Spring 2011

Introduction
Many organisms ranging from birds to humans rely on communication for
reproduction and survival. Humpback whales, Megaptera hovaeangline, use complex
songs to find mates (Smith et al. 2008). Meerkats, Suricata suricatta, use
communication to signal to others when a predator is near (Manser 1999). Many birds
and insects use visual signals to provide protection for themselves by mimicry.
Communication is a necessity for both terrestrial and marine organisms, but challenges
in both environments limit which types are used most effectively.
Communication common in terrestrial habitats, including chemical signals, prove
challenging in a marine environment. Water exchange occurs constantly causing these
signals to dissipate rendering them useless under most marine conditions. Visual
communication is beneficial in areas that are wide open and lack obstacles that block
the signal. Tactile communication can be very important especially between mother
and offspring, but is limited by distance between individuals. Acoustic communication is
vital in environments were close distances can not be achieved or are difficult. Sound
travels great distances which makes it a great signal for many organisms. In fact, water
is a better travel medium for sound than air, thus sound travels faster and further than in
air given the right conditions (no masking, no corners, etc.). In marine environments,
acoustic communication is used primarily. Thus, it is no surprise that killer whales,
Orcinus orca, are highly dependent on their vocalizations. (Bain 2011, Erbe 2011,
Richardson et al. 1995)
Killer whales use multiple methods for communicating. Tactile communication
is often used between a mother and calf, but is limited by distance. Despite killer
whalesʼ acute vision above and below the water, visual communication is difficult at
night and in murky water conditions (Bain 2011). However acoustic communication
overcomes these challenges and is theorized as their primary form of communication
(Bain 2011, Erbe 2011, Richardson et al. 1995). Killer whales vocalize in three different
ways. They emit short broadband clicks, pulsed calls, and pure tonal whistles. Clicks
are used for echolocation, typically when foraging. A click is sent from the whaleʼs
melon outward; once it hits an object, it bounces off and is received by the oil filled
lower jaw of the animal (Richardson et al. 1995). Multiple clicks sent out over time allow
the animal to determine position of an object, for example a fish, even when it may be
out of visual range. Calls and whistles have not successfully been linked with behavior
although many attempts have been made (Bain 1986, Ford 1989, Morton et al. 1986).
LIttle is known about the information being sent out through these acoustic signals.
This study aims to better understand discrete calls made by killer whales.
Offshores, transients, and residents are three ecotypes of killer whales that can
be distinguished by diet, behavior, vocalizations, social structure and travel patterns
(Ford et al.1999). Residents are fish eating mammals who have very stable social
structures (Ford et al. 1998). Residents can be subdivided into communities based on
where they spend most of their time, specifically in the summer (Bigg et al. 1987).
Northern Residents typically occupy inland waters of northern Vancouver Island, while
Southern Residents can be found in the Salish Sea (Bigg et al. 1987, Ford et al. 1998).

This area is defined to include the Strait of Juan de Fuca, Puget Sound, the waters
around the San Juan Islands, including Haro Strait, and continues up the Strait of
Georgia (Washington State Board of Natural Resources), also including the inland
waters off the southern end of Vancouver Island. Thus, some overlap in range exists
between Northern and Southern Residents.
This study aims to better understand the vocalizations, specifically discrete calls
that make the Southern Residents unique. Ford (1987) describes pulsed calls having
distinct tonal qualities resulting from the high repetition rate of the pulses. Most of these
calls are highly repetitive and can be grouped into discrete categories detectable by the
human ear. Visual inspection confirms and brings clarity to call identification. A
spectrogram is a visual plot of the frequency versus time of a sound using a color
spectrum to measure amplitude or energy produced in a call. Ford defined these
discrete calls by frequency
and duration measured from
their spectrograms. Calls
can be segmented by
determining shifts in
repetition rate of the pulses.
In the case of S1, the call
can be divided into three parts (see Figure 1). Measurements were taken on each part
of the calls in Fordʼs study (1987). Calls were named alphanumerically. A letter (N, S
or T representing Northern Residents, Southern Residents and transients, respectively)

distinguishing each call source was followed by a call number, determined by the order
in which they were identified. Twenty-six discrete call types were identified for the
Southern Residents. S1 will be the focus here. (Ford 1987)
Southern Residents were chosen as subjects of this study because of the large
network that exists to monitor their location. This information comes from two main
sources. Whale watching is a large industry in the area both from land and on water.
Monitoring also comes from a network of hydrophones operated by OrcaSound
(Washington State Parks and The Whale Museum). These hydrophones stream live
allowing people all over the world to listen and report when calls are heard at any of the
five locations in the Salish Sea.
Southern Residents are made up of three pods, J, K, and L (Bigg et al. 1987).
As of 2008, the Center for Whale Research lists J-pod as having 25 members. While K
and L pods have 19 and 42 members, respectively. This study will focus on J-pod
because they are the most cohesive and most studied pod in the Salish Sea. Multiple
matrilines spending at least half of their time together make up a pod (Baird 2000,
2002). In the case of residents, male and female individuals who share a common
immediate female family member make up a matriline. Members of a matrilineal group
rarely separate from each other for extended periods of time (Baird 2000).
Ford (1999) and Wieland (2007), report J-pod contributed to a large percentage
of the calls gathered during each of their studies. Each study categorized calls into call
types defined by Ford (1987). S1 composed about 25% of the calls made by J-pod in
Wielandʼs (2007) study. S1 was also the most common J-pod call type studied by Ford
(1987) and has been reported as J-podʼs most used call since the 1970ʼs (Ford and
Fisher 1983). Therefore, it is thought to be this podʼs contact call. Probability that S1 is
followed by another S1 also adds to the contact call hypothesis (Weiland 2007). A
contact call is used by vocalizing animals for cohesion of a group, in this case a pod,
especially when traveling (Ford and Fisher 1983). Contact calls, like S1, may also be a
family or individual identifier (Ford 1991) similar to dolphin signature whistles(Caldwell
and Caldwell 1965, Caldwell et al. 1990, Janik and Slater 1998). Many other studies
have tried to support this idea by comparing dialects in geographically distinct killer
whales (Deeke 2010, Sayigh 1990).
The contact call hypothesis suggests a contact call signals information to other
individuals. If the signal remains constant over time, the meaning or information
portrayed in the signal should remain constant. However if the signal changes, those
unaware of the change may be left in the dark on what the signal now means. Take for
instance your name. It identifies you to other people as an individual (your first name)
and as part of a family (your last name). Consider what would happen if you changed
your first name. Confusion may ensue for people when trying to contact you if they are
unaware of your name change. Thus, consistency in a call used for contact should
remain relatively stable over time to conserve its meaning.
As previously stated, little is known about killer whales and their methods for
acoustic communication. More studies have been done on bottlenose dolphins,
Tursiops truncatus, to better understand their use of signature whistles. Evidence from
bottlenose dolphins (McCowan and Reiss 1995) suggests that vocal maturation and

learning both play a role in development of whistle contours. The author found:
Complex whistles were made in the earlier stages of development. The time at which
certain whistles were acquired varied among individuals. Whistle types used by infants
were shared with genetically unrelated adults. Together these findings suggest vocal
maturation and learning may be contributing to repertoire development (McCowan and
Reiss 1995). By analogy, we suggest these factors could also serve as a model for
killer whale communication because they are closely related.
Killer whales have a hearing range from 1 to 100 kHz (Symanski et al. 1999). In
Figure 2 below (reproduced from Holt 2008), an average of two killer whalesʼ behavioral
and physiological audiograms are presented. Audiograms were obtained by using
trained killer whales (Symanski et al. 1999). Thresholds were determined by emitting
sounds of known frequencies and measuring the killer whaleʼs response. Physiological
audiograms were determined by measuring electrical pulses in nerves, a response to
hearing a sound, using electrodes along the distal dorsal side of the killer whaleʼs blow
hole; Behavioral audiograms were determined by training the killer whale to react, in this
case by dipping its head, to signal that a sound was heard (Bain 2011).
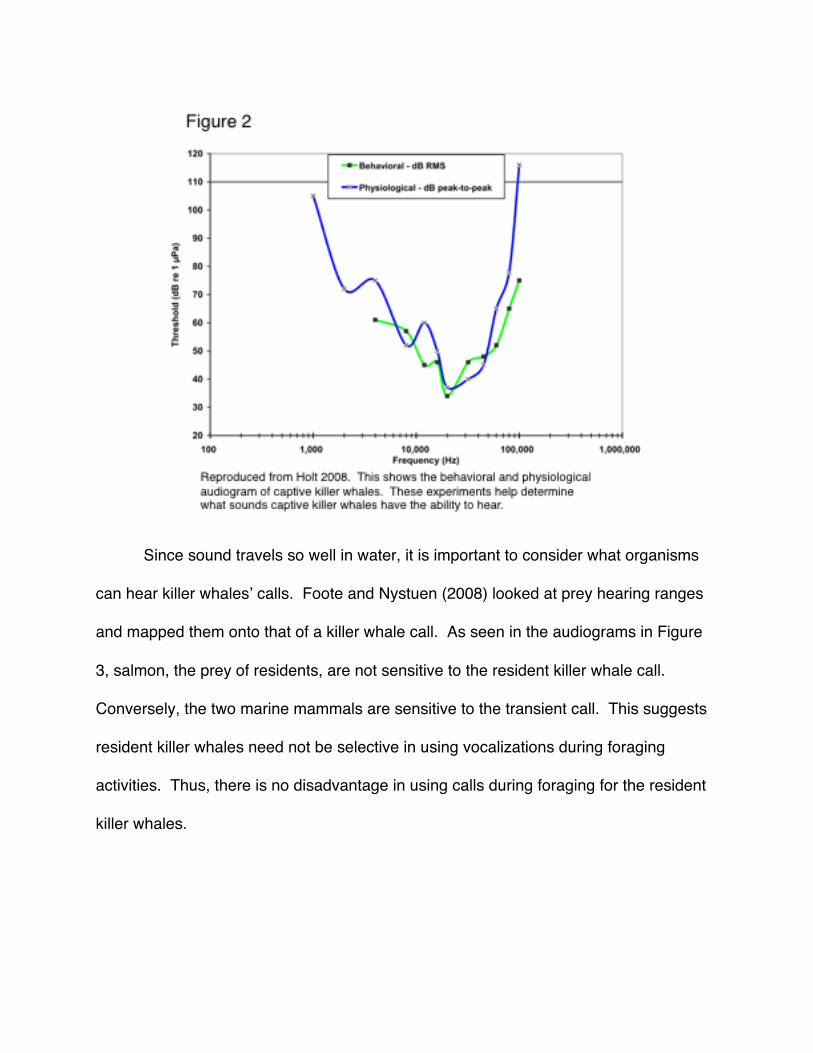
Since sound travels so well in water, it is important to consider what organisms
can hear killer whalesʼ calls. Foote and Nystuen (2008) looked at prey hearing ranges
and mapped them onto that of a killer whale call. As seen in the audiograms in Figure
3, salmon, the prey of residents, are not sensitive to the resident killer whale call.
Conversely, the two marine mammals are sensitive to the transient call. This suggests
resident killer whales need not be selective in using vocalizations during foraging
activities. Thus, there is no disadvantage in using calls during foraging for the resident
killer whales.

Now, consider how sound travels. Sound behaves as a wave and can be
described in terms of an amplitude, frequency,
and length (see Figure 4). A single call type
may vary by frequency, duration, or amplitude.
One study comparing dolphin whistles of
different geographic populations considered a
list of traits including minimum and maximum
frequencies, start and end frequencies, delta frequency, peak frequency, duration,
number of inflection points, and number of harmonics (May-Collado and Wartzok 2008).
These characteristics will be used to analyze the S1 calls of the resident killer whales.
Because whistles of a bottlenose dolphin are not precisely comparable to a killer whale
call, it is expected that some of the characteristics listed above may not be significant.
However they present a good starting point to investigate variation in the calls of killer
whales.
Spectrograms allow for measurements to be made on the calls. The more
energy occurs in parts that are brighter, while less energy is contained in areas that are
dark (as seen in Figure 1, note color varies with settings and program used). Recall,
S1 calls seem to be made up of three parts. Thus, inflection points should occur twice
in every call categorized as S1. Typically, the call starts at one frequency and ends at a
different frequency, usually lower. Thus minimum and maximum frequency may be the
same as start and end frequency. Peak frequency may also be redundant. Harmonic
visualizations are often limited by the sensitivity of the recording equipment. In this
study, we are limited by the the frequency range of the hydrophone.
Information gathered here led the researcher to develop a foundation for
measuring variation in the calls of the Southern Resident. This study aims to test two
hypotheses.
1) No variation in S1 calls exists.
2) S1 calls from the same individual will not change significantly.
Investigation of (2) will be limited because it is dependent on localizing more than one
cal to an individual.
Methods
A 42ʼ catamaran, the Gato Verde, was used to collect data from April 2011
through May 2011 throughout the Salish Sea. The vessel is a hybrid electric-biodiesel
sail boat. This limited background noise due to the research vessel when recording
whales. We observed the Be Whale Wise guidelines. (Note distance increased from
100 yards to 200 yards perpendicular to the whaleʼs travel path during the data
collection period.) The radio system and whale watch company contacts were used to
determine the location of the SRKWs.
A four hydrophone array (Labcore 40ʼs Array with peak sensitivity of 5 kHz) was
deployed from port stern of the Gato Verde when whale sightings are imminent. The
most accurate recordings were made when a speed less than three knots was
maintained by the boat and a weight was attached to the array keeping it submerged.
Hydrophones were calibrated ahead of time using the Inter Ocean Systems Model 902
Listening Calibration System. The sampling rate was set to 48,000 samples/second
and the gain setting was adjusted accordingly. Recording occurred once equipment
was in place and whales were in sight. Sound Devices 702 recorders assigned labels
to the audio files, these were noted in the data sheets to determine day and time the
recording was taken. Metadata (weather conditions, number of individuals present,
latitude and longitude coordinates, etc.) that does not affect this study was recorded for
archival purposes only (stored in SQLShare - http://www.sqlshare.com/).
Photos were used to identify the whales present during recordings. Identifying
individual whales in the Southern Resident community has been made possible by
extensive photo identification projects (Bigg et al. 1987, Center for Whale Research).
Uniqueness of the dorsal fin and right and left saddle patches, the area of the body just
behind the dorsal fin, are the characteristics used to determine individuality (Ford et al.

1999, Baird 2002, Bigg et al. 1987) . J-pod was the focus group since they commonly
use S1 (Ford 1999 and Wieland 2007). Recordings will be scanned for S1 calls that are
visually and audibly separate from other calls and boat noise. An ideal situation would
occur when S1 calls are found and it is possible to localize the calls to pinpoint each call
to an individual whale. Had this occurred these files would have been used to address
the second previously stated hypothesis.
Attempts at understanding how the calls are perceived by the SRKWs were
achieved by the following process. Several S1 calls were mapped onto the killer whale
behavioral audiogram to determine what parts of the call are in the critical hearing
range. These calls were first turned into twelfth octave bands in order to properly
display them on the audiogram. Maximum decibel level was calculated and help shift
the call to the level in which it was recorded by the Sound Devices. This help us better
analyze and interpret data.
Calls that measurements were made on had to meet the criteria listed below.
a) The call must be represented visually and audibly.
b) The call must be separate from background noise in the spectrogram.
c) The call must be separate from other calls in the spectrogram. The spectra
of two calls could not overlap one another.
d) A full harmonic must be seen in which start and end components could be
captured. The longest and strongest harmonics were typically used.
S1 calls were analyzed in RavenPro 1.4 beta version build 38 (2003-2010: Cornell Lab
of Ornithology, Ithaca, New York). Measurements made on each call included start and
end time, low and high frequency, center frequency, delta frequency (referred to as
frequency range), delta time (referred to as duration), frequency 95%, max frequency,
and max power.
SeaSounds Data (previously categorized):
a) For understanding categorization: RavenPro 1.4 was used to measure known
calls using features described above based on May-Collado and Wartzok
(2008) for previously categorized calls (S1, S3, S6, S7, S10, S12, and S16).
These calls were chosen for comparison by listening to recordings and looking
at spectrograms of Wieland and Ford to find some similar and some different
calls, with respect to S1. Calls were then put in random order to prevent bias
in determining groupings.
b) Principal component analysis (PCA) was performed to distinguish groups
formed based on measurements taken.
c) Groups from PCA were used to compare to known call type categorizations
previously made.
d) PCA was used to determine what factors if any were causing the separation.
Uncategorized Data:

a) Selections on S1 calls were made given the four criteria above (see Figure 5).
A box was drawn capturing the whole call and all its harmonics. Point
selections were made at the start, peak, and end frequencies of the same
harmonic for each call. A selection was also made on a harmonic directly
below or above where start frequency was measured. (See appendix for
measurements taken on several S1s used.) This allowed for correcting the
frequencies down to the fundamental in order to compare measurements
made on all calls.
b) Selection tables were saved from RavenPro 1.4 and concatenated to provide
a master table with all calls measured. Mean, variance, and standard
deviation were calculated in Numbers (Apple 2009) for each feature
measured.
c) Files were saved as text files and loaded into R (http://www.R-project.org).
Pairs comparison and a PCA on the newly acquired data allowed for
visualization of the S1s based on the features measured.
d) Hierarchical clustering allowed the S1 data set to be divided into groups.
e) T-tests were done on these groups using the factors driving the PCA for the
S1 data set and the SeaSounds data set (peak frequency, start frequency,
center frequency, max frequency, and frequency at 95%).
Results
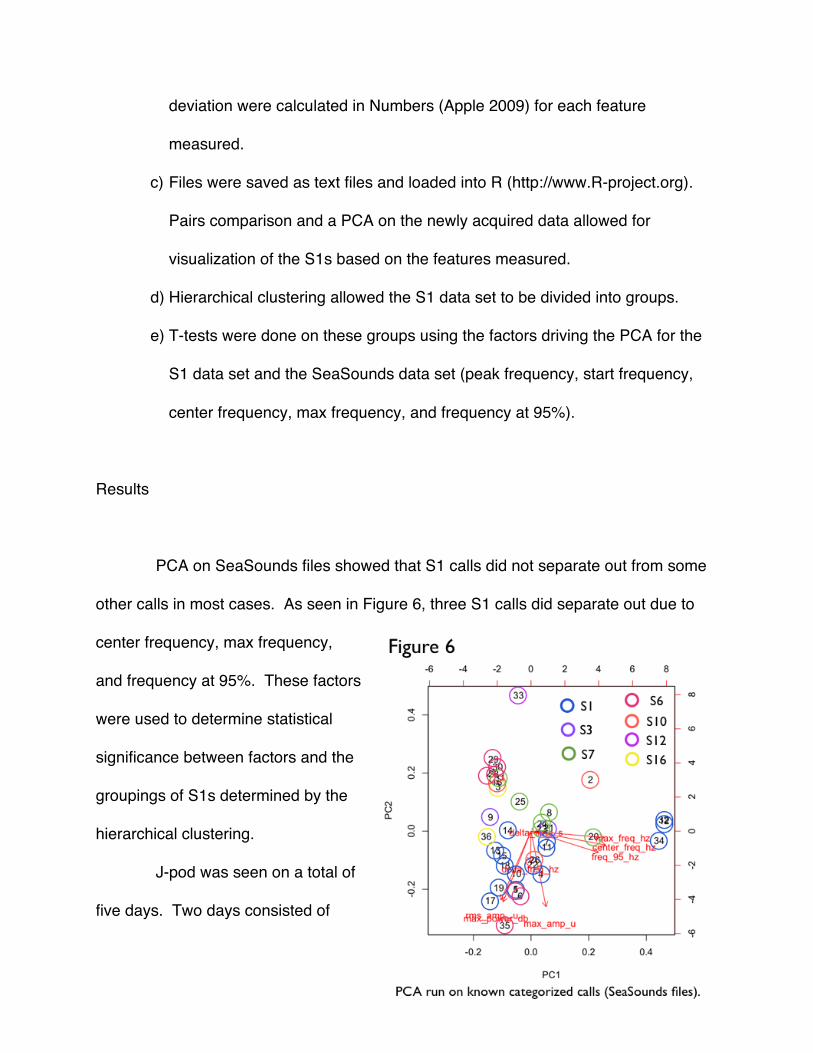
PCA on SeaSounds files showed that S1 calls did not separate out from some
other calls in most cases. As seen in Figure 6, three S1 calls did separate out due to
center frequency, max frequency,
and frequency at 95%. These factors
were used to determine statistical
significance between factors and the
groupings of S1s determined by the
hierarchical clustering.
J-pod was seen on a total of
five days. Two days consisted of
recordings full of vocalizations. The other three days conditions or behavior state made
its difficult to get clear recordings of vocalizations. Due to limitations in time 150 S1
calls were analyzed. Many calls heard could not be used because they did not meet all
of the four criteria discussed previously.
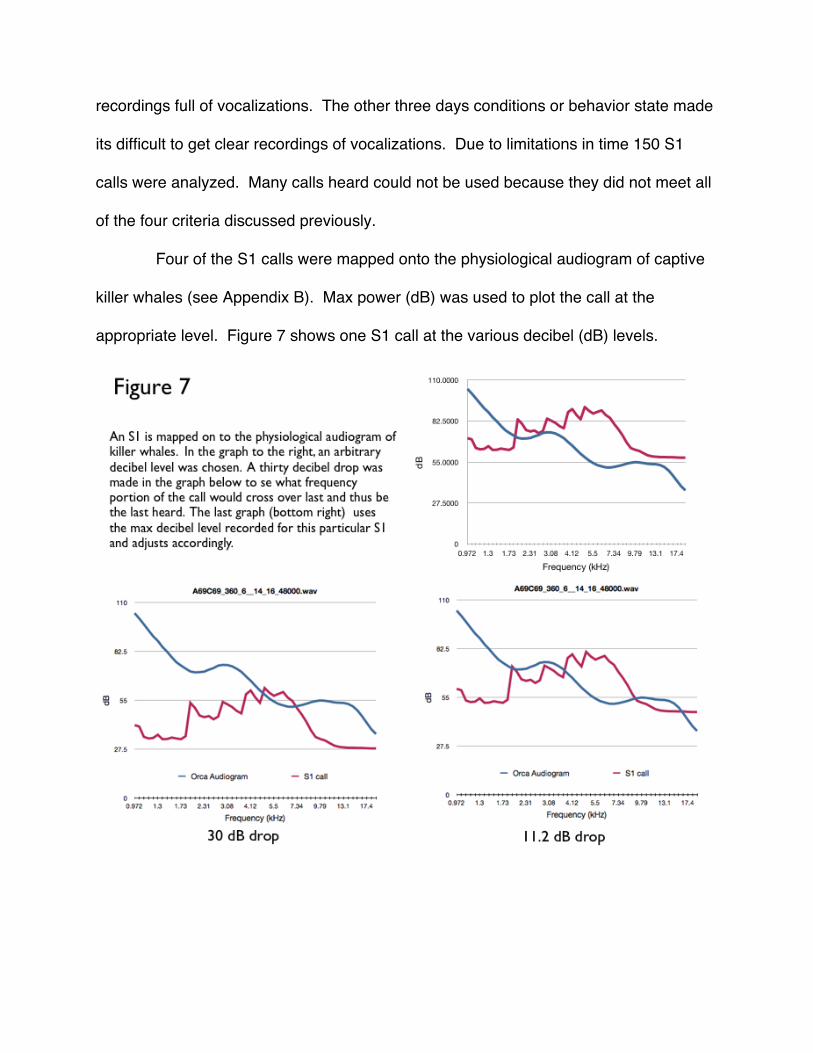
Four of the S1 calls were mapped onto the physiological audiogram of captive
killer whales (see Appendix B). Max power (dB) was used to plot the call at the
appropriate level. Figure 7 shows one S1 call at the various decibel (dB) levels.

The mean , variance, and standard deviation were calculated for all factors
measured on the S1 calls. Variance on all factors was greater than zero. Pairs test
done on the factors in R showed few correlated factors (see appendix).
The S1 calls clustered into three major groups when a hierarchical clustering in
R was performed (see Appendix E). There were 6 calls that formed a small out group.
It was noted that these six calls were from the same recording subset. This led to
proposing the groupings were based were in time the recordings were made in relation
to each other. However no statistical evidence for this was shown. Instead numbers of
calls from each recording was proportional to the number of minutes of different
recordings (see Table 1). The three groups formed were arbitrarily named A, B, and C
(shown in Appendix E). PCA on the S1 data set showed no groupings between S1 calls
(see Appendix D). Peak frequency and start frequency were the main factors driving
principal component 1.
T-tests showed statistical significance existed for distinguishing groups A and B
by both center frequency and max frequency. The same was shown for groups B and
C. However groups A and C were only statistically significant when frequency at 95%
was the factor tested (see Table 2).

Discussion
First understand that the audiogram graphs only show the left have of the
physiological audiogram. This is limited because of the sensitivity of frequency of the
hydrophones. Physiological audiogram was used to account for the hearing of the two
captive killer whales since it is obtained using a repeatable experimentation. In the
case of the behavioral audiogram, we have no sense of how good or poor the hearing of
those two whales is. Since sensitivity occurs amount 20kHz for the killer whales it
would be necessary to see what is happening to the right side. Hydrophones of better
sensitivities will help accomplish this. Doing this may help determine frequencies and
levels at which the whales are unaffected. This could be beneficial in trying to protect
the SRKWs from things like boat noise and pile driving.
The PCA on the SeaSounds files did not provide clear distinctions of S1 from
the other call types looked at. Perhaps this was due to factors that were measured did
not accurately account for all the variation in the S1 calls. Determining more features to
better capture the uniqueness of the S1 calls should be looked at in future research.

Variance was measured for all factors. If no variation was present, all _2 values
would be close to 0. However, all factors varied (_2 > 0). Thus, the null hypothesis can
be rejected. This means that there is variation in the S1 calls. The variation seems to
be occurring due to center frequency, max frequency, and frequency at 95%. As
previously stated, these factors may not be the sole contributors to the variation, but
based on those studied these were significant.
The hierarchical clustering also suggests variation since there are three major
groups that formed. It would be interesting to add many known discrete categorized
calls to see where they lie on the tree. Using cladistic programs and making trees
based on the factors we found significant could also see how the variation in the S1
calls separated them from each other. Examining a few calls that are considered
distant on the tree no obvious differences were noticed. Separating the data by these
groups in more detail may help classify what range of S1 calls exist.
The hypothesis of whether calls from the same individual varied was not
answered. No opportunities arose in the data collecting days in this study in which only
a few whales were present and thus sounds could be localized to individuals. Closer
examination of archived files may turn up files that could be used to asses this
hypothesis. This too is an important question. Knowing what whale is calling based on
the variation of the call could aid in monitoring efforts using the hydrophones.
Given restricted time during this study period only 150 calls were analyzed from
two days with J-pod. More calls would only strengthen the data set. Also changes over

time could be examined. This could provide more evidence that the calls are getting
louder or longer over time as seen in Holt (2009). These findings may prove vital in
establishing no go zones for the whales and finding new ways to help conserve this
endangered species.
Conclusion
Variation in S1 calls does exist. Further research could pinpoint if the variation
is due to a different number of individuals calling or due to some other environmental
factor such as increased boat noise. When many instances like this occur were
separation of calls can be made down to the individual, cladistics should be used to
make a tree inference. This tree could then be compared to trees from photo id projects
and from genome sequencing.
It would also be beneficial to see if the same kind of variation occurs for call
types other than S1. A greater quantity of calls over a larger time span would also help.
This study only scratches the surface in trying to determine variation in calls. Many
other factors could be put into consideration.
Appendices
Appendix A
Appendix B

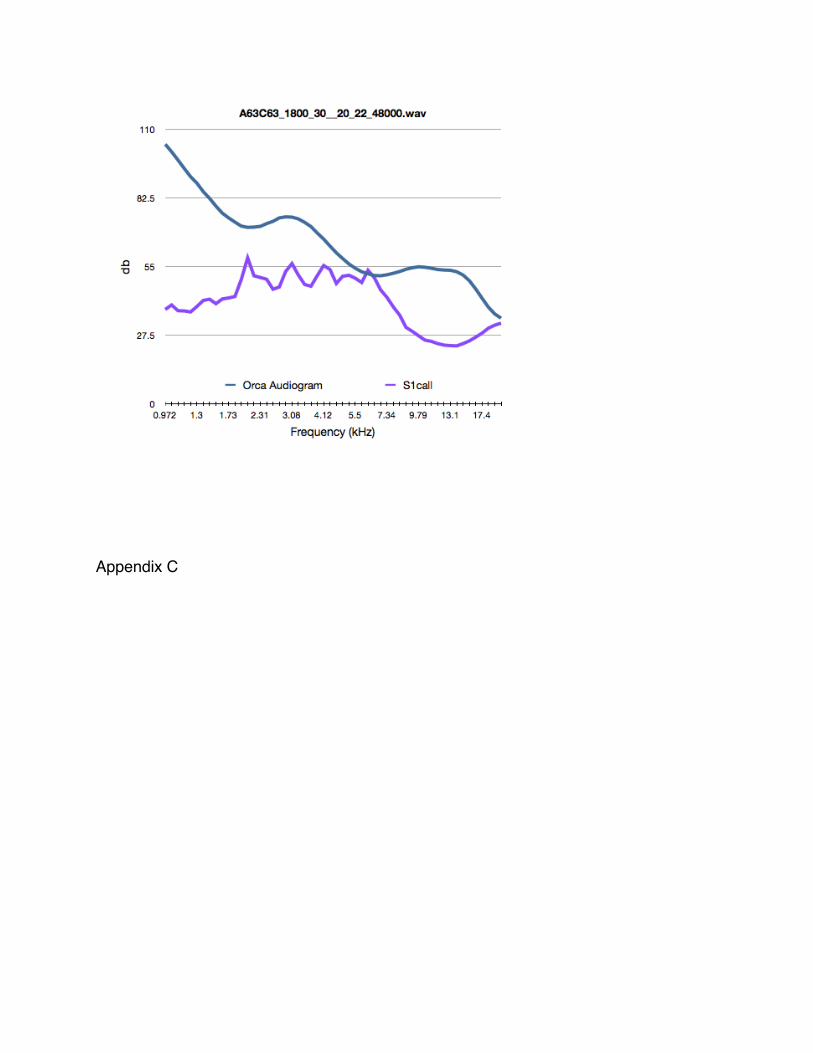
Appendix C

Appendix D

PCA analysis for SeaSounds files
PCA analysis for S1 data
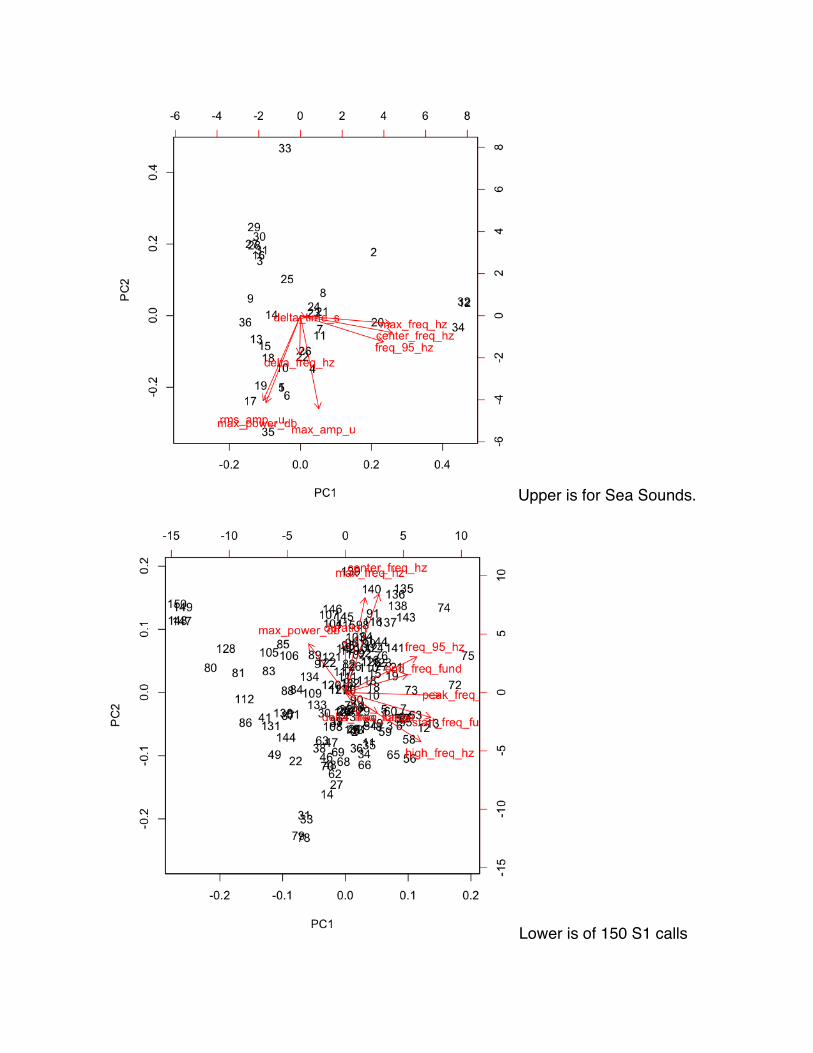
Upper is for Sea Sounds.
Lower is of 150 S1 calls

AppendixE

References

Bain, David. Communication of killer whales. Beam Reach. University of Washington.Friday Harbor Labs. 12 April 2011
Bain, David. Acoustic Behavior of Orcinus. Behavioral biology of killer whales. 335-371.1986
Baird, Robin W. The killer whale: foraging specializations and group hunting. Cetaceansocieties: field studies of dolphins and whales. Edited by J. Mann, R.C. Connor,P.L. Tyack and H. Whitehead. University of Chicago Press, Chicago. 127-153.2000.
Baird, Robin W. Killer whales of the world: natural history and conservation. St. Paul, MN. Voyager Press. 2006
Bigg, Michael A., Ellis, Graeme M., Ford, John K. B., and Balcomb, Kenneth C. Killerwhales: a study of their identification, genealogy and natural history in BritishColumbia and Washington State. Nanaimo, British Columbia. Phantom Pressand Publishers Inc. 1987
Caldwell,M.C.&Caldwell,D.K. Individualized whistle contours in bottlenose dolphins (Tursiops truncatus). Nature 207:434-435. 1965
Caldwell, M. C., Caldwell, D. K. & Tyack, P. L. Review of the signature whistlehypothesis for the Atlantic bottlenose dolphin, Tursiops truncatus. The BottlenoseDolphin. Edited by S. Leatherwood & R. R. Reeves. 199-234. San Diego: Academic Press. 1990
Center for Whale Research. http://www.whaleresearch.com/research.html. AccessedApril 2011.
Deecke, V. B., Ford, J. K. B., and Spong, P. Quantifying complex patterns ofbioacoustic variation: Use of a neural network to compare killer whale (Orcinusorca) dialects. Journal of the Acoustical Society of America. 105(4). 2400-2507.1999
Erbe, Christine. Underwater acoustics: noise and the effects on marine mammals, apocket handbook. 3rd edition. JASCO Applied Sciences. 2011
Fagen, Robert M. and Young, Donald Y. Temporal patterns of behaviors: durations,intervals, latencies, and sequences. Edited by Colgan, Patrick W. QuantitativeEthology. New York. John Wiley & Sons Inc. 79-114. 1978
Foote, Andrew D. and Nystuen, Jeffrey A. Variation in call pitch among killer whaleecotypes. Acoustical Society of America 1747-1752. 2008

Ford, John K.B. A Catalogue of Underwater Calls Produced By Killer Whales (Orcinus orca) in British Columbia. Canadian Data Report of Fisheries and Aquatic Sciences. 633. 1987
Ford, J K B Acoustic behavior of resident killer whales (Orcinus orca) off Vancouver Island, British Columbia. Canadian Journal of Zoology 67: 727-745. 1989
Ford, J. K. B., Ellis, G. M., Barrett-Lennard, L. G., Morton, A. B., Palm, R. S., and Balcomb, K. C. Dietary specialization in two sympatric populations of killerwhales (Orcinus orca) in coastal British Columbia and adjacent waters. CanadianJournal Of Zoology. 1471. 1456-1471. 1998
Ford, John K.B. and Fisher, Dean H. Group specific dialects of killer whales (Orcinusorca) in British Columbia. Edited by Roger, Payne. Communication and Behaviorof Whales. Boulder. Westview Press, Inc. 129-161. 1983
Ford, John K.B., Ellis, Graeme M., and Balcomb, Kenneth C. Killer Whales. Vancouver.UBC Press. 1999
Holt, Marla M. Sound exposure and Southern Resident Killer Whales: a review ofcurrent knowledge and data gaps. Fisheries Bethesda. 59. 2008
Holt, M. M., Noren, D. P., Veirs, V., Emmons, C. K., & Veirs, S. Speaking up: killerwhales (Orcinus orca) increase their call amplitude in response to vessel noise.The Journal of the Acoustical Society of America, 125(1), EL27. 2009
Hoelzel, Rus A. Killer whale call characteristics: Implications for cooperative foragingstrategies. Behavioral biology of killer whales. 373-403. 1986
Janick, V. M. and Slater, P. J. B. Context-specific use suggests that bottlenose dolphin signature whisltes are cohesion calls. Animal Behavior. 56: 829-838. 1998
Manser, Martha B. Response of foraging group members to sentinel calls in suricates, Suricata suricatta. Proceedings of the Royal Socociety B. 266. 1013-1019. 1999
May-Collado, Laura and Wartzok, Douglas. A comparison of bottlenose dolphins in theAtlantic Ocean: factors promoting whistle variation. Journal of Mammalogy.89(5). 1229-1240. 2008
National Marine Fisheries Service. Recovery Plan for Southern Resident Killer Whales(Orcinus orca). National Marine Fisheries Service. Northwest Region. Seattle.2008

Olesiuk, P. F., Bigg, M. A., and Ellis, G. M. Life history and population dynamics ofresident killer whales (Orcinus orca) in the coastal waters of British Columbia andWashington State. Report of the International Whaling Commission, Special Issue12. 209-243. 1990
Richardson, W. J., Greene Jr., C. R., Malme, C. I., and Thomson, D. H. Marinemammals and noise. Academic Press. San Diego, California. 1995
Sayigh, Laela S., Tyack, Peter L., Wells, Randall S., and Scott, Michael D. Signature whistles of free-ranging bottlenose dolphins Tursiops truncatus: stability and mother-offspring comparisons. Behavioral Ecology and Sociobiology. 26:4. 247-260. 1990
Smith, J., Goldizen, A., Dunlop, R., & Noad, M. Songs of male humpback whales,Megaptera novaeangliae, are involved in intersexual interactions. AnimalBehaviour, 76(2), 467-477. 2008
Szymanski, M. D., Bain, D. E., Kiehl, K., Pennington, S., Wong, S., and Henry, K. R.Killer whale (Orcinus orca) hearing: Auditory brainstem response and behavioralaudiograms. Journal of the Acoustical Society of America. 106(2). 1134-1141.1999
Weiß, B. M., Ladich, F., Spong, P., and Symonds, H. Vocal behavior of resident killerwhale matrilines with newborn calves: The role of family signatures. Journal of theAcoustical Society of America 119: 627–635. 2006
The Whale Museum. http://www.whalemuseum.org/seasound/ref.html. Accessed April2011
Washington State Board of Natural Resources. State board on geographic namesapproves ʻSalish Seaʼ.http://www.dnr.wa.gov/ResearchScience/News/Pages/nr09_177.aspx. 30 October2009. Accessed April 2011
Washington State Parks. Lime Kiln Point.http://www.parks.wa.gov/parks/?selectedpark=Lime%20Kiln%20Point. AccessedApril 2011
Wieland, Monika. 2007. Repertoire usage of the Southern Resident Community of KillerWhales (Orcinus orca) (Masterʼs thesis). Reed College, Portland, OR.
Wieland, M., Jones, A. and Renn, S. C. P. Changing durations of southern residentkiller whale (Orcinus orca) discrete calls between two periods spanning 28 years. Marine Mammal Science. 26. 195–201. 2010