Variation in Black Bear Home Ranges in Relation to Preferred Foods in Sequoia & Kings Canyon Nat’l...
26
Variation in Black Bear Home Ranges in Relation to Preferred Foods in Sequoia & Kings Canyon Nat’l Parks Rachel Mazur, Karen Folger, and Pete Klimley
-
Upload
duane-jennings -
Category
Documents
-
view
214 -
download
1
Transcript of Variation in Black Bear Home Ranges in Relation to Preferred Foods in Sequoia & Kings Canyon Nat’l...

Variation in Black Bear Home Ranges in Relation to Preferred
Foods in Sequoia & Kings Canyon Nat’l Parks
Rachel Mazur, Karen Folger, and Pete Klimley

Location of Sequoia and Kings Canyon, National Parks within California


Research Questions:1. How much do the sizes of black bear home
ranges vary by year?
2. Is it possible to explain any variation by measuring the availability of critical fall foods?
3. Are bears exhibiting preferences among habitat types or simply using them in proportion to their availability?
4. Are there fewer human-bear incidents when bears are foraging on higher quality foods?
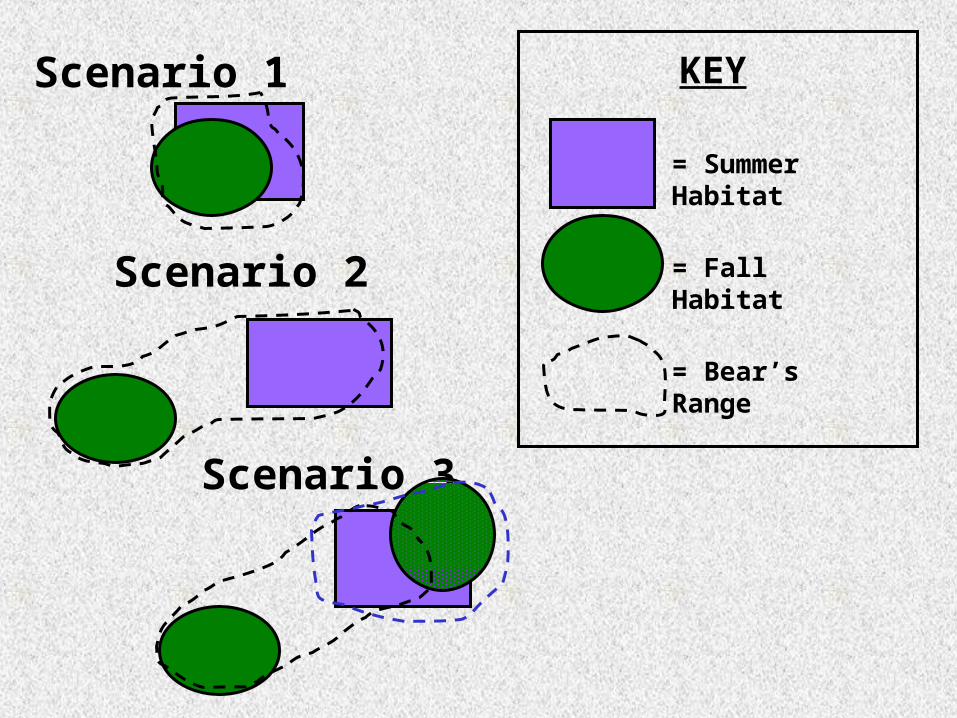
Scenario 1
Scenario 2
Scenario 3
= Summer Habitat
= Fall Habitat
KEY
= Bear’s Range


GPS Radio Collars• Wild adult female bears
• Store-on-board units – programmed to fall off
• Locations recorded every hour (Aug-Oct)
• 1 Bear in 2004
• 10 Bears each in 2005 and 2006
• 1 Bear had data for both 2004 and 2005
• 5 Bears had data for both 2005 and 2006

1 3 42
Core Area Mapping from GPS points
• Kernals used to calculated home ranges using Home Range Tools extension to ArcGIS• Old days used VHF telemetry with a few points to estimate• Core areas are most used areas within Home Range

0
5
10
15
20
25
30
August September October
Month
Siz
e (k
m2)
2004
2005
2006
0.0
0.5
1.0
1.5
2.0
2.5
3.0
August September October
Month
Siz
e o
f C
ore
Are
a (k
m2) 2004
2005
2006
Total Habitat Area – All Bears
Core Habitat Area – All Bears


05
101520
2530
2004 2005 2006
Year
Co
un
tsa
co
rns
/ 3
0 s
Canyon Oak
05
101520
2530
2004 2005 2006
Year
Co
un
tsa
co
rns
/ 3
0 s
Int. Live Oak
05
101520
2530
2004 2005 2006
Year
Co
un
tsa
co
rns
/ 3
0 s Blue Oak
05
101520
2530
2004 2005 2006
Year
Co
un
tsa
co
rns
/ 3
0 s BlackOak
Variation in annual acorn crops in Sequoia National Park 2004-2006


Sugar Pine Habitat
Oak Habitat


2004 Bear

2005 Bear

0.0
0.5
1.0
1.5
2.0
2.5
3.0
1 2 3 4 5 6 7 8 9
Weeks (September and October)
Lo
g V
alu
esPercentage ofSugar Pine
Size of Core Area
0.0
0.5
1.0
1.5
2.0
2.5
3.0
1 2 3 4 5 6 7 8 9
Weeks (September and October)
Lo
g o
f V
alu
es
Percentage of Oak
Size of Core Area
Relationships between food source availability and core use areas
2005
2006


Scenario 1
Scenario 2
Scenario 3
= Summer Habitat
= Fall Habitat
KEY
= Bear’s Range

0.00
1.00
2.00
3.00
4.00
5.00
6.00
7.00
8.00
1 2 3 4 5 6 7 8 9 10 11 12 13
Weeks (August - October)
Nu
mb
er o
f D
ays
wit
h I
nci
den
ts
2005
2006
Human-Bear Incidents
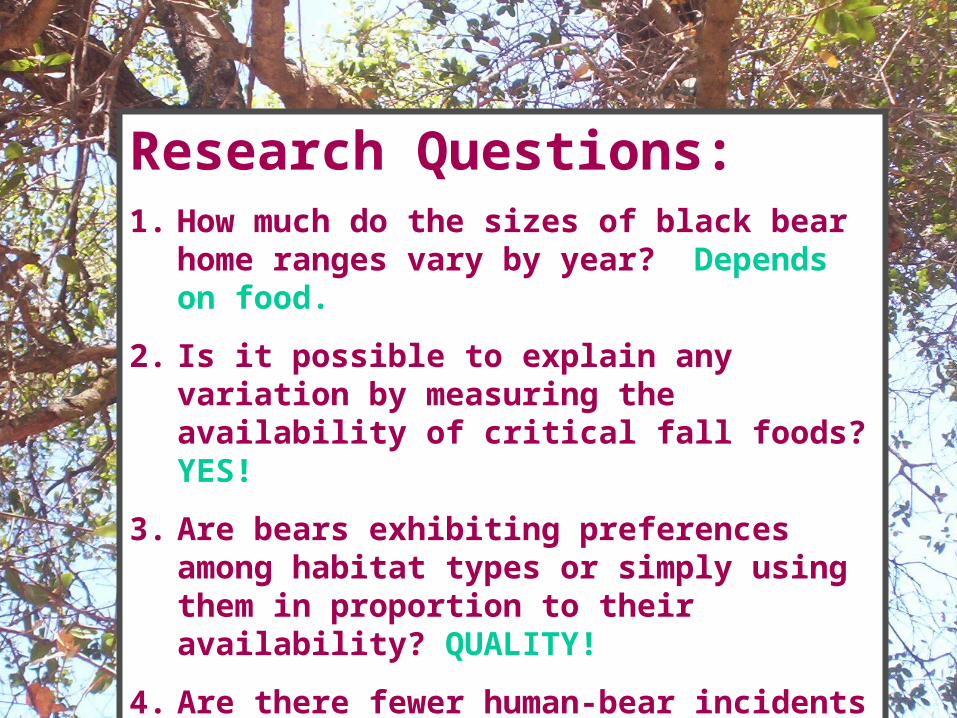
Research Questions:1. How much do the sizes of black bear home
ranges vary by year? Depends on food.
2. Is it possible to explain any variation by measuring the availability of critical fall foods? YES!
3. Are bears exhibiting preferences among habitat types or simply using them in proportion to their availability? QUALITY!
4. Are there fewer human-bear incidents when bears are foraging on higher quality foods? YES!

2007 and 2008 Data• 9 Collars on in 2007 for 2 years
• Collars to fall off October 31, 2008

Please save the bears.