Variation in ages and growth rates of trees in Amazonian tropical forests: consequences for carbon...
23
Variation in ages and growth rates of trees in Amazonian tropical forests: consequences for carbon and forest management Simone Vieira, Plínio Camargo, Luiz Martinelli (CENA) Susan Trumbore (UCI), Jeff Chambers (Tulane), Niro Higuchi (INPA)
-
Upload
luis-sandoval -
Category
Documents
-
view
214 -
download
0
Transcript of Variation in ages and growth rates of trees in Amazonian tropical forests: consequences for carbon...

Variation in ages and growth rates of trees in Amazonian tropical forests: consequences for
carbon and forest management
Simone Vieira, Plínio Camargo, Luiz Martinelli (CENA)
Susan Trumbore (UCI), Jeff Chambers (Tulane), Niro Higuchi (INPA)
Diogo Selhorst, Foster Brown (SETEM)
Our questions – CD-08
What is the capacity for these forests to store C?Where could it be stored and for how long?
Our approach – CD-08
Look at components of C fluxes: This specific work: changes in living tree C stocks, and the environmental variables that control them.
Use radiocarbon to determine the residence time of carbon in trees and soils

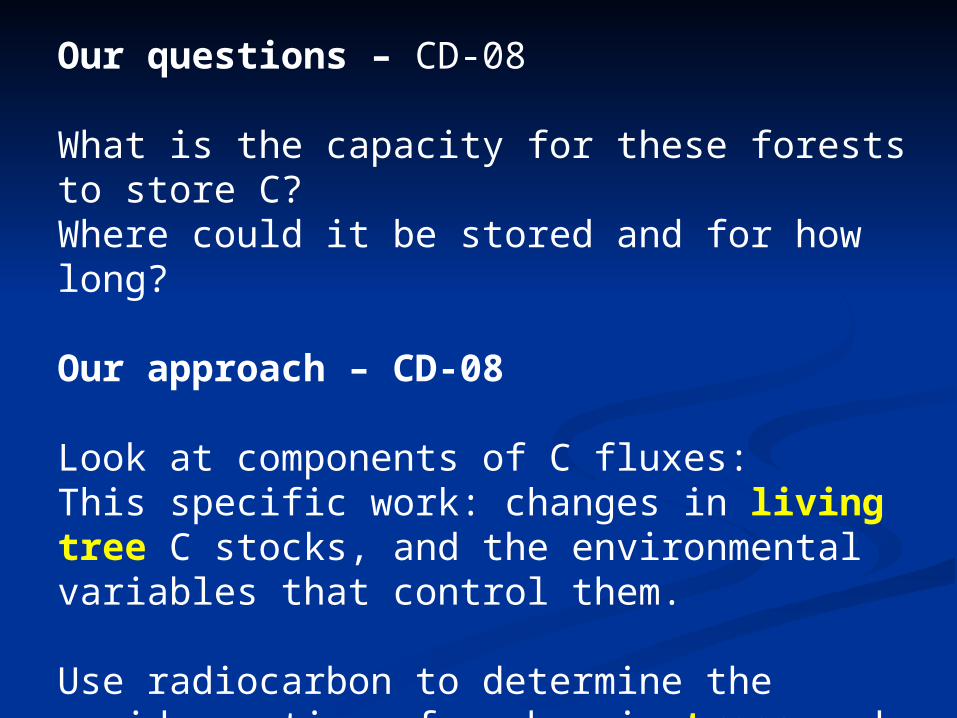
ManausZF2 Reserve
Rio Branco - Catuaba Exp. Farm
SantarémTapajos National Forest
Rio Branco
Manaus
Santarém
Field sites
All terra firme forestSoils are OxisolsVariation in dry season lengthShortest in Manaus, longer in Rio Branco, Santarém
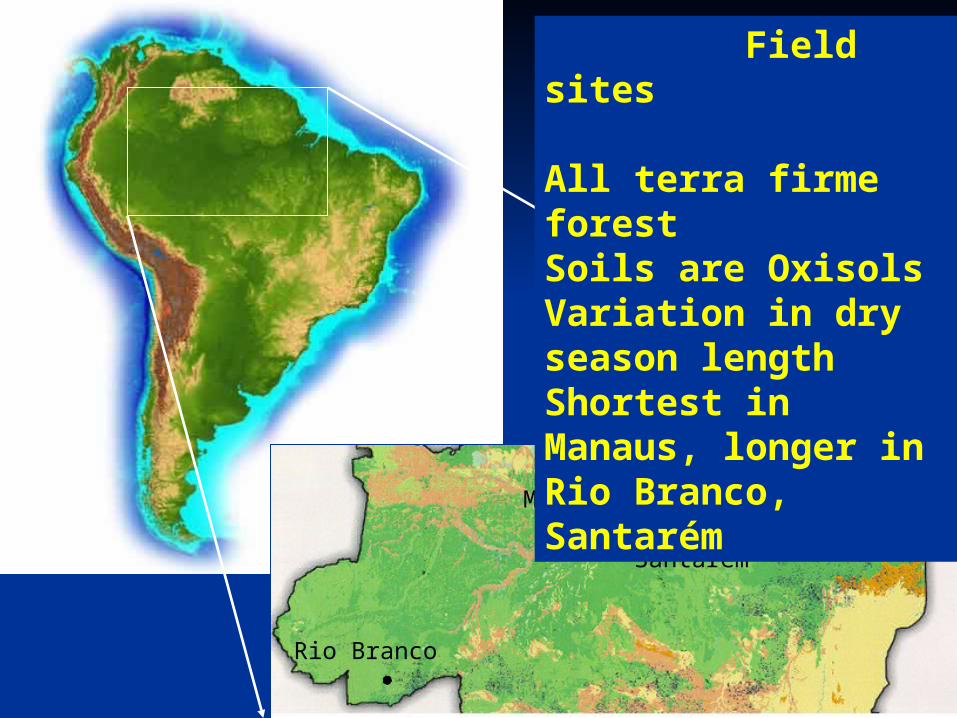
Trees
How old are tropical trees?
How fast do they grow?
How long do they store carbon?
How do characteristics vary across the Amazon basin?

Measurement of tree diameter during establishment of permanent plot

= 122.51e-0.4418x
= 470.26e-0.6893x
= 108.64e-0.454x
0.0001
0.001
0.01
0.1
1
10
100
1000
10-19,930-39,9
50-59,970-79,9
90-99,9
110-119,9
130-139,9
150-159,9
170-179,9
190-199,9
Classe de Diâmetro
ln in
diví
duos
.ha-1
Manaus
Rio Branco
Santarém
Stem frequency in DBH Class (stem ha-1)
Manaus (626), Rio Branco (467) and Santarém (460)

0
10
20
30
40
50
60
70
80
90
10-2020-30
30-4040-50
50-6060-70
70-8080-90
90-100
100-110> 110
DBH Class
Bio
mas
s (M
g.ha
-1)
Manaus
Rio Branco
Santarém
Bio
mas
s (M
g ha
-1)
Tree diameter class (cm)
Not all forests in the Amazon are equalManaus has more biomass overall, in smaller trees,than sites with a more pronounced dry season
Manaus Rio Branco Santarém 626 466 460 trees ha-1
180 95 141 Mg C ha-1
40 45 56 cm (DBH mean)
Vieira et al., 2004

Growth rates from dendrometer bands

Growth rates vary seasonally with rainfall, though not simply
Man
aus
DM
DV
(m
day
-1)
-5
0
5
10
15
0
5
10
15
20
25
30
Rainfall Diameter Variation
Rai
nfal
l (m
m d
ay-1
)
Rio
Bra
nco
DM
DV
(m
day
-1)
0
5
10
15
20
25
0
2
4
6
8
10
12
Rai
nfal
l (m
m d
ay-1
)
S
anta
rém
DM
DV
(m
day
-1)
-5
0
5
10
15
20
25
Apr-0
0
Jul-0
0
Oct-00
Jan-
01
Apr-0
1
Jul-0
1
Oct-01
Jan-
02
Apr-0
2
Jul-0
2
Oct-02
0
3
6
9
12
15
R
ainf
all (
mm
day
-1)
Mean annual growth increment –
Manaus 1.7 mm yr-1
Rio Branco 3.8 mm yr-1
Santarém 3.1 mm yr-1
Biomass increment in living trees
~ 2 Mg C ha-1 yr-1 all three sites

Radiocarbon Sample


Tree age (radiocarbon)Tree age (radiocarbon)
0
200
400
600
800
1000
1200
0 10 20 30 40 50 60 70 80 90 100110120130140
DBH (cm)
Tre
e ag
e (y
ears
)
Manaus Rio Branco Santarém

Radiocarbon and dendrometer based estimates of growth agree
mm
/yr
from
den
drom
eter
ban
ds
mm/yr from DBH and radiocarbon age
>50cm
30-50cm
10-30cmRio Branco
Manaus
SantaremSantarem
1:1
0
0,1
0,2
0,3
0,4
0,5
0,6
0,7
0,0 0,1 0,2 0,3 0,4 0,5 0,6 0,7
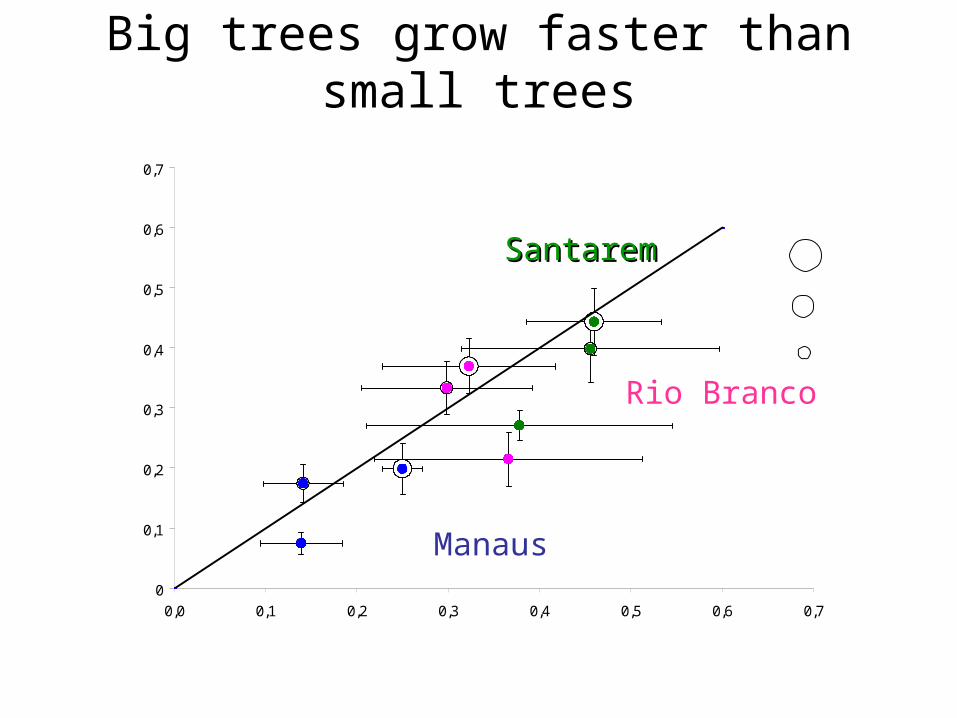
Big trees grow faster than small treesm
m/y
r fr
om d
endr
omet
er b
ands
mm/yr from DBH and radiocarbon age
>50cm
30-50cm
10-30cmRio Branco
Manaus
SantaremSantarem
1:1
0
0,1
0,2
0,3
0,4
0,5
0,6
0,7
0,0 0,1 0,2 0,3 0,4 0,5 0,6 0,7

Trees in Manaus (central Amazon) grow much slower than other areas
mm
/yr
from
den
drom
eter
ban
ds
mm/yr from DBH and radiocarbon age
>50cm
30-50cm
10-30cmRio Branco
Manaus
SantaremSantarem
1:1
0
0,1
0,2
0,3
0,4
0,5
0,6
0,7
0,0 0,1 0,2 0,3 0,4 0,5 0,6 0,7
0
40
80
120
160
200
240
0-50 50-100 100-300 300-500 >500
Age Class (years)
ste
m h
a-1
Manaus Rio Branco Santarem
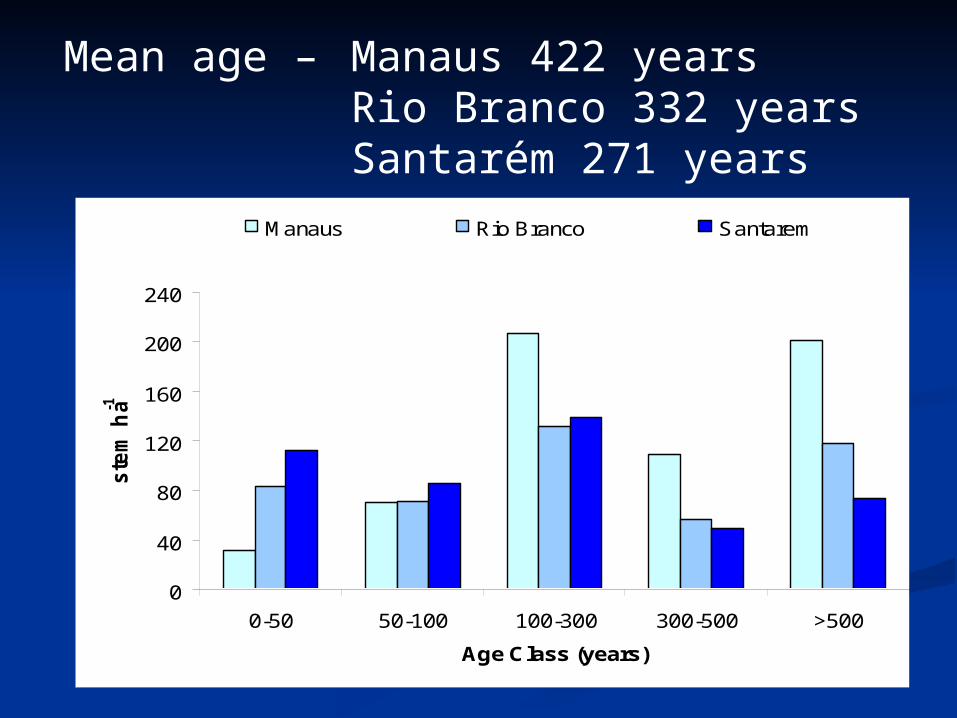
Mean age – Manaus 422 yearsRio Branco 332 years Santarém 271 years

0
20
40
60
80
100
120
140
160
180
10-30
30-50
>50
No
Indi
vidu
als/
ha
Manaus
Santarém Rio Branco
Trees can be oldExtrapolating growth rates, we estimate >20% of all trees and 15-35% of trees 10-30 cm diameter are
>300 yrs old
Age of individuals estimated from diameter/growth rate (yr)
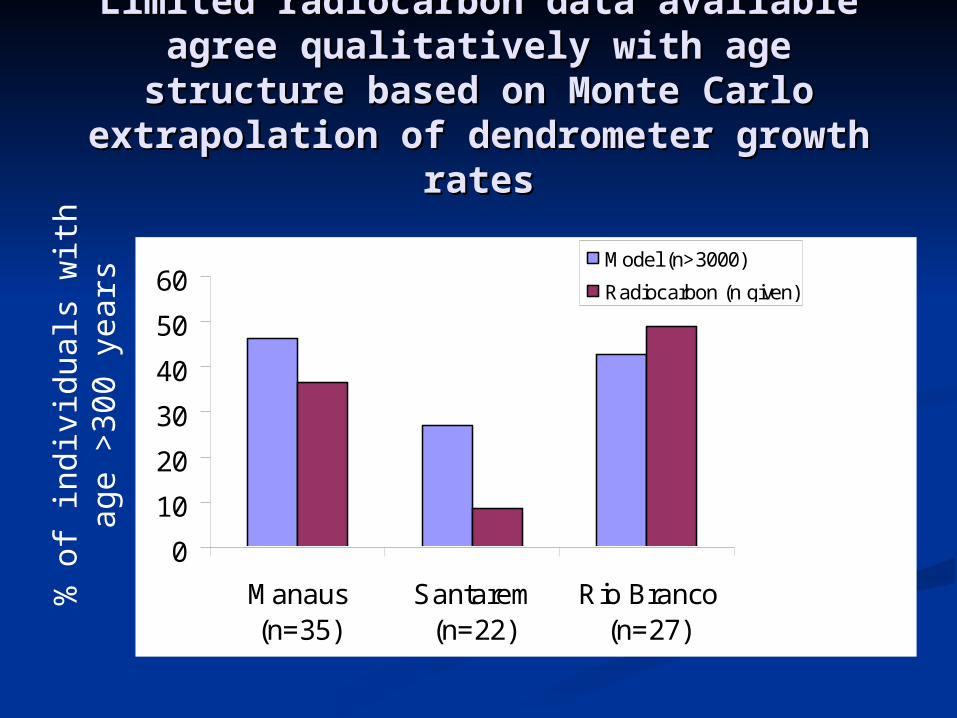
Limited radiocarbon data available Limited radiocarbon data available agree qualitatively with age structure agree qualitatively with age structure based on Monte Carlo extrapolation of based on Monte Carlo extrapolation of
dendrometer growth ratesdendrometer growth rates
0
10
20
30
40
50
60
Manaus(n=35)
Santarem(n=22)
Rio Branco(n=27)
Model (n>3000)
Radiocarbon (n given)
% o
f in
divi
dual
s w
ith a
ge >
300
year
s

Trees Trees <10cm<10cm DBH sampled in Rio DBH sampled in Rio Branco (Catuaba Reserve) support Branco (Catuaba Reserve) support
this picture:this picture:6 of 18 (33%) had ages >45years6 of 18 (33%) had ages >45years
0
1
2
3
4
5
1 to 10 10 to 20 20 to 30 30 to 45 >45
Clearing
intact forest
Basal age (years) from radiocarbon
No
of in
divi
dual
s

Manaus
Santarém Rio Branco
Individuals/ha 626 460 466Biomass C MgC/ha 180 141 95Growth MgC/ha/yr 1.6-2.1 2.2 -3.0 3.3-3.4Mean age of C (yr)* 260 220 240 MRT of C (stock/growth)** 114 74 53 * From monte carlo simulations **biomass-weighted Data from Vieira et al. 2004
C dynamics differ with forest location
Low carbon use efficiency (NPP/GPP ~ 30% Low carbon use efficiency (NPP/GPP ~ 30% at Manaus and Santarat Manaus and Santaréém sites)m sites)
~25% of NPP used for wood growth at ~25% of NPP used for wood growth at Manaus (data pending for other sites) Manaus (data pending for other sites)
Although biomass may recover quickly Although biomass may recover quickly through fast-growing pioneer species, slow through fast-growing pioneer species, slow growing species (therefore biodiversity) will growing species (therefore biodiversity) will take centuries to recover from disturbance take centuries to recover from disturbance
Implications of low growth rates: Implications of low growth rates: