Natalia Restrepo-Coupe, Brad Christoffersen, Daniel F. Amaral, Plínio B. de Camargo;
20
Natalia Restrepo-Coupe, Brad Christoffersen, Daniel F. Amaral, Plínio B. de Camargo; Scott R. Saleska Carbon loss on the other side of drought: excess wet season precipitation during La Niña suppresses Amazon forest photosynthesis
-
Upload
sonia-moody -
Category
Documents
-
view
19 -
download
1
description
Carbon loss on the other side of drought: excess wet season precipitation during La Niña suppresses Amazon forest photosynthesis. Natalia Restrepo-Coupe, Brad Christoffersen, Daniel F. Amaral, Plínio B. de Camargo; Scott R. Saleska. - PowerPoint PPT Presentation
Transcript of Natalia Restrepo-Coupe, Brad Christoffersen, Daniel F. Amaral, Plínio B. de Camargo;

Natalia Restrepo-Coupe, Brad Christoffersen, Daniel F. Amaral, Plínio B. de Camargo; Scott R. Saleska
Carbon loss on the other side of drought: excess wet season precipitation during La Niña suppresses Amazon forest photosynthesis

Motivation: will Amazon forest die-back with future climate change?
Adapted from: Cox et al., 2003, Amazon Dieback under Climate-Carbon Cycle Projections for the 21st Century
1 2 3 4 5 6 7 8 Mean daily temperature
change(K)
-3 -2 -1 -0.5 0.5 1 2 3Precipitation change (mm day-1)
-8 -4 -2 -1 1 2 4 8Change in Vegetation Carbon (kg C m-2)
180 90W 090 N
45 N
0
45 S
90S
Differences relative to 1990 - 2090 mean
180 90W 0
180 90W 0

Motivation: August 2008 – June 2008 La Niña Event
El Niño
La Niña
neutral
La Niña ONI value for ASO 2007 – AMJ 2008 is -1.4oCThe most recent ONI value (July – September 2009) is +0.8oC.
Source: http://www.cpc.ncep.noaa.gov/products/analysis_monitoring/enso_advisory/
Oceanic Nino Index, ONI (ERSST.v3b ONI)Upper ocean heat anomalies (1991 -2009)
Se
a S
urf
ac
e T
em
pe
ratu
reA
no
mli
es
(C
)
4
3
2
1
0
-1
-2
-3
1990 1992 1994 1996 1998 2000 2002 2004 2006 2008 2010

Motivation: 2008 – June 2008 La Niña Event
La Niña
neutral
Source: http://www.cpc.ncep.noaa.gov/
Oceanic Nino Index, ONI (ERSST.v3b ONI)Upper ocean heat anomalies (1991 -2009)
Se
a S
urf
ac
e T
em
pe
ratu
reA
no
mli
es
(C
)
4
3
2
1
0
-1
-2
-3
1990 1992 1994 1996 1998 2000 2002 2004 2006 2008 2010
NOV JAN MAR MAY JUL 2008 2009
Se
a S
urf
ac
e T
em
pe
ratu
reA
no
mli
es
(C
)
1.5
1
0.5
0
-0.5
-1
-2
Tropical Rainfall Measuring Mission (TRMM) data, at 0.25 spatial resolution 1998 – 2009 [NASA, 2006]
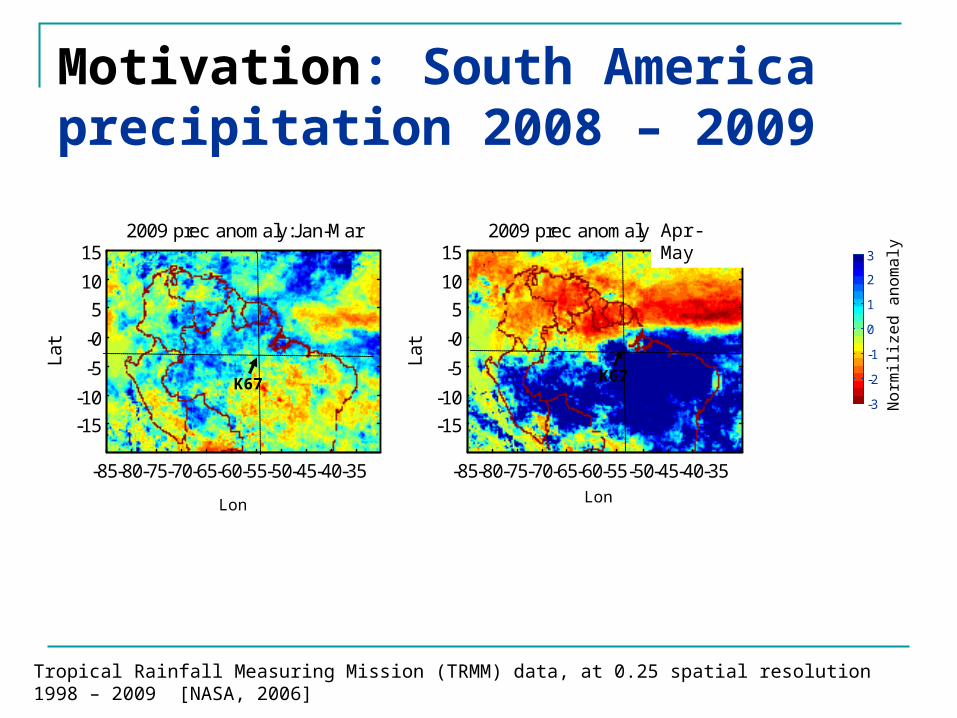
Motivation: South America precipitation 2008 – 2009La
t
Lon
2009 prec anomaly:Jan
-79 -74 -69 -64 -59 -54 -49 -44 -39
8
3
-2
-7
-12
Lat
Lon
2009 prec anomaly:Feb
-79 -74 -69 -64 -59 -54 -49 -44 -39
8
3
-2
-7
-12
Lat
Lon
2009 prec anomaly:Mar
-79 -74 -69 -64 -59 -54 -49 -44 -39
8
3
-2
-7
-12
Lat
Lon
2009 prec anomaly:Apr
-79 -74 -69 -64 -59 -54 -49 -44 -39
8
3
-2
-7
-12
Lat
Lon
2009 prec anomaly:May
-79 -74 -69 -64 -59 -54 -49 -44 -39
8
3
-2
-7
-12
-3
-2
-1
0
1
2
3
No
rmili
zed
an
om
aly
Lat
Lon
2009 prec anomaly:Jan-Mar
-85-80-75-70-65-60-55-50-45-40-35
15
10
5
-0
-5
-10
-15La
t
Lon
2009 prec anomaly:Apr-Jun
-85-80-75-70-65-60-55-50-45-40-35
15
10
5
-0
-5
-10
-15
Lat
Lon
2009 prec anomaly:Jul-Sep
-85-80-75-70-65-60-55-50-45-40-35
15
10
5
-0
-5
-10
-15
Lat
Lon
2009 prec anomaly:Oct-Dec
-85-80-75-70-65-60-55-50-45-40-35
15
10
5
-0
-5
-10
-15
Lon
K67
Lon
K67
Apr-May

… on the other side of drought …
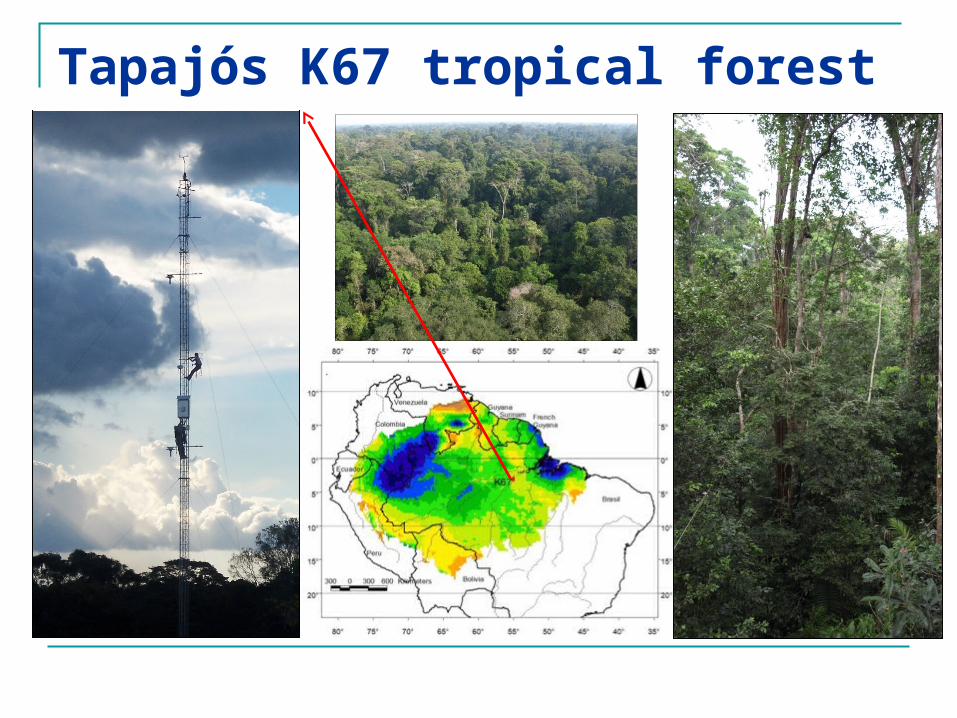
Tapajós K67 tropical forest

A S O N D J F M A M J J23
26
29
Tai
r ( C
)
Tapajós K67 tropical forest: Climate
Hydrological year: Dry season – Wet seasonHY2002: Aug 1, 2002 – Jul 31, 2003 HY2003: Aug 1, 2003 – Jul 31, 2004HY2004: Aug 1, 2004 – Jul 31, 2005 HY2005: Aug 1, 2005 – Jan 6, 2006HY2008: Aug 1, 2008 – Jul 31, 2009
A S O N D J F M A M J J0
125
250
Pre
cip
(m
m w
ee
k-1
)
A S O N D J F M A M J J400
800
1200
PA
R ( m
ol m
-2 s
-1)
Aug 2008 – Jul 2009
dry season wet season
dry season wet season
dry season wet season
NE
E (
kgC
ha-1
)
K67
-1000
0
1000
2000
3000
4000
5000
pre
c (m
m)
K67
A S O N D J F M A M J J0
500
1000
1500
2000HY2002HY2003HY2004HY2005HY2008HY2009

NE
E (
kgC
ha-1
)
K67
-1000
0
1000
2000
3000
4000
5000
pre
c (m
m)
K67
A S O N D J F M A M J J0
500
1000
1500
2000HY2002HY2003HY2004HY2005HY2008HY2009
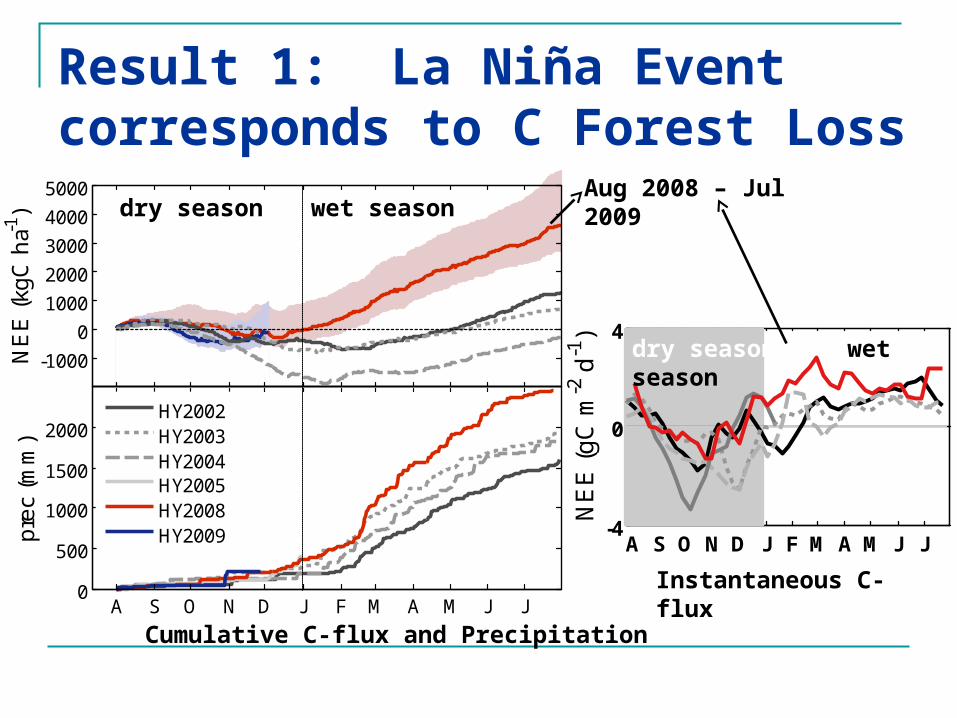
Result 1: La Niña Event corresponds to C Forest Loss
Net ecosystem exchangeForest C losses
Forest C uptake
dry season wet seasonAug 2008 – Jul 2009
A S O N D J F M A M J J-4
0
4
NE
E (
gC
m-2
d-1
)
NE
E (
kgC
ha-1
)
K67
-1000
0
1000
2000
3000
4000
5000
pre
c (m
m)
K67
A S O N D J F M A M J J0
500
1000
1500
2000HY2002HY2003HY2004HY2005HY2008HY2009
dry season wet season
Result 1: La Niña Event corresponds to C Forest Loss
dry season wet season
Aug 2008 – Jul 2009
Instantaneous C-flux
Cumulative C-flux and Precipitation

A S O N D J F M A M J J-4
0
4
NE
E (
gC
m-2
d-1
)
What is the cause of C-loss? (split into photosynthesis & respiration)
NEE: Net Ecosystem ExchangeR: Ecosystem RespirationGEE: Gross Ecosystem Productivity
~ Photosynthetic activity
Hig
her
C u
ptak
eH
ighe
r C
loss
es
NEE = R + GEE
dry season wet season
NE
E (
kgC
ha-1
)
K67
-1000
0
1000
2000
3000
4000
5000
pre
c (m
m)
K67
A S O N D J F M A M J J0
500
1000
1500
2000HY2002HY2003HY2004HY2005HY2008HY2009

A S O N D J F M A M J J-12
-6
0
GE
E (
gC
m-2
d-1
)
A S O N D J F M A M J J-4
0
4
NE
E (
gC
m-2
d-1
)
A S O N D J F M A M J J0
6
12
R (
gC
m-2
d-1
)
Result 2: Forest C Loss is due to reduced photosynthesis
NEE: Net Ecosystem ExchangeR: Ecosystem RespirationGEE: Gross Ecosystem Productivity
~ Photosynthetic activity
Hig
her
C u
ptak
eH
ighe
r C
loss
es
dry season wet season
dry season wet season
dry season wet season
Reduced photosynthesis (less negative)
NEE = R + GEE
NE
E (
kgC
ha-1
)
K67
-1000
0
1000
2000
3000
4000
5000
pre
c (m
m)
K67
A S O N D J F M A M J J0
500
1000
1500
2000HY2002HY2003HY2004HY2005HY2008HY2009

A S O N D J F M A M J J-12
-6
0
GE
E (
gC
m-2
d-1
) A S O N D J F M A M J J0
6
12
R (
gC
m-2
d-1
)
Hig
her
C u
ptak
eH
ighe
r C
loss
es
dry season wet season
dry season wet season
What is the cause of reduced photosynthesis?
Lower PAR and…
A S O N D J F M A M J J400
800
1200
PA
R ( m
ol m
-2 s
-1)
NE
E (
kgC
ha-1
)
K67
-1000
0
1000
2000
3000
4000
5000
pre
c (m
m)
K67
A S O N D J F M A M J J0
500
1000
1500
2000HY2002HY2003HY2004HY2005HY2008HY2009

A S O N D J F M A M J J-12
-6
0
GE
E (
gC
m-2
d-1
) A S O N D J F M A M J J0
6
12
R (
gC
m-2
d-1
)
Hig
her
C u
ptak
eH
ighe
r C
loss
es
dry season wet season
dry season wet season
Result 3: decreased photosynthetic response
0 800 16000
25
50
PAR (mol m-2 s-1)
GE
P (
mo
l m
-2 s
-1)
Jan
0 800 16000
25
50
PAR (mol m-2 s-1)G
EP
(m
ol
m-2
s-1
)
Feb
Decreased photosynthetic response
Jan
Feb
GE
P =
-G
EE
NE
E (
kgC
ha-1
)
K67
-1000
0
1000
2000
3000
4000
5000
pre
c (m
m)
K67
A S O N D J F M A M J J0
500
1000
1500
2000HY2002HY2003HY2004HY2005HY2008HY2009

What is the cause of reduced photosynthetic response? Earlier onset of the wet season? High soil moisture? ….

Summary:at Tapajós K67 tropical forest Result 1: La Niña Event (wet wet season and
earlier onset of the wet season, corresponds to C Forest Loss.
Result 2: Forest C Loss is due to reduced photosynthesis.
Result 3: decreased photosynthetic response.
Future work: Investigaion on the cause of reduced photosynthetic response?
Acknowledgments
This research was funded by the National Science Foundation’s Partnerships for International Research and Education (PIRE) and the National Aeronautics and Space Administration (NASA) LBA investigation CD-32.
Thank you

0:00 12:00 0:00-150
350
850
1350
Aug
0:00 12:00 0:00-150
350
850
1350
Sep
0:00 12:00 0:00-150
350
850
1350
Oct
0:00 12:00 0:00-150
350
850
1350
Nov
0:00 12:00 0:00-150
350
850
1350
Dec
PA
R ( m
ol m
-2 s
-1)
0:00 12:00 0:00-150
350
850
1350
Jan
0:00 12:00 0:00-150
350
850
1350
Feb
0:00 12:00 0:00-150
350
850
1350
Mar
0:00 12:00 0:00-150
350
850
1350
Apr
0:00 12:00 0:00-150
350
850
1350
May
Local Time0:00 12:00 0:00
-150
350
850
1350
Jun
0:00 12:00 0:00-150
350
850
1350
Jul
Local Time

NE
E (
kgC
ha-1
)
K67
-500
0
500
1000
pre
c (m
m)
K67
A S O N D0
100
200
300HY2002HY2003HY2004HY2005HY2008HY2009
PAR)) *(+(GEP
GEP*PAR*=GEP
sat
sat