VALUE CREATION IN INNOVATION ECOSYSTEMS:...
28
Strategic Management Journal Strat. Mgmt. J., 31: 306–333 (2010) Published online EarlyView in Wiley InterScience (www.interscience.wiley.com) DOI: 10.1002/smj.821 Received 6 May 2008; Final revision received 12 October 2009 VALUE CREATION IN INNOVATION ECOSYSTEMS: HOW THE STRUCTURE OF TECHNOLOGICAL INTERDEPENDENCE AFFECTS FIRM PERFORMANCE IN NEW TECHNOLOGY GENERATIONS RON ADNER 1 * and RAHUL KAPOOR 2 1 Tuck School of Business, Dartmouth College, Hanover, New Hampshire, U.S.A. 2 The Wharton School, University of Pennsylvania, Philadelphia, Pennsylvania, U.S.A. The success of an innovating firm often depends on the efforts of other innovators in its environ- ment. How do the challenges faced by external innovators affect the focal firm’s outcomes? To address this question we first characterize the external environment according to the structure of interdependence. We follow the flow of inputs and outputs in the ecosystem to distinguish between upstream components that are bundled by the focal firm, and downstream complements that are bundled by the firm’s customers. We hypothesize that the effects of external innovation challenges depend not only on their magnitude, but also on their location in the ecosystem relative to the focal firm. We identify a key asymmetry that results from the location of challenges relative to a focal firm—greater upstream innovation challenges in components enhance the benefits that accrue to technology leaders, while greater downstream innovation challenges in complements erode these benefits. We further propose that the effectiveness of vertical integration as a strat- egy to manage ecosystem interdependence increases over the course of the technology life cycle. We explore these arguments in the context of the global semiconductor lithography equipment industry from its emergence in 1962 to 2005 across nine distinct technology generations. We find strong empirical support for our framework. Copyright 2009 John Wiley & Sons, Ltd. INTRODUCTION A firm’s competitive advantage depends on its ability to create more value than its rivals (Porter, 1985; Brandenburger and Stuart, 1996). Greater value creation, in turn, depends on the firms’ ability to innovate successfully. To capture the returns from innovation, many firms strive to be technology leaders in their industry by being first to introduce new innovations to the market. A given innovation, however, often does not stand alone; rather, it depends on accompanying changes Keywords: technological change; first mover advantage; business ecosystem; vertical integration; complements; semiconductor lithography *Correspondence to: Ron Adner, Tuck School of Business, Dart- mouth College, Strategy and Management, 100 Tuck Hall, Hanover, NH 03755, U.S.A. E-mail: [email protected] in the firm’s environment for its own success. These external changes, which require innovation on the part of other actors, embed the focal firm within an ecosystem of interdependent innovations (Adner, 2006). Consider, for example, Airbus’s monumental investment in pioneering the super-jumbo passen- ger aircraft with its A380 offer. Airbus, as the focal firm, faces substantial challenges in designing and manufacturing the core airframe of the airplane. Beyond this internal challenge, it also relies on a host of suppliers for subassemblies and com- ponents. Some of these suppliers are themselves confronted with significant innovation challenges to deliver components that meet Airbus’s require- ments (e.g., engine, navigation system), while oth- ers will not need to innovate at all (e.g., carpet- ing). Receiving these various components, Airbus Copyright 2009 John Wiley & Sons, Ltd.
Transcript of VALUE CREATION IN INNOVATION ECOSYSTEMS:...
Strategic Management JournalStrat. Mgmt. J., 31: 306–333 (2010)
Published online EarlyView in Wiley InterScience (www.interscience.wiley.com) DOI: 10.1002/smj.821
Received 6 May 2008; Final revision received 12 October 2009
VALUE CREATION IN INNOVATION ECOSYSTEMS:HOW THE STRUCTURE OF TECHNOLOGICALINTERDEPENDENCE AFFECTS FIRM PERFORMANCEIN NEW TECHNOLOGY GENERATIONS
RON ADNER1* and RAHUL KAPOOR2
1 Tuck School of Business, Dartmouth College, Hanover, New Hampshire, U.S.A.2 The Wharton School, University of Pennsylvania, Philadelphia, Pennsylvania, U.S.A.
The success of an innovating firm often depends on the efforts of other innovators in its environ-ment. How do the challenges faced by external innovators affect the focal firm’s outcomes? Toaddress this question we first characterize the external environment according to the structure ofinterdependence. We follow the flow of inputs and outputs in the ecosystem to distinguish betweenupstream components that are bundled by the focal firm, and downstream complements that arebundled by the firm’s customers. We hypothesize that the effects of external innovation challengesdepend not only on their magnitude, but also on their location in the ecosystem relative to thefocal firm. We identify a key asymmetry that results from the location of challenges relative toa focal firm—greater upstream innovation challenges in components enhance the benefits thataccrue to technology leaders, while greater downstream innovation challenges in complementserode these benefits. We further propose that the effectiveness of vertical integration as a strat-egy to manage ecosystem interdependence increases over the course of the technology life cycle.We explore these arguments in the context of the global semiconductor lithography equipmentindustry from its emergence in 1962 to 2005 across nine distinct technology generations. We findstrong empirical support for our framework. Copyright 2009 John Wiley & Sons, Ltd.
INTRODUCTION
A firm’s competitive advantage depends on itsability to create more value than its rivals (Porter,1985; Brandenburger and Stuart, 1996). Greatervalue creation, in turn, depends on the firms’ability to innovate successfully. To capture thereturns from innovation, many firms strive to betechnology leaders in their industry by being firstto introduce new innovations to the market. Agiven innovation, however, often does not standalone; rather, it depends on accompanying changes
Keywords: technological change; first mover advantage;business ecosystem; vertical integration; complements;semiconductor lithography*Correspondence to: Ron Adner, Tuck School of Business, Dart-mouth College, Strategy and Management, 100 Tuck Hall,Hanover, NH 03755, U.S.A. E-mail: [email protected]
in the firm’s environment for its own success.These external changes, which require innovationon the part of other actors, embed the focal firmwithin an ecosystem of interdependent innovations(Adner, 2006).
Consider, for example, Airbus’s monumentalinvestment in pioneering the super-jumbo passen-ger aircraft with its A380 offer. Airbus, as the focalfirm, faces substantial challenges in designing andmanufacturing the core airframe of the airplane.Beyond this internal challenge, it also relies ona host of suppliers for subassemblies and com-ponents. Some of these suppliers are themselvesconfronted with significant innovation challengesto deliver components that meet Airbus’s require-ments (e.g., engine, navigation system), while oth-ers will not need to innovate at all (e.g., carpet-ing). Receiving these various components, Airbus
Copyright 2009 John Wiley & Sons, Ltd.

Value Creation in Innovation Ecosystems 307
faces the additional challenge of integrating thesecomponents with the airframe in order to delivera functioning aircraft to its airline customers. Inorder for the aircraft to be used productively byairlines, however, a number of other actors inthe environment, outside of Airbus’s direct supplychain, confront additional innovation challengesas well. Complementors such as airports need toinvest and develop new infrastructure to accommo-date the oversized aircraft, regulators need to spec-ify new safety procedures, and training simulatormanufacturers need to develop new simulators onwhich aircraft crews can be trained. The A380innovation ecosystem thus comprises not only Air-bus as the core innovator, but also its upstreamsuppliers, and its downstream buyers and comple-mentors. The key point is that it is not enoughto consider whether and how Airbus will success-fully resolve its internal innovation challenges; inorder for the A380 offer to create value, all of theother ecosystem partners need to resolve their owninnovation challenges as well.
Understanding firm performance in such ‘inno-vation ecosystems’ requires a change in the wayin which the strategy and the innovation litera-tures have traditionally linked industry dynamicsto firm performance. Most obviously, it requires anapproach that is explicit not only about the inno-vation challenges that are faced by the focal firm(Cooper and Schendel, 1976; Tushman and Ander-son, 1986; Henderson and Clark, 1990; Chris-tensen, 1997), but one that is also explicit aboutthe nature of innovation challenges confronted bythe external partners. In addition, it requires anapproach that extends beyond the focus on howdifferent actors will bargain over value capture(Porter, 1980; Teece, 1986; Brandenburger andStuart, 1996; Brandenburger and Nalebuff, 1997)to include an explicit consideration of the innova-tion challenges that different actors will need toovercome in order for value to be created in thefirst place.
The current paper presents an approach to ana-lyzing the dynamics of value creation that focuseson the role of innovation challenges in a firm’secosystem as potential bottlenecks to value cre-ation. We show that no less important than themagnitude of innovation challenges in the ecosys-tem is the location of these challenges. We presenta simple structure for locating challenges relativeto the focal firm according to the flow of activi-ties within the ecosystem and draw key distinctions
between challenges that need to be confronted bythe focal firm, its upstream suppliers, and its down-stream complementors.
Specifically, the current paper identifies asym-metries that arise from the positions of differentcounterparties relative to the focal firm. We showthat a firm’s ability to create value is impactedin very different ways depending on whether itis its upstream or downstream partners that faceinnovation challenges The impact of high externalinnovation challenges on the focal firm depends onwhether the challenges are confronted by suppliers,which affects the components that the firm needs tointegrate in order to offer a complete product to itscustomers, or by complementors, in which case thefirm can offer its complete product to the customer,but the customer cannot utilize it to its full poten-tial. We link these asymmetries in value creationto their impact on value capture and competitiveadvantage. To our knowledge this is the first paperin the management literature to explicitly postulateor test the asymmetric effects of components andcomplements.
We use this ecosystem lens to consider two inter-related questions. First, how the structure of tech-nological interdependence—the location of chal-lenges relative to the focal firm—affects the ben-efit that accrues to technology leaders (i.e., firmsthat pioneer the introduction of new technologygenerations). Second, how the effectiveness of ver-tical integration as a strategy for managing tech-nological interdependence changes over the courseof a technology’s life cycle.
The first mover advantage literature has iden-tified important considerations under which tech-nology leaders gain or lose from early entry intonew markets. Both the applied and scholarly lit-eratures are replete with studies, prescriptions,and caveats regarding the merits of pioneeringopportunities (Lieberman and Montgomery, 1988;Mitchell, 1991; Golder and Tellis, 1993; Chris-tensen, Suarez, and Utterback, 1998). Consistentwith strong arguments for and against the benefitsof leading in the introduction of new innovations,the empirical findings have been decidedly mixed,with some studies reporting significant pioneer-ing advantages while others report disadvantagesand non-effects (Kerin, Varadarajan, and Peter-son,1992; VanderWerf and Mahon, 1997).
The debates over the advantage accorded totechnology leaders have tended to overlook the
Copyright 2009 John Wiley & Sons, Ltd. Strat. Mgmt. J., 31: 306–333 (2010)DOI: 10.1002/smj

308 R. Adner and R. Kapoor
nature of the technology challenges that lead-ers and their ecosystems must overcome. In sodoing, they have neglected a key contingency.The current paper moves beyond the literature’straditional analysis of firms’ positions relative totheir rivals. We explicitly consider the innovationchallenges that reside in the firm’s environmentand need to be confronted by external partners ifthe focal innovation is to succeed in the market.We develop a simple framework for characteriz-ing the technological uncertainty associated withexternal innovation challenges. We argue that thelocation of challenges impacts the steepness offirms’ learning curves, their rate of progress alongthese curves, and the extent of spillovers to rivals.We predict that challenges in components increasethe performance advantage attributable to tech-nology leaders, while challenges in complementsdecrease this advantage.1 In so doing, we revealhow the structure and sequence of value creationaffects the outcomes of competition for value cap-ture.
We then consider firms’ vertical integration ofkey components as a strategy to manage thisinterdependence. We integrate arguments fromthe research literatures on technology life cycles(Rosenberg, 1976; Sahal, 1981; Dosi, 1982) andtransaction cost economics (Williamson, 1985),and suggest that while technological challengestend to decrease as technologies mature, con-tractual challenges need not dissipate over time.Because vertical integration mitigates contractualhazards but not necessarily technological chal-lenges, we posit that the shifting balance of tech-nological and contractual uncertainty will act toincrease the benefit from vertical integration overthe course of the technology life cycle. Hence, ver-tical integration is likely to be more effective aftera technology has reached a stage of maturity, ratherthan during its emergence.
We test these arguments in the context ofthe global semiconductor lithography equipmentindustry from its emergence in 1962 to 2005,a period during which the industry transitionedthrough nine distinct technology generations.While focal innovators faced significant challengesin each of these generational transitions, the extent
1 Note that our focus is not in specifying whether technologyleaders will have a competitive advantage. Rather, our focus ison specifying whether competitive advantage from technologyleadership is enhanced or eroded by the magnitude and locationof external innovation challenges.
to which suppliers and complementors faced inno-vation challenges varied across these generations,providing us with an ideal setting in which to testthe impact of ecosystem challenges on technologyleaders. We construct a unique dataset to test ourarguments. The data include a novel measure ofecosystem challenges for each of the nine tech-nology generations, as well as information aboutevery firm that ever sold lithography equipmentfor mainstream applications in the semiconductorindustry.
Our study makes a number of contributions.First, it introduces a structured approach for ana-lyzing technology interdependence. This approachoffers a new perspective for understanding inno-vators’ outcomes during periods of technologicalchange by focusing not only on the internal chal-lenges faced by the focal firms (Tushman andAnderson, 1986; Henderson and Clark, 1990) butalso on the external challenges faced by partnersin the ecosystem. By using an ecosystem lensto examine the benefits of technology leadership,we expand the scope of inquiry beyond its tradi-tional focus on direct competitors to identify theunderpinning mechanisms by which uncertainty incomponents and complements exercise opposingeffects on the performance of technology leadersand laggards (Lieberman and Montgomery, 1998).By disaggregating the external environment intoupstream and downstream constituents, we showthat the location of challenges matters no lessthan their magnitude, and offer a finer-grainedview of the interaction between organizations andtheir environments (Dess and Beard, 1984) andits implication for the dynamics of value creation(Brandenburger and Stuart, 1996; Adner and Zem-sky, 2006). By linking the flow of activities amongexchange partners to the distribution of innova-tion challenges across the ecosystem, we shedlight on a key mechanism of joint value creationand contribute to the emerging research literatureon ecosystem strategy (Moore, 1996; Iansiti andLevien, 2004; Adner, 2006). To the best of ourknowledge, the current study is the first to opera-tionalize the environment in this way. Finally, byexplicitly considering the changing benefits of ver-tical integration over the course of the technologylife cycle we contribute toward an understand-ing of how firms’ boundary choices affect theirperformance outcomes over time (Stigler, 1951;Argyres and Bigelow, 2007; Novak and Stern,2008).
Copyright 2009 John Wiley & Sons, Ltd. Strat. Mgmt. J., 31: 306–333 (2010)DOI: 10.1002/smj

Value Creation in Innovation Ecosystems 309
AN ECOSYSTEM PERSPECTIVE
The ecosystem construct, as a way of makinginterdependencies more explicit, has gained promi-nence in both business strategy (Moore, 1996; Ian-siti and Levien, 2004; Adner, 2006) and practice(e.g., Intel Corporation, 2004; SAP Corporation,2006). These approaches have focused on under-standing coordination among partners in exchangenetworks that are characterized by simultaneouscooperation and competition (Brandenburger andNalebuff, 1997; Afuah, 2000). Studies in this veinexplore the challenges that arise when incentivesacross the ecosystem are not aligned (Casadesus-Masanell and Yoffie, 2007), the role of estab-lished relationships with ecosystem partners inshaping firms’ motivations to compete for differentmarket segments (Christensen and Rosenbloom,1995), and the activities that focal firms undertaketo induce exchange partners to favor their spe-cific technology platforms (Gawer and Cusumano,2002).
Notice, however, that these studies are primarilyconcerned with strategic interactions among firms,extending the focus on value capture from thecontext of bilateral partnerships (Teece, 1986) andindustries (Porter, 1980) to the context of ecosys-tems (Jacobides, Knudsen, and Augier, 2006;Pisano and Teece, 2007). Thus, while the strategyliterature has explored the role of co-specialization,bargaining power, and relationships betweenexchange partners in shaping firms’ value capture,it has tended to assume away the question of howvalue is created in the first place.
Notice too, that while these research studies areclearly sensitive to the presence of different rolesand actors along the value chain (i.e., drawingclear distinctions between suppliers, complemen-tors, and buyers), the specific value chain positionof a counterparty relative to the focal firm has hadno impact on the resulting analysis;—that is, theimpact of an exchange partner with high bargain-ing power on the focal firm’s ability to capturevalue is exactly the same regardless of whetherthe counter party is positioned as a complementor,a buyer, or a supplier.
Indeed, although the very imagery of a valuechain (at the level of both firms and indus-tries) suggests interdependencies characterized asan ordered arrangement of activities, the literaturehas largely neglected the impact of the relativelocations of activities along the chain. This has left
the field in the odd position of highlighting theimportance of complements, complementors, andcomplementary assets, (e.g., Teece, 1986; Milgromand Roberts, 1990), claiming qualitatively distinctstatus for the role of complementors and suppli-ers, but unable to use its definition of these con-structs2 to distinguish between complements (e.g.,software for hardware) and components (e.g., pro-cessors for computers) because improvements ineither increase the attractiveness of the focal offer.
We depart from this literature by explicitly link-ing the dynamics of value creation and their impli-cations for value capture to the structure of inter-dependence in a firm’s ecosystem. The perspectivethat we propose and test in this study exploits therelative location of activities within the ecosys-tem to distinguish among the different roles playedby various actors in the firm’s environment. Weidentify roles according to the location in whichactivities are bundled in the ecosystem by follow-ing the flow of inputs and outputs of firms, anduse this as the basic framework for our analysis.
Figure 1 shows the schema of our approach. Theoutputs of upstream suppliers serve as inputs tothe focal actor. We refer to such inputs, whichare bundled by the focal actor into its product,as components. The focal actor’s product servesas an input to its customer. A customer may alsoneed to bundle other offers alongside the focalactor’s product in order to utilize it. We refer tosuch offers, which are bundled downstream by thecustomer, as complements. Thus, components andcomplements are defined according to where ele-ments are bundled in the flow of activities relative
Supplier 2
Complementor 1
Supplier 1
Complementor 2
Focal firm Customer
Components Complements
Figure 1. Generic schema of an ecosystem
2 For example, ‘The defining characteristic of these groups ofcomplements is that if the levels of any subset of the activitiesare increased, then the marginal return to increases in any or allof the remaining activities rises’ (Milgrom and Roberts, 1990:514).
Copyright 2009 John Wiley & Sons, Ltd. Strat. Mgmt. J., 31: 306–333 (2010)DOI: 10.1002/smj
310 R. Adner and R. Kapoor
to the position of the focal product, not accord-ing to whether they are produced by a given firmor outsourced to another. For example, althoughHewlett Packard produces both personal comput-ers and printers, they remain separate offers thatare brought together by the customer: the printeris a complement to the computer independentlyof whether it is offered by Hewlett Packard orCannon. In the figure, as in our study, we exam-ine only first-tier components and complements;clearly, this structure can be extended forwardand backward along the activity chain to includehigher-tiered actors (e.g., suppliers’ suppliers; cus-tomers’ customers). In the following section, weapply this approach in the context of innova-tions.
Innovation and the structureof interdependence
The majority of studies in the innovation liter-ature have sought to characterize the magnitudeand nature of the internal innovation challengesconfronted by focal innovators.3 The magnitude ofinnovation challenges can be characterized by theextent to which they require changes to the cur-rent approach to problem solving. The nature of achallenge can be rooted in discovery, design, anddevelopment (Tushman and Anderson, 1986; Hen-derson and Clark, 1990); in integrating externalcomponents into firms’ internal designs (Takeishi,2002; Brusoni, Prencipe, and Pavitt, 2001); or inscaling up the production and delivery of the iden-tified solution (Argote, 1999; Hatch and Mowery,1998).
The success of an individual innovation, how-ever, is often dependent on the success of otherinnovations in the firm’s external environment.Hughes’s (1983) rich description of the emergenceof the electrical power network highlights theobstacles raised when some technological elementsof an ecosystem lag behind others in resolving theirchallenges. He attributes the decline of direct cur-rent (DC) generation technologies to bottlenecks
3 Exceptions are Afuah’s studies (Afuah and Bahram, 1995;Afuah, 2000), which have explored how firm performance isimpacted when partners face technology challenges. These stud-ies focus on the overall level of innovation challenges that part-ners must confront. In contrast, our study explicitly considers theimpact of variations in both the level and the location of chal-lenges within the ecosystem. In so doing, we are able to uncovernew insights regarding the asymmetric impact of upstream anddownstream uncertainty on innovators’ outcomes.
in the development of distribution technology forthe DC network. Conversely, Henderson’s (1995)study of the semiconductor lithography industry(the same industry we examine in this paper) high-lights the role that suppliers, customers, and com-plementors played in offsetting bottlenecks in opti-cal lithography technology, thereby extending thedominance of optical lithography over nonopticalapproaches. However, while the existence of exter-nal innovation dependencies in such systems ofinnovation has been well documented in the liter-ature, it has been undertheorized.
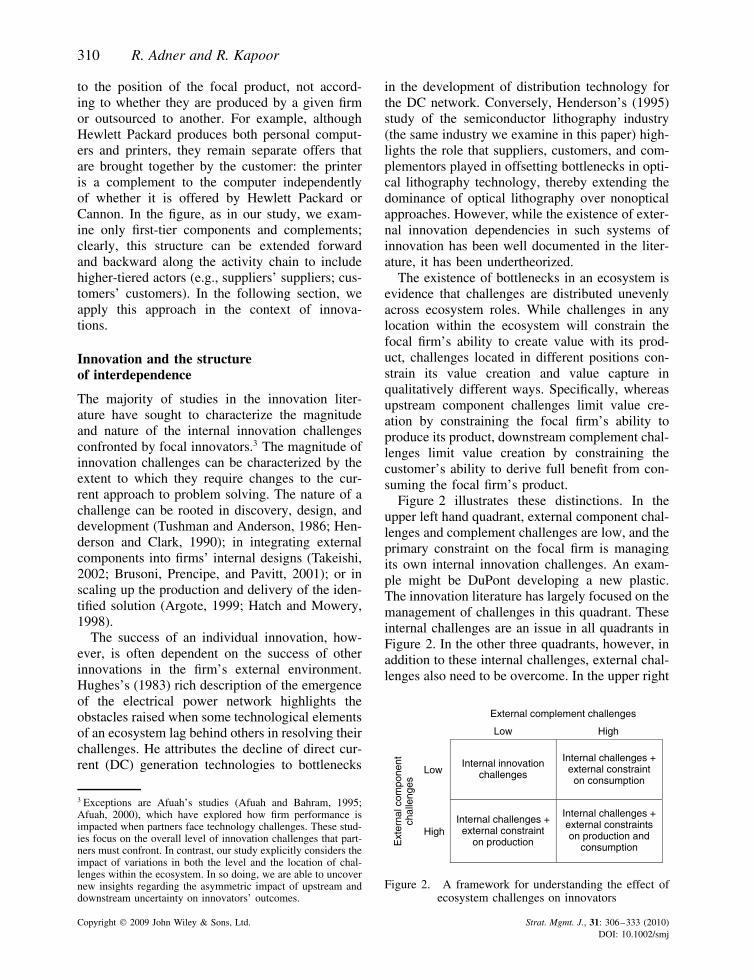
The existence of bottlenecks in an ecosystem isevidence that challenges are distributed unevenlyacross ecosystem roles. While challenges in anylocation within the ecosystem will constrain thefocal firm’s ability to create value with its prod-uct, challenges located in different positions con-strain its value creation and value capture inqualitatively different ways. Specifically, whereasupstream component challenges limit value cre-ation by constraining the focal firm’s ability toproduce its product, downstream complement chal-lenges limit value creation by constraining thecustomer’s ability to derive full benefit from con-suming the focal firm’s product.
Figure 2 illustrates these distinctions. In theupper left hand quadrant, external component chal-lenges and complement challenges are low, and theprimary constraint on the focal firm is managingits own internal innovation challenges. An exam-ple might be DuPont developing a new plastic.The innovation literature has largely focused on themanagement of challenges in this quadrant. Theseinternal challenges are an issue in all quadrants inFigure 2. In the other three quadrants, however, inaddition to these internal challenges, external chal-lenges also need to be overcome. In the upper right
External complement challenges
Low
LowInternal innovation
challenges
Internal challenges +external constrainton consumption
Ext
erna
l com
pone
ntch
alle
nges
HighInternal challenges +external constraint
on production
Internal challenges +external constraintson production and
consumption
High
Figure 2. A framework for understanding the effect ofecosystem challenges on innovators
Copyright 2009 John Wiley & Sons, Ltd. Strat. Mgmt. J., 31: 306–333 (2010)DOI: 10.1002/smj

Value Creation in Innovation Ecosystems 311
hand quadrant, upstream component challenges arehigh, and the focal firm faces an additional barrierto production rooted in the ability of its suppliersto overcome their own innovation challenges. Forexample, each new generation of hard disk driveshas presented drive manufacturers with significantinternal design challenges, but has also requiredsignificant innovation on the part of suppliers ofcomponents such as read-write heads, motors, anddisk substrate materials. In the lower left handquadrant, downstream complement challenges arehigh, and the focal firm’s buyers are constrainedin their ability to benefit from the firm’s inno-vation, despite the firm’s ability to overcome itsown challenges. For example, although hardwareplatforms for electronic book readers have beenavailable since the 1990s, the decade-long absenceof compelling electronic book content hindered theability of hardware providers to create value withtheir innovation.
Note that the upper right hand quadrant and thelower left hand quadrant both have high challengeon one external dimension and low challenge onthe other. An analysis that examined only the mag-nitude of external innovation challenges, ignoringtheir location relative to the focal firm, would beblind to the asymmetric effects of upstream anddownstream interdependence. Therefore, such ananalysis would incorrectly characterize these quad-rants as equivalent.
In the lower right hand quadrant, component andcomplement challenges are both high. An exampleis zero emission vehicles, which require signifi-cant innovation not only in car design, but alsoin the engine component and in the complementof the fuel delivery infrastructure. Nominally, thisquadrant represents the highest state of environ-mental uncertainty. However, the effect of thesimultaneous presence of high component and highcomplement challenges will likely depend on thespecific order of uncertainty resolution—whetherthe characterization of ecosystem challenges willshift from the lower right hand quadrant to theupper right hand quadrant, or from the lower righthand quadrant to the lower left hand quadrant.The sequence will depend on the specific natureof challenges in the ecosystem.
We now consider how differences in the con-straints on value creation due to the location ofchallenges in the ecosystem impact firms’ compet-itive advantage.
TECHNOLOGICALINTERDEPENDENCE ANDINNOVATORS’ PERFORMANCE
How do the magnitude and location of technolog-ical challenges in the ecosystem affect the benefitsof technology leadership? Being first to introducean improved technology to the market is a commonmanagerial aspiration. Successful technology lead-ers, by virtue of having beaten their rivals to mar-ket, enjoy reduced competition when presentingtheir offer to customers. Whether this temporaryexclusivity translates into a sustained competitiveadvantage over later entrants, however, depends onthe leader’s ability to exploit its window of oppor-tunity. This capability will depend on the relativedistribution of challenges across components andcomplements.
Component challenges
Innovations are often enabled by changes in com-ponents. In such cases, both firms and their sup-pliers may face considerable challenges in devel-oping and integrating these new components intothe focal offer (Fine, 1998; Iansiti, 1998; Brusoniet al., 2001). How do component challenges affectthe performance of technology leaders who pioneertechnology generations?
A key driver of early mover advantage isthe opportunity to exploit production and marketexperience to progress down the learning curve,increasing the firm’s added value by improvingthe offer’s performance or costs (Spence, 1981;Lieberman, 1984, 1989; Argote, 1999). Empiri-cal studies of learning curves from the 1930s tothe present day have found significant variancein learning potential. For example, in their reviewof 22 learning curve studies, Dutton and Thomas(1984) report progress ratios that vary from 55percent (high learning opportunity) to over 100percent (no learning opportunity).4
The extent to which progress down the learningcurve can be a source of advantage is intimatelylinked to the potential for learning—greater advan-tage is rooted in greater learning potential. Hence,to understand learning as a source of advantage
4 The progress ratio measures the cost reduction associated witha doubling of production. A progress ratio of X percent impliesthat a doubling of production reduces cost of production toX percent of the initial cost.
Copyright 2009 John Wiley & Sons, Ltd. Strat. Mgmt. J., 31: 306–333 (2010)DOI: 10.1002/smj
312 R. Adner and R. Kapoor
we must consider what drives differences in themagnitude of the learning opportunity.
The magnitude of the learning opportunitydepends both on the extent to which the innovatingfirm needs to change its current approach to prob-lem solving and the scope it has for doing so. It isthe emerging mastery of new routines that under-pins a firm’s progress down the learning curve. Ifvery little change from the status quo is required,it follows that there is not much new for the firmto learn; hence, both the opportunity for and therelative advantage from learning will be relativelylow. In contrast, when the innovating firm needsto overcome high uncertainty and complexity inorder to bring its offer to market, the opportunityfor learning will be higher, as will be the potentialfor learning to be a source of competitive advan-tage.5
When the focal innovation requires accompa-nying innovations in components, the focal firm’sdevelopment challenges increase, as it now mustovercome additional hurdles in specifying, sourc-ing, and integrating new components into its newdesigns. These challenges can impact both thetechnological as well as the organizational routinesthat must be mastered by the firm in order for itto bring the innovative offer to the market. In thisway, component challenges increase the magnitudeof the firm’s learning opportunity, and hence theadvantage it can gain from progressing down thelearning curve in advance of its rivals.
Further, the increased requirements for closercoordination with suppliers (Dyer and Singh, 1998)and more frequent iterations through design anddevelopment cycles (Clark and Fujimoto, 1991)that accompany challenging components,contribute not only to increasing the benefits tothe technology leader from greater experience withthe new technology, but also to reducing the easewith which later rivals can imitate this progress(Lippman and Rumelt, 1982; Rivkin, 2000). Forexample, rivals have found it difficult to imitate
5 Balasubramanian and Lieberman (2006) report findings that arehighly consistent with these arguments. This study considers 117industries to examine how the relationship between experienceand productivity depends on research and development (R&D)intensity (a proxy for industry development challenges). Thisstudy finds that greater R&D intensity is correlated with lowerprogress ratios (i.e., greater learning potential), which is con-sistent with our argument that greater learning potential shouldincrease the relative benefits that accrue to firms with a headstart in moving down the learning curve.
innovations that emerged from the extensive col-laboration between Toyota and its key suppliers(Dyer, 1996; Dyer and Hatch, 2006).
Hypothesis 1: Greater technological challengesin components will increase the performanceadvantage of technology leaders.
The degree to which component challengesincrease the performance advantage of technologyleaders may be tempered by the extent of modular-ity between the component and the focal product.Two mechanisms stand out when interfaces arewell specified. First, with regard to the focal firm,there may be less potential for learning becausekey developments are undertaken by the supplier.Second, with regard to the focal firm’s rivals, thereis the possibility that once the component has beendeveloped for the technology leader, rivals can freeride on these investments and ‘plug-and-play’ thecomponent directly into their own offers, therebyreducing the leader’s period of exclusivity in themarket.
We note, however, that while these factors canreduce the extent to which component challengesincrease a leader’s advantage, they are unlikelyto reverse the direction of the effect. While mod-ularity does reduce interdependence, it does noteliminate it. For example, Brusoni and Prencipe(2001) note that while modularity allows for therise of specialist component suppliers, it also posesgreater organizational and knowledge requirementson the focal firms in their role as system inte-grators. Similarly, Hoetker’s (2006) study of out-sourcing choices in the notebook computer marketsupports the argument that organizational coordi-nation challenges exist even when technologies arehighly modular.
Complement challenges
We have argued that component challenges canincrease both potential for learning as well as bar-riers to imitation, and hence increase the advan-tages that accrue to technology leaders. How arethe factors that support these advantages affectedby challenges in complements? The resolution ofcomponent challenges is required in order for afirm to be able to produce its offer and presentit to the market. However, the extent to whichthe offer can create value for users depends on
Copyright 2009 John Wiley & Sons, Ltd. Strat. Mgmt. J., 31: 306–333 (2010)DOI: 10.1002/smj

Value Creation in Innovation Ecosystems 313
the availability of critical complements. For exam-ple, the Airbus A380’s ability to create value forits airline customers is hampered until airports, askey complementors, undertake the modificationsto their terminals that are required to handle theoversized aircraft.
Many innovations rely on the availability ofcomplements to unlock their full value. Rosen-berg (1972: 21) submits that a single innovationrarely constitutes a ‘complete innovation,’ and thatthe opportunities and challenges faced by usersin adopting the innovation can be influenced bythe state of development of complements. Hughes(1983) describes imbalances in the pace of devel-opment of complementary innovations as creating‘reverse salients’ on the frontier of technologicaldevelopment. Ethiraj (2007) illustrates how com-plements constrained the value of products devel-oped by suppliers to the personal computer indus-try. Goldfarb (2005) offers a qualitative examina-tion of how challenges in complements delayed theadoption of electricity in the railroad and printingindustries in the early 1900s.
Greater complement innovation challenges resultin delays in the availability of the complementas complementors struggle to overcome their owntechnology hurdles. By reducing the value creationof the focal offer, delays in the availability of suit-able complements act to slow the adoption rateof the new offer. These adoption delays impactthe advantage from technology leadership in twodistinct ways. First, they allow rivals more timeto catch up and possibly imitate the leader beforethe market takes off. Second, because lower ratesof adoption will reduce the firm’s ability to gainexperience (i.e., lower demand will lead to lowerproduction quantities), the leader will make slowerprogress down the learning curve during its periodof exclusivity. Hence, even without imitation, laterentrants will confront a leader with a smaller com-petitive advantage. By acting to slow both adoptionand the accumulation of experience, greater com-plement challenges erode the sustainability of thetechnology leader’s competitive advantage.
Hypothesis 2: Greater technological challengesin complements will decrease the performanceadvantage of technology leaders.
The impact of complement challenges on tech-nology leaders is likely to be affected by the extentto which complements are open vs. proprietary.
When complements are open, such that they canbe used with the offer of any firm, laggards willbenefit from any progress that had been made inthe market to advance the leader’s offer; that is,spillovers will be higher and technology leaderswill see their advantage eroded.
When complements are proprietary, such thatthey can only work with the offer of a partic-ular firm, spillovers will be reduced. However,the leader need not necessarily be better off: tothe extent that there is a new race to be won inthe development of suitable complements, whetherthe first firm in the market with the focal offerwill also win the race to be first to market withthe key complement will depend on a number ofcase-specific factors. What is clear, however, isthat even when complements are proprietary, highcomplement challenges forces firms to competein a second race for leadership. Hence, regardlessof whether complements are open or proprietary,complement challenges erode the benefit of tech-nology leadership in the focal offer.
The balance of uncertainty: technology vs.opportunism
Our discussion is focused on innovation challengesthat arise in ecosystems, in which focal offers needto be combined with components and complementsif they are to present a value-creating solution tocustomers. We have argued that in such contextsthe distribution of technological challenges acrossthe ecosystem is an important driver of firms’ out-comes. We now consider vertical integration as agovernance strategy to manage such interdepen-dence.6
A key benefit of vertical integration is the abil-ity to mitigate contractual hazards. These con-tractual hazards arise when firms and their sup-pliers make asset-specific investments under con-ditions of uncertainty (Williamson, 1985). Whencontracting with suppliers for innovative compo-nents with high development challenges, the focalfirm faces two specific kinds of uncertainty. Thefirst is the technological uncertainty surrounding
6 In our empirical setting, a subset of firms integrate into compo-nent production, but no firms integrate into complements. Hence,because we are only able to test arguments regarding verticalintegration into components, we do not hypothesize about thebenefits of integration choices with respect to complements. Thisquestion, although fascinating, is beyond the scope of this paper.
Copyright 2009 John Wiley & Sons, Ltd. Strat. Mgmt. J., 31: 306–333 (2010)DOI: 10.1002/smj

314 R. Adner and R. Kapoor
whether and when suppliers will discover appro-priate solutions to their development challenges(Clark, 1985). The second is what Williamson(1985: 58) terms behavioral uncertainty regardingwhether and when suppliers will behave oppor-tunistically (Jap and Anderson, 2003; Sutcliffe andZaheer, 1998).
The resolution of technological uncertaintydetermines value creation—if the supplier cannotproduce appropriate components, the firm cannotbring the desired product to market. The reso-lution of behavioral uncertainty determines valuecapture—if the supplier renegotiates the contractterms opportunistically, the firm cannot appropri-ate the expected rents.
Early in a technology’s life cycle, technologicaluncertainty is at its peak. As development takesplace, knowledge is accumulated and progressbecomes more predictable. Although developmentcontinues throughout the life cycle, and innovationchallenges are always present, within a given tra-jectory the level of technological uncertainty tendsto decrease over time (Dosi, 1982; Sahal, 1981).7
In contrast to technological uncertainty, whichdecreases with time, the trend for behavioral uncer-tainty as technology matures is ambiguous. Onthe one hand, increased experience and repeatedinteractions can allow firms to specify better for-mal contracts and extend relational contracts withtheir suppliers, such that behavioral uncertaintymay decrease over time (Mayer and Argyres,2004; Argyres, Bercovitz, and Mayer, 2007). Onthe other hand, it is also possible for behavioraluncertainty to increase over the technology lifecycle: as firms continue to work with suppliers to
7 The literature has distinguished among industry life cycles(i.e., the time span between an industry’s emergence and itsdecline), technology life cycles (i.e., within a given industry,the time span between a new technology’s emergence and itsdecline), and product life cycle (i.e., within a given technology,the time span between the emergence of a new product and itsdecline). The current study focuses on the introduction of newtechnology generations, and so conducts its analysis at the levelof technology life cycles. We note that the distinction betweenthe technology and product life cycles can be fuzzy depending onthe context and whether product performance or product salesare being plotted on the Y-axis. However, in our context thisdistinction is quite clear. Within the semiconductor lithographyindustry, which emerged in 1962 and continues to the presentday, we are examining technology life cycles, such as the periodfrom emergence of the I-line technology generation in 1985 toits decline in the face of the rising dominance of the subsequenttechnology generation, We do not focus on the product life cyclethat governed the rise and decline of specific product modelswithin the I-line generation.
improve their offers, the level of co-specialization,transaction- specific assets, and supplier switchingcost can increase. Similarly, as the market for theoffer grows, so may the opportunity cost to the firmof switching suppliers, increasing the incentive forsuppliers to behave opportunistically. For exam-ple, the classic episode of General Motors (GM)and Fisher Body as discussed by Klein (1988,2000) suggests that the rapid increase in demandfor closed metal bodies created significant contrac-tual hazards for GM and led GM to acquire FisherBody.
Vertical integration mitigates the effects ofbehavioral uncertainty but not of technologicaluncertainty.8 If the level of technological uncer-tainty decreases more rapidly than behavioraluncertainty over the technology’s life cycle, thenthe relative importance of behavioral uncertaintyrises. Under these conditions the benefit from ver-tical integration will be greater at later stages ofthe technology life cycle.
Hypothesis 3: The performance advantage fromvertical integration will increase over the courseof the technology life cycle.
EMPIRICAL CONTEXT
We test our hypotheses in the context of the semi-conductor lithography equipment industry. Semi-conductor lithography is a key process used bysemiconductor manufacturers to create integratedcircuits. Improvements in lithography tools havebeen the main driver of progress in semiconductormanufacturing, enabling the production of higherperformance chips at lower marginal cost (Moore,1995). From its emergence in 1962 to 2005, thesemiconductor lithography industry has witnessedthe commercialization of nine different technolog-ical generations. From the beginning, lithographytool manufacturers have regarded technology lead-ership to be a key source of competitive advantage.Being among the first to introduce a new technol-ogy generation offers technology leaders signifi-cant learning advantages as well as the opportunityto lock in customers due to high switching costs.
8 Vertical integration may also allow firms to develop a betterunderstanding of the interactions between the focal componentsand the product architectures (Kapoor and Adner, 2009), and toapply such firm-specific knowledge to facilitate improvementsover the technology life cycle (Novak and Stern, 2008).
Copyright 2009 John Wiley & Sons, Ltd. Strat. Mgmt. J., 31: 306–333 (2010)DOI: 10.1002/smj
Value Creation in Innovation Ecosystems 315
Lens
Mask with IC pattern on top
Semiconductor wafer with resist layer
Energy source
Figure 3. Basic schema of the semiconductor lithography process
In each of the nine technology generations, themanufacturers of lithography tools had to over-come significant innovation challenges. Althoughsuppliers and complementors were always criti-cal to enabling each new technology generation,the magnitude of their challenges varied acrossgenerations—whereas in some generations it waspossible to simply reuse existing elements, othergenerations required suppliers and complementorsto completely reinvent their offers.
Semiconductor lithography
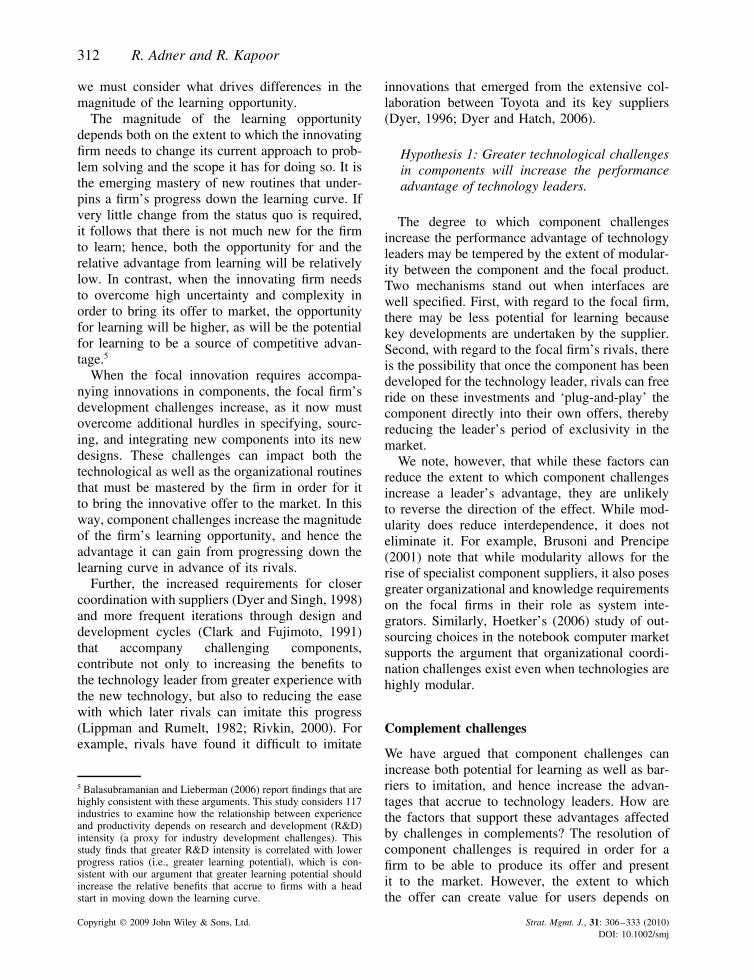
Semiconductor lithography is the process by whicha circuit design is imprinted on a semiconductorwafer. The basic principle of lithography is illus-trated in Figure 3. After the design of an integratedcircuit (IC) is finalized (i.e., the wiring, the gates,and the junctions), the circuit blueprint is trans-ferred to a mask. The lithography process takesplace when beams of energy originating from anenergy source are directed onto the mask. The pat-tern on the mask allows a portion of the energyto pass through, with or without an optical lenssystem, onto the wafer. The wafer is coated withan energy sensitive resist. The resist undergoes achemical reaction wherever the mask has allowedthe energy to pass through. This chemical reactionchanges the structure of the resist and allows itsselective removal from the wafer. Another chemi-cal process is then initiated in which the exposedparts of the wafer are etched. Finally, the remain-ing resist is removed, creating a final circuit thatreplicates the initial design. A single wafer can gothrough this process a number of times as multiplelayers of circuits are etched onto it. For exam-ple, in 2006, a one gigabit dynamic random accessmemory chip could be etched with as many as 60circuit layers.
The key performance attribute of a lithographytool is its resolution, the smallest geometry onwhich the tool can focus on the wafer surface.Resolution determines the extent of miniaturizationthat can be achieved by the semiconductor man-ufacturer. A semiconductor manufacturer will usescores of lithography tools in a single productionline, often one for each circuit layer. With mod-ern tools costing over $20 million each, invest-ments in lithography equipment represent a sub-stantial portion of the cost of a fabrication facility.Lithography ‘production recipes,’ which are cus-tomized to specific tool models, masks, and resists,are regarded as a key source of advantage forsemiconductor manufacturers who invest signifi-cant resources in optimizing their production lines(Iansiti, 1998). To maintain competitiveness semi-conductor manufacturers continuously reinvest intheir facilities and look to new lithography tech-nology generations to allow them to offer productswith higher performance at lower cost.
The current study’s focal firms design andassemble the lithography tool. The key compo-nents that these toolmakers need to integrate intotheir offers are the energy source and the lens.Their customers are semiconductor manufacturerswho use the lithography tool in their fabricationplants. The mask and the resist are the key com-plements that these customers must integrate withthe lithography tool. A schema of the lithographytool ecosystem is presented in Figure 4.
The development of a new generation of lithog-raphy tool technology poses significant challengesfor tool manufacturers to achieve finer and finerresolutions. A new technology generation can alsoimpose substantial challenges on other ecosystemelements: the energy source may need to operate ata new wavelength; the lens may need to be man-ufactured from a new material; the mask, whichneeds to be etched with thinner lines, may need to
Copyright 2009 John Wiley & Sons, Ltd. Strat. Mgmt. J., 31: 306–333 (2010)DOI: 10.1002/smj

316 R. Adner and R. Kapoor
Lens producers
Energy sourceproducers
Resist producers
Lithographytool producers Semiconductor manufacturers
Mask producers
Figure 4. The semiconductor lithography equipment ecosystem
be manufactured in a new way, possibly from newmaterials; the chemical resist may need to be refor-mulated to enable greater control of the chemicalreactions as energy wavelengths become smallerand geometric resolutions become finer.
Despite undergoing nine generational transi-tions, the structure of interdependence in theecosystem—the components that need to be inte-grated by the focal tool manufacturers and thecomplements that their customers, the semicon-ductor manufacturers, need to combine with thetool offer—has remained unchanged throughoutthe 44-year period that we study. All tool manu-facturers integrate the source and lens componentsand leave it to their customers to integrate themask and the resist complements with the tool.This choice of what to bundle and what to excludein the tool offer is rooted in a lack of syner-gies on both the supply and demand sides. Onthe supply side, there is little overlap between theknowledge bases and resources required to succeedin developing and assembling lithography tools(highly complex batch assembly), creating newresists (producing vats of very specialized chemi-cal solution), and mask production (essentially acustom printing service business). More impor-tantly, on the demand side, the big semiconduc-tor manufacturers (the toolmakers’ most importantcustomers) have had little interest in fully bundledsolutions—they regard their proprietary produc-tion recipes for putting together tool, mask, andresist as a key source of their own competitiveadvantage (Kapoor and Adner, 2009), and view amove to bundled lithography solutions as inviting aloss of differentiation.9 Where tool manufacturing
9 Such stability in activity flows is a common characteristicacross many industries. For example, disk drive producers havealways bundled motors and heads; their customers, the computerassemblers, bundle the drive with processors and software.
firms have differed is in their strategy for managingtheir interdependence with lens components: somefirms are vertically integrated into lens productionwhereas others rely on external suppliers.
Thus, the industry allows us to examine a well-defined technological ecosystem that comprisesfocal firms, their suppliers, and their complemen-tors, in which the location and magnitude ofecosystem innovation challenges vary across tech-nology generations. The industry is also appealingbecause it provides a natural set of controls fortwo key factors that have already been examinedin the innovation literature. First, all the transi-tions across technology generations can be char-acterized as sustaining innovations (nondisruptivein the Christensen [1997] sense) in that all tech-nology generations were targeted at existing cus-tomers, enhanced performance on the same set ofkey performance attributes (resolution, accuracy,and throughput, in particular), and commanded sig-nificant price premiums over earlier generations.Second, the value of complementary assets—salesforce, manufacturing, brand, service, and supportcompetence—was preserved throughout (Mitchell,1989; Tripsas, 1997).
Technology transitions in the semiconductorlithography equipment industry
The key measure of progress in semiconductorlithography is improvement in tool resolution.Finer resolutions enable the semiconductor man-ufacturers to use the lithography tool to pack morecircuits onto a chip and more chips onto a wafer.These improvements allow semiconductor manu-facturers to offer chips with higher performance atlower marginal cost.
For the lithography tool manufacturers, improv-ing resolution is a top priority. Tool manufacturersincrease resolution using a combination of three
Copyright 2009 John Wiley & Sons, Ltd. Strat. Mgmt. J., 31: 306–333 (2010)DOI: 10.1002/smj

Value Creation in Innovation Ecosystems 317
levers. The first is to reduce the wavelength oflight that is transmitted by the energy source. Thesecond is to increase the size of the lens. Thethird is to improve the design of the tool itself.The industry distinguishes among technology gen-erations according to the design of the tool andthe wavelength of energy that it transmits. Incre-mental improvements to the tool design and thelens are core drivers of product advances withina technology generation. When further improve-ments become untenable due to a combinationof physical and economic constraints the industryshifts to a new design or to a smaller wavelength,which heralds the emergence of a new lithographytechnology generation.
In transitioning across technology generations,tool manufacturers always face significant designchallenges. Consider, for example, the industry’stransition from I-line generation steppers to deepultraviolet (DUV) 248 nm generation steppers.The core approach to increasing resolution in thistransition was to decrease the energy wavelengthfrom 365 nm to 248 nm, which would allow toolresolution to improve from 0.8 µm to 0.45 µm.The relationship between reduced wavelength andfiner resolution is straightforward in theory.10 Real-izing this improvement in a commercial setting,however, requires a corresponding improvementin tool design (e.g., in terms of factors such asalignment, repeatability, reliability, and through-put). Overcoming these design challenges requirestool manufacturers to experiment and iterate, oftenfor years, in order to come up with a suitable offer(Henderson and Clark, 1990).11
10 The resolution capability of lithography technologies thatemploy a lens system is given by the Rayleigh criterion:
resolution = k1 x (wavelength/numerical aperture),
where wavelength is the wavelength of the light being transmit-ted by the source, numerical aperture is the measure of the sizeof the lens, and k1 is a process-specific constant.11 Henderson’s studies of the industry have highlighted that inconfronting new technology generations, firms may face bothengineering challenges in creating new designs as well as cog-nitive challenges in recognizing the subtleties of change (Hen-derson and Clark, 1990; Henderson, 1993). In particular, thesestudies highlighted the unique cognitive challenges that confrontincumbents when generational changes affect the architecturallinks among only core design concepts. The focus of our paperis on external challenges; however, we account for incumbencyeffects in our empirical specification.
When a new technology generation requiresinnovation in components, the tool manufactur-ers face greater challenges in specifying, sourc-ing, and integrating the new components into theirdesigns. The transition to DUV 248 nm, for exam-ple, required fundamental changes in the energysource and the lens. Mercury lamps, which hadbeen used in all earlier generations, were notable to provide sufficient energy at a wavelengthof 248 nm to cause adequate chemical reactionsin the resist. This challenge was overcome bythe development of excimer lasers using kryptonfluoride (KrF) gas. In addition, the conventionalglass material that had been used to make lensesfaced absorption problems with the 248 nm wave-length. The only material that could be used wasfused silica, and this required major changes tothe lens manufacturing process. These requiredchanges created significant challenges in compo-nents, which, in turn, served to increase the designand integration challenges that confronted the toolmanufacturers.
In order for the new generation of lithographytechnology to be used effectively by customers,significant challenges needed to be overcome inthe development of complements as well. Maskmakers needed a new material that would pro-vide improved transmission of the new wavelengthwhich, in turn, required changes to the mask man-ufacturing process. Finally, the existing novolacresists could not absorb enough energy from the248 nm wavelength to cause an adequate chemicalreaction. To solve this challenge, a new chemicallyamplified resist had to be developed.
Table 1 summarizes the major technologicalinnovations required to overcome the challenges inthe tool, lens, source, mask, and resist in each tech-nology generation. Readers interested in a moredetailed overview of each of the technology tran-sitions are referred to Kapoor and Adner’s (2007)study, which explains how ecosystem challengesimpacted the sales evolution of different technol-ogy generations.
METHODOLOGY
Data
We used both primary and secondary data sourcesfor this study. We began by developing a detailed
Copyright 2009 John Wiley & Sons, Ltd. Strat. Mgmt. J., 31: 306–333 (2010)DOI: 10.1002/smj

318 R. Adner and R. Kapoor
Tabl
e1.
Maj
orte
chno
logi
cal
inno
vatio
nsby
the
litho
grap
hyeq
uipm
ent
ecos
yste
mto
over
com
eth
ech
alle
nges
acco
mpa
nyin
gne
wte
chno
logy
gene
ratio
ns
Tech
nolo
gyge
nera
tion
(yea
rof
first
sale
)R
esol
utio
n(µ
m)
Tool
Sour
ceL
ens
Mas
kR
esis
t
Init
ial
solu
tion
(pre
-196
2)M
ercu
ryla
mp.
Non
e.M
anua
llycu
tm
ask.
Neg
ativ
ere
sist
.
Con
tact
prin
ter
(196
2)7.
00C
ircu
itde
sign
istr
ansf
erre
dto
waf
erby
putti
ngm
ask
indi
rect
cont
act
with
the
resi
ston
the
waf
eran
dth
ensh
inin
gth
elig
hten
ergy
from
the
mer
cury
lam
pen
ergy
sour
ce.
——
Intr
oduc
tion
ofSt
ep&
Rep
eat
Cam
era
for
mas
km
akin
g.
—
Subs
titu
tion
ofem
ulsi
onpl
ates
bych
rom
eon
glas
s.Pr
oxim
itypr
inte
r(1
972)
3.00
The
mas
kis
sepa
rate
dfr
omth
ew
afer
bya
smal
lga
p.E
limin
atin
gdi
rect
cont
act
redu
ces
defe
ctra
tes.
——
——
Proj
ectio
nsc
anne
r(1
973)
2.00
Are
flect
ive
lens
syst
emis
inco
rpor
ated
into
the
tool
toal
low
for
grea
ter
conc
entr
atio
nof
light
ener
gyto
betr
ansf
erre
dth
roug
hth
em
ask
onto
the
waf
er.
—D
evel
opm
ent
ofre
flect
ive
lens
syst
em.
Use
ofel
ectr
onbe
amsy
stem
sfo
rhi
gh-q
ualit
y1X
mas
ks.
—
E-b
eam
wri
ter
(197
6)0.
5M
ove
anel
ectr
onbe
amth
roug
ha
prep
rogr
amm
edpa
thto
crea
teth
eci
rcui
tpa
ttern
dire
ctly
onth
ere
sist
with
out
use
ofle
nsor
mas
k.
Dev
elop
men
tof
ther
mio
nic
and
field
emis
sion
met
hods
and
final
conv
erge
nce
toSc
hottk
yem
itter
.
——
New
deve
lopm
ents
wit
hPM
MA
-bas
edre
sist
.
Copyright 2009 John Wiley & Sons, Ltd. Strat. Mgmt. J., 31: 306–333 (2010)DOI: 10.1002/smj

Value Creation in Innovation Ecosystems 319
Tabl
e1
(Con
tinu
ed)
Tech
nolo
gyge
nera
tion
(yea
rof
first
sale
)R
esol
utio
n(µ
m)
Tool
Sour
ceL
ens
Mas
kR
esis
t
X-r
aypr
inte
r(1
978)
0.3
Cha
nge
wav
elen
gth
from
435
nmto
10nm
and
proj
ect
ener
gyfr
oman
X-r
ayso
urce
with
out
use
ofa
lens
.
Dev
elop
men
tof
sync
hrot
ron
for
prov
idin
ga
high
ener
gyso
urce
.
—D
evel
opm
ent
ofne
wm
ask
mat
eria
lssu
chas
SiC
/Ta.
—
Dev
elop
men
tof
new
mas
km
akin
gte
chni
ques
topr
ovid
esm
alle
rge
omet
ries
.G
-lin
est
eppe
r(1
978)
1.25
Step
-and
-rep
eat
tech
nolo
gyal
low
sa
sing
lew
afer
tobe
etch
edth
roug
hm
ultip
leex
posu
res
asth
em
ask
issh
ifte
dac
ross
the
waf
erin
step
s.A
refr
activ
ele
nssy
stem
allo
ws
for
the
circ
uit
dim
ensi
ons
onth
em
ask
tobe
5–
10tim
esla
rger
than
the
dim
ensi
ons
etch
edon
toth
ew
afer
.
—D
evel
opm
ent
ofre
frac
tive
lens
syst
em.
—C
hang
ein
resi
stfr
omst
anda
rdne
gativ
ere
sist
tono
vola
cre
sist
.
I-lin
est
eppe
r(1
985)
0.80
Wav
elen
gth
deri
ved
from
the
mer
cury
lam
pen
ergy
sour
ceis
redu
ced
from
435
nmto
365
nm.
—D
evel
opm
ent
ofne
wle
nsm
ater
ial
for
redu
ced
wav
elen
gth.
——
DU
V24
8nm
step
per
(198
6)0.
45W
avel
engt
his
redu
ced
from
365
nmto
248
nm.
Dev
elop
men
tof
kryp
ton
fluor
ide
(KrF
)ex
cim
erla
ser.
Cha
nge
inle
nsm
ater
ial
tofu
sed
silic
a.
Cha
nge
inm
ask
mat
eria
lto
quar
tz.
Cha
nge
inre
sist
toch
emic
ally
ampl
ified
resi
st.
DU
V19
3nm
step
per
(199
6)0.
15W
avel
engt
his
redu
ced
from
365
nmto
248
nm.
Dev
elop
men
tof
argo
nflu
orid
e(A
rF)
exci
mer
lase
r.
Cha
nge
inle
nsm
ater
ial
toca
lciu
mflu
orid
e.
Intr
oduc
tion
ofR
ET
mas
ksfo
r19
3nm
.N
ewve
rsio
nsof
chem
ical
lyam
plifi
edre
sist
.
Copyright 2009 John Wiley & Sons, Ltd. Strat. Mgmt. J., 31: 306–333 (2010)DOI: 10.1002/smj

320 R. Adner and R. Kapoor
historical understanding of the semiconductorlithography equipment industry during a 20-monthfield study. We conducted multiple interviews withover 30 industry experts, most of whom havebeen associated with the industry for more than20 years. The interviewees came from a variety ofpositions within the ecosystem: toolmakers, semi-conductor manufacturers, suppliers, complemen-tors, industry associations, and consultants. Theinterviews were semi-structured and lasted twohours on average. We identified ecosystem struc-ture by first asking what elements needed to beintegrated by tool manufacturers in order for themto produce their offers; and second, asking whatelements needed to be integrated by the tool cus-tomers in order for the tool to be used productively.There was unanimous agreement that the energysource and the lens were the key components tobe integrated into the tool by the manufacturer,and that the mask and the resist were the keycomplements to be integrated with the tool by thecustomer. We used the information from the inter-views to develop an understanding of the ecosys-tem challenges that governed the emergence of thedifferent technology generations. We consolidatedthis information in a document that mirrors Table 1and sent it back to our interviewees for writtenand verbal comments. We incorporated these com-ments and then sent the table out for a secondreview. All the experts agreed with our final char-acterization.
We searched every issue of Solid State Tech-nology from 1961 to 2001 for articles relating toecosystem innovation challenges. Solid State Tech-nology is a leading industry journal whose missionis to cover the key trends and issues that confrontthe industry. It has been publishing technical arti-cles on challenges facing the semiconductor indus-try since its founding in 1957. Using this source,we created measures (discussed below) that char-acterize the extent of challenges in the key compo-nents and complements for each of the technologygenerations.
Finally, we obtained detailed market datafrom the leading industry consulting firm, VLSIResearch, which has been following the industrysince the1970s. The VLSI data included sales bytechnology generation for every firm that competedin the lithography equipment industry from 1974to 2005. Rebecca Henderson generously sharedher data on the contact printing generation. Ourfinal dataset consists of an unbalanced panel of 64
firm-technology generations. The average numberof observations per group is 10.4. Our data arecomprehensive and include information on eachof the 33 firms that ever sold a semiconductorlithography tool for mainstream semiconductorapplications.12
Variables
The definitions of the variables used to test ourhypotheses are summarized in Table 2 and detailedbelow.
Dependent variable
Our dependent variable, generation share, is afirm’s market share in a given technology gener-ation in a given year. This measure is consistentwith prior research studies that examine firm per-formance in new technology generations (Mitchell,1991; Henderson, 1993; Tripsas, 1997). Further,industry participants and observers (e.g., VLSIResearch, Gartner Dataquest) regularly use marketshare in a generation as a measure of firm success.
Our main analysis considers a firm’s marketshare in a given technology generation in a givenyear. As a test of robustness for Hypotheses 1 and2, reported in the Appendix, we also consider afirm’s cumulative market share over the entire lifeof the technology generation.
Independent variables
Our measures of component and complement chal-lenges were created using a count of Solid StateTechnology articles that discuss ecosystem chal-lenges. Our industry sources confirmed that a countof published articles that address technical prob-lems regarding an ecosystem element is a goodproxy for the level of technology challenges thatsurrounded the development of different lithogra-phy generations. Through our field work we devel-oped a list of keywords that we used to guide thearticle search.13
12 The current analysis excludes two firms from our samplebecause, although they produced lithography tools, they werecompeting in different markets. These firms entered the givenlithography generation during its declining phase and weretargeting niche markets such as thin film heads, pressure sensors,and biotech applications rather than the mainstream applicationsof semiconductor manufacturers.13 The keywords were: lithography, microphotographs, mask,photomask, resist, laser, UV, DUV, Deep UV, optical, lens,
Copyright 2009 John Wiley & Sons, Ltd. Strat. Mgmt. J., 31: 306–333 (2010)DOI: 10.1002/smj

Value Creation in Innovation Ecosystems 321
Table 2. Variable descriptions
Variables Description
Dependent variableGeneration share Firm’s market share in a given generation in a given year.
Key variables in studyTechnology leadership Entry timing for the firm in the new generation. Leadership position is defined as one
for the first entrant and subsequent entry is measured with respect to the lag inyears from the first entry.
Component challenge Number of technical articles that refer to lens and source innovation in the givengeneration that appear in the industry journal no later than five years after theemergence of the new generation.
Complement challenge Number of technical articles that refer to mask and resist innovation in the givengeneration that appear in the industry journal no later than five years after theemergence of the new generation.
Vertical integration Dummy = one for a firm with a separate business unit performing manufacturing oflens component for the generation.
Technology maturity Count of number of years between a technology generation’s year of first sale andthe given year.
Control variablesIncumbent Dummy = one for a firm that sold lithography tools in an earlier technology
generation.Conglomerate Dummy = one for a firm that was active in multiple industries.Generation sales growth Annual sales growth rate of the generation.Number of firms Number of firms active in the generation in a given year.
We identified a total of 181 lithography-relatedarticles that appeared from 1961 to 2001. We thenidentified articles that discussed ecosystem chal-lenges in a given generation. We used the articletitles to identify the match between the generationand the ecosystem element. If there was insuffi-cient information available in the title, we readthe abstract and the conclusion to ascertain if thearticle addressed the innovation challenges in theecosystem for a given generation. A small sub-set of articles discussed the ecosystem innovationchallenges for multiple generations, and for thesearticles we read the relevant sections for each gen-eration in order to create a match. This procedurereduced our set to 102 articles.
Finally, since our primary concern is withrespect to innovation challenges that confront tech-nology leaders as they pioneer technology gen-erations, we further reduced our set to includeonly those articles that were published no laterthan five years after the commercialization ofthe first tool in a generation. Another reason tochoose the five-year post-commercialization win-dow was to present a balanced view of upstream
stepper, aligner, mercury, illuminator, exposure, printer, and thenames of the different generations.
and downstream ecosystem challenges. The arti-cles published after the close of this five-yearwindow were almost entirely dedicated to dis-cussing complement challenges. This is not sur-prising, since by the fifth post-commercializationyear, much progress would have necessarily beenmade on the component side. Our final datasetconsisted of information from 56 articles that dis-cussed 78 ecosystem innovation challenges. Wetested robustness with three- and seven-year win-dows and the results are consistent with thosereported here.
We constructed the component challenge mea-sure as the sum of the number of articles that dis-cussed innovation challenges in the lens (innov lg)and the source (innov sg) for technology generationg.14
component challengeg = innovlg + innovsg
14 As validation of the article count measure, we tested itsconsistency with the qualitative descriptions revealed in ourinterviews and reported in Table 1. We coded the entries andnon-entries in Table 1 with values of one and zero respectively,and then compared them to the article count data. The correlationis 0.91 for source, 0.83 for lens, 0.92 for mask, and 0.89 forresist innovation challenges. This high correlation increases ourconfidence in the measure.
Copyright 2009 John Wiley & Sons, Ltd. Strat. Mgmt. J., 31: 306–333 (2010)DOI: 10.1002/smj

322 R. Adner and R. Kapoor
Similarly, complement challenge wasconstructed as the sum of the number of articlesthat discussed innovation challenges in the resist(innov rg) and the mask (innovmg).
complement challengeg = innovrg + innovmg
We measure a firm’s technology leadership asthe time of its entry into a new technology gener-ation relative to its rivals. We define entry as thefirst occurrence of revenue for a firm in a givengeneration. The first firm to enter the generationwas assigned a technology leadership value of one.Subsequent firms were assigned values with refer-ence to the years elapsed since the first entrant(e.g., a firm entering a generation three years afterthe leader was assigned a technology leadershipvalue of four).
To assess the effects of vertical integration onfirm performance, we construct the variable verti-cal integration. The variable takes a value of oneif the firm produced its own lens component in agiven technology generation and zero otherwise.During the history of the industry no tool manu-facturer produced its own energy source.
We define the variable technology maturity asthe number of years that have lapsed since the firstcommercial sale of a tool in the given technologygeneration, where the first year of commercialsales is coded as one.
Control variables
We control for a number of firm- and industry-level effects. Henderson and Clark (1990) andHenderson (1993) identified important differencesbetween incumbents and entrants during technol-ogy transitions in the semiconductor lithographyequipment industry. We control for this effectusing the variable incumbent, which takes a valueof one if a firm had sold lithography tools in anearlier technology generation.
We control for firm size through the variableconglomerate, which takes a value of one if thefirm was active in industries other than semi-conductor manufacturing equipment and zero oth-erwise. We include two industry level controls.The first is generation sales growth, a measure ofchange in tool sales (in dollars) in a given gener-ation in a given year, which represent the growthopportunities that may influence choices regard-ing investment in new technology generations. The
second is number of firms, which controls for thecompetitive density in the generation in a givenyear.
Statistical analysis
We use panel data for our empirical analysis. Eachpanel corresponds to a firm in a given technologygeneration. The use of panel data helps to controlfor potential sources of unobserved heterogeneityand enables us to test how the benefits of verticalintegration change over time during the course of agiven generation. While both the random- and thefixed-effects models allow for explicit considera-tion of the unobserved effects, the random-effectsmodel makes an additional assumption that theunobserved effect is uncorrelated with the indepen-dent variables. Although a fixed-effects approachwould require fewer assumptions than the random-effects approach, it cannot be used if the explana-tory variables do not vary within the experimentalgroup (Baltagi, 2005: 13). In our analysis, com-ponent challenges and complement challenges arethe key explanatory variables, but they do notexhibit intertemporal variation for a firm withina given generation. For this reason, we use arandom-effects model. We control for unobserveddifferences across firms by including firm dum-mies in a firm-generation panel (Wooldridge, 2002:288). We also include year dummies to control forunobserved year-specific effects. We estimate thefollowing equation:
yigt = β0 + Xigtb + Dil + Ttd + aig+uigt
where yigt is firm i’s market share in a generationg in year t ; Xigt is the vector of independent andcontrol variables; Di is the vector of dummies foreach firm; Tt is the vector of dummies for eachyear; aig is the unobserved heterogeneity for a firmin a generation that is assumed to be uncorrelatedwith the explanatory variables; and uigt is the errorterm.
RESULTS
Descriptive relationships
Figure 5 illustrates the varying degrees of com-ponent and complement challenges in each of thenine technology generations. As can be seen from
Copyright 2009 John Wiley & Sons, Ltd. Strat. Mgmt. J., 31: 306–333 (2010)DOI: 10.1002/smj

Value Creation in Innovation Ecosystems 323
Resist
Mask
Lens
Source
Contact Proximity Projection E-beam X-ray G-line I-line DUV 248 DUV 193
Ecosystem challengea 8 0 5 11 15 5 7 13 14
aThe magnitude of ecosystem challenge is obtained by aggregating the number of article discussions for each of the ecosystemelements in a given generation.
Figure 5. Distribution of challenges among ecosystem elements in nine semiconductor lithography equipmentgenerations
the figure, each of the technology generations pre-sented a distinct combination of ecosystem chal-lenges. This is a key source of variance that weexploit in this study.
The descriptive statistics and pairwise correla-tions for the variables used in the study are pre-sented in Table 3. The statistically significant neg-ative correlation between technology leadership(where lower values indicate earlier entry timing)and generation share suggests that early entry isrewarded with higher market share in the semi-conductor lithography equipment market. Sincecomponent challenges and complement challengesare moderately correlated, we estimate their coeffi-cients in separate models, as well as in a combinedmodel, to alleviate concerns regarding multicolin-earity.
Tests of the hypotheses
Our hypotheses predict the impact of externalecosystem challenges on the entry timing advan-tage that accrues to technology leaders, and theimpact of vertical integration decisions on firm per-formance over the course of the technology lifecycle. We test Hypotheses 1 and 2 by interact-ing firms’ technology leadership with measures ofecosystem challenges. We mean centered the vari-ables in the interaction terms. The mean centeringof continuous variables helps to reduce potentialmulticolinearity and facilitates the interpretation ofthe estimated coefficients (Aiken and West, 1991).We test Hypothesis 3 by interacting firms’ verticalintegration status with the generation’s technol-ogy maturity. Consistent with prior empirical stud-ies examining market share performance in new
technology generations (Henderson, 1993; Tripsas,1997), we use a semi-log specification to test ourhypotheses.
Table 4 reports our regression results. Model 1 isour baseline model. Consistent with conventionalwisdom in the industry, the coefficient for tech-nology leadership is statistically significant andnegative, indicating benefits to technology lead-ership. We find that incumbency has a negativeeffect, which is consistent with Henderson’s (1993)empirical findings. The coefficient for vertical inte-gration is statistically significant and positive, sug-gesting that in-house component manufacturing isa source of advantage in this industry. The coeffi-cient for complement challenge is also statisticallysignificant and positive. While not hypothesized,this finding indicates that on average, the marketshare of a firm is greater when complement chal-lenges are high than when complement challengesare low. Given that an increase in a firm’s mar-ket share translates to a decline in rivals’ marketshares, the result suggests that greater complementchallenges may result in lower variance among thefirms’ market shares so as to increase the meanmarket share level of the population. We computedthe coefficient of variation for a firm’s marketshare at different values of complement challengesand consistent with the above finding, the cor-relation between complement challenges and thecoefficient of variation was negative.15 Among theindustry-level controls, the coefficient for numberof firms is negative and statistically significant,
15 We note that when we exclude the X-ray and e-beam gen-erations in Model 6 (below) the direct effect of complementchallenge remains positive but is statistically insignificant.
Copyright 2009 John Wiley & Sons, Ltd. Strat. Mgmt. J., 31: 306–333 (2010)DOI: 10.1002/smj
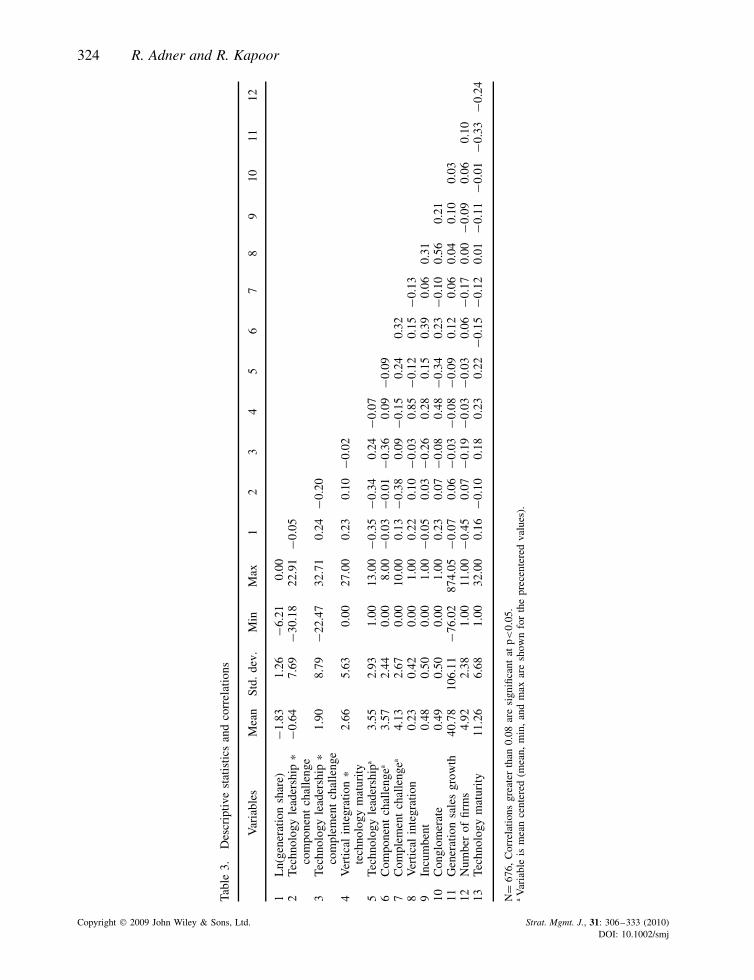
324 R. Adner and R. Kapoor
Tabl
e3.
Des
crip
tive
stat
istic
san
dco
rrel
atio
ns
Var
iabl
esM
ean
Std.
dev.
Min
Max
12
34
56
78
910
1112
1L
n(ge
nera
tion
shar
e)−1
.83
1.26
−6.2
10.
002
Tech
nolo
gyle
ader
ship
*co
mpo
nent
chal
leng
e−0
.64
7.69
−30.
1822
.91
−0.0
5
3Te
chno
logy
lead
ersh
ip*
com
plem
ent
chal
leng
e1.
908.
79−2
2.47
32.7
10.
24−0
.20
4V
ertic
alin
tegr
atio
n*
tech
nolo
gym
atur
ity2.
665.
630.
0027
.00
0.23
0.10
−0.0
2
5Te
chno
logy
lead
ersh
ipa
3.55
2.93
1.00
13.0
0−0
.35
−0.3
40.
24−0
.07
6C
ompo
nent
chal
leng
ea3.
572.
440.
008.
00−0
.03
−0.0
1−0
.36
0.09
−0.0
97
Com
plem
ent
chal
leng
ea4.
132.
670.
0010
.00
0.13
−0.3
80.
09−0
.15
0.24
0.32
8V
ertic
alin
tegr
atio
n0.
230.
420.
001.
000.
220.
10−0
.03
0.85
−0.1
20.
15−0
.13
9In
cum
bent
0.48
0.50
0.00
1.00
−0.0
50.
03−0
.26
0.28
0.15
0.39
0.06
0.31
10C
ongl
omer
ate
0.49
0.50
0.00
1.00
0.23
0.07
−0.0
80.
48−0
.34
0.23
−0.1
00.
560.
2111
Gen
erat
ion
sale
sgr
owth
40.7
810
6.11
−76.
0287
4.05
−0.0
70.
06−0
.03
−0.0
8−0
.09
0.12
0.06
0.04
0.10
0.03
12N
umbe
rof
firm
s4.
922.
381.
0011
.00
−0.4
50.
07−0
.19
−0.0
3−0
.03
0.06
−0.1
70.
00−0
.09
0.06
0.10
13Te
chno
logy
mat
urity
11.2
66.
681.
0032
.00
0.16
−0.1
00.
180.
230.
22−0
.15
−0.1
20.
01−0
.11
−0.0
1−0
.33
−0.2
4
N=
676,
Cor
rela
tions
grea
ter
than
0.08
are
sign
ifica
ntat
p<0.
05.
aV
aria
ble
ism
ean
cent
ered
(mea
n,m
in,
and
max
are
show
nfo
rth
epr
ecen
tere
dva
lues
).
Copyright 2009 John Wiley & Sons, Ltd. Strat. Mgmt. J., 31: 306–333 (2010)DOI: 10.1002/smj

Value Creation in Innovation Ecosystems 325
Table 4. Coefficient estimates from random effects OLS regressions; dependent variable = Ln(generation share)
Model 1 Model 2 Model 3 Model 4 Model 5 Model 6a
Technology leadership *component challenge
−0.040∗∗∗ −0.042∗∗∗ −0.044∗∗∗
(0.009) (0.009) (0.013)Technology leadership *
complement challenge0.022∗∗ 0.020∗∗ 0.020∗
(0.009) (0.008) (0.011)Vertical integration *
technology maturity0.034∗∗ 0.041∗∗∗ 0.029∗
(0.016) (0.016) (0.017)Technology leadership −0.146∗∗∗ −0.148∗∗∗ −0.163∗∗∗ −0.142∗∗∗ −0.158∗∗∗ −0.156∗∗∗
(0.022) (0.019) (0.020) (0.022) (0.018) (0.024)Vertical integration 0.406∗∗∗ 0.245 0.398∗∗ 0.047 −0.205 0.012
(0.156) (0.151) (0.156) (0.231) (0.227) (0.281)Component challenge −0.036 −0.045 −0.001 −0.052 −0.033 −0.035
(0.047) (0.044) (0.048) (0.049) (0.047) (0.115)Complement challenge 0.102∗∗∗ 0.074∗∗∗ 0.086∗∗∗ 0.104∗∗∗ 0.061∗∗∗ 0.028
(0.025) (0.022) (0.024) (0.025) (0.023) (0.031)Technology maturity 0.003 −0.025 0.014 −0.011 −0.033 −0.029
(0.017) (0.018) (0.017) (0.019) (0.020) (0.040)Incumbent −0.609∗∗∗ −0.757∗∗∗ −0.423∗∗∗ −0.658∗∗∗ −0.655∗∗∗ −0.769∗∗∗
(0.124) (0.127) (0.144) (0.127) (0.151) (0.253)Conglomerate 0.875 −0.215 0.397 2.845∗∗∗ 2.697∗∗∗ 2.812∗∗∗
(0.585) (0.579) (0.541) (0.310) (0.355) (0.447)Generation sales growth −0.000 −0.001 −0.000 −0.000 −0.001 −0.000
(0.000) (0.000) (0.000) (0.000) (0.000) (0.000)Number of firms −0.183∗∗∗ −0.181∗∗∗ −0.179∗∗∗ −0.189∗∗∗ −0.184∗∗∗ −0.178∗∗∗
(0.020) (0.020) (0.020) (0.020) (0.020) (0.024)Constant −1.066 0.194 −1.393 −3.190∗∗∗ −2.407∗∗∗ −2.401∗∗
(0.867) (0.951) (0.860) (0.613) (0.655) (1.126)Firm dummies Included Included Included Included Included IncludedYear dummies Included Included Included Included Included IncludedR-squared (within) 0.17 0.17 0.17 0.19 0.19 0.19R-squared (between) 0.77 0.83 0.78 0.77 0.83 0.83R-squared (overall) 0.58 0.61 0.60 0.59 0.62 0.62Observations 676 676 676 676 676 521
Robust standard errors in parentheses clustered for intra-panel correlation, ∗ significant at 10%; ∗∗ significant at 5%; ∗∗∗ significantat 1%.a Model 6 excludes observations from X-ray and e-beam generations.
confirming the negative effects of competitive den-sity on firms’ market share performance.
In Model 2 we interact technology leadershipwith component challenge to test Hypothesis 1. InModel 3 we interact technology leadership withcomplement challenge to test Hypothesis 2. InModel 4 we interact vertical integration with tech-nology maturity to test Hypothesis 3. Model 5 isthe fully specified model.
Hypothesis 1 predicted that greater compo-nent challenges will increase the performanceadvantage accorded to technology leaders. Thehypothesis is supported in Models 2 and 5. Thecoefficient of the interaction term between tech-
nology leadership and component challenge isnegative and statistically significant. Hence, thegreater the challenges in components, the greaterthe market share benefit that accrues to technologyleaders.
Hypothesis 2 predicted that greater complementchallenges will decrease the performance advan-tage accorded to technology leaders, and is sup-ported in Models 3 and 5. The coefficient ofthe interaction term between technology leader-ship and complement challenge is positive and sta-tistically significant. Therefore, complement chal-lenges in the firms’ ecosystem erode the benefitsthat accrue to technology leaders.
Copyright 2009 John Wiley & Sons, Ltd. Strat. Mgmt. J., 31: 306–333 (2010)DOI: 10.1002/smj

326 R. Adner and R. Kapoor
Hypothesis 3 predicted that the advantage fromvertical integration will increase over the course ofthe technology life cycle. The positive and signif-icant coefficient of the interaction term betweenvertical integration and technology maturity inModels 4 and 5 supports the hypothesis.
Robustness tests
We tested the robustness of our results in a num-ber a ways. First, we considered the X-ray andelectron-beam (e-beam) generations as possibleanomalies. These were the only technology gen-erations not to achieve market dominance even intheir peak sales years. This however, was only evi-dent ex post. Ex ante, these two generations hadgarnered very strong interest and support amongindustry participants who believed that these gen-erations represented the future of lithography tech-nology. As a robustness test, we present Model 6in Table 4, which excluded the X-ray and e-beamtechnology generations and whose results are fullyconsistent with our predictions.
Second, as a test of robustness for Hypotheses1 and 2, we include Table A1 in the Appendix,which shows results from a cross-sectional spec-ification estimated using ordinary least squares(OLS) regression for a firm’s cumulative mar-ket share in a given generation. The results arefully consistent with our predictions. As an addi-tional test of robustness for Hypotheses 1 and 2,we reconfigured our panel data from grouping by‘firm in a generation’ to grouping by ‘firm.’ Thisspecification allowed us to estimate a traditionalfixed-effects specification. However, it requiredthat we right censor observations of firms’ par-ticipation in older generations beginning in theyear in which they introduce their new genera-tion products (because the panel can only have oneobservation per firm per year). In addition, becausethe fixed-effects estimation requires temporal vari-ance within a panel, it effectively excludes firmsthat participated in only one technology gener-ation. These exclusions reduced the number ofobservations from 676 to 406. The results of thismore conservative test are fully consistent with ourmain results and are reported in Table A2 in theAppendix.
Third, we split component and complementchallenges into their individual elements of source,lens, mask, and resist, to ensure that our results are
not driven by a specific element. Again, the resultsare fully supportive of our predictions.
Fourth, it is possible that vertically integratedfirms may systematically enter a generation lateand ramp up much faster than their nonintegratedrivals. We checked for this possibility by compar-ing the technology leadership values for verticallyintegrated firms with those of nonintegrated firms.We did not find a significant difference between thetwo subgroups (t = 0.90, p = 0.37). Finally, in ourcontext, the first two years are typically character-ized by ramp-up challenges. For this reason weperformed a robustness test by excluding the datafor the first two years of each firm’s participation ina new technology generation. Our predicted rela-tionship continued to be statistically significant.
DISCUSSION
Firms face considerable challenges in resolving theuncertainty that surrounds the development andproduction of an innovation. Extant innovationresearch has provided a rich set of dimensionsto characterize the innovators’ internal challengesand to explain performance outcomes (Tushmanand Anderson, 1986; Henderson and Clark, 1990;Christensen, 1997). However, the challenges thataccompany an innovation are often situated notonly within a focal firm but also in the firm’secosystem of upstream suppliers and downstreamcustomers and complementors. In this study, wemove beyond the literature’s traditional analysisof an innovating firm’s internal challenges to alsoconsider the external challenges confronted bypartners in its ecosystem.
In considering external innovation challenges,we present a structured framework based on theflow of activities in the ecosystem to distin-guish between those challenges whose resolutiondepends on suppliers and those whose resolutiondepends on complementors. We examine how suchexternal innovation challenges affect the benefitthat technology leaders derive from pioneering anew innovation. We find that, depending on theirlocation, challenges in the external ecosystem caneither enhance or erode a firm’s competitive advan-tage from technology leadership. Specifically, wefind that while the advantage from technologyleadership increases with component challenges, itdecreases with complement challenges. Challengesin components increase the technology leader’s
Copyright 2009 John Wiley & Sons, Ltd. Strat. Mgmt. J., 31: 306–333 (2010)DOI: 10.1002/smj

Value Creation in Innovation Ecosystems 327
−15.00%
−10.00%
−5.00%
0.00%
0 10
Mar
ket
shar
e d
iffe
ren
ce b
etw
een
follo
wer
an
d le
ader
Follower′s entry lag (years)
Low component/ lowcomplementchallengeHigh component/ low complement challengeLow component/high complementchallenge
1 2 3 4 5 6 7 8 9
Figure 6. Difference in expected market share between a technology leader and a follower as a function of ecosystemchallenge and the follower’s entry timing lag
competitive advantage by increasing the potentialfor learning and by increasing barriers to imita-tion. In contrast, challenges in complements reducethe technology leader’s competitive advantage byslowing its advance down the learning curve andby increasing opportunities for rivals to catch up.
Figure 6 uses the estimates from Model 5 to plotthe effect of technology leadership on firms’ mar-ket share performance for different combinationsof ecosystem challenges. The vertical axis mea-sures the difference in average annual market sharebetween the technology leader and a follower. Thehorizontal axis is the lag, in years, between theentry times of the leader and the follower, wherea value of zero denotes simultaneous entry. Weplot three component-complement challenge sce-narios, where high (low) corresponds to a +1(−1) standard deviation above (below) our sam-ple mean. The baseline case, ‘low component-, lowcomplement-challenge’ shows a downward slopingcurve indicating that when ecosystem challengesare low, the technology leader is advantaged rel-ative to the follower. As discussed above, thisfinding is highly consistent with the establishedbeliefs in the semiconductor lithography equip-ment industry. In the case of ‘high component-,low complement-challenge’ we find that the slopeis even more negative, indicating that technologyleaders enjoy an even greater competitive advan-tage. To get a sense for the economic magnitudeof these differences, consider that in 2004 a onepercent market share difference in the DUV 248generation corresponded to $28.7 million in sales.Finally, in the ‘low component-, high complement-challenge’ case we find a weakly upward sloping
curve. This finding indicates that when comple-ment challenges are high, technology leadership isless beneficial; indeed, in our specific context, wefind that the leader is at a slight disadvantage tolater followers.
The implication of Figure 6, as an illustrativesummary of our arguments and findings, for thedebates regarding early mover advantages is astrong one. Moving beyond the debate of existencevs. nonexistence of first mover advantages (e.g.,Golder and Tellis, 1993; Lieberman and Mont-gomery, 1988, 1998), we have identified specificcontingencies that determine the extent of technol-ogy leadership. Further, the mechanisms that weidentify regarding the opposing effects of compo-nent and complement challenges expand the analy-sis of first mover advantage beyond the traditionalfirm-centered focus to incorporate specific featuresof the external environment.
Beyond environmental contingency, we alsoexamine vertical integration as a strategy for man-aging ecosystem challenges. We suggest that whencontracting with suppliers for innovative compo-nents, the focal firm faces two specific kinds ofuncertainty. The first is the technological uncer-tainty surrounding whether and when suppliers willdiscover appropriate solutions to their own devel-opment challenges. The second is the behavioraluncertainty regarding whether and when supplierswill behave opportunistically to renegotiate agree-ments and reset terms in their own favor. We notethat while technology uncertainty is resolved andreduced over the course of the technology lifecycle, behavioral uncertainty does not necessar-ily decrease over time. This asymmetry suggests
Copyright 2009 John Wiley & Sons, Ltd. Strat. Mgmt. J., 31: 306–333 (2010)DOI: 10.1002/smj

328 R. Adner and R. Kapoor
that the balance between technological uncertaintyand behavioral uncertainty will tend to tilt towardthe latter over time. As such, we argue and findthat the benefits derived from vertical integrationshould increase over the course of the technol-ogy life cycle. This empirical finding is consistentwith recent studies conducted in the context of theautomotive industry (Argyres and Bigelow, 2007;Novak and Stern, 2008).
Distinguishing between innovation challengesthat reside upstream and downstream of a focalfirm reveals important asymmetries in their effecton the firm’s ability to create value with its offer.The impact of upstream component challenges,which prevent the firm from offering its inno-vation to the market, are qualitatively differentfrom downstream complement challenges, whichprevent the focal firm’s customers from utilizingthe innovation to its full potential. Although bothresult in bottlenecks to value creation, they haveopposite effects on the firm’s ability to capturevalue and create competitive advantage. This find-ing supports recent calls in the literature that arguefor the importance of understanding the dynamicsof value creation as a precursor to the analysisof value capture (Brandenburger and Stuart, 1996;Adner and Zemsky, 2006).
By expanding the scope of inquiry beyond thetraditional firm boundaries, the current paper offersan additional lens for understanding technologyevolution and firm performance. The ecosystemdynamics that we explore seem to characterize alarge, and growing, number of innovation environ-ments. Prior research literature has often linkedthe resolution of technological uncertainty to theemergence of dominant designs (Utterback andAbernathy, 1975; Anderson and Tushman, 1990)and industry standards (Cusumano, Mylonadis, andRosenbloom, 1992). The ecosystem perspectivepresented here suggests that the readiness of com-plements can play a similar role, no less decisive,in the resolution of this uncertainty.
Further, our findings hold a potential man-agerial implication regarding managing invest-ments in new technologies. Investing to accel-erate commercialization cycles in the pursuit offirst mover advantage makes most sense in set-tings characterized by high component innova-tion challenges and low complement innovationchallenges; such investments are likely to beless beneficial in settings characterized by high
complement challenges. In many settings, rela-tive challenge levels across the ecosystem canbe identified well in advance of the commercial-ization of the innovation. For example, in thecontext of the semiconductor lithography equip-ment industry, we found articles discussing ecosys-tem challenges that appeared in print up to sixyears before the technology generation was actu-ally commercialized. Our interviews confirm thisperspective.
Finally, we contribute to the research literaturein organizational theory that examines the inter-actions between the firms and their environments(Lawrence and Lorsch, 1967; Dess and Beard,1984). While prior studies have highlighted theimportance of environmental uncertainty in affect-ing firms’ internal structures, decision processesand performance, they have not given a clearstructure in which to assess the impact of dis-tinct elements of the environment. In the absenceof such structure, the research literature’s char-acterization of uncertainty in the external envi-ronment has tended to remain at an aggregatedlevel—for example, distinguishing between sta-ble vs. variable (Lawrence and Lorsch, 1967), lowvs. high velocity (Eisenhardt, 1989), and smoothvs. abrupt development (Suarez and Lanzolla,2007). Although these aggregate characterizationshave yielded important insights, we believe that afiner-grained level of analysis can offer additionalfindings.
Our results also suggest a modification to cur-rent approaches to analyzing networks. Networktheory has concentrated on how the social structureof exchange relationships influences firm outcomes(Burt, 1992). A common operationalization is toexamine the structure of ties among actors in anetwork, distinguishing between direct and indirectrelationships. The current study introduces a sensi-tivity to the flow of activity within such networks,differentiating between upstream and downstreamroles. This distinction raises a new set of questionsregarding the impact of network ties to differentroles within a network: we expect that the implica-tions of direct ties will differ depending on whetherone is considering a focal firm’s direct upstreamtie to its supplier or direct downstream tie to itscustomer; similarly, we expect the implicationsof indirect ties to depend on whether the link isupstream, to a supplier’s supplier or downstream,to a complementor.
Copyright 2009 John Wiley & Sons, Ltd. Strat. Mgmt. J., 31: 306–333 (2010)DOI: 10.1002/smj

Value Creation in Innovation Ecosystems 329
In considering our findings with regard to earlymover advantage, the question arises: Shouldn’tfirms, in recognizing the effect of complementinnovation challenges in delaying market adop-tion of new technologies, change their strategiesand forgo early entry? Our field interviews sug-gest that firms, at least in our setting, are generallymore focused on managing component challengesthan complement challenges. Since the deliveryof the firm’s product is so dependent on the per-formance of suppliers, managerial attention seemsto be especially focused on identifying any andall potential sources of production bottlenecks.In contrast, complement challenges command lessattention—while it is clear that technology man-agers are largely responsible for production, whois responsible for complementors? Marketing andsales managers are the natural candidates, but theirmandate is to focus on direct customer needs.In general, when customers discuss obstacles andopportunities with representatives of the focal firm,they tend to discuss the issues over which thefirm has actual control (e.g., performance, deliv-ery times, service levels, etc.) rather than externalfactors over which the firm is relatively power-less (e.g., progress of complements). This distinc-tion raises an additional set of questions regardinghow firms’ external coordination requirements arereflected in their internal organizational structures.
The current study, of course, has a number oflimitations. While we have taken care in our esti-mation and included firm and year dummies toaccount for unobserved differences across firmsand time periods, there are several potential con-cerns with respect to endogeneity. Our focus ison the effect of component and complement chal-lenges that arise during technology transitions.During these transitions, focal firms also facedinnovation challenges in their core activities, butdue to nonavailability of data we were unable tomeasure their extent. This omission could bias ourresults if focal innovation challenges were corre-lated with external challenges. However, descrip-tive evidence suggests that there is no systematiccorrelation between the core innovation challengeand challenges in components and complements.For example, in the proximity generation, while thetool manufacturers faced significant challenges indesigning and manufacturing the new architecture,there were no major changes required anywhereelse in the ecosystem. For completeness, we docontrol for the fact that incumbents are likely to
face greater challenges across the technologicaltransitions than entrants as discussed by Hendersonand Clark (1990) and find support for this argu-ment.
In addition, although we characterize the loca-tion relationships among ecosystem actors, wehave no visibility as to the history and natureof specific exchange relationships among theseactors and how these might affect their interac-tions (Argyres and Liebeskind, 2002). Future stud-ies could address these limitations by incorporatinghow actors coordinate through mechanisms such asalliances and relational contracts within the contextof innovation ecosystems.
Finally, the current study is conducted in thecontext of a single industry, such that its replica-tion in other contexts would extend its generaliz-ability. Although we believe that the underpinningdrivers we have identified hold across settings, it isquite possible that their effects can be drowned outby other factors that can dominate in other settings(e.g., strategic interactions, the specific nature oftechnological change, demand uncertainty, modesof cross-firm coordination, etc.). As such, we viewthis study as presenting a baseline structure uponwhich other factors and considerations can be over-laid. In this regard, we are careful to character-ize our hypotheses and findings as regarding theextent, rather than the absolute level of early moveradvantages.
This study has presented an ecosystem lens toexamine the conditions under which technologyleadership yields competitive advantage. We haveargued and shown that the benefit of technologyleadership depends on both the location and themagnitude of uncertainty within the ecosystem.We have examined the effectiveness of verticalintegration as a strategy to manage ecosystemuncertainty and have identified the impact of thetechnology life cycle in determining its benefits.
Ecosystem settings raise a new set of issuesfor both researchers and managers to consider.Choices regarding both business model design andorganization design need to be revisited in thelight of joint value creation. Questions regardingdevelopment incentives (Casadesus-Masanell andYoffie, 2007), positioning and coordination choices(Iansiti and Levien, 2004; Gawer and Cusumano,2002), customer expectations (Adner, 2004), andvalue chain configuration (Jacobides and Billinger,2006) all become more visible and more importantin the context of ecosystems. We hope that our
Copyright 2009 John Wiley & Sons, Ltd. Strat. Mgmt. J., 31: 306–333 (2010)DOI: 10.1002/smj

330 R. Adner and R. Kapoor
developed framework and analysis can offer addi-tional avenues along which such questions can befruitfully addressed.
ACKNOWLEDGEMENTS
We thank Phil Anderson, Pino Audia, RamonCasadesus-Masanell, Kathy Eisenhardt, CharlesGalunic, Martin Gargiulo, Javier Gimeno, RebeccaHenderson, Dan Levinthal, Bill Lazonick, Alessan-dro Lomi, Marwan Sinaceur, Jasjit Singh, OlavSorenson, Michael Tushman, Peter Zemsky andseminar participants at Dartmouth, Duke, Harvard,Michigan, NYU, and Tilburg for their helpful com-ments, as well as attendees at the 2006 AOM,ACAC, and Druid conferences. We are also grate-ful to the associate editor and two anonymousreviewers for insightful feedback. Finally, we espe-cially thank VLSI Research and Rebecca Hen-derson for their generosity in sharing their datawith us.
REFERENCES
Adner R. 2004. A demand-based perspective on technol-ogy life cycles. Advances in Strategic Management 21:25–53.
Adner R. 2006. Match your innovation strategy toyour innovation ecosystem. Harvard Business Review84(4): 98–107.
Adner R, Zemsky P. 2006. A demand-based perspectiveon sustainable competitive advantage. StrategicManagement Journal 27(3): 215–239.
Afuah A. 2000. How much do your co-opetitors’capabilities matter in the face of technological change?Strategic Management Journal , March Special Issue21: 387–404.
Afuah A, Bahram N. 1995. The hypercube of innovation.Research Policy 24(1): 51–76.
Aiken LS, West SG. 1991. Multiple Regression: Testingand Interpreting Interactions . Sage: Newbury Park,CA.
Anderson PC, Tushman ML. 1990. Technological discon-tinuities and dominant designs. Administrative ScienceQuarterly 35(4): 604–633.
Argote L. 1999. Organizational Learning: Creating,Retaining and Transferring Knowledge. Kluwer:Norwell, MA.
Argyres NS, Bercovitz J, Mayer KJ. 2007. Complemen-tarity and evolution of contractual provisions: anempirical study of IT services contracts. OrganizationScience 18(1): 3–19.
Argyres N, Bigelow L. 2007. Does transaction mis-alignment matter for firm survival at all stages ofthe industry life cycle? Management Science 53(8):1332–1344.
Argyres NS, Liebeskind JP. 2002. Governance insepara-bility and the evolution of the biotechnology industry.Journal of Economic Behavior and Organization 47:197–219.
Balasubramanian N, Lieberman MB. 2006. Industrylearning environments and the heterogeneity offirm performance. Working paper CES-WP 06–29.U.S. Census Bureau, Center for Economic Studies,Suitland, MD.
Baltagi B. 2005. Econometric Analysis of Panel Data (3rdedn). Wiley: New York.
Brandenburger AM, Nalebuff BJ. 1997. Co-Opetition:A Revolution Mindset That Combines Competitionand Cooperation: The Game Theory Strategy That’sChanging the Game of Business . Currency: New York.
Brandenburger AM, Stuart HW. 1996. Value-based busi-ness strategy. Journal of Economics & ManagementStrategy 5: 5–24.
Brusoni S, Prencipe A. 2001. Unpacking the black box ofmodularity: technologies, products and organizations.Industrial and Corporate Change 10: 179–205.
Brusoni S, Prencipe A, Pavitt K. 2001. Knowledgespecialization, organizational coupling, and theboundaries of the firm: why do firms know morethan they make? Administrative Science Quarterly 46:597–621.
Burt RS. 1992. Structural Holes: The Social Structure ofCompetition . Harvard University Press: Cambridge,MA.
Casadesus-Masanell R, Yoffie DB. 2007. Wintel: coop-eration and conflict. Management Science 53(4):584–598.
Christensen CM. 1997. Innovator’s Dilemma: When NewTechnologies Cause Great Firms to Fail . HarvardBusiness School Press: Boston, MA.
Christensen CM, Rosenbloom RS. 1995. Explainingthe attacker’s advantage: technological paradigms,organizational dynamics, and the value network.Research Policy 24(2): 233–257.
Christensen CM, Suarez FF, Utterback JM. 1998. Strate-gies for survival in fast-changing industries. Manage-ment Science 44(12): S207–S220.
Clark KB. 1985. The interaction of design hierarchies andmarket concepts in technological evolution. ResearchPolicy 14: 235–251.
Clark KB, Fujimoto T. 1991. Product DevelopmentPerformance. Harvard Business School Press: Boston,MA.
Cooper AC, Schendel D. 1976. Strategic response totechnology threats. Business Horizons 19(1): 61–69.
Cusumano M, Mylonadis Y, Rosenbloom R. 1992Strategic maneuvering and mass market dynamics: thetriumph of VHS over Beta.. Business History Review66(1): 51–94.
Dess GG, Beard DW. 1984. Dimensions of organi-zational task environments. Administrative ScienceQuarterly 29(1): 52–73.
Dosi G. 1982. Technological paradigms and technologicaltrajectories. Research Policy 11: 147–162.
Dutton J, Thomas A. 1984. Treating progress functionsas a managerial opportunity. Academy of ManagementReview 9(2): 235–247.
Copyright 2009 John Wiley & Sons, Ltd. Strat. Mgmt. J., 31: 306–333 (2010)DOI: 10.1002/smj
Value Creation in Innovation Ecosystems 331
Dyer JH. 1996. Specialized supplier networks as asource of competitive advantage: evidence from theauto industry. Strategic Management Journal 17(4):271–291.
Dyer JH, Hatch NW. 2006. Relation-specific capabilitiesand barriers to knowledge transfers: creating advan-tage through network relationships. Strategic Manage-ment Journal 27(8): 701–719.
Dyer JH, Singh H. 1998. The relational view: coopera-tive strategy and sources of inter-organizational com-petitive advantage. Academy of Management Review23(4): 660–679.
Eisenhardt KM. 1989. Making fast strategic decisions inhigh-velocity environments. Academy of ManagementJournal 32(3): 543–576.
Ethiraj SK. 2007. Allocation of inventive effort incomplex product systems. Strategic ManagementJournal 28(6): 563–584.
Fine CH. 1998. Clockspeed: Winning Industry Controlin the Age of Temporary Advantage. Perseus Books:Reading, MA.
Gawer A, Cusumano MA. 2002. Platform Leadership:How Intel, Microsoft, and Cisco Drive IndustryInnovation . Harvard Business School Press: Boston,MA.
Golder PN, Tellis GJ. 1993. Pioneer advantage: market-ing logic or marketing legend? Journal of MarketingResearch 30(2): 158–170.
Goldfarb B. 2005. Diffusion of general-purpose technolo-gies: understanding patterns in the electrification of USManufacturing 1880–1930. Industrial and CorporateChange 14(5): 745–773.
Hatch NW, Mowery DC. 1998. Process innovation andlearning by doing in semiconductor manufacturing.Management Science 44(11): 1461–1477.
Henderson R. 1993. Underinvestment and incompetenceas responses to radical innovation: evidence fromthe photolithographic alignment equipment industry.RAND Journal of Economics 24(2): 248–270.
Henderson RM. 1995. Of life cycles real and imaginary:the unexpectedly long old age of optical lithography.Research Policy 24(4): 631–643.
Henderson RM, Clark KB. 1990. Architectural innova-tion: the reconfiguration of existing product technolo-gies and the failure of established firms. AdministrativeScience Quarterly 35(1): 9–30.
Hoetker G. 2006. Do modular products lead to modularorganizations? Strategic Management Journal 27(6):501–518.
Hughes TP. 1983. Networks of Power: Electrificationin Western Society 1880–1930 . Johns HopkinsUniversity Press: Baltimore, MD.
Iansiti M. 1998. Technology Integration: Making CriticalChoices in a Dynamic World . Harvard BusinessSchool Press: Boston, MA.
Iansiti M, Levien R. 2004. The Keystone Advantage:What the New Dynamics of Business Ecosystems Meanfor Strategy, Innovation, and Sustainability . HarvardBusiness School Press: Boston, MA.
Intel Corporation. 2004. Intel sees unified platform andecosystem as key to enabling the digital home. Pressrelease 17 February.
Jacobides MG, Billinger S. 2006. Designing the bound-aries of the firm: from make, buy, or ally to thedynamic benefits of vertical architecture. OrganizationScience 17(2): 249–261.
Jacobides MG, Knudsen T, Augier M. 2006. Benefitingfrom innovation: value creation, value appropriationand the role of industry architectures. Research Policy35(8): 1200–1221.
Jap SD, Anderson E. 2003. Safeguarding interorga-nizational performance and continuity under expost opportunism. Management Science 49(12):1684–1701.
Kapoor R, Adner R. 2007. Technology interdependenceand the evolution of semiconductor lithography. SolidState Technology 50(11): 51–54.
Kapoor R, Adner R. 2009. What firms make vs. whatthey know: how firms’ production and knowledgeboundaries affect competitive advantage in the faceof technological change. Working paper, Tuck Schoolof Business, Dartmouth College, Hanover, NH.
Kerin RA, Varadarajan PR, Peterson RA. 1992. First-mover advantage: a synthesis, conceptual framework,and research propositions. Journal of Marketing 56(4):33–52.
Klein B. 1988. Vertical integration as organizational own-ership: the Fisher Body-General Motors relationshiprevisited. Journal of Law, Economics, & Organization4(1): 199–213.
Klein B. 2000. Fisher-General Motors and the natureof the firm. Journal of Law and Economics 43(1):105–142.
Lawrence PR, Lorsch JW. 1967. Organization and Envi-ronment: Managing Differentiation and Integration .Harvard Business School Press: Boston, MA.
Lieberman MB. 1984. The learning curve and pricing inthe chemical processing industries. RAND Journal ofEconomics 15(2): 213–228.
Lieberman MB. 1989. The learning curve, technologicalbarriers to entry, and competitive survival in thechemical processing industries. Strategic ManagementJournal 10(5): 431–447.
Lieberman MB, Montgomery DB. 1988. First-moveradvantages. Strategic Management Journal, SummerSpecial Issue 9: 41–58.
Lieberman MB, Montgomery DB. 1998. First-mover(dis)advantages: retrospective and link with theresource-based view. Strategic Management Journal19(12): 1111–1125.
Lippman SA, Rumelt RP. 1982. Uncertain imitability:an analysis of interfirm differences in efficiencyunder competition. Bell Journal of Economics 13(2):418–438.
Mayer KJ, Argyres NS. 2004. Learning to contract:evidence from the personal computer industry.Organization Science 15(4): 394–410.
Milgrom P, Roberts J. 1990. The economics of modernmanufacturing: technology, strategy and organization.American Economic Review 80(3): 511–528.
Mitchell W. 1989. Whether and when? Probabilityand timing of incumbents’ entry into emergingindustrial subfields. Administrative Science Quarterly34: 208–230.
Copyright 2009 John Wiley & Sons, Ltd. Strat. Mgmt. J., 31: 306–333 (2010)DOI: 10.1002/smj

332 R. Adner and R. Kapoor
Mitchell W. 1991. Dual clocks: entry order influences onincumbent and newcomer market share and survivalwhen specialized assets retain their value. StrategicManagement Journal 12(2): 85–100.
Moore GE. 1995. Lithography and the future ofMoore’s law. Optical/Laser Microlithography VIII:Proceedings of the SPIE 2440: 2–17.
Moore JF. 1996. The Death of Competition: Leadershipand Strategy in the Age of Business Ecosystems .Harper Business: New York.
Novak S, Stern S. 2008. How does outsourcing affectperformance dynamics? Evidence from the automobileindustry. Management Science 54(12): 1963–1979.
Pisano GP, Teece DJ. 2007. How to capture value frominnovation: shaping intellectual property and industryarchitecture. California Management Review 50(1):278–296.
Porter ME. 1980. Competitive Strategy: Techniques forAnalyzing Industries and Competition . Free Press:New York.
Porter ME. 1985. Competitive Advantage: Creating andSustaining Superior Performance. Free Press: NewYork.
Rivkin JW. 2000. Imitation of complex strategies.Management Science 46(6): 824–844.
Rosenberg N. 1972. Factors affecting the diffusion oftechnology. Explorations in Economic History 10(1):3–33.
Rosenberg N. 1976. On technological expectations.Economic Journal 86(343): 523–535.
Sahal D. 1981. Patterns of Technological Innovation .Addison-Wesley: Reading, MA.
SAP Corporation. 2006. SAP ecosystem unites to bringinnovation to chemicals industry. Press release, 8 May.
Spence M. 1981. The learning curve and competition.Bell Journal of Economics 12(1): 49–70.
Stigler GJ. 1951. The division of labor is limited by theextent of the market. Journal of Political Economy59(3): 185–193.
Suarez FF, Lanzolla G. 2007. The role of environmentaldynamics in building a first mover advantage theory.Academy of Management Review 32(2): 377–392.
Sutcliffe KM, Zaheer A. 1998. Uncertainty in thetransaction environment: an empirical test. StrategicManagement Journal 19(1): 1–23.
Takeishi A. 2002. Knowledge partitioning in the interfirmdivision of labor: the case of automotive productdevelopment. Organization Science 13(3): 321–338.
Teece DJ. 1986. Profiting from technological innovation:implications for integration, collaboration, licensingand public policy. Research Policy 15(6): 285–305.
Tripsas M. 1997. Unraveling the process of creativedestruction: complementary assets and incumbent sur-vival in the typesetter industry. Strategic ManagementJournal , Summer Special Issue 18: 119–142.
Tushman M, Anderson P. 1986. Technological disconti-nuities and organizational environments. Administra-tive Science Quarterly 31(3): 439–465.
Utterback JM, Abernathy WJ. 1975. A dynamic modelof process and product innovation. Omega 3(6):639–656.
VanderWerf PA, Mahon JF. 1997. Meta-analysis of theimpact of research methods on findings of first-moveradvantage. Management Science 43(11): 1510–1519.
Williamson OE. 1985. The Economic Institutions ofCapitalism: Firms, Markets, Relational contracting .Free Press: New York.
Wooldridge JM. 2002. Econometric Analysis of CrossSection and Panel Data . MIT Press: Cambridge, MA.
Copyright 2009 John Wiley & Sons, Ltd. Strat. Mgmt. J., 31: 306–333 (2010)DOI: 10.1002/smj
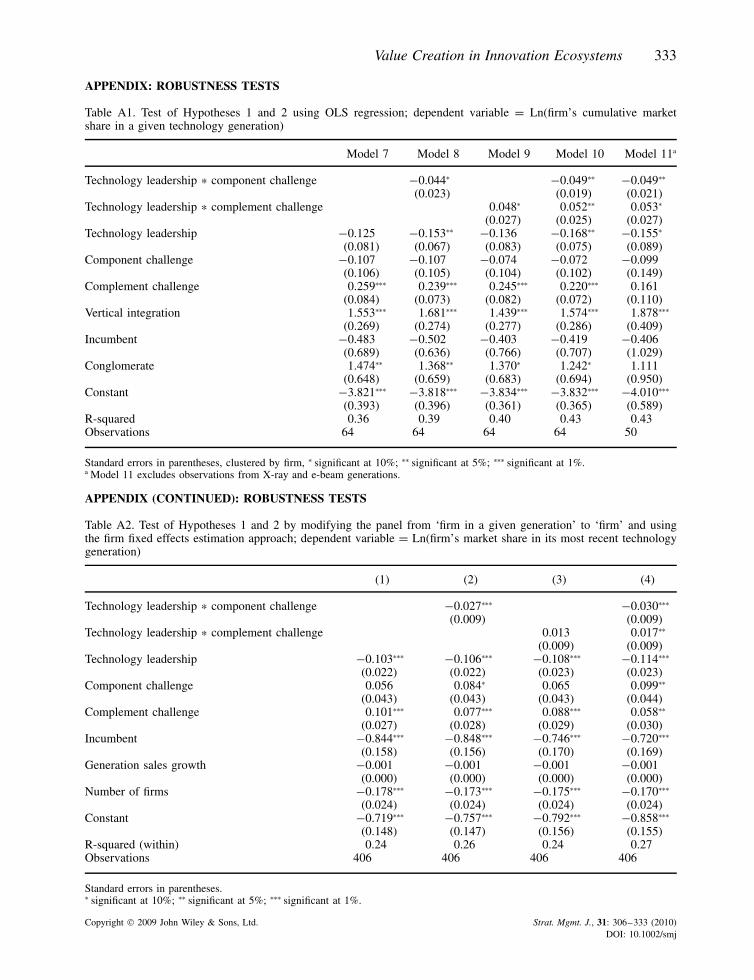
Value Creation in Innovation Ecosystems 333
APPENDIX: ROBUSTNESS TESTS
Table A1. Test of Hypotheses 1 and 2 using OLS regression; dependent variable = Ln(firm’s cumulative marketshare in a given technology generation)
Model 7 Model 8 Model 9 Model 10 Model 11a
Technology leadership * component challenge −0.044∗ −0.049∗∗ −0.049∗∗
(0.023) (0.019) (0.021)Technology leadership * complement challenge 0.048∗ 0.052∗∗ 0.053∗
(0.027) (0.025) (0.027)Technology leadership −0.125 −0.153∗∗ −0.136 −0.168∗∗ −0.155∗
(0.081) (0.067) (0.083) (0.075) (0.089)Component challenge −0.107 −0.107 −0.074 −0.072 −0.099
(0.106) (0.105) (0.104) (0.102) (0.149)Complement challenge 0.259∗∗∗ 0.239∗∗∗ 0.245∗∗∗ 0.220∗∗∗ 0.161
(0.084) (0.073) (0.082) (0.072) (0.110)Vertical integration 1.553∗∗∗ 1.681∗∗∗ 1.439∗∗∗ 1.574∗∗∗ 1.878∗∗∗
(0.269) (0.274) (0.277) (0.286) (0.409)Incumbent −0.483 −0.502 −0.403 −0.419 −0.406
(0.689) (0.636) (0.766) (0.707) (1.029)Conglomerate 1.474∗∗ 1.368∗∗ 1.370∗ 1.242∗ 1.111
(0.648) (0.659) (0.683) (0.694) (0.950)Constant −3.821∗∗∗ −3.818∗∗∗ −3.834∗∗∗ −3.832∗∗∗ −4.010∗∗∗
(0.393) (0.396) (0.361) (0.365) (0.589)R-squared 0.36 0.39 0.40 0.43 0.43Observations 64 64 64 64 50
Standard errors in parentheses, clustered by firm, ∗ significant at 10%; ∗∗ significant at 5%; ∗∗∗ significant at 1%.a Model 11 excludes observations from X-ray and e-beam generations.
APPENDIX (CONTINUED): ROBUSTNESS TESTS
Table A2. Test of Hypotheses 1 and 2 by modifying the panel from ‘firm in a given generation’ to ‘firm’ and usingthe firm fixed effects estimation approach; dependent variable = Ln(firm’s market share in its most recent technologygeneration)
(1) (2) (3) (4)
Technology leadership * component challenge −0.027∗∗∗ −0.030∗∗∗
(0.009) (0.009)Technology leadership * complement challenge 0.013 0.017∗∗
(0.009) (0.009)Technology leadership −0.103∗∗∗ −0.106∗∗∗ −0.108∗∗∗ −0.114∗∗∗
(0.022) (0.022) (0.023) (0.023)Component challenge 0.056 0.084∗ 0.065 0.099∗∗
(0.043) (0.043) (0.043) (0.044)Complement challenge 0.101∗∗∗ 0.077∗∗∗ 0.088∗∗∗ 0.058∗∗
(0.027) (0.028) (0.029) (0.030)Incumbent −0.844∗∗∗ −0.848∗∗∗ −0.746∗∗∗ −0.720∗∗∗
(0.158) (0.156) (0.170) (0.169)Generation sales growth −0.001 −0.001 −0.001 −0.001
(0.000) (0.000) (0.000) (0.000)Number of firms −0.178∗∗∗ −0.173∗∗∗ −0.175∗∗∗ −0.170∗∗∗
(0.024) (0.024) (0.024) (0.024)Constant −0.719∗∗∗ −0.757∗∗∗ −0.792∗∗∗ −0.858∗∗∗
(0.148) (0.147) (0.156) (0.155)R-squared (within) 0.24 0.26 0.24 0.27Observations 406 406 406 406
Standard errors in parentheses.∗ significant at 10%; ∗∗ significant at 5%; ∗∗∗ significant at 1%.
Copyright 2009 John Wiley & Sons, Ltd. Strat. Mgmt. J., 31: 306–333 (2010)DOI: 10.1002/smj