PROMOTION PROFITABILITY FOR A RETAILER:...
55
1 PROMOTION PROFITABILITY FOR A RETAILER: THE ROLE OF PROMOTION, BRAND, CATEGORY, AND STORE CHARACTERISTICS by Kusum L. Ailawadi Professor of Marketing Tuck School of Business at Dartmouth College 100 Tuck Hall, Hanover, NH 03755 Phone: (603) 646-2845 e-mail: [email protected] Bari A. Harlam Vice President of Marketing Intelligence CVS Corporation One CVS Drive, Woonsocket, RI Phone: (401) 769-2211 e-mail: [email protected] Jacques César Director Mercer Management Consulting Inc. 1 Grosvenor Place London SW1X 7HJ Phone: +44 20 7235 5444 e-mail: [email protected] David Trounce Director Mercer Management Consulting, Inc. 1 California St., 16 th Floor San Francisco, CA 94111-5421 Phone: (415) 743-7901 e-mail: [email protected] April 14, 2006 Acknowledgements: The authors thank Pen-che Ho from the Tuck School and David Waller, Andrew Youn, and Matt Hamory from Mercer Management Consultants for their assistance with data preparation, and John Wallace from Dartmouth College for his help with computing resources. They also thank Scott Neslin, Leigh McAlister, Paul Farris, Murali Mantrala, the Marketing Science Institute, the ISMS Practice Prize committee, and two anonymous reviewers for their comments and suggestions.
-
Upload
vuongthien -
Category
Documents
-
view
219 -
download
1
Transcript of PROMOTION PROFITABILITY FOR A RETAILER:...

1
PROMOTION PROFITABILITY FOR A RETAILER: THE ROLE OF PROMOTION, BRAND, CATEGORY, AND STORE CHARACTERISTICS
by
Kusum L. Ailawadi Professor of Marketing
Tuck School of Business at Dartmouth College 100 Tuck Hall, Hanover, NH 03755
Phone: (603) 646-2845 e-mail: [email protected]
Bari A. Harlam
Vice President of Marketing Intelligence CVS Corporation
One CVS Drive, Woonsocket, RI Phone: (401) 769-2211
e-mail: [email protected]
Jacques César Director
Mercer Management Consulting Inc. 1 Grosvenor Place
London SW1X 7HJ Phone: +44 20 7235 5444
e-mail: [email protected]
David Trounce Director
Mercer Management Consulting, Inc. 1 California St., 16th Floor
San Francisco, CA 94111-5421 Phone: (415) 743-7901
e-mail: [email protected]
April 14, 2006
Acknowledgements: The authors thank Pen-che Ho from the Tuck School and David Waller, Andrew Youn, and Matt Hamory from Mercer Management Consultants for their assistance with data preparation, and John Wallace from Dartmouth College for his help with computing resources. They also thank Scott Neslin, Leigh McAlister, Paul Farris, Murali Mantrala, the Marketing Science Institute, the ISMS Practice Prize committee, and two anonymous reviewers for their comments and suggestions.

2
Promotion Profitability for a Retailer: The Role of Promotion, Brand, Category, and Store Characteristics
ABSTRACT
The purpose of this paper is to quantify the net unit and net profit impact of promotions
for a retailer and to understand the key correlates of this impact. Using data on all promotions
offered in 2003 by CVS, a leading U.S. drug retailer, the authors (a) quantify the gross
promotional lift; (b) decompose this into switching, stockpiling, and incremental lift for the
retailer; (c) estimate the extent to which promotion affects sales of other product categories in the
store to compute the net unit impact of the promotion; (d) account for promotional and non-
promotional margins and manufacturer funding to compute the net profit impact of the
promotion; and (e) examine how promotion, brand, category, and store characteristics influence
the net impact.
The authors find that approximately 45% of the gross lift is incremental for CVS, and
there is also a significantly positive halo effect on sales of other categories. But the net profit
impact of promotions is negative on average because CVS’ promotional margin is often
substantially less than regular margin. In their analysis of the correlates of net impact, they find
that many promotion and brand characteristics have opposing associations with net unit and net
profit impact. Deep, featured promotions on high “consumer pull” brands generate high net unit
impact but they significantly reduce CVS’ promotional margin, resulting in lower net profit
impact. The retailer must therefore make some difficult trade-offs between revenue and profit
objectives in promotion decisions.
Keywords: Promotion, Promotion profitability, Retailer promotions, Determinants of promotion
impact.

3
Promotional spending by U.S. packaged goods manufacturers peaked in the late nineties
at over 50% of the marketing budget and it continues to ride high. Whether this spending is
effective for manufacturers and/or retailers is therefore an important question. Clearly, the
answer depends not only on the immediate or gross lift of a promotion but also on the sources of
this lift. Researchers have devoted considerable effort to quantifying the brand-switching,
stockpiling, and consumption components of the gross lift. New work has led to important
refinements in our understanding of these components, showing, for example, that increased
consumption is a significant component of the gross lift for some categories (Ailawadi and
Neslin 1998; Bell, Chiang, and Padmanabhan 1999), and brand-switching, while substantial, is
considerably smaller than was previously thought (Sun, Neslin, and Srinivasan 2003; van
Heerde, Gupta, and Wittink 2003; van Heerde, Leeflang, and Wittink 2004).
Since manufacturers fund promotions at least to some extent, and since much has been
written about the potential erosion of brand loyalty due to promotions, it is understandable that
researchers have evaluated promotion impact primarily from the perspective of manufacturers
(see Cooper et al. 1999 and Srinivasan et al. 2004 for two exceptions). Further, their focus has
been almost exclusively on unit impact. Although promotions’ effect on profitability was
conceptualized several years ago (Neslin and Shoemaker 1983; McAlister 1985), lack of publicly
available cost data has prevented empirical analyses of profit impact.
However, retailers make decisions about promotions to consumers, and promotion impact
for a retailer is quite different from promotion impact for a manufacturer. The left panel of
Figure 1 lays out the components of the gross lift for a promoted brand in a given store in given
week and the right panel shows which components are incremental for a retailer. The gross lift
consists of (i) sales switched from other brands and other stores in the same period; (ii) sales

4
switched from the same or other brands in the same or other stores in future periods; and (iii) an
increase in consumption through new users or higher consumption rates by existing users. We
could also distinguish between switches from other items of the same brand and switches from
other brands (van Heerde and Gupta 2005), but Figure 1 suffices to identify the elements of the
retailer’s gross and incremental lift.
<Insert Figure 1 About Here>
For a manufacturer, increased consumption and switches from current and future
purchases of other brands make up incremental lift. For a retailer, on the other hand, increased
consumption and switches from current and future purchases in other stores make up
incremental lift. Along with this incremental lift within the category, a retailer must consider the
promotion’s effect on sales of other categories to quantify the net unit impact in the store, and its
regular and promotional margins, including manufacturer funding if any, to quantify the net
profit impact in the store. In the remainder of this paper, when we refer to incremental lift for
the retailer, we mean the incremental portion of the gross lift within the category, and when we
refer to net unit or net profit impact for the retailer, we mean net impact in the store, which also
includes the “halo” effect that the promotion may have on sales of other categories.
We take the perspective of CVS, a leading U.S drug retail chain with a High-Low
promotional pricing strategy. Our objective is to estimate the net unit and profit impact of each
individual CVS promotion and relate variation in impact to a wide range of promotion, brand,
category, and store correlates. We (a) estimate the gross lift; (b) estimate current period
switching from other items within the category in the store and stockpiling from future period
category sales in the store (the components that are crossed out in Figure 1), to compute the
incremental lift; (c) estimate the “halo” effect, i.e., the extent to which promotion affects sales of

5
other categories in the store, to compute the net unit impact; and (d) account for manufacturer
funding and CVS’ promotional and regular margins to compute the net profit impact.
We then examine how this net impact varies with the four sets of correlates noted above.
By using the same method to quantify the impact of several million promotions, we can provide
meta analysis like empirical generalizations about the determinants of a promotion’s net impact
for a retailer without the need to control for differences across studies (e.g., Nijs et al. 2001).
This analysis provides CVS an understanding of why different promotions vary in their net
impact, and suggests strategies for the company to design and implement more effective
promotions while discontinuing the most unprofitable ones.
Before proceeding, we preview our key findings. First, approximately 45% of the gross
lift is due to switching within the store and 10% is taken from future purchases in the store due to
stockpiling. This leaves a substantial 45% as incremental lift for CVS. Second, there is a
positive halo effect of promotion – for every unit of gross lift, .16 unit of some other product is
purchased elsewhere in the store. Third, despite this substantial net unit impact, more than half
of CVS promotions are not profitable because promotional margin is often significantly less than
regular margin. Fourth, cross-store variation is a very small component of total variation in net
impact. Cross-category and cross-brand components are both significant, and the latter is
particularly substantial in net profit impact. Finally, many promotion and brand correlates that
are positively associated with net unit impact have a negative association with net profit impact,
revealing a difficult challenge for retailers. Deep, featured promotions on high “consumer pull”
brands generate high net unit impact but they are also the ones where the retailer’s promotional
margin is substantially lower than regular margin, resulting in lower net profit impact.
6
DATA
CVS is the leading drug store chain in the U.S., with front-store (i.e., excluding
pharmacy) sales revenue of approximately $8.2 billion from over 3800 stores in 2003. The
company’s stores are organized into multiple markets in each of five regions -- Northeast,
Midwest, Midsouth, Deep South, and Southwest. The product mix is organized into five
departments – Health, Beauty, Edibles, General Merchandise, and Photo Processing. CVS
offered approximately 36 million promotions on items in 189 categories and 3808 stores in 2003.
Our data span a large number of variables and are compiled from several sources, as
summarized in the Appendix. The primary source is weekly Point-of-Sale (POS) scanner data
for 2003. The POS data provide information on prices, promotion, and sales of each item in each
week in each store. As we will describe in the Methodology section, these data are used to
estimate the baseline, gross lift, switching, and halo rates. They are also used to compute
correlates like promotion depth and frequency, brand share and relative price.
The second source is two years of panel data from CVS’ Extra Care loyalty program. In
2003, the program had approximately 33 million active members who accounted for over 65% of
weekly front-store sales. Demographic characteristics of these members such as gender (73%
women) and age (26% less than 35, 42% between 35 and 55, and 32% over 55 years of age)
mirror the CVS customer base well. Members shop more frequently at CVS than the overall
customer base (20 times per year versus 15 times) though they spend similar amounts per trip
($14 versus $13.60). We use the loyalty program data primarily to estimate stockpiling, but also
to compute some category correlates like penetration, purchase frequency, and purchase amount.
The third source of data is internal company records. Financial information for each item
includes manufacturer price, Activity Based Costs (ABC) which include warehousing, stocking,

7
cashiering etc, manufacturer funding of promotions, and regular and promotional margin. This
information is used to compute the net profit impact of each promotion. Store information
includes characteristics like store size and location.
Demographic and competitive information for each store are obtained from Claritas and
Trade Dimensions respectively. Finally, Leading National Advertisers provide manufacturers’
media advertising expenditures, and category characteristics like storability and impulse
purchasing are obtained from Narasimhan, Neslin, and Sen (1996, hereafter denoted NNS).
METHODOLOGY
Since the purpose of this research is to quantify the net impact of individual promotions,
understand why that impact varies, and distinguish between the best and worst performing
promotions, the relevant unit of analysis is the individual promotion. Therefore, we need a
methodology that allows us to quantify the impact of each individual promotion rather than
provide average estimates of impact (see also Abraham and Lodish 1993 and Cooper et al.
1999). In addition, the methodology should (a) provide robust estimates of gross lift and its
components; (b) be practical for CVS to implement on an ongoing basis for millions of
promotions each year; and (c) be usable with one year of item-level POS data and/or two years
of panel data which is the most that CVS has available at any time given the large number of
items, categories and stores. The company wants estimates of the net impact of each promotion,
but, more importantly, it wants to evaluate all promotions using the same method, understand the
correlates of net impact, and use that understanding in future promotion decisions.
As van Heerde, Leeflang, and Wittink (2004) point out, estimating how many units of a
promoted product’s gross lift come from other products, other periods, and higher consumption
is crucial for determining the net unit impact of promotions. Their regression based

8
methodology relies on POS data pooled across stores to provide average estimates of the gross
lift as well as its switching and stockpiling components. We do not use their methodology
because we need the gross lift and net impact of individual promotions and we want to examine
differences across stores. Further, we find that 52 weeks of aggregate data are not long enough
to capture the stockpiling effect within a drug store chain. Consumers shop at drug stores less
than once in two weeks (versus at least once a week at a grocery store), and the average purchase
frequency for many products at CVS is less than twice a year. As a result, stockpiling effects are
spread over a much longer period than the 6-8 weeks for grocery stores (van Heerde et al. 2004,
Macé and Neslin 2004).
However, we do follow the spirit of van Heerde et al’s approach in estimating switching
and halo rates. We describe our methodology below and examine its robustness in Section 5.
Since our focus is on “normal” promotion response at CVS, holiday weeks and weeks in which
known unusual events occurred in the market are deleted from our analyses. For the same
reason, we exclude the Southwest region where CVS has recently entered in only a few markets.
Baseline and Gross Lift
The gross lift for a promoted item in a given store in a given week is equal to the unit
sales of that item minus its baseline for that week. Like Abraham and Lodish (1993), we
estimate the baseline as a moving average of the item’s unit sales in neighboring non-
promotional weeks. The number of weeks varies with the turn-over and seasonality of the item.
The longest lag is used for slow moving items with low seasonality since more weeks are needed
to get a good sales estimate and the representativeness of earlier weeks is not compromised. In
contrast, shorter periods are used for seasonal items and we use both lags and leads so that the
weeks are representative of the season for which the baseline is being estimated.
9
<Insert Table 1 About Here>
Table 1 provides the specifics. We categorized items into nine groups based on low,
medium, or high seasonality (measured by the coefficient of variation in monthly sales), and very
low, low, or regular turn-over (measured by mean number of units sold per week per store). The
breakpoints and the number of leading and lagging non-promotional weeks were finalized after
testing the robustness of baselines in a prototype market.
Switching
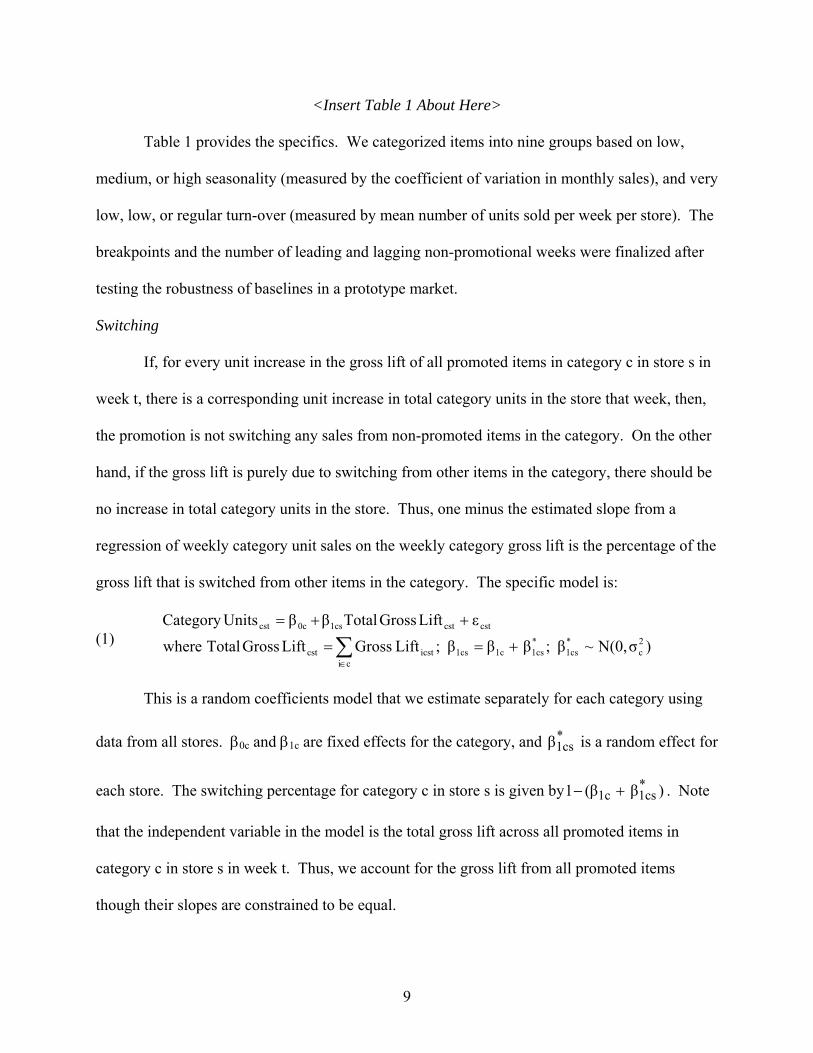
If, for every unit increase in the gross lift of all promoted items in category c in store s in
week t, there is a corresponding unit increase in total category units in the store that week, then,
the promotion is not switching any sales from non-promoted items in the category. On the other
hand, if the gross lift is purely due to switching from other items in the category, there should be
no increase in total category units in the store. Thus, one minus the estimated slope from a
regression of weekly category unit sales on the weekly category gross lift is the percentage of the
gross lift that is switched from other items in the category. The specific model is:
(1) )σN(0,~β;βββ;Lift Gross LiftGrossTotalwhere
εLiftGrossTotalββUnitsCategory2c
*1cs
*1cs1c1cs
ciicstcst
cstcst1cs0ccst
+==
++=
∑∈
This is a random coefficients model that we estimate separately for each category using
data from all stores. β0c and β1c are fixed effects for the category, and *1csβ is a random effect for
each store. The switching percentage for category c in store s is given by )ββ(1 *1cs1c +− . Note
that the independent variable in the model is the total gross lift across all promoted items in
category c in store s in week t. Thus, we account for the gross lift from all promoted items
though their slopes are constrained to be equal.

10
We de-seasonalize the data before estimation to control for spurious correlation that
might occur because both the independent and the dependent variable increase in peak season
and both decrease in off-season. We do this by dividing both by a “week of year” seasonal
factor for the category. The seasonal factor is computed as the average category sales in that
week divided by average weekly sales, where averages are obtained from the last three years of
category sales. We further control for store-level effects in a given week that may affect both
variables. The procedure is analogous to de-seasonalization except that the “week of year”
factor is computed for the store instead of the category. Finally, we first-difference both
variables to remove store-specific fixed effects and any trend.
Stockpiling
The stockpiling component of gross lift is the percentage that is taken from future
category sales in the store. Since purchase frequency of most products at CVS is very low, this
stockpiling effect is spread over a fairly long period. We use two years of the loyalty program
panel data to estimate the reduction in future category purchases when consumers buy on
promotion, by comparing subsequent purchases of promotional buyers with subsequent
purchases of matched non-promotional buyers. We compare promotional buyers with non-
promotional buyers because the time series of a panelist’s own purchases is not long enough to
reliably estimate future decrease in category purchases after a promotional purchase. The steps
in our analysis for each category are:
1. From a random sample of panelists, we select those who buy the category at least twice
during the two-year period of data. To reliably estimate stockpiling, we aim for
approximately 25,000 purchasers. Therefore, we vary the size of the random sample from

11
5% to 25% as needed, using a smaller percentage for categories with high penetration at
CVS, and a larger percentage for low penetration categories.
2. We calculate deciles of annual category spending at CVS by the buyers in this sample.
3. We put promotional purchases in the “promotional group” and regular purchases in the “non-
promotional group,” and order them within the spending deciles. Thus, promotional
purchasers are compared with non-promotional purchasers whose annual spending in the
category is similar to their own.
4. For each purchase in each group, we calculate the time until the next purchase of the
category at CVS and average the difference in time between promotional and non-
promotional purchases.
5. We weight this difference, i.e., the delay until the next purchase in each decile, by the average
number of category units per purchase occasion in that decile to obtain an overall average
reduction in category units.
6. Finally, we compute this reduction as a percentage of the gross lift in the category observed in
the panel.
Note that we estimate the stockpiling percentage for a category across stores. Since the
33 million panelists are spread across 3800 stores and penetration of many categories at CVS is
less than 5%, there are not enough purchases to get reliable estimates for each store.
Halo
A promotion in one category may affect sales in other categories. This effect, which we
call “halo,” will be positive if the promotion leads customers to buy items from other categories
12
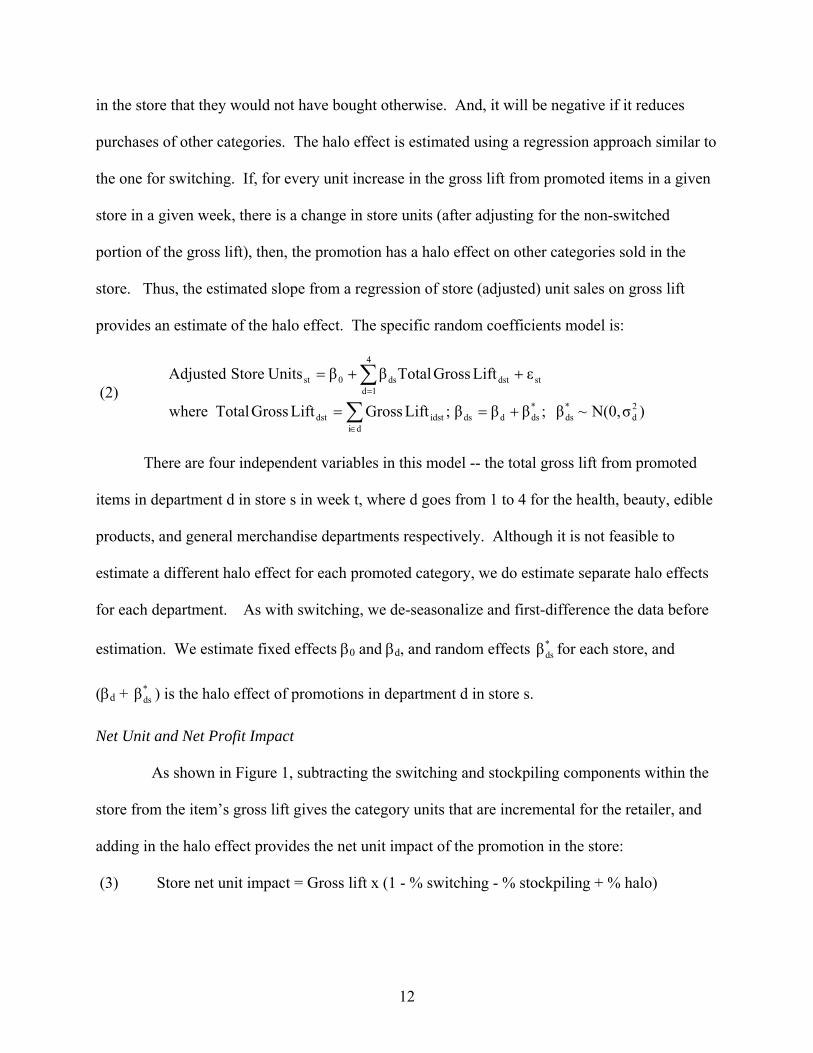
in the store that they would not have bought otherwise. And, it will be negative if it reduces
purchases of other categories. The halo effect is estimated using a regression approach similar to
the one for switching. If, for every unit increase in the gross lift from promoted items in a given
store in a given week, there is a change in store units (after adjusting for the non-switched
portion of the gross lift), then, the promotion has a halo effect on other categories sold in the
store. Thus, the estimated slope from a regression of store (adjusted) unit sales on gross lift
provides an estimate of the halo effect. The specific random coefficients model is:
(2) )σN(0,~β;βββ;LiftGrossLiftGrossTotalwhere
εLiftGrossTotalβ β UnitsStoreAdjusted
2d
*ds
*dsdds
diidstdst
st
4
1ddstds0st
+==
++=
∑
∑
∈
=
There are four independent variables in this model -- the total gross lift from promoted
items in department d in store s in week t, where d goes from 1 to 4 for the health, beauty, edible
products, and general merchandise departments respectively. Although it is not feasible to
estimate a different halo effect for each promoted category, we do estimate separate halo effects
for each department. As with switching, we de-seasonalize and first-difference the data before
estimation. We estimate fixed effects β0 and βd, and random effects *dsβ for each store, and
(βd + *dsβ ) is the halo effect of promotions in department d in store s.
Net Unit and Net Profit Impact
As shown in Figure 1, subtracting the switching and stockpiling components within the
store from the item’s gross lift gives the category units that are incremental for the retailer, and
adding in the halo effect provides the net unit impact of the promotion in the store:
(3) Store net unit impact = Gross lift x (1 - % switching - % stockpiling + % halo)

13
Accounting for CVS’ regular and promotional margin of the promoted item inclusive of
manufacturer funding, and the margins of other items, provides the net profit impact in the store:
Store net profit impact = Promo units x (Promo price – Manufacturer price – ABC + Manufacturer promo funding)
(4) - Base units x (Regular price – Manufacturer price – ABC) - (% Switching x Gross lift x Regular category price x Regular category % margin) - (% Stockpiling x Gross lift x Average category price x Average category % margin) + (% Halo x Gross lift x Average store price x Average store % margin)
The first two terms in equation 4 reflect the gross profit impact of the promotion. Apart
from promotional and regular retail prices and manufacturer price, they account for activity
based costs (ABC) and promotion linked funding from the manufacturer, both of which are
allocated per unit. The next two terms subtract from this gross profit the portion that is not
incremental either because margin was switched from non-promoted items in the category or
because margin was taken from future sales of the category due to stockpiling. The last term is
the halo margin from additional (or fewer) items sold elsewhere in the store due to the
promotion. We use regular category margin in the switching term because consumers switch
from non-promoted items to the promoted items. We use average category margin in the
stockpiling term because the future category sales that are pulled forward could be on or off
promotion. And, we use average store margin in the halo term because the other affected items
in the store could be on or off promotion.
CORRELATES OF NET IMPACT
Conceptual Framework
Each promotion varies in terms of the characteristics of (a) the promotion, e.g., discount
depth, presence of feature, presence of BOGO (Buy One Get One x% off); (b) the brand, e.g.,
unit share, price, advertising; (c) the category, e.g., penetration, distribution, concentration; and

14
(d) the store, e.g., store type, market demographics, competition density. Researchers have
related some of these characteristics to promotional price elasticities. For instance, Bolton
(1989) studies brand characteristics; NNS study category characteristics and Hoch et al. (1995)
study market demographics. A few researchers have also studied how one or more components
of the gross lift vary with some of these characteristics. van Heerde, Leeflang, and Wittink
(2004) study differences in the decomposition of the gross lift for pure price promotions versus
those accompanied by a display or feature. Macé and Neslin (2004) examine how stockpiling
varies with UPC, category, and market demographic correlates. And, Bell, Chiang, and
Padmanabhan (1999) study the effect of some of these correlates on panel data based brand
switching, purchase incidence, and quantity elasticities. However, we are not aware of any study
that quantifies the net unit and net profit impact of promotion for a retailer and studies the
correlates of that net impact. In this section, we develop expectations about the association of
relevant correlates with net impact.
A correlate that influences net unit impact must do so through one or more elements of
the incremental lift for the retailer and/or the halo rate. Since there is little prior research on halo
rates or their determinants, our expectations regarding correlates of net unit impact are based on
their possible association with elements of the incremental lift (see Figure 1). Note that store
switching is the critical phenomenon that drives incremental lift for the retailer. As Bucklin and
Lattin (1992) demonstrate, direct store switching (promotion influences the consumer to visit the
promoting store A instead of another store B) may be small but indirect store switching (the
consumer visits both stores, but, because of the promotion in store A, she buys the promoted
product in store A whereas otherwise she would have bought it in store B) can be significant. If,

15
along with switching stores, the consumer also switches brands and/or periods, or the promotion
increases consumption, the incremental lift will be larger.
Now, consider net profit impact. If the retailer’s promotional margin is close to regular
margin, i.e., the promotion is fully funded by the manufacturer, then high net unit impact should
go along with high net profit impact. If, however, part of the promotion is funded by the
retailer, then promotional margin will be less than regular margin, and net profit impact may be
low even if net unit impact is high. Thus, correlates that influence the extent to which
promotions are funded by the retailer and therefore the retailer’s promotional versus regular
margin, can have a different association with net profit impact versus net unit impact.
We examine correlates that may influence one or more of the elements of incremental lift
and/or the retailer’s promotional versus regular margin. Our expectations about the association
of each correlate with net impact are guided by how it might affect these elements (see NNS for
another example of this approach). Table 2 summarizes our expectations.
< Insert Table 2 About Here >
Promotion Characteristics
Association with Net Unit Impact. The deeper the discount, the more likely it is that the
economic savings will offset any costs that the consumer might incur in switching from preferred
stores and/or preferred brands, and any inventory carrying costs in buying now from the
promoting store instead of buying later from another store. It is also more likely that new users
will buy the category or existing users will consume more of it (Assuncao and Meyer 1993).
Thus, we expect discount depth to be positively associated with net unit impact.
Featured promotions can be easily seen in the store as well as before going shopping so
they are more likely to induce store switching than unfeatured promotions (Kumar and Leone

16
1988; NNS), but there is no particular reason why features should affect consumption. Similarly,
if a large percentage of the items in a category are on promotion at the same time, consumers
will perceive they have more choice and be more likely to switch stores to avail of a deal. But
this should not affect the consumption component. Therefore, we expect a positive association
of features and percentage of items promoted with net unit impact.
Finally, consumers have to take more than one unit of the product to avail of the discount
in a BOGO promotion. This constraint may make them less willing to incur switching costs.
Higher inventory can increase consumption rates (Ailawadi and Neslin 1998), so BOGOs may
have a positive association with consumption. But, overall, we expect a negative association of
BOGOs with net unit impact.
Association With Net Profit Impact. All else equal, the retailer is more likely to have to
fund part of the promotion when the discount is deep. So, promotional margins should be lower
relative to regular margins when deeper discounts are offered. Featured promotions are also
more likely to be funded in part by the retailer, since retailers don’t want their featured prices to
appear uncompetitive (Ailawadi, Farris, and Shames 1999). Finally, manufacturers don’t like
simultaneous promotions on competing brands since this limits the ability of any one brand to
gain share. This means that the retailer may have to fund part of the promotion when several
other items in the category are also promoted. Prior literature does not provide guidance on
whether BOGO promotions are funded by retailers more than other promotions.
Overall, we expect discount depth, features, and percentage of items promoted to be
negatively associated with promotional margins and therefore less positively associated with net
profit impact than with net unit impact. But, the association of BOGOs with net profit impact is
an empirical question.

17
Brand Characteristics
Association with Net Unit Impact. The “consumer pull” enjoyed by high share and
heavily advertised brands makes it more likely that consumers will switch from other stores and
brands when these brands are promoted. They are also more likely to incur the inventory costs
of stockpiling these “more preferred” brands (Krishna 1992). We expect the opposite for store
brands. Wansink (1994) shows how advertising can increase consumption and Krishna (1994)
suggests that consumption increases should be more likely for preferred brands. Overall,
therefore, we expect share and relative advertising to be positively associated and store brand to
be negatively associated with net unit impact.
As NNS note, the savings and “trading-up quality” benefits of promotions are more
salient for higher priced brands, but so is the risk due to a greater dollar outlay. The former may
make consumers more willing to incur store switching costs, and perhaps also brand switching
and inventory costs. The latter, however, may inhibit their willingness to switch brands and is
quite likely to inhibit stockpiling and consumption. Thus, the association of relative price with
net unit impact is an empirical question.
Frequently promoted brands are less likely to induce store switching and stockpiling
because consumers expect to find them on promotion often and do not need to make changes in
their purchase behavior. Frequently promoted brands are also less likely to increase
consumption because regular consumers learn to buy deal-to-deal in suitable quantities to satisfy
their consumption needs (Assuncao and Meyer 1993). Thus, we expect brand promotion
frequency to be negatively associated with net unit impact.
Association with Net Profit Impact. High share and heavily advertised brands have more
consumer pull and, therefore, greater market power over the retailer, making it more likely that

18
promotions are funded, at least in part, by the retailer (Albion and Farris 1987; Steiner 1973,
1993). The same should be true of high priced brands if they have higher pull, and the opposite
is true of store brands. Finally, all else equal, the retailer may also have to fund part of the
promotion when the brand is promoted frequently.
Thus, we expect brand share, relative advertising, and relative price to be negatively
associated with promotional margins and therefore less positively associated with net profit
impact than with net unit impact. We expect store brand to be positively associated with
promotional margins and therefore less negatively associated with net profit impact than with net
unit impact. And, we expect brand promotion frequency to be negatively associated with
promotional margins and therefore more negatively associated with net profit impact than with
net unit impact.
Category Characteristics
Association With Net Unit Impact. Promotions in high market penetration categories
should induce more store switching because there is a larger pool of category users who can
switch stores. So should promotions in frequently purchased categories because it is more likely
that consumers will need the category at any shopping trip and therefore will buy it if it is on
promotion, even if they usually buy it at another store. However, the opposite is true for
categories that have high penetration and purchase frequency at a given retailer. Our measures
are the percentage of customers who buy the category at least once at CVS, and their average
purchase frequency at CVS. If a large percentage of shoppers already buy the category
frequently from the store, there is less opportunity for switching purchases from other stores.
Also, the higher the penetration of the category, the less room there is for promotion to increase
consumption by bringing in new users. It is unclear whether promotions on frequently

19
purchased categories increase consumption. On one hand, the product may be more salient and
therefore increase consumption (Chandon and Wansink 2002), but on the other, consumption of
these categories is presumably frequent already, so there may be a ceiling effect. Therefore, we
expect penetration and purchase frequency to be negatively associated with net unit impact.
Our expectations about high purchase amount, frequently promoted, and deeply
discounted categories follow the same reasoning as for high priced brands, frequently promoted
brands, and deep discounts respectively.
Promotion should be associated with greater store switching for widely distributed
categories because there is more opportunity for shifting purchases from other stores that also
carry the category, but there is no reason for category distribution to be related to consumption.
Thus, we expect category distribution to be positively associated with net unit impact.
Storability of a category should not influence store switching but promotions on storable
categories are more likely to accelerate future purchases from other stores (Macé and Neslin
2004). And, they are likely to be negatively related to consumption (Ailawadi and Neslin 1998).
Therefore, we cannot predict the direction of association between storability and net unit impact.
Impulse purchases are, by definition, made in the store, so impulse categories should exhibit
smaller store switching effects across the board. New users may buy and existing users may
consume more when they see an impulse category on promotion. But this effect may be smaller
in a drug store where consumers come to buy specific health or beauty products than in a grocery
store where they browse and shop for a variety of grocery products. Overall, therefore, we
expect a negative association of impulse purchaseability with net unit impact.
More differentiated categories (high advertising and high Herfindahl index) have greater
consumer pull and more distinct preferences. Therefore, consumers should be more likely to
20
switch stores for promotions on these categories, but less likely to switch brands (Steiner 1993).
Advertising can increase consumption (Wansink 1994; Chandon and Wansink 2002), but there is
no reason for Herfindahl index to be related to consumption. The same reasoning should apply
to categories with many brands if this implies greater differentiation, but more brands could also
reflect less established preferences and therefore less differentiation (Macé and Neslin 2004).
Thus, the association of category advertising, Herfindahl index, and number of brands with net
unit impact is an empirical question.
Association With Net Profit Impact: As noted earlier, manufacturers hold greater power
in heavily advertised, widely distributed, and more concentrated categories. So the retailer is
more likely to have to fund part of the promotion. All else equal, the retailer is also more likely
to fund part of the promotion in deeply discounted or frequently promoted categories.
Overall, we expect category distribution, discount depth, and promotion frequency to be
negatively associated with promotional margins and therefore less positively associated with net
profit impact than with net unit impact. And, we also expect category advertising and Herfindahl
index to be negatively associated with promotional margins and therefore negatively associated
with net profit impact. The remaining category correlates do not appear to be directly relevant to
retailer funding of promotions, so we expect the association to be similar to net unit impact.
Store Characteristics
Association With Net Unit Impact. Although there is little prior research to go by,
intuition suggests that direct store switching should be more likely for larger stores and those
located in a shopping area. Also, stores with a drive-through pharmacy should see less indirect
store switching because consumers who use the drive-through do not have the opportunity to see
and buy promoted items in the store. Thus, we expect larger stores and those located in a

21
shopping center (versus a stand-alone store) to have higher net unit impact and stores with a
drive-thru pharmacy to have lower net unit impact.
Prior literature has found weak and often inconsistent associations between market
demographics and shopping behaviors such as price search, promotional price elasticity, and
promotion use. We therefore do not predict the direction of association of demographics with
net impact, but we do include demographics that reflect search costs, time constraints, and
financial constraints, since these traits are most relevant to promotion response.
There is little prior research on the association of retail competition with promotion
response. As competition from other retailers increases, sales levels at any retailer should
decrease. However, the more competition there is in the market, the more opportunity there is
for a given retailer’s promotions to switch consumers from competing stores. Thus, we expect
retail competition in the area to be positively associated with net unit impact.
Association with Net Profit Impact. Since the type of store and market demographics are
not directly relevant to the relative market power of the retailer versus manufacturers, we expect
the association of these variables with net profit impact to be similar to their association with net
unit impact. The retailer may use promotions more heavily in order to compete in markets
where competition is stronger, even if the promotions are not funded by manufacturers. Thus,
we expect retail competition to be negatively associated with promotional margins and
consequently less positively associated with net profit impact than with net unit impact.
EMPIRICAL ANALYSIS: PROMOTION IMPACT
We exclude the photo processing department from our analysis because it is a service.
We also exclude another 4% of the observations where the promoted brand is not identified or
values of the base or promotional margin are outliers (greater than 500% or less than -500%).

22
Finally, since the dataset is too large, we randomly select 50% of the stores in each region for our
analyses, providing 12.9 million observations in 177 categories from 1816 stores. Of these 177
categories, 76 are in the health department, 47 in general merchandise, 30 in beauty, and 24 in
edible groceries, in line with the overall distribution of categories in these departments at CVS.
Robustness of Estimates
Before reporting our findings, we provide information on the robustness of our estimates,
beginning with baseline.
Baseline. We chose one prototypical market and conducted two analyses on all of the
approximately 100 stores in that market to test the robustness of our baseline. First, we
investigated whether our baseline estimates are artificially depressed because we include the
week after a promotion, which may be affected by stockpiling. We re-estimated our baselines by
excluding not just promotion weeks but also the next week after a promotion. We then
conducted t-tests for each item across stores to see if the re-estimated baselines were
significantly different from the original ones in promotional weeks. We found no significant
difference between the two baselines in 76% of the cases. For the remaining 24%, our original
baseline was higher than the re-estimated one in 14% and lower than the re-estimated one in
10%. This analysis shows that there is no systematic downward bias in our baseline estimates.
As a further check, we followed Abraham and Lodish (1993) and estimated the baseline not just
for promotional events but for all items in all weeks in all stores. For each item, we then
conducted a t-test across stores to see if the estimated baseline was significantly different from
actual sales in non-promotional weeks. We found that, in 97.4% of the cases, there was no
significant difference between the two. The estimated baseline was higher than actual sales in

23
2.5% of the cases, and less than actual sales in 0.1% of the cases. This analysis too shows that
there is no systematic bias in our baseline estimates.
Switching. The estimates of the random coefficients model used to estimate the switching
percentage for each category and store show its robustness. The fixed effects are of the right
sign and statistically significant for 100% of the categories. Model fit, as measured by a
likelihood ratio test, AIC, and BIC improves significantly in 100% of the categories when
random effects for stores are added. Of all the switching percentages estimated, only 0.7% fall
outside the range from 0 to 1, with a median value of 0.46. Further, we conducted a split half
analysis across stores and found that the fixed effects were not significantly different across the
two sub-samples. For comparison, we also tried to estimate switching and stockpiling using the
van Heerde et al. (2004) method for the same market that we used to test baselines. However,
the relevant coefficient estimates had the wrong sign in a large number of cases.
Halo. Our random coefficients model for estimating halo rate is also robust. All the fixed
effects are statistically significant, and model fit improves significantly when random effects for
stores are included in the model. There is no logical bound on the magnitude of the halo
coefficients. They are not percentages so they do not need to lie between 0 and 1, indeed they do
not even have to be positive. However, the halo coefficient is the change in number of units of
products sold elsewhere in the store for every unit increase in the gross lift of promoted products.
So, very large positive or negative values would be suspect. In our analysis, 73% of the
estimated halo coefficients (across departments and stores) are positive and the range of values is
from -.84 to 1.20, with a median of .16. Since ours is the first study to estimate halo rates, we
cannot compare the magnitudes with prior research, but there are no obvious outliers and the

24
range of values appears to be quite plausible. We also conducted a split half analysis and found
that the fixed effects were not significantly different across the two sub-samples.
Stockpiling. Our estimates of the stockpiling component range between -.25 and .62,
with a median of .10. In the lower deciles of spending, we found that the average difference in
time to the next purchase between promotional and non-promotional purchasers was often
negligible. In some deciles for some categories, the average time to the next purchase for
promotional purchasers was less than for non-promotional purchases, but, averaged across all
deciles, the average difference was negative in only 8% of the categories. We further tested the
robustness of our stockpiling estimates in two ways. For fifteen categories across the four
departments, we repeated our estimation with a second random sample of loyalty program
panelists and we also tested the use of other demographic variables in additional to annual
category spending to match promotional and non-promotional customers. In both analyses, we
found that the stockpiling components were very similar to our original estimates. Given this
stability in estimates, we concluded that the added complexity and the reduction in sample size
from matching on multiple characteristics were not worthwhile.
Finally, we did try to estimate stockpiling from the POS data by regressing total category
units in weeks t+1 through t+6 on the gross lift in week t (in the spirit of van Heerde et al. 2004).
However, the resulting stockpiling effect was much smaller than that estimated from the panel
data. Indeed, the median stockpiling component was barely above zero. For the reasons noted
earlier, we believe that, for a drug store chain like CVS, our panel data approach provides a more
valid estimate of stockpiling than that obtained from 52 weeks of POS data.
<Insert Table 3 About Here>

25
Components of the Gross Lift
Table 3 provides descriptive statistics of the gross lift and its components. The size of
the lift is quite similar to that reported in other analyses (Blattberg and Neslin 1990, p. 351;
NNS). The median percentage of the lift that is attributed to switching is much closer to the 35%
recently reported by van Heerde, Gupta and Wittink (2003) than the 75-80% reported by Gupta
(1988), Bell, Chiang, and Padmanabhan (1999) etc. in their elasticity decompositions.
The percentage attributed to stockpiling is not directly comparable to the incidence and
quantity elasticities in the elasticity decomposition approach, and it is smaller than that found by
van Heerde et al. (2004). However, drug retailers differ substantially from grocery retailers in
their mix of product categories, with a much higher percentage of health and beauty products. In
these products, purchases tend to be more need-based versus food products, so consumers are
less likely to stockpile product if they don’t need it. Also, since drug stores are visited relatively
infrequently, a substantial part of consumers’ stockpiling is likely to come from other stores
(which is incremental lift for CVS), not from future purchases at CVS.
Table 3 also shows the median halo rate from promotions in each department. Beauty
and general merchandise products have the greatest halo benefit – for every one unit of gross lift
in these departments, an extra .30 and .28 units respectively of some other products are sold in
the store. The halo rate is much smaller for edible groceries, at .05, and slightly negative for
health products, at -.04. Thus, there is significant variation in the ability of promoted products
from different departments to affect other sales in the store.
<Insert Table 4 About Here>
26
Net Unit and Profit Impact
Table 4 provides a summary overview of the net unit and profit impact of the
promotional events. These numbers are in units and dollars respectively. To put them in
context, we also provide baseline units and profit per item per store per week. The most
important take-away from this table is that, although the median net unit impact of a promotion
is positive, the median net profit impact is negative. This can only be if CVS promotional
margin is less than regular margin, which is often the case even after accounting for
manufacturer funding. And the problem is aggravated because all promotional units earn the
lower margin, not just the incremental units. These average levels of net unit versus net profit
impact are new to the literature and very interesting. However, the standard deviations in Table
4 show that there is plenty of variation in net impact, both across and within departments. Next,
we examine the correlates of that variation using the 10.9 million observations on promotions in
140 categories for which we were able to obtain data on the correlates.
EMPIRICAL ANALYSIS: CORRELATES OF NET PROMOTION IMPACT
In this analysis, we utilize the natural nesting in our data of individual promotions within
brands that are within categories that, in turn, are within stores. We first decompose the total
variation of net impact into its cross-store, cross-category, cross-brand, and residual within brand
components to assess the relative importance of each variance component. Next, we determine
what percentage of each variance component is explained by the corresponding set of correlates.
Finally, we examine the estimated coefficients of the correlates to see if they conform to our
directional expectations and to assess their relative magnitudes.

27
Variance Decomposition
We begin our analysis with the following hierarchical model for net unit impact of a
promotion (Raudenbush and Bryk 2002):1
(5)
000s00cs0bcspbcs0000pbcs
000s0000000s
00cs000s00cs
0bcs00cs0bcs
pbcs0bcspbcs
νμηεδImpactUnitNetStoreνδχwhere
μχβwhereηβαwhere
εαImpactUnitNetStore
++++=⇒+=
+=+=
+=
In this four-level model, the net unit impact of a promotion p on brand b in category c in
store s is a function of the brand mean (α0bcs) plus a random error (εpbcs). The brand mean is a
function of the category mean (β00cs) plus random error (η0bcs), which is a function of the store
mean ( χ000s) plus random error (μ00cs), which, finally, is a function of the grand mean (δ0000) plus
random error (ν000s). All the random errors are distributed normally:
(6) )σN(0,ν);σN(0,μ);σN(0,η);σN(0,ε 2ν000s
2η00cs
2η0bcs
2εpbcs ====
Thus, the cross-store component of total variation in net unit impact is given
by )σ̂σ̂σ̂σ̂/(σ̂ 2ν
2μ
2η
2ε
2ν +++ , the cross-category component is given by )σ̂σ̂σ̂σ̂/(σ̂ 2
ν2μ
2η
2ε
2 +++μ ,
etc. Table 5 shows the magnitude of these components for net unit impact and net profit impact.
Cross-store variation is very small. Cross-category and cross-brand variation are both substantial
but the former is bigger for net unit impact and the latter is bigger for net profit impact. This is
consistent with our expectations. The difference between promotional and regular margin is key
for determining net profit impact, and we expected mainly brand and promotion factors to
influence this.
<Insert Table 5 About Here>
1 The analysis for net profit impact is exactly analogous.
28
Next, we add fixed effects of promotion, brand, category, and store correlates into the
model in equation 5. Comparing the variance estimate at each level with and without the
correlates allows us to determine what percentage of the variance at each level is explained by
the correlates. Table 5 provides this information. The cross-store variance component is very
small but it is still interesting to note that almost 30-40% of that component is explained by our
correlates. A substantial percentage of cross-category variation is explained, especially for net
unit impact. However, much of cross-brand variation and the residual, within-brand variation in
both net unit and net profit impact remains unexplained.
Correlates of Net Impact
Table 6 presents the estimated effects of the correlates on net unit and net profit impact.
We divide the two dependent variables by total category unit and dollar sales in the store
respectively because it is inappropriate to assume equal magnitude effects across categories and
stores of different sizes (van Heerde et al. 2004). This scaling also makes the dependent
variables unitless and therefore comparable across categories with very different units of
measurement. We follow Dhar and Hoch (1997) in the presentation of effects in order to provide
a sense for their relative magnitudes. For continuous variables, we present the percentage
change in the dependent variable when the correlate increases by one standard deviation from its
mean, holding all other correlates at their means. For dummy variables, we present the
percentage change in the dependent variable when the dummy variable is “on” versus the base
case, holding all other correlates at their means. Thus, the table shows that, when the discount
depth increases by one standard deviation from its mean and all other correlates are at their
means, net unit impact increases by 23%. And, when all other correlates are at their means, front
page features have an 89% higher net unit impact than non-featured promotions.

29
<Insert Table 6 About Here>
While these percentage changes allow us to compare the effects of different correlates on
a given dependent variable, they are not comparable across dependent variables with very
different means and standard deviations. Therefore, we also provide standardized coefficients in
Table 6 to compare the effect of a given correlate on net unit versus net profit impact. Thus,
holding all other variables constant, when promotion discount increases by one standard
deviation, net unit impact increases by .072 standard deviations but net profit impact decreases
by .175 standard deviations.
Promotion Characteristics. The effects of promotion correlates on net unit impact are
consistent with our expectations. Deeper discounts, features, and promotions on a greater
percentage of items in the category all increase net unit impact, while BOGOs are associated
with lower net unit impact. More interestingly, however, the effects of these variables on net
profit impact are exactly the opposite. We expected that deep discounts, features, and promotion
breadth would be associated with greater funding of promotions by the retailer. Not only is that
the case, but the effect is big enough to make the association with net profit negative.
BOGO promotions have the opposite pattern. Despite lower net unit impact, their net
profit impact is much higher. Our conversations with category managers at CVS explain the
finding. Manufacturers fund BOGOs fully. Indeed, they often provide free goods for BOGO
promotions, because they are assured the consumer will take home at least two units of their
brand at every purchase.
Brand Characteristics. As expected, high share and highly advertised brands get higher
net unit impact but the store brand and frequently promoted brands get lower net unit impact.

30
High priced brands, for which we did not have an a priori expectation, have a small negative
association with net unit impact.
Our expectations of greater funding of promotions by the retailer for high share, highly
advertised brands are also supported. As in the case of promotion characteristics, this downward
pressure on promotional margin is strong enough to make the association of these correlates with
net profit impact negative. Promotions on high priced brands and frequently promoted brands
seem to be well funded by manufacturers -- they are associated with higher net profit impact
even though their net unit impact is lower. Also, though we expected promotions on the store
brand to be well funded by the store brand supplier, it is interesting that the store brand effect on
net profit impact is very strong. This is partly because CVS margins on store brands are often
higher than on national brands, even when the store brand is on promotion. So, there is a margin
benefit even from the non-incremental portion of the lift, as consumers switch from lower
margin national brands to higher margin store brands.
Category Characteristics. As expected, categories with high penetration and high
purchase frequency at CVS have lower net unit impact. These effects are relatively strong. Also
in line with expectations, frequently promoted and impulse categories get lower net unit impact
and storable and widely distributed categories get higher net unit impact. High purchase amount
categories are associated with a higher net unit impact, suggesting that promotion savings are
more meaningful and induce store and brand switching when the dollar outlay is large.
Interestingly, advertising, Herfindahl index, and number of brands in the category are both
negatively associated with net unit impact. This suggests that preferences for individual brands
are strong in such categories and reduced likelihood of brand switching dominates any increased
likelihood of store switching.
31
The association of category characteristics with net profit impact is surprising. As
expected, heavily advertised and widely distributed categories get lower net profit impact. But
Herfindahl index is positively associated with net profit impact, though the effect is small.
Interestingly, although number of brands in the category is negatively associated with net unit,
the association with net profit impact is positive. This suggests that, as the number of brands in
the category increases, the retailer is able to offset the smaller net unit impact with greater
funding of promotions from manufacturers. We also find that high penetration, frequently
purchased, frequently promoted, and impulse categories have a greater net profit impact even
though their net unit impact is lower. It appears that the retailer wields some negotiating
leverage in promotion funding for impulse categories that are promoted often and where it enjoys
a strong customer base. The opposite applies to storable categories – they have lower net profit
impact even though their net unit impact is higher.
Store Characteristics. Overall, the effects of store characteristics are much smaller in
magnitude than the effects of promotion, brand, and category characteristics. This is despite the
fact that our data contain more variability in store characteristics than do other studies. Still,
there are some interesting effects that we wish to highlight.
Among characteristics of the store itself, stores in strip malls have somewhat higher net
unit impact than stand-alones. Among market demographics, income and percentage of single
family homes seem to be most important. Consistent with economic theory, lower income areas
get higher net unit impact, as do areas with a higher percentage of single family homes. Savings
are more important under budget constraints, and consumers can stockpile on deal when they
have more storage space (Blattberg et al. 1978; Hoch et al. 1995). We also find a small but non-
monotonic effect of education and employment. Very less and very highly educated areas both
32
show lower net unit impact. And, net unit impact increases with the percentage of two-worker
households but decreases with the percentage of three-worker households.
The impact of retail competition, though small, is intriguing. It varies by type of
competition. As competition from drug chains increases, net unit impact increases, in
accordance with our expectations.2 The effect of mass merchant competition is the reverse -- as
competition from mass merchants increases, net unit impact becomes smaller. Drug store
competitors are usually High-Low pricers like CVS while many mass merchants are everyday
low pricers. It may be that CVS competes with other drug stores for similar customers and can
switch those customers with promotions, but the consumers who shop at EDLP stores are not as
easy to attract with temporary promotional offers. Although speculative, this explanation is
consistent with Ailawadi, Neslin, and Gedenk’s (2001) finding that there are distinct segments of
value conscious consumers, one that buys national brands on promotion and another that buys
everyday low priced store brands. However, more research is clearly needed to understand the
role of competition from different retail formats.
Impact of Negative Promotional Margin. In approximately 17% of the observations in
our dataset, the retailer’s promotional margin was negative. In those cases, any correlate that
increases net unit impact must, by definition, decrease net profit impact because the retailer is
making a loss on each unit sold. We wanted to see if the pattern of opposite associations of the
correlates with net unit versus net profit impact is driven solely by these cases. We repeated our
analysis after excluding them and found few substantive differences. Of the 92 coefficient
estimates in Table 6, less than ten changed signs. Further, none of these sign changes occurred
in the promotion and brand correlates for which we had a priori directional expectations. Details
are available from the first author upon request. 2 Note that our measure of retail competition is defined such that a higher value implies less competition.

33
CONCLUSION
Summary and Research Implications
This article is the first to quantify not just the net unit but also the net profit impact of
promotions for a retailer, and to examine the key correlates of variation in this impact. We
conduct our analysis across a wide range of categories, analyzing several beauty, health, and
general merchandise products apart from the typical grocery products that most scanner data
studies have used. We also examine a much broader set of promotion, brand, category, and store
correlates than other empirical analyses of promotions.
Some key contributions and implications of this research are as follows. First, we
quantify the incremental lift that a retailer gets from promotions. On average, 45% of the gross
lift is incremental, coming either from other stores or from increased consumption. Since the
latter is likely to be small for most of these mature product categories, store switching must be a
significant phenomenon and it deserves further investigation. Prior research has shown that
promotions in a single category don’t induce significant direct store switching. But, perhaps
consumers make direct switches based on the collection of promotions featured by a store. More
importantly, indirect store switching can be significant for a drug store chain like CVS. CVS is
one of the multiple stores that consumers visit but has a small share of their packaged goods
spending. Promotions can induce consumers to buy promoted products while they are in the
store that they would otherwise buy in the grocery store or at a mass merchant.
Second, we quantify the extent to which promotion influences sales of other products in
the store. We find that this “halo” effect is positive on average and substantial, especially for
products in the beauty and general merchandise departments. We encourage future researchers
to validate our work, find new ways of getting more disaggregate estimates of the halo rate, and

34
study how and why halo rates vary across categories and retail formats. There may be some
promise in combining store data with consumer surveys, and in mining loyalty program panel
data. Intuition suggests that direct store switching would be associated with greater halo rates
than indirect store switching, and we highlight this as a topic for further research.
Third, we account for the retailer’s promotional and regular margins in order to quantify
the net profit impact of promotion. Importantly, we find that, on average, the net profit impact of
a promotion is negative although the net unit impact is positive. This can only be if the retailer’s
promotional margin is less than regular margin. But conventional wisdom is that manufacturers
fund promotions and retailers pass through less than 100% of manufacturer funding. As
McAlister (2005) notes, promotional dollars come in a variety of forms, some lump-sum and
others that are linked to individual items, some that are of the “pay-for-performance” type and
others that are simply off-invoice and can be applied to regular margins. Further, there is often a
time lag between the receipt of funding and the retail promotion. We accounted for all
manufacturer payments and found that CVS promotional margin is often substantially lower than
regular margin. This does not necessarily mean that pass-through is greater than 100%.
Retailers may get funding from some vendors while not promoting their products at all. Also,
promotional margin may be lower than regular margin in part because funding that is not directly
tied to retailer promotions can be applied to regular margins. Future research on pass-through
rates must first consider what the best measure of pass-through is and then empirically examine
its magnitude.
Fourth, our analysis of the correlates of net unit versus profit impact reveals a challenge
for retailers. Many of the promotion and brand factors that have a positive association with net
unit impact have a negative association with net profit impact. So, managing promotions for

35
incremental units is not the same as managing them for incremental profit. Deep, featured
promotions on leading, differentiated brands get high net unit impact but they are also the ones
that get low net profit impact. These brands have high consumer pull and therefore are most
effective in making people switch stores, but they are also the ones with the most power over the
retailer, so that the retailer ends up funding at least part of the promotion. Retailers must make
some trade-offs between sales and profit objectives of promotions.
Fifth, our analysis provides some interesting insights into the category drivers of net
impact. Net unit impact is low for categories with strongly defined brand preferences. Although
we do not directly measure store switching, this is consistent with the idea that people switch
stores only for their preferred brands. However, manufacturer funding, and therefore net profit
impact, does not suffer in these categories. Although net unit impact is lower in impulse
categories and those where the retailer has high penetration and purchase frequency,
manufacturer funding, and therefore net profit impact, is unexpectedly higher.
Finally, our results show that store characteristics, while they are significant, contribute
only in small part to the total variation in net impact. This is despite the fact that our data cover a
much wider range of stores and markets (albeit within one retail chain) than prior research. This
suggests that relative to other sources of variation, cross-store variation is not too important and
could even be ignored. But, we believe that more work needs to be done to understand the role
of retail competition, particularly given our finding that mass merchant competitors influence
CVS’ net promotion impact differently from drug and grocery store competitors.
Limitations
This research represents a major collaborative effort between academics and practitioners
to quantify retail promotion impact and to understand how it varies, using a dataset whose

36
coverage of multiple markets, categories, and brands is unprecedented in the literature.
However, we wish to acknowledge some limitations that we hope future research can address.
First, we follow Abraham and Lodish (1993) in using a moving average of non-
promotional week sales to obtain our baselines. But, our data prevent us from utilizing the
“adjustment factor” that those authors use to improve the quality of their baseline. Abraham and
Lodish can see how actual sales in other stores in the market area, that did not promote in a given
week, differ from their baseline, and use that information to adjust the baseline for all stores.
Since we do not have data on competing stores, and CVS promotes uniformly in all its stores in a
given market area, we are unable to make this adjustment. But, our robustness checks, the
results of which we reported earlier, do validate our baseline estimates.
Second, the need to estimate the impact of individual promotions and the practical
constraints of one year of data together with very infrequent shopping trips and category
purchases for a drug retailer, meant that we could not use a unified methodology for estimating
and decomposing the gross lift such as that proposed by van Heerde, Leeflang, and Wittink
(2004). However, our method for estimating switching and halo rates is conceptually similar to
theirs. Data restrictions also prevented us from estimating separate switching and stockpiling
rates for different promotion types and brands in the category. However, there is plenty of
variation in deal depths, use of features, BOGOs etc. across categories, and we do estimate
switching and stockpiling for each category. Also, while we estimate one percentage for all
promoted items within a category, the magnitude varies by item because gross lift varies.
Third, since the gross lift, which is measured with error, is used as an independent
variable in the models to estimate switching and halo, there is potential for a downward bias in
those estimates. The unified regression approach of van Heerde et al. would avoid this problem
37
but, as noted earlier, our attempt to use it to estimate switching and stockpiling with 52 weeks of
POS data was not successful. We would also like to note that CVS conducted a controlled field
test in which promotion changes were made based on our analysis. The results, details of which
are available in Ailawadi et al. (2005), validated our overall methodology and its ability to
identify the worst and best performing promotions.
Fourth, we study the impact of BOGOs and feature ads placed on the front, back, or
middle page of the flyer, but lack of data on displays and limit promotions prevent us from
studying these promotion types. van Heerde et al. (2004) show that the display effect and its
decomposition is different from pure price promotions, and the work of Inman, Peter, and
Raghubir (1997) and Wansink, Kent, and Hoch (1998) suggests that there may be interesting
differences for limit promotions as well. Fifth, although we have examined a much broader set
of correlates than other studies, much of the cross-brand and within-brand variation in net impact
remains to be explained. Future research should identify and study other relevant correlates.
A final issue we want to highlight is not so much a limitation of our research as it is a
flaw in how promotions are evaluated. It relates to fact that regular price and regular margin are
an inflated benchmark for evaluating the profitability of promotions. As Farris and Quelch
(1987) note, if the retailer were to stop promoting, the everyday low price would have to be
somewhere between the current regular price and the current promotional price. To address this,
we computed a more realistic benchmark price as the weighted average of regular and
promotional price, the weights being the percentage of category sales off and on promotion. We
repeated our net profit impact analyses using this price instead of the higher regular price. As
expected, the level of the net profit impact of promotions increased. Importantly, however, there
was no substantive change in the correlates of net profit impact. Still, we highlight this as an

38
important issue that researchers must deal with as they examine the profitability of promotions to
retailers and manufacturers.
In closing, we believe that this study, jointly conducted by academics and practitioners,
has provided new results about the impact of promotions for a retailer and several insights into
how that impact varies. We hope that our findings and the substantive issues they highlight will
stimulate further research in this area and encourage more collaborative work between academics
and practitioners. A major benefit of such collaboration is its ability to bring together valid and
practical methods with unique data to address important managerial problems.

39
TABLE 1 WEEKS FOR BASELINE ESTIMATES
Type of Item Low Seasonality (CV < .4)
Medium Seasonality (.4 ≤ CV ≤ .8)
High Seasonality (CV > .8)
Very low movement (< .2 units per store-week)
T-1 to T-12 weeks (5% of promotions)
T-4 to T+4 weeks (3% of promotions)
T-3 to T+3 weeks (5% of promotions)
Low movement (.2 to 1 units per store-week)
T-1 to T-8 weeks (22% of promotions)
T-4 to T+4 weeks (6% of promotions)
T-3 to T+3 weeks (10% of promotions)
Regular movement > 1 units per store-week)
T-1 to T-6 weeks (37% of promotions)
T-3 to T+3 weeks (7% of promotions)
T-2 t o T+2 weeks (5% of promotions)
CV = Coefficient of variation of item sales = Standard deviation of monthly sales/Mean monthly sales

40
TABLE 2 EXPECTED CORRELATES OF NET PROMOTION IMPACT
Current Period Future Period
Correlate Store Switches
Brand+Store Switches
Store Switches
Brand+Store Switches
Category Consumption
Incremental Lift
Promo vs Reg. Margin
Promotion Characteristics Discount Depth + + + + + + - Feature + + + + ? + - % Items on Promotion + + + + 0 + - BOGO - - - - + - ?
Brand Characteristics Unit Share + + + + ? + - Relative Advertising + + + + + + - Store Brand - - - - ? - + Relative Price + ? ? ? - ? ? Promotion Frequency - - - - - - -
Category Characteristics Penetration - - - - - - 0 Purchase Frequency - - - - ? - 0 Purchase Amount + ? ? ? - ? 0 Promotion Frequency - - - - - - - Average Discount Depth + + + + + + - Distribution + + + + 0 + - Storability 0 0 + + - ? 0 Impulse Purchase-ability - - - - + - 0 Advertising + - + - + ? - Herfindahl Index + - + - ? ? - Number of Brands ? ? ? ? ? ? +
Store Characteristics Store Square Footage + + + + 0 + 0 Shopping Center Location + + + + 0 + 0 Drive-thru Pharmacy - - - - 0 - 0 Drug Competition + + + + 0 + - Mass Merchant Competition + + + + 0 + - Grocery Competition + + + + 0 + -
Note: Market demographics are not listed here because we do not have a priori expectations about the direction of their effect.

41
TABLE 3 OVERVIEW OF THE PROMOTIONAL LIFT
Variable Full Sample Health Beauty Edibles Gen. Merchandise
Promotional Discount Median 30.0% 26.5% 28.6% 33.6% 33.6% Standard deviation 14.5% 14.4% 14.8% 13.7% 13.7%
Gross Lift %* Median 310% 264% 314% 308% 421% Standard deviation 581% 530% 548% 633% 659%
Switching Rate Median .46a .50 .47 .40 .43 Standard deviation .16 .15 .14 .17 .18
Stockpiling Rate Median .10b .11 .09 .15 .08 Standard deviation .10 .11 .05 .12 .10
Halo Rate Median .16c -.04 .30 .05 .28 Standard deviation .17 .09 .09 .10 .10
* Gross lift as a percentage of baseline units aRead as: .46 unit out of every unit of gross lift for a promoted item is switched from other items in the category
within the store in the same week. bRead as: .10 unit out of every unit of gross lift for a promoted item is pulled forward from future category sales
within the store due to consumer stockpiling. cRead as: For every unit of gross lift for a promoted item, .16 unit of some other product is sold elsewhere within the
store in the same week.

42
TABLE 4 OVERVIEW OF NET PROMOTION IMPACT
Variable Full Sample Health Beauty Edibles Gen. Merchandise
Net Unit Impact Median 1.05a .58 1.35 2.07 1.71 Standard deviation 12.7 2.5 6.0 18.0 21.9
Baseline Units Median .86a .80 .67 2.00 .75 Standard deviation 6.0 2.8 2.6 11.8 5.2
Net Profit Impact Median -.62b -.93 .23 -1.14 .08 Standard deviation 13.5 9.4 7.8 20.1 17.6
Baseline Profit Median 1.29b 1.69 1.24 .91 .94 Standard deviation 5.1 5.1 3.8 4.9 3.5
a Read as: The median net unit impact (computed using equation 3) of a promotion on one item in one week in one
store is +1.05 units, compared to median baseline sales of .86 units per item per week per store. b Read as: The median net profit impact (computed using equation 4) of a promotion on one item in one week in one
store is -$.62, compared to median baseline profit of $1.29 per item per week per store.

43
TABLE 5 VARIANCE COMPONENTS OF NET IMPACT
Net Unit Impact Net Profit Impact Variance Component % of Total Variation % Explained by
Correlates % of Total Variation % Explained by
Correlates Cross-Store 2.2%a 38.7%b 1.0% 27.3% Cross-Category 27.9% 36.1% 8.2% 9.1% Cross-Brand 14.7% 8.6% 24.2% 3.1% Residual Within-Brand 62.2% 2.6% 66.6% 4.6% a Read as: Cross-store variation accounts for 2.2% of the total variation in net unit impact. b Read as: 38.7% of the cross-store variation in net unit impact is explained by the correlates in our model.

44
TABLE 6 CORRELATES OF NET UNIT AND PROFIT IMPACT
Percent Change Standardized Coefficient Explanatory Variable
Net Unit Impact
Net Profit Impact
Net Unit Impact
Net Profit Impact
Promotion Characteristics Discount depth .23a -1.55 .072b -.175b Front page feature .89a -1.63 .081 -.053 Middle page feature .51 -.42 .073 -.021 Back page feature .83 -.72 .072 -.022 % Items on promotion .29 -.23 .091 -.025 BOGO -.14 2.24 -.015 .085 Brand Characteristics Unit share .52 -.55 .164 -.063 Relative advertising .04 -.34 .012 -.039 Store brand -.23 2.05 -.026 .085 Relative price -.01 .18 -.004 .020 Promotion frequency -.33 .14 -.103 .016 Category Characteristics Penetration -.26 .52 -.083 .058 Purchase frequency -.27 .13 -.086 .014 Purchase amount .26 -.44 .081 -.050 Avg. promotion frequency -.07 .38 -.023 .043 Avg. discount depth -.07 .12 -.022 .013 Distribution .09 -.56 .029 -.064 Storability .55 -.80 .063 -.033 Impulse purchaseability -.47 .59 -.058 .026 Advertising -.09 -.07 -.029 -.007 Herfindahl index -.04 .05 -.014 .005 Number of brands -.38 .38 -.012 .043 Beauty dept. .85 .83 .125 .044 Gen. merchandise dept. 2.84 1.09 .276 .038 Edibles dept. 2.64 -2.86 .275 -.107 Store characteristics: Store Retail square footage -.01 ns -.006 ns Drive thru pharmacy ns ns ns ns Convenience center -.02 -.05 -.003 -.002 Downtown .02 .08 .001 .003 Strip Shopping Center .07 -.06 .009 -.003 Other ns .09 ns .002 Store characteristics: Demographics Population -.03 -.03 -.008 -.004 % Kids in population ns -.08 ns -.009 % Seniors in population -.01 -.06 -.004 -.007

45
% Less than high school -.02 ns -.005 ns % College or more -.04 ns -.011 ns % Income < $25K .09 .03 .027 .003 % Income > $100K -.04 .04 -.014 .004 % Hispanic or black -.01 .03 -.003 .004 % Single family homes .07 .03 .022 .004 Persons per household .03 .09 .009 .010 % Two workers .04 .02 .011 .002 % ≥ Three workers -.04 -.07 -.013 -.007 Store Characteristics: Competition Pop./Chain drug -.02 .05 -.006 .005 Pop./Mass merchant .03 .03 .010 .003 Pop/Grocery -.01 -.06 -.002 -.006 Note: All coefficients are significant at p<.01 except where noted (ns). a Read as: Holding all other correlates at their means, when the discount increases by
one standard deviation, net unit impact increases by 23%. Holding all other correlates at their means, when the promotion is featured on the front page of the flyer net unit impact is 89% higher than when it is not featured.
b Read as: Holding all other correlates constant, when the discount increases by one
standard deviation, net unit impact increases by .072 standard deviations and net profit impact decreases by .175 standard deviations.

46
FIGURE 1 LIFT AND NET UNIT IMPACT OF A PROMOTION FOR A RETAILER
Increased Category
Consumption
Category sales shifted from
current period
GROSS
LIFT
Category sales shifted from
future periods
=
New users
Higher consumption rate
Current sales of other brands in other stores
Current sales of other brands in same store
Current sales of same brand in other stores
Future sales of other brands in other stores
Future sales of other brands in same store
Future sales of same brand in other stores
Future sales of same brand in same store
INCREEMENTAL
LIFT
= +Halo
Change in current sales of other
categories in same store
=
STORE
NET
UNIT
IMPACT

47
REFERENCES
Abraham, Magid M., and Leonard M. Lodish (1993), “An Implemented System for Improving
Promotion Productivity Using Store Scanner Data,” Marketing Science, Vol. 12, Issue 3, 248-
269.
Ailawadi, Kusum L., and Scott A. Neslin (1998), “The Effect of Promotion on Consumption:
Buying More and Using it Faster," Journal of Marketing Research, Vol. 35, 390-398.
----, Paul W. Farris, and Erwin Shames (1999), “Trade Promotion: Essential to Selling Through
Resellers”, Sloan Management Review, Vol. 41, No. 1 (Fall), 83-92.
----, Scott A. Neslin, and Karen Gedenk (2001), “Pursuing the Value Conscious Consumer: Store
Brands Versus National Brand Promotions," Journal of Marketing, Vol. 65, No. 1 (January), 71-
89.
----, ----, Jacques Cesar, and David Trounce (2005), “Quantifying and Improving Promotion
Profitability at CVS,” ISMS Practice Prize Report, Marketing Science Conference, Emory
University.
Albion, Mark S. and Paul W. Farris (1987), "Manufacturer Advertising and Retail Gross
Margins," Advances in Marketing and Public Policy, Vol. 1, 107-136.

48
Assuncao, Joao L., and Robert Meyer (1993), “The Rational Effect of Price Promotions on Sales
and Consumption,” Management Science, Vol. 39, Issue 5 (May), 517-535.
Bell, David R., Jeongwen Chiang, and V. Padmanabhan (1999), “The Decomposition of
Promotional Response: An Empirical Generalization,” Marketing Science, Vol. 18, No. 4, 504-
526.
Blattberg, Robert, Thomas Buesing, Peter Peacock, and Subrata Sen (1978), “Identifying the
Deal Prone Segment,” Journal of Consumer Research, Vol. 3, No. 3, 369-377.
Blattberg, Robert, and Scott A. Neslin (1990), Sales Promotion: Concepts, Methods, and
Strategies. Englewood Cliffs, New Jersey: Prentice-Hall Publishers.
Bolton, Ruth N. (1989), “The Relationship Between Market Characteristics and Promotional
Price Elasticities,” Marketing Science, Vol. 8 (Spring), 153-169.
Bucklin, Randolph E., and James M. Lattin (1992), “A Model of Product Category Competition
Among Grocery Retailers,” Journal of Retailing, Vol. 68, No. 3 (Fall), 271-293.
Chandon, Pierre, Brian Wansink, and Gilles Laurent (2000), “A Benefit Congruency Framework
of Sales Promotion Effectiveness,” Journal of Marketing, Vol. 64 (October), 65-81.

49
---- and ---- (2002), “When Are Stockpiled Products Consumed Faster? A Convenience-Salience
Framework of Post-Purchase Consumption Incidence and Quantity,” Journal of Marketing
Research, Vol. 39, Issue 3 (August), 321-335.
Cooper, Lee G., Penny Baron, Wayne Levy, Michael Swisher, and Paris Gogos (1999),
“PromoCast: A New Forecasting Method for Promotion Planning,” Marketing Science, Vol. 18,
No. 3, 301-316.
Dhar, Sanjay, and Stephen Hoch (1997), "Why Store Brand Penetration Varies by Retailer,"
Marketing Science, Vol. 16 (3), 208-227.
Farris, Paul W., and John Quelch (1987), “In Defense of Price Promotion,” Sloan Management
Review, Vol. 29, Issue 1 (Fall), 63-69.
Gupta, Sunil (1988) “Impact of Sales Promotions on When, What, and How Much to Buy,”
Journal of Marketing Research, 25 (November), 342-355.
Hoch, Stephen, Byung-Do Kim, Alan Montgomery, and Peter Rossi (1995), “Determinants of
Store-Level Price Elasticity,” Journal of Marketing Research, Vol. XXXII (February), 17-29.
Inman, J. Jeffrey, Anil C. Peter, and Priya Raghubir (1997), “‘Framing the Deal’ The Role of
Restrictions in Accentuating Deal Value,” Journal of Consumer Research, Vol. 24 (June), 68-79.

50
----, Venkatesh Shankar, and Rosellina Ferraro (2004), ‘The Roles of Channel-Category
Associations and Geodemographics in Channel Patronage,” Journal of Marketing, Vol. 68, Issue
2 (April), 51-71.
Krishna, Aradhna (1992), “The Normative Impact of Consumer Price Expectations for Multiple
Brands on Consumer Purchase Behavior,” Marketing Science, Vol. 11, Issue 3, 266-286.
---- (1994), “The Effect of Deal Knowledge on Consumer Purchase Behavior,” Journal of
Marketing Research, Vol. 31, Issue 1 (February), 76-91.
Kumar, V., and Robert P. Leone (1988), “Measuring the Effect of Retail Store Promotions on
Brand and Store Substitution,” Journal of Marketing Research, Vol. 25, Issue 2 (May), 178-185.
Lal, Rajiv, and Chakravarthi Narasimhan (1996), “The Inverse Relationship Between
Manufacturer and Retailer Margins: A Theory,” Marketing Science, Vol. 15 No. 2, 132-151.
Macé, Sandrine, and Scott Neslin (2004), “The Determinants of Pre- and Postpromotion Dips in
Sales of Frequently Purchased Goods,” Journal of Marketing Research, Vol. XLI (August), 339-
350.
McAlister, Leigh (1985), “The Impact of Price Promotions on a Brand’s Market Share, Sales
Pattern, and Profitability,” Working Paper # 1622-85, Sloan School of Management.

51
---- (2005), “Cross Brand Pass-through? Not in Grocery Retailing,” Working Paper, McCombs
School of Business, University of Texas Austin.
Narasimhan, Chakravarthi, Scott A. Neslin, and Subrata Sen (1996), “Promotional Elasticities
and Category Characteristics,” Journal of Marketing, Vol. 60 (April), 17-30.
Neslin, Scott A., and Robert W. Shoemaker (1983), “A Model for Evaluating the Profitability of
Coupon Promotions,” Marketing Science, Vol. 2, Issue 4, 361-88.
Nijs, Vincent R., Marnik G. DeKimpe, Jan-Benedict E.M. Steenkamp, and Dominique M.
Hanssens (2001), “The Category-Demand Effects of Price Promotions,” Marketing Science, Vol.
20, Issue 1 (Winter), 1-22.
Raju, P.S. (1980), "Optimal Stimulation Level: Its Relationship to Personality, Demographics
and Exploratory Behavior," Journal of Consumer Research, Vol. 7 (December), 795-809.
Raudenbush, Stephen W., and Anthony S. Bryk (2002), Hierarchical Linear Models:
Applications and Data Analysis Methods, Second Edition, Thousand Oaks, CA: Sage
Publications, Inc.
Srinivasan, Shuba, Koen Pauwels, Dominique Hanssens, and Marnik Dekimpe (2004), “Do
Promotions Benefit Manufacturers, Retailers or Both?” Management Science, Vol. 50, Issue 5
(May), 617-629.

52
Steiner, Robert L. (1973), “Does Advertising Lower Consumer Prices?” Journal of Marketing,
Vol. 37 (October), 19-26.
---- (1993), “The Inverse Association Between the Margins of Manufacturers and Retailers,”
Review of Industrial Organization, Vol. 8, 717-740.
Sun, Baohong, Scott A. Neslin, and Kannan Srinivasan (2003), “Measuring the Impact of
Promotions on Bran Switching When Consumers Are Forward Looking,” Journal of Marketing
Research, Vol. XL (November), 389-405.
Urbany, Joel E., Peter R. Dickson and Rosemary Kalapurakal (1996), "Price Search in the Retail
Grocery Market," Journal of Marketing, 60 (April), 91-104.
van Heerde, Harald J., Sachin Gupta, and Dick Wittink (2003), “Is 75% of the Sales Promotion
Bump Due to Brand Switching? No, Only 33% Is,” Journal of Marketing Research, Vol. XL
(November), 481-491.
----, and ---- (2005), “The Origin of Demand: A System to Classify the Sources of Own-Demand
Effects of Marketing Instruments,” Working Paper, Tilburg University.
----, Peter S.H. Leeflang, and Dick R. Wittink (2004), “Decomposing the Sales Promotion Bump
With Store Data,” Marketing Science, Vol. 23, Issue 3, 317-334.

53
Wansink, Brian (1994), “Advertising’s Impact on Category Substitution,” Journal of Marketing
Research, Vol. 31, Issue 4 (November), 505-515.
----, Robert J. Kent, and Stephen J. Hoch (1998), “An Anchoring and Adjustment Model of
Purchase Quantity Decisions,” Journal of Marketing Research, Vol. 35, Issue 1, 71-81.
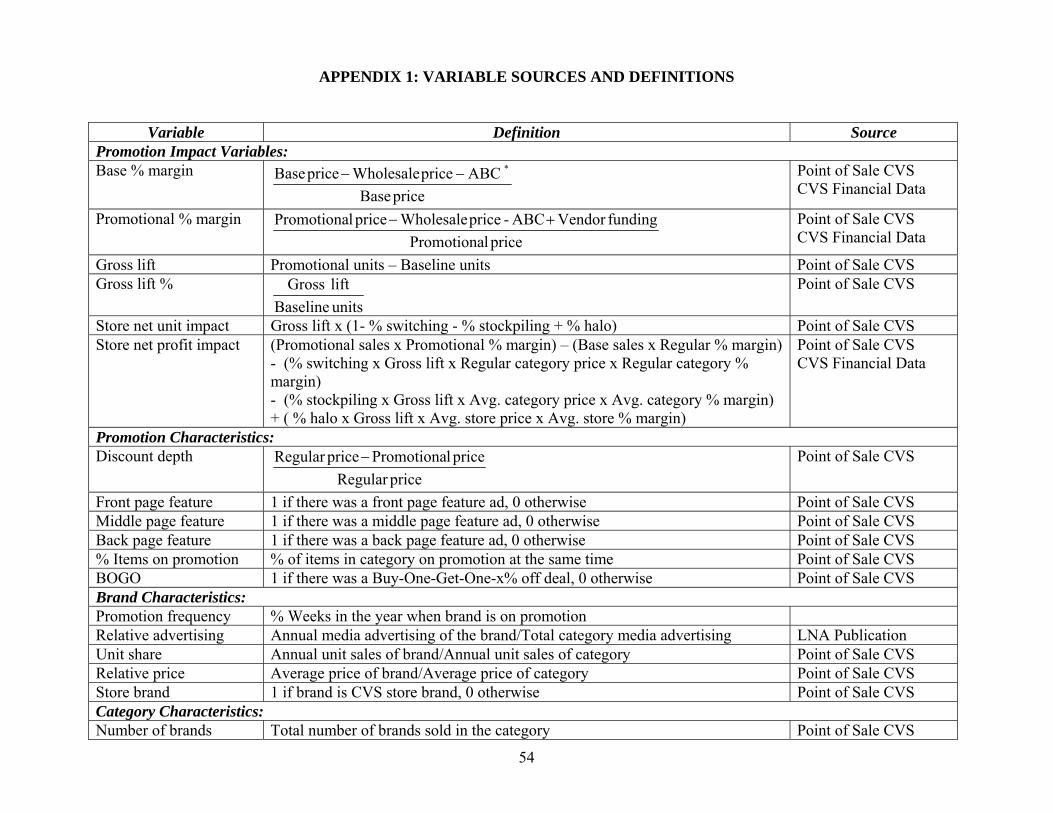
54
APPENDIX 1: VARIABLE SOURCES AND DEFINITIONS
Variable Definition Source Promotion Impact Variables: Base % margin
priceBaseABCpriceWholesalepriceBase *−−
Point of Sale CVS CVS Financial Data
Promotional % margin pricelPromotiona
fundingVendorABC -priceWholesalepricelPromotiona +− Point of Sale CVS CVS Financial Data
Gross lift Promotional units – Baseline units Point of Sale CVS Gross lift %
unitsBaselinelift Gross
Point of Sale CVS
Store net unit impact Gross lift x (1- % switching - % stockpiling + % halo) Point of Sale CVS Store net profit impact (Promotional sales x Promotional % margin) – (Base sales x Regular % margin)
- (% switching x Gross lift x Regular category price x Regular category % margin) - (% stockpiling x Gross lift x Avg. category price x Avg. category % margin) + ( % halo x Gross lift x Avg. store price x Avg. store % margin)
Point of Sale CVS CVS Financial Data
Promotion Characteristics: Discount depth
priceRegularpricelPromotionapriceRegular −
Point of Sale CVS
Front page feature 1 if there was a front page feature ad, 0 otherwise Point of Sale CVS Middle page feature 1 if there was a middle page feature ad, 0 otherwise Point of Sale CVS Back page feature 1 if there was a back page feature ad, 0 otherwise Point of Sale CVS % Items on promotion % of items in category on promotion at the same time Point of Sale CVS BOGO 1 if there was a Buy-One-Get-One-x% off deal, 0 otherwise Point of Sale CVS Brand Characteristics: Promotion frequency % Weeks in the year when brand is on promotion Relative advertising Annual media advertising of the brand/Total category media advertising LNA Publication Unit share Annual unit sales of brand/Annual unit sales of category Point of Sale CVS Relative price Average price of brand/Average price of category Point of Sale CVS Store brand 1 if brand is CVS store brand, 0 otherwise Point of Sale CVS Category Characteristics: Number of brands Total number of brands sold in the category Point of Sale CVS

55
Herfindahl index ∑ 2share)unit(Brand Point of Sale CVS Advertising Total annual media advertising of the category LNA Publication Avg. promo. frequency % Weeks in the year when category is on promotion Point of Sale CVS Avg. discount depth Average % discount when category is on promotion Point of Sale CVS Penetration % of CVS customers who buy the category Extra Care CVS Panel Purchase amount Average purchase amount in dollars Extra Care CVS Panel Purchases per year Average category purchases per year at CVS per purchasing customer Extra Care CVS Panel Storability 1 if it is a storable category, 0 otherwise Primary survey, NNS Impulse purchaseability 1 if it is a category purchased on impulse, 0 otherwise Primary survey, NNS Store Characteristics: Retail square footage Retail area of store in square feet CVS store database Drive thru pharmacy 1 if there is a drive thru pharmacy in store, 0 otherwise CVS store database Store type Dummy variables for downtown, strip shopping center, convenience center, and
others. Base case is free-standing store. CVS store database
Population Number of households in area Claritas % Income < 25K % Households with annual income less than $25K Claritas % Income > 100K % Households with income more than $100K Claritas % Less than HS % Adults with education less than high school Claritas % College or more % Adults with college education or more Claritas % Kids in population % Population 14 years or younger Claritas % Seniors in population % Population 65 years or older Claritas % Hispanic or black % Population that is Hispanic or Non-Hispanic Black Claritas % Single family homes % Population in single family homes Claritas Persons per household Average number of persons in household Claritas % Two workers % Households with two workers Claritas % ≥ Three workers % Households with more than two workers Claritas Pop/mass merch. Population divided by mass merchandiser store quantity within 3 mile radius,
where store quantity is a metric scaled from 0 to 1 based on number of stores and their proximity to the CVS store.
Trade Dimensions
Pop/chain drug Population divided by chain drug store quantity within 3 mile radius, where store quantity is a metric scaled as above.
Trade Dimensions
Pop/grocery Population divided by grocery store quantity within 3 mile radius, where store quantity is a metric scaled as above.
Trade Dimensions
* ABC = Activity based costs.