Innovation Ecosystems and the Pace of Substitution: Re...
53
Innovation Ecosystems and the Pace of Substitution: Re-examining Technology S-curves Ron Adner Tuck School of Business, Dartmouth College Strategy and Management 100 Tuck Hall Hanover, NH 03755, USA Tel: 1 603 646 9185 Email: [email protected] Rahul Kapoor The Wharton School University of Pennsylvania Philadelphia, PA-19104 Tel : 1 215 898 6458 Email: [email protected] December 22, 2011 Abstract Why do some new technologies emerge and immediately supplant incumbent technologies while others take years or decades to takeoff? We explore this question through a framework that weighs the emergence challenges that need to be overcome by a new technology against the extension opportunities that are available to the old technology. We consider both the focal competing technologies as well as the external technology ecosystems in which they are developed and used. We apply this framework to analyze ten episodes of technology competition that have occurred in the semiconductor lithography equipment industry from 1972 to 2009. The framework provides a robust explanation for the observed differences in the pace of substitution.
Transcript of Innovation Ecosystems and the Pace of Substitution: Re...

Innovation Ecosystems and the Pace of Substitution: Re-examining Technology S-curves
Ron Adner Tuck School of Business, Dartmouth College
Strategy and Management 100 Tuck Hall Hanover, NH 03755, USA
Tel: 1 603 646 9185 Email: [email protected]
Rahul Kapoor
The Wharton School University of Pennsylvania
Philadelphia, PA-19104 Tel : 1 215 898 6458
Email: [email protected]
December 22, 2011
Abstract
Why do some new technologies emerge and immediately supplant incumbent technologies while others take years or decades to takeoff? We explore this question through a framework that weighs the emergence challenges that need to be overcome by a new technology against the extension opportunities that are available to the old technology. We consider both the focal competing technologies as well as the external technology ecosystems in which they are developed and used. We apply this framework to analyze ten episodes of technology competition that have occurred in the semiconductor lithography equipment industry from 1972 to 2009. The framework provides a robust explanation for the observed differences in the pace of substitution.
2
INTRODUCTION
Technology substitution has been a dominant focus of the innovation literature since its
beginnings (i.e., Schumpeter, 1942). However, while the waves of creative destruction regularly crash on
the shores of markets, the pace of substitution varies markedly across different contexts and episodes.
Some new technological waves wreak havoc on the established technological regimes and dominate their
markets in a matter of years (e.g., DVDs, inkjet printers), some take decades (e.g., color television, E-
books), while others fall upon the shore and recede, leaving but trace remains in a niche (e.g., WAP
telephony, digital audio tape).
Although the literature has made significant inroads in characterizing the nature of the threat
posed by a new technology and its implications for innovating firms, much less attention has been paid to
the dynamics by which new technologies transition from ex-ante threat to ex-post market dominance
Great progress has been made in identifying whether a new technology holds the potential to dominate an
old technology (e.g., Foster, 1986; Christensen, 1997), and whether the new technology reinforces or
undermines the position of industry incumbents (Abernathy and Clark, 1985; Tushman and Anderson,
1986; Teece 1986; Henderson and Clark, 1990; Tripsas, 1997; Hill and Rothaermel, 2003; Lavie, 2006;
Benner, 2010). There has been relatively little explicit investigation of how and why the pace of
substitution varies across different episodes of technology competition (Anderson and Tushman, 1990;
Ansari and Garud, 2009 are notable exceptions). Instead, the implicit assumption has been that once the
newer, better technology becomes available commercially, it should substitute the old technology, and
substitute it fast.
In this paper we examine variance in the pace of technology substitution – the time span between
the point at which a new technology with superior performance becomes commercially available [is first
sold commercially] and the point at which it achieves market share dominance. Our theory (and our
observations) begins after the point of commercialization and seeks to explain why some superior new
technologies conform to the expectation of rapid substitution while others depart quite dramatically.
3
We present a structured approach to analyzing the pace of technology substitution that considers
the interplay between the emergence challenges that need to be overcome in order for users to benefit from
a new technology’s superior performance and the extension opportunities that are available to improve the
performance of the old technology. We argue that understanding differences in the pace of substitution
requires the explicit, joint consideration of both emergence challenges and extension opportunities. In
assessing emergence challenges and extension opportunities we take a systems view of technology (e.g.,
Rosenberg, 1976; Hughes, 1983; Henderson and Clark, 1990; Tushman and Rosenkopf, 1992; Garud and
Kumaraswamy, 1993; Henderson, 1995; Ethiraj 2007), considering not only developments in the focal
technologies that are competing for dominance, but also developments in the technology ecosystem in
which each of the focal technologies is embedded (Christensen and Rosenbloom, 1995; Iansiti and
Levien, 2004; Adner, 2006; Adner and Kapoor, 2010). In so doing we draw a key distinction between the
as-developed performance of a focal technology, which depends on the components and the product
architecture (e.g., the battery and design of an electric car), and the as-used performance of the technology
which depends additionally on the complements which users integrate with the focal technology (e.g. the
quality of the charging infrastructure for electric car).
We develop a framework in which technology competition is assessed according to the balance of
emergence challenges for the new technology and extension opportunities for the old technology. We use
these two dimensions to identify four qualitatively distinct substitution regimes and predict a clear
ordering of the pace of substitution across these regimes. Our approach clarifies how the competing
effects of emergence challenges and extension opportunities for the focal technologies as well as their
surrounding ecosystems interact to determine when and how technology substitution takes place.
We draw on a unique array of primary and secondary data to test the predictions from our
framework in the context of the semiconductor lithography equipment industry from 1972 to 2009, during
which ten new technology generations were introduced into the industry. In each case: the new
technology was offered for sale on a commercial basis (i.e., it had overcome its development challenges);
the new technology offered significantly higher performance than the old technology (e.g., Foster, 1986);
4
customers were well informed about the availability of the new technology (e.g., Rogers, 1995; Bass,
2004); and customers were eager to adopt higher performance products (e.g., Christensen, 1997). Yet
despite these structural similarities, substitution dynamics varied widely across the technology
generations, ranging from cases of rapid substitution (dominance achieved after one year), to slow
substitution (dominance achieved after ten years), to non- substitution (dominance never achieved). We
apply our framework to explain the variance in substitution dynamics – the difference in the interval
between the time a new technology’s first commercial sale and the time it achieves dominant industry
market share. In so doing we explore and articulate the micro-foundations of technology substitution.
We find that the joint consideration of new technology emergence challenges and old technology
extension opportunities explains variance in the pace substitution that cannot be accounted for when
emergence and extension are considered independently. We also explore the ways in which the industry
has managed the interaction between new technology emergence and old technology extension to shed
light on the puzzling observation that, despite many misses and delays in the commercialization of new
lithography technologies, semiconductor manufacturers has continued to make steady progress along the
performance trajectory predicted by Moore’s law. From a broader technology management perspective,
we consider implications for resource allocation across technology generations and the use of different
coordination mechanisms in the face of technological change.
TECHNOLOGY SUBSTITUTION
Explaining the dynamics of substitution is an important goal of the technology strategy literature.
S-curves have become the canonical representations of both the technology life cycle and of the
competition between technologies (e.g., Foster, 1986; Christensen, 1997; Utterback, 1994). The S-curve
approach holds that the magnitude of performance improvement in a given technology for a fixed unit of
effort or time is relatively low during the early development stages. As the technology is better
understood, the rate of progress increases until the stage of maturity, at which point the technology

5
approaches its limits and the performance impact of additional efforts to improve the technology are
subject to decreasing returns.
In the context of competing technologies, Foster’s influential work posited that the substitution
threat becomes salient when the new technology moves beyond its development stage, and that
substitution occurs when the new technology’s performance surpasses the performance of the old
technology – the point at which the new S-curve crosses the old (Foster, 1986). Christensen (1997)
observed that substitution can take place even when the new technology is inferior to the old, arguing that
if consumers are over-served along the main performance dimension they may switch to the new
technology if it offers superior performance on new dimensions. Adner (2002) found that such disruptive
dynamics can be explained in terms of price and cost asymmetries. Other studies have shown how new
technologies can be incubated in distant markets, emerging as substitute threats when they reach a
sufficient performance level (Levinthal, 1998; Adner and Levinthal, 2001) or when triggered by a
discontinuous shift in the preferences of consumers in the core market (Tripsas, 2008).
Notice, however, that most studies in this vein implicitly frame substitution as an event that is
governed by the rise of the new technology. They pay the bulk of their attention to understanding whether
the new technology arises in a market domain that is nearer or farther from the current customer base;
whether it draws on knowledge domains that are nearer or further from the current competence base;
whether it favors established firms or new entrants. The focus in this literature has been on understanding
where, and by whom, the new technology will be incubated before it reaches the mainstream market, with
the assumption that once it is available commercially, the new technology will quickly dominate the
market.
Beyond the performance level of the new technology itself, however, two additional factors play
an important role in determining the dynamics of substitution: the performance evolution of the old
technology after the introduction of the new technology; and the role of ecosystem elements on
determining the performance-in-use (as opposed to performance-as-developed) gap between the old and
new technologies.

6
Substitution reflects consumers’ choice to stop using the old technology and start using the new.
As such, it is important to consider not just the performance trajectory of the new technology, but also that
of the old technology. Specifically, although the canonical representation posits a flat-lining of the old
technology’s performance trajectory, this is not necessarily the case. Indeed, cases of old technology
extension have been well documented in settings ranging from sailing ships (Harley, 1971) to pond ice
harvesting (Utterback, 1994) to typesetters (Tripsas, 2008) to carburetors (Snow, 2004) to mobile
telephony (Ansari and Garud, 2009). Henderson’s pioneering (1995) study identified the key role of
improvements in components, complements, and users’ capabilities in extending the performance
trajectory of optical lithography. A key insight in Henderson’s study is that predictions regarding an ‘old’
technology’s performance limits must be informed by a holistic assessment of the potential for
performance improvements in its surrounding ecosystem.
Fundamentally, what matter for consumers is not the performance of a technology “as-
developed”; rather, what matters is the performance of the technology “as-used.” The as-developed
performance of a given technology depends on the interaction between components and the focal
architectures into which these components are integrated (Figure 1a). It is this performance-as-developed
that has been the focus of much of the literature on technology S-curves. In contrast, the as-used
performance of a technology depends not only on the as-developed performance of the focal technology,
but also on the performance of the complements with which users will combine it to derive their value
(Figure 1b).
(Insert Figures 1a and 1b about here)
Consider the example of electric cars, which are threatening to substitute traditional gas-powered
cars on the basis of energy efficiency and emissions reduction. Although this competition is often framed
as one between products (i.e., electric vs. gas-powered vehicles) its outcome will be determined by the
competition between systems. Here, as-developed product performance is determined by the interaction
7
between the battery components (e.g., how much electric charge can be stored in the battery) and the
design of the car (e.g., how efficiently is energy consumed within the car, such as through regenerative
braking systems that captures the energy generated from slowing the car and transfers it back to the
battery). But once launched, the as-used performance of an electric car depends on complementary
elements such as the charging station infrastructure (e.g., how convenient it is for a driver to recharge the
battery). Taking such a systems view, it follows that the competition between gas and electric cars should
not be assessed on the basis of the standalone product or artifact, but rather be considered within the
context of the entire technology ecosystem on which the products’ performance depends.
Historical accounts of technology evolution have explicitly shown that underlying a technology’s
advance are systemic efforts by component and complement providers from a range of industries. For
example, Constant’s (1980) extensive account of the progress in aircraft piston-engine technology between
1910 and 1945 pointed to the critical role of improvements in the engine components by suppliers such as
General Electric, as well as improvements in the complements of fuels and lubricants by oil companies
such as Royal Dutch Shell. Such systemic efforts that transcend a given firm or industry are even more
prominent today as technologies become more complex and firms get more specialized.
Progress in a given technology can also be hindered by interdependencies in the ecosystem.
Rosenberg’s (1963) account of the technological change in the American machine tool industry points to
numerous episodes of “technological imbalance” in which improvements in machine tool technology
could only be realized by users after improvements in other interdependent technologies such as drills and
cutting materials were achieved. Similarly, Hughes’ (1983) rich description of the evolution of the
electrical power system in different market contexts highlights the impact of technological
interdependencies and performance bottlenecks on adoption. Since substitution is ultimately a question of
consumers’ changing adoption choices, the true measure of performance must be performance-in-use, and
so must include consideration of progress in the critical components and complements that comprise the
complete solution that users will compare.

8
In our analysis of technology substitution we highlight how the performance of ecosystem
elements can play two distinct roles. First (as in Henderson, 1995), it can extend the useful life of a focal
technology, when improvements in ecosystem elements offset maturity in the focal technology, allowing
the focal technology to function beyond its ‘stand-alone’ potential. Second, and in direct contrast to the
first, it can delay the emergence of a new technology when the performance of complements lags that of
the focal technology, creating a technology bottleneck that keeps it from functioning at its ‘stand-alone’
potential. A direct implication of this approach is that any one of these three trajectories can act as a
binding constraint on system performance: it is the combined effect of the components, product
architecture, and complements that determines the in-use performance of the competing technologies,
which is ultimately the driver of technology substitution (Figure 2).
(Insert Figure 2 about here)
The Pace of Technology Substitution: Emergence Challenges vs. Extension Opportunities
In the context of interdependent technologies, substitution must be viewed not as a race between a
new technology and an old technology, but rather as a race between a new technology ecosystem and an
old technology ecosystem. As such, two key factors come to the fore. For the new technology, we must
consider the dynamics of emergence – the challenges within the ecosystem that need to be resolved in
order for the technology to achieve its commercial potential once it is introduced into the market. In the
case of electric cars, beyond delivering a car with superior performance-as-developed, it entails the
emergence of sufficiently robust complements (charging infrastructure). Beyond emergence, however,
substitution requires superiority. In this regard, the new technology’s emergence challenges must be
evaluated against the old technology’s extension opportunities – the opportunities available within the
ecosystem for further improving the old technology’s performance in-use. In the case of gas-powered
cars, extension opportunities have included improvements in components such as the internal combustion
9
engine and the fuel pump, as well as in complements such as cleaner burning fuels. 1 Thus, the pace of
substitution is jointly determined by the rate at which the new technology’s ecosystem can overcome its
emergence challenges relative to the rate at which the old technology’s ecosystem can exploit its extension
opportunities. Considering either aspect in isolation offers an incomplete characterization. It is the
balance of these forces as illustrated in figure 3 that forms the basis of our framework.
(Insert Figure 3 about here)
Assessing the emergence challenges of a new technology against the extension opportunities for
the old technology gives rise to four different substitution regimes. Figure 4 presents our organizing
framework for analyzing technology substitution. We consider this framework a baseline structure on
which additional factors can be overlaid. Our hypotheses should be viewed as ceteris paribus predictions
regarding the relative pace of substitution.
(Insert Figure 4 about here)
When the emergence challenge for the new technology is low and the extension opportunity for
the old technology is low (quadrant 1), the new technology can be expected to achieve market dominance
quickly. Its performance-in-use is not held back by bottlenecks elsewhere in the ecosystem, and the old
technology’s potential to improve in response to the threat is limited. This quadrant is most consistent with
the popular imagery of creative destruction and punctuated equilibria. While the old technology can
1 Our goal in this study is to characterize the emergence challenges that arise for the new higher performance technology (as-developed) to achieve a higher performance as-used. For this reason, the technology emergence challenges that are relevant to the new technology concern the challenges with respect to the availability of complements, whereas extension opportunities for the old technology can be rooted in improvements anywhere in the ecosystem.

10
continue serving niches for an extended duration (e.g., Adner and Snow, 2010), the bulk of the market will
abandon it in (relatively) short order in favor of the new technology.
Hypothesis 1: The pace of substitution will be fastest when the ecosystem emergence challenge for
the new technology is low and the ecosystem extension opportunity for the old technology is low.
We note that much of the innovation literature has tended to focus its attention on quadrant 1 – the
challenge of bringing to market a new technology with higher performance-as-developed than the old
technology. The typical focus on emergence challenges has to do with the time required to develop the
new technology. The implicit assumption is that past this point – after commercial introduction – the new
technology should win, and win quickly. The null hypothesis is thus that after the commercial
introduction of a superior new technology the pace of substitution should be rapid (i.e., following
conventional wisdom, all transition should fall in quadrant 1).
When the extension/emergence balance shifts, however, we can expect very different dynamics. In
diametric opposition to the prior case, is the case when ecosystem emergence challenge for the new
technology is high and the ecosystem extension opportunity for the old technology is high (Quadrant 4).
Here, despite the promise of the new technology, its performance-in-use is constrained by progress in the
ecosystem. Moreover, the old technology stands to benefit from improvement in its own components and
complements that enhance its performance-in-use, even if the performance of the focal technology itself is
static. This quadrant is most consistent with technologies that seem revolutionary ex-ante and over hyped
ex-post. Here, the old technology can be expected to maintain a prosperous leadership position – secure,
high share in a growing market – for an extended period.
Hypothesis 2: The pace of substitution will be slowest when the ecosystem emergence challenge
for the new technology is high and the ecosystem extension opportunity for the old technology is high.

11
Whereas quadrants 1 and 4 offer direct contrasts between fast and slow substitution, the off-
diagonal quadrants (2 and 3) result in more nuanced dynamics. When the emergence challenge for the
new technology is low and the extension opportunity for the old is high (quadrant 2), competition between
the old and new technology will be robust. The new technology will make inroads into the market, but
improvements in the incumbent technology’s ecosystem allow it to compete robustly and defend its
market share. We expect a prolonged period of coexistence before substitution takes place (e.g.,
McGahan, 2004). Although extension opportunities are unlikely to reverse the rise of the new technology,
they will materially delay its dominance and slow the rate of substitution.
Hypothesis 3: The pace of substitution will be intermediate when the ecosystem emergence
challenge for the new technology is low and the ecosystem extension opportunity for the old technology is
high.
In contrast, when the emergence challenge is high for the new technology and the extension
opportunity is low for the old technology (quadrant 3), substitution will be delayed until emergence
challenges are resolved, but once they are resolved substitution will be rapid. Here, an analysis of market
share will likely show that the old technology maintains high market share, but that market growth has
stalled. Because rapid market share inversion is to be expected once the new technology fulfills its
performance-in-use potential, dominance by the incumbent is fragile, in the sense that it is maintained not
by the incumbent’s success, but by the entrant’s setback.
Hypothesis 4: The pace of substitution will be punctuated – first very slow then very fast – when
the ecosystem emergence challenge for the new technology is high and the ecosystem extension
opportunity for the old technology is low.
12
Thus, Hypotheses 1-3 posit a rank ordering of time-to-substitution while Hypothesis 4 posits a
temporal pattern.
RESEARCH SETTING AND DESIGN
We explore the validity of our theoretical framework through a detailed history of semiconductor
lithography equipment industry from 1972-2009. The industry offers a particularly rich context in which
to explore the interaction between technology ecosystems and the pace of substitution. It is a context of
robust technological change. Between 1972 and 2009, ten new generations of lithography equipment
technology were commercialized so as to enable semiconductor manufacturers achieve exponential
improvements in chip performance at lower marginal cost along the progress trajectory referred to as
Moore’s law. While the lithography equipment firms have played an important role in pushing the
technology envelope forward, progress within each of the technology generations were critically shaped
by components and complements in the ecosystem (Henderson, 1995; Iansiti, 1998; Adner and Kapoor,
2010). Simultaneously, the context is characterized by continuity in terms of user preferences
(Christensen, 1997), the nature of core competences (Anderson and Tushman, 1990), the value and
importance of complementary assets (Teece, 1986). This combination yields sufficient variance in the
variables that are of interest to our study, while offering an important set of natural controls for the key
variables that have been identified in the literature, but which are not important drivers of our theory.
Our research design contrasts multiple episodes of technology competition between a dominant
old technology and the new technology within a single industry. We capture every transition in the
history of the industry. We treat each case of technology competition as an experiment in order to test the
correspondence between the substitution dynamics predicted by our theory and that was actually observed
(Yin, 1994; Eisenhardt, 1989; Lee et. al., 1999). This multi-case design allows us to illustrate our
constructs and contingencies in a much richer way than would a large scale empirical study (Siggelkow,
2007). By drawing all the cases from a single industry we are also able to provide evidence that helps us
to rule out a number of alternative explanations.

13
Data
An important challenge for the study was to exploit the richness of the context through not only
developing a detailed understanding of the technology and its evolution but also characterizing the ten
cases of technology competition with respect to our framework while accounting for alternative
explanations. This required the use of both primary and secondary data sources. We obtained detailed
product specifications and sales data for each of the technology generations from VLSI Research, an
established consulting firm that has been following the industry since the 1970s. VLSI Research also
provided us with historical data on prices of lithography equipment and capital expenditures by
semiconductor manufacturers that we used to rule out some important alternative explanations. For two of
the earliest generations, we supplemented the data from VLSI Research with product specifications
reported in the Henderson Photolithography FIVE Data (Henderson, 1993; Helfat and Klepper, 2007).
We conducted multiple interviews with over 30 industry experts, most of whom have been
associated with the industry for more than 20 years. We used the information from the interviews to
develop an understanding of the lithography technology, its historical evolution as well as the nature of
emergence challenges and extension opportunities within the ecosystems of the different technology
generations. The interviews were semi-structured and lasted two hours on average. The interviewees
came from a variety of roles within the semiconductor lithography ecosystem: lithography equipment
manufacturers, their customers (semiconductor manufacturers), their complementors, research consortia,
industry associations, and consultants. Figure 5 shows the distribution of interviewee affiliations.2 This
allowed us to understand the emergence challenges and extension opportunities at the level of the
ecosystem rather than at the level of a specific actor or role. Frequently, we followed up with the experts
through emails or phone calls in clarifying some of the technical details. Through our field work, we also
developed a list of keywords that we used to codify technical articles published between 1961 and 2010 in
33 Three of the earliest technology generations transmitted the energy directly from the source to the wafer without using a lens. These were the Contact, Proximity, and X-ray generations.
14
Solid State Technology, the leading industry trade journal, and we used this information to objectively
characterize the extent of ecosystem emergence challenge for each of the technology generations.
(Insert Figure 5 about here)
Semiconductor Lithography Technology
Semiconductor lithography is the process by which a circuit design is imprinted on a
semiconductor substrate called a wafer. The basic principle of lithography is illustrated in Figure 6. After
the design of an integrated circuit (IC) is finalized (i.e., the wiring, the gates and the junctions), the circuit
blueprint is transferred to a “mask”. The lithography process takes place when beams of energy
originating from an “energy source” are directed onto the mask. The pattern on the mask allows a portion
of the energy beams to pass through, with or without an optical “lens” system, onto the wafer. The wafer
is coated with an energy sensitive “resist”. The resist undergoes a chemical reaction wherever the mask
has allowed the energy to pass through. This chemical reaction changes the structure of the resist and
allows its selective removal from the wafer. Another chemical process is then initiated in which the
exposed parts of the wafer are etched. Finally, the remaining resist is removed, creating a final circuit that
replicates the initial design.
(Insert Figure 6 about here)
The process is carried out using lithography alignment equipment or what is commonly referred to
in the industry as the lithography tool. The energy source and the lens are the two key components that
are integrated by equipment manufacturers into the lithography tool. A semiconductor manufacturer may
use scores of lithography tools in a single production line. With modern tools costing over twenty million
dollars each, investments in lithography equipment represent a substantial portion of the cost of a

15
fabrication facility. To maintain competitiveness, semiconductor manufacturers continuously reinvest in
their facilities and look to new tool generations to allow them to offer products with higher performance at
lower marginal cost. The mask and the resist are the two main complements that semiconductor
manufacturers must integrate with the lithography tool to carry out the lithography process. Hence, the
lithography technology ecosystem comprises of the lithography tool as the focal technology, the energy
source and the lens as key components, and the mask and the resist as the key complements (Figure 7).3
(Insert Figure 7 about here)
The main measure of performance in semiconductor lithography is the resolution, the smallest
feature size that can be “printed” on the semiconductor wafer. Resolution determines the extent of
miniaturization that can be achieved by the semiconductor manufacturer. Smaller feature size allows the
semiconductor manufacturers to pack more circuits onto a chip and more chips onto a wafer. For the
lithography tool manufacturers this means that improving resolution is a top priority.
The resolution capability of lithography technology is given by the Rayleigh criterion:
Resolution = k1* λ/NA,
where λ is the wavelength of energy being transmitted by the source, NA is a numerical aperture of the
lens that is a function of the tool architecture and the size of the lens, and k1 is a process-specific constant
that is a function of the mask and the resist complements. Tool manufacturers use three distinct levers to
improve the resolution performance of the lithography technology. The first is increasing the size of the
lens so as to increase the NA. However, this mode of improvement is limited by the complexity of the lens
33 Three of the earliest technology generations transmitted the energy directly from the source to the wafer without using a lens. These were the Contact, Proximity, and X-ray generations.
16
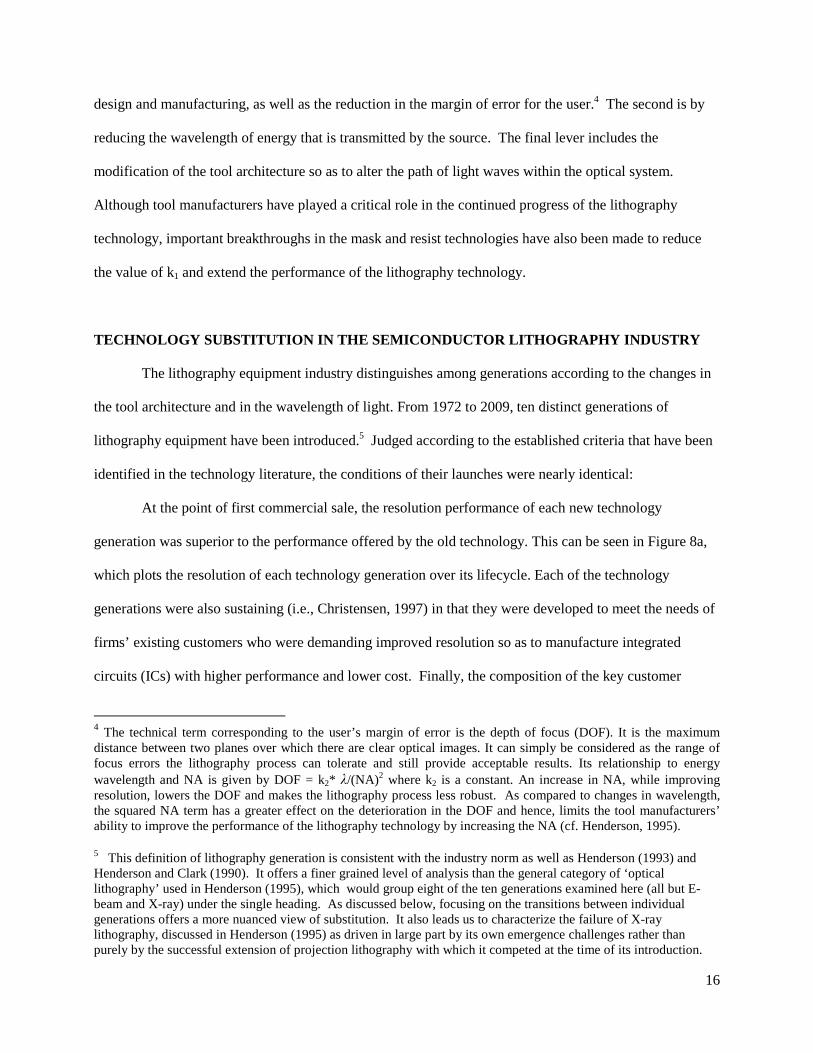
design and manufacturing, as well as the reduction in the margin of error for the user.4 The second is by
reducing the wavelength of energy that is transmitted by the source. The final lever includes the
modification of the tool architecture so as to alter the path of light waves within the optical system.
Although tool manufacturers have played a critical role in the continued progress of the lithography
technology, important breakthroughs in the mask and resist technologies have also been made to reduce
the value of k1 and extend the performance of the lithography technology.
TECHNOLOGY SUBSTITUTION IN THE SEMICONDUCTOR LITHOGRAPHY INDUSTRY
The lithography equipment industry distinguishes among generations according to the changes in
the tool architecture and in the wavelength of light. From 1972 to 2009, ten distinct generations of
lithography equipment have been introduced.5 Judged according to the established criteria that have been
identified in the technology literature, the conditions of their launches were nearly identical:
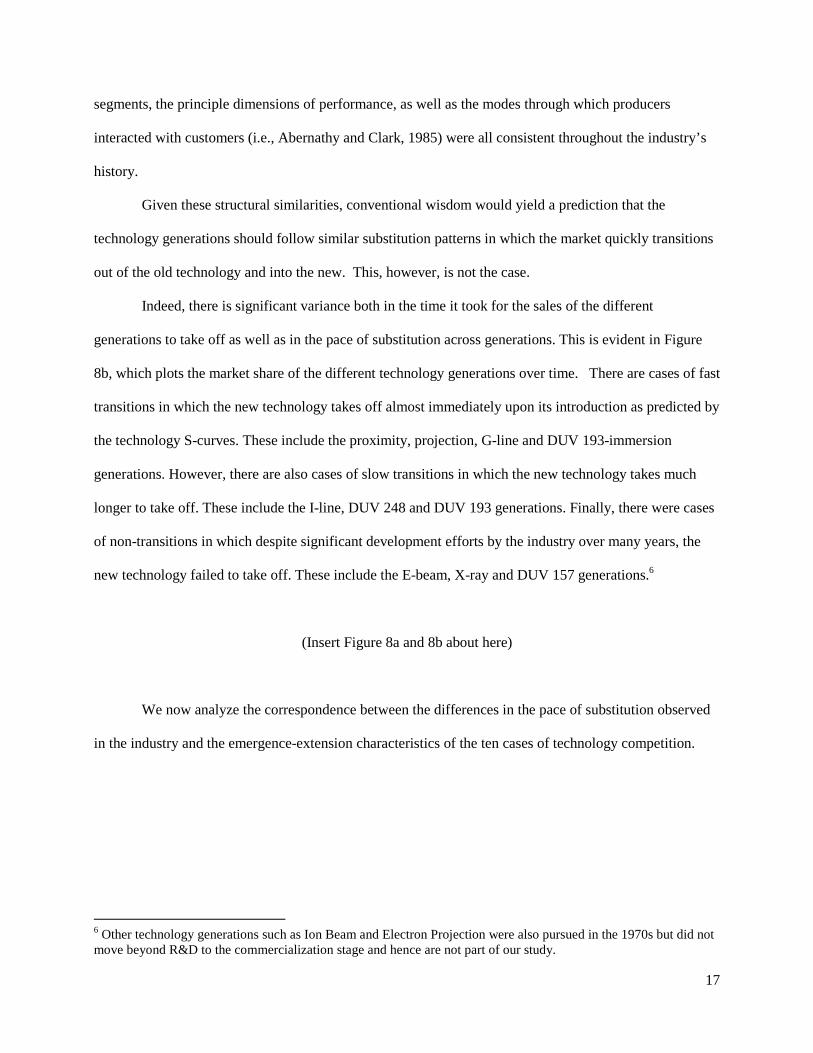
At the point of first commercial sale, the resolution performance of each new technology
generation was superior to the performance offered by the old technology. This can be seen in Figure 8a,
which plots the resolution of each technology generation over its lifecycle. Each of the technology
generations were also sustaining (i.e., Christensen, 1997) in that they were developed to meet the needs of
firms’ existing customers who were demanding improved resolution so as to manufacture integrated
circuits (ICs) with higher performance and lower cost. Finally, the composition of the key customer
4 The technical term corresponding to the user’s margin of error is the depth of focus (DOF). It is the maximum distance between two planes over which there are clear optical images. It can simply be considered as the range of focus errors the lithography process can tolerate and still provide acceptable results. Its relationship to energy wavelength and NA is given by DOF = k2* λ/(NA)2 where k2 is a constant. An increase in NA, while improving resolution, lowers the DOF and makes the lithography process less robust. As compared to changes in wavelength, the squared NA term has a greater effect on the deterioration in the DOF and hence, limits the tool manufacturers’ ability to improve the performance of the lithography technology by increasing the NA (cf. Henderson, 1995). 5 This definition of lithography generation is consistent with the industry norm as well as Henderson (1993) and Henderson and Clark (1990). It offers a finer grained level of analysis than the general category of ‘optical lithography’ used in Henderson (1995), which would group eight of the ten generations examined here (all but E-beam and X-ray) under the single heading. As discussed below, focusing on the transitions between individual generations offers a more nuanced view of substitution. It also leads us to characterize the failure of X-ray lithography, discussed in Henderson (1995) as driven in large part by its own emergence challenges rather than purely by the successful extension of projection lithography with which it competed at the time of its introduction.
17
segments, the principle dimensions of performance, as well as the modes through which producers
interacted with customers (i.e., Abernathy and Clark, 1985) were all consistent throughout the industry’s
history.
Given these structural similarities, conventional wisdom would yield a prediction that the
technology generations should follow similar substitution patterns in which the market quickly transitions
out of the old technology and into the new. This, however, is not the case.
Indeed, there is significant variance both in the time it took for the sales of the different
generations to take off as well as in the pace of substitution across generations. This is evident in Figure
8b, which plots the market share of the different technology generations over time. There are cases of fast
transitions in which the new technology takes off almost immediately upon its introduction as predicted by
the technology S-curves. These include the proximity, projection, G-line and DUV 193-immersion
generations. However, there are also cases of slow transitions in which the new technology takes much
longer to take off. These include the I-line, DUV 248 and DUV 193 generations. Finally, there were cases
of non-transitions in which despite significant development efforts by the industry over many years, the
new technology failed to take off. These include the E-beam, X-ray and DUV 157 generations.6
(Insert Figure 8a and 8b about here)
We now analyze the correspondence between the differences in the pace of substitution observed
in the industry and the emergence-extension characteristics of the ten cases of technology competition.
6 Other technology generations such as Ion Beam and Electron Projection were also pursued in the 1970s but did not move beyond R&D to the commercialization stage and hence are not part of our study.

18
Ecosystem Emergence Challenge in New Technology Generations
Each of the new generations presented significant development challenges for the lithography
equipment manufacturers. These include challenges in designing the new tool architecture as well as in
integrating the different components into the architecture. At the time of first commercial sale, each new
generation offered superior performance-as-developed than did the dominant generation. However, these
generations differed significantly in the extent to which innovation in complements was required in order
for the tool generation to achieve its commercialization potential; that is, for its performance-in-use to
match its performance-as-developed for the mass market. In Appendix I, we provide a detailed
description of each of the tool generations and the nature of ecosystem emergence challenges for each
generation.
Five of the ten generations faced high emergence challenges, requiring major complement
innovations in the mask and resist. These were the E-beam, X-ray, DUV 248, DUV 193 and DUV 157
generations. The emergence challenges in the ecosystem were a result of the reduction in the wavelength
of the energy beams that required the development of new materials for the mask and for the resist. The
other five generations – Proximity, Projection, G-line, I-line and DUV 193-immersion faced much lower
emergence challenges as they were able to reuse the mask and resist technologies that had been developed
for the incumbent technology generations.
However, although the level of emergence challenge is an important differentiator between the
generations, it does not fully explain the variance in substitution rates: despite a very low emergence
challenge, the I-line generation was slow to replace the predecessor G-line generation. Indeed, if we focus
only on emergence challenges without considering extension opportunities we cannot explain findings of
robust co-existence (quadrant 2 in figure 4).
In order to provide an objective measure of ecosystem emergence challenge, we counted the
number of technical articles published between 1961 and 2010 in Solid State Technology, the leading
industry journal, that discuss challenges in the development of Mask and Resist for the new technology
generation (see Figure 9). Our industry sources confirmed that a count of published good proxy for the

19
level of technology challenges that surrounded the development of different lithography generations.7
The average number of articles across the generations was 4.6. We categorized emergence challenges in
those generations that were above this average as ‘High’ and the other ‘Low”. The characterization of
ecosystem emergence challenge based on the article count measured exhibited high consistency with the
description of ecosystem emergence challenges that we documented in Appendix I.
(Insert Figure 9 about here)
Ecosystem Extension Opportunities in Old Technology Generations
The extension opportunities within a generation were shaped by the potential for improvements in
resolution through increasing the NA or reducing the k1as illustrated by the Rayleigh criterion. The
different lithography technologies faced very different opportunities for extending their performance at the
time of the introduction of the new technology generation. These differences were driven in part by the
architecture of the tool and in part by the technical and economic constraints imposed on the components
and complements in the ecosystem. In six cases of technology competition the old technology had low
extension opportunities. The contact and proximity tool architectures did not include a physical lens (i.e.,
the ‘lens’ that the energy passed through was air, not glass), so improving NA was not a possible
extension mechanism. The projection generation used a reflective lens that made it very difficult to
increase NA beyond 0.167 (Henderson, 1995). The extension opportunity for these generations was also
limited by the fact that they required the use of masks whose feature size was in a 1-to-1 ratio to the size
7 We used a number of keywords to identify lithography related articles that were published between 1961 and 2010. The keywords were: lithography, microphotographs, mask, photomask, resist, laser, UV, DUV, Deep UV, optical, lens, stepper, aligner, mercury, illuminator, exposure, printer, and the names of the different generations. We then used the article titles to create a match between the technology generation and whether the article referred to technical problems in mask and resist. If insufficient information was available in the title, we read the abstract and the conclusion to ascertain if the article addressed the innovation challenges in the ecosystem for a given generation. A small subset of articles discussed the mask and resist challenges for multiple generations, and for these articles we read the relevant sections for each generation in order to create a match. Since our primary concern was to assess mask and resist challenges during the emergence of the new technology generation, we excluded articles that were published five years after the generation was commercialized. As a test of robustness, we also used a ten year window and the patterns were fully consistent with our predictions.

20
of the features to be printed on the wafer. This created very high challenges for the mask production
process and limited the potential for mask-based extension opportunities. By the time DUV 193i was
introduced in 2005 the extension opportunities for DUV 193 were severely limited by the physical limits
imposed by the lens, mask and resist materials which had already been “stretched” for over two decades.
In contrast, four generations had high extension opportunities. The G-line, I-line, DUV 248, and
DUV 193 (at the time of the DUV 157 introduction) generations all benefitted enormously from extension
opportunities due to improvements in lens design, lens manufacturing, in combination with new
techniques for mask design, mask manufacturing, and from the introduction and refinements of new resist
chemistries.
As was the case for emergence challenge, we note that although the level of extension opportunity
is an important differentiator between generations, it too does not fully explain variance in the pace of
substitution: despite having low extension opportunity, Projection was not displaced by the E-beam or X-
ray generations. Indeed, if we focus only on extension opportunities without considering emergence
challenges we cannot explain findings of resilience illusion (quadrant 3 in figure 4).
To provide an objective measure of the extension opportunity for the different technology
generations, we collected the published technical specifications for every lithography tool sold by every
major tool manufacturer between 1973 and 2009. Specifically, we collected data on resolution, numerical
aperture (NA), wavelength (λ), and used these to derive the value of k1 for every tool model. To quantify
the extension opportunity in every generation that was due to improvements in the ecosystem, we
computed the difference in resolution between the best old technology tool sold in the year that the new
technology was introduced and the best old technology tool ever sold after that year.
We then used the Raleigh criterion to quantify how much of the old technology’s extension
opportunity was due to increasing the size of lens (NA), and how much was derived from improvements in
21
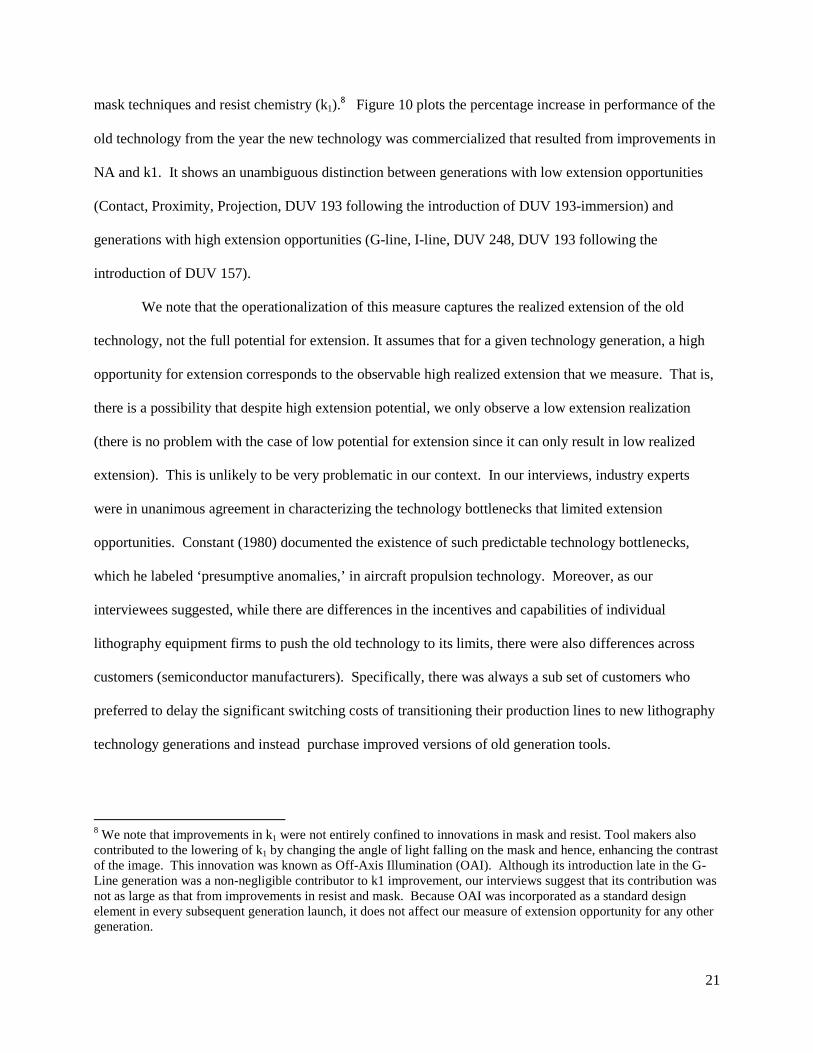
mask techniques and resist chemistry (k1).8 Figure 10 plots the percentage increase in performance of the
old technology from the year the new technology was commercialized that resulted from improvements in
NA and k1. It shows an unambiguous distinction between generations with low extension opportunities
(Contact, Proximity, Projection, DUV 193 following the introduction of DUV 193-immersion) and
generations with high extension opportunities (G-line, I-line, DUV 248, DUV 193 following the
introduction of DUV 157).
We note that the operationalization of this measure captures the realized extension of the old
technology, not the full potential for extension. It assumes that for a given technology generation, a high
opportunity for extension corresponds to the observable high realized extension that we measure. That is,
there is a possibility that despite high extension potential, we only observe a low extension realization
(there is no problem with the case of low potential for extension since it can only result in low realized
extension). This is unlikely to be very problematic in our context. In our interviews, industry experts
were in unanimous agreement in characterizing the technology bottlenecks that limited extension
opportunities. Constant (1980) documented the existence of such predictable technology bottlenecks,
which he labeled ‘presumptive anomalies,’ in aircraft propulsion technology. Moreover, as our
interviewees suggested, while there are differences in the incentives and capabilities of individual
lithography equipment firms to push the old technology to its limits, there were also differences across
customers (semiconductor manufacturers). Specifically, there was always a sub set of customers who
preferred to delay the significant switching costs of transitioning their production lines to new lithography
technology generations and instead purchase improved versions of old generation tools.
8 We note that improvements in k1 were not entirely confined to innovations in mask and resist. Tool makers also contributed to the lowering of k1 by changing the angle of light falling on the mask and hence, enhancing the contrast of the image. This innovation was known as Off-Axis Illumination (OAI). Although its introduction late in the G-Line generation was a non-negligible contributor to k1 improvement, our interviews suggest that its contribution was not as large as that from improvements in resist and mask. Because OAI was incorporated as a standard design element in every subsequent generation launch, it does not affect our measure of extension opportunity for any other generation.

22
We are, however sensitive to the fact that this measure does not account for the endogenous
choices made by industry participants that ultimately determine how extension potential is realized. After
presenting our results, we explore the different modes through which this realization process has unfolded
in the semiconductor lithography industry.
(Insert Figure 10 about here)
Dynamics of Substitution: Joint consideration of emergence challenges and extension opportunities
We have characterized each episode of technology competition according to the degree of
emergence challenge confronting the new technology and the extension opportunity available to the old
technology. We now consider these characterizations jointly to position each case of technology
competition in its corresponding quadrant within our framework. Figure 11 matches the transitions to
their quadrants and reports the pace of substitution, measured as the number of years between the year the
new technology was commercialized and the year it achieved a dominant market share. As we elaborate
below, the observed substitution dynamics in every technology transition supports the predicted
relationships in each quadrant.
(Insert Figure 11 about here)
Quadrant 1: Creative Destruction
Four transitions were characterized by low ecosystem emergence challenge for the new
technology and low ecosystem extension opportunity for the old technology. Consistent with Hypothesis
1, in all these cases the new technology generations (proximity, projection, G-line and DUV 193-
immersion) achieved very rapid market adoption and were the fastest to substitute the old generation. The
average time to substitution in this quadrant is 3 years.

23
Quadrant 4: Robust Resilience
Three transitions were characterized by high ecosystem emergence challenge for the new
technology and high ecosystem extension opportunity for the old technology. Consistent with Hypothesis
2, these new technology generations (DUV 248, DUV 193 and DUV 157) were the slowest to take off.9 A
case in point is the transition from I-line to DUV 248. It took DUV 248 eleven years to achieve market
dominance. The reduction in the wavelength from I-line’s 365nm to 248nm required significant changes in
the key components and complements of the lithography ecosystem. While developing a new mask
material was difficult, the most significant emergence challenge in the ecosystem was with the resist. New
resist chemistries had to be developed that were sensitive enough to absorb sufficient energy from the
lower wavelength to cause the chemical reaction, yet specific enough so as not to react when energy
impacted an adjoining molecule. It took several years before a new type of resist chemistry called the
chemically amplified resist was developed to meet the commercialization requirements of the DUV 248
technology.
The effect of the resist challenge on the sales growth of DUV 248 generation can be seen in
Figure 12. It plots sales of DUV 248 tools and the number of articles appearing in SPIE Proceedings
(proceedings of the annual semiconductor lithography industry conference) that discuss resist development
for the DUV 248 generation. The resist article measure is a good indicator of the extent of attention that
the DUV 248 resist attracted in the R&D community. The first article appeared in 1984, four years before
the first commercial sale of a DUV 248 tool. Attention peaked in 1994, six years after the commercial
launch. The sharp decline after this peak is indicative that the major innovation challenges with the resist
were overcome. What is striking is the correspondence between the decline in article count, which signals
the beginning of resolution of major resist-related challenges, and the sales takeoff of the DUV 248
technology.
9 In fact, the ecosystem emergence challenge for DUV 157 was so significant that, at the time of this writing, it has yet to achieve any meaningful market penetration.

24
(Insert Figure 12 about here)
In addition to the ecosystem emergence challenges faced by DUV 248 generation, the transition
was further slowed by high extension opportunities for the I-line generation. This extension was achieved
through an innovation in the mask called the Phase-Shift technique. The technique allowed for a reduction
in the resolution of the lithography technology by lowering the k1 and extending the I-line generation
from its initial resolution limit of 500nm to 350nm (Terasawa et al., 1989; NTRS, 1994). This extension
raised the performance threshold that the DUV 248 generation needed to cross in order to achieve
successful commercialization. The average time to substitution in this quadrant was in excess of 11 years.
Quadrant 2: Robust Coexistence
The transition from G-line to I-line was characterized by low ecosystem emergence challenge and
high ecosystem extension opportunity. It took I-line 7 years to dominate G-line. The intermediate pace of
substitution in this quadrant is consistent with the prediction in Hypothesis 3 that the substitution
dynamics within this quadrant would entail a robust competition between the old and the new technology
until the old technology reaches its limits. This result in a substitution regime that is slower than in
quadrant 1 but faster than in quadrant 4.
Figure 13 shows changes in the ratio of wavelength to Numerical Aperture (NA) for the highest
performance G-line and I-line tools sold in a given year. Recall that for a given generation (fixed
wavelength), improvement in resolution is achieved by increasing the NA, which is a function of the size
of the lens. Figure 13 shows that, after the I-line generation was introduced, there was a corresponding
burst in the performance of the G-line generation. This improvement was a result of an increase in NA,
and continued for six years. It was only when the G-line generation could no longer be extended that the I-
line generation gained significant market share. This case illustrates that low emergence challenge is not a
sufficient condition for fast substitution. The pace of substitution critically depends on the extension

25
opportunity for the old technology. This point is also reinforced in Figure 14 which shows the contrast in
the patterns of substitution that we observe for Quadrants 1 and 2.
(Insert Figures 13 and 14 about here)
Quadrant 3: Resilience Illusion
Finally, the competition between Projection to E-beam in 1976 and to X-ray in 1978 was
characterized by high ecosystem emergence challenge and low ecosystem extension opportunity (lower
left quadrant). We predicted in Hypothesis 4 that, in this regime, the old technology, despite having
limited extension opportunity, would continue its market dominance until the emergence challenge with
the new technology is resolved. However, once the new technology ecosystem has overcome the
emergence challenge, the new technology is expected to have a very steep sales takeoff. Hence, during this
regime, the old technology’s dominance is fragile because its market position is based not in its own
strength, but in the rival technology’s weakness.
In the case of the Projection vs. E-beam and Projection vs. X-ray competitions, the emergence
challenges for E-beam and X-ray were both extremely high. Their shorter wavelengths required dramatic
innovation in resist (much the same type of challenge as faced by DUV248 over a decade later) and in the
mask (for X-ray). And in the absence of suitable amplified resist and mask complements, neither
generation could translate its performance-as-developed advantage into a performance-in-use advantage.10
Consistent with the first part of the hypothesis, Projection dominated the market in the early years that
followed the introduction of the new technologies. However, neither E-beam nor X-ray replaced
Projection in later years. In this regard, the predicted punctuation was not observed. This was due to the
fact that the competition became a multi technology race. Specifically, the X-ray generation was
commercialized two years after E-beam, and then the G-line generation (which had low emergence 10 We note that while E-beam generation faced high ecosystem emergence challenge, it also suffered from lower throughput that made it less attractive for large scale mass production. We discuss this aspect of E-beam in detail in Appendix I.
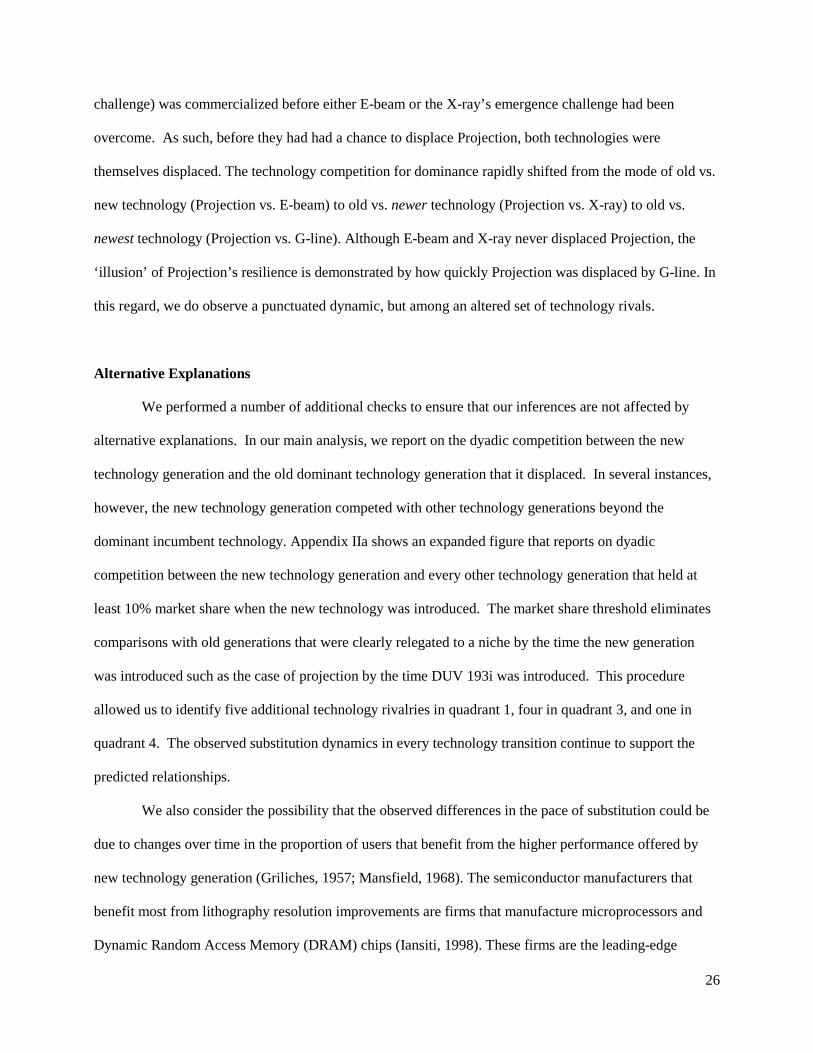
26
challenge) was commercialized before either E-beam or the X-ray’s emergence challenge had been
overcome. As such, before they had had a chance to displace Projection, both technologies were
themselves displaced. The technology competition for dominance rapidly shifted from the mode of old vs.
new technology (Projection vs. E-beam) to old vs. newer technology (Projection vs. X-ray) to old vs.
newest technology (Projection vs. G-line). Although E-beam and X-ray never displaced Projection, the
‘illusion’ of Projection’s resilience is demonstrated by how quickly Projection was displaced by G-line. In
this regard, we do observe a punctuated dynamic, but among an altered set of technology rivals.
Alternative Explanations
We performed a number of additional checks to ensure that our inferences are not affected by
alternative explanations. In our main analysis, we report on the dyadic competition between the new
technology generation and the old dominant technology generation that it displaced. In several instances,
however, the new technology generation competed with other technology generations beyond the
dominant incumbent technology. Appendix IIa shows an expanded figure that reports on dyadic
competition between the new technology generation and every other technology generation that held at
least 10% market share when the new technology was introduced. The market share threshold eliminates
comparisons with old generations that were clearly relegated to a niche by the time the new generation
was introduced such as the case of projection by the time DUV 193i was introduced. This procedure
allowed us to identify five additional technology rivalries in quadrant 1, four in quadrant 3, and one in
quadrant 4. The observed substitution dynamics in every technology transition continue to support the
predicted relationships.
We also consider the possibility that the observed differences in the pace of substitution could be
due to changes over time in the proportion of users that benefit from the higher performance offered by
new technology generation (Griliches, 1957; Mansfield, 1968). The semiconductor manufacturers that
benefit most from lithography resolution improvements are firms that manufacture microprocessors and
Dynamic Random Access Memory (DRAM) chips (Iansiti, 1998). These firms are the leading-edge

27
adopters in the semiconductor manufacturing market. Appendix IIb plots the annual capital expenditures
by the leading-edge firms as the proportion of total expenditure by semiconductor manufacturers from
1980-2007 as reported by VLSI Research. It shows that the leading-edge firms are the biggest spenders in
the industry so as to continuously upgrade their manufacturing facilities. This trend has been remarkably
consistent from 1981 to 1998 in which the leading-edge segment has represented between 60% and 75%
of the total semiconductor capital expenditures. Hence, the slow adoption of the I-line and the DUV 248
cannot be attributed to changes in the composition of the leading-edge segment. In recent years, with the
emergence of semiconductor foundries, the relative share of the leading-edge segment has declined
somewhat, but they still represent the largest market segment for semiconductor equipment (which is
consistent with the fast dominance growth achieved by the latest DUV 193 immersion generation).
Finally, we consider three different alternative explanations for the observed slower pace of
substitution for a number of technology transitions. First, it is possible that the slower pace of substitution
might be due to the new generation undermining user’s existing capabilities (Rogers, 1995). However,
because the basic science and technological principles have been retained across all lithography
generations (Henderson, 1995), such that they have been competence enhancing from a user perspective,
there is no reason to believe that a lack of user capabilities explains variance in the pace of substitution.
Second, it is possible that the slower pace of substitution for the new generation could be a result of user
preferences shifting over time away from resolution and towards some other performance dimension
(Tripsas, 2008). We checked for this possibility by performing hedonic regression of lithography tool
price and resolution for the different technology generations. We report these results in Appendix IIc. The
coefficient of resolution is highly significant and explains 88% of variance in tool prices. Hence, as
compared to the disk drive (Christensen, 1997), typesetter (Tripsas, 2008) and mobile communication
(Ansari and Garud, 2009) technologies in which user preferences for different performance attributes have
shifted over time, the preference for improved resolution among the leading-edge users that drive the
demand for the new technology generations have been highly consistent throughout the industry’s history.
A third possibility could be that firms that introduce new technologies may differ in their capabilities and
28
incentives to successfully commercialize new technologies and that may influence the pace of substitution.
For example, technology pioneers may be incumbents or entrants in the industry with different sets of
capabilities and incentives (Reinganum, 1983; Henderson and Clark, 1990). Within incumbents,
pioneering firms could also differ in terms of market leadership in the previous technology generation. In
investing this possibility, we did not find any systematic evidence to support that the observed differences
in the pace of substitution are driven by firm-level differences. As documented in Appendix IId, new
generations were introduced by both entrants and incumbents, and that the incumbents that introduced new
generations could be either laggards or leaders in the previous dominant generation. Moreover, new
generations exhibiting slower pace of substitution were introduced by both entrants and incumbents. These
supplemental analyses allow us to rule out some important alternative explanations and serve to increase
our confidence in the interpretation of our findings.
In summary, by jointly considering new technology’s emergence challenge and old technology’s
extension opportunity we are able to account for the observed differences in the substitution dynamics for
every case of technology competition in the semiconductor lithography equipment industry.
FROM OPPORTUNITY TO REALIZATION: DIFFERENT FACES OF EXTENSION
In our analysis, we have focused on the evidence regarding the level of extension in the old
technology that was realized once the new technology had emerged. We have argued that in our context
we expect a high correlation between technological opportunity and realization. In studying the patterns
of technological change in the semiconductor lithography industry we were able to uncover three different
modes by which industry participants acted to make extension opportunities a reality.
First, in some cases, the extension of the old technology was a “last gasp” effort by individual
incumbent firms to prolong the life of their old technology investments. We observed such an extension
pattern in the case of the G-line generation after the emergence of the I-line generation. Nikon was the
first firm to commercialize the I-line generation in 1985. However, another incumbent firm, Canon,
instead chose to focus its R&D efforts on extending the G-line generation through an increase in the size

29
of the lens, introducing I-line tools only when further extending the performance of the G-line generation
was deemed unfeasible. This last gasp effort to reinvigorate performance improvement in mature
technologies is of the sort that has been observed in other technologies such as sailing ships (Harley,
1971), pond ice harvesting (Utterback, 1994), typesetters (Tripsas, 2008). The main driver here is
differences in innovation incentives among focal firms.
Second, there were instances in which solutions to resolving the technology development
challenges in the new technology generation helped in extending the old technology generation. For
example, one of the key challenges in the development of DUV 157 generation was the development of
new lens materials with high concentration of Calcium Fluoride that would allow for low wavelength light
to pass through. The R&D efforts to resolve this challenge also helped to make better lenses for the
incumbent DUV 193 generation and thus contributed to extending its performance. Similarly, the resist
development for lower wavelength generations helped in improving the chemical composition of the resist
used with the older generations. Snow (2004) documents such a “spill back” effect in the automotive
industry where the development of the new electronic fuel injection technology created a positive spillover
in the old carburetor technology and extended its performance. Taylor (2010) explores the intra-
organizational mechanisms through which such spillbacks take place.
Finally, there were instances where extension opportunities were created as a result of collective
resource re-allocation by firms in the lithography ecosystem. Over the past forty years, Gordon Moore’s
(1965) conjecture about the rate of progress in semiconductor manufacturing has taken on the status of a
socially constructed ‘Law’ that has served as a critical coordination mechanism for the industry.
During episodes when industry leaders – industry associations such as SEMATECH and major
leading edge semiconductor manufacturers – concluded that the high emergence challenge confronting a
new lithography technology generation will making it unlikely that it would be available to allow
continued progress according to Moore’s law, firms in the lithography ecosystem reallocated their R&D
resources towards extending the old technology generation (e.g. Schellenberg, 2004).
30
Since the 1990s, progress in semiconductor manufacturing has been coordinated according to
collectively defined technology roadmaps, most recently under the auspices of International Technology
Roadmap of Semiconductors (ITRS). The roadmap is regarded as a very good indicator of the R&D
resource allocation across the different technology generations. When it was evident that the emergence
of DUV 193 in 1996 would be significantly delayed due to the challenges in the resist, which would mean
that the generation would not be able to achieve its planned introduction at 180nm resolution, the
semiconductor industry revised its collective development emphasis. The 1991 roadmap, in expectation
that the DUV 193 generation would launch in 1996 with a resolution of 250nm, specified that the
performance of DUV 248 would be limited to 250nm and that this limit would be reached by 1996 (Micro
Tech 2000, 1991). As emergence challenges continued to delay the launch of the DUV 193 generation,
the 1997 and 1999 roadmaps revised the expected performance limit of DUV 248 to 150nm by 1999 and
130nm by 2001 respectively. These revisions signaled a collective agreement to reallocate substantial
development resources to extend the performance of DUV 248 (and so away from the DUV 193 effort) as
a last resort for sustaining the trajectory guided by Moore’s law. As a result of these investments, the
DUV 248 generation did indeed achieve the resolution performance of 130nm in 2001.
Instead of extension as a last gasp for survival, this third type of extension episode is better
characterized as a “last resort.” While last gasps are driven by focal firms competing to maximize the
value that they can capture from the old technology, these last resort efforts were driven by stakeholders in
the broader ecosystem whose prime motivation was to sustain progress along the trajectory specified by
Moore’s Law for the semiconductor manufacturers. Although an in-depth discussion of the institutional
structures that impact the semiconductor industry is beyond the scope of this paper, interested readers are
referred to Moore, 1996, Macher et al.(1999) and Brown and Linden (2009).
Each of the three modes of old technology extension is impacted in a different way by the
interaction of the old and new technologies. In the case of last gasps, the old technology’s extension arises
from increased efforts in response to new competition. In the case of spillbacks, extension arises as a
byproduct of progress in the development of the new threat itself. Conversely, In the case of last resorts,
31
extension arises due to a failure of progress in the new technology. Collectively the evidence regarding
different modes of extension not only helps to support our argument that high extension opportunity in our
context corresponds to high extension realization but, perhaps more importantly, also shows that the
realization of extension opportunities incorporates a rich set of interactions that go well beyond the
identification of technological constraints.
DISCUSSION AND CONCLUSION
This study sheds light on the forces that determine the pace of technology substitution by
presenting a framework that identifies when and how technology competition is resolved. It considers the
relative balance between the emergence challenges confronting the new technology and the extension
opportunities available to the old technology as a key governor of these dynamics. Underlying this
approach is a view that, in order to understand progress in a given technology, we need to take into
account progress in the surrounding ecosystem in which the focal technology is embedded. We apply this
framework to study ten episodes of technology competition that have occurred in the semiconductor
lithography equipment industry from 1972 to 2009. We find that the observed dynamics are fully
consistent with our predictions. The framework also helps to clarify the puzzling variance in transition
paths observed in the industry despite the existence of structural similarities across the different cases of
technology competition.
In addition to these core findings, our in depth study of the semiconductor lithography industry
sheds light on the different sources of extension in matured technologies. We found that at times,
extension was a “last gasp” effort by firms to maximize the value that they can capture from the old
technology as they face the threat of imminent substitution. In other instances, we found that extension of
the old technology was also a result of the discovery of solutions to the emergence challenges in the new
technology. Hence, this form of extension was driven by a technical spillover from the new to the old
technology. Finally, we found that extension of the old technology could be spurred by the failure of the
32
new technology to emerge on time. Here, extension was a “last resort” effort by stakeholders in the
ecosystem to sustain the progress trajectory of the industry.
Approaching substitution as an outcome of the interplay between extension of the old technology
and emergence of the new helps clarify observations that highly discontinuous changes at one level of a
technology hierarchy can be invisible at other levels (e.g., Funk, 2008a,b). In the context of
semiconductors, we observe that despite many misses and delays in the commercialization of new
lithography technologies, semiconductor manufacturers continued to make steady progress along the
Moore’s law. Whenever semiconductor manufacturers were confronted with the prospect that their
lithography tool suppliers would be unable to meet the industry roadmap requirements, they proactively
guided resources to finding ways of bridging the gap with the old technology until a new technology
solution became available. This ‘last resort’ reallocation of efforts had great impact on the returns to tool
makers’ efforts in both the old and new generations.
By focusing on the notion of ‘performance-in-use’ as driving substitution, rather than simply
performance as developed, we are able to draw a link between two of the most fundamental life-cycle
patterns identified in the innovation community: the S-curve profiles of technology improvement and the
S-curve profile of technology adoption. While the primary use of the technology S-curve has been to
understand technologies’ performance limits, the primary use of the adoption S-curve has been to
understand the market potential and timing for a given technology so as to inform a firm’s technology and
market development strategies (e.g., Fisher and Pry, 1971; Agarwal and Bayus, 2002; Bass, 2004). Studies
of adoption patterns (e.g., Griliches, 1957; Rogers, 1995) focus on the dynamics of the demand
environment, but most often assume that technology is static. Conversely, studies of technology
evolution, focus almost exclusively on the relative performance position of the new and established
technologies, and tend to assume that a technology with superior performance will automatically take over
a given market. In doing so, they have tended to overlook the role of demand-side adoption in
determining the pace and extent of technology substitution (Adner, 2004). Our paper informs and clarifies
the relationship between these two fundamental constructs. Specifically, we note that adoption and
33
substitution are intimately linked – a user’s decision to adopt the new technology is, implicitly, a decision
not to adopt the incumbent technology. Hence, what looks like adoption from the new technology’s
perspective looks like substitution from the old technology’s perspective. They are two sides of the same
coin. For this reason, understanding the adoption of a new technology requires not only a detailed demand
side analysis of consumer heterogeneity and information diffusion mechanism (e.g., Rogers, 1995) but
also consideration of the supply side factors that govern the technological progress within an ecosystem.
As with substitution, the pace of adoption will be a function of the dynamics of emergence of the new
technology ecosystem and the dynamics of extension of the incumbent technology ecosystem. For
example, the emergence of a new technology may require major improvements in the complements for the
average user to derive the full benefits, and this may slow the adoption rate. Similarly, the extension of a
new technology through improvements in components, architectures or complements may also slow the
adoption of the new technology. Such an ecosystem framework is able to explain why new superior
technologies may face slow market adoption and why seemingly geriatric technologies may continue to
dominate.
In this regard, our approach has some predictive implications. Historically, S-curve analysis has
focused on the performance profile of a stand-alone technology. One problem with the S-curve is that the
time to performance take -off is notoriously difficult to specify ex-ante. Focusing on performance-in-use
expands the analysis beyond the time to take-off for the single focal technology, to include the
performance profile of the entire ecosystem on which the focal technology’s value creation depends.
Counter intuitively, this expansion of the consideration set, as depicted in Figure 2, can improve our
ability to make predictions. In an interdependent system, performance in-use cannot take off until every
element is ready. For this reason, the most challenged element acts as a bottleneck for the whole system.
This has an important implication: the take-off of the focal technology’s performance as-developed profile
will predict performance-in-use takeoff only if the focal technology is the bottleneck of the system. If the
focal technology is not the bottleneck, overcoming its development challenge will not affect the system’s
emergence challenge. For example, much attention has been paid to predicting when hydrogen powered
34
fuel cell technology will be ready to overcome its development challenge, with the implication that once
this challenge is overcome, fuel cells will become important technology rivals to gasoline engines (e.g.,
Ellis et.al., 2001; Ehsani et. al., 2009). Taking a systems view, however, makes it clear that fuel cells will
not pose a real substitution threat until they are complemented by a sufficiently developed hydrogen
infrastructure. Even casual consideration of the physical, logistic, and regulatory challenges to the
development of this critical complement makes it clear that its deployment will be measured in decades,
not years. As such, we can be sure that, whether the automotive fuel cell requires four years or eight years
to emerge, it will not pose a substitute threat for many years after (i.e., it will fall in quadrant 3 or 4).
Thus, while we cannot predict when the fuel cell ecosystem will finally emerge, we can be more confident
about when it will not emerge – not because fuel cells won’t be ready, but because the complementary
hydrogen infrastructure will not be. To be clear – we are not suggesting that this approach will offer an
accurate prediction of the pace of substitution; rather, we are suggesting that it can offer a more accurate
prediction than an approach that does not explicitly consider the interplay between ecosystem extension
and emergence. Further, we do believe that there is value in presenting these arguments in the form of a
clear framework in which to assess their impact rather than presenting them as standalone variables to be
added to the long list of factors to consider.
We view this study as a helpful guide, rather than as a final word. Our empirical analysis has a
number of limitations that suggest promising avenues for further work. We test our ideas in the context of
a single industry, and expect that other market environments will reveal additional nuances. In particular,
we expect that the ways in which stakeholders negotiate the modes of extension and emergence will be
impacted by the industrial organization of the different market players that need to collaborate in value
creation. Moreover, although we do not study them explicitly in this paper, it is clear that the institutional
and social contexts in which technologies compete and evolve play critical roles in shaping the timing and
nature of outcomes. In this regard, while we view the magnitude of the technology challenges we discuss
as relatively exogenous, the resolution of these challenges is highly endogenous, depending on the efforts,

35
investments, urgency, perceptions, and alternatives that are available to the different participants. We
expect exploration of these dynamics to be particularly fruitful and hope to pursue it in future work.
36
REFERENCES
Abernathy, W. J., & Clark, K. B. 1985. Innovation: Mapping the Winds of Creative Destruction. Research Policy 14: 3-22.
Adner, R. 2002. When Are Technologies Disruptive: A Demand-Based View of the Emergence of Competition. Strategic Management Journal 23: 667-688.
Adner, Ron. 2004. “A demand-based perspective on technology life cycles.” Business Strategy Over the Industry Lifecycle: Advances in Strategic Management. J. Baum and A. McGahan, eds. 21: 25-43.
Adner, R. 2006. Match your Innovation Strategy to your Innovation Ecosystem. Harvard Business Review 84 (4): 98
Adner, R., & Levinthal, D. A. 2001. The emergence of emerging technologies. California Management Review 45(1): 50-66.
Adner, R., Kapoor, R. 2010. Value creation in innovation ecosystems: how the structure of technological interdependence affects firm performance in new technology generations. Strategic Management Journal 30(3): 306-333.
Adner R, Snow D. 2010. Old technology responses to new technology threats: demand heterogeneity and technology retreats. Industrial and Corporate Change 19(5): 1655-1675.
Agarwal, R. and Bayus, B. 2002. The Market Evolution and Sales Takeoff of Product Innovations. Management Science 48(8): 1024-1041.
Anderson PC, Tushman ML. 1990. Technological discontinuities and dominant designs. Administrative Science Quarterly 35(4): 604-633.
Ansari, S., R. Garud. 2009. Inter-generational transitions in socio-technical systems: The case of mobile communications. Research Policy 38(2): 382-392.
Bass, F. M. 2004. Comments on "A New Product Growth for Model Consumer Durables The Bass Model." Management Science 50(12S):1833-1840.
Benner, Mary J. 2007. The incumbent discount: Stock market categories and response to radical technological change. Academy of Management Review 32: 703-720.
Bijker, W., Hughes, T., Pinch, T. (Eds.), 1987. The social construction of technological systems: New directions in the sociology and history of technology. MIT Press, Cambridge, MA.
Brown, C. and Linden, G.. 2009. Chips and Change: How Crisis Reshapes the Semiconductor Industry. Cambridge, MA: MIT Press.
Christensen CM, Rosenbloom RS. 1995. Explaining the attacker's advantage: Technological paradigms, organizational dynamics, and the value network. Research Policy 24(2): 233-257.
Christensen, C. M. 1997. Innovator's Dilemma: When New Technologies Cause Great Firms to Fail. Boston: Harvard Business School Press.
Constant, E.W. 1980. The Origins of the Turbojet Revolution. Baltimore: Johns Hopkins University Press. Dosi, G. 1982. Technological Paradigms and Technological Trajectories. Research Policy 11: 147-162. Ehsani, M., Gao, Y. and Emadi, A. 2009. Modern Electric, Hybrid Electric, and Fuel Cell Vehicles:
Fundamentals, Theory, and Design, Second Edition. CRC Press. Boca Raton: Florida. Ellis, M.W., Von Spakovky, M.R. and Nelson, D.J. 2001. “Fuel cell systems: Efficient, flexible energy
conversion for the 21st century.” Proceedings of the IEEE 89(12): 1808-1818. Eisenhardt, E. 1989. Building Theories from Case Study Research. Academy of Management Review
14(4): 532-550 Ethiraj, S. K. (2007). Allocation of inventive effort in complex product systems, Strategic Management
Journal 28 (6), 563-84.
37
Fisher, J., & Pry, R. 1972. A simple substitution model of technological change. Technological forecasting and social change 3: 75-88.
Foster, R. 1986. Innovation: The Attacker’s Advantage. New York: Summit Books. Funk, J. 2008a. Systems, Components and Technological Discontinuities: The Case of the Semiconductor
Industry, Industry & Innovation 15:4,411 — 433 Funk, J. 2008b. Components, Systems, and Technological Discontinuities: Lessons from the IT Sector,
Long Range Planning 41(5): 555-573. Garud, R. and Kumaraswamy, A. 1993. Changing competitive dynamics in network industries: An
exploration of Sun Microsystem’s open systems strategy. Strategic Management Journal 14(5):351-369.
Griliches, Z. 1957. Hybrid Corn: An Exploration in the Economics of Technological Change . Harley, Charles K. 1971. The shift from sailing ships to steamships, 1850-1890: A study in technological
change and its diffusion. In Essays on a mature economy: Britain after 1840, ed. Deirdre N. McCloskey, xv, 439. Princeton, N.J., Princeton University Press.
Helfat, Constance E. and Klepper, Steven. 2007. Firm and Industry Evolution and Entrepreneurship (FIVE Project): Data Overview (November 2, 2007). 2007 Kauffman Symposium on Entrepreneurship and Innovation Data. Available at SSRN: http://ssrn.com/abstract=1022116
Henderson, R. M., & Clark, K. B. 1990. Architectural innovation: The Reconfiguration of Existing Product Technologies and the Failure of Established Firms. Administrative Science Quarterly, 35(1): 9-30.
Henderson R. 1993. Underinvestment and incompetence as responses to radical innovation: evidence from the photolithographic alignment equipment industry. RAND Journal of Economics 24(2): 248.
Henderson, R. M. 1995. Of Life Cycles Real and Imaginary: The Unexpectedly Long Old Age of Optical Lithography. Research Policy 24(4): 631-643.
Hill CWL, Rothaermel FT. 2003. The performance of incumbent firms in the face of radical technological innovation. Academy of Management Review 28:257–274.
Hughes, T. P. 1983. Networks of Power: Electrification in Western Society 1880 – 1930. Baltimore: Johns Hopkins University Press.
Iansiti M. 1998. Technology integration: Making critical choices in a dynamic world. Harvard Business School Press: Boston, MA.
Iansiti M, Levien R. 2004. The Keystone Advantage: What the New Dynamics of Business Ecosystems Mean for Strategy, Innovation, and Sustainability. Harvard Business School Press.
Kapoor, R. and Adner, R. 2007. Technology Interdependence and the Evolution of Semiconductor Lithography. Solid State Technology 50(11): 51-54.
Lavie, D. 2006. Capability reconfiguration: An analysis of incumbent responses to technological change. Academy of Management Review, 31: 153–174
Lee, T. L., Mitchell, T. R., & Sablynski, C. J. 1999. Qualitative research in organizational and vocational psychology: 1979–1999. Journal of Vocational Behavior 55: 161–187.
Levinthal, D. A. 1998. The slow pace of rapid technological change: gradualism and punctuation in technological change. Industrial and Corporate Change 7(2): 217-247.
Macher, J.T., Mowery, D.C., Hodges, D.A., 1999. Semiconductors. In: Mowery, D. (Ed.), U.S. Industry in 2000: Studies in Competitive Performance. National Academy Press, Washington, DC, pp. 245–286.
Mansfield, E. 1968. Industrial Research and Technological Innovation: An Econometric Analysis. New York: W.W. Norton & Company.
McGahan A.M. 2004. How industries evolve: Principles for achieving and sustaining superior performance. Harvard Business School Press.

38
Moore, G.E., 1996. Some personal perspectives on research in the semiconductor industry. In: Rosenbloom, R.S., Spencer, W.J. (Eds.), Engines of Innovation. Harvard Business School Press, Boston, pp. 165–174.
Reinganum JF. 1983. Uncertain Innovation and the Persistence of Monopoly. The American Economic Review 73(4): 741-748.
Rogers, E. M. 1995. Diffusion of Innovations. New York: The Free Press. Rosenberg, N. 1963. Technological change in the machine tool industry, 1840-1910. Journal of Economic
History, 23(4): 414-443. Rosenberg, N. 1976. Perspectives on Technology. Cambridge: Cambridge University Press. Rothaermel FT, Hill CWL. 2005. Technological discontinuities and complementary assets: a longitudinal
study of industry and firm performance. Organization Science 16: 52–70. Sahal, D. 1981. Patterns of Technological Innovation. Addison-Wesley, Reading, MA. Schellenberg, F.M. 2004. Resolution enhancement technology: the past, the present, and extensions for the
future Optical Microlithography XVII. SPIE, Santa Clara, CA, USA, 1-20. Schumpeter, J. A. 1942. Capitalism, Socialism and Democracy. London: Unwin University Books. Siggelkow, N. 2007. Persuasion with case studies. Academy of Management Journal 50: 20-24 Snow, D. 2004. Extraordinary Efficiency Growth in Response to New Technology Entries: The
Carburetor’s Last Gasp. HBS Working Paper. Sood, A., & Tellis, G. J. 2005. Technological evolution and radical innovation. Journal of Marketing,
69(3): 152-168. Taylor A. 2010. The next generation: technology adoption and integration through internal competition in
new product development. Organization Science, 21:23-41 Teece DJ. 1986. Profiting from Technological Innovation: Implications for Integration, collaboration,
Licensing and Public Policy. Research Policy 15(6): 285-305. Terasawa, T., Hasegawa, N. Kurosaki,Tanaka,T.1989. 0.3-micron optical lithography using a phase-
shifting mask, Proceedings of the International Society for Optical Engineering 1088: 25–33. Tripsas, M. 1997. Unraveling the Process of Creative Destruction: Complementary Assets and Incumbent
Survival in the Typesetter Industry. Strategic Management Journal 18(6): 119-142. Tripsas, M. 2008. Customer preference discontinuities: a trigger for radical technological change.
Managerial and Decision Economics 29(2-3): 79-97. Tushman, M. L., & Anderson, P. 1986. Technological Discontinuities and Organizational Environments.
Administrative Science Quarterly 31(3): 439-465. Tushman M, Rosenkopf L. 1992. Organizational determinants of technological change: Towards a
Sociology of Technological Evolution. Research in Organizational Behavior 14: 311–347. Utterback, J.M. 1994. Mastering the dynamics of innovation: how companies can seize opportunities in
the face of technological change. Harvard Business School Press Boston, MA, USA. Yin, R.K. 1994. Case Study Research: Design and Methods, 3rd ed. Sage, Thousand Oaks, CA.

39
Figure 1a: Determinants of Performance As-Developed.
Figure 1b: Determinants of Performance As-Used.
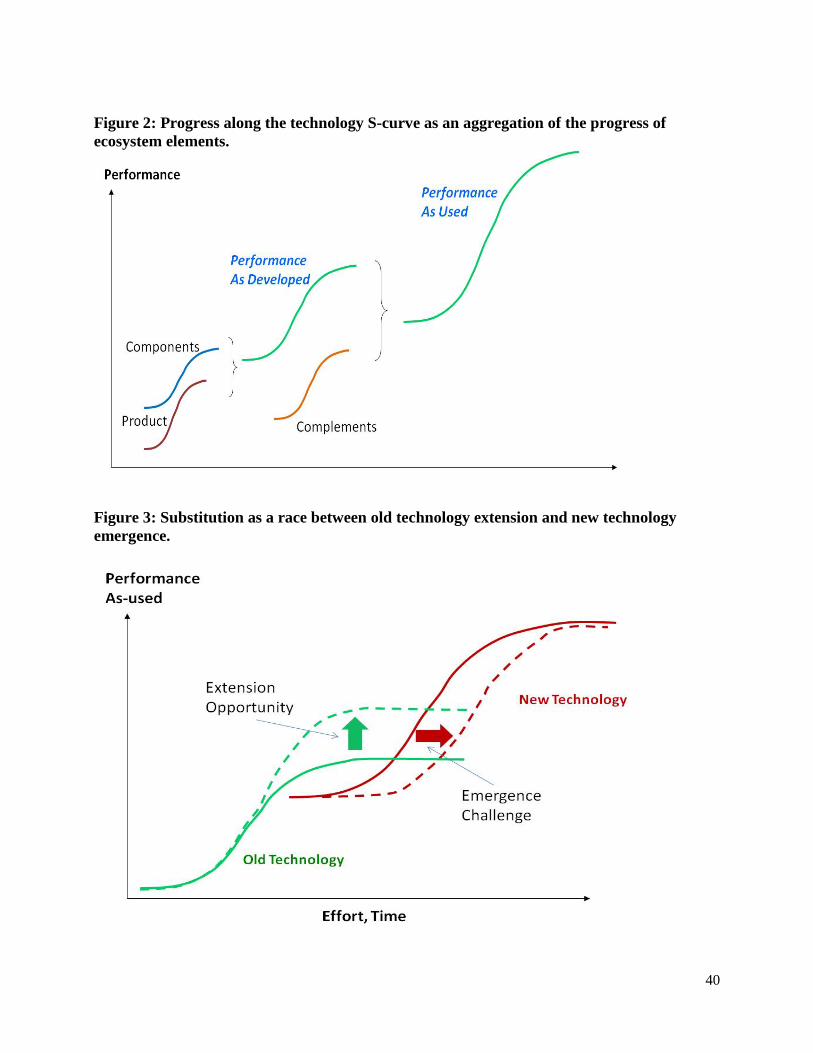
40
Figure 2: Progress along the technology S-curve as an aggregation of the progress of ecosystem elements.
Figure 3: Substitution as a race between old technology extension and new technology emergence.
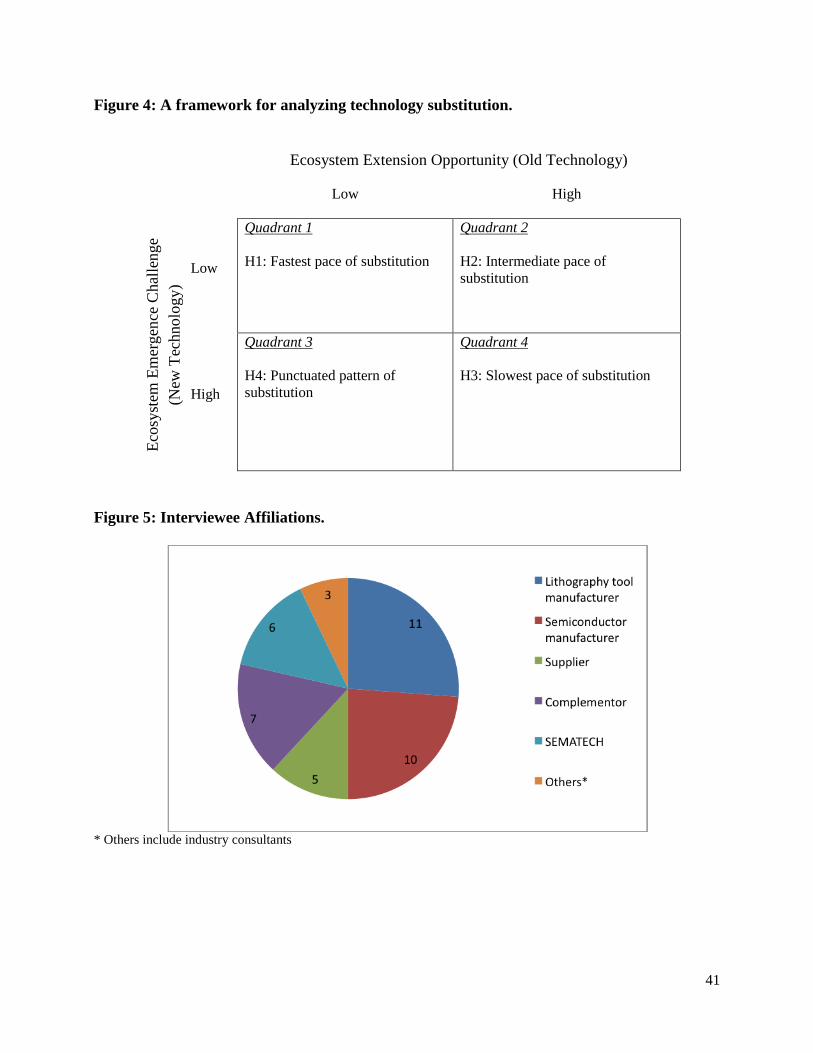
41
Figure 4: A framework for analyzing technology substitution.
Ecosystem Extension Opportunity (Old Technology)
Low High
Ecos
yste
m E
mer
genc
e C
halle
nge
(New
Tec
hnol
ogy)
Low
Quadrant 1 H1: Fastest pace of substitution
Quadrant 2 H2: Intermediate pace of substitution
High
Quadrant 3 H4: Punctuated pattern of substitution
Quadrant 4 H3: Slowest pace of substitution
Figure 5: Interviewee Affiliations.
* Others include industry consultants
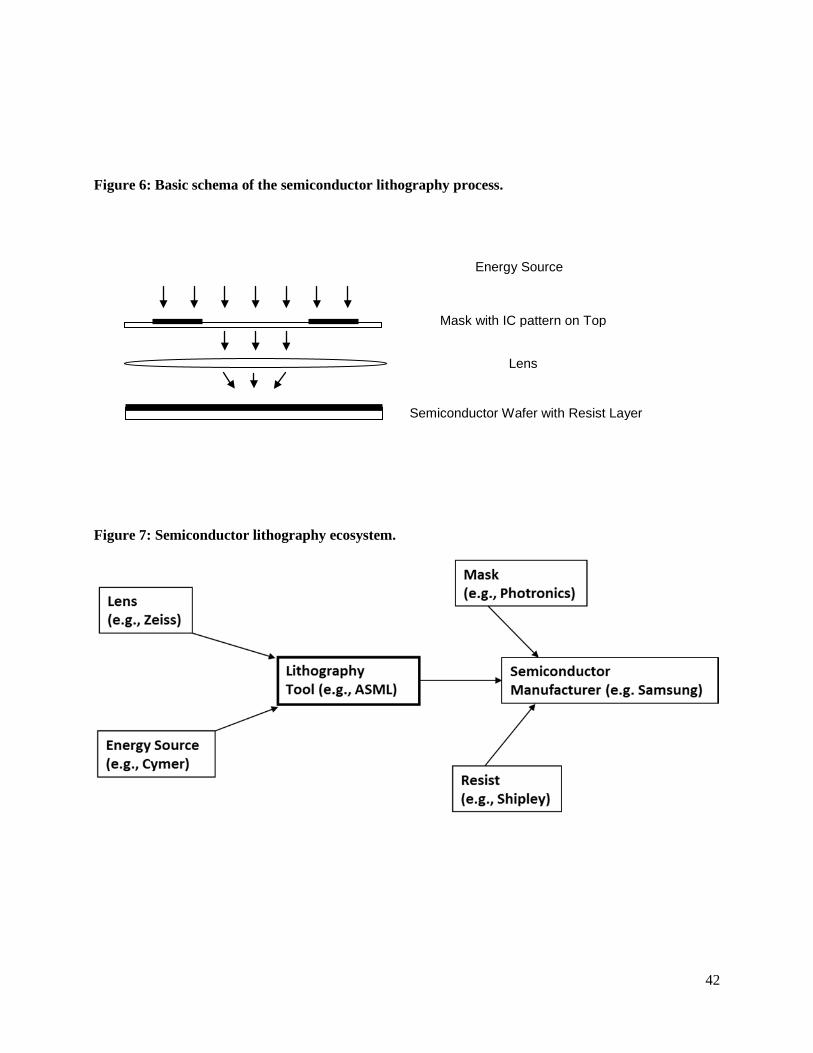
42
Figure 6: Basic schema of the semiconductor lithography process.
Figure 7: Semiconductor lithography ecosystem.
Semiconductor Wafer with Resist Layer
Energy Source
Mask with IC pattern on Top
Lens
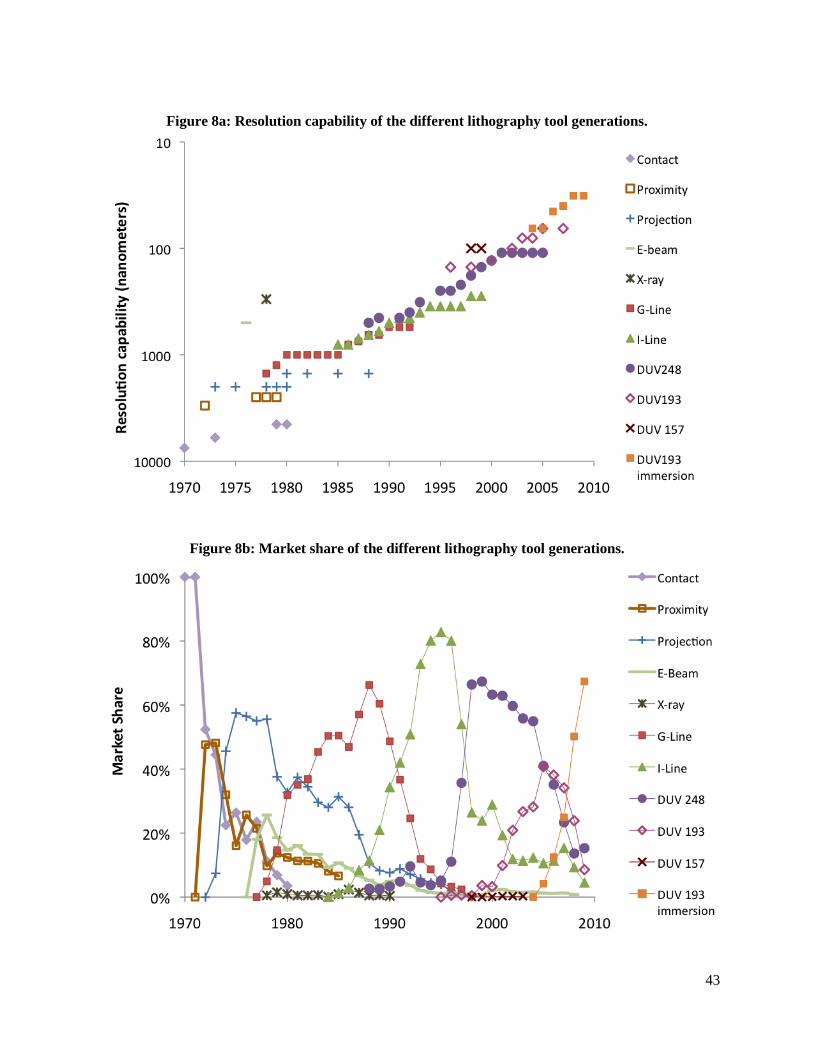
43
Figure 8a: Resolution capability of the different lithography tool generations.
Figure 8b: Market share of the different lithography tool generations.

44
Figure 9: Magnitude of ecosystem emergence challenge for the different technology generations as measured by Solid State Technology article count.
Figure 10: Magnitude of Ecosystem Extension Opportunity for the Different Lithography Technology Generations.
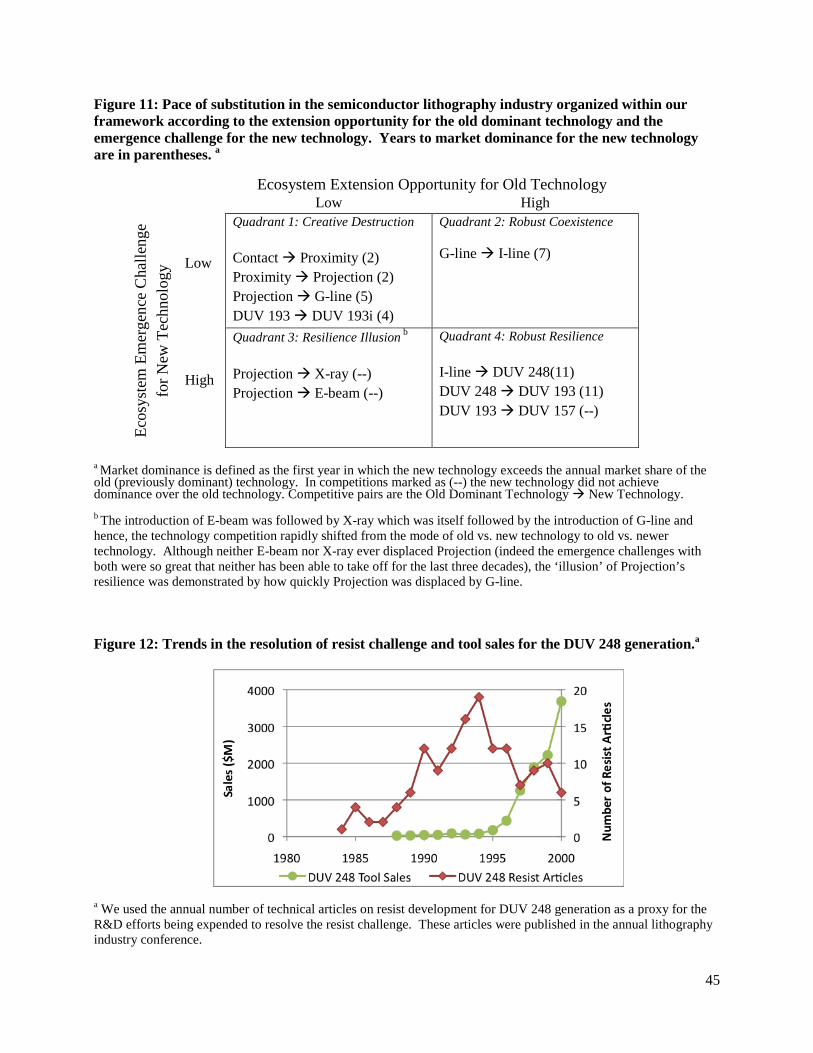
45
Figure 11: Pace of substitution in the semiconductor lithography industry organized within our framework according to the extension opportunity for the old dominant technology and the emergence challenge for the new technology. Years to market dominance for the new technology are in parentheses. a
Ecosystem Extension Opportunity for Old Technology Low High
Ecos
yste
m E
mer
genc
e C
halle
nge
for N
ew T
echn
olog
y Low
Quadrant 1: Creative Destruction Contact Proximity (2) Proximity Projection (2) Projection G-line (5) DUV 193 DUV 193i (4)
Quadrant 2: Robust Coexistence
G-line I-line (7)
High
Quadrant 3: Resilience Illusion b Projection X-ray (--) Projection E-beam (--)
Quadrant 4: Robust Resilience I-line DUV 248(11) DUV 248 DUV 193 (11) DUV 193 DUV 157 (--)
a Market dominance is defined as the first year in which the new technology exceeds the annual market share of the old (previously dominant) technology. In competitions marked as (--) the new technology did not achieve dominance over the old technology. Competitive pairs are the Old Dominant Technology New Technology. b The introduction of E-beam was followed by X-ray which was itself followed by the introduction of G-line and hence, the technology competition rapidly shifted from the mode of old vs. new technology to old vs. newer technology. Although neither E-beam nor X-ray ever displaced Projection (indeed the emergence challenges with both were so great that neither has been able to take off for the last three decades), the ‘illusion’ of Projection’s resilience was demonstrated by how quickly Projection was displaced by G-line. Figure 12: Trends in the resolution of resist challenge and tool sales for the DUV 248 generation.a
a We used the annual number of technical articles on resist development for DUV 248 generation as a proxy for the R&D efforts being expended to resolve the resist challenge. These articles were published in the annual lithography industry conference.

46
Figure 13: Robust coexistence between old (G-line) and new (I-line) technology*
*The increase in market share for G-Line in the years 1987 and 1988 was due to the fact that G-Line was competing not only with I-Line at the higher end of the market, but also with Projection at the lower end of the market. The gains in G-Line’s market share have a close correspondence with the decline in Projection’s market share during this period. To make sure that our result is not affected by this somewhat artificial boost to G-line’s market share, we ran a head-to-head market share analysis of G-line vs. I-line. To do this we looked only at G-line and I-line sales and excluded sales from all other generations. We then computed market shares in this two technology race and identified the year in which I-line’s share exceeded G-line’ share. The cross over year, 1991, remains as before.

47
Figure 14: Difference in the pattern of substitution between Quadrant 1 (Proximity/Projection and DUV 193/DUV 193 immersion) and Quadrant 2 (G-Line/I-Line)

48
Appendix I: Semiconductor Lithography Technology Generations Herewith, we describe each of the lithography technology generations and the major challenges that accompanied their development and commercialization. 1. Contact Printers (First Generation)
Contact printing was the earliest and the simplest of the lithography technologies to be commercialized in 1962. The modifier ‘contact’ corresponds to the fact that the mask and the semiconductor wafer were in direct contact with each other. The contact printers in the 1960’s included a stage system for securing the mask and the wafer, and an alignment unit that ensured that the patterns from the mask were accurately transferred to the wafer. They used a mercury lamp for their light source, an existing component already used in movie projectors of the time. Contact printers did not incorporate a lens.
2. Proximity Printers
A primary disadvantage of contact printing was low process yield. This was due to the damage inflicted on the mask and the wafers as they were repeatedly brought in and out of physical contact with each other during the lithography process. Proximity printing, introduced in 1972, offered a way to overcome this problem. With proximity printing the mask and the wafer were separated by a tiny gap in order to reduce the defects that had been caused by their direct contact. This reconfiguration allowed for significant enhancement in the process yield during semiconductor manufacturing. As discussed in detail by Henderson and Clark (1990), this generational transition can be characterized as an architectural innovation and imposed significant innovation challenges on the focal lithography equipment firms. The transition to proximity printing did not, however, present major innovation challenges to any of the components and complements in the lithography ecosystem.
3. Projection Scanners
The continuous need of semiconductor manufacturers to reduce circuit dimensions and get better manufacturing yields led to the introduction of another architectural innovation in 1973. Projection scanners introduced the use of lens systems as a component in lithography tools. The lens system was composed of a series of reflective mirrors which allowed the image of the mask to be transferred to the wafer. The ecosystem challenges during the development and emergence of this generation were in the lens system, a new component that was developed specifically for the lithography industry; and in the mask, which needed to be etched with correspondingly smaller geometries and greater accuracy. To meet the mask manufacturing challenge, mask makers switched from using step and repeat cameras to using the more accurate electron beam systems in their production process.
4. E-Beam Writers
Electron-beam (E-beam) technology involves patterning the resist on the semiconductor wafer directly using electron beams the follow a pre-programmed pattern, thereby eliminating the need for a mask. A major concern with this approach has been its suitability for mass production. Since a pre-programmed electron beam travels across the wafer to achieve very low resolution, the time required to complete a single wafer can be as high as 10 hrs, which is almost an order of magnitude longer than the alternate optical lithography technologies. The major component and complement challenges posed by E-beam technology were the development of the E-beam source to increase throughput and the new resist chemistries that work with the emitted electrons.
5. X-ray Printers
The use of X-rays for lithography was proposed due to their very low wavelength of less than 10nm. In the early 1970’s, X-ray lithography was developed as a simple proximity imaging system. As in proximity printing, the radiation from an X-ray source is transmitted through the mask onto the resist.

49
X-ray lithography’s very low wavelength created substantial challenges to the development and implementation of the technology for semiconductor manufacturing. These challenges included major innovations required of the source and the mask.
6. G-line
Step-and-repeat (stepper) technology was introduced in 1978. The G-line stepper, an architectural innovation, introduced two key modifications. First, light was projected through the mask on to the wafer using a refractive lens system (as opposed to the reflective lens system used in projection scanners). Second, the light was projected on only a part of the wafer at any one time; the mask was shifted across the wafer in steps, such that multiple exposures are made across the wafer to complete the lithography process. This significantly eased the challenge of mask making as the circuit patterns on the mask could now be 10x or 5x of the dimensions that need to be printed on to the wafer. Beyond challenges in the design of the tool, the transition to G-line steppers imposed challenges on the ecosystem. It required the development of a refractive lens comprised of several precise glass elements that would minimize distortion and transmit light accurately on to the wafer. It also required the development of a resist formulation that would allow for sufficiently small geometries; that is, a resist in which exposure to light energy would trigger a chemical reaction only in the molecules that were directly exposed to the light, without setting off a reaction in adjacent molecules. The resist challenge was resolved through the development of new novolac-based materials which replaced the negative resists which had been used to this point.
7. I-line
I-line steppers, introduced in 1985, used light with a wavelength of 365nm to improve over the resolution achievable with the G-line generation. The main ecosystem challenge was to develop a lens that would transmit light at the lower wavelength. This required the development of a new glass material and corresponding changes to the lens production process. The remaining ecosystem elements required only incremental changes for the transition from the G-line generation.
8. DUV 248
The next step in the industry’s technology evolution was the introduction of DUV 248nm steppers in 1988. This generation entailed a further reduction in wavelength into the deep ultraviolet (DUV) spectrum at 248nm. The reduction in wavelength required fundamental changes in the light source, the lens, the mask, and the resist. Mercury lamps, which had been used in all earlier generations, were not able to provide sufficient energy at a wavelength of 248nm to cause adequate chemical reactions in the resist. This challenge was overcome by the development of excimer lasers using Krypton Fluoride (KrF) gas. The conventional glass material that was used to make lenses faced absorption problems with 248nm wavelength. The only material that could be used was fused silica, and this required major changes to the lens manufacturing process. The challenges imposed on mask makers were overcome by changing the mask material from soda lime glass to quartz in order to provide improved transmission of the 248nm wavelength. This, in turn, required major changes to the mask manufacturing process. Finally, the existing novolac resists could not absorb enough energy from the new wavelength to cause an adequate chemical reaction. As a result, new chemically-amplified resist had to be developed for semiconductor manufacturers to create fine circuits using the new lithography technology. 9. DUV 193
The industry’s drive towards finer resolutions continued when tools using the 193nm wavelength were introduced in 1996. As was the case for the DUV 248nm technology, the very low light wavelength created new challenges in the ecosystem. Since KrF lasers could not produce light with wavelength of 193nm, a new excimer laser that used Argon Fluoride (ArF) gas was developed. New challenges were also posed by light absorption problems with the existing lens materials. These were overcome with the development of a new lens material, calcium fluoride (CaF2). The resist also had to undergo major
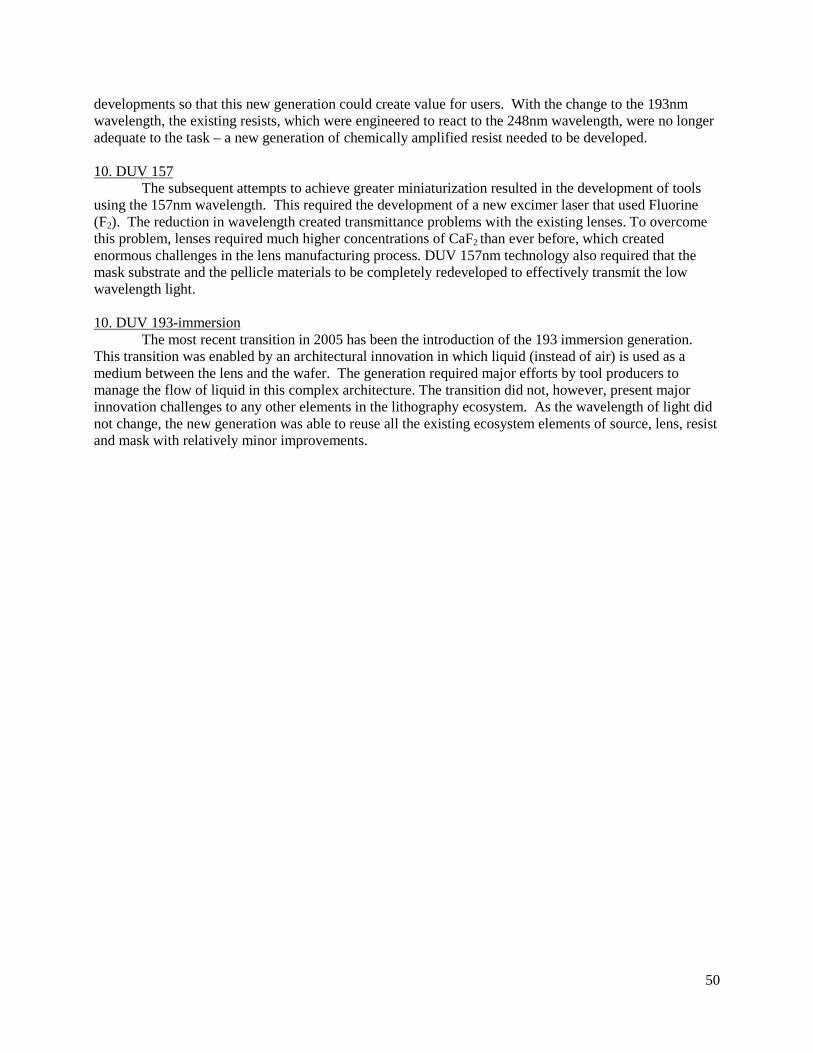
50
developments so that this new generation could create value for users. With the change to the 193nm wavelength, the existing resists, which were engineered to react to the 248nm wavelength, were no longer adequate to the task – a new generation of chemically amplified resist needed to be developed. 10. DUV 157
The subsequent attempts to achieve greater miniaturization resulted in the development of tools using the 157nm wavelength. This required the development of a new excimer laser that used Fluorine (F2). The reduction in wavelength created transmittance problems with the existing lenses. To overcome this problem, lenses required much higher concentrations of CaF2 than ever before, which created enormous challenges in the lens manufacturing process. DUV 157nm technology also required that the mask substrate and the pellicle materials to be completely redeveloped to effectively transmit the low wavelength light. 10. DUV 193-immersion
The most recent transition in 2005 has been the introduction of the 193 immersion generation. This transition was enabled by an architectural innovation in which liquid (instead of air) is used as a medium between the lens and the wafer. The generation required major efforts by tool producers to manage the flow of liquid in this complex architecture. The transition did not, however, present major innovation challenges to any other elements in the lithography ecosystem. As the wavelength of light did not change, the new generation was able to reuse all the existing ecosystem elements of source, lens, resist and mask with relatively minor improvements.

51
Appendix IIa: Pace of substitution in the semiconductor lithography industry organized within our framework according to the extension opportunity for every mainstream old technology and the emergence challenge for the new technology. Years for the new technology to achieve higher market share than the old technology are in parentheses.a
Ecosystem Extension Opportunity for Old Technology
Low High
Ecos
yste
m E
mer
genc
e C
halle
nge
for N
ew T
echn
olog
y
Low
Quadrant 1: Creative Destruction Contact Proximity (2) Proximity Projection (2) Projection G-line (5) DUV 193 DUV 193i (4) Contact Projection (2) Proximity G-line (2) Projection I-Line (4) I-Line DUV 193i (2) DUV 248 DUV 193i (3)
Quadrant 2: Robust Coexistence
G-line I-line (7)
High
Quadrant 3: Resilience Illusion
Projection E-beam (--)b Projection X-ray (--)b
G-line DUV 248 (8) Projection DUV 248 (5) I-line DUV 193 (7) I-Line DUV 157 (--)b
Quadrant 4: Robust Resilience I-line DUV 248(11) DUV 248 DUV 193 (11) DUV 193 DUV 157 (--)c
DUV 248 DUV 157 (--)c
a Pace of substitution is defined as the number of years required for the new technology to overtake the market share of every prior technology that had achieved dominant market share and still held at least ten percent share when the new technology was introduced (the ten percent boundary assures that the old technology was still contending for mainstream customers; i.e., it precludes comparisons such as projection vs. DUV 193i. Competitive pairs are Old Technology New Technology.
b The introduction of E-beam was followed by X-ray which was itself followed by the introduction of G-line and hence, the technology competition rapidly shifted from the mode of old vs. new technology to old vs. newer technology. Although neither E-beam nor X-ray ever displaced Projection (indeed the emergence challenges with both were so great that neither has been able to take off for the last three decades), the ‘illusion’ of Projection’s resilience was demonstrated by how quickly Projection was displaced by G-line. The same pattern also applies to competition between I-Line and DUV 157 i.e. it was rapidly substituted by DUV 193i as shown in Quadrant 1. c The ecosystem emergence challenges with DUV 157 were so great that it did not ever achieve dominance over the old technology.

52
Appendix IIb: Demand for semiconductor equipment from the leading edge market segment
Appendix IIc: Hedonic Regression Analysis of Lithography Tool Price. a
Dependent Variable =
Ln (Inflated price in 2004$) Model 1 Model 2 Ln(Resolution in nm) -1.162*** -0.917*** (0.045) (0.121) DUV 193 1.378*** (0.398) DUV 248 1.398*** (0.310) I-Line 1.267*** (0.237) G-Line 1.076*** (0.184) Projection 1.135*** (0.176) Constant 22.058*** 19.348*** (0.286) (0.945) Observations 90 90 Adjusted R-squared 0.88 0.92
Proximity is the omitted technology category Standard errors in parentheses * significant at 10%; ** significant at 5%; *** significant at 1%.
a The data for the hedonic analysis was collected from tool manufacturer’s product brochures and from VLSI Research.

53
Appendix IId: Description of firms that pioneered the new technology generations
New Technology Generation
Pioneer in New Technology Incumbent/Entrant Market Leader in the Previous Dominant Technology
Proximity Kasper/Karl Suss Incumbent/Entrant Yes
Projection Perkin Elmer Entrant -
E-Beam Perkin Elmer/Varian Incumbent/Entrant Yes
X-ray Cobilt Incumbent No
G-Line GCA Entrant -
I-Line Nikon Incumbent Yes
DUV 248 Nikon Incumbent Yes
DUV 193 Integrated Solutions Entrant -
DUV 157 Exitech Entrant -
DUV 193 immersion ASML Incumbent Yes