v117n2a10 3D geological modelling and resource …3D geological modelling and resource estimation...
10
Introduction This paper describes a methodology that can be applied when constructing a geological model of a deposit following a conventional approach. An understanding of the geology of a deposit is fundamental to the Mineral Resource estimation (MRE) process, since estimates are constrained by the geological complexity captured within the geological model, usually based on geology, geometry, structural nature, and grade distribution of the deposit. The risk associated with the geological model and the choice and suitability of estimation techniques have an impact on Mineral Resource confidence, which is reflected by the resource classification category associated with the estimate. Each deposit is unique, therefore the MRE process for each deposit varies. The workflow adopted in this study is based on a gold deposit containing an oxide zone (oxides) and a deeper sulphide zone (sulphides) comprised of unweathered (fresh rock) material, located in southwestern Mali. The mine does not have the plant capability to treat sulphides due to the indentation hardness, and most of the oxide Mineral Reserve on the concession has already been depleted. Exploring the potential for additional oxide resources is thus a natural step to increase the life of the mine. Background Any MRE process is iterative, requiring a good understanding of: the underlying geology, good resource evaluation practice, and relevant knowledge of the literature, including company reports and maps, to recognize and learn from past experience. This information provides a reference and known a-priori information about the deposit to guide both the modelling and estimation processes. The first step in the MRE process is data collation and preparation to serve as the basis for modelling, analysis, and estimation. This data includes collar, survey, alteration, assay, lithology, hardness, and redox information that is validated to ensure it is error-free. Light detection and ranging (LIDAR) surface topography strings are another type of data that is validated to ensure that the topography is accurately represented. Once all the data is deemed of high quality and suitable for estimation, the second step of the MRE process is 3D geological modelling based on the drilling data. During this step, validated data is used to generate a series of wireframes to represent the extent and current understanding of the 3D geological modelling and resource estimation for a gold deposit in Mali by L. Chanderman*, C.E. Dohm*, and R.C.A. Minnitt* Synopsis Mineral Resource estimation (MRE) and classification are highly dependent on the confidence in the model of the orebody geometry, known as the geological model, within which the estimates are constrained. An understanding of the geology of a deposit is thus fundamental to the Mineral Resource evaluation process. The geological model is a function of the structural and depositional complexity of the geology captured by drilling information, which is limited in the early stages of a project. The information effect has a significant impact in terms of the interpretation of the geology as well as the estimation of grade continuity and the resultant risk associated with the Mineral Resource estimate and classification. Therefore, as new drilling information becomes available, it is necessary to update and refine the geological model to appropriately constrain the resource estimates. The grade information is also updated, including statistics and the spatial correlation characteristics. This refinement is based on geological interpretations derived from the drill- hole information that becomes available throughout the life of the mine; orebody knowledge that comes from working experience of the deposit, as well as familiarity with the software package used for modelling, is also important. In updating, the potential to identify new resources in previously unknown areas may be realized. The opposite may also occur where previous interpretations of ore continuity are refuted. Both scenarios could result from a better understanding of the geology of the deposit and thus a more realistic MRE, which reduces geological risk. This paper describes how newly drilled advanced grade-control holes for a gold deposit in Mali were used to refine the 3D geological model for the deposit in an attempt to identify the potential for additional oxide ore using conventional geostatistical evaluation techniques. Keywords geological modelling, resource estimation, geostatistical evaluation. * School of Mining Engineering, University of the Witwatersrand, South Africa. © The Southern African Institute of Mining and Metallurgy, 2017. ISSN 2225-6253. Paper received Apr. 2016; revised paper received Sep. 2016. 189 The Journal of the Southern African Institute of Mining and Metallurgy VOLUME 117 february 2017 s http://dx.doi.org/10.17159/2411-9717/2017/v117n2a10
Transcript of v117n2a10 3D geological modelling and resource …3D geological modelling and resource estimation...
Introduction
This paper describes a methodology that canbe applied when constructing a geologicalmodel of a deposit following a conventionalapproach. An understanding of the geology ofa deposit is fundamental to the MineralResource estimation (MRE) process, sinceestimates are constrained by the geologicalcomplexity captured within the geologicalmodel, usually based on geology, geometry,structural nature, and grade distribution of thedeposit. The risk associated with the geologicalmodel and the choice and suitability ofestimation techniques have an impact onMineral Resource confidence, which isreflected by the resource classification category
associated with the estimate. Each deposit isunique, therefore the MRE process for eachdeposit varies. The workflow adopted in thisstudy is based on a gold deposit containing anoxide zone (oxides) and a deeper sulphidezone (sulphides) comprised of unweathered(fresh rock) material, located in southwesternMali. The mine does not have the plantcapability to treat sulphides due to theindentation hardness, and most of the oxideMineral Reserve on the concession has alreadybeen depleted. Exploring the potential foradditional oxide resources is thus a naturalstep to increase the life of the mine.
Background
Any MRE process is iterative, requiring a goodunderstanding of: the underlying geology,good resource evaluation practice, and relevantknowledge of the literature, including companyreports and maps, to recognize and learn frompast experience. This information provides areference and known a-priori informationabout the deposit to guide both the modellingand estimation processes. The first step in theMRE process is data collation and preparationto serve as the basis for modelling, analysis,and estimation. This data includes collar,survey, alteration, assay, lithology, hardness,and redox information that is validated toensure it is error-free. Light detection andranging (LIDAR) surface topography stringsare another type of data that is validated toensure that the topography is accuratelyrepresented. Once all the data is deemed ofhigh quality and suitable for estimation, thesecond step of the MRE process is 3Dgeological modelling based on the drilling data.During this step, validated data is used togenerate a series of wireframes to representthe extent and current understanding of the
3D geological modelling and resourceestimation for a gold deposit in Maliby L. Chanderman*, C.E. Dohm*, and R.C.A. Minnitt*
Synopsis
Mineral Resource estimation (MRE) and classification are highlydependent on the confidence in the model of the orebody geometry, knownas the geological model, within which the estimates are constrained. Anunderstanding of the geology of a deposit is thus fundamental to theMineral Resource evaluation process. The geological model is a function ofthe structural and depositional complexity of the geology captured bydrilling information, which is limited in the early stages of a project. Theinformation effect has a significant impact in terms of the interpretation ofthe geology as well as the estimation of grade continuity and the resultantrisk associated with the Mineral Resource estimate and classification.
Therefore, as new drilling information becomes available, it isnecessary to update and refine the geological model to appropriatelyconstrain the resource estimates. The grade information is also updated,including statistics and the spatial correlation characteristics. Thisrefinement is based on geological interpretations derived from the drill-hole information that becomes available throughout the life of the mine;orebody knowledge that comes from working experience of the deposit, aswell as familiarity with the software package used for modelling, is alsoimportant.
In updating, the potential to identify new resources in previouslyunknown areas may be realized. The opposite may also occur whereprevious interpretations of ore continuity are refuted. Both scenarios couldresult from a better understanding of the geology of the deposit and thus amore realistic MRE, which reduces geological risk. This paper describeshow newly drilled advanced grade-control holes for a gold deposit in Maliwere used to refine the 3D geological model for the deposit in an attemptto identify the potential for additional oxide ore using conventionalgeostatistical evaluation techniques.
Keywords
geological modelling, resource estimation, geostatistical evaluation.
* School of Mining Engineering, University of theWitwatersrand, South Africa.
© The Southern African Institute of Mining andMetallurgy, 2017. ISSN 2225-6253. Paper receivedApr. 2016; revised paper received Sep. 2016.
189The Journal of the Southern African Institute of Mining and Metallurgy VOLUME 117 february 2017 s
http://dx.doi.org/10.17159/2411-9717/2017/v117n2a10
3D geological modelling and resource estimation for a gold deposit in Mali
deposit’s geology and mineralization. These wireframes arethe basis for the geological model, which in turn is thefoundation of the MRE, therefore care must be taken toensure that no error is introduced or allowed to propagate inthe process. Irrespective of the computer modelling techniqueapplied, it is vital that the geologist prevents automaticsoftware routines from making programmed assumptionsabout the geology, because software packages do not havethe intellectual experience of the deposit that the geologisthas. This process of modelling the geology is essential fordefining domains (stationary regions) which make reliableestimation possible. Domains can be defined using grades inan iterative process of selecting mineralized intersectionsfrom each borehole and then plotting the distribution of thedata and assessing the statistics to identify whether trendsexist within the domains. Domaining assists in selectinginterpolation techniques; defining subsets within the depositdata and highlighting outliers and extreme grade values, andessentially establishing whether relationships betweenvariables exist.
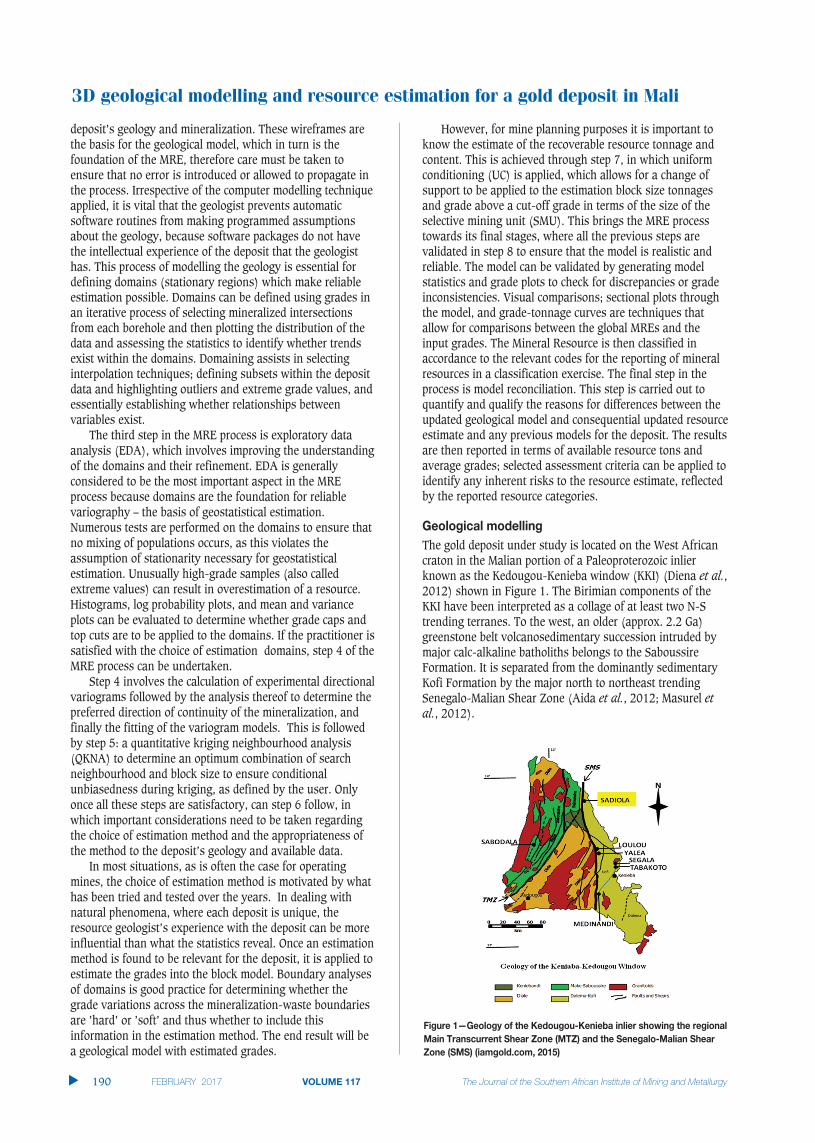
The third step in the MRE process is exploratory dataanalysis (EDA), which involves improving the understandingof the domains and their refinement. EDA is generallyconsidered to be the most important aspect in the MREprocess because domains are the foundation for reliablevariography – the basis of geostatistical estimation.Numerous tests are performed on the domains to ensure thatno mixing of populations occurs, as this violates theassumption of stationarity necessary for geostatisticalestimation. Unusually high-grade samples (also calledextreme values) can result in overestimation of a resource.Histograms, log probability plots, and mean and varianceplots can be evaluated to determine whether grade caps andtop cuts are to be applied to the domains. If the practitioner issatisfied with the choice of estimation domains, step 4 of theMRE process can be undertaken.
Step 4 involves the calculation of experimental directionalvariograms followed by the analysis thereof to determine thepreferred direction of continuity of the mineralization, andfinally the fitting of the variogram models. This is followedby step 5: a quantitative kriging neighbourhood analysis(QKNA) to determine an optimum combination of searchneighbourhood and block size to ensure conditionalunbiasedness during kriging, as defined by the user. Onlyonce all these steps are satisfactory, can step 6 follow, inwhich important considerations need to be taken regardingthe choice of estimation method and the appropriateness ofthe method to the deposit’s geology and available data.
In most situations, as is often the case for operatingmines, the choice of estimation method is motivated by whathas been tried and tested over the years. In dealing withnatural phenomena, where each deposit is unique, theresource geologist’s experience with the deposit can be moreinfluential than what the statistics reveal. Once an estimationmethod is found to be relevant for the deposit, it is applied toestimate the grades into the block model. Boundary analysesof domains is good practice for determining whether thegrade variations across the mineralization-waste boundariesare ’hard’ or ’soft’ and thus whether to include thisinformation in the estimation method. The end result will bea geological model with estimated grades.
However, for mine planning purposes it is important toknow the estimate of the recoverable resource tonnage andcontent. This is achieved through step 7, in which uniformconditioning (UC) is applied, which allows for a change ofsupport to be applied to the estimation block size tonnagesand grade above a cut-off grade in terms of the size of theselective mining unit (SMU). This brings the MRE processtowards its final stages, where all the previous steps arevalidated in step 8 to ensure that the model is realistic andreliable. The model can be validated by generating modelstatistics and grade plots to check for discrepancies or gradeinconsistencies. Visual comparisons; sectional plots throughthe model, and grade-tonnage curves are techniques thatallow for comparisons between the global MREs and theinput grades. The Mineral Resource is then classified inaccordance to the relevant codes for the reporting of mineralresources in a classification exercise. The final step in theprocess is model reconciliation. This step is carried out toquantify and qualify the reasons for differences between theupdated geological model and consequential updated resourceestimate and any previous models for the deposit. The resultsare then reported in terms of available resource tons andaverage grades; selected assessment criteria can be applied toidentify any inherent risks to the resource estimate, reflectedby the reported resource categories.
Geological modelling
The gold deposit under study is located on the West Africancraton in the Malian portion of a Paleoproterozoic inlierknown as the Kedougou-Kenieba window (KKI) (Diena et al.,2012) shown in Figure 1. The Birimian components of theKKI have been interpreted as a collage of at least two N-Strending terranes. To the west, an older (approx. 2.2 Ga)greenstone belt volcanosedimentary succession intruded bymajor calc-alkaline batholiths belongs to the SaboussireFormation. It is separated from the dominantly sedimentaryKofi Formation by the major north to northeast trendingSenegalo-Malian Shear Zone (Aida et al., 2012; Masurel etal., 2012).
s
190 february 2017 VOLUME 117 The Journal of the Southern African Institute of Mining and Metallurgy
Figure 1—Geology of the Kedougou-Kenieba inlier showing the regional
Main Transcurrent Shear Zone (MTZ) and the Senegalo-Malian Shear
Zone (SMS) (iamgold.com, 2015)

The mineralization has a strong structural control and isspatially associated with a complex weathering and alterationpattern, possibly associated with a mesothermal origin –typical for gold emplacement in West African Birimian rocks(Aida et al., 2012; Masurel et al., 2012). The strata arefolded and dip gently to the east (25–50 degrees) andcomprise graphitic metapelites overlying impure carbonates(Figure 2).
The mineralization is thought to be controlled by acombination of lithology, structure, weathering, andalteration, necessitating the need for updated geologicalwireframes of the weathering surfaces, hardness boundaries,extent of the graphitic alteration, and gold mineralization asnew information became available. All drilling data wasvalidated in terms of geology and geochemical analysisbefore modelling.
Graphite alteration can reduce metallurgical recoveries.The extent of the graphite alteration therefore needed to beinvestigated. A graphite wireframe (Figure 3) was createdusing the interpolation technique in Leapfrog® miningsoftware based on the logged alteration codes in the drill-holefile. Indicator kriging (IK) was then applied to estimate theextent of the graphite. However, these results did not visuallycompare well to the modelled graphite and were thereforeignored.
The drill-holes were composited to 2 m intervals and thenused to generate grade envelopes in Leapfrog® in an attemptto separate out higher grade areas in order to estimate themseparately. The data was transformed to Gaussian spacebefore interpolation; a spheroidal variogram was used and ageological threshold grade was selected for the interpolation.The spheroidal interpolant function in Leapfrog® was selectedto create the grade envelope based on the fixed-rangespherical variogram used in geostatistical modelling. Thespheroidal interpolant function approximates the sphericalvariogram while forming a smooth interpolant. The process ofchoosing a suitable threshold grade was iterative and aimedat identifying the direction of strongest continuity in themineralization based on knowledge and understanding of thedeposit. The choice of grade threshold can be revealed onlyby iteration, since grade continuity is irregular. The aim is toidentify the grade that displays the strongest continuity tohonour the principles of stationarity that underlie the theoryof geostatistics. The threshold grade decision is thusdependent on both the data and the intuition of the modeller.
The approach followed to constrain the ore envelopes in thisstudy tended towards the more conservative – a balancebetween over-constraining (exaggerating the gradecontinuity) and under-constraining (including largequantities of boundary waste) the wireframes was taken toavoid misrepresenting the grade and recoverable metal.Manual refinement of the envelopes was required to avoidallowing the interpolation software to introduce inappropriateassumptions about the deposit geology. This manualadjustment involved using ’dummy’ high- or low-gradepoints to either extend mineralization where the modelledconnectivity was less than desired or restrict mineralization
3D geological modelling and resource estimation for a gold deposit in Mali
The Journal of the Southern African Institute of Mining and Metallurgy VOLUME 117 february 2017 191 s
Figure 2—Cross-section of the geology of the deposit (AngloGold
Ashanti)
Figure 3—Extent of graphite alteration shown with drill-holes
Figure 4—Sectional view showing the general trend of the mineral-
ization (dipping toward the east)
Figure 5—Isometric view showing the mineralization envelope (gold)
and approximate location of the dolerite dyke (green dashed line) with
the drill-holes
3D geological modelling and resource estimation for a gold deposit in Mali
where the modelled connectivity was more than desired (orthere were unreasonable extensions beyond data support –often termed Leapfrog® ’blowouts’).
The resultant interpretation of the mineralization isshown in Figure 4 – it strikes approximately N-S (for 1.1 km)and dips at 50 degrees towards the east. Near its centre, thereis a break in the mineralization where a dolerite dyke hasintruded along a fault that has separated and displaced themineralization (Figure 5). The previous and updated mineral-ization interpretations were carefully assessed and theycompared well in terms of the geological controls governingthe mineralization.
Exploratory data analysis
Samples within the mineralized envelope were deemed ‘ore’and those outside, ‘waste’. Domains are defined as zones thatare geologically and statistically homogenous (supported byvariography and statistical analysis) (Duke and Hanna,2001). The domains in the study were defined using gradesin an iterative process of selecting mineralized intersectionsin each borehole using Leapfrog®. Mineralized domains wereidentified on the basis of logged samples and grade
continuity, and were guided by the previously modelledmineralized wireframes. The spatial limits of these domainsare controlled by the 3D geological mesh (Schofield, 2011)and were examined in a boundary analysis exercises. Sixdomains (laterite ore, saprolite ore, hard ore, laterite waste,saprolite waste, and hard waste) were identified. The ‘ore’ (ormineralized) domains (laterite, saprolite, and hard) werecompared to determine whether they should be estimatedtogether or separately.
The statistics and distributions of the hard and saproliteore were compared and found to be fairly similar, but thesaprolite mean ore grade was higher at 1.65 g/t than the hardore mean grade of 1.29 g/t.
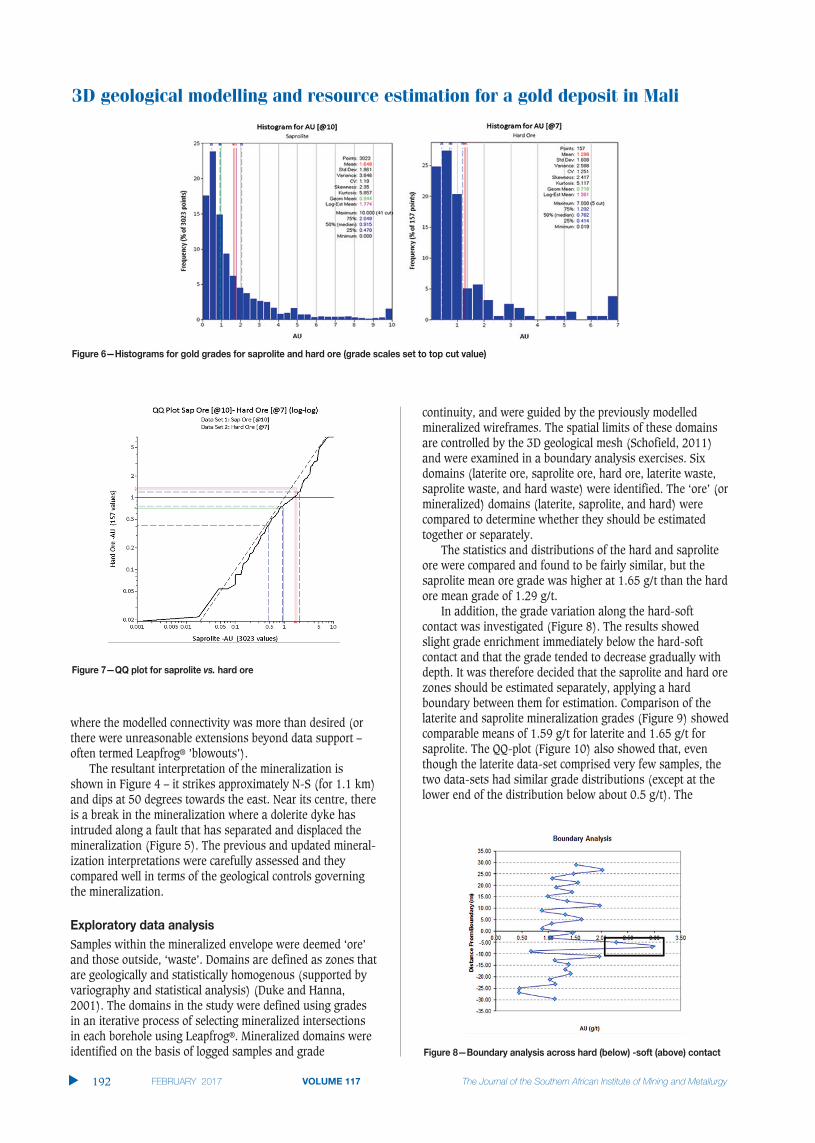
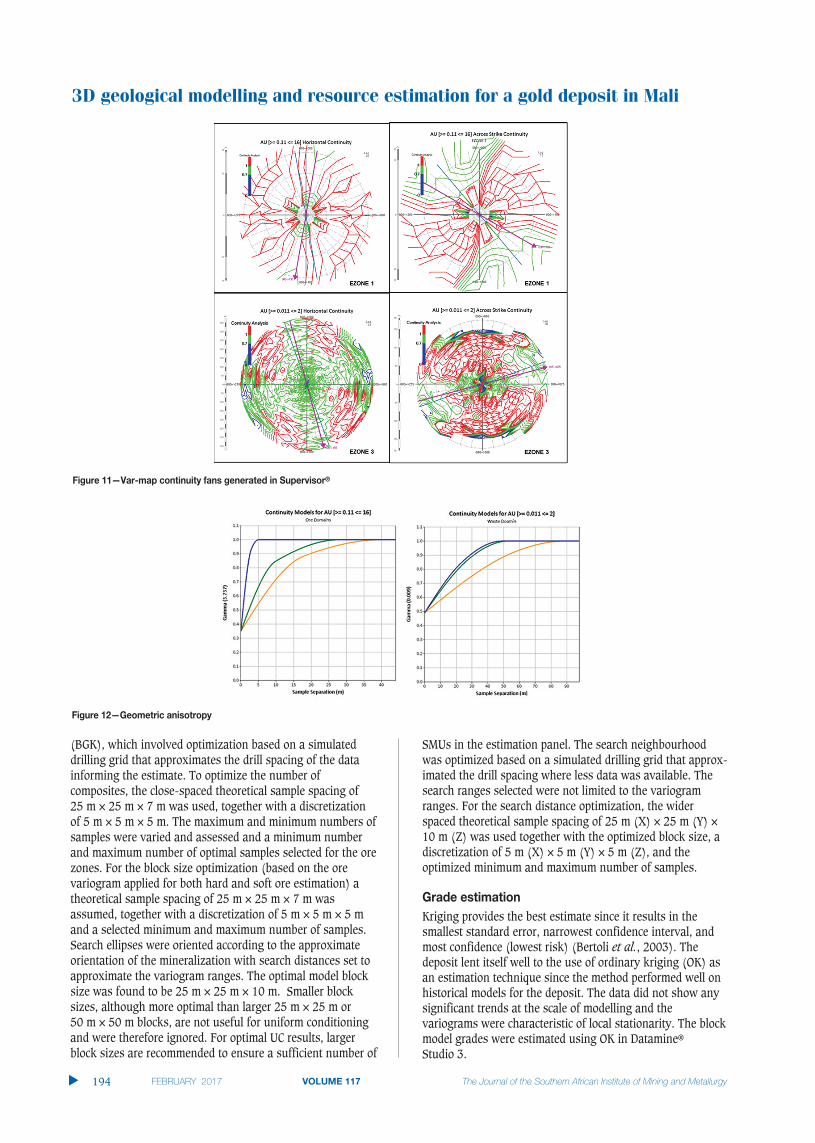
In addition, the grade variation along the hard-softcontact was investigated (Figure 8). The results showedslight grade enrichment immediately below the hard-softcontact and that the grade tended to decrease gradually withdepth. It was therefore decided that the saprolite and hard orezones should be estimated separately, applying a hardboundary between them for estimation. Comparison of thelaterite and saprolite mineralization grades (Figure 9) showedcomparable means of 1.59 g/t for laterite and 1.65 g/t forsaprolite. The QQ-plot (Figure 10) also showed that, eventhough the laterite data-set comprised very few samples, thetwo data-sets had similar grade distributions (except at thelower end of the distribution below about 0.5 g/t). The
s
192 february 2017 VOLUME 117 The Journal of the Southern African Institute of Mining and Metallurgy
Figure 6—Histograms for gold grades for saprolite and hard ore (grade scales set to top cut value)
Figure 7—QQ plot for saprolite vs. hard ore
Figure 8—Boundary analysis across hard (below) -soft (above) contact
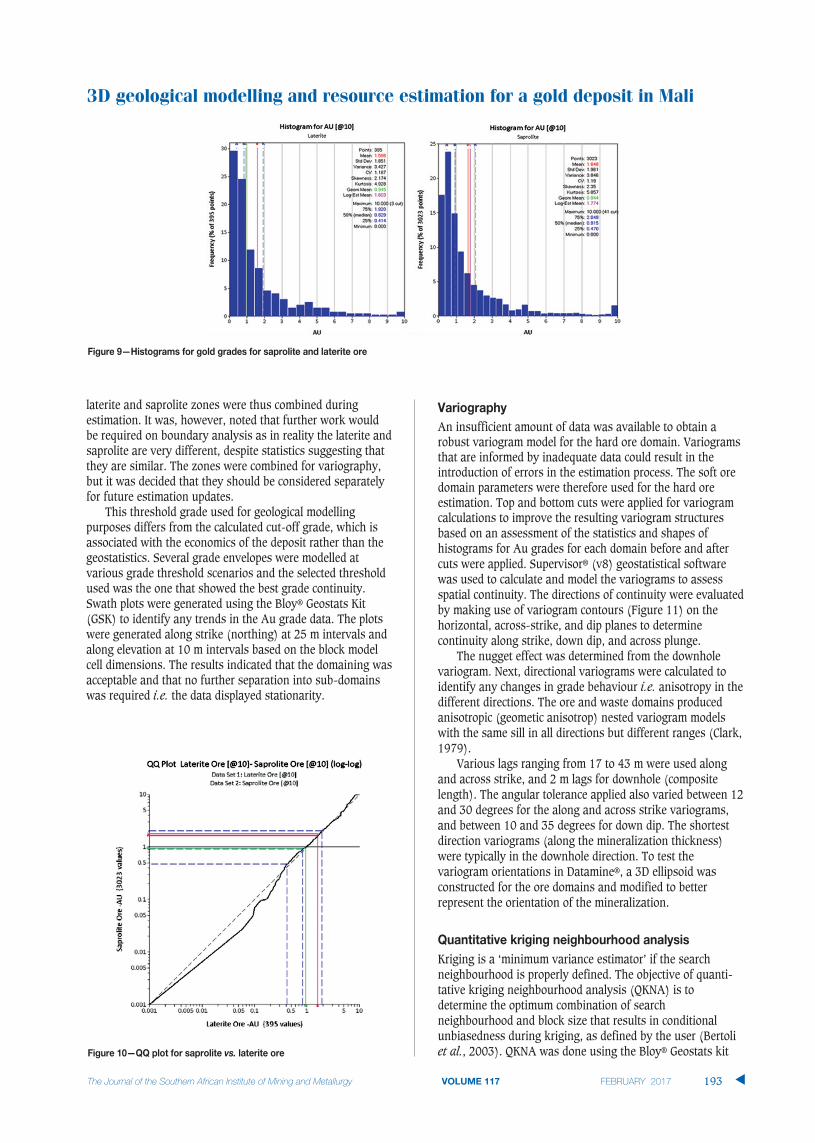
laterite and saprolite zones were thus combined duringestimation. It was, however, noted that further work wouldbe required on boundary analysis as in reality the laterite andsaprolite are very different, despite statistics suggesting thatthey are similar. The zones were combined for variography,but it was decided that they should be considered separatelyfor future estimation updates.
This threshold grade used for geological modellingpurposes differs from the calculated cut-off grade, which isassociated with the economics of the deposit rather than thegeostatistics. Several grade envelopes were modelled atvarious grade threshold scenarios and the selected thresholdused was the one that showed the best grade continuity.Swath plots were generated using the Bloy® Geostats Kit(GSK) to identify any trends in the Au grade data. The plotswere generated along strike (northing) at 25 m intervals andalong elevation at 10 m intervals based on the block modelcell dimensions. The results indicated that the domaining wasacceptable and that no further separation into sub-domainswas required i.e. the data displayed stationarity.
Variography
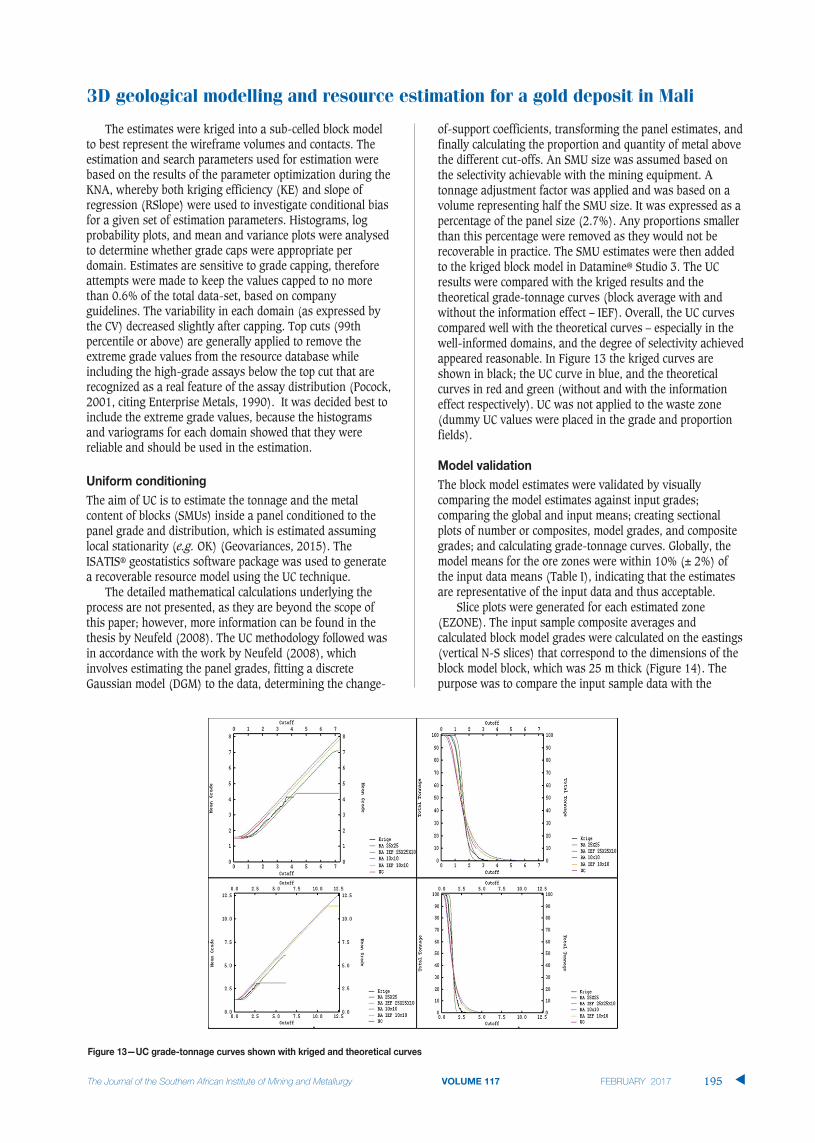
An insufficient amount of data was available to obtain arobust variogram model for the hard ore domain. Variogramsthat are informed by inadequate data could result in theintroduction of errors in the estimation process. The soft oredomain parameters were therefore used for the hard oreestimation. Top and bottom cuts were applied for variogramcalculations to improve the resulting variogram structures based on an assessment of the statistics and shapes ofhistograms for Au grades for each domain before and aftercuts were applied. Supervisor® (v8) geostatistical softwarewas used to calculate and model the variograms to assessspatial continuity. The directions of continuity were evaluatedby making use of variogram contours (Figure 11) on thehorizontal, across-strike, and dip planes to determinecontinuity along strike, down dip, and across plunge.
The nugget effect was determined from the downholevariogram. Next, directional variograms were calculated toidentify any changes in grade behaviour i.e. anisotropy in thedifferent directions. The ore and waste domains producedanisotropic (geometic anisotrop) nested variogram modelswith the same sill in all directions but different ranges (Clark,1979).
Various lags ranging from 17 to 43 m were used alongand across strike, and 2 m lags for downhole (compositelength). The angular tolerance applied also varied between 12and 30 degrees for the along and across strike variograms,and between 10 and 35 degrees for down dip. The shortestdirection variograms (along the mineralization thickness)were typically in the downhole direction. To test thevariogram orientations in Datamine®, a 3D ellipsoid wasconstructed for the ore domains and modified to betterrepresent the orientation of the mineralization.
Quantitative kriging neighbourhood analysis
Kriging is a ‘minimum variance estimator’ if the searchneighbourhood is properly defined. The objective of quanti-tative kriging neighbourhood analysis (QKNA) is todetermine the optimum combination of searchneighbourhood and block size that results in conditionalunbiasedness during kriging, as defined by the user (Bertoliet al., 2003). QKNA was done using the Bloy® Geostats kit
3D geological modelling and resource estimation for a gold deposit in Mali
The Journal of the Southern African Institute of Mining and Metallurgy VOLUME 117 february 2017 193 s
Figure 9—Histograms for gold grades for saprolite and laterite ore
Figure 10—QQ plot for saprolite vs. laterite ore
3D geological modelling and resource estimation for a gold deposit in Mali
(BGK), which involved optimization based on a simulateddrilling grid that approximates the drill spacing of the datainforming the estimate. To optimize the number ofcomposites, the close-spaced theoretical sample spacing of 25 m × 25 m × 7 m was used, together with a discretizationof 5 m × 5 m × 5 m. The maximum and minimum numbers ofsamples were varied and assessed and a minimum numberand maximum number of optimal samples selected for the orezones. For the block size optimization (based on the orevariogram applied for both hard and soft ore estimation) atheoretical sample spacing of 25 m × 25 m × 7 m wasassumed, together with a discretization of 5 m × 5 m × 5 mand a selected minimum and maximum number of samples.Search ellipses were oriented according to the approximateorientation of the mineralization with search distances set toapproximate the variogram ranges. The optimal model blocksize was found to be 25 m × 25 m × 10 m. Smaller blocksizes, although more optimal than larger 25 m × 25 m or 50 m × 50 m blocks, are not useful for uniform conditioningand were therefore ignored. For optimal UC results, largerblock sizes are recommended to ensure a sufficient number of
SMUs in the estimation panel. The search neighbourhoodwas optimized based on a simulated drilling grid that approx-imated the drill spacing where less data was available. Thesearch ranges selected were not limited to the variogramranges. For the search distance optimization, the widerspaced theoretical sample spacing of 25 m (X) × 25 m (Y) ×10 m (Z) was used together with the optimized block size, adiscretization of 5 m (X) × 5 m (Y) × 5 m (Z), and theoptimized minimum and maximum number of samples.
Grade estimation
Kriging provides the best estimate since it results in thesmallest standard error, narrowest confidence interval, andmost confidence (lowest risk) (Bertoli et al., 2003). Thedeposit lent itself well to the use of ordinary kriging (OK) asan estimation technique since the method performed well onhistorical models for the deposit. The data did not show anysignificant trends at the scale of modelling and thevariograms were characteristic of local stationarity. The blockmodel grades were estimated using OK in Datamine®Studio 3.
s
194 february 2017 VOLUME 117 The Journal of the Southern African Institute of Mining and Metallurgy
Figure 12—Geometric anisotropy
Figure 11—Var-map continuity fans generated in Supervisor®
3D geological modelling and resource estimation for a gold deposit in Mali
The Journal of the Southern African Institute of Mining and Metallurgy VOLUME 117 february 2017 195 s
The estimates were kriged into a sub-celled block modelto best represent the wireframe volumes and contacts. Theestimation and search parameters used for estimation werebased on the results of the parameter optimization during theKNA, whereby both kriging efficiency (KE) and slope ofregression (RSlope) were used to investigate conditional biasfor a given set of estimation parameters. Histograms, logprobability plots, and mean and variance plots were analysedto determine whether grade caps were appropriate perdomain. Estimates are sensitive to grade capping, thereforeattempts were made to keep the values capped to no morethan 0.6% of the total data-set, based on companyguidelines. The variability in each domain (as expressed bythe CV) decreased slightly after capping. Top cuts (99thpercentile or above) are generally applied to remove theextreme grade values from the resource database whileincluding the high-grade assays below the top cut that arerecognized as a real feature of the assay distribution (Pocock,2001, citing Enterprise Metals, 1990). It was decided best toinclude the extreme grade values, because the histogramsand variograms for each domain showed that they werereliable and should be used in the estimation.
Uniform conditioning
The aim of UC is to estimate the tonnage and the metalcontent of blocks (SMUs) inside a panel conditioned to thepanel grade and distribution, which is estimated assuminglocal stationarity (e.g. OK) (Geovariances, 2015). TheISATIS® geostatistics software package was used to generatea recoverable resource model using the UC technique.
The detailed mathematical calculations underlying theprocess are not presented, as they are beyond the scope ofthis paper; however, more information can be found in thethesis by Neufeld (2008). The UC methodology followed wasin accordance with the work by Neufeld (2008), whichinvolves estimating the panel grades, fitting a discreteGaussian model (DGM) to the data, determining the change-
of-support coefficients, transforming the panel estimates, andfinally calculating the proportion and quantity of metal abovethe different cut-offs. An SMU size was assumed based onthe selectivity achievable with the mining equipment. Atonnage adjustment factor was applied and was based on avolume representing half the SMU size. It was expressed as apercentage of the panel size (2.7%). Any proportions smallerthan this percentage were removed as they would not berecoverable in practice. The SMU estimates were then addedto the kriged block model in Datamine® Studio 3. The UCresults were compared with the kriged results and thetheoretical grade-tonnage curves (block average with andwithout the information effect – IEF). Overall, the UC curvescompared well with the theoretical curves – especially in thewell-informed domains, and the degree of selectivity achievedappeared reasonable. In Figure 13 the kriged curves areshown in black; the UC curve in blue, and the theoreticalcurves in red and green (without and with the informationeffect respectively). UC was not applied to the waste zone(dummy UC values were placed in the grade and proportionfields).
Model validation
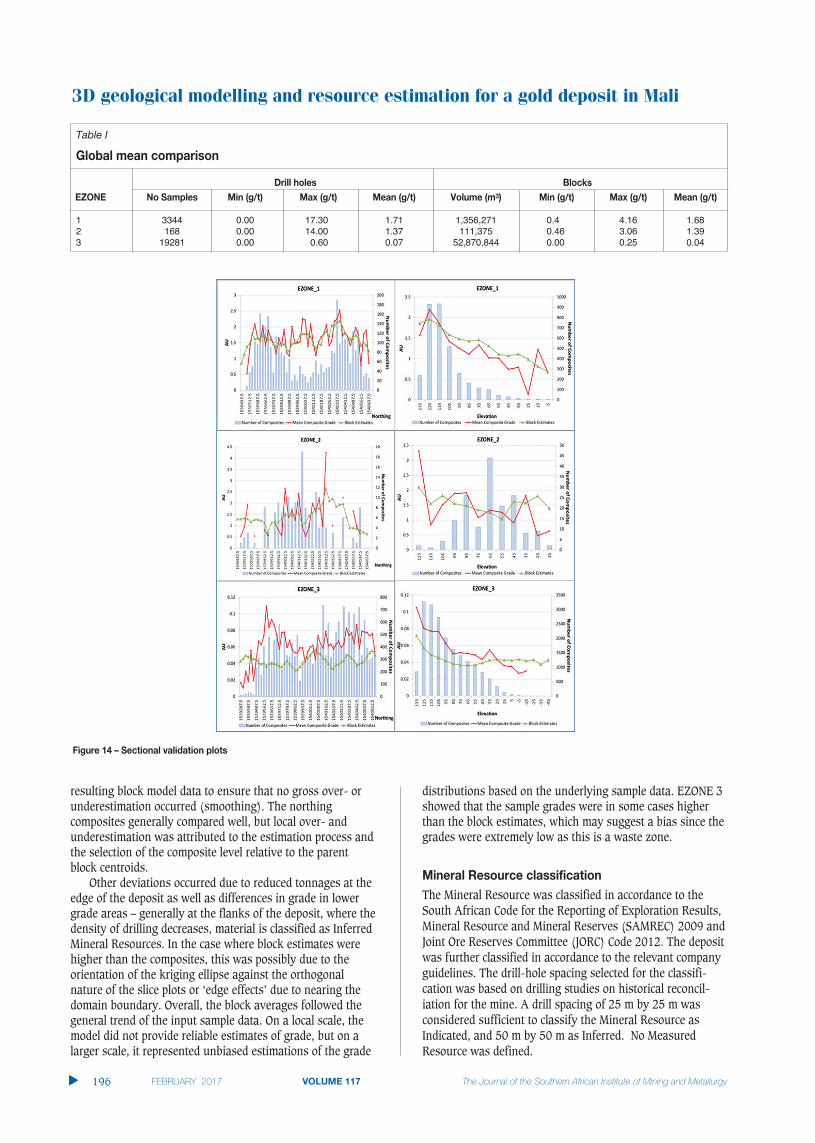
The block model estimates were validated by visuallycomparing the model estimates against input grades;comparing the global and input means; creating sectionalplots of number or composites, model grades, and compositegrades; and calculating grade-tonnage curves. Globally, themodel means for the ore zones were within 10% (± 2%) ofthe input data means (Table I), indicating that the estimatesare representative of the input data and thus acceptable.
Slice plots were generated for each estimated zone(EZONE). The input sample composite averages andcalculated block model grades were calculated on the eastings(vertical N-S slices) that correspond to the dimensions of theblock model block, which was 25 m thick (Figure 14). Thepurpose was to compare the input sample data with the
Figure 13—UC grade-tonnage curves shown with kriged and theoretical curves
3D geological modelling and resource estimation for a gold deposit in Mali
resulting block model data to ensure that no gross over- orunderestimation occurred (smoothing). The northingcomposites generally compared well, but local over- andunderestimation was attributed to the estimation process andthe selection of the composite level relative to the parentblock centroids.
Other deviations occurred due to reduced tonnages at theedge of the deposit as well as differences in grade in lowergrade areas – generally at the flanks of the deposit, where thedensity of drilling decreases, material is classified as InferredMineral Resources. In the case where block estimates werehigher than the composites, this was possibly due to theorientation of the kriging ellipse against the orthogonalnature of the slice plots or ‘edge effects’ due to nearing thedomain boundary. Overall, the block averages followed thegeneral trend of the input sample data. On a local scale, themodel did not provide reliable estimates of grade, but on a larger scale, it represented unbiased estimations of the grade
distributions based on the underlying sample data. EZONE 3showed that the sample grades were in some cases higherthan the block estimates, which may suggest a bias since thegrades were extremely low as this is a waste zone.
Mineral Resource classification
The Mineral Resource was classified in accordance to theSouth African Code for the Reporting of Exploration Results,Mineral Resource and Mineral Reserves (SAMREC) 2009 andJoint Ore Reserves Committee (JORC) Code 2012. The depositwas further classified in accordance to the relevant companyguidelines. The drill-hole spacing selected for the classifi-cation was based on drilling studies on historical reconcil-iation for the mine. A drill spacing of 25 m by 25 m wasconsidered sufficient to classify the Mineral Resource asIndicated, and 50 m by 50 m as Inferred. No MeasuredResource was defined.
s
196 february 2017 VOLUME 117 The Journal of the Southern African Institute of Mining and Metallurgy
Figure 14 – Sectional validation plots
Table I
Global mean comparison
Drill holes Blocks
EZONE No Samples Min (g/t) Max (g/t) Mean (g/t) Volume (m3) Min (g/t) Max (g/t) Mean (g/t)
1 3344 0.00 17.30 1.71 1,356,271 0.4 4.16 1.682 168 0.00 14.00 1.37 111,375 0.46 3.06 1.393 19281 0.00 0.60 0.07 52,870,844 0.00 0.25 0.04
Model reconciliation
The previous Mineral Resource model was compared with theupdated Mineral Resource model within a common volume toquantify the differences as a result of the model update.Grade-tonnage curves for the common volume were alsocalculated. Changes were ascribed mostly to the changes inthe interpretation of the mineralized envelopes, theestimation search parameters, and the general increase in thebulk densities assigned to the various rock types.
The detailed reconciliation study showed that the newMRE identified an additional 7191 ounces of Indicated(oxide) Mineral Resource, 1893 ounces of which waspreviously classified as Inferred. The increase was attributedto the extension of some of the mineralized zones and bettergrade continuity for others based on the updated geologicalmodel.
Conclusion
This study described the identification of additional oxide orepotential at a gold deposit in Mali based on 3D geologicalmodelling and geostatistical evaluation techniques asinformed by newly drilled advanced grade-control holes. Thefindings of the ten-step MRE process adopted revealed thatthe deposit contained an additional oxide Mineral Resource(7191 ounces) identified in the new 3D geological model.Due to the new drilling information, the geologicalunderstanding of the deposit was improved, making itpossible to better constrain the resource estimates within anew geological model. This included improvements in theinterpretation of the mineralized envelope in the areas wherethe drilling campaign provided new information. In someareas the continuity of the modelled mineralization wasextended, and in other areas the envelopes were constrainedto reduce the boundary waste that was previously included.The new data also allowed for the updating of variograms,estimation parameters, and top-capping applied. Potentialrisk to the model could originate from bias identified ingrade-tonnage curves which exists irrespective of theeffectiveness of the estimation process, as well as theinherent risk associated with geological uncertainty as aresult of not being able to completely capture the true natureof the geology. From the context of a conventional approachto 3D geological modelling and MRE, the results wereacceptable. However, to fully characterize the geologicaluncertainty, stochastic approaches to orebody modelling andestimation should be considered.
Acknowledgments
The authors express their gratitude to AngloGold AshantiLimited for permission to use all data and the relevantsoftware necessary for the project. Special thanks to Mr VasuGovindsammy (Evaluation Manager, AGA) and Miss EmiMaritz (Senior Evaluation Geologist, AGA) for theirassistance and support.
References
CLARK, I. 1979. Practical Geostatistics. Applied Science Publishers, Barking,
Essex. 129 pp.
DUKE, J.H. and HANNA, P.J. 2001. Geological interpretation for resource
modelling and estimation. Mineral Resource and Ore Reserve Estimation –
The AusIMM Guide to Good Practice. Edwards, A.C. (ed.). Australasian
Institute of Mining and Metallurgy, Melbourne. pp. 147–156.
GEOVARIANCES. 2015. Localized multivariate uniform conditioning.
http://www.geovariances.com/en/IMG/pdf/_GeovMining_LocalizedMultiva
riateUniformConditioning.pdf [Accessed 12 January 2015].
MASUREL, Q., THEBAUD, N., MILLER, J., and ULRICH, S. 2012. Tectonics, magma
generation and gold endowment: a study of the contrasting mineralization
styles in the world-class Sadiola gold camp, Mali, West Africa. Society of
Economic Geologists Conference: Building Exploration Capability for the
21st Century, Keystone, CO, 27-30 September 2014. Society of Economic
Geologists, Littleton, CO.
MASUREL, Q., THEBAUD, N., MILLER, J., STANISLAV, U., and OCKERT, T. 2012. The
world-class Sadiola gold camp, Mali, West Africa: Evidence for contrasting
styles of carbonate-hosted mineralisation within an orogenic gold
province. Proceedings of Gold14@Kalgoorlie, Kalgoorlie, WA, 8-10
October 2014. Australian Institute of Geoscientists.
https://www.google.co.za/url?sa=t&rct=j&q=&esrc=s&source=web&cd=16
&cad=rja&uact=8&ved=0CDEQFjAFOApqFQoTCO6xqJaE_sYCFQwcPgodmi
sD6w&url=http%3A%2F%2Fsjsresource.worldsecuresystems.com%2F_lite
rature_127582%2FBulletin_No_59_(Low_Res)&ei=KpG3Ve70C4y4-
AGa14zYDg&usg=AFQjCNGeInZfYf-
X094WxiMEadhio1tgkg&sig2=Uecf9ejxQuB8zwAKpAJ7Sg&bvm=bv.9871
7601,d.cWw [Accessed 10 June 2015].
NEUFELD, C.T. 2005. Guide to Recoverable Reserves with Uniform conditioning.
Guidebook Series, vol. 4. Centre for Computational Geostatistics (CCG),
Canada.
POCOCK, J.A. 2001. Why feasibility resource estimates under-valued the Peak
ore body. Mineral Resource and Ore Reserve Estimation – The AusIMM
Guide to Good Practice. Edwards, A.C. (ed.). Australasian Institute of
Mining and Metallurgy: Melbourne. pp. 299–314.
SCHOFIELD, N.A. 2011. Geological domaining and resource estimation – a
discussion. Proceedings of the 35th APCOM Symposium, Wollongong,
NSW. Australasian Institute of Mining and Metallurgy, Melbourne.
SAMREC. 2009. South African Mineral Resource Committee. The South African
Code for Reporting of Exploration Results, Mineral Resources and Mineral
Reserves (the SAMREC Code). 2007 Edition as amended July 2009. pp.
11-12. http://www.samcode.co.za/downloads/SAMREC2009.pdf
VANN, J., JACKSON, S., and BERTOLI, O. 2003. Quantitative kriging neighbourhood
analysis for the mining - a description of the method with worked case
examples. Proceedings of the 5th International Mining Geology
Conference, Bendigo, Vic, Australia. Australasian Institute of Mining and
Metallurgy, Melbourne. u
3D geological modelling and resource estimation for a gold deposit in Mali
The Journal of the Southern African Institute of Mining and Metallurgy VOLUME 117 february 2017 197 s

Page 1