uwfdm-1228 - Fusion Technology Institute - University of Wisconsin
73
• W I S C O N S I N • F U S I O N • T E C H N O L O G Y • I N S T I T U T E FUSION TECHNOLOGY INSTITUTE UNIVERSITY OF WISCONSIN MADISON WISCONSIN Triggered Steam Explosions of Molten Ferrosilicon Drops: Behavior of Solenoid-Driven and Pneumatic Impactors, Ability to Trigger the Explosions at Various Water Depths, Energetics of the Explosions, Fall Histories, Colloidal Material Deposited During the Explosions L.S. Nelson, P.W. Brooks, R. Bonazza, M.L. Corradini, K. Hildal November 2004 UWFDM-1228
Transcript of uwfdm-1228 - Fusion Technology Institute - University of Wisconsin

•
W I S C O N SI N
•
FU
SIO
N•
TECHNOLOGY• INS
TIT
UT
E
FUSION TECHNOLOGY INSTITUTE
UNIVERSITY OF WISCONSIN
MADISON WISCONSIN
Triggered Steam Explosions of Molten FerrosiliconDrops: Behavior of Solenoid-Driven and Pneumatic
Impactors, Ability to Trigger the Explosions at VariousWater Depths, Energetics of the Explosions, Fall
Histories, Colloidal Material Deposited During theExplosions
L.S. Nelson, P.W. Brooks, R. Bonazza,M.L. Corradini, K. Hildal
November 2004
UWFDM-1228

Triggered Steam Explosions of Molten Ferrosilicon Drops:
Behavior of Solenoid-Driven and Pneumatic Impactors,
Ability to Trigger the Explosions at Various Water Depths,
Energetics of the Explosions, Fall Histories,
Colloidal Material Deposited During the Explosions
L.S. Nelson, P.W. Brooks, R. Bonazza,M.L. Corradini, K. Hildal*
Fusion Technology InstituteUniversity of Wisconsin1500 Engineering Drive
Madison, WI 53706
http://fti.neep.wisc.edu
November 2004
UWFDM-1228
*Institute of Metallurgy, Norwegian University of Science and Technology,N-7491 Trondheim, Norway

ABSTRACT
We have initiated steam explosions of single drops of molten ferrosilicon (75 wt % Si) released at the liquidus temperature into water as they approached either a solenoid-driven or a pneumatic impactor. A submerged photodetector responded to the luminosity of the drops and activated either impactor after they had fallen to an appropriate distance above the impactor. We used a tourmaline transducer to characterize the pressure transients generated in water at various heights above both types of impactor. These procedures have allowed us to determine (a) the strength of the pressure transient needed to initiate the steam explosion of a single drop, and (b) the range of fall depths over which the drop can be triggered to explode with this transient. Drops with diameters of 11 mm can be triggered with 0.3 MPa pressure transients at depths between 150 mm and 400 mm in water at room temperature. Drops with diameters of 9 mm released similarly require trigger pulses of 1.3 MPa, but will explode at depths from 150 mm to at least 785 mm. Although the change of drop diameters probably causes these differences in behavior, the purity of the alloys used to prepare the drops may also play a role. Measurements of photographic images of the bubbles generated during the steam explosions indicate that the maximum energies released per gram of melt are about 23 J/g and 48 J/g for 11 mm- and 9 mm-diameter drops, corresponding to about 1% and 2% of the total enthalpy of the molten ferrosilicon at its liquidus temperature. Both energy releases decrease to about 8 J/g as the drops descend to depths just before they no longer can be triggered to explode. Video images show that ferrosilicon drops with diameters between 3 mm and 11 mm fall through water at about 0.5 m/s and suggest that 17 mm-diameter drops fall at about 2 m/s. Shutter wheel photography has shown: (a) instantaneous velocities that vary as the drops descend; (b) the onset of solidification of the drops; and (c) a steam explosion that occurred in a partially solidified drop. During a steam explosion, 10% to 20% of the weight of a molten ferrosilicon drop remains suspended in the water as a colloid. Attempts to analyze the suspended material gravimetrically, by inductively coupled plasma mass spectrometry and by X-ray diffraction have not been completely definitive. Most of the colloid seems to have the same composition as the starting material. Although the formation of hydrogen bubbles indicates that oxygen-containing combustion products must form during the explosions, as yet they have not been detected.

INTRODUCTION
Steam explosions of molten drops of ferrosilicon alloys (nominally 75 weight percent Si) have been studied at the University of Wisconsin since 1995, as documented by Nelson et al. (1996, 1997 and 1998a, b, c; see also Appendix A). This report describes the experimental work performed with these alloys during the period May 1, 1998, through October 31, 1998. Preliminary descriptions of this work have been presented in two informal letter reports prepared during 1998; the first was submitted on July 1, 1998, and covered the period May 1, 1998, through June 30, 1998 (Nelson et al., 1998b); the second was submitted on December 31, 1998, and covered the period July 1, 1998, through October 31, 1998 (Nelson et al., 1998c). In our 1997 experiments (Nelson et al., 1998a), we developed two devices for triggering the steam explosions of drops of molten ferrosilicon alloys as they fell freely in water: a hydrogen-oxygen combustion tube and a solenoid-driven mechanical impactor. Both devices generated upward-directed pressure transients from below the falling drops that destabilized the boiling film that surrounds the drops and thus initiated the steam explosions. Although the combustion tube is an excellent triggering source, the mechanical impactor was found to have a number of advantages detailed in the final report for the 1997 work (Nelson et al., 1998a). Because of these advantages, the mechanical impactor was selected as the triggering source for the 1998 experiments. As we performed the 1997 experiments and became more familiar with the impactor as a triggering source, it became clear that we needed: (a) Improved quantitative knowledge of the impactor’s performance to better understand how steam explosions of molten ferrosilicon drops are initiated, and (b) Stronger pressure transients to extend the range of triggering parameters that might be required to trigger both the large and small drops planned for the 1998 experiments.
In order to obtain quantitative information about the triggering pressures that were being applied to the drops when steam explosions occurred, we measured these transients with a tourmaline transducer obtained during 1998. These measurements are reliable and replace the incorrect preliminary estimates of the pressures generated by the impactor obtained with a quartz transducer during 1997. Also, we have extended our capabilities for generating pressure transients by developing a pneumatically driven impactor. This impactor can produce a range of pressure pulses that are stronger than those produced by the solenoid-driven impactor without introducing electrical noise that might interfere with transducer measurements in vicinity of the trigger generation source. The absence of electrical noise should provide an important advantage if it is decided to use the tourmaline transducer in future experiments to determine pressures generated by the steam explosions of the ferrosilicon drops. We have also improved our technique for triggering the steam explosions of these drops by using a photodetector submerged in the water. The optical axis of this photodetector is directed horizontally across the pneumatic impactor at a fixed height above it. When the falling luminous drop crosses this axis, the impactor is fired immediately. This exposes the drop to a known and reproducible pressure transient that is independent of the depth of the impactor in the water. We have also improved our capabilities for time-resolved imaging by (a) obtaining new video equipment, and (b) developing a procedure for recording time-exposed photographs through a rotating shutter wheel during the fall and explosion of the molten ferrosilicon drops after release into water. The primary objectives of the 1998 experiments were to determine the threshold triggering pressures and the maximum depths at which explosions could be triggered using ferrosilicon drops of two diameters—9 mm and 11 mm.
1
Steam explosions of 11 mm-diameter drops of molten ferrosilicon can be triggered with a pressure transient of 0.3 MPa at depths between 150 mm and 400 mm in room temperature water, but not at 450 mm or 500 mm. Drops with diameters of 9 mm (a) required a four-fold greater triggering transient, 1.3 MPa, to explode, and (b) could be triggered to explode at depths between 150 mm and the maximum depth of our chamber, 785 mm. We also learned that 9 mm-diameter drops could not be triggered at depths shallower than about 100 mm, probably due to the time required for (i) detachment and closure of the air bag that forms as the drop enters the water and/or (ii) the establishment of a stable boiling film around the hot drop. By examination of both video and time-resolved photographic images, we learned that the fall velocities are somewhat less than 0.5 m/s for drops with diameters between 3 mm and 11 mm; then, as the drop diameters increase to about 17 mm, the velocities seem to increase quickly to greater than 2 m/s. Time-exposed photographs recorded through a rotating shutter wheel show that instantaneous velocities of the drop can vary significantly as the drops descend. Moreover, these images sometimes show that the drop begins to tumble late in its fall, indicating the onset of solidification. In one of the photographs, the drop exploded after the tumbling began, indicating that steam explosions can be initiated in drops after they have begun to solidify. After a ferrosilicon drop explodes, the surrounding water always becomes cloudy with a colloidal material that settles very slowly. From the weight of the granular debris recovered, we learned that 10% to 20% of the weight of each drop remains suspended in the water after its explosion. This was confirmed approximately by boiling dry samples of the water that contained the colloid and weighing the residues. We also attempted to identify the residues by X-ray diffraction and to analyze the colloid-containing water with inductively coupled plasma mass spectrometry (ICPMS). Although these analyses are still preliminary, they suggest that the colloidal material is largely vaporized melt that had condensed in the water after the steam explosion of the drop, accompanied by a lesser amount of combustion product. (For the visit in May, 1998, of Drs. Trond Bergstrøm, Karl Forwald and Birger Andresen of SINTEF, Elkem and FeSil, respectively, we presented a two-day review and discussion of the research on the quenching and triggered steam explosions of molten ferrosilicon drops performed at the Department of Engineering Physics, University of Wisconsin-Madison during 1996 and 1997. An outline of the discussions is presented in Appendix B.)
2

EXPERIMENTAL
Transducer
To measure the pressure transients generated by our triggering sources, we used a tourmaline underwater blast transducer, Model W138A01033CY020AC, obtained from PCB Piezotronics, Inc., Depew, NY, USA. This pressure sensor has been designed for various marine applications where it is necessary to measure fast pressure transients at various depths in water. Its electrical leads are watertight and it is normally used suspended freely in the water, independent of structures or surfaces that might produce reflections or other extraneous pressure signals. It uses a tourmaline crystal disc 0.76 mm-thick x 3.8 mm OD as the pressure sensor. A significant advantage of tourmaline is that it is an isotropic piezoelectric material; that is, its response is independent of the direction from which the pressure transient impacts the crystal. This eliminates the need for accurate orientation of the crystal axes as is the case with, for example, quartz. In this transducer, the tourmaline crystal is enclosed in silicone oil that is encapsulated in a transparent plastic tube. The crystal and the signal and ground wires are shielded against electrical noise. These wires are attached to an in-line preamplifier located about 50 mm away from the crystal; it is also encapsulated in the oil in the same plastic tube. The transducer has a 6.2 m-long coaxial cable connected watertight on one end to the preamplifier and attached at the other end to a battery-powered signal conditioner; it, in turn, is connected via coaxial cable to the recording oscilloscope. The manufacturer’s specification sheet and diagram of the transducer are reproduced in Figure 1 and Figure 2. The transducer has been carefully calibrated by the manufacturer to reliable standards. The calibration certificate supplied with the transducer is shown in Figure 3. Note the strict linearity of the transducer, 0.89% of full scale, over the range 0 to 5000 psi (0 to 34.9 MPa). The sensitivity of this transducer is:
Sensitivity = 4.930 mV / psi or 715 mV / MPa
The certificate also indicates documentation of the manufacturer’s calibration. We started the measurements during May and June, 1998, with the transducer placed in shallow water, just a few millimeters beneath the surface. This depth was selected to duplicate the conditions used with the quartz transducer in the 1997 program (Nelson et al., 1998a). Later on, after July of 1998, we placed the transducer deeper in the water, at a depth of 300 mm, after we realized that better reproducibility of the measurements could be achieved with the transducer further away from the free water surface. Oscilloscope
We recorded the signals generated by the transducer with a Hewlett Packard Infinium 500 MHz / 1 GSa/s oscilloscope, Model 54815A, Serial No. US38130105. This instrument is brand new and was purchased during 1998 by another organization in the Department of Engineering Physics for shock tube studies. We were very fortunate to be able to borrow this costly high-speed instrument on an occasional basis. The oscilloscope is truly state-of-the-art instrumentation, with the ability to record four channels simultaneously. It is completely computerized with its own keyboard and mouse attached. Its output may be presented in many ways, including recording on a floppy disc to permit graphing with the Microsoft Excel Chart Wizard program. Pressure Transient Generators
Solenoid-Driven Impactor
The solenoid-driven impactor used early in the 1998 experiments has been described in detail by Nelson et al. (1998a). It consists of a weight driven upward by a 110 VAC electrical solenoid against a circular steel plate to produce the pressure transients. The solenoid and weight are mounted beneath the plate inside a cylindrical canister. The plate covers the upper end of the canister and seals it watertight, allowing the
3

4 4

entire unit to be submerged in the water. With the plate facing upward, activation of the solenoid causes the weight to impact the plate and send a pressure transient upward into the water. The transients generated this way have been used successfully to trigger steam explosions of freely falling drops of molten ferrosilicon when they were a few centimeters above the surface of the impactor, or just after they landed on it (Nelson et al., 1998a). We attempted to use the unit from the 1997 studies for a demonstration steam explosion experiment in May, 1998 (see Appendix B). We obtained erratic results, namely, when we released three drops of the melt under conditions identical to those that successfully produced explosions during the 1997 experiments, one drop did not explode, one exploded vigorously, while the third produced only a spongy mass.
5

When we disassembled the impactor, we discovered that moisture had entered the supposedly sealed canister and during 6 months of non-use had corroded the armature of the solenoid. We replaced the solenoid with a new one of the same make and model. The disassembled impactor fitted with the new solenoid and the corroded old solenoid are shown in Figure 4. The impactor with the new solenoid was used in the experiments described in this report.
6

Figure 4. Photograph of the solenoid-driven impactor used in this work. In the foreground, the corroded original
solenoid used in the 1997 work is shown after removal from the impactor. In the background, the impactor is shown with the new solenoid in place. (C-250-1)
Pneumatic Impactor
During the 1997 experiments, we realized that the solenoid-driven impactor can operate successfully only with applied voltages close to the rated 110 VAC. This strongly restricts the range of pressure transients that can be produced by this device. For the 1998 experiments, we studied the steam explosions of both 9 mm-diameter drops produced from 10 mm-diameter ferrosilicon rods, similar to those studied during 1996 and 1997, and drops of larger diameter produced from 16 mm diameter ferrosilicon rods. Because at the start of the 1998 work we felt that triggering of larger drops might require larger triggers, we set out to broaden the range of pressure transients that can be generated with the impactor technique. To accomplish this, we substituted a pneumatic piston for the solenoid to drive one of two different weights upward to impact the cover plate for the canister. The principle of operation is the same, but now we have several parameters that can be varied to alter the pressure transients—driving gas pressure, piston diameter and stroke, and the total weight that impacts the plate. Moreover, the nonelectrical nature of the pneumatic operation should eliminate or greatly reduce the electrical noise associated with the solenoid-driven impactor that can interfere with the sensitive electrical measurements of pressure signals with transducer-oscilloscope recording. In the redesigned impactor, we installed a stainless steel pneumatic piston within the canister in place of the solenoid, as shown in Figures 5 through 7. The piston has a diameter of 19 mm and a stroke of 26 mm. It also has a spring that retracts the extended cylinder when the unit is depressurized, allowing us to operate the cylinder with only one air line. The piston was obtained as Model 6W071 from the Speedaire Corporation. We attached to the piston one of two steel discs to act as hammer heads to impact the underside of the plate. The smaller was 15.9 mm OD x 16.7 mm tall and weighed 22.66 g, while the larger was 25.4 mm OD x 16.7 mm tall and weighed 62.53 g. (These weights are significantly lighter than the 408 g weight welded onto the heavy armature of the solenoid-driven impactor.)
7

Figure 5. The piston and its attachment to the plate are shown as used in the pneumatic impactor. The 22.66 g weight
has been threaded onto the driver rod. The piston is retracted in this photograph. (C-250-2)
The driver gas was air obtained from one of two sources: the compressed air supply of the Engineering Research Building, nominally at 90 psi (0.62 MPa); or a commercial cylinder of high pressure compressed air reduced with a regulator to pressures between 90 and 250 psi (0.62 MPa and 1.7 MPa). The cylinder gas was used with a ballast chamber of about 1 liter capacity. A high quality Bourdon dial gauge read the driver gas pressure. An electrical solenoid valve was used to actuate the pneumatic cylinder. The gas lines were 6 mm polypropylene tubing. The safe maximum operating pressure of this system was 300 psi (2.1 MPa), but we never exceeded 250 psi (1.7 MPa). In order to admit the gas line for the pneumatic impactor, we welded two ports through the side of the canister. (One of these is visible in Figure 7.) One line admitted the high pressure air to operate the piston, while the other allowed the small amount of air that leaked past the piston during each actuation to vent from the canister to the ambient atmosphere above the water level.
8

Figure 6. The piston and its attachment to the plate are shown as used in the pneumatic impact r. The 22.66 g weight
Materials
rosilicon Rods
sed rods of ferrosilicon (75 weight percent Si) received from SINTEF
or discussion in later sections, the compositions of rods from several other batches are also included in
ohas been threaded onto the driver rod. The piston is almost completely extended in this photograph. (C-250-2)
Fer
During the 1998 experiments, we uMaterials Technology, Trondheim, Norway. These rods were from three batches: 1A (16 mm-diameter) and 1C and B (both 10 mm-diameter) with the compositions shown in Table 1. These batches have low contents of Al and Ca and are considered to be “nonalloyed.” Note, however, that alloy B had significantly less Al and Ca than the alloys 1A and 1C, even though the amounts were quite low in all three alloys. We also performed a few experiments with miscellaneous 10 mm-diameter nonalloyed rods from batches F1/F2 and F8 that remained from our 1997 experiments; their compositions also have been included in Table 1. FTable 1. Experiments were not performed with these rods, however.
9

Figure 7. The piston and plate assembly and the canister used in the pneumatic impactor are shown before assembly.
The 22.66 g weight has been threaded onto the driver rod. The piston is almost completely extended in this photograph. One of the two ports for passing an air line through the wall of the canister is visible at the lower left of the photograph. (C-250-2)
Table 1. Ferrosilicon Rods Supplied by SINTEF Materials Technology, Trondheim, Norway
SINTEF Batch No.
UW No. Diameter (mm)
Si (wt.%) Fe (wt.%) Al (wt.%) Ca (wt.%)
F1/F2* C-121-1 10 73.8 25.1 <0.001 0.001 F7* C-133-1 10 73.8 25.0 0.020 0.011 F8* C-133-2 10 73.9 24.9 0.002 0.007 1A C-241-1c 16 74.4 24.8 0.06 0.03 3A C-241-1i 16 73.5 24.1 1.21 0.43 1C C-241-1e 10 74.5 24.8 0.05 0.03 B D-11-2 10 75.0 24.4 <0.01 0.013 C D-11-3 16 74.6 24.8 <0.01 0.013
* This material was supplied during 1997. Water
We used deionized water obtained from Lindsay Water Co., Madison, a local commercial bottler. Gases
We flushed the furnace and the fall path of the drops between the furnace outlet and the water with a mixture of 1% hydrogen in argon obtained from a high pressure cylinder. The mixture was prepared from commercial grade gases.
10

Support Materials
For most of the experiments performed during this reporting period, we used 0.5 mm-diameter Type 316 stainless steel wire to support the ferrosilicon rods in the furnace. In several experiments, we tried 0.5 mm-diameter 99.95% molybdenum wire (impurities in ppm: Al, 120; Ca, 10; Zr, 10; and Mg, 3) as a support because of its high melting temperature (2620 °C). We abandoned this material after several experiments because it alloyed with the ferrosilicon and left undesirable coatings both on the globules and inside the furnace. We also used a 3 mm graphite support rod inserted through a hole drilled with a diamond core drill perpendicular to the axes near the ends of short pieces of 10 mm ferrosilicon rods. Although we used the graphite as a support in only a few experiments, there was no discernible interaction between the graphite and the ferrosilicon at the furnace temperatures used (≈1450 oC); moreover, it seemed to have no effect on either the melting or (in a single experiment) on the triggering of explosions of the drops. Generation of Drops of Molten Ferrosilicon
These experiments were performed with the pendant drop generation and release technique described in the final report of the 1997 studies (Nelson et al., 1998a). All drops were allowed to fall spontaneously from the tip of the heated ferrosilicon rods. It should be noted that the pendant drop technique inherently produces drops at the liquidus temperature of the alloy (≈1320 oC). Consequently, all experiments reported here and in our previous work were performed with drops at or below the liquidus temperature. Triggering with a Submerged Photodetector
Since the beginning of our studies, spontaneous steam explosions have never been observed when drops of any of the ferrosilicon alloys were released into water. In the 1997 studies, however, we learned how to initiate explosions with pressure transients generated by small underwater hydrogen-oxygen explosions or with a submerged solenoid-driven impactor (Nelson et al., 1998a). Because of significant limitations of both the hydrogen-oxygen explosions and the solenoid-driven impactor, we turned to the encapsulated pneumatic impactor described above for triggering the drops during the 1998 work. This submerged unit generates nominally 0.3 MPa pressure transients at a distance of 100 mm above its surface, as measured with the tourmaline underwater blast transducer-oscilloscope combination, also described above. During the 1998 studies, we improved our earlier method of firing the triggering unit. In the 1997 experiments, we relied on the luminosity of each spontaneously released drop to activate a photodetector placed just beneath the lower end of the furnace tube. Activation of the photodetector then started a time delay relay that was set to fire the impactor at the time when the drop reached the desired depth for triggering. This procedure required considerable trial and error testing to achieve the correct firing delay to trigger the drop properly. We abandoned this method as too difficult to adjust for the various drop diameters and triggering depths required for the 1998 work. In the 1998 experiments, we fired the impactor when the luminous drop passed a waterproofed photodetector that was submerged in the water with its optical axis directed horizontally at a fixed distance above the surface of the impactor. (A schematic drawing of the submerged photodetector is shown in Figure 8; a photograph of the experimental arrangement is shown in Figure 9.) The magnitude of the pulses produced at the triggering axis could be varied by raising or lowering the photodetector above the surface of the impactor (indicated by the upper double-headed arrow in Figure 8). The axis of the photodetector then remained fixed at this position as the impactor was moved up and down in the water to vary the triggering depth (indicated by the lower double-headed arrow in Figure 8). This procedure always exposed the luminous drop to a constant and known pressure transient regardless of the depth of the impactor. (For
11

SiC Furnace Drop of Melt Falls From the Furnace
Adjust Triggering Depth
Adjust TriggeringPressure
Triggering Depth
Fall Path of theLuminous Drop
Support Debris
Catcher Pan
Transparent Interaction Chamber
Water Level
Impactor
Photodetector Axis Submerged Photodetector
Figure 8. Schematic diagram of the arrangement for triggering the steam explosion of a luminous molten drop with a
submerged photodetector and a pneumatic impactor. The pressure transient may be varied by moving the photodetector up and down (upper double-headed arrow); the triggering depth may be varied by moving the impactor up and down (lower double-headed arrow)
12

Figure 9. Photograph of the apparatus for triggering the steam explosion of a luminous molten drop with a submerged
ture studies in hot water, we also have obtained a fiber optic extension that will allow us to place the
ime-Resolved Imaging
new video components: a simple video monitor and two video cassette
photodetector (upper right) and a pneumatic impactor (lower center). The photodetector is mounted on one of the vertical fiducial bars. The separation between the bars (181 mm) is used to calibrate horizontal distances on photographs of the steam explosions. The separation between the washers fixed with nuts on the threaded bars (100 mm) provides the calibration of the photographs in the vertical direction. (C-272-1)
fuphotodetector outside the water chamber to protect it from thermal damage.) T
Video Imaging
During 1998, we obtained threerecorders (VCR’s) for single frame analyses of the tapes recorded with our camcorder. One of the VCR’s is a Mitsubishi HS-UG681 unit that moves frames forward or backward with a hand-held rotary dial controller at 10 frames per rotation. With the tapes produced with our camcorder, this VCR produces a time resolution of 30 f/s. This VCR is best suited for counting time intervals that involve many frames. We also
13

obtained a Panasonic PV-4611 VCR that advances frames one at a time with a pushbutton controller (it has no frame-by-frame reverse action, however). Although more difficult to operate in single frame mode, the Panasonic VCR has an important advantage: it produces a time resolution of 60 f/s with the same tapes that are viewed by the Mitsubishi VCR at only 30 f/s. The Panasonic VCR is better suited for counting shorter time intervals that involve only a few video frames. (The time resolutions of both VCR’s were determined by viewing the same taped image of the sweep second hand of a wall clock that had been recorded with our camcorder.) We have dedicated the monitor and both VCR’s to the laboratory in which these experiments are performed rather than relying on our previous procedure of viewing and analyzing our tapes at home with personal video equipment. Shutter Wheel Photography
s repo 7 and 1998a, c), our primary method for recording the behavior of
uring the 1998 experiments, we added a second 35 mm camera to record time-exposed images of the
eed Photography
High-sp empted during the 1998 program.
xamination of Solids
The ferrosilicon rods were examined before and after the experiments by length measurements with a
Granular Debris
term “debris” to refer to the granular materials that could be recovered
e investigated these materials by both weighing and with 35 mm photographs with calibration scales
Colloidal Debris
nerally disregarded the slow settling, cloudy material deposited in the
A rted earlier (Nelson et al., 199molten ferrosilicon drops as they fall through water has used time-exposed 35 mm photography in a darkened room. Although this technique produces high quality streak images, they yield very little information about what happens to the drops at various times during their fall. Dluminous ferrosilicon drops. We arranged this camera to view the experiments through a rotating five-bladed shutter wheel in order to obtain a time resolution of 83.3 ms per chop (12 chops per second) during the fall of the drop(s). The images produced this way show “dotted” tracks for the main drop as well as for any satellite or other secondary drops produced during the experiment. The second camera was placed to view the falling drops from a greater distance than the main camera in order to provide imaging over the entire fall distance of the drops. The images produced with the shutter wheel, a train of “dots,” complements the frame-by-frame video images in determining the velocities of motion and providing other information about the behavior of the various luminous particles as they fall through the water. The setup for shutter wheel photography is shown in Figure 10.
High-Sp
eed photography was not att E
Rods
caliper, by changes of weights and with 35 mm photography. We included an appropriate calibration scale in each 35 mm photograph to determine dimensions of the rods.
In our earlier work, we used the from the catcher pan within a few hours after each experiment. These materials included solidified drops that had not exploded and coarse or fine material from drops that had completely or partially exploded. Wincluded in the images. These materials have also been archived for future studies.
During our earlier studies, we gewater after the explosion of each drop (negligible amounts were formed if the drop did not explode). During the 1998 experiments, however, we began to look at this material more carefully after we realized that a large fraction (10% to 20%) of the weight of each drop that exploded remained suspended in the water as a colloid, and did not settle out for many hours.
14

Figure 10. Rotating shutter wheel and 35 mm camera used to record time-resolved photographs of a luminous
ferrosilicon drop as it falls through water. (C-268-1) In the 1998 program, we initiated preliminary investigations of this material (a) with inductively coupled plasma mass spectrometry (ICPMS) (Jarvis et al., 1992) by directly injecting the colloid-containing water into the spectrometer, (b) by weighing the material that remained after known amounts of the colloid-containing water had been boiled dry, and (c) by X-ray diffraction of the material that remained after the colloid-containing water had been boiled dry.
15

RESULTS
Measurement of Pressure Transients
In the 1998 experiments, we positioned the tourmaline transducer horizontally, with the pressure sensing element (see Figure 2) at one of two locations: (a) in shallow water, just a few millimeters beneath the surface of the water, and (b) in deep water, at a depth of 300 mm. At the beginning of the 1998 measurements, location (a) was selected to duplicate the sensor position used with the quartz transducer in the 1997 experiments (Nelson et al., 1998a). (Only the tip of the transducer could be placed in the water in those experiments because the quartz unit was not waterproofed and would have shorted out if immersed more deeply.) Location (b) was used later after we began to realize that measurements in the shallow water were less reproducible than those made in deeper water.
Solenoid-Driven Impactor
We used the new tourmaline transducer to measure the pressure transients generated by the solenoid-driven impactor (the new solenoid was installed for these measurements). We placed the transducer in shallow water, a few millimeters below the water level, and the surface of the impactor 102 mm beneath it in the water. Using the Infinium oscilloscope, we recorded the maximum pressures produced in ten repeat trials. The data are presented in Table 2, and one oscilloscope trace from the sequence (Trial No. 2) is shown in Figure 11. The maximum pressures from Table 2 are shown in the graph presented in Figure 12. It should be noted from Table 2 and Figure 12 that the average peak pressure generated at 102 mm by the impactor (fitted with the new solenoid) is 0.129 ± 0.023 MPa (±18%). Pneumatic Impactor
We made similar measurements of the peak pressures generated by the pneumatic impactor. As in the previous section, we placed the transducer in shallow water, a few millimeters below the water level, and the surface of the impactor 102 mm beneath it in the water. A typical oscilloscope trace recorded in this sequence of measurements is shown in Figure 13. In Figure 14, we have plotted the averaged maximum pressures (10 to 12 measurements were averaged for each point) recorded using several driving gas Table 2. Transients generated in water with the solenoid-driven impactor measured with the tourmaline transducer placed a few millimeters beneath the surface of the water and with the surface of the impactor 102 mm below it. Recorded as Vmax's with the Infinium oscilloscope. Distance Vmax Pmax (mm) Trial No. (mV) (MPa) Remarks 102 1 80.0 0.1119 2 130.4 0.1824 Oscilloscope Trace 3 101.9 0.1425
4 86.0 0.1203 5 82.4 0.1152 6 102.8 0.1438 7 73.8 0.1032 8 70.5 0.0986 9 90.3 0.1263 10 93.8 0.1312 11 84.0 0.1175 12 106.4 0.1488 Average 0.1285
St. Dev. ±0.0232 Percent ±18
16

Figure 11. Typical oscilloscope trace recorded when the tourmaline transducer was impacted at 102 mm with a
pressure pulse generated by the solenoid-driven impactor. The transducer was placed a few millimeters beneath the surface of the water with the surface of the impactor 102 mm below. The vertical scale is 50 mV / large division; the horizontal scale is 500 µs / large division. (C-256-1 #2)
pressures between 90 psi (0.6 MPa) and 250 psi (1.7 MPa) and hammer heads that had two different weights, 22.66 g and 62.53 g. Note that at the lower air pressures, between about 90 psi (0.6 MPa) and 125 psi (0.9 MPa), the peak pressures for both hammer heads are moderately high at 0.3 to 0.4 MPa and reasonably reproducible. But at the higher driving gas pressures, the averages are higher, ranging between about 0.4 and 0.8 MPa with considerable scatter of the maximum pressures. In Figure 15, we show three sets of measurements with the tourmaline transducer. (In all three sets of measurements, we placed the transducer a few millimeters below the water level, and the surface of the impactor 102 mm beneath it in the water.) The upper two sets of points were produced with the pneumatic impactor, both with a driver gas pressure of 185 psi (1.3 MPa). The upper set of points was generated with a 62.53 g weight attached to the pneumatic piston, while the middle set of points was produced with a 22.66 g weight attached. The lower data points were generated with the solenoid-driven impactor and were taken from Figure 12. We have noted in Figure 15 the averaged values of the two sets of measurements made with the pneumatic impactor: 0.428 ± 0.060 MPa (±14%) for the data produced with the heavier weight and 0.334 ± 0.049 MPa (±14%) with the lighter weight. Notice that the averaged peak pressures generated by the pneumatic impactor are 2 to 3 times greater than the averaged peak pressure of 0.129 ± 0.023 MPa (± 18%) generated by the solenoid-driven impactor.
17

0.00
0.02
0.04
0.06
0.08
0.10
0.12
0.14
0.16
0.18
0.20
0 2 4 6 8 10 12 14
Trial Number
Max
imum
Pre
ssur
e in
Mpa
Average: 0.129 +/- 0.023 Mpa (18%)
Figure 12. Pressure transients generated in water with the solenoid-driven impactor (new solenoid was installed). The tourmaline transducer was placed a few millimeters beneath the surface of the water with the surface of the impactor 102 mm below. (C-256-1)
Thresholds for Triggering Steam Explosions
Drops Released from 16 mm Rods
During the first part of the 1998 experiments, we generated drops from ferrosilicon rods that were 16 mm in diameter. The rods were taken from Batch 1A. As indicated in Table 1, these rods have a composition that we consider “nonalloyed”, that is, with low concentrations of Al and Ca. (During our work in 1997, we also were able to trigger steam explosions with alloys that had low concentrations of Al and Ca, but not with alloys that had higher concentrations of these elements (Nelson et al., 1998a).) We performed 14 experiments with these rods, as summarized in Tables 3a and 3b. (The data in Table 3a have been rearranged according to increasing triggering depth in Table 3b.) The luminous drops were released at their liquidus temperature into our 1 m-deep chamber filled with deionized water at room temperature (20 °C to 22 °C). Spontaneous explosions never occurred with these drops. Our first observation with these new, larger rods was that the diameters of the drops of molten ferrosilicon that fell spontaneously from the16 mm-diameter rods were only 11 mm. (This diameter is based on the weight of 2.14 ± 0.14 g, averaged over 25 unexploded globules, using a density for the molten alloy of 3.2
18

Figure 13. Typical oscilloscope trace recorded when the tourmaline transducer was impacted at 102 mm with a
pressure pulse generated by the pneumatic impactor. The tourmaline transducer was placed a few millimeters beneath the surface of the water with the surface of the impactor 102 mm below. The vertical scale is 200 mV/ large division; the horizontal scale is 500 µs / large division. (C-260-1 #11)
g/cc (Forwald, 1991).) This was disappointing because we had expected the drop diameters to be roughly proportional to the rod diameters. Thus, because the 10 mm-diameter rods used during the 1997 studies produced 9 mm-diameter drops of melt, we anticipated drops nearer to 16 mm in diameter to form from the 16 mm-diameter rods. We did increase the weights of the drops about 1.5-fold, however, by using the larger rods. As they fell to various depths in the water, the drops were exposed to triggering pulses of 0.322 MPa generated by always directing the axis of the submerged photodetector horizontally 100 mm above the surface of the pneumatic impactor. The triggering level (that is, the optical axis of the photodetector) was positioned at depths in the water from 150 mm to 500 mm, achieved by placing the surface of the impactor 250 mm to 600 mm deep in the water. The arrangement for the triggering has been shown in Figures 8 and 9. Nine explosions were triggered during the 14 experiments with the 11 mm drops. (Because we observed small amounts of slag to form at the tips of the 16 mm-diameter rods when the melting first began, we did not trigger the first of the 11 mm drops released; instead, the trigger was fired for the second and subsequent drop releases.) As indicated in Tables 3a and 3b, explosions could be triggered with the photodetector axis at all depths between 150 mm and 400 mm; at this latter depth, however, only 2 of 5 drops exploded. No explosions could be triggered at 450 mm or at 500 mm. We concluded, then, that 11 mm-diameter drops of Alloy 1A can be triggered to explode in room temperature water between 150 mm and a maximum depth of 400 mm.
19

0.0
0.1
0.2
0.3
0.4
0.5
0.6
0.7
0.8
0.9
0 50 100 150 200 250 300
Driving Gas Pressure in psi
Ave
rage
d M
axim
um P
ress
ure
in M
pa
62.53 g, C-260-X62.53 g, C-263-X22.66 g, C-258-X
Figure 14. Pressure transients generated in water with the pneumatic impactor as a function of driving gas pressure. Two weights were used: 22.66 g and 62.53 g. The tourmaline transducer was placed a few millimeters beneath the surface of the water with the surface of the impactor 102 mm below.
Time-exposed photographs of the eight explosions and the two non-explosions at 450 mm and 500 mm are shown in Figures 16a through 16j. The photographs are arranged in order of increasing triggering depths. Drops Released from 10 mm Rods
In order to investigate the effects of drop diameter on the thresholds for triggering, we returned to 9 mm-diameter drops released spontaneously from 10 mm-diameter rods. (This diameter is based on the weight of 1.34 ± 0.10 g, averaged over 38 unexploded globules, using a density for the molten alloy of 3.2 g/cc (Forwald, 1991).) At the time we started these experiments, we had an uncertain supply of 10 mm-diameter nonalloyed rods. First, we attempted experiments with 10 mm-diameter ferrosilicon rods from Batch 1C, as summarized in Table 4. These rods were very brittle and often broke when we tried to grind the groove in which the support wire is wound. (We had only minimal breakages with the 10 mm-diameter nonalloyed rods from Batches F1/F2, F7 and F8 used during the 1996 and 1997 studies (Nelson et al., 1998a).) As a result, we were obliged to work with a few lengths of the rods from Batch 1C that were only about 50 mm long. These rods were shorter than we felt could be suspended reliably with the Type 316 stainless steel wire used with the 16 mm-diameter rods from Batch 1A early in the 1998 experiments and with the other 10 mm-diameter rods used in the 1996 and 1997 studies. (If the rod is too short, it sometimes becomes necessary to
20

0
0.1
0.2
0.3
0.4
0.5
0.6
0 2 4 6 8 10 12 14
Trial Number
Max
imum
Pre
ssur
e in
Mpa
Pneumatic, 185 psi, 22.66 g, C-258-6Solenoid, C-256-1Pneumatic, 185 psi, 62.53 g, C-263-3
Average: 0.129 +/- 0.023 Mpa (18%)
Average: 0.428+/- 0.060 Mpa (14%)Average: 0.334 +/- 0.046 Mpa (14%)
Figure 15. Comparison of the pressure transients generated in water with the solenoid-driven and the pneumatic impactors operated at an air pressure of 185 psi. Two weights were used: 22.66 g and 62.53 g. The tourmaline transducer was placed a few millimeters beneath the surface of the water with the surface of the impactor 102 mm below.
lower the stainless steel wire too near the hot zone of the furnace; this causes the wire to melt, allowing the rod to fall before the desired drops are released.) In the attempt to find an alternate support material, we performed two experiments using 0.5 mm Mo support wires because of its high melting temperature (2620 °C) (these experiments are summarized in Table 4). It was a reliable support, allowing us to hold rods as short as 47 mm without falling at the furnace temperature of about 1450 °C. Unfortunately, the Mo wire: (a) reacted at high temperature with the ferrosilicon rod to form a shiny, well-wetted weld in the groove where the Mo contacted the alloy; (b) produced a blue coloration on the solidified drops recovered after the experiments; (c) seemed to produce a white deposit on the inside of the furnace tube; and (d) produced drops that did not explode. (As with the 11 mm-diameter drops, we used triggers of 0.322 MPa produced by positioning the axis of the photodetector 100 mm above the surface of the pneumatic impactor, with triggering depths of 150 mm (D-3-1) and 300 mm (D-1-1). The latter condition was thought to be the same as that used for triggering in the 1997 experiments with the solenoid-driven impactor (Nelson et al., 1998a).) We hypothesized that perhaps the Mo wire was somehow preventing the explosion. We abandoned the Mo wire and returned to Type 316 stainless steel support wire. We tried one experiment (D-4-1) with a 10 mm-diameter rod that remained from the 1997 studies (Nelson et al., 1998a). It was from the Batch F8 (see Table 1) that had produced good explosions in 1997. We used the triggering depth of 300 mm and the same 0.322 MPa pulse produced when the impactor was 100 mm below the photodetector axis.
21

22
Table 3a. Summary of Releases of 11 mm Drops of Nonalloyed Molten Ferrosilicon into WaterExperiments were triggered with the pneumatic impactor; air pressure was 185 psi.
T(water) T(furnace) Furnace Rod Loss Debris Difference Depths (mm) Type of Nature ofNumber Expt. No. Alloy (oC) (oC) Atm. Wt (g) Wt. (g) (g) Impactor Triggering Interaction Debris Imaging Remarks
1 C-274-1 1A No. 1 21.4 1450 Ar + 1%H2 11.5 11.21 0.29 400 300 Explosion Powder OS, VCR New rod. #1 exploded with lights on, VCR only. #'s 2-5 triggd, no explosions.
2 C-276-1 1A No. 1 22.3 (New) 1450 Ar + 1%H2 2.27 2.3 0.03 350 250 None Spherule OS, VCR #1 and tiny spherule fell spontaneously. Trigger fired about 5 s later. Fresh DI water.
3 C-278-1 1A No. 1 22.1 1450 Ar + 1%H2 4.45 3.91 0.54 250 150 Explosion Powder OS, VCR #1, triggd, coarse frag. #2 triggd, BIG explosion threw water 2 m.
4 C-280-1 1A No. 1 22.3 1450 Ar + 1%H2 4.07 3.36 0.71 250 150 Explosion Powder OS, VCR Large explosion; threw water 2 m. OS image is asymmetric.
5 C-282-1 1A No. 2 22.5 (New) 1448 Ar + 1%H2 6.93 6.51 0.42 300 200 Explosion Powder OS, VCR New rod. #1 untriggd, #2 triggd, no explosions; # 3 triggd, explos., threw H2O. New H2O.
6 C-284-1 1A No. 2 23.0 1450 Ar + 1%H2 6.94 6.64 0.30 350 250 Explosion C. Powder OS, VCR #1 untrigg'd, no explosion; #2, trigg'd, no explosion; #3 trigg'd, exploded.
7 C-286-1 1A No. 2 22.2 1450 Ar + 1%H2 4.57 4.19 0.38 400 300 Explosion Powder OS, VCR #1 untrigg'd, no explosion; #2 trigg'd, vigorous explosion; threw water.
8 C-288-1 1A No. 2 20.9 1465 Ar + 1%H2 4.43 4.01 0.42 500 400 Explosion Powder OS, VCR #1 untrigg'd, no explosion; #2 trigg'd. and exploded. No water thrown.
9 C-290-1 1A No. 2 21.5 1455 Ar + 1%H2 4.34 4.51 -0.17 600 500 None V. Coarse OS, VCR #1 untrigg'd, #2 trigg'd; no explosion; then rod fell. SS wire embedded in rod.
10 C-292-1 1A No. 3 21.5 1455 Ar + 1%H2 9.23 9.24 -0.01 550 450 None Globules OS, VCR New rod. #1 untrigg'd, #'s 2, 3, 4 trigg'd; no explosions.
11 C-294-1 1A No. 3 21.5 1460 Ar + 1%H2 9.26 9.24 0.02 500 400 None Coarse Frg OS, VCR #1 untrigg'd, #'s 2,3 and 4 trigg'd; no explosions. ERB gas. Transitional debris.
12 C-296-1 1A No. 3 21.5 1465 Ar + 1%H2 4.74 4.45 0.29 300 200 Explosion Powder OS, VCR #1 untrigg'd, #2 trigg'd, exploded moderately. No water thrown. ERB gas mixture.
13 C-298-1 1A No. 4 22.3 1450 Ar + 1%H2 4.70 4.33 0.37 500 400 Explosion C. Powd. OS, VCR New rod is odd. #1 untrigg'd, #2 trigg'd, moderate explosion. No water thrown. ERB gas.
14 C-300-1 1A No. 4 22.6 1450 Ar + 1%H2 4.42 4.59 -0.17 600 500 None Globules OS, VCR #1 untrigg'd, #2 trigg'd; no explosion; then rod fell. SS wire embedded in rod. ERB gas.

Table 3b. Summary of Releases of 11 mm Drops of Nonalloyed Molten Ferrosilicon into WaterExperiments were triggered with the pneumatic impactor; air pressure was 185 psi.
T(water) T(furnace) Furnace Rod Loss Debris Difference Depths (mm) Type of Nature ofNumber Expt. No. Alloy (oC) (oC) Atm. Wt (g) Wt. (g) (g) Impactor Triggering Interaction Debris Imaging Remarks
3 C-278-1 1A No. 1 22.1 1450 Ar + 1%H2 4.45 3.91 0.54 250 150 Explosion Powder OS, VCR #1, triggd, coarse frag. #2 triggd, BIG explosion threw water 2 m.
4 C-280-1 1A No. 1 22.3 1450 Ar + 1%H2 4.07 3.36 0.71 250 150 Explosion Powder OS, VCR Large explosion; threw water 2 m. OS image is asymmetric.
5 C-282-1 1A No. 2 22.5 (New) 1448 Ar + 1%H2 6.93 6.51 0.42 300 200 Explosion Powder OS, VCR New rod. #1 untriggd, #2 triggd, no explosions; # 3 triggd, explos., threw H2O. New H2O.
12 C-296-1 1A No. 3 21.5 1465 Ar + 1%H2 4.74 4.45 0.29 300 200 Explosion Powder OS, VCR #1 untrigg'd, #2 trigg'd, exploded moderately. No water thrown. ERB gas mixture.
2 C-276-1 1A No. 1 22.3 (New) 1450 Ar + 1%H2 2.27 2.3 0.03 350 250 None Spherule OS, VCR #1 and tiny spherule fell spontaneously. Trigger fired about 5 s later. Fresh DI water.
6 C-284-1 1A No. 2 23.0 1450 Ar + 1%H2 6.94 6.64 0.30 350 250 Explosion C. Powder OS, VCR #1 untrigg'd, no explosion; #2, trigg'd, no explosion; #3 trigg'd, exploded.
1 C-274-1 1A No. 1 21.4 1450 Ar + 1%H2 11.5 11.21 0.29 400 300 Explosion Powder OS, VCR New rod. #1 exploded with lights on, VCR only. #'s 2-5 triggd, no explosions.
7 C-286-1 1A No. 2 22.2 1450 Ar + 1%H2 4.57 4.19 0.38 400 300 Explosion Powder OS, VCR #1 untrigg'd, no explosion; #2 trigg'd, vigorous explosion; threw water.
8 C-288-1 1A No. 2 20.9 1465 Ar + 1%H2 4.43 4.01 0.42 500 400 Explosion Powder OS, VCR #1 untrigg'd, no explosion; #2 trigg'd. and exploded. No water thrown.
11 C-294-1 1A No. 3 21.5 1460 Ar + 1%H2 9.26 9.24 0.02 500 400 None Coarse Frg OS, VCR #1 untrigg'd, #'s 2,3 and 4 trigg'd; no explosions. ERB gas. Transitional debris.
13 C-298-1 1A No. 4 22.3 1450 Ar + 1%H2 4.70 4.33 0.37 500 400 Explosion C. Powd. OS, VCR New rod is odd. #1 untrigg'd, #2 trigg'd, moderate explosion. No water thrown. ERB gas.
10 C-292-1 1A No. 3 21.5 1455 Ar + 1%H2 9.23 9.24 -0.01 550 450 None Globules OS, VCR New rod. #1 untrigg'd, #'s 2, 3, 4 trigg'd; no explosions.
9 C-290-1 1A No. 2 21.5 1455 Ar + 1%H2 4.34 4.51 -0.17 600 500 None V. Coarse OS, VCR #1 untrigg'd, #2 trigg'd; no explosion; then rod fell. SS wire embedded in rod.
14 C-300-1 1A No. 4 22.6 1450 Ar + 1%H2 4.42 4.59 -0.17 600 500 None Globules OS, VCR #1 untrigg'd, #2 trigg'd; no explosion; then rod fell. SS wire embedded in rod. ERB gas.
23

24
o a triggering transient with -280-1). (b) (Right) Triggering
Again, none of the drops exploded. And the frozen ent in
inated the furnace and
pe 316 stainless steel support wire wound into a pted another experiment
produced explosions with 9 mm-ng depth, 0.322 MPa pulse (Nelson et al., 1998a)).
but again, no explosions occurred (see Table 4 for m-diameter drops produced
explosions under the conditions we were of rods from Batch 1C,
ine whether there actually was over, we did not investigate further whether the Mo
F1/F2 (see Table 1) that were too short. We used a new
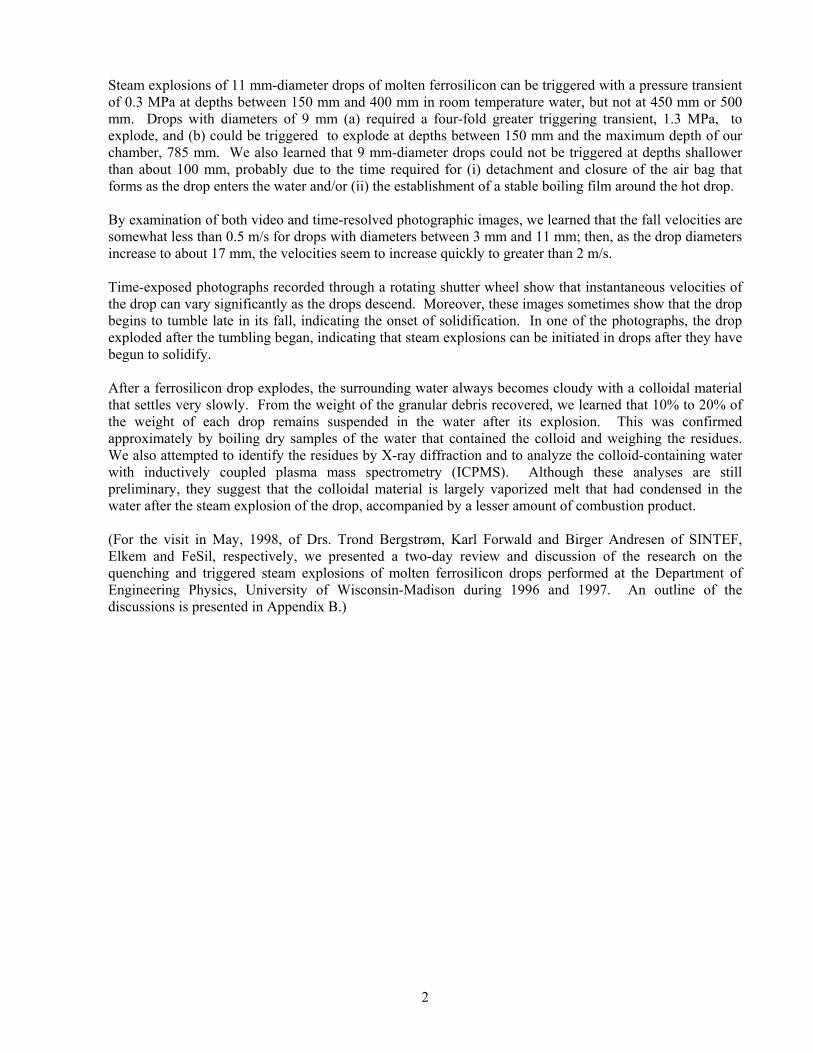
Figure 16. Time-exposed images of 11 mm-diameter drops of molten alloy 1A exposed t
peak pressure of 0.3 MPa. (a) (Left) Triggering depth was 150 mm. (Cdepth was 150 mm. (C-278-1-2). Vertical fiducial rods are 181 mm apart.
Three drops were released several minutes apart. globules recovered after this experiment also had the blue color observed in the previous experimwhich Mo support wire had been used. We hypothesized that the Mo had contamagain might be preventing the explosions. Next, we replaced the furnace tube and returned to the Tygroove that we were able to form with great care in a rod from Batch 1C. We attem(D-5-1) with triggering conditions identical to those that successfullydiameter nonalloyed drops during 1997 (150 mm triggeriWe were able to release 4 drops several minutes apart,details). At this point we began to suspect difficulties inherent with the 10 mfrom the ferrosilicon rods from Batch 1C that prevented steamusing. Unfortunately, due to the breakages, we had exhausted the usable lengthsand could not proceed further with this material. We were unable to determan inherent inability for the drops to explode. Moresupport wires made a difference in the ability to initiate explosions. Next, we tried two experiments (D-7-1 and D-8-1) with 10 mm rods from Batch were supplied for the 1997 program but had been put aside because they
gure 16. Time-exposed images of 11 mm-diameter drops of molten alloy 1A exposed to a triggering transient with
s steel wire. The resulting graphite holder was, in effect, an xtension of the rod that kept the stainless steel wire above the hot zone of the furnace where it did not melt.
e depth, 150 mm, but with twice the iggering pulse (see Table 4).
Fipeak pressure of 0.3 MPa. (c) (Left) Triggering depth was 200 mm. (C-296-1-2). (d) (Right) Triggering depth was 200 mm. (C-282-1-3). Vertical fiducial rods are 181 mm apart.
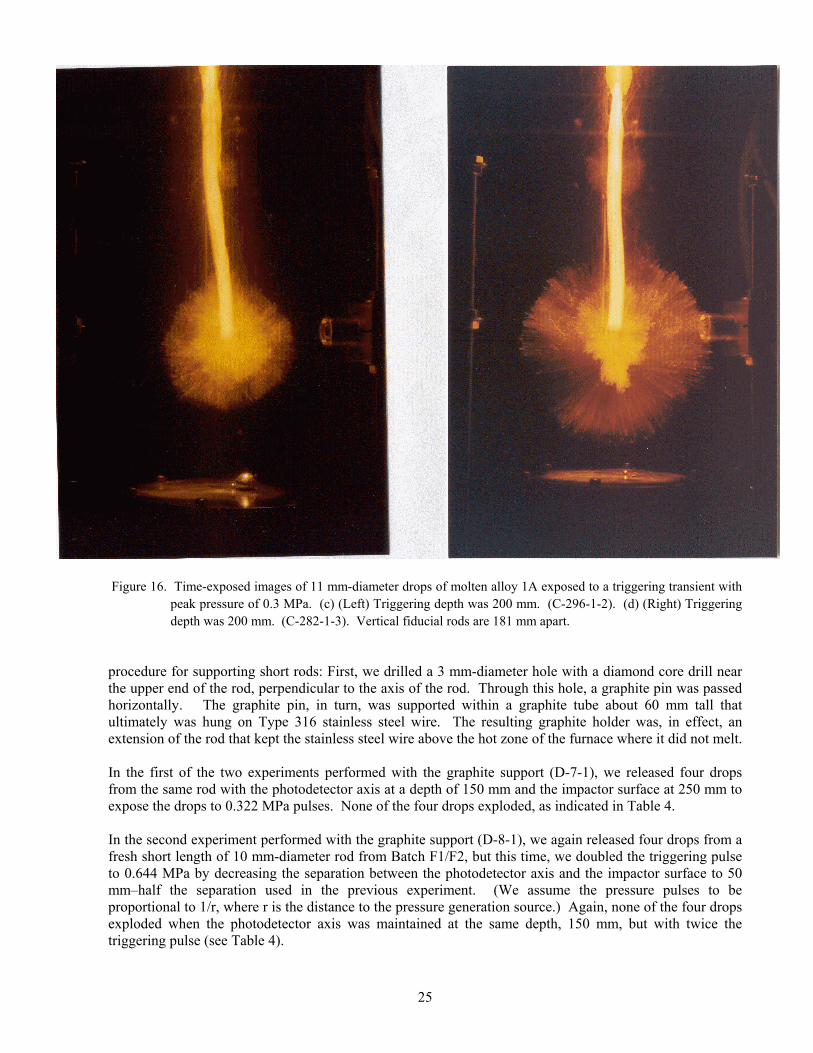
procedure for supporting short rods: First, we drilled a 3 mm-diameter hole with a diamond core drill near the upper end of the rod, perpendicular to the axis of the rod. Through this hole, a graphite pin was passed horizontally. The graphite pin, in turn, was supported within a graphite tube about 60 mm tall that ultimately was hung on Type 316 stainlese In the first of the two experiments performed with the graphite support (D-7-1), we released four drops from the same rod with the photodetector axis at a depth of 150 mm and the impactor surface at 250 mm to expose the drops to 0.322 MPa pulses. None of the four drops exploded, as indicated in Table 4. In the second experiment performed with the graphite support (D-8-1), we again released four drops from a fresh short length of 10 mm-diameter rod from Batch F1/F2, but this time, we doubled the triggering pulse to 0.644 MPa by decreasing the separation between the photodetector axis and the impactor surface to 50 mm–half the separation used in the previous experiment. (We assume the pressure pulses to be proportional to 1/r, where r is the distance to the pressure generation source.) Again, none of the four drops exploded when the photodetector axis was maintained at the samtr
25

Figure 16. Time-exposed images of 11 mm-diameter drops of molten alloy 1A exposed to a triggering transient with
peak pressure of 0.3 MPa. (e) (Left) Triggering depth was 250 mm. (C-284-1-3). (f) (Right) Triggering depth was 300 mm. (C-286-1-2). Vertical fiducial rods are 181 mm apart.
At this stage of the experimentation, we had become quite confused about our inability to produce explosions of drops produced from 10 mm-diameter rods. Not only were we failing to reproduce the 1997 results, but we had also run out of 10 mm nonalloyed rods. In September of 1998, we received a new supply of nonalloyed 10 mm-diameter rods from SINTEF Materials Technology, Trondheim, Norway. We selected the set of 9 rods labeled Batch B for the
he small amounts of slag to form at the tips of the 10 mm-diameter rods
remaining experiments performed in 1998. These rods had been prepared from a highly pure source of iron, resulting in an impurity content significantly lower than that of the 16 mm-diameter rods from Batch 1A used earlier in the 1998 experiments, as indicated in Table 1. We decided to return to the stainless steel support wires but now to pass the wire through a 3 mm hole diamond-drilled though the upper end of each rod rather than winding it into a groove ground in the rod. This new and gentler procedure for attaching the support wire resulted in fewer broken rods. We used rods from Batch B to perform the final 10 experiments during 1998; each was performed with multiple drops released spontaneously several minutes apart. These experiments are summarized in Table 4. (Because we did not observe t
26

Figure 16. Time-exposed images of 11 mm-diameter drops of molten alloy 1A exposed to a triggering transient with
peak pressure of 0.3 MPa. (g) (Left) Triggering depth was 400 mm. (C-288-1-2). (h) (Right) Triggering depth was 400 mm. (C-298-1-2). Vertical fiducial rods are 181 mm apart.
from Batch B when the melting first began as we did with the 16 mm-diameter rods from Batch 1A, the trigger was set to fire for all drop releases.) With experiments D-11-4 and D-12-1, we continued to use triggering pulses of 0.622 MPa with the axis of the submerged photodetector placed 50 mm above the surface of the impactor and with the triggering axis at a depth of 150 mm. Of the six drops released under these conditions, one exploded. This suggested that we might be close to a threshold for the triggering pulse.
e then doubled the triggering pulse a second time by fuW rther decreasing the distance between the
00 mm to 785
tal effect on the experiment or the explosions of the drops.)
photodetector axis and the surface of the impactor to 25 mm. If the 1/r relationship holds, this should produce pulses of 1.288 MPa–four times greater than those measured to be 0.322 MPa with the tourmaline transducer at 100 mm. We then performed eight experiments with these triggering conditions. As ndicated in Table 4, the photodetector axis was placed at various water depths ranging from 1i
mm (bottom). (We refer to the latter depth as the “bottom” because it was the deepest we could position the photodetector axis and still retain it 25 mm above the impactor when it and the catcher pan rested on the bottom of the water chamber (see Figures 8 and 9).) (Note that experiment D-24-1 was performed with the graphite pin support for a short ferrosilicon rod described above; the graphite seemed to have no detrimen
27

Figure 16. Time-exposed images of 11 mm-diameter drops of molten alloy 1A exposed to a triggering transient with
peak pressure of 0.3 MPa. (i) (Left) Triggering depth was 400 mm. (C-292-1-4). (j) (Right) Triggering depth was 500 mm. (C-290-1-2). Vertical fiducial rods are 181 mm apart.
Time-exposed photographs of the 18 explosions and one non-explosion at 100 mm are shown in Figures
7a through 17u. The photographs are arranged in order of increasing triggering depths.
ps could not be triggered at a depth as shallow as 00 mm; and (c) these drops could be triggered to explode at all depths from 150 mm to 785 mm, the
1 From this final set of experiments, we learned that: (a) the 9 mm-diameter drops prepared from Batch B required trigger pulses four times stronger than those required to trigger the 11 mm-diameter drops prepared from Batch 1A; (b) explosions of the 9 mm-diameter dro1greatest depth at which we could place the triggering axis in our 1 m chamber and still produce the 1.288 MPa pulses. In the time-exposed photographs of the explosions of 11 mm- and 9 mm-diameter drops shown in Figures 16a through 16j and Figures 17a through 17u it should be noted that as the triggering depth increases (a) the ratio of the inner luminous area to the outer luminous area increases progressively, and (b) the explosions are asymmetric at first, then become spherical, and finally become asymmetric again as triggering depth increases. (By comparing similar time-exposed images with those of the explosions recorded in reflected light with the high speed camera during the 1997 work (Nelson et al., 1998a), we learned that the inner and
28
29
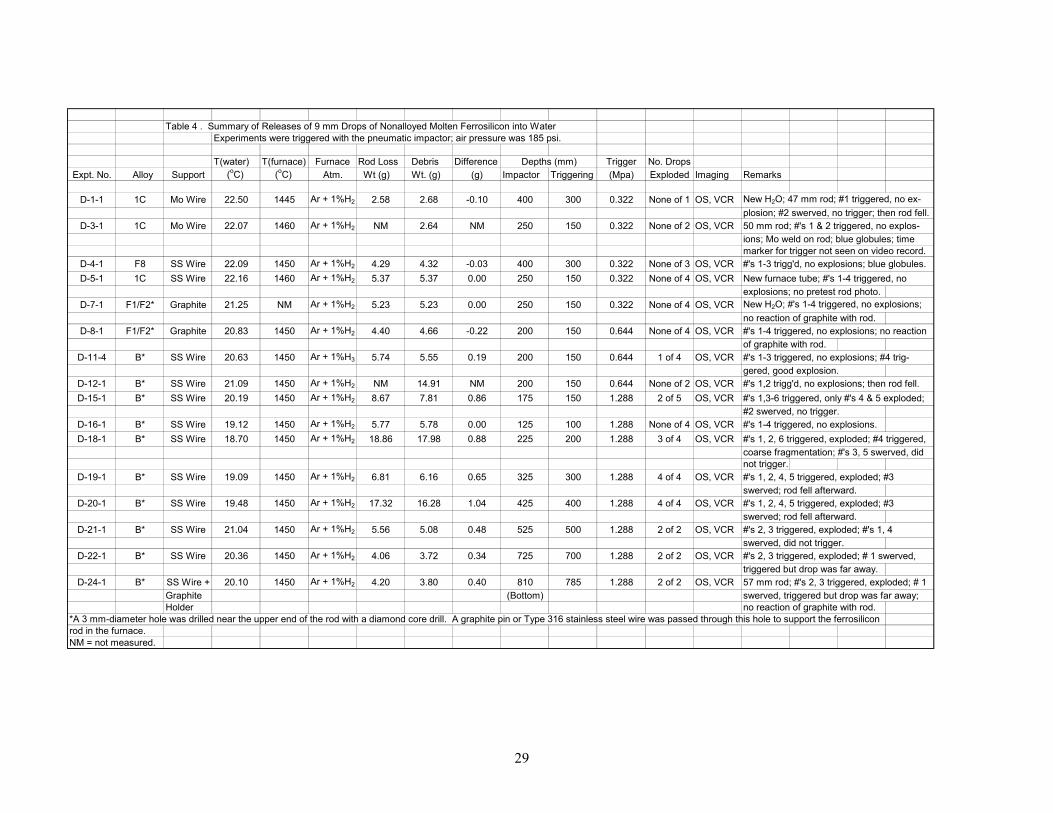
Table
. No. Alloy Supp
1-1 1C Mo W
3-1 1C Mo W
4-1 F8 SS W5-1 1C SS W
7-1 F1/F2* Graph
8-1 F1/F2* Graph
1-4 B* SS W
2-1 B* SS W5-1 B* SS W
6-1 B* SS W8-1 B* SS W
9-1 B* SS W
0-1 B* SS W
1-1 B* SS W
2-1 B* SS W
4-1 B* SS WiGraphiHolder
mm-diameter hole was d the furnace. not measured.
4 . 9 s of Nonalloyed Mol errosilicon into Waterere pneumatic impact r pressure was 185 psi.
Fu od Loss Debris ference Depths (mm) Trigger No. DropsExpt ort Wt (g) (g) Impactor Triggering (Mpa) Exploded Imaging Remarks
D- ire Ar + 2.58 -0.10 400 300 0.322 None of 1 OS, VCR New H2O; 47 mm rod; #1 triggered, no ex- plosion; #2 swerved, no trigger; then rod fell.
D- ire Ar + NM NM 250 150 0.322 None of 2 OS, VCR 50 mm rod; #'s 1 & 2 triggered, no explos-ions; Mo weld on rod; blue globules; time marker for trigger not seen on video record.
D- ire Ar + 4.29 -0.03 400 300 0.322 None of 3 OS, VCR #'s 1-3 trigg'd, no explosions; blue globules.D- ire Ar + 5.37 0.00 250 150 0.322 None of 4 OS, VCR New furnace tube; #'s 1-4 triggered, no
explosions; no pretest rod photo.D- ite Ar + 5.23 0.00 250 150 0.322 None of 4 OS, VCR New H2O; #'s 1-4 triggered, no explosions;
no reaction of graphite with rod.D- ite Ar + 4.40 -0.22 200 150 0.644 None of 4 OS, VCR #'s 1-4 triggered, no explosions; no reaction
of graphite with rod.D-1 ire Ar + 5.74 0.19 200 150 0.644 1 of 4 OS, VCR #'s 1-3 triggered, no explosions; #4 trig-
gered, good explosion.D-1 ire Ar + NM NM 200 150 0.644 None of 2 OS, VCR #'s 1,2 trigg'd, no explosions; then rod fell.D-1 ire Ar + 8.67 0.86 175 150 1.288 2 of 5 OS, VCR #'s 1,3-6 triggered, only #'s 4 & 5 exploded;
#2 swerved, no trigger.D-1 ire Ar + 5.77 0.00 125 100 1.288 None of 4 OS, VCR #'s 1-4 triggered, no explosions.D-1 ire Ar + 18.86 0.88 225 200 1.288 3 of 4 OS, VCR #'s 1, 2, 6 triggered, exploded; #4 triggered,
coarse fragmentation; #'s 3, 5 swerved, did not trigger.
D-1 ire Ar + 6.81 0.65 325 300 1.288 4 of 4 OS, VCR #'s 1, 2, 4, 5 triggered, exploded; #3 swerved; rod fell afterward.
D-2 ire Ar + 17.32 1.04 425 400 1.288 4 of 4 OS, VCR #'s 1, 2, 4, 5 triggered, exploded; #3 swerved; rod fell afterward.
D-2 ire Ar + 5.56 0.48 525 500 1.288 2 of 2 OS, VCR #'s 2, 3 triggered, exploded; #'s 1, 4 swerved, did not trigger.
D-2 ire Ar + 4.06 0.34 725 700 1.288 2 of 2 OS, VCR #'s 2, 3 triggered, exploded; # 1 swerved, triggered but drop was far away.
D-2 re + Ar + 4.20 0.40 810 785 1.288 2 of 2 OS, VCR 57 mm rod; #'s 2, 3 triggered, exploded; # 1 te (Bottom) swerved, triggered but drop was far away;
no reaction of graphite with rod.*A 3 rilled ne he a diamond core raphite pin or Type 316 stainless steel wire was passed through this hole to support the ferrosilicon rod inNM =
ten For; ai
Dif Wt. (g)
2.68
2.64
4.325.37
5.23
4.66
5.55
14.917.81
5.7817.98
6.16
16.28
5.08
3.72
3.80
drill. A g
mm Dropd with the
rnace RAtm.
1%H2
1%H2
1%H2
1%H2
1%H2
1%H2
1%H3
1%H2
1%H2
1%H2
1%H2
1%H2
1%H2
1%H2
1%H2
1%H2
rod with
Summary of Releases ofExperiments were trigg
T(water) T(furnace) (oC) (oC)
22.50 1445
22.07 1460
22.09 145022.16 1460
21.25 NM
20.83 1450
20.63 1450
21.09 145020.19 1450
19.12 145018.70 1450
19.09 1450
19.48 1450
21.04 1450
20.36 1450
20.10 1450
ar the upper end of t

30
Figure 17. Time-exposed images of 9 mm-diameter drops of molten alloy B exposed peak pressure of 1.3 MPa. (a) (Left) Triggering depth was 100 mm.depth was 150 mm. (D-15-1-4). Vertical fiducial rods are 181 mm apart.
outer luminous areas mentioned in (a) were formed by the generation of explosions.)
Checking the Impactor
As we were trying to understand the failure of the 9 mm-diamconditions that seemed identical to those that successfullynonalloyed drops during 1997 (150 mm triggering depth, 0.3 MPa pulse; see Nelson et al., 1998a), checked to see whether the pneumatic impactor was still generating pulses of the correct mhad made the original measurements of the pressure transients two m1998b), and now had to eliminate the possibility that the impactor somincorrectly. In most of the original measurements (Nelson et al., a few millimeters beneath the surface, with the surface of the impactor transient data presented previously, in Figures 12, 14 and15, were recorded in this m
to a triggering transient with (D-16-1-4). (b) (Right) Triggering
first and second bubbles during the
eter drops to explode with triggering produced explosions with 9 mm-diameter
we agnitude. We
onths previously (Nelson et al., ehow had begun to operate
1998b), we placed the transducer in shallow water, just 102 mm below. The pressure
anner.

Figure 17. d to a triggering transient with
peak pressure given in brackets. (c) (Left) Triggering depth was 100 mm [0.6 MPa]. (D-11-4-4). (d) (Right) Triggering depth was 150 mm [1.3 MPa]. (D-15-1-5). Vertical fiducial rods are 181 mm apart.
But just before we began the drop releases in July of 1998, we realized that when the transducer was placed
deeper water, at 300 mm. These data are shown in Figure 18 as the lower points (D-9-1, solid
deviations and percent deviations were: • 0.428 ± 0.060 MPa, ± 14% for experiment C-263-3 performed in shallow water in June, 1998; • 0.378 ± 0.027 MPa, ± 7% for experiment C-265-3 performed in deep water in July, 1998; and • 0.322 ± 0.008 MPa, ± 2% for experiment D-9-1 performed in deep water in September, 1998.
Time-exposed images of 9 mm-diameter drops of molten alloy B expose
in deeper water, the measurements became more reproducible. This is shown in Figure 18, where the upper points (C-263-3, open circles) were recorded in June, 1998, with the transducer in shallow water, while the middle points (C-265-3, open triangles) were recorded in July, 1998, with the transducer deeper in the water, at a depth of 300 mm. In both sets of measurements, the surface of the impactor was placed 102 mm below the transducer. To check the impactor in September, 1998, we performed another set of experiments with the transducer again in the squares). In the three sets of data plotted in Figure 18, we recorded the outputs of the transducer 10 or 11 times and obtained the peak pressures with the Infinium oscilloscope. The averaged values, standard
31

Figure 17. Time-exposed images of 9 mm-diameter drops of molten alloy B exposed to a triggering transient with
peak pressure of 1.3 MPa. (e) (Left) Triggering depth was 200 mm. (D-18-1-1). (f) (Right) Triggering depth was 200 mm. (D-18-1-2). Vertical fiducial rods are 181 mm apart.
These three sets of measurements show that the reproducibility of the measurements is improved significantly when the transducer is placed deeper in the water. Moreover, it appears that over the time interval of two months, the pressure transients generated by the pneumatic impactor had decreased somewhat (by about 17%) but had also become about three times more reproducible. From these measurements, we also concluded that our inability to trigger the 9 mm-diameter drops of molten ferrosilicon was probably not caused by failure of the impactor to operate properly. (Note: We have used
e lowest value of 0.322 ± 0.008 MPa throughout this report as the correct peak pressure for the triggering
of the Explosions
the final report for the 1997 experiments (Nelson et al., 1998a), we presented preliminary estimates of
are determined from the photographic images of the explosions. Bubble volumes
thtransients generated by the impactor at a distance of 100 mm.) Energetics
Inthe amounts of energy transferred to the water by the steam explosions of the molten ferrosilicon. These energies were estimated from the pressure-volume products of the bubbles generated by the explosions, where the bubble volumescan be converted into energies with Equation (1):
32
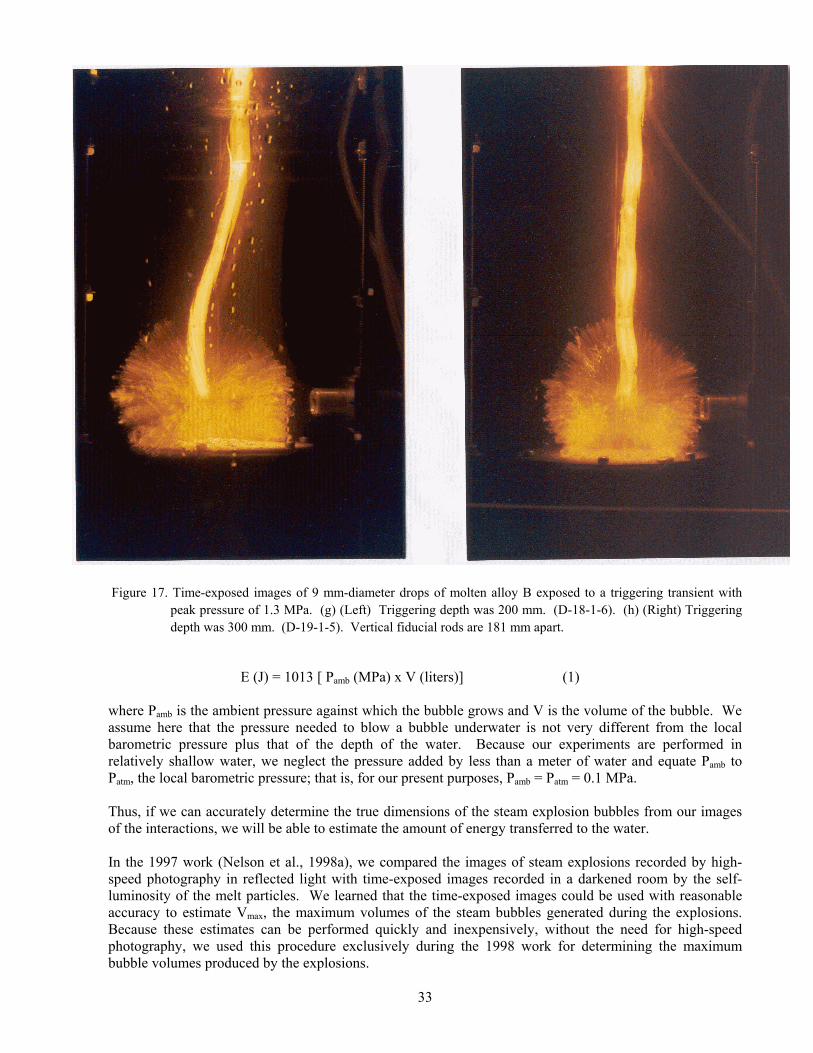
Figure 17. Time-exposed images of 9 mm-diameter drops of molten alloy B exposed to a triggering transient with
peak pressure of 1.3 MPa. (g) (Left) Triggering depth was 200 mm. (D-18-1-6). (h) (Right) Triggering depth was 300 mm. (D-19-1-5). Vertical fiducial rods are 181 mm apart.
E (J) = 1013 [ Pamb (MPa) x V (liters)] (1)
e steam explosion bubbles from our images rgy transferred to the water.
l., 1998a), we compared the images of steam explosions recorded by high-
during the 1998 work for determining the maximum bubble volumes produced by the explosions.
where Pamb is the ambient pressure against which the bubble grows and V is the volume of the bubble. We assume here that the pressure needed to blow a bubble underwater is not very different from the local barometric pressure plus that of the depth of the water. Because our experiments are performed in relatively shallow water, we neglect the pressure added by less than a meter of water and equate Pamb to Patm, the local barometric pressure; that is, for our present purposes, Pamb = Patm = 0.1 MPa.
Thus, if we can accurately determine the true dimensions of th
f the interactions, we will be able to estimate the amount of eneo In the 1997 work (Nelson et aspeed photography in reflected light with time-exposed images recorded in a darkened room by the self-luminosity of the melt particles. We learned that the time-exposed images could be used with reasonable accuracy to estimate Vmax, the maximum volumes of the steam bubbles generated during the explosions. Because these estimates can be performed quickly and inexpensively, without the need for high-speed photography, we used this procedure exclusively
33

Time-exposed images of 9 mm-diameter drops of molten alloy B exposed to a triggering transient with peak pressure of 1.3 MPa. (i) (Left) Triggering depth was 300 mm. (D-
Figure 17. 19-1-1). (j) (Right) Triggering
depth was 300 mm. (D-19-1-2). Vertical fiducial rods are 181 mm apart.
frtted per gram of
melt in Figure 19 as the solid diamonds. We have also included a pair of data points for the hemispherical
or both drop diameters, note that there is a distinct trend of the outer envelope of the points toward smaller
the that produced by the spherical explosions.
The PVmax bubble energies produced by the 8 explosions obtained with 11 mm-diameter molten ferrosilicon drops (see Tables 3a and 3b) were estimated from the time-exposed images shown in Figures 16a through 16j. These energies are plotted per gram of melt in Figure 19 as the open squares. The PVmax energies produced by 18 explosions obtained with 9 mm-diameter drops (see Table 4) were estimated similarly om the time-exposed images shown in Figures 17a through 17u. These energies are also plo
explosion of a 9 mm-diameter drop reported in the 1997 work (see Table 7 in Nelson et al., 1998a). FPV energies per gram of melt as fall distance increases. Note also that the magnitudes of the energies released per gram of melt for the 9 mm-diameter drops seem to be about twice as large as those estimated for the explosions of the 11 mm-diameter drops. Also, the PVmax energies per gram of melt produced by the explosions of 9 mm-diameter drops during the 1997 work (see Table 7 in Nelson et al. (1998a)) seem reasonably consistent with the maximum energies produced by the explosions of 9 mm-diameter drops during the 1998 work. And finally, the maximum energy produced by the hemispherical explosion of a 9 mm-diameter drop is at least 35% greater than
34

Figure 17. Time-exposed images of 9 mm-diameter drops of molten alloy B exposed to a triggering transient with
peak pressure of 1.3 MPa. (k) (Left) Triggering depth was 300 mm. (D-19-1-4). (l) (Right) Triggering depth was 400 mm. (D-20-1-1). Vertical fiducial rods are 181 mm apart.
Fall Histories
Knowledge of the rates at which molten ferrosilicon drops descend through the water during granulation is important for determining process parameters and for the design of equipment. We have, therefore, analyzed some of our records to determine distances the drops have fallen through the water at various times after release. We have used two time-resolved imaging techniques for these determinations: (a) video records, by counting frames as the drops fall behind known depth markers on the water chamber; and (b) hopped time-exposed photographic images of the falling drops recorded through the rotating shutter wheel
ace of the
csetup shown in Figure 10. The water was at room temperature for all experiments in which these measurements were made. Measurements with Video Images
We have analyzed our video records frame-by-frame for experiments in which drops with four diameters were released: 3 mm (this was a small satellite drop that fell along with the parent drop in experiment C-276-1-S); 9 mm (C-129-1-1); 11 mm (C-268-1-1); and 17 mm (C-213-1-2). For depth marking, we were able to determine when the luminous drops passed behind four reinforcing rods that cross the f
35

Figure 17. Time-exposed images of 9 mm-diameter drops of molten alloy B exposed to a triggering transient with
peak pressure of 1.3 MPa. (m) (Left) Triggering depth was 400 mm. (D-20-1-4). (n) (Right) Triggering depth was 400 mm. Image of explosion is at lower right. Broad image at left is that of the falling rod. (D-20-1-5,6). Vertical fiducial rods are 181 mm apart.
ter chamber horizontally at depths of 0, 311, 635 and 959 mm below the surface of the water. We have istances vs. time for these drops in Figure 20.
only one or two video frames. Although not very accurate, we nevertheless clude these data in Figures 20 and 21 as the best available at this time.
Examination of the Shutter Wheel Images
washown the fall d We calculated the slopes of the lines shown in Figure 20 to obtain the velocities vs. drop diameters shown in Figure 21. It must be emphasized that, as yet, we have information about only one drop larger than 11 mm in diameter. This is for the 17 mm-diameter drop released accidentally from a 10 mm-diameter rod during experiment C-213-1-2. The information about this drop is not very reliable, because we were able to measure fall distance and fall time with in
Fall Rates. The time-exposed photographic images recorded through the rotating shutter wheel shown in Figure 10 provide a second group of data that complements the video images for investigating the motion of the molten drops through water. A typical chopped image of a falling ferrosilicon drop recorded in this
36

igure 17. Time-exposed images of 9 mm-diameter drops of molten alloy B exposed to a triggering transient with
anner is shown in Figure 22. This image was recorded during experiment C-268-1 in which an 11 mm-
Figures 20 and 21 for the 11 mm-diameter
red the depths of the “dots” shown in Figure 22 and, knowing the time per chop (0.0833 s),
ely, that the separations argements of the photographs and converted into
portant information about the shorter range motion
ter
Fpeak pressure of 1.3 MPa. (o) (Left) Triggering depth was 400 mm. (D-20-1-2). (p) (Right) Triggering depth was 500 mm. (D-21-1-3). Vertical fiducial rods are 181 mm apart.
mdiameter drop of alloyed ferrosilicon from a 16 mm-diameter rod from Batch 3A (see Table 1) was allowed to fall the entire depth of the chamber without a trigger. (The video record from this experiment was also
sed to determine fall distance vs. time and velocity shown in udrop.)
e have measuWhave produced a plot of drop depth vs. time similar to the plot determined from the video images shown in Figure 20. The data points are presented as the solid diamonds in Figure 23. We have also included as the open squares the corresponding video data points for this drop, taken from Figure 20. There is satisfactory agreement between these plots.
he chopped images have a significant advantage over the video images, namTbetween the “dots” can also be measured on enlinstantaneous velocities of the drops. This provides imof the drops through the water as they cool that is difficult or impossible to determine from the video images. The instantaneous velocities for the 11 mm-diameter drop in experiment C-268-1 determined from the “dot” images in Figure 22 are plotted in Figure 24. Note the rapid deceleration of the drop shortly af
37

Figure 17. Time-exposed images of 9 mm-diameter drops of molten alloy B exposed to a triggering transient with
peak pressure of 1.3 MPa. (q) (Left) Triggering depth was 500 mm. (D-21-1-2). (r) (Right) Triggering depth was 700 mm. (D-22-1-3). Vertical fiducial rods are 181 mm apart.
it entered the water, some variations in its velocity as the drop approaches the middle of the chamber and then a steady increase in velocity as it falls toward the bottom of the chamber. For comparison, we have included as the dashed line in Figure 24 the velocity of the same drop taken from Figure 21, as calculated from the slope of the four video data points shown in Figure 20. Solidification of the Drops. We can learn about other aspects of the behavior of the falling drops from the shutter wheel photographs. For example, in Figure 25, we show an enlarged photograph of a 9 mm-diameter drop in experiment D-24-1-3 that has fallen through room temperature water almost to the “bottom” of our chamber before being triggered to explode at a depth of 785 mm (the time-exposed image of the explosion of this drop has been shown in Figure 17u). The “dot” images indicate that this drop first ell uniformly, presumably as a f completely molten globule (upper arrows), then started to tumble at 1.67 s
(20 “dots” after water entry), presumably as a partially solidified “lozenge” (center arrow), before it was triggered and exploded at 2.33 s (28 “dots” after water entry) as it crossed the photodetector axis 25 mm above the impactor (lower arrow). We believe these “dot” images may prove to be important for investigating industrial granulation because their analyses (a) allow us to determine when a globule starts to solidify, and (b) indicate that globules of ferrosilicon can still be triggered to explode even after they have partially solidified! (The steam explosion
38

Figure 17. Time-exposed images of 9 mm-diameter drops of molten alloy B exposed to a triggering transient with
peak pressure of 1.3 MPa. (s) (Left) Triggering depth was 700 mm. (D-22-1-2). (t) (Right) Triggering depth was 785 mm (Bottom). (D-24-1-2). Vertical fiducial rods are 181 mm apart.
losion.
of a partially solidified drop of laser-melted iron oxide has been reported earlier by Nelson and Duda (1985).) Colloidal Materials Generated by the Explosions
Visual Observations
After the steam explosion of a ferrosilicon drop, the surrounding water always becomes cloudy with a colloidal material that settles very slowly. This cloudiness is long lasting; it does not seem to settle out completely even after a day or two. This indicates that the colloidal material is probably a finely divided solid that has very small particle sizes. In earlier work (Nelson et al., 1998a), we hypothesized that this material might be formed by the condensation of gaseous products generated during the underwater gas-phase combustion of the molten ferrosilicon alloy in the finely fragmented state produced by the steam explosion. Beyond this comment, however, we generally disregarded the slow settling, cloudy material deposited in the water after each exp During our 1998 experiments, however, we began to look at this material more carefully after we realized that a large fraction (10% to 20%) of the weight of each drop that exploded remained suspended in the water as a colloid, while negligible amounts of colloidal material remained suspended if the molten drop
39

Time-exposed image of 9 mm-diameter drop of molten alloy B exposed to a triggering transient with peak pressure of 1.3 MPa. (u) Triggering depth was 785 mm (Bottom). (D-24-1-3). Ve
Figure 17. rtical fiducial rods are
181 mm apart.
ze without an explosion as it settled through the water. This can be seen in Tables 3 a and b and able 4 as the differences between (a) the weights of the solidified globules or of the granular debris
urs) and (b) the weight of melt released into the water f weight of the rod). If no explosions occurred during an experiment, l (see, for example, experiment D-16-1 in Table 4). But if there had
. We examined the 93 L of the cloudy water that filled the
merely froTrecovered soon after the explosions (within a few hoduring the experiments (i.e., the loss othe weights (a) and (b) would be equabeen one or more explosions, the weights of the granular material recovered after the experiment would be 10% to 20% less per drop that had exploded (see, for example, experiment D-21-1 in Table 4). (This behavior also occurred during the steam explosions generated during the 1997 work but was not recognized at that time (see Tables 3 and 4 in Nelson et al., 1998a).) Concentrations of the Colloidal Material
By boiling dry known amounts of water that contained the colloid, we were able to estimate the oncentration of this material gravimetricallyc
chamber in which 10 experiments had been performed over a period of 17 days (experiments C-282-1 through C-300-1, summarized in Tables 3a and b). In these 10 experiments, 6 steam explosions of individual 11 mm-diameter drops had occurred in this same water filling, resulting in a total loss of solids
40

0.0
0.1
0.2
0.3
0.4
0.5
0.6M
axim
um P
ress
ure
in M
pa
0 2 4 6 8 10 12
Trial Number
D-9-1, September, 1998, Deep Water
C-265-3, July, 1998, Deep Water
C-263-3, June, 1998, Shallow Water
Average: 0.378 +/- 0.027 Mpa (7%)
Average: 0.322 +/- 0.008 Mpa (2%)
Average: 0.428+/- 0.060 Mpa (14%)
Figure 18. Maximum pressures generated by the pneumatic impactor, measured with the tourmaline transducer placed several millimeters beneath the water surface (open circles), and at depths of 300 mm two months apart (open triangles and solid squares). In all experiments, the surface of the impactor was placed 102 mm below the transducer.
of 2.18 g (that is, the total of the differences between the weights of the debris collected soon after the xperiments and the weights of all melt delivered during these 10 experiments was 2.18 g).
that some of the colloidal material had plated out rmly on the walls of the water chamber during the 17 days during which the experiments were performed,
when the water samples were taken. And,
e At the end of the 17 days, we collected two ~280 g samples of cloudy water while the total contents of the chamber were stirred vigorously. After weighing on a balance sensitive to 0.01 g, these colloid-containing water samples were transferred to aluminum containers that had been preweighed on a balance sensitive to 0.00001 g. After boiling dry on a hotplate and cooling, the containers and their residues were reweighed on the same balance. For the set of 10 experiments in which 6 explosions had occurred in the same water filling, the two weights of boiled-down residues were 1.24 g and 0.65 g extrapolated on the basis of the total 93 liters. These residues corresponded to 57% and 30% of the total colloidal material (total of the weight differences) of 2.18 g, about half the expected weight. Although these estimates are both low, they are in rough agreement with the expected weight. It is possiblefiand could not be completely resuspended by the manual stirringalthough we worked as carefully as possible with the hot plate, it is also possible that some of the residues were lost because of spattering or aerosolization during the boiling to dryness. Identification of the Suspended Material by ICPMS
We made several attempts to analyze the colloid-containing water by inductively coupled plasma mass
41

0
10
20
30
40
50
60
70
80
Bub
ble
Ener
gy [J
/g]
9 mm Drops
11 mm Drops
9 mm Drops, 1997
9 mm Drops, 1997Hemispherical
Assumes 1.24 g
Assumes 1.53 g
1997
1997
0 200 400 600 800 1000
Trigger Depth [mm] Figure 19. Bubble energies of molten ferrosilicon drops per gram of melt released plotted as a function of trigger
trongly for those in (ii), as trongly for those in (ii), as
depth. spectrometry (ICPMS) (Jarvis et al., 1992). With this procedure, a known amount of liquid is sprayed into a plasma that ionizes the elements present in the liquid. These ions are passed into and analyzed quantitatively with a mass spectrometer. The ions may be formed from elements that are in true solution in the liquid, or are in suspension as colloids. (This technique is used extensively by the Soil and Plant Analysis Laboratory at the University of Wisconsin for analyzing samples of milk and river water.) This technique seemed especially attractive for analyzing silicon-containing alloys in colloidal suspension because there would be no need to place the materials in true solution, for example, by dissolution in hydrofluoric acid that might be accompanied by losses of Si as the gaseous SiF4. We attempted to use ICPMS to analyze water samples collected from the water fillings in which we had performed (i) experiments C-276-1 through C-280-1 and (ii) experiments C-282-1 through C-300-1. The
ed quantitatively with a mass spectrometer. The ions may be formed from elements that are in true solution in the liquid, or are in suspension as colloids. (This technique is used extensively by the Soil and Plant Analysis Laboratory at the University of Wisconsin for analyzing samples of milk and river water.) This technique seemed especially attractive for analyzing silicon-containing alloys in colloidal suspension because there would be no need to place the materials in true solution, for example, by dissolution in hydrofluoric acid that might be accompanied by losses of Si as the gaseous SiF4. We attempted to use ICPMS to analyze water samples collected from the water fillings in which we had performed (i) experiments C-276-1 through C-280-1 and (ii) experiments C-282-1 through C-300-1. The total weights of suspended colloidal materials would have been 1.25 g and 2.18 g when extrapolated to the total water volume of 93 L, corresponding to concentrations of 13.4 mg/L and 23.4 mg/L. The chamber
as not stirred during the collection of the samples in (i), but was stirred s
total weights of suspended colloidal materials would have been 1.25 g and 2.18 g when extrapolated to the total water volume of 93 L, corresponding to concentrations of 13.4 mg/L and 23.4 mg/L. The chamber
as not stirred during the collection of the samples in (i), but was stirred swwindicated in the previous section. indicated in the previous section. The ICPMS analyses indicated solids concentrations of about 55 µg/L and 110 µg/L for (i) and (ii), The ICPMS analyses indicated solids concentrations of about 55 µg/L and 110 µg/L for (i) and (ii),
42

0
200
400
600
800
1000
1200
1400
0.0 0.5 1.0 1.5 2.0 2.5 3.0
Time in Seconds
Fall
Dis
tanc
e in
Mill
imet
ers
C-213-1-2, 8.55 gC-268-1-1, 1.91 gC-129-1-1, 1.24 gC-276-1-S, 0.04 g
17 mm
11 mm 9 mm
3 mm
Long Extrapolation,Uncertain
Figure 20. Fall distances vs. time for molten ferrosilicon drops of several diameters released into room temperature water. Video images were used to make the measurements.
respective i-to-Fe ratios of from 1 to 10 for the samples. The solid concentrations thus were low by ore than a factor of 10-3 and the ratios Si/Fe did not seem very reliable.
ed” water used originally fill the chamber was not always constant and seemed to affect the results significantly. We concluded
suspended material with X-ray diffraction. We used as a sample the t the
ly, and Sm We concluded that ICPMS analyses of water that contains Si-Fe colloidal material is not as straightforward as we had originally anticipated. There are several uncertainties that immediately come to mind: (a) In the original water sampling it may be difficult to achieve concentrations and compositions that are representative of the true colloid suspended in the entire sample of water (93 L in our experiments). (b) It may be similarly difficult to inject the colloid-containing water samples into the instrument and yet retain the true concentrations and compositions of the colloid. This difficulty might be caused by settling and plating out of the suspended materials in the sample transfer containers and/or the injection apparatus. And (c), in several of our attempted analyses, we learned that the purity of our “deioniztofrom our brief attempts, therefore, that the use of this technique to investigate the colloidal materials produced during the steam explosions of molten ferrosilicon alloys would require very careful attention to water purities and to the procedures for collecting and transferring samples to the ICPMS instrument. Identification of the Suspended Material by X-Ray Diffraction
e also attempted to identify theWmaterial that remained in the cloudy water recovered from the chamber after experiment C-213-1-2 a
43

0
500
1000
1500
2000
2500
3000
3500
4000
0 2 4 6 8 10 12 14 16 18 20
Drop Diameter in Millimeters
Fall
Velo
citie
s in
Mill
met
ers/
Seco
nd
Great Uncertainty
Figure 21. Fall velocities of molten ferrosilicon drops with several diameters released into room temperature water. The velocities were calculated as the slopes of the fall distance-time points plotted in Figure 20.
d (see Table 1). (Several lesser
broad hump” resence of amorphous materials r cryst . The most likely amorphous or
end of the program in 1997. This experiment produced the very large explosion of the 17.2 mm drop of
olten ferrosilicon released (accidentally) from a 10 mm-diameter F8 romexplosions had also occurred in the same water filling.) As a final effort during that year, we boiled dry the entire 93 L of water in the chamber. After the boiling, a fine gray-black powder remained on the bottom of the stainless steel vessels used for the boiling. We collected a sample of this solid on an adhesive tape and analyzed it with an X-ray diffraction unit in the Department of Materials Science and Engineering at the University of Wisconsin with the assistance of Mr. Larry Casper. The pattern obtained is shown in Figure 26. The simple crystalline patterns in this figure were identified with appropriate software to correspond to Si and FeSi2. These patterns are identical to those obtained from the starting ferrosilicon rod material at Michigan Technological University, Houghton, Michigan during the 1997 program (Nelson et al., 1998a). t has been pointed out to us, however, that the pattern shown in Figure 26 also has a significant I
“ at low diffraction angles. This “hump” probably results from the po als that have particle sizes too small to produce discrete line patternsfine crystalline material to be produced in a steam explosion of our Si-rich alloy would be SiO2 formed by gas-phase combustion. Materials with other Fe-Si-O compositions also might be expected to be deposited
44

Figure 22. Chopped image of the molten ferrosilicon drop released into 1 m-deep room temperature water in
Experiment C-268-1. The image was recorded through the rotating shutter wheel shown in Figure 10. The “dots” are 0.0833 s apart.
X-ray diffraction as iscrete crystalline patterns.
nsuited to investigating the amorphous products of underwater gas-phase combustion of the alloy.
in the water in an amorphous or fine crystalline state. If these fine particulate materials were to form during the underwater combustion of the molten ferrosilicon, they would not be recognized byd We must conclude, then, that X-ray diffraction is not a sensitive diagnostic technique for identifying the colloidal materials produced during steam explosions of molten ferrosilicon in water. It seems particularlyu
45

Figure 23. Fall depths vs. time for the molten ferrosilicon drop released into 1 m-deep room temperature water in experiment C-268-1. The solid diamonds were obtained from the shutter wheel image in Figure 22; the
0
200
400
600
800
1000
0.000 0.500 1.000 1.500 2.000
Time [s]
Fall
Dep
th [m
m]
Shutter Wheel
Video
1200
open squares were taken from Figure 20 and were obtained from video images.
The prese ion would, of course, be indicated by the generation of hydrogen. Bubbles of permanent gas have been observed to form during the explosions (Nelson et al., 1998a)1.) The olume of hydrogen generated would indicate the extent of the reaction (Nelson et al., 1994).
nce of the metal-water react(v
ubbles ight coalesce into a single bubble that could be used to estimate the amount of hydrogen generated during
the explosion. Unfortunately, the depth of the explosion was so shallow (about 150 mm) that the bubbles did not coalesce during the available imaging time; as a result, we still do not have an estimate of hydrogen generation. In future experiments, we should examine explosions with reflected light in deeper water in order to allow time for the bubbles to coalesce.
1 We have reexamined the video record from experiment C-213-1-1 that was performed during the 1997 program. In these images, recorded with reflected light, we clearly saw a myriad of tiny bubbles of noncondensible gas rise from the site of the interaction after the explosion. We had hoped the bm
46

0
100
200
300
400
500
600
700
800
0 100 200 300 400 500 600 700 800 900 1000
Depth [mm]
Velo
city
[mm
/s]
Video Velocity Based on 4 Points
Instantaneous Velocities Based on Shutter Wheel "Dots"
Figure 24. Velocities of the molten ferrosilicon drop released into 1 m-deep room temperature water in experiment C-
268-1 obtained from the shutter wheel image shown in Figure 22. The value of the velocity obtained from video images and taken from Figure 20 is included as the dotted line.
47

Partially solidified drop triggered and exploded 2.33 s after water entry.
Drop starts to tumble as it begins to solidify 1.67 s after water entry.
Drop falls uniformly as molten globule
Figure 25. Enlargement of the shutter wheel photograph of the complete fall of the 9 mm-diameter drop of alloy B that
fell and exploded in experiment C-24-1-3. (The lower part of the fall is shown in Figure 17u.) The "dot" images suggest that the drop first fell uniformly as a completely molten globule (upper arrows), then started to tumble 1.67 s after water entry (20 "dots") as a partially solidified "lozenge" (center arrow) before it triggered and exploded 2.33 s after water entry (28 "dots") as it crossed the photodetector axis 25 mm above the impactor (lower arrow). The depth of the triggering level (photodetector axis) was 785 mm (Bottom).
48

Figure 26. X-ray diffraction pattern of the residue that remained after boiling dry the 93 L water filling recovered from the chamber in 1997 after experiment C-213-1-2. A number of steam explosions of molten ferrosilicon drops had occurred in this water, leaving 10% to 20% of the weight of each drop suspended in the water as a colloid.
49

DISCUSSION
Measurements with the Tourmaline Transducer
In the work done during 1997, we attempted to measure the pressure transients generated by both the solenoid-driven impactor and the hydrogen-oxygen combustion tube with a quartz transducer borrowed from a shock tube program. We hung the tip of this transducer a few millimeters beneath the water surface and fired the pressure generating source a known distance (102 mm) below it. Unfortunately, the quartz transducer available to us in 1997 was not designed for use during free suspension in water. Moreover, this type of service in the presence of water often led to difficulties with the sensitive electrical leads caused by splashing and high humidity. We were aware at the time that the transducer was not entirely suitable for our purposes, but its easy availability without cost led us to use it anyway. Moreover, the oscilloscope used to record the outputs of the quartz transducer was very antiquated and awkward to operate, but again, because it was available to us without cost, we proceeded with it, too. Thus, the measurements of pressures reported during 1997 have always been suspected to be of dubious reliability. Use of the tourmaline underwater blast transducer that is specifically designed and carefully calibrated for operation underwater, plus the ability to record with a high-speed, state-of-the-art oscilloscope have enabled us to make measurements that we now believe can be relied upon. Unfortunately, as feared, we learned from these new measurements that the pressure estimates made with the quartz transducer during 1997 were seriously in error. Thus, the averaged peak pressures measured with the quartz transducer reported during 1997 for the impactor with the original solenoid, 0.422 ± 0.074 MPa (±18%) at 100 mm (Nelson et al., 1998a), have now been remeasured with the tourmaline transducer to be 0.129 ± 0.023 MPa (±18%) at 102 mm for the impactor (driven with the new solenoid) (see Table 2 and Figure 12). That is, all pressure measurements reported during 1997 for the impactor and the hydrogen-oxygen combustion tube must now be reduced by the factor 0.1285 / 0.422 = 0.30. (The high readings of the quartz transducer are not unexpected, as indicated in a recent communication from the manufacturer of both the quartz and the tourmaline transducers. This communication is reproduced as Figure 27.) This reevaluation presents a sizeable reduction in apparent magnitude of the pressure pulse that initiated the steam explosion of a 9 mm-diameter drop of the nonalloyed ferrosilicon 45 mm above the solenoid-driven impactor that was positioned 200 mm beneath the surface of the water. This value was reported in the 1997
(that is, inthe steam hazard in the industrial ferrosilicon granulation processes than originally thought. (It should be noted also
at the value of ≈1.0 MPa was mistakenly identified in the 1997 work (Nelson et al., 1998a) as the threshold” trigger needed for the steam explosion. The threshold was not
work to be ≈1 MPa (Nelson et al., 1998a). The true value of this pulse must now be reduced to ≈0.3 MPa stead of 10 times atmospheric pressure it is now only 3 times!). We believe the ability to trigger explosions of the drops with a pressure excursion this small may indicate a considerably greater
th“ determined during 1997; only that this triggering pressure was “sufficient” for triggering. It is possible, then, that the actual threshold could be somewhat less than the ≈1.0 MPa estimated with the 1997 calibration or somewhat less than ≈0.3 MPa with the 1998 calibration.) Not only will the threshold value for initiating the explosion of a single ferrosilicon drop be smaller than originally thought, but also the propagation of a large-scale steam explosion drop-to-drop through a large array of drops may also involve smaller pressurizations than initially anticipated. We regret any difficulties the incorrect original estimates with the quartz transducer may have caused our sponsors. We attempted a simple and inexpensive set of preliminary measurements during 1997. It is unfortunate that there is such a large difference between the original estimates and the true values determined in 1998.
Reproducibility of the Measurements
As yet, we do not understand what governs the reproducibilities achieved with the tourmaline transducer during repeated measurements of the maximum pressures generated by either the solenoid-driven or the pneumatic impactor. This is due mostly to our inadequate analyses of the data recorded early in the 1998
50

Figure 27. Communication from the manufacturer of both the quartz and tourmaline transducers regarding the suitability of operation in water.
51

program. We hope to extend these analyses during the 1999 program to learn more about the performance f the impactor under a variety of conditions.
Several salient observations made during the 1998 program should be mentioned, however: • When we made our original measurements early in 1998, the transducer was positioned a few
millimeters beneath the surface of the water and the impactors 100 mm below. We repeated the measurements ten or more times to obtain averaged peak pressures. These averaged values always seemed to have similar standard deviations between the data points of ±14% to ±18% (see Table 2 and Figures 12, 15 and 18). [Standard deviations on this order also seemed to be produced during our (incorrect, as we know now) measurements during the 1997 program with the solenoid-driven impactor made with the quartz transducer, both placed at similar depths in the water and recorded with the antiquated oscilloscope (Nelson et al., 1998a).]
• In July, 1998, we made similar measurements in deeper water, with the transducer at a depth of 300 mm
and the pneumatic impactor at 400 mm. We now obtained standard deviations of ±7% (see Figure 18). • We seemed to obtain more reproducible measurements when we used higher air pressures to drive the
pneumatic impactor (see Figure 14). • We seemed to obtain lower but more reproducible measurements with the pneumatic impactor after it
had been operated for several months. As shown in Figure 18, when we repeated the July, 1998, measurements in deep water with the pneumatic impactor two months later, in September of 1998, the peak pressure averaged over 10 trials had decreased from 0.378 ± 0.027 MPa (±7%) to 0.322 ± 0.008 MPa (±2%). Here, the averaged peak pressure decreased by about 15% while the standard deviations decreased more than three-fold, from (±7%) to (±2%). (Note: We have used this lower value of 0.322 ±0.008 MPa throughout this report as the correct peak pressure for the triggering transients generated by the pneumatic impactor at a distance of 100 mm.)
We are disappointed about the large uncertainties that accompanied many of the tourmaline transducer measurements of the maximum pressures generated by both the solenoid-driven and the pneumatic impactors. We cannot explain these at present. During the 1999 program we look forward to the opportunity to extend these analyses and our understanding of the phenomena involved. Advantages of the Pneumatic Impactor
By developing the pneumatic impactor, we have greatly increased the range of pressure transients that can be produced by the impactor devices. Not only do we have the solenoid-driven device that produces pressure transients on the order of 0.13 MPa at 100 mm (see Figure 12) but we now have the ability to produce transients up to 0.4 MPa at 100 mm (and perhaps even greater) with the pneumatic impactor (see Figures 15 and 18). Moreover, we believe it will be possible to increase the maximum pressures still farther by adding still heavier weights to the piston we are using now, or to increase the diameter of the piston, or some combination of these. When we began the steam explosion experiments in 1998, we intended to use drops of melt that were larger than the 9 mm drops studied in 1996 and 1997. At that time, it seemed possible that (a) larger drops might
quire larger pressure transients for triggering, and (b) the bubbles generated by the exploding drops might e considerably larger than those produced during the 1997 studies. Both aspects of the new studies made
it desirable to be able to generate greater peak pressures to achieve the following:
genera r would allow us to increase the trigger pressure while holding distance above the impactor constant.
o
reb
(a) If application of stronger peak pressures at a given location is desired. The stronger pressure transients ted by the pneumatic impacto
52

(b) If it is desired to increase the separation between the steam explosion and the impactor. In the 1997
work (Nelson et al., 1998a), we learned that the explosions of the drops may produce bubbles that ispherical”
explosions. When the explosion occurs too close to the impactor’s surface, measurements of the bubble
s we began to use the tourmaline transducer during 1998, we encountered considerable difficulty during
elecmetimes obscured the recording of the true pressure signatures.
A d mpactor is that it does not require the introduction of electrical ower into the vicinity of the steam explosion. This should minimize electrical noise produced during
deliposelecor mcomassopres
ur ).
r pressurization is roduced within the first few microseconds of the transient, followed by several milliseconds of small
erences between these pressure-time behaviors might provide an
duces peak pressures several times greater than the solenoid-driven impactor as a weight of either 22.66 g or 62.53 g attached to a driving piston of unknown weight–probably of the
xperimental Improvements
protech nts in water that can initiate steam explosions of the molten
impinge on the surface of the impactor to produce “hemispherical” or partially “hem
volumes become difficult. Moreover, when the explosion occurs on or near the surface of the impactor, the energy transfer during the steam explosion seems to become more efficient. Therefore, having stronger pressure transients available will enable us to produce the threshold trigger pressure higher above the impactor (we assume the 1/r relationship holds here) and thus cause the explosion to occur higher in the water above the impactor. At the start of the 1998 experiments, we believed that the ability to control the height of the steam explosions above the impactor by varying the strength of the pressure pulses might become very important during the studies of the large drops.
Athe electrical activation of the solenoid. The switching of the fairly high current generated undesirable
trical noise that interfered with the triggering of the oscilloscope, made measurements difficult and so
istinct advantage of the pneumatic ipactivation of the impactor in the chamber, and thus minimize spurious interferences during the electrically
cate transducer-oscilloscope recording. (It must be pointed out, however, that electrical noise can still sibly be generated during the activation of the pneumatic impactor. This might be produced by the trically operated solenoid valve that pressurizes the pneumatic piston. But this valve operates a meter ore from the impactor and the likely location of the transducer and its leads close to the explosion site, pared to only centimeters away for the solenoid-driven impactor.) The minimal electrical noise ciated with the pneumatic impactor would, without doubt, greatly facilitate the measurement of the sure signatures generated by the steam explosions of the ferrosilicon drops if it is decided to use the maline transducer for this application (see Appendix Cto
And, finally, the pneumatic and solenoid-driven impactors apply somewhat different pressure-time signatures to the drops, as can be seen in Figures 11 and 13. Notice that in Figure 11, the solenoid-driven impactor produces a pressure signature that begins with almost a full millisecond of small amplitude oscillations before the major pressure spike is produced, while in Figure 13, the majopamplitude pressurizations. Perhaps the diffimportant parameter in these triggering studies. It is interesting at this point to mention the differences between the weights of the moving elements that produce the transients shown in Figures 11 and 13. The solenoid-driven impactor consists of an approximately 400 g weight welded onto an armature of roughly similar weight, producing a total of about 1 kg that strikes the bottom of the plate shown in Figure 4 when the solenoid is activated. By contrast, the pneumatic impactor that prohsame order as the weight attached. So, an approximately 100 g assembly driven pneumatically against the steel plate shown in Figures 5 through 7 produces pressure transients in the water several times stronger than the electrically driven armature+weight combination, roughly ten times heavier, when it impacts the similar plate shown in Figure 4. E
We devoted the first months of both the 1997 and the 1998 programs to improving the experimental cedures used in the previous year. In 1997 (Nelson et al., 1998a), we developed: (a) two triggering niques for generating pressure transie
53

ferrosilicon drop–the hydrogen-oxygen explosion tube and the solenoid-driven impactor; and (b) a time-
dev(b) techdro Althexpstea
delay technique for firing these devices at the appropriate time. At the start of the 1998 program, we: (a) eloped a pneumatic impactor that produces stronger pressure pulses than the solenoid-driven impactor; characterized the outputs of both impactors with a tourmaline transducer; (c) developed a better nique for firing the impactor based upon the activation of a submerged photodetector as the luminous
p passes its optical axis; and (d) improved our time-resolved imaging capabilities.
ough the time devoted to developing our experimental capabilities could not be used to perform eriments, the improvements were very necessary to achieve reliable and reproducible results in areas of m explosion research that had been poorly studied in the past.
Time-Resolved Imaging
Video Imaging. By purchasing several new pieces of equipment that could be dedicated to our laboratory, we eliminated the need for viewing our video records at home with personal video equipment. This new equipment also allows us to view the tapes immediately after the experiments and with coworkers. Moreover, we are able to do the fame-by-frame viewing more rapidly and accurately because of the
ifferent and complementary characteristics of the playback VCR’d s: One VCR (the Mitsubishi HS-UG681) has a 10 frame-per-revolution rotary controller that allows us to quickly and easily scan, view and count frames of a tape forward or backward with a time resolution of 30 frames per second, while the second VCR (the Panasonic PV-4611), although more difficult to operate frame-by-frame, produces images from the same tapes at 60 frames per second. (The total cost of this video equipment, which also included a simple color monitor, was less than US$1000.) The frame-by-frame viewing capabilities of both VCR’s also permit us to take 35 mm photographs of single frame images on the video screen that are valuable for analyses of the action and for the preparation of reports. The Mitsubishi unit usually produces more stable images and better photographs. Shutter-Wheel Imaging. Time-exposed photography of the interactions through the rotating shutter wheel hown in Figure 10 adds time resolution to the time-integrates d streak photos of the falling drops, of which
5), that is difficult to obtain from the video records. Thus,
ce between the impactor and the photodetector axis (represented by the pper double-headed arrow in Figure 8). When combined with a pneumatically driven impactor that can
rge amplitudes, and with our capability of measuring these amplitudes with
Figures 16 and 17 are examples. These images can offer important additional information about the falling drops that complements the other imaging techniques, particularly if erratic fall behavior or changes in the geometries of the melt particles occur during an interaction. We have used the technique to view the entire fall of a drop during an interaction as in the shutter wheel photographs shown in Figures 22 and 25. Analyses of photographs such as these can provide not only (a) fall depth-time information about the drops comparable to that obtained by single frame analyses of the video records (see Figure 23), but also (b) information about the instantaneous fall behavior (see Figure 24) and, in some cases, (c) the shape and
nset of solidification of the drops (see Figure 2othe addition of the shutter wheel to our imaging capabilities significantly broadens our earlier perspectives of the fall histories of the drops. Triggering with a Submerged Photodetector
Placement of the photodetector at a fixed distance above the surface of the pneumatic impactor, as shown in Figures 8 and 9, has provided an important advance for the initiation of steam explosions of single drops of a molten material. It is thus possible to expose a drop of melt as it falls through water (a) to a known pressure transient after various fall times by raising or lowering the impactor in the water (represented by the lower double-headed arrow in Figure 8), and (b) to adjust the magnitude of the pressure transient seen by the drop by varying the distanuproduce pressure transients of laa calibrated tourmaline pressure transducer, we are able to expose the drops to a wide range of triggering conditions. Moreover, because of the reproducibility and quantitative knowledge of these conditions (see Figure 18), it is possible to determine thresholds for both the triggering pressures needed to initiate an explosion and for the various depths at which a given drop can be induced to explode, as shown in Tables
54
3a, 3b and 4. And in these determinations, there is now no need for extensive trial and error adjustments to synchronize the triggering system with the drop motion, as required with the time-delay relay procedure used during the 1997 studies (Nelson et al., 1998a). We feel that triggering with the submerged photodetector will require little further development for studying luminous drops of molten ferrosilicon with other diameters (the study of smaller drops of
rrosilicon is currently under consideration for the 1999 program; see Appendix C). It may be necessary,
and 4, it will be necessary to install a ore powerful pneumatic piston in the impactor canister. We will need his extra triggering strength
or axis much closer to the impactor than the 25 mm used for
Table 5, we have summarized the data from Tables 3a, 3b and 4 for the explosion thresholds of both the
sing that the application of pressure transients cannot initiate the steam
fehowever, to increase the output of the pneumatic impactor to initiate the explosions of drops with diameters smaller than 9 mm. Thus, if the drops continue to require progressively stronger triggering pulses for their explosion as their diameter decreases, as indicated in Tables 3a, 3bmbecause we cannot place the photodetecttriggering the 9 mm drops without the surface seriously deforming the images of the explosions (that is, to cause the images to appear hemispherical rather than spherical). We do not anticipate that the installation, testing and calibration of the more powerful piston would require major effort, however. We also feel that triggering with the submerged photodetector would require little further development for studying luminous drops of molten silicon or other materials important to commercial granulation operations (the study of drops of molten silicon is also being considered for the 1999 program; see Appendix C). Thresholds for Triggering Steam Explosions
In9 mm-diameter drops of Alloy 1A and the 11 mm-diameter drops of Alloy B. Table 5 indicates thresholds for both the magnitude of pressure pulses required to initiate an explosion, and for the depths at which explosions can be triggered with those pulses. Minimum Depths for Explosions
As indicated in Table 5, we learned that 9 mm-diameter drops of molten ferrosilicon could not be triggered to explode when the photodetector axis was placed at a depth as shallow as 100 mm below the surface of the water. We believe this to be an intrinsic limitation that probably applies to drops with many diameters because the drops are still undergoing rapid and intense changes in the first moments after they enter the water. With our apparatus, after they detach from the rod, the drops fall through the argon-hydrogen furnace atmosphere for 406 mm before they strike the water. Thus, they are traveling at a free fall velocity of about 2800 mm/s as they enter the water. In the next hundred or so millimeters, the drops: (a) decelerate rapidly (see Figure 24 for the change in velocity exhibited by a 11 mm-diameter drop in room temperature water); (b) pull a gas bag down with them into the water that pinches off during their deceleration (Worthington, 1908); and (c) start to establish a stable boiling film around their surfaces. During this ransition period, it is not surprit
explosions. Somewhat deeper, at 150 mm, triggering proceeded for both the 9 mm and the 11 mm drops, provided the threshold triggering pressure had been exceeded. We conclude, then, that the shallowest depth at which molten ferrosilicon drops can be triggered to explode is about 150 mm. Triggering Thresholds vs. Drop Diameter
In Table 5, it also can be seen that initiation of the steam explosions of 9 mm-diameter drops of Alloy B requires pressure transients about 4 times larger than the 11 mm-diameter drops of Alloy 1A—namely, 1.3 MPa vs. 0.3 MPa. Two comments should be made about the strong dependence of triggering strength on drop diameter:
55

Table 5Explosiveness of Ferrosilicon Drops vs. Fall Distance in Room Temperature Water
(O = No Explosion; X = Explosion)
OOOXX
300 OOOXX OOOOO XXXX
350
500 XX
Triggering Rod 1A (16 mm) Rod B(10 mm)Depth 11 mm Drops 9 mm Drops(mm) Pmax = 0.3 Mpa Pmax = 0.3 Mpa Pmax = 0.6 Mpa Pmax = 1.3 Mpa
0
50
100 OOOO
150 OXX OOOOOOOOOOOO OOOOOOOOOX O
200 OXX XXX
250 OX
400 OOOXX XXXX
450 O
O
550
600
650
700 XX
785(Bottom) XX
film that surrounds smaller drops unnerson, 1979). Thus, a stronger pressure pulse is required with smaller drops to collapse the film and
ause th ion (Ciccarelli and Frost, 1994).
ressure transient, ∆P, were to be applied to the water, only the larger drops with resholds <∆P would trigger and explode, while the smaller drops with thresholds >∆P would not. (As an
mm-iameter drop of Alloy 1A falling side by side through water at room temperature. If they are between 150
(i) This effect is probably due to the greater stability of the boiling (Gc e liquid-liquid contact that initiates the explos If it is true that there is a strong dependence of triggering strength on drop diameter, the practical effect for granulation processes would be as follows: If there is an array of drops of various diameters in film boiling in water, and if a pthexample, the simplest array we might consider is one 9 mm-diameter drop of Alloy B and one 11d
56

mm and 400 mm deep when a pressure transient of 0.3 MPa is applied to the drops, we would expect the 11 mm-diameter drop to explode while the 9 mm-diameter drop would continue to fall without exploding. But if the pressure transient should equal or exceed 1.3 MPa, both would explode.) (ii) The effect of the impurity levels on the triggering thresholds cannot be ruled out, however. Thus, because it has a very low content of Al and Ca compared to Alloy 1A (see Table 1), Alloy B somehow may require a larger pressure transient to explode. In order to remove this uncertainty about the effect of impurity levels on these thresholds, we believe it may be necessary to redo these experiments with rods of alloys with identical compositions, either with diameters of 10 mm or 16 mm. We currently have five 16 mm-diameter rods from Batch C (D-11-3) with impurity contents that are also very low, and an overall composition that is essentially identical to that of the 10 mm rods from Batch B (D-11-4) (see Table 1). We therefore propose performing a brief set of experiments with rods from Bach C to check the influence of impurity levels on the triggering threshold of 11 mm-diameter drops in room temperature water. Threshold Depths vs. Drop Diameter
In these experiments, we have learned that 11 mm-diameter drops of Alloy 1A may be triggered to explode with 0.3 MPa pulses to a maximum depth of 400 mm in room temperature water, while 9 mm-diameter drops of Alloy B may be triggered to explode with 1.3 MPa pulses to a depth of at least 785 mm, the maximum possible with our 1 m-deep water chamber (see Table 5). This effect may be the result of a cooling rate that is significantly lower for the smaller drops than for the larger drops due to the effect of drop diameter on film boiling heat transfer. But again, the same concern arises as in the previous section, namely, whether the ability to trigger the 9 mm-diameter drops to a depth almost twice that of the 11 mm-diameter drops is due to the difference in diameters or to the differences between the compositions of the alloys used. It may be that, compared to the 1A alloy, the very low impurity levels of the B alloy would allow the drops to supercool to a lower temperature before solidifying and thus be triggerable to deeper levels in the water chamber (compare with the drop behavior shown in Figure 25). And again, as in the previous section, we propose performing a brief set of experiments with drops produced from the 16 mm-diameter rods from Batch C (D-11-3) to check the influence of impurity levels on the maximum depth at which explosions can be triggered with 11 mm-diameter drops. Energetics
In order to assess the hazards associated with water granulation processes, it is important to know the amount of energy that might be released during a steam explosion. Therefore, as part of the 1997 work, we made several preliminary estimates of the pressure-volume bubble energies generated by the steam explosions of 9 mm-diameter drops of molten ferrosilicon initiated by both the solenoid-driven impactor and the hydrogen-oxygen combustion tube. These estimates were presented in Table 7 of Nelson et al. (1998a). During 1998, we have extended these estimates to both 9 mm- and 11 mm-diameter drops initiated with the pneumatic impactor that was fired with the submerged photodetector. These estimates
ere determined by measurements of bubble diameters on the time-exposed images shown in Figures 16 nd 17 and are plotted on the basis of energy per gram of melt vs. fall depth in Figure19 of this report.
red per gram of melt s the drops first enter the water (150 to 200 mm deep) are about twice as great for the 9 mm-diameter
wa In Figure 19, we see that as the drops descend deeper into the water there is a rapid decrease in the maximum energies transferred per gram of melt (that is, the outer envelope of the data points in Figure 19), consistent with rapid cooling by boiling heat transfer. The maximum energies transferadrops as for the 11 mm-diameter drops—about 48 J/g compared to about 23 J/g. But then, as the drops fall deeper in the water, the maximum energies transferred per gram of melt decrease progressively to about 8 J/g for drops of both diameters just before they no longer can be triggered to explode. We have added the data points for “spherical” explosions from Table 7 in the 1997 work (Nelson et al., 1998a) to Figure 19 as the three solid triangles designated “1997”. These points fall among the cluster of
57
lower energies per gram of melt determined in the 1998 work and suggest some consistency between the earlier and the later work. We have also included as the crosses at the top of Figure 19 the data for the “hemispherical” explosions
e feel that triggering of steam explosions at surfaces where pressure transients might occur may present reater tion than the explosions that might be triggered away from
(For the one “hemispherical” explosion analyzed during 1997, the energy transferred J/g, or almost 3% of the total available enthalpy.) These percentages are about the same as
en (Nelson et al., 1997a) that the efficiency of
observed in 1997 (Nelson et al., 1998a). (“Hemispherical” explosions occur when the triggering pulse is generated shortly after the molten drop has fallen onto the surface of the impactor.) Although this type of explosion was not studied during the 1998 work, the magnitude of the energy generated per gram of melt seems to be significantly greater than for even the most energetic “spherical” explosions that were triggered above the surface both in 1997 and 1998. In the 1997 report, we suggested that the “hemispherical” explosions may have larger magnitudes than the “spherical” explosions because heat is lost from the explosion site through only a half solid angle when the surface is present rather than the full solid angle when it is absent. Wg hazards in the industrial granulation situasurfaces in the bulk coolant. We have, therefore, included in Appendix C the investigation of steam explosions triggered at surfaces as one of the ideas for future study because of its potential importance to the industrial situation. We believe this study ought to be very fruitful because the pneumatic impactor activated by the submerged photodetector at various times after the drops contact the surface could provide excellent capabilities for this type of triggering. The nature of the surface (e.g., wettable, nonwettable, pyrolytic, etc.) might also be an important parameter for such studies. As in the 1997 work (Nelson et al., 1997a), we can now compare the enthalpy of the molten 25 wt. % Fe-75 wt. % Si ferrosilicon alloy reported by Klevan (1997) with the PVmax bubble energies transferred to the water by the steam explosions, as determined by the analyses of the bubble images that are summarized in Figure 19. As seen in this figure, we have obtained maximum pressure-volume energies that decrease from about 23 J/g to about 8 J/g for the 11 mm-diameter drops and from about 48 J/g to about 8 J/g for the 9 mm-diameter drops. From the graph in Figure 2.4 of Klevan (1997), we estimate the enthalpy of molten 25 wt. % Fe-75 wt. % Si at the liquidus temperature to be 2300 J/g. Thus the bubble energies transferred to the water per gram of melt for “spherical” explosions decrease from about 1% to about 0.3% of the total available enthalpy in the melt for the 11 mm-diameter drops and from about 2% to about 0.3% for the 9
m-diameter drops. mis about 62 those estimated during the 1997 work. Our prediction thtransfer would increase as drop diameter increased, however, was incorrect. The 1998 work has shown just the opposite–that it decreases as drop diameter increases (at least for the two drop diameters and the two alloys studied). This provides another reason for studying drops of different diameters and compositions in the future (see Appendix C). It should be noted in Table 7 of Nelson et al. (1998a) that when double bubbles occurred in an explosion (see Figures 16 and 17 of this work), both inner and outer bubbles in an explosion were reported independently. Although we have made similar measurements during the 1998 work, we have plotted only the sum of the energies of both bubbles in Figure 19. We plan to discuss the double bubbles observed
uring 1998 in a later report.
greater than 2 m/s–
d Fall Histories
By analyzing video and shutter wheel images of molten ferrosilicon drops after they enter the water, we have learned that their fall velocities (after hydrodynamic equilibration) are less than about 0.5 m/s for drops with diameters between 3 mm and 11 mm, as indicated in Figures 21 and 24. We also have an indication in Figure 21 from one experiment that as their diameters increase above 11 mm, the drop
elocities increase rapidly, with a 17 mm drop apparently falling through water atvalmost as fast as its free fall entry velocity of 2.8 m/s. Thus it seems that our largest drops, 11 mm in diameter, are at the lower threshold of a large increase in fall velocity. This is certainly important
58

knowledge for the industrial granulation process in which drop diameters in the range of 10 mm to 20 mm are considered to be the most important. The need for increasing the information about fall histories should
rovide strong impetus for future studies of larger ferrosilicon drops (see Appendix C).
the “dots” change from smooth fall and begin to tumble as they fall. This is shown learly in Figure 25 for a 9 mm-diameter drop produced in experiment D-24-1. Figure 25 also shows that a
p In addition to the basic measurements of fall distance vs. time, we have learned several other interesting aspects about the movements of the drops from the shutter wheel photographs. Careful analysis of the “dots” shown in Figure 22 indicates that the instantaneous velocity of the 11 mm-diameter drop in experiment C-268-1 decreases after it first enters the water, then fluctuates for a short while before gradually increasing toward the end of its fall through 1 m-deep water (see Figure 24). Also, careful examination of the shutter wheel images sometimes can indicate the onset of solidification of a falling drop whencdrop of molten ferrosilicon can be triggered to explode even after it has begun to solidify. (The steam explosion of a partially solidified drop of iron oxide has been reported earlier by Nelson and Duda (1985).) Because the work plans for 1997 and 1998 did not mandate study of drop fall histories, we have not devoted great effort to this area. Nevertheless, we have a large amount of archived unreduced video and shutter wheel data, plus some high-speed photographs, that pertain to the fall rates and other behavior of molten ferrosilicon drops in water. It will be interesting to compare the information obtained by both video and shutter wheel imaging of our drops with the work of Gunnerson and coworkers (1990, 1991) in which the
ttling behavior of hot, boiling spheres in subcooled water has been studied both experimentally and
. We made an approximate calculation of the amount of hydrogen that might
rage atomic weight is 35 for the FeSi alloy (Fe = 56, Si = 28); and
setheoretically. Colloidal Material
Although not mandated as part of our program for 1998, the deposition of colloidal materials in the water during steam explosions also is of considerable interest because it may relate to the underwater combustion of the ferrosilicon alloy. This interest has grown considerably since we realized in 1998 that during an explosion 10% to 20% of the weight of a drop may become suspended in the cooling water as particles of very small diameter. If our hypothesis (Nelson et al., 1998a) were correct, namely, that the colloidal material results from the gas phase combustion of the finely divided molten metal as it explodes, and if 10% to 20% of the mass of the metal is involved, the energies released by these explosions would be very serious indeed. This has prompted us, therefore, to look more carefully at the colloidal material in order to learn its origin and, particularly, its relation to combustion. In order to estimate how much of the colloidal material might be oxidic (that is, generated by the combustion of the molten ferrosilicon), we considered the generation of hydrogen, a sure indicator of
hether burning had occurredwbe generated during a steam explosion. We assumed that:
• All of the colloidal material is a combustion product; • About 20% of the drop remains suspended as colloid, i.e., 0.4 g for a 2 g drop; • The ave
• The metal-water reaction is Me + H 2O = MeO + H2. Then for 0.4 g of alloy, the number of moles of H2 generated by the metal-water reaction would be (0.4 g / 35 g) mole X 22.4 L/mole = 0.3 L at STP. If the hydrogen generated was at STP (that is, at approximately room temperature and atmospheric pressure), this volume would correspond to a single bubble 83 mm in diameter. If the hydrogen was hot, as it probably would be when generated by the melt exploding at or above its liquidus temperature, the bubble would be even larger.
59

We never observed a bubble of noncondensible gas this large during a steam explosion of a molten ferrosilicon drop. In fact, the complete steam explosion bubbles had maximum diameters of this same order
efore they collapsed; see Table 7 in Nelson et al., 1998a. Only much smaller bubbles of noncondensible
the attempt to identify the colloidal material by X-ray diffraction, we discovered that some fraction of it
i-O composition. That is, some of the material is not oxidized, but we cannot rule out the possibility that
is apparent that an estimate of the amounts of hydrogen generated during the steam explosions would t indication of the extent of combustion and the amount of oxidic products that are
bgas were observed to form and persist after the steam bubbles generated by the explosion had collapsed, however. And the bubbles of noncondensible gas that did form were generated as a collection of many tiny bubbles that resembled those in an effervescent beverage (see Figure 20 in Nelson et al., 1998a; see also Footnote 1 at the end of the Results section above). Inwas identical to the starting material because of the presence of strong crystalline patterns that coincide with pure Si and FeSi2. These patterns are identical to the patterns produced by the alloy (i.e., the starting material) prior to melting (Nelson et al., 1998a). But in the colloidal material, we also have observed a strong, broad “hump” superimposed on the sharp crystalline patterns (see Figure 26). This “hump” is thought to be related to the presence of amorphous material in the sample, possibly SiO2 or some other Fe-Ssome is.
We must modify our earlier hypothesis (Nelson et al., 1998a), then, to suggest that the suspended material is largely vaporized melt that had condensed in the water after the steam explosion, plus a smaller amount of condensed combustion product, rather than our original suggestion that the colloidal material was entirely a combustion product.
Itprovide an importanpresent in the colloidal material (see Appendix C). Perhaps other analytical techniques would be better suited to indicate the presence of oxygen-containing combustion products. Scanning electron microscopy is a good possibility because apparently it can identify phases in the Si-O-Fe system in which oxygen is present, as indicated by Bjerknes et al. (1998). Plans for Future Studies
We have suggested a number of ideas for future studies in Appendix C.
60

CONCLUSIONS
ewhat higher purity of the alloy used to prepare the 9 mm-iameter drops compared to that used to prepare the 11 mm-diameter drops, rather than to the differences
an be used to estimate the energies
released into the water during the steam explosions of the ferrosilicon drops. The maximum energies released per gram of melt just after the drops enter the water are about 23 J/g and 48 J/g for drops with diameters of 11 mm and 9 mm, respectively. Both energy releases decrease progressively to about 8 J/g as the drops descend to depths just before they no longer can be triggered to explode. These maximum energies released per gram of melt correspond to about 1% and 2%, respectively, of the total available enthalpy of the molten ferrosilicon at its liquidus temperature. By examination of both video and time-resolved photographic images, important information can be obtained about the histories of the drops as they fall through the water. The video images show that the fall velocities are somewhat less than 0.5 m/s for drops with diameters between 3 mm and 11 mm. But there is also evidence that the velocities increase rapidly to greater than 2 m/s as the drop diameters increase to about 17 mm. Time-exposed photographs recorded through a rotating shutter wheel provide timed “dot” images as the drops fall that complement and extend the information obtained from the video analyses. The photographic technique has been used to confirm the fall time vs. depth behavior obtained from the video images. Careful examination of the “dots” and their spacing has shown that instantaneous velocities of the drop can vary significantly as the drops descend. Moreover, after appearing smooth and regular for most of the descent, the “dots” sometimes begin to tumble late in the fall. We attribute the start of tumbling to the onset of solidification of the drop. Moreover, one of the drops was triggered to explode after the tumbling began,
We have remeasured the peak pressure generated with the solenoid-driven impactor with a reliable tourmaline transducer-high-speed oscilloscope combination to be 0.129 ± 0.023 MPa (±18%) at 102 mm. We conclude that the peak pressure of nominally 1 MPa at 45 mm above the impactor at a depth of 200 mm, measured with a quartz transducer and cited in the 1997 work as sufficient for triggering a 9.2 mm molten drop of nonalloyed ferrosilicon, is incorrect. The actual value must be corrected to nominally 0.3 MPa. We also conclude that the pneumatic impactor developed during 1998 can produce peak pressures at the same distance in water that are several times larger than the solenoid-driven impactor used in the 1997 studies. Moreover, the pneumatic impactor can easily be modified to increase or decrease the peak pressures, which is difficult to achieve with the solenoid-driven impactor. And, the pneumatic impactor produces triggering pressure transients at the location of the explosion accompanied by very little electrical noise compared to the solenoid-driven impactor. This minimal electrical noise in the vicinity of the explosion should prove valuable while making transducer measurements of the pressure-time signatures emitted during the steam explosions of molten ferrosilicon drops. Our improved technique for triggering with a photodetector submerged in the water has allowed us to determine (a) the strength of the pressure transients needed to initiate the steam explosion of a single drop of molten ferrosilicon (75 wt % Si) released at its liquidus temperature into water, and (b) the range of fall depths over which the drop can be triggered to explode with this transient. Drops with diameters of 11 mm can be triggered to explode with 0.3 MPa pressure transients at depths between 150 mm and 400 mm in water at room temperature. But drops with diameters of 9 mm released similarly require trigger pulses 4 times larger to explode–1.3 MPa. The explosions of the 9 mm-diameter drops, however, may be initiated over a much wider range of depths–from 150 mm to at least 785 mm, the maximum depth possible with our current apparatus. We cannot rule out the possibility, however, that the differences in behavior may be due to the somdbetween drop diameters.
Analyses of the time-exposed photographic images of the explosions c
61

suggesting that steam explosions may occur either in a completely molten drop or in a partially solidified
gh the formation of hydrogen bubbles indicates that some combustion occurs during the explosions,
ribe this work also have been bmitted to the sponsor on July 1, 1998 (Nelson et al., 1998b) and on and December 31, 1998 (Nelson et
ccessed via the Internet link http://www.ub.ntnu.no/dravh/000057.pdf
drop. During a steam explosion of the sort just described, as much as 20% of the weight of the molten drop may be deposited in the water as a fine colloidal suspension that settles out very slowly. Preliminary attempts to identify the suspended material by inductively coupled plasma mass spectrometry and by X-ray diffraction have not been definitive. Most of the material seems to have the same composition as the starting material.
lthouAas yet, no oxygen-containing solids have been detected. ACKNOWLEDGEMENTS
We are grateful to SINTEF Materials Technology, Trondheim, Norway, for supporting this work. We are also grateful to Dr. Trond Bergstrøm of SINTEF for his continuing interest in this work.
FINAL NOTES
This document originally was submitted to the sponsor, SINTEF Materials Technology, Trondheim, Norway, on March 15, 1999, as the draft final report that describes the research performed at the University of Wisconsin-Madison during 1998. Two informal letter reports that descsual., 1998d); in addition, an informal summary report was submitted on October 1, 1998 (Nelson et al.,1998c). Much of the information included in this report was summarized by L. S. Nelson at the Ferrolegeringsseminar, Trondheim, Norway, October 21 to 22, 1998. Related research has been performed at NTNU, the Norwegian Technological University, Trondheim, Norway, under the direction of Professor Johan Kr. Tuset, and has been described in the thesis “Steam explosions during granulation of Si-rich alloys: Effect of Ca- and Al-additions” by Kjetil Hildal, dated 25 March, 2002. It may be a .
62

REFERENCES
jerknB es, T. M., Morsund, S., and Tuset, J. K., 1998, “Oxidation of Liquid Silicon and Si-Rich Alloys,” Ferrolegeringsseminar, Trondheim, Norway, October 21 to 22. Ciccarelli, G., and Frost, D.L., 1994, "Fragmentation Mechanisms Based on Single Drop Steam Explosion Experiments Using Flash X-ray Radiography," Nucl. Eng. Des. 146, 109-132. Forwald, K., 1991, Private communication via Dr. Young Lee, Elkem Research, Pittsburgh, PA. Gunnerson, F. S., 1979, Film Boiling Destabilization from Hydrodynamic and Thermodynamic Considerations, Thesis (Ph. D.W., 1979, Film Boiling Dest
), University of New Mexico. See also Gunnerson, F. S., and Cronenberg, A. abilization from Hydrodynamic and Thermodynamic Considerations with
Application to the Understanding of Vapor Explosion Phenomena, U. S. Nuclear Regulatory Commission, Washington, D. C., Technical Report No. NE-66(79) NRC-318-1, April, 1979.
unnerson, F. S., Meyer, J. A., Chappidi, P. R., and Zeyen, R., (1990), “The Settling Behavior of Hot, Boiling Spheres in Subcooled Water,” 5th Int'l Symposium on Multi-Phase Transport and Particulate,
Dec 12-14,1988, published in proceedings, pp. 337-344 (1990).
G
Miami Beach, FL, Gunnerson, F. S., and Chappidi, P. R., (1991), “The Behavior of Free Failing Boiling Spheres with Relation to Vapor Explosion Phenomena,” 13th ICDERS, July 28-Aug 2, 1991, Nagoya, Japan. Jarvis, K.E., Gray, A.L., and Houk, R.S., 1992, Handbook of Inductively Coupled Plasma Mass Spectrometry, Blackie & Son Ltd., Published in the USA by Chapman and Hall. Klevan, O. S., 1997, Removal of C and SiC from Si and FeSi during Ladle Refining and Solidification, Dr. Ing. Thesis, Department of Metallurgy, The Norwegian University of Science and Technology, Trondheim, Norway. Nelson, L. S., and Duda, P. M., 1985, Steam Explosion Experiments with Single Drops of Iron Oxide Melted with a CO2 Laser. II. Parametric Studies, Sandia National Laboratories, Albuquerque, NM, SAND82-1105, April 1985. Nelson, L. S., Duda, P. M., and Hyndman, D. A., 1994, “Interactions Between Drops of a Molten Aluminum-Lithium Alloy and Liquid Water,” Metallurgical and Materials Transactions B, 25B, 623-625. Nelson, L. S., Bonazza, R., and Corradini, M. L., 1996, Formation of 10-20 mm Drops of Molten Ferrosilicon, University of Wisconsin-Madison, Report UWFDM-1027. Nelson, L. S., Bonazza, R., Brooks, P. W., and Corradini, M. L., 1997, Quenching 10-20 mm-Diameter Drops of Molten Ferrosilicon in Water and on Solids, Informal Letter Report to SINTEF Materials Technology, Trondheim, Norway, March 13, 1997. Nelson, L. S., Brooks, P. W., Bonazza, R., and Corradini, M. L., 1998a, Steam Explosions of Molten Ferrosilicon Drops Released into Water: Effects of Triggering, Alloying and Water Temperature, Draft Final Report to SINTEF Materials Technology, Trondheim, Norway, March 15, 1998. Nelson, L. S., Brooks, P. W., Bonazza, R., and Corradini, M. L., 1998b, Pressure Transients Generated by Solenoid-Driven and Pneumatic Impactors for Triggering Steam Explosions of Single Drops of Molten Ferrosilicon Alloys, Informal Letter Report to SINTEF Materials Technology, Trondheim, Norway, July 1, 1998.
63

Nelson, L. S., Brooks, P. W., Bonazza, R., Corradini, M. L., and Hildal, K., 1998c, Triggered Steam Explosions of Molten Ferrosilicon Drops: Explosiveness as Water Depth Increases; Colloidal Material Deposited in the Water During the Explosions, Informal Summary Report (Draft), October 1, 1998. Nelson, L. S., Brooks, P. W., Bonazza, R., and Corradini, M. L., 1998d, Triggered Steam Explosions of Molten Ferrosilicon Drops: Ability to Trigger the Explosions at Vario
ater Depths; Energetics of the Explosions; Fall Histories; Colloidal Material Depous
W sited During the Explosions, Informal Letter Report to SINTEF Materials Technology, Trondheim, Norway, Dec
998. ember 31,
1 Worthington, A. M., and Cole, R. S., 1900, “Impact with a Liquid Surface Studied by the Aid of Instantaneous Photography. Paper II,” Phil. Trans. Roy. Soc. (London) 194A, 175-199; see also Worthington, A. M., 1908, “A Study of Splashes,” Longmans, Green and Company, London.
64

APPENDIX A
Synopsis of reports and articles prepared for SINTEF Materials Technology, Trondheim, Norway, by the
n
Lloyd S. Nelson, Riccardo Bonazza, Paul W. Brooks and Michael L. Corradini; “Quenching 10-20 mm-
Mo-I-Rana, Norway, April 8, 1997.
4. Lloyd S. Nelson, “Results from Explosion Tests”, Seminar at Mo-I-Rana, Norway, April 8, 1997. 5. Lloyd S. Nelson, Paul W. Brooks, Riccardo Bonazza and Michael L. Corradini; “Generation of
Pressure Transients for the Initiation of Steam Explosions of Single Drops of Melt”, Informal Letter Report (Draft), June 30, 1997.
6. Lloyd S. Nelson, Paul W. Brooks, Riccardo Bonazza and Michael L. Corradini; “Release of Molten
Ferrosilicon Drops into Water: Effects of Triggering and Alloying”, Informal Letter Report (Draft), September 1, 1997.
7. Lloyd S. Nelson, Paul W. Brooks, Riccardo Bonazza and Michael L. Corradini; “Release of Molten
Ferrosilicon Drops into Water: Part 2 Effects of Triggering, Alloying and Water Temperature”, Informal Letter Report (Draft), December 31, 1997.
8. Lloyd S. Nelson, Paul W. Brooks, Riccardo Bonazza and Michael L. Corradini; “Generation of
Pressure Transients in Water for Triggering Steam Explosions of Single Drops of Melt: A Simple and Inexpensive Mechanical Impactor”, Paper intended for publication (Draft), March 11, 1998.
9. Lloyd S. Nelson, Paul W. Brooks, Riccardo Bonazza and Michael Corradini; “Steam Explosions of
Molten Ferrosilicon Drops Released into Water: Effects of Triggering, Alloying and Water Temperature”, Final Report (Draft), March 15, 1998.
University of Wisconsin-Madiso 1. L.S. Nelson, R. Bonazza and M.L. Corradini; “Formation of 10-20 mm Drops of Molten Ferrosilicon”,
University of Wisconsin-Madison Report No. UWFDM-1027, June, 1995. 2.
Diameter Drops of Molten Ferrosilicon in Water and on Solids”, Draft, March 1997. 3. Lloyd S. Nelson, “Review of Steam Explosions Emphasizing Single Drops”, Seminar at
65
10. Lloyd S. Nelson, Paul W. Brooks, Ricc Michael L. Corradini; “Release of Molten
Ferrosilicon Drops into Water: Effects of Tr gering and Alloying”, SINTEF/UW Review and
1. Lloyd S. Nelson, Paul W. Brooks, Riccardo Bonazza and Michael L. Corradini; “Pressure Transients
, 1998.
rops of a Molten Ferrosilicon Alloy”, Paper intended for publication (Draft), August 17, 1998.
13. W. Brooks, Riccardo Bonazza, Michael L. Corradini and Kjetil Hildal; “Triggered Steam Explosions of Molten Ferrosilicon Drops: Explosiveness as Water Depth Increases;
raft), October 1, 1998.
14. of Molten Ferrosilicon Drops”, Presentation at Ferrolegeringsseminar,
Trondheim, Norway, October 21, 1998.
15. xplosions of Molten Ferrosilicon Drops: Ability to Trigger the Explosions at
Various Water Depths; Energetics of the Explosions; Fall Histories; Colloidal Material Deposited
16. za and Michael L. Corradini; “Triggering Steam
Explosions of Single Drops of a Molten Ferrosilicon Alloy with a Simple Encapsulated Mechanical
7. Lloyd S. Nelson, Paul W. Brooks, Riccardo Bonazza and Michael L. Corradini and Kjetil Hildal,
March 15, 1999.
ardo Bonazza andig
Discussions, May 27 and 28, 1998.
1Generated by Solenoid-Driven and Pneumatic Impactors for Triggering Steam Explosions of Single Drops of Molten Ferrosilicon Alloys”, Informal Letter Report (Draft), July 1
12. Lloyd S. Nelson, Paul W. Brooks, Riccardo Bonazza and Michael L. Corradini; “A Simple
Encapsulated Mechanical Impactor for Triggering Steam Explosions of Single D
Lloyd S. Nelson, Paul
Colloidal Material Deposited in the Water During the Explosions”, Informal Summary Report (D
Lloyd S. Nelson, Paul W. Brooks, Riccardo Bonazza, Michael L. Corradini and Kjetil Hildal; “Triggered Steam Explosions
Lloyd S. Nelson, Paul W. Brooks, Riccardo Bonazza, Michael L. Corradini and Kjetil Hildal; “Triggered Steam E
During the Explosions”, Informal Letter Report (Draft), December 31, 1998.
Lloyd S. Nelson, Paul W. Brooks, Riccardo Bonaz
Impactor”, Paper submitted for publication in Metallurgical and Materials Transactions B, January 16, 1999.
1“Triggered Steam Explosions of Molten Ferrosilicon Drops: Behavior of Solenoid-Driven and Pneumatic Impactors; Ability to Trigger the Explosions at Various Water Depths; Energetics of the Explosions; Fall Histories; Colloidal Material Deposited During the Explosions,” Final Report (Draft),
66

APPENDIX B
Review and Discussion of the
1996 and 1997 Work at the University of Wisconsin
andng ows.
On May 27 and 28, 1998, we hosted a two-day review and discussion of the research on the quenching
triggered steam explosions of molten ferrosilicon drops performed at the Department of ineering Physics, University of Wisconsin-Madison. The agenda for this session follE
Trondheim, Norway
EVISED AGENDA
Visit of Drs. Trond Bergstrøm, Karl Forwald and Birger Andresen.
SINTEF Materials Technology
Wednesday and Thursday, May 27 and 28, 1998
R
Wednesday, May 27, 1998
0 Arrive at Engineering Research Building. Proceed to Room ERB 4 080 14.
Welcome Professor M. L. Corradini
L. S. Nelson
100
ng and Drop Release R. Bonazza Triggering Others
Imaging 1200 Depart for Luncheon. Continue discussions as desired. 1330 Discussion of Results, 1996,1997, ERB414 L. S. Nelson Steam Explosions R. Bonazza
Effects of Alloying, Water Temperature Others Combustion and Colloidal Materials
Debris 1001 Adjourn
Opening Remarks Dr. Trond Bergstrøm Professor R. Bonazza
Initial Discussions SINTEF Personnel
0900 Laboratory Demonstration. ERB 1408 P. W. Brooks
Discussion of Experimental Matters. L. S. Nelson
0 Discussion of Experimental Matters, ERB 414 L. S. Nelson Melti
67

Thursday, May 28, 1998
800 Reassemble in ERB 414. Informal discussions.
830 In
000 Plans for 1998 L. S. Nelson Effects of Drop Diameter R. Bonazza Suppression Others
1130 Adjourn for
1330 Visit Stoughton, WI, Site 1500 Return to offices, ERB
Plans for 1999, 2000 All Topics for Th
Other matters
0 0 terpretation of 1996, 1997 Results L. S. Nelson
Bubble Energetics R. Bonazza Threshold Pressures for Triggering Others Weber Phenomena
1
Luncheon
esis
1630 Adjourn
68

APPENDIX C
uggested Topics for Future Studies
In this appendix ursued in 1999 and future years. These ideas are ted by Lloyd S. Nelson during his visit to NTNU, Trondheim, Norway
Topics for Futur
r require graphite crucibles and a deeper water chamber)
nts for triggering sions
aFall his
s
Effects of Alloy Purity on Thresholds Threshold pressure transients for triggering Threshold depths for explosions Compare drops with identical purities but different diameters
• Superheated Drops (Will probably require graphite crucibles) Effects of alloying (Will Al, Ca still suppress explosions?) Threshold pressure transients for triggering Threshold depths for explosions
• Triggering at Surfaces (“Hemispherical” explosions) Energetics Effect of trigger strength Effect of delays after drops land Effect of surface coatings
S
, we list a numberssentially as presen
of ideas for studies that might be pe
on October 19, 1998.
e Studies:
• La ger Drops (Will probabFall histories
ly
Threshold pressure transieThreshold depths for explo
• Sm ller Drops (Will probably require significantly increased triggers)
tories for triggering Threshold pressure transients
Threshold depths for explosion
•
69

• Combustion
Generation of hydrogen nts
Analyses of video and Hycam bubble images (reflected light, deep water explosions to allow bubbles to coalesce)
Identify as boiled down material (XRD, XRF, SEM, other analytical techniques)
ounts (Boil dry and weigh solids that remain)
Is this due to
perature)
s a microphone)
• Sup
• Deb xplosions (sieve analyses)
• Molten Silicon Drops
Compare with the behavior of molten ferrosilicon drops.
Volumetric measureme
Combustion products Colloidal material deposited in the water
Identify as water suspension (ICPMS)
Am
s (Does the composition of fines differ from that of granules? Debricombustion of smaller particles?)
Luninosity patterns
• Energetics n drop diameter Dependence o
Dependence on depth of explosion (melt temRelationship to debris diameters
• Pressures generated by the falling drop(Use tourmaline transducer + oscilloscope orBoiling transitions Other transitions
• Pressures generated by the explosions (Use tourmaline transducer + oscilloscope) pressive schemes
ubbles BDissolved gases
f the coolant Viscosity o
ris ced in eDiameters of debris produ
Quality and texture of granules vs. quenching conditions
70