Utility of geo-informatics for disaster risk management ... · PDF fileUtility of...
64
Utility of geo-informatics for disaster risk management: linking structural damage assessment, recovery and resilience Dr. Norman Kerle, ESA Department ITC-OOA-Group ERDT Visiting Professor
Transcript of Utility of geo-informatics for disaster risk management ... · PDF fileUtility of...
Utility of geo-informatics for disaster risk management: linking structural damage
assessment, recovery and resilience
Dr. Norman Kerle, ESA DepartmentITC-OOA-Group
ERDT Visiting Professor
…back in Tacloban
UPVTC - Geoinformatics for DRM - 2014
2
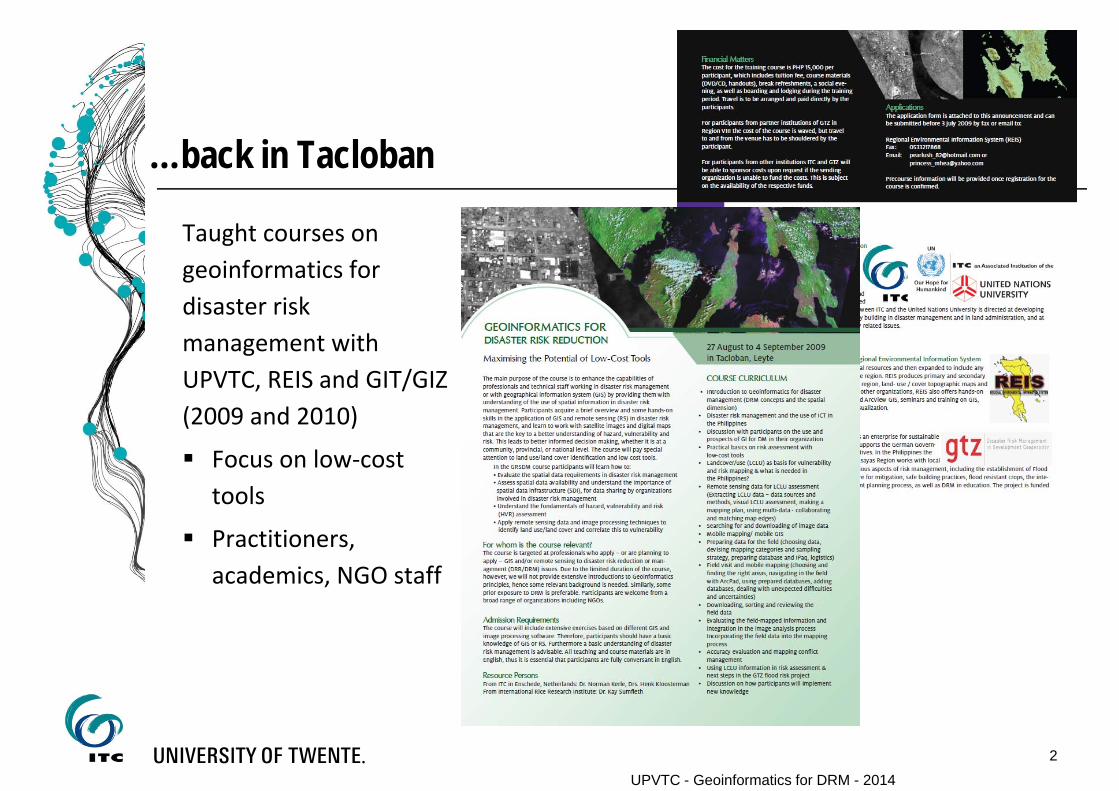
Taught courses on geoinformatics for disaster risk management with UPVTC, REIS and GIT/GIZ (2009 and 2010)
Focus on low‐cost tools
Practitioners, academics, NGO staff
…back in Tacloban
UPVTC - Geoinformatics for DRM - 2014
3
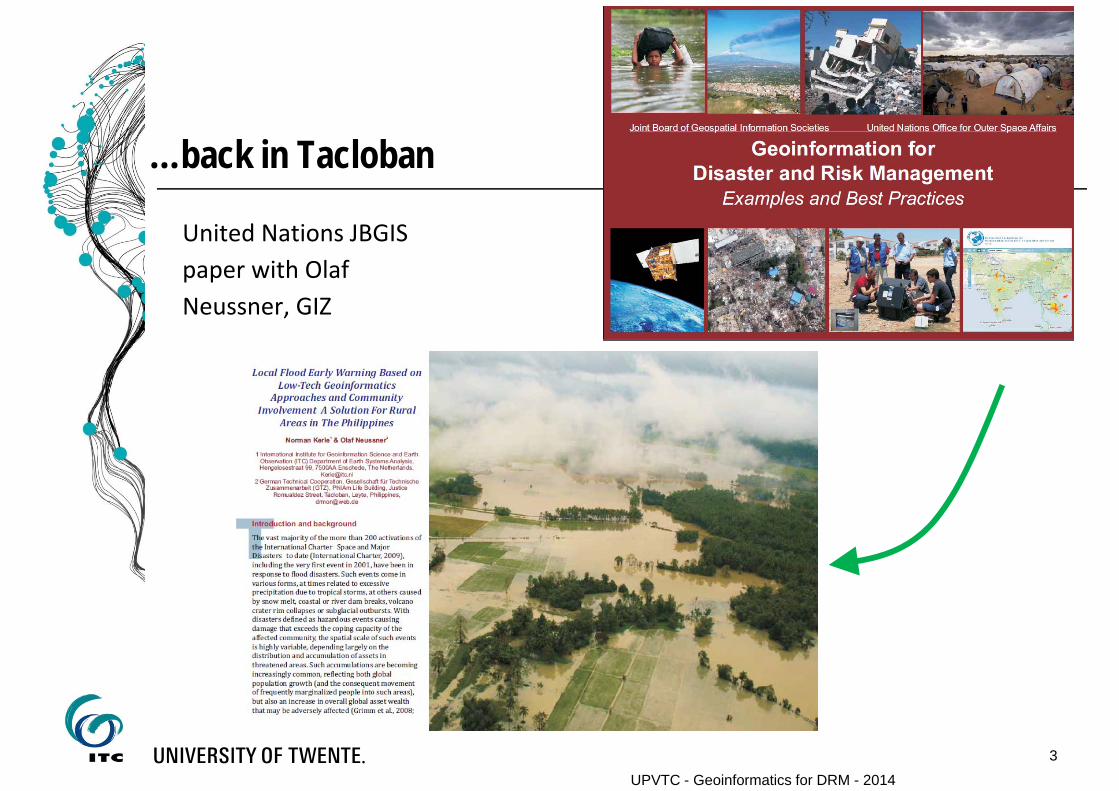
United Nations JBGIS paper with Olaf Neussner, GIZ
…back in Tacloban
UPVTC - Geoinformatics for DRM - 2014
4
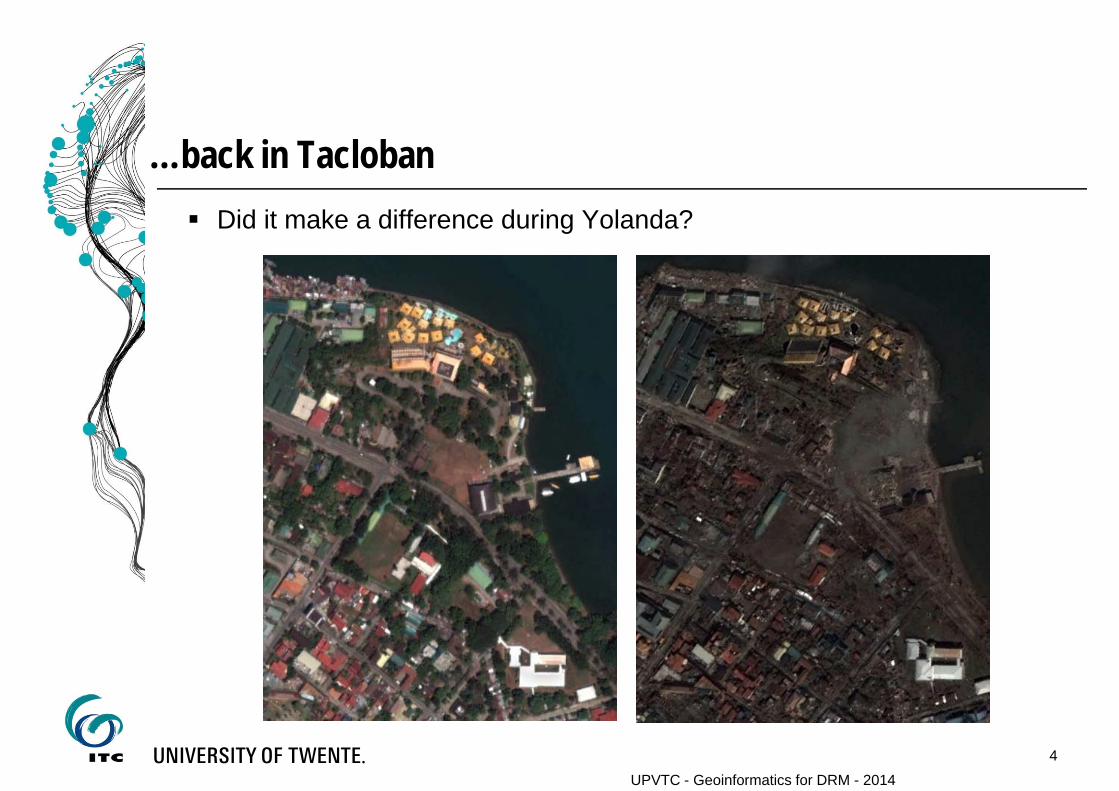
Did it make a difference during Yolanda?
…back in the Philippines
UPVTC - Geoinformatics for DRM - 2014
5
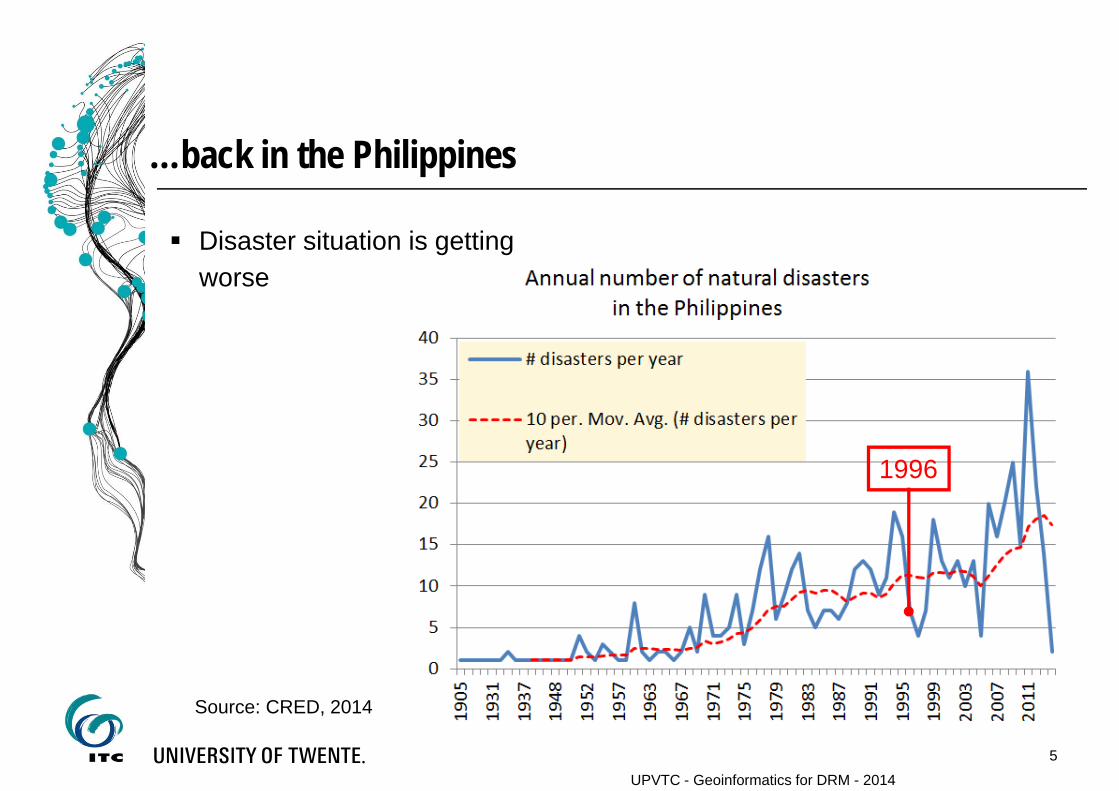
Source: CRED, 2014
Disaster situation is getting worse
1996
UPVTC - Geoinformatics for DRM - 2014
My background Image-based damage mapping Limits of vertical imagery and prospect of oblique data Prospect of crowdsourcing
Lack of coordination and user needs understanding What comes after a disaster – tracking recovery Linking recovery and resilience
Lecture outline
6

UPVTC - Geoinformatics for DRM - 2014
ITC/University of Twente (Enschede, The Netherlands) PhD in geography/ Volcano remote sensing (Uni Cambridge) Geoinformatics for disaster risk management
(hazard/risk/vulnerability/damage)
www.unu-drm.nl
Training & capacity building Knowledge development and
research collaboration Advisory services
Me @ ITC
My background
7
8
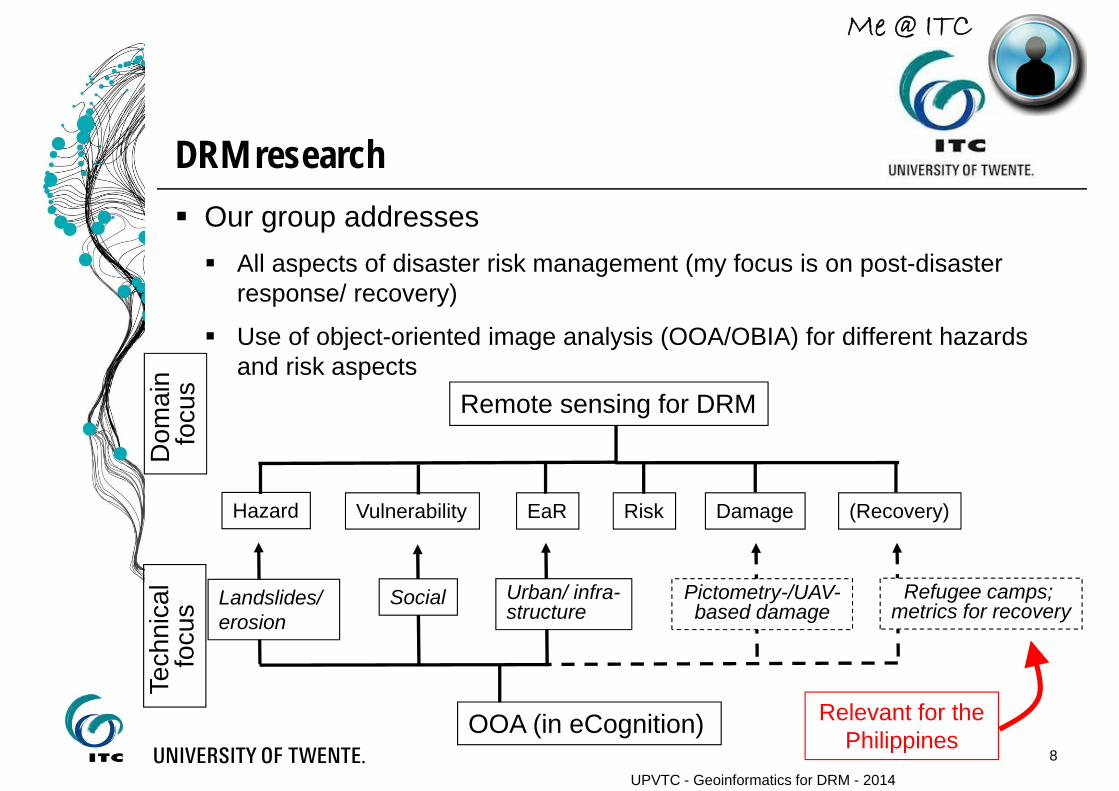
DRM research
UPVTC - Geoinformatics for DRM - 2014
Our group addresses All aspects of disaster risk management (my focus is on post-disaster
response/ recovery)
Use of object-oriented image analysis (OOA/OBIA) for different hazards and risk aspects
Vulnerability EaR Risk Damage (Recovery)
Remote sensing for DRM
Hazard
Dom
ain
focu
sTe
chni
cal
focu
s
OOA (in eCognition)
Landslides/ erosion
Social Urban/ infra-structure
Refugee camps; metrics for recovery
Pictometry-/UAV-based damage
Relevant for the Philippines
Me @ ITC
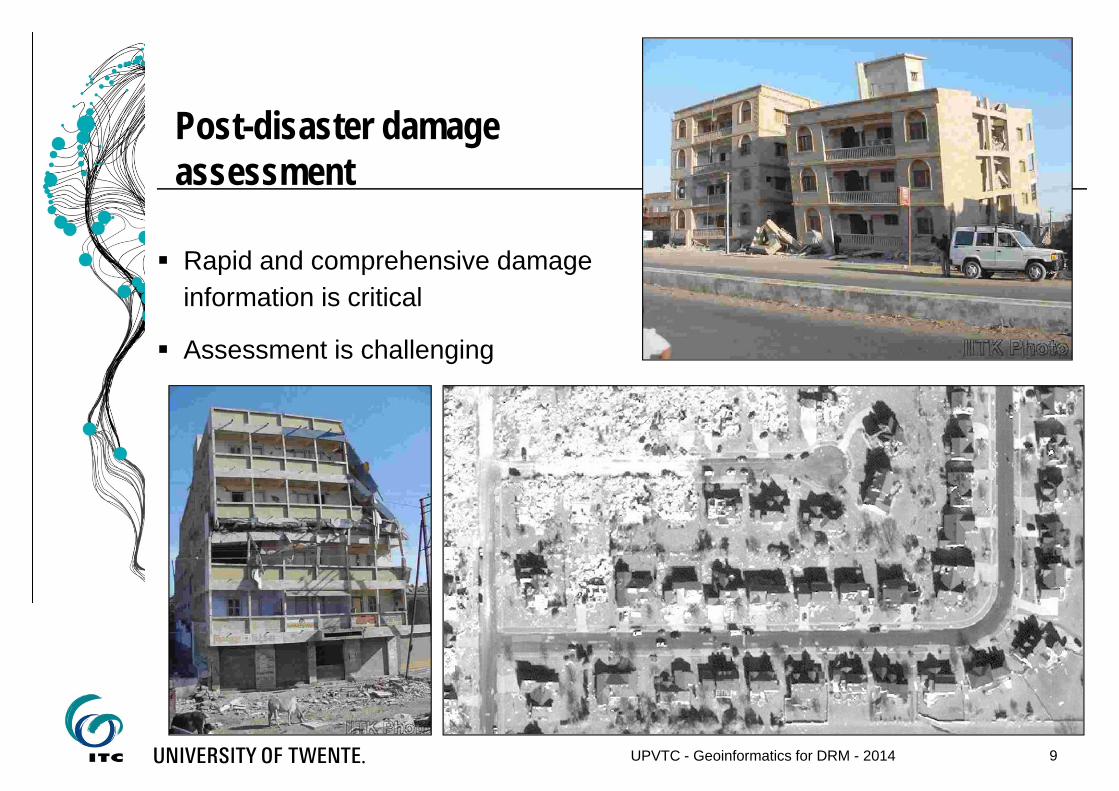
Rapid and comprehensive damage information is critical
Assessment is challenging
9UPVTC - Geoinformatics for DRM - 2014
Post-disaster damage assessment
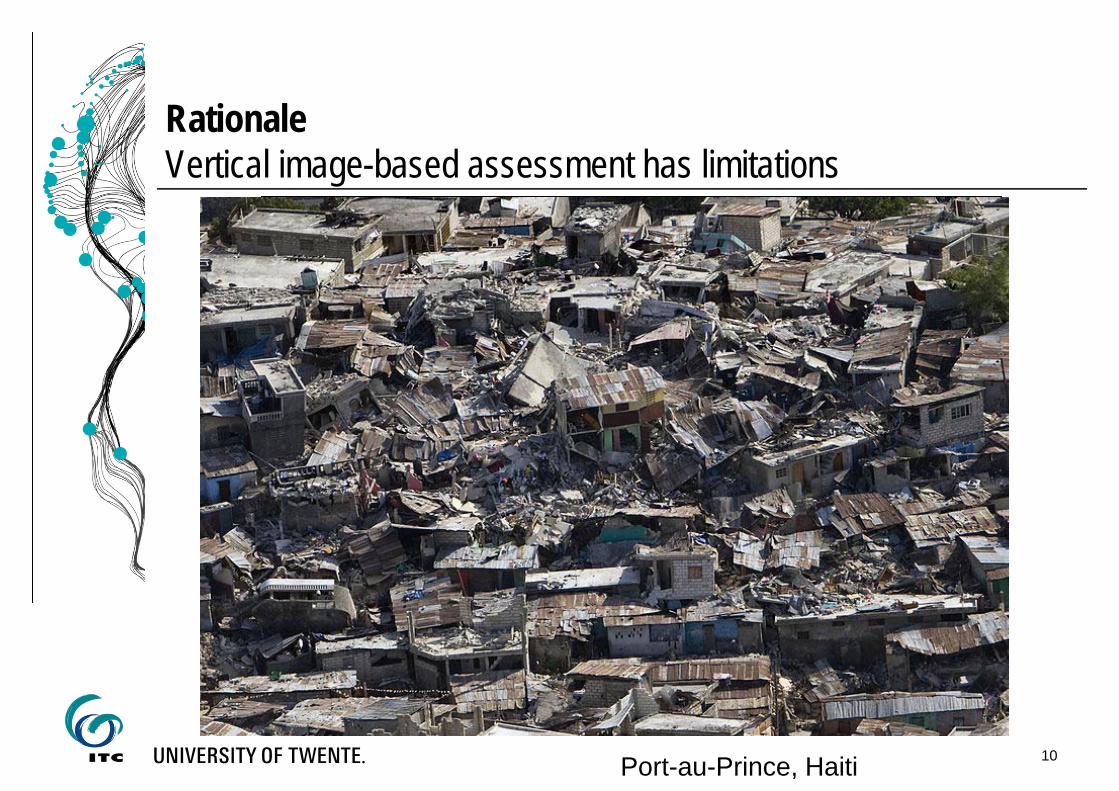
10Port-au-Prince, Haiti
RationaleVertical image-based assessment has limitations
11
• What is damage?
• Structural damage (destroyed buildings, etc.)
• Damage to nature
• Damage to systems/ functional damage (economic, social,
economic, etc.)
• Direct vs. indirect
-> anything that is of value and can be adversely affected
• This is relevant for our discussion on hazards, since disasters can
both highlight existing hazards, or change them
Principal questions and considerations
UPVTC - Geoinformatics for DRM - 2014

What are we really trying to do? Advise the government on the consequences of a disaster
event? Aid in immediate disaster response Assess the potential for secondary disaster Guide clean-up and reconstruction?
Rapid and comprehensive data suitable for many stakeholders are needed – only a remote sensing approach is useful
Principal questions and considerations
12UPVTC - Geoinformatics for DRM - 2014
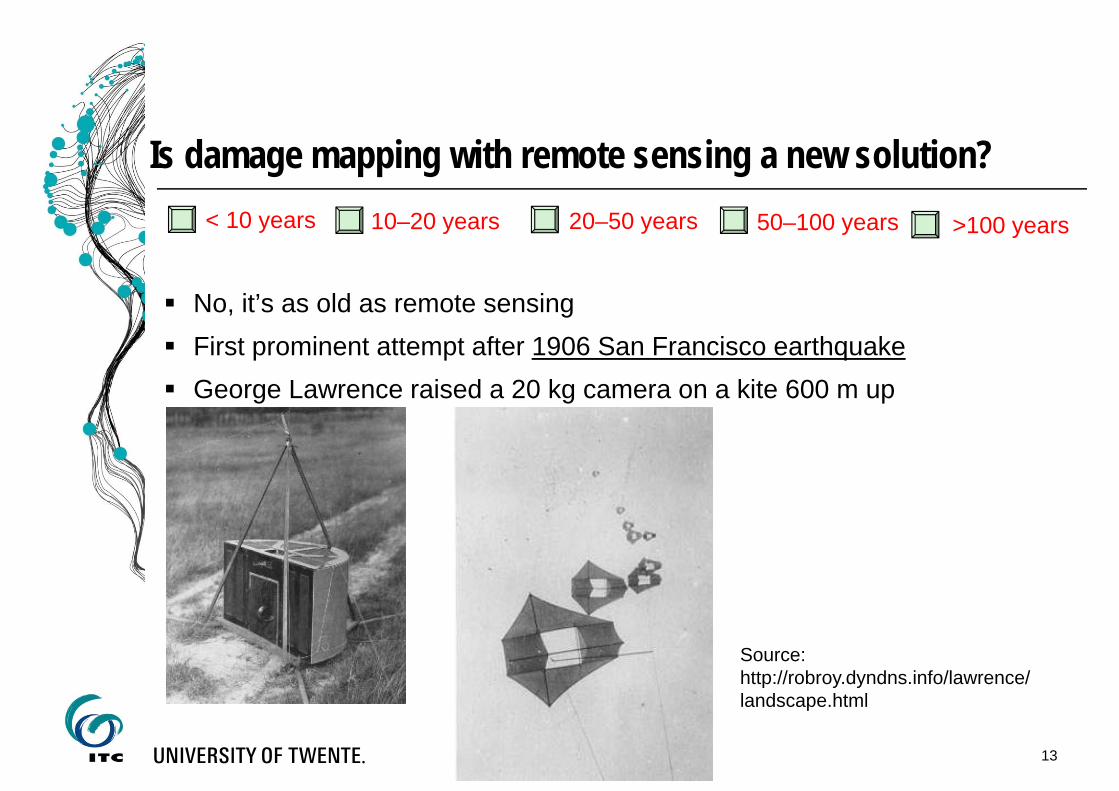
No, it’s as old as remote sensing First prominent attempt after 1906 San Francisco earthquake George Lawrence raised a 20 kg camera on a kite 600 m up
Is damage mapping with remote sensing a new solution?
Source: http://robroy.dyndns.info/lawrence/landscape.html
13
< 10 years 10–20 years 20–50 years 50–100 years >100 years
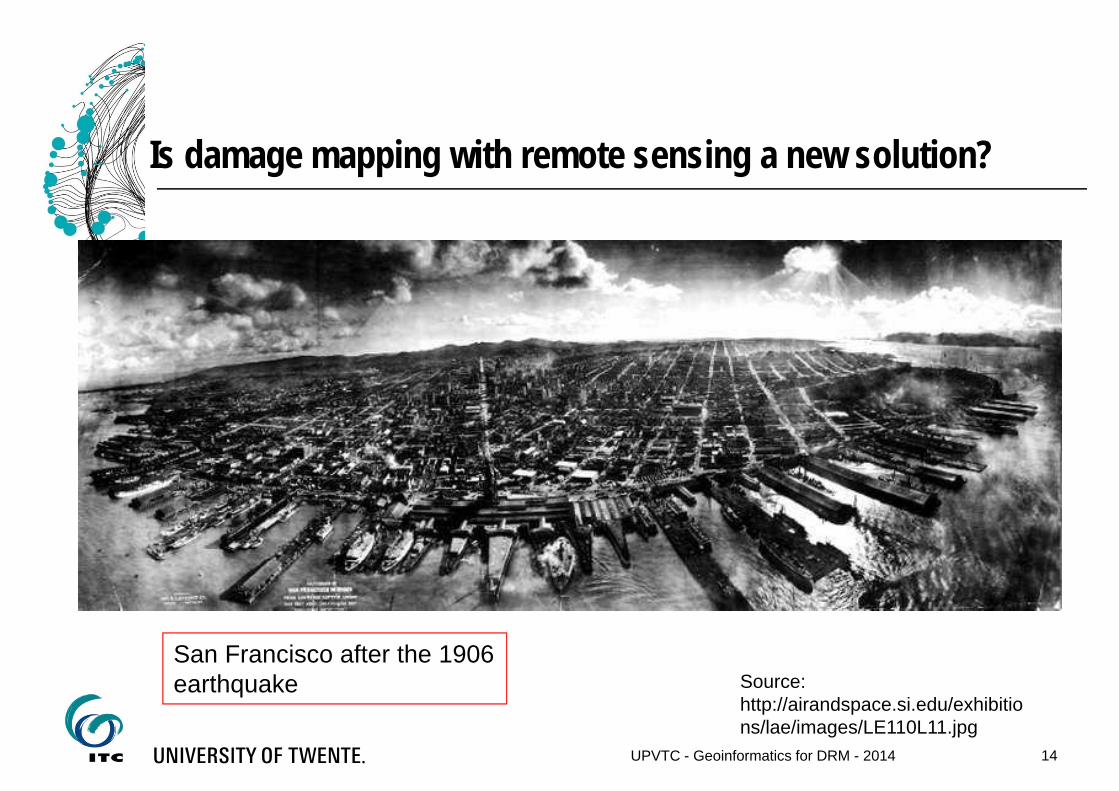
Is damage mapping with remote sensing a new solution?
Source: http://airandspace.si.edu/exhibitions/lae/images/LE110L11.jpg
San Francisco after the 1906 earthquake
14UPVTC - Geoinformatics for DRM - 2014
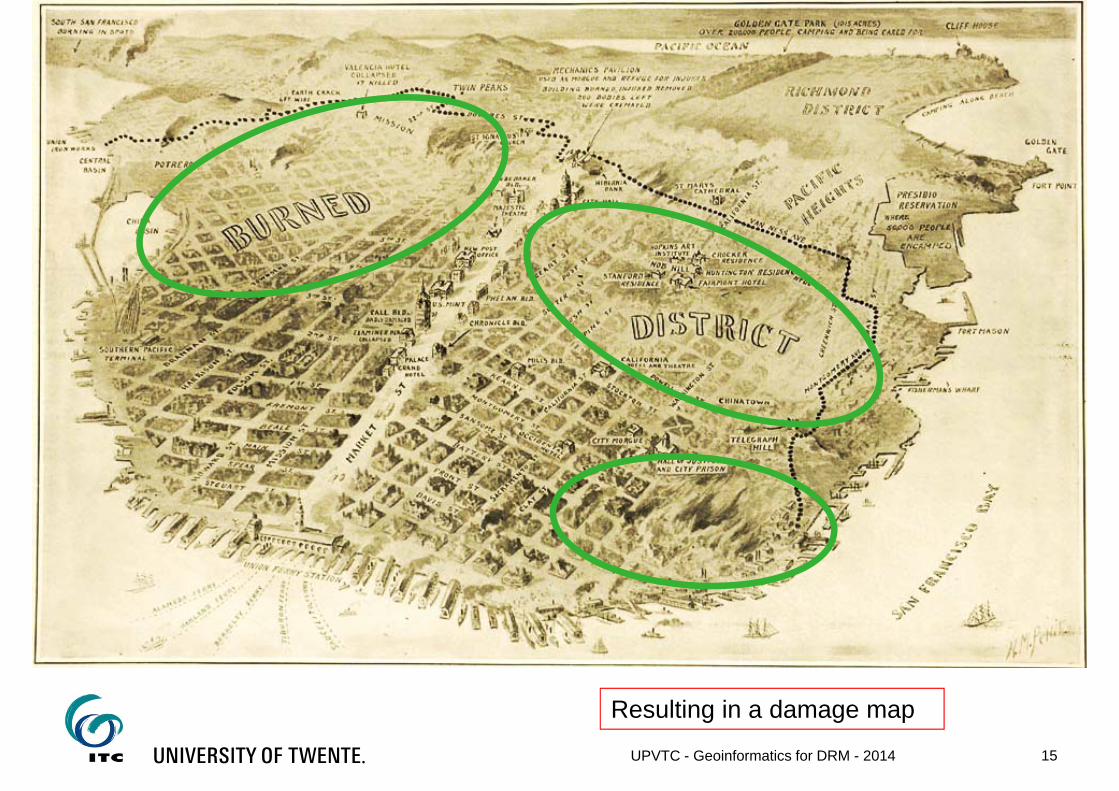
Resulting in a damage map
15UPVTC - Geoinformatics for DRM - 2014
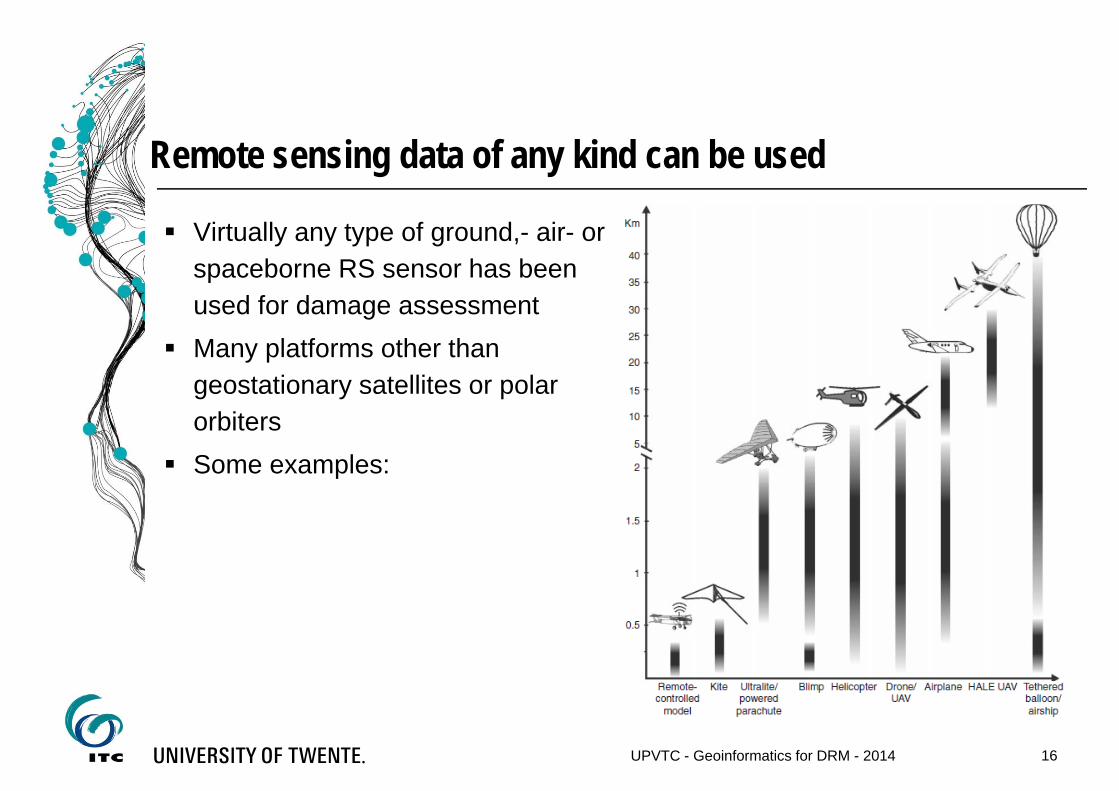
Virtually any type of ground,- air- or spaceborne RS sensor has been used for damage assessment
Many platforms other than geostationary satellites or polar orbiters
Some examples:
Remote sensing data of any kind can be used
16UPVTC - Geoinformatics for DRM - 2014
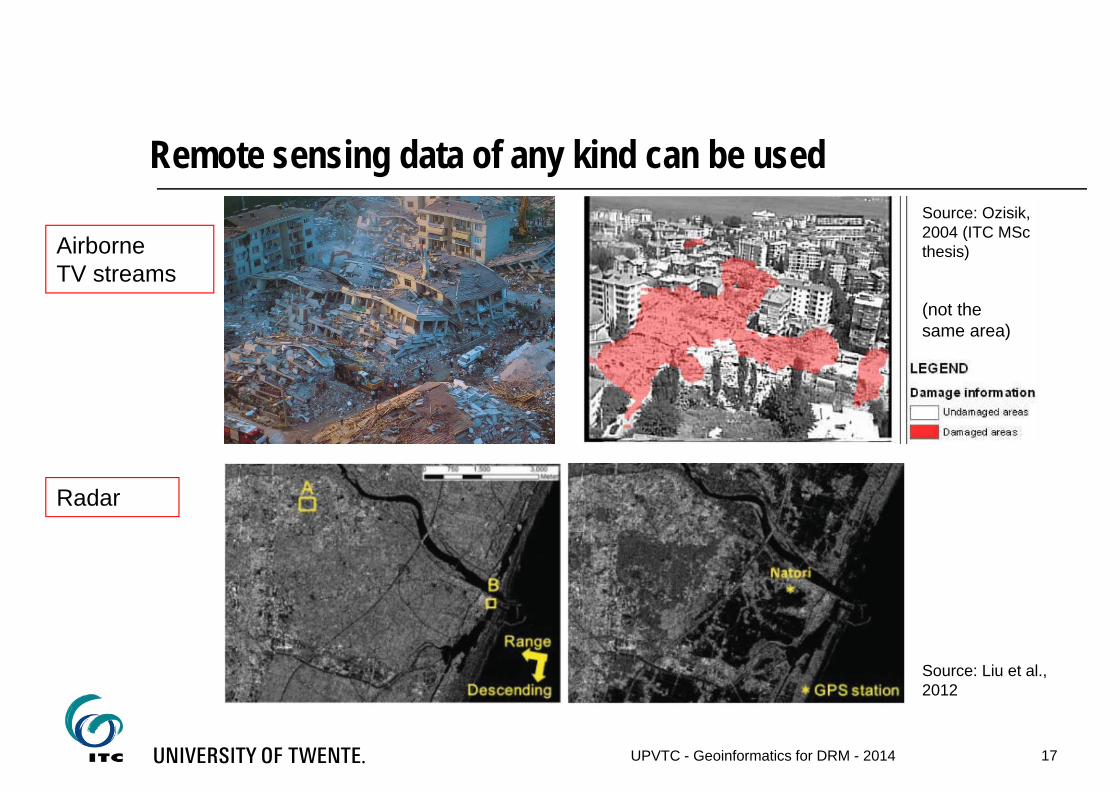
Remote sensing data of any kind can be used
Airborne TV streams
(not the same area)
Radar
Source: Ozisik, 2004 (ITC MSc thesis)
Source: Liu et al., 2012
17UPVTC - Geoinformatics for DRM - 2014
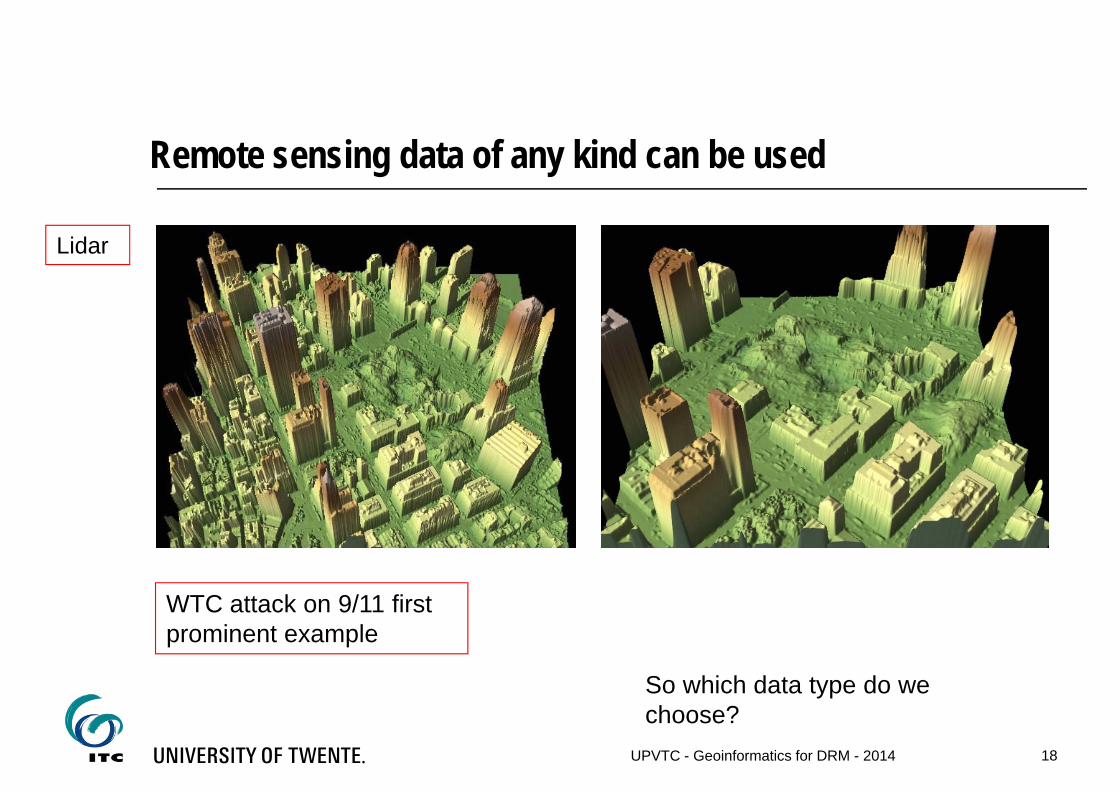
Remote sensing data of any kind can be used
Lidar
WTC attack on 9/11 first prominent example
So which data type do we choose?
18UPVTC - Geoinformatics for DRM - 2014

The scale factor
19UPVTC - Geoinformatics for DRM - 2014
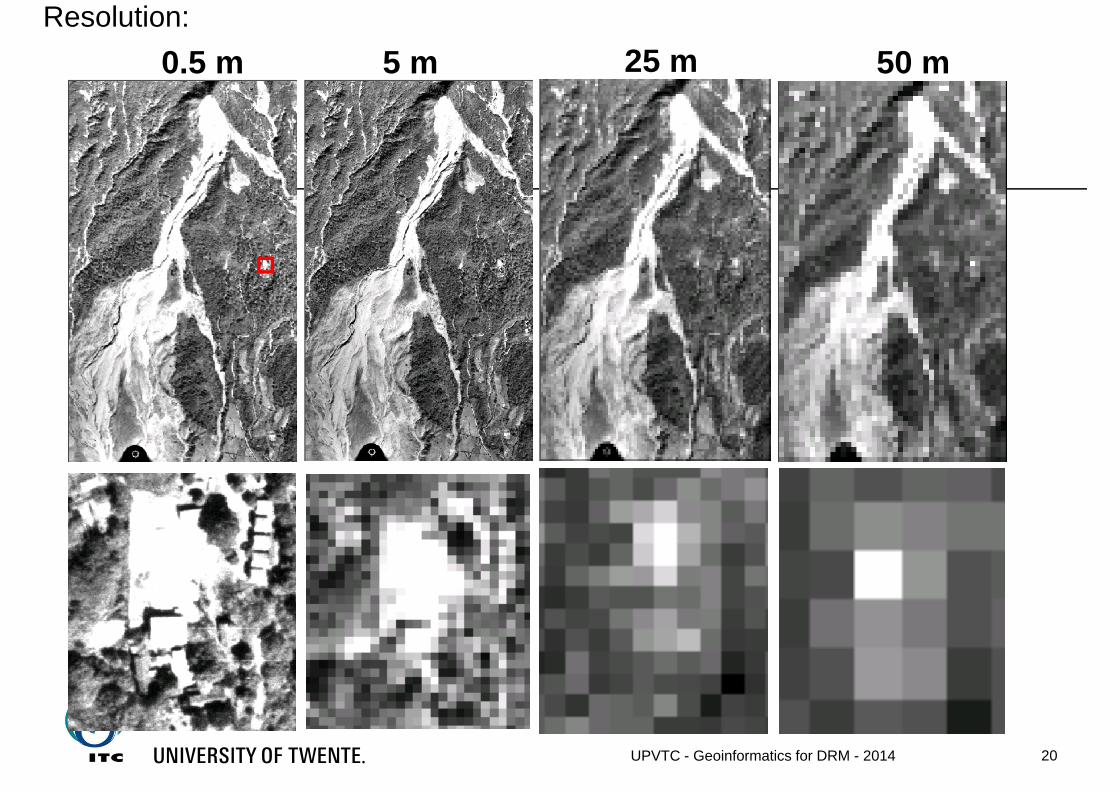
Resolution:0.5 m 5 m 25 m 50 m
20UPVTC - Geoinformatics for DRM - 2014
21
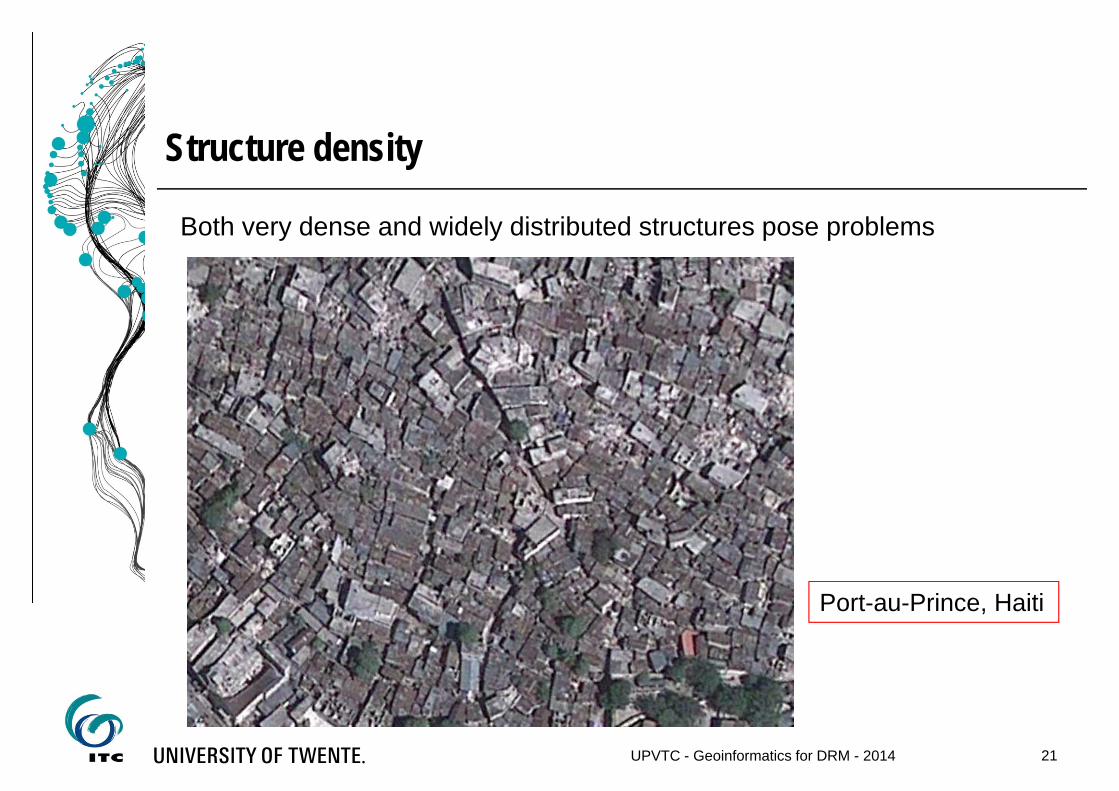
Both very dense and widely distributed structures pose problems
UPVTC - Geoinformatics for DRM - 2014
Port-au-Prince, Haiti
Structure density
22
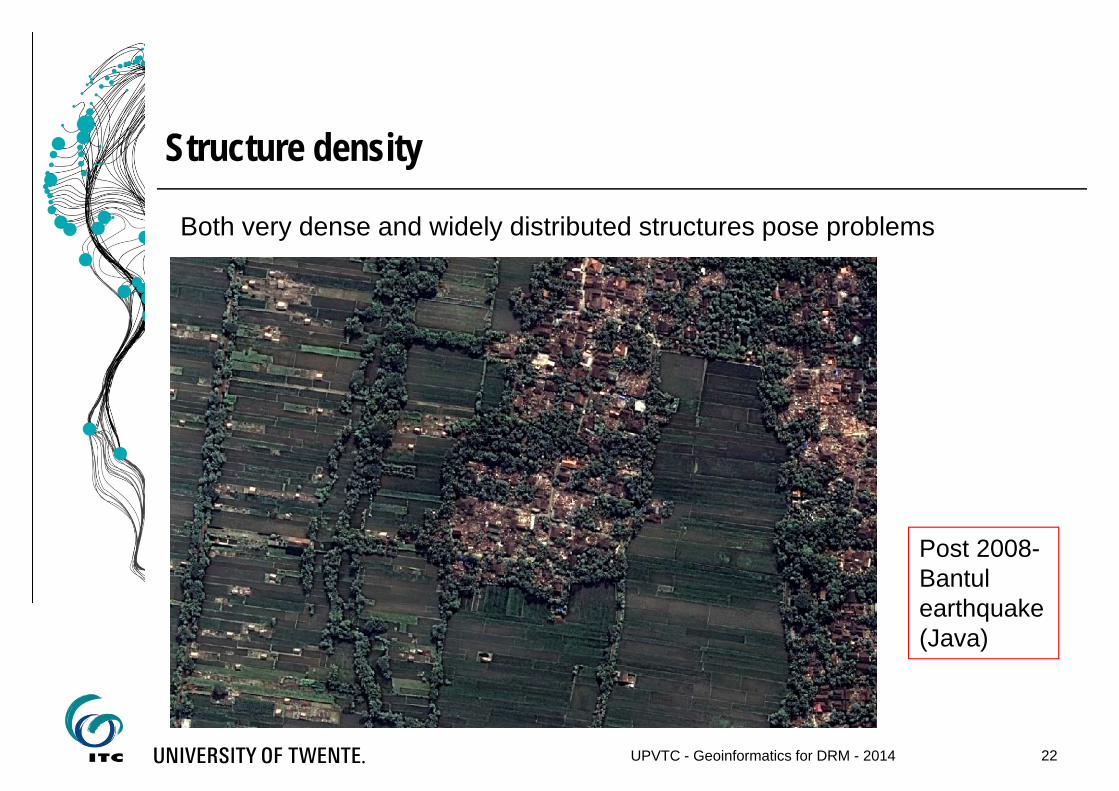
Both very dense and widely distributed structures pose problems
UPVTC - Geoinformatics for DRM - 2014
Post 2008-Bantul earthquake (Java)
Structure density
23
There is not perfect data type Optical imagery is most often used (low number of
radar) High-spatial resolution is clearly best suited But severe limits remain International Charter “Space and Major Disasters” Image processing still done manually
UPVTC - Geoinformatics for DRM - 2014
Best satellite type?
24
There are inherent limitations to image-based damage mapping Damage is more of a concept than a physical entity Damage is a complex 3- (maybe even 4-) dimensional
feature Internal damage can’t (usually) be seen The relationship between a damage feature and it’s effect on
structural integrity is not always clear Damage features do not add up linearly to a per-building
damage scale
UPVTC - Geoinformatics for DRM - 2014
Limits of image-based damage mapping

5 digital cameras (1 nadir, 4 oblique)
Spatial resolution of 15cm (nadir images, flying height ca. 1000m)
60% overlap for stereo
25UPVTC - Geoinformatics for DRM - 2014
Instead: airborne oblique (Pictometry)
Expectations were limited (recent visual analysis mapping of Haiti damageby Cambridge Architectural Research Ltd. (CAR) led to poor results)
Which Pictometry features allow damage mapping? (elevation,geometrics features, textures, etc.)
Identification of planar (=intact) and spectrally homogenous facades androof sections
Supervised classification of image segments
26UPVTC - Geoinformatics for DRM - 2014
Objectives
Photogrammetric processing
Dense matching of stereo images
Extraction of 3D point cloud, basis for a digital surface model (DSM)
DSM filtering to derive ground surface (DTM and nDSM)
Removal of vegetation
27UPVTC - Geoinformatics for DRM - 2014
Damage mapping: methodology
Orthorectification of oblique images and depth maps
Feature extraction from these images and the DSM
Assumption: intact buildings have planar surfaces
Find evidence for planarity through
Geometric homogeneity
Image information (radiometric homogeneity)
3D point cloud segmentation to find planar surfaces
28UPVTC - Geoinformatics for DRM - 2014
Damage mapping: methodology
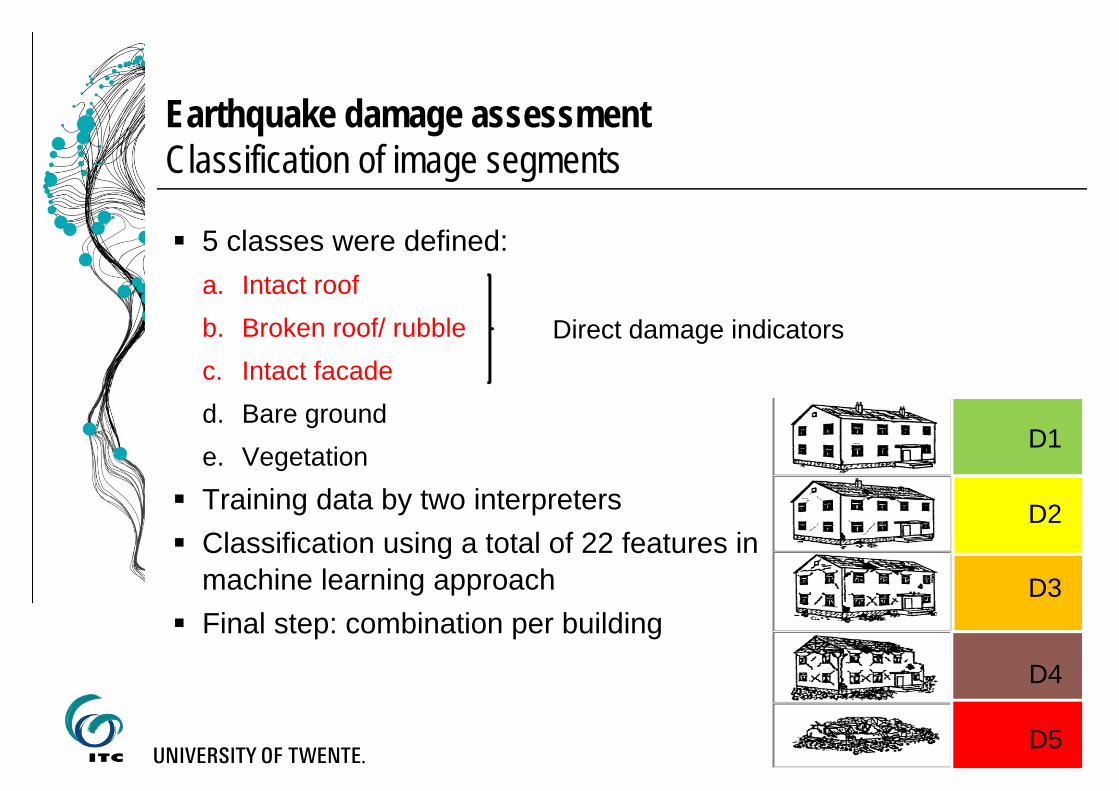
5 classes were defined:a. Intact roofb. Broken roof/ rubblec. Intact facaded. Bare grounde. Vegetation
Training data by two interpreters Classification using a total of 22 features in
machine learning approach Final step: combination per building
Direct damage indicators
D1
D2
D3
D4
D5
Earthquake damage assessmentClassification of image segments
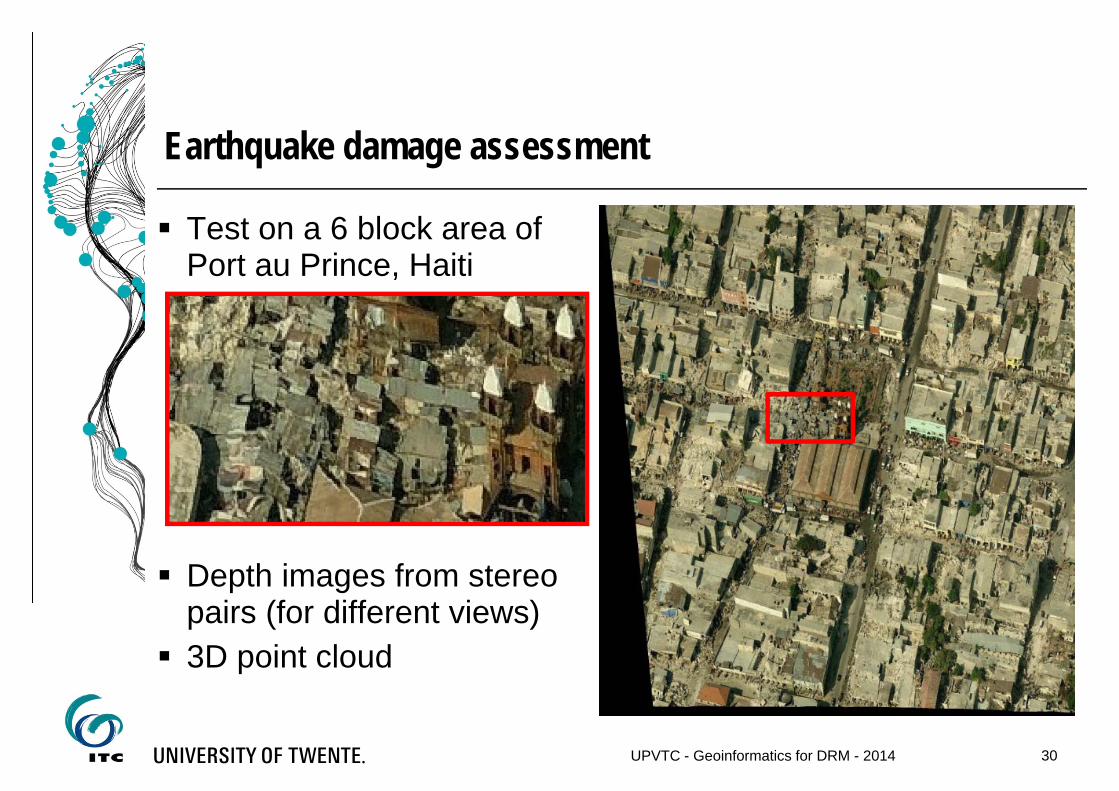
Test on a 6 block area of Port au Prince, Haiti
Depth images from stereo pairs (for different views)
3D point cloud
UPVTC - Geoinformatics for DRM - 2014
Earthquake damage assessment
30
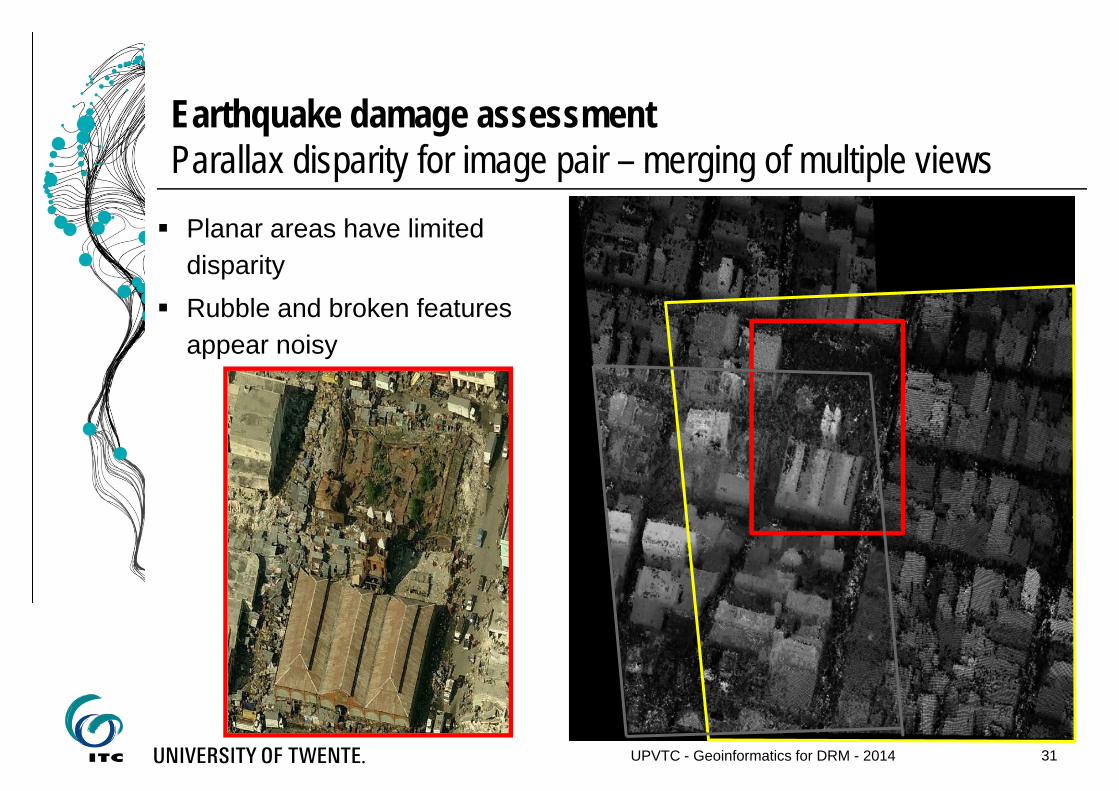
Planar areas have limited disparity
Rubble and broken features appear noisy
UPVTC - Geoinformatics for DRM - 2014
Earthquake damage assessmentParallax disparity for image pair – merging of multiple views
31
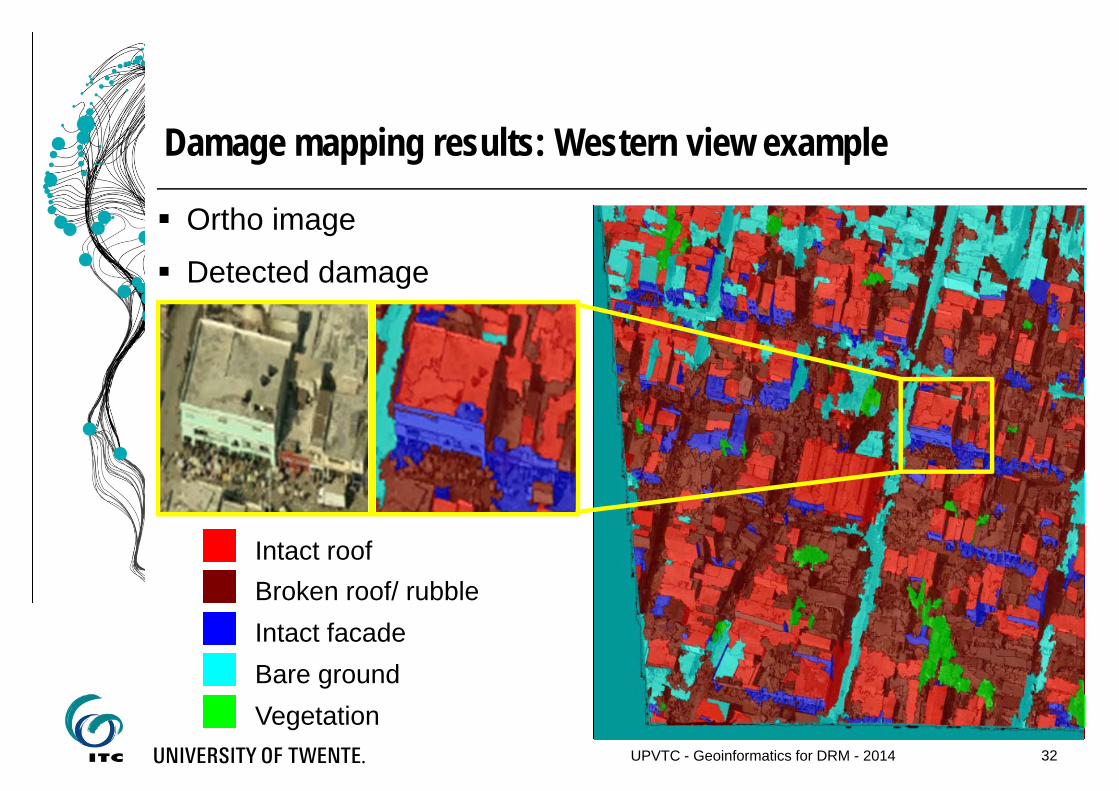
Intact roofBroken roof/ rubbleIntact facadeBare groundVegetation
Ortho image
Detected damage
UPVTC - Geoinformatics for DRM - 2014
Damage mapping results: Western view example
32
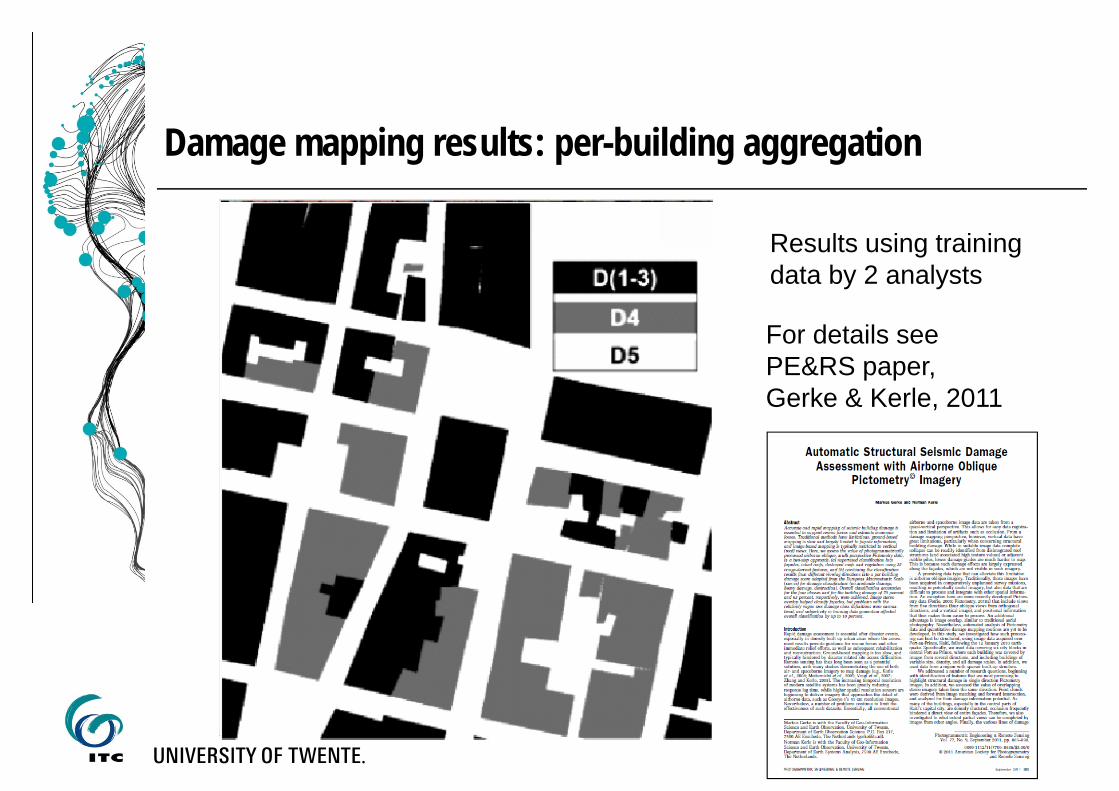
Results using trainingdata by 2 analysts
For details seePE&RS paper, Gerke & Kerle, 2011
Damage mapping results: per-building aggregation
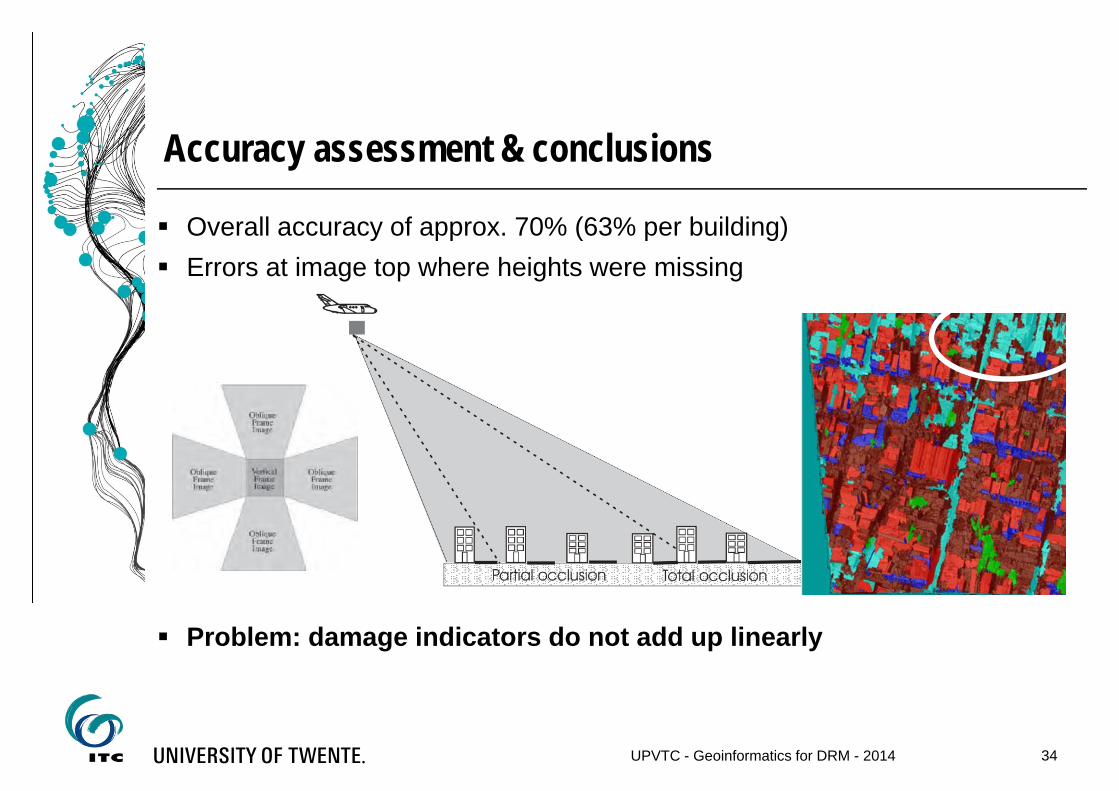
Overall accuracy of approx. 70% (63% per building) Errors at image top where heights were missing
Problem: damage indicators do not add up linearly
UPVTC - Geoinformatics for DRM - 2014
Accuracy assessment & conclusions
34
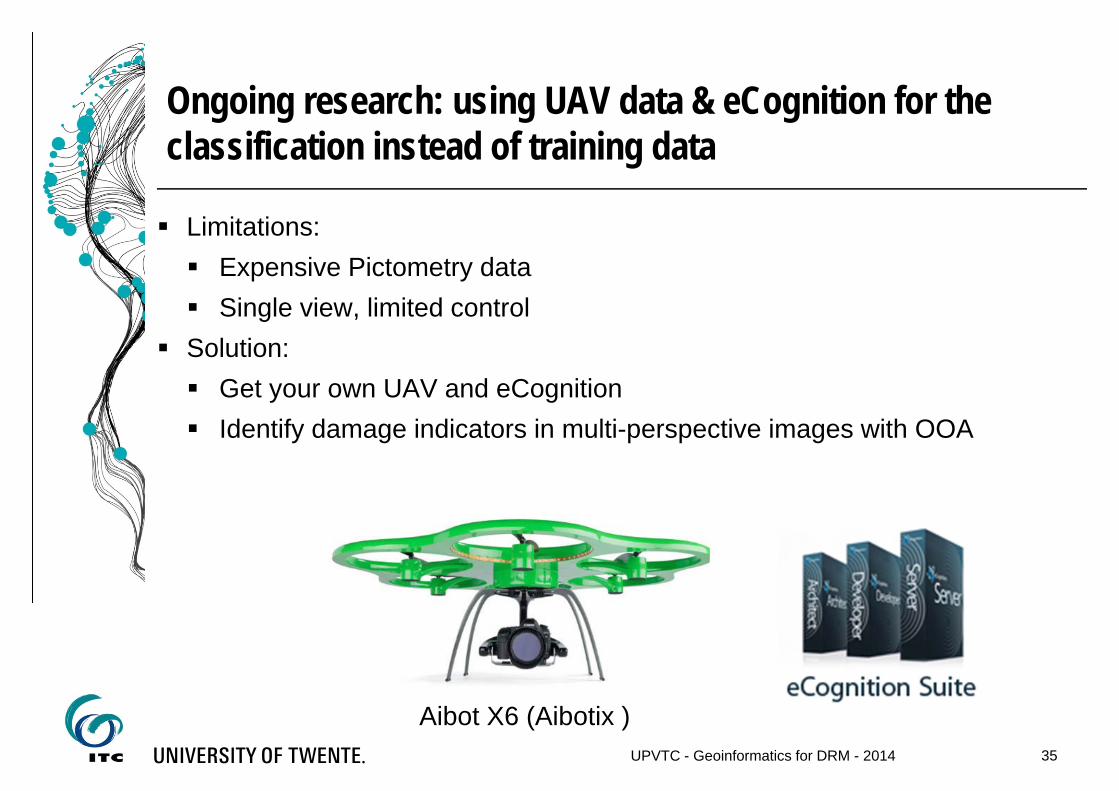
Limitations: Expensive Pictometry data Single view, limited control
Solution: Get your own UAV and eCognition Identify damage indicators in multi-perspective images with OOA
Aibot X6 (Aibotix )UPVTC - Geoinformatics for DRM - 2014
Ongoing research: using UAV data & eCognition for the classification instead of training data
35
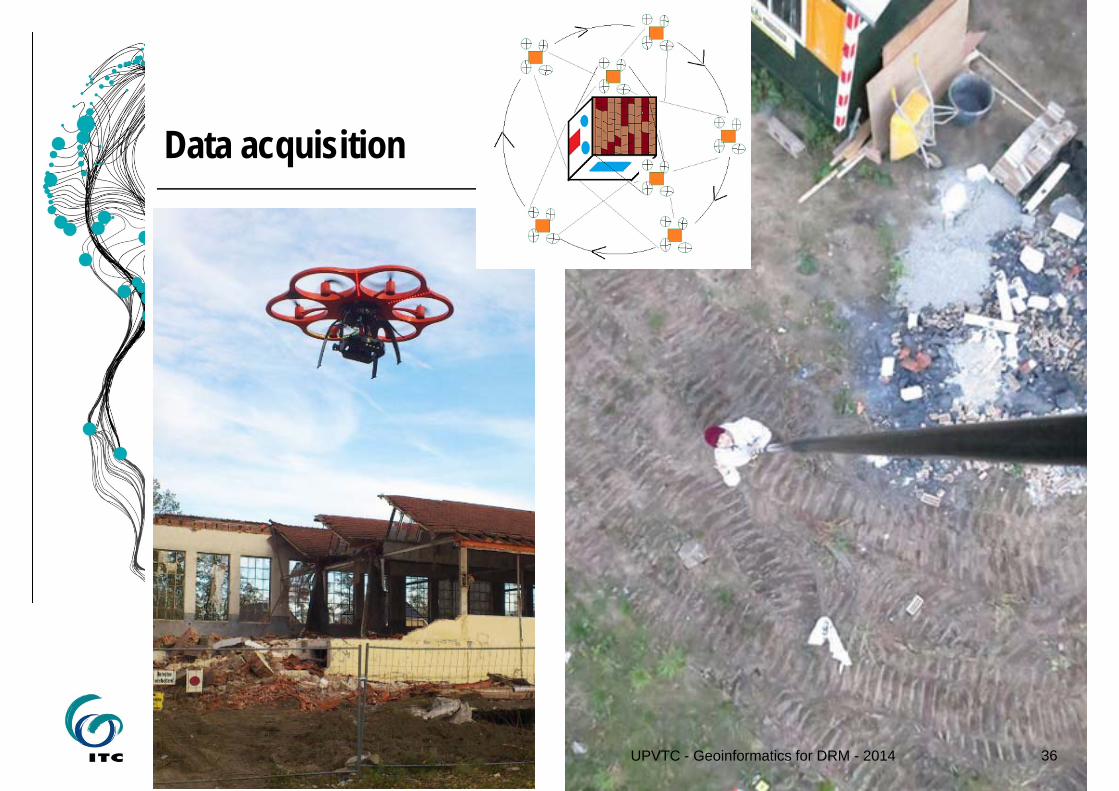
UPVTC - Geoinformatics for DRM - 2014 36
Data acquisition
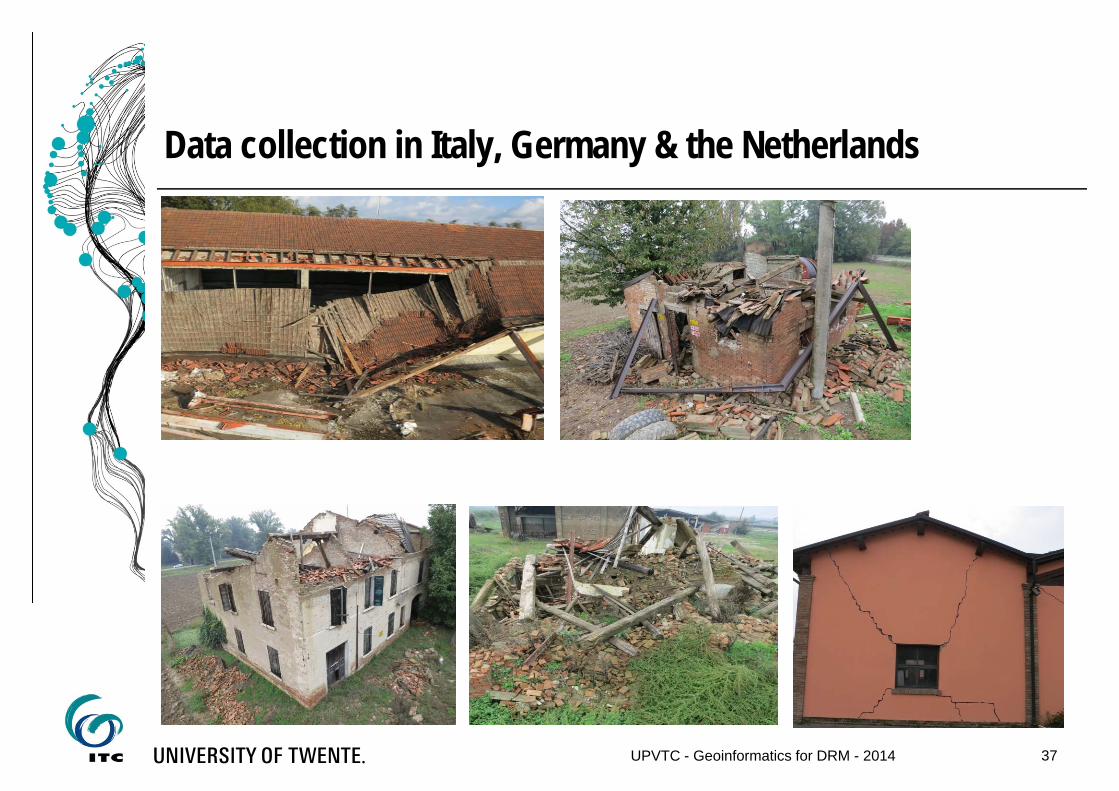
UPVTC - Geoinformatics for DRM - 2014 37
Data collection in Italy, Germany & the Netherlands
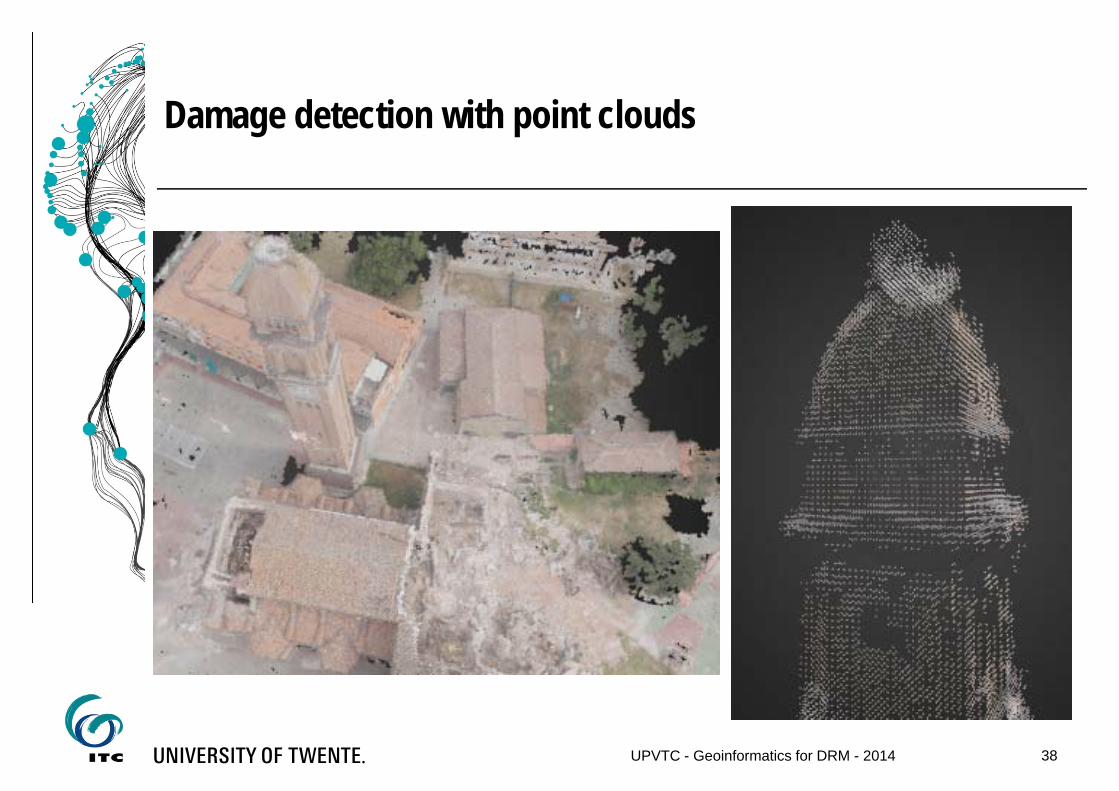
38UPVTC - Geoinformatics for DRM - 2014
Damage detection with point clouds
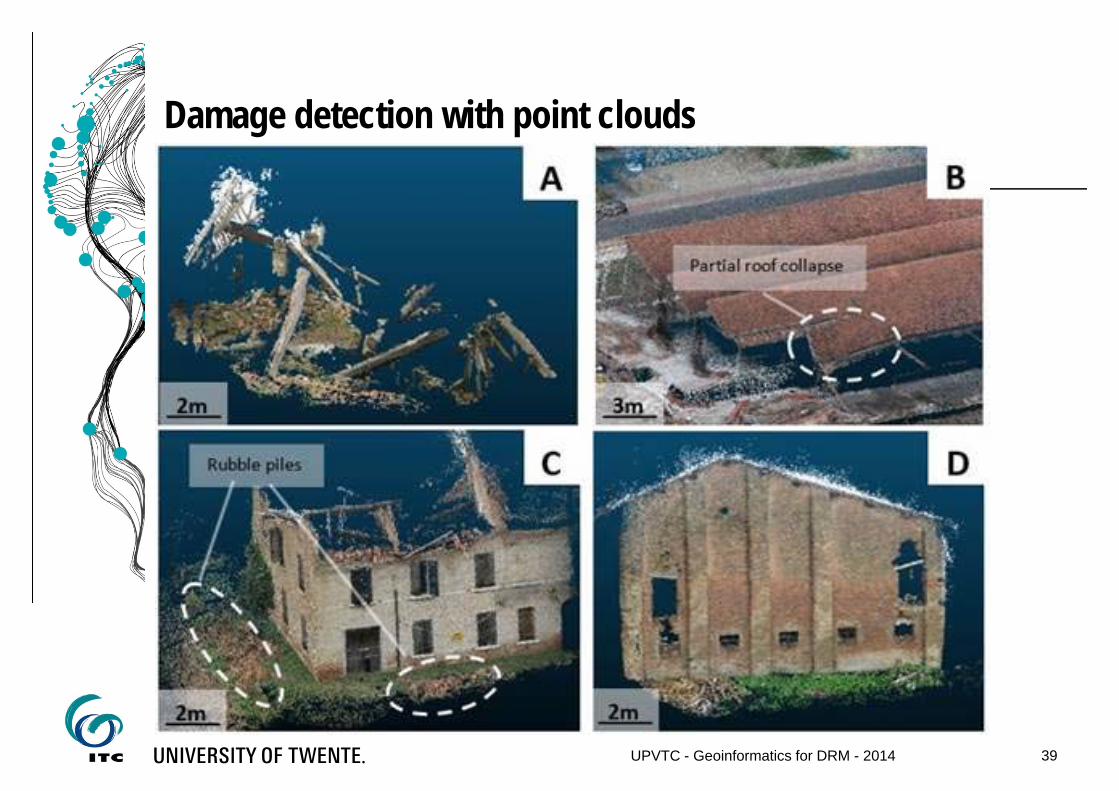
39UPVTC - Geoinformatics for DRM - 2014
Damage detection with point clouds
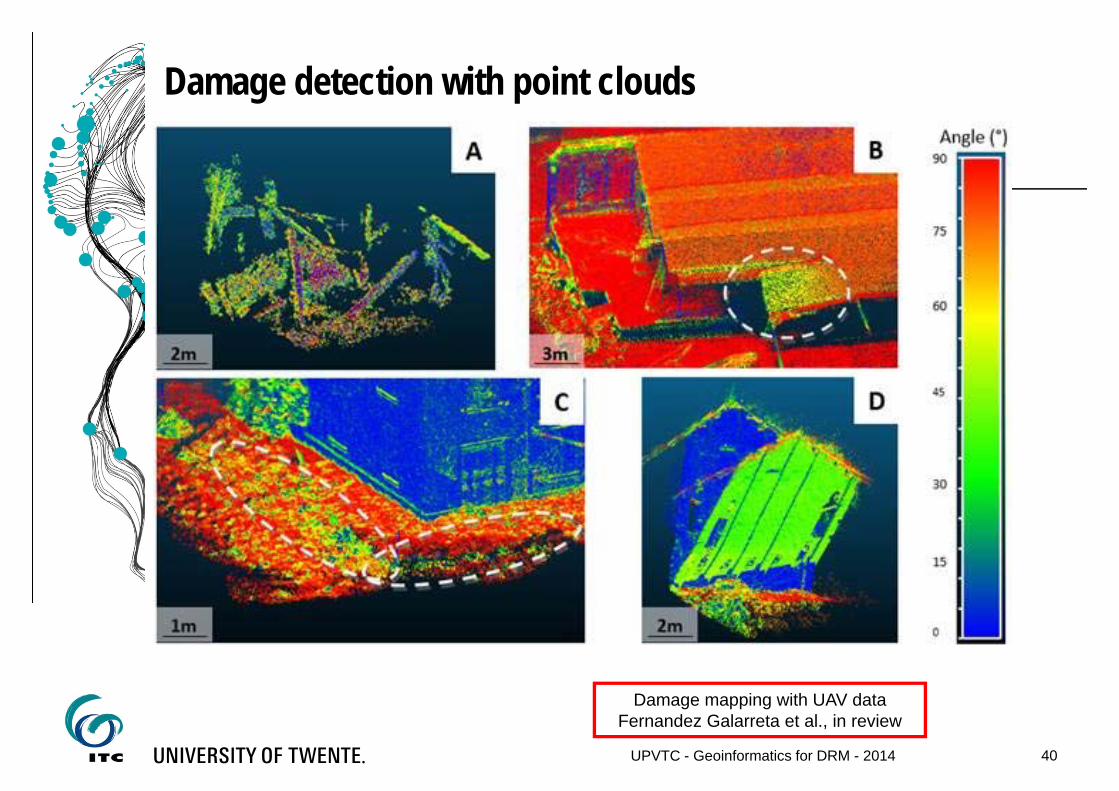
40UPVTC - Geoinformatics for DRM - 2014
Damage mapping with UAV dataFernandez Galarreta et al., in review
Damage detection with point clouds
41
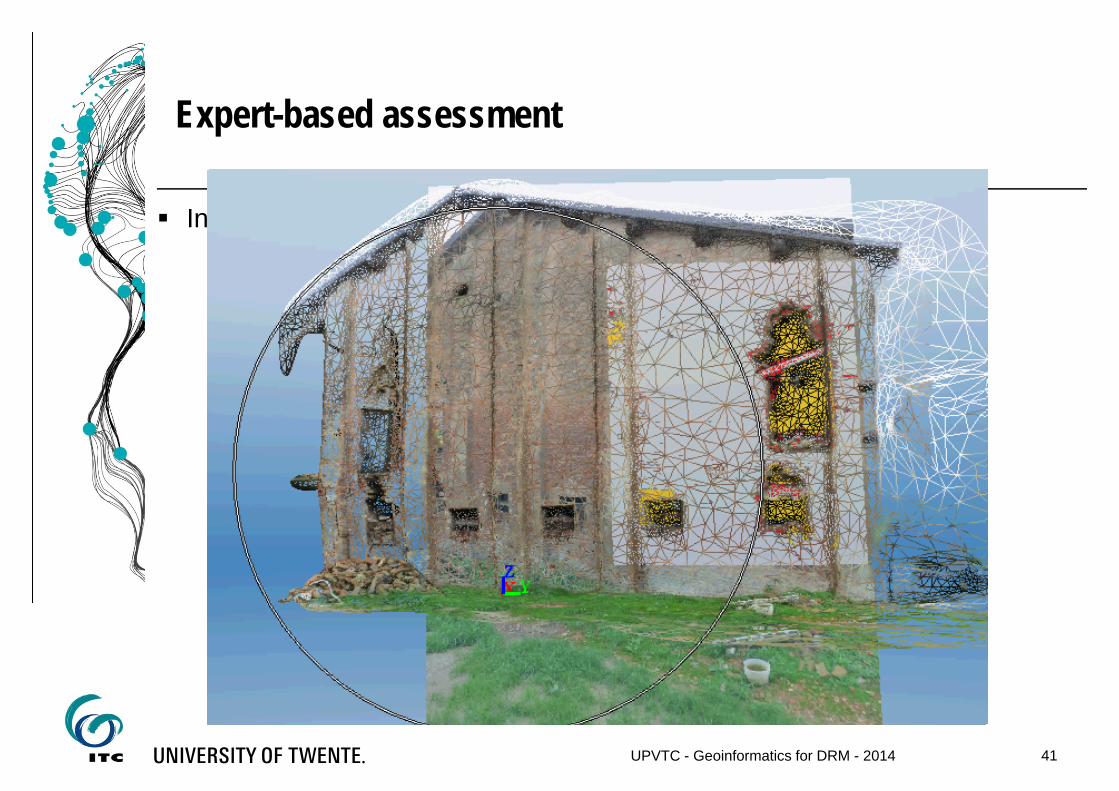
Integrate damage features in a building model for expert evaluation
UPVTC - Geoinformatics for DRM - 2014
Expert-based assessment

42
Image-based damage mapping - issues
UPVTC - Geoinformatics for DRM - 2014
Problems with the approach per se
There are many players in this business
Following Haiti some 2000 damage map products were generated
This is wasteful and overwhelms the potential user
Actual user needs are not well understood
Actual image data are not usually made available to end users or researchers
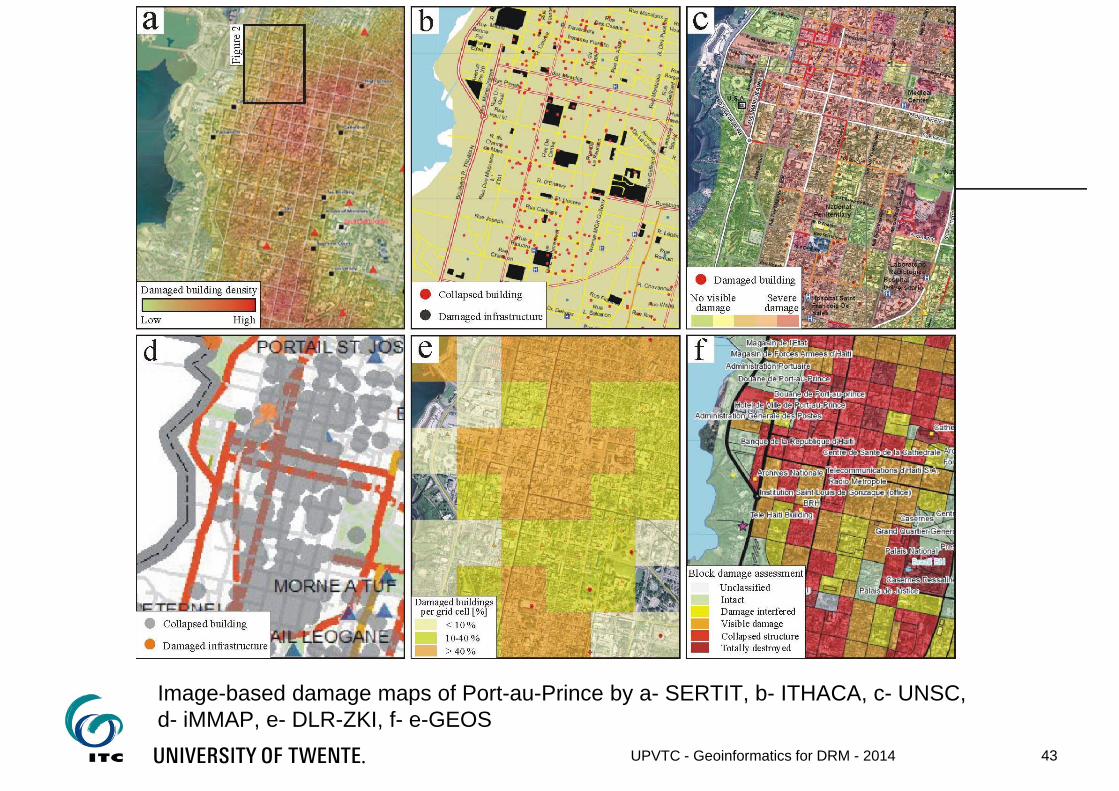
UPVTC - Geoinformatics for DRM - 2014 43
Image-based damage maps of Port-au-Prince by a- SERTIT, b- ITHACA, c- UNSC, d- iMMAP, e- DLR-ZKI, f- e-GEOS
44
Lay persons or qualified volunteers have been used for visual damage mapping
First in 2008 (Wenchuan [China] earthquake, typhoon Nargis[Myanmar])
Prominent example: 2010 Haiti earthquake Some 600 volunteers mapped damage First using Geoeye imagery, later aerial photographs
Damage mapping with crowdsourcing (VGI)
UPVTC - Geoinformatics for DRM - 2014
45
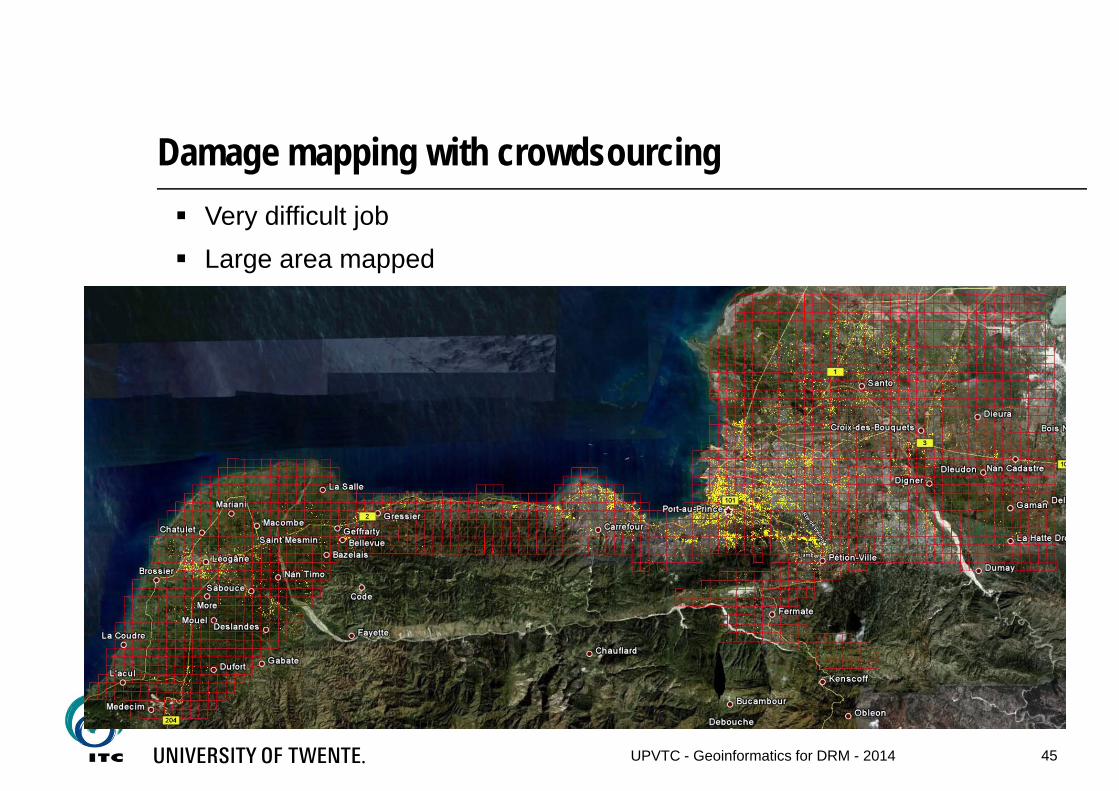
Very difficult job Large area mapped
Damage mapping with crowdsourcing
UPVTC - Geoinformatics for DRM - 2014
46
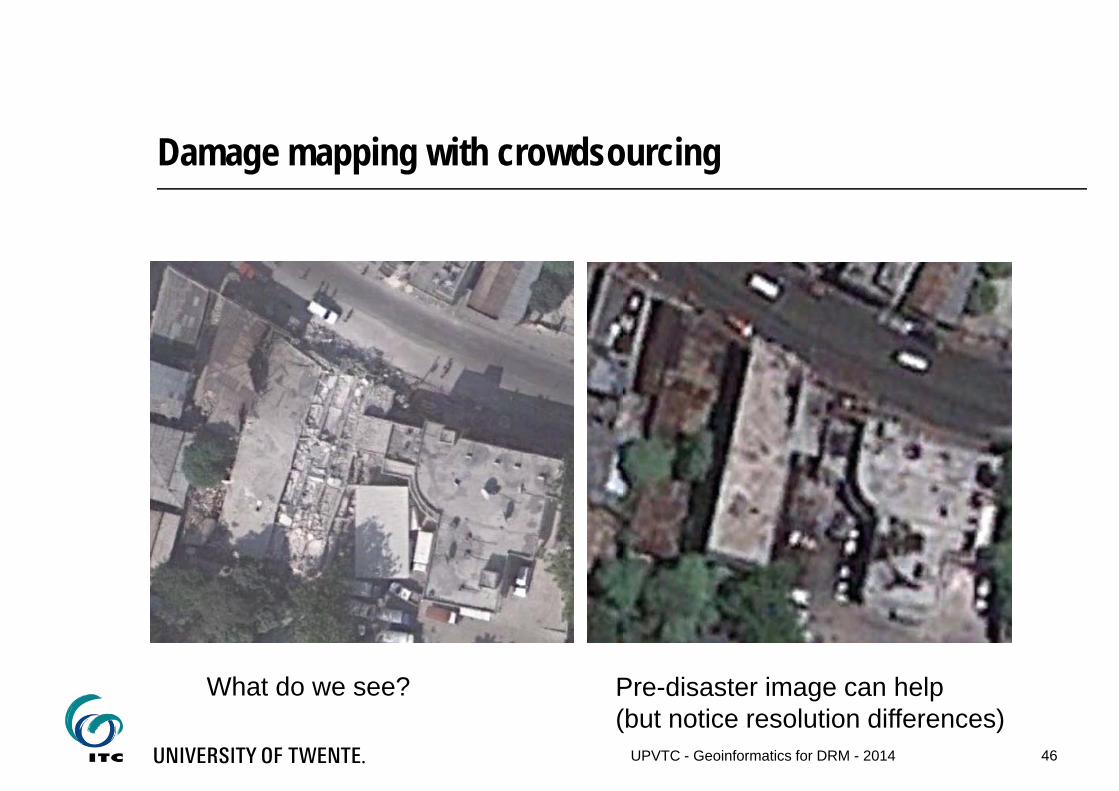
What do we see? Pre-disaster image can help (but notice resolution differences)
Damage mapping with crowdsourcing
UPVTC - Geoinformatics for DRM - 2014
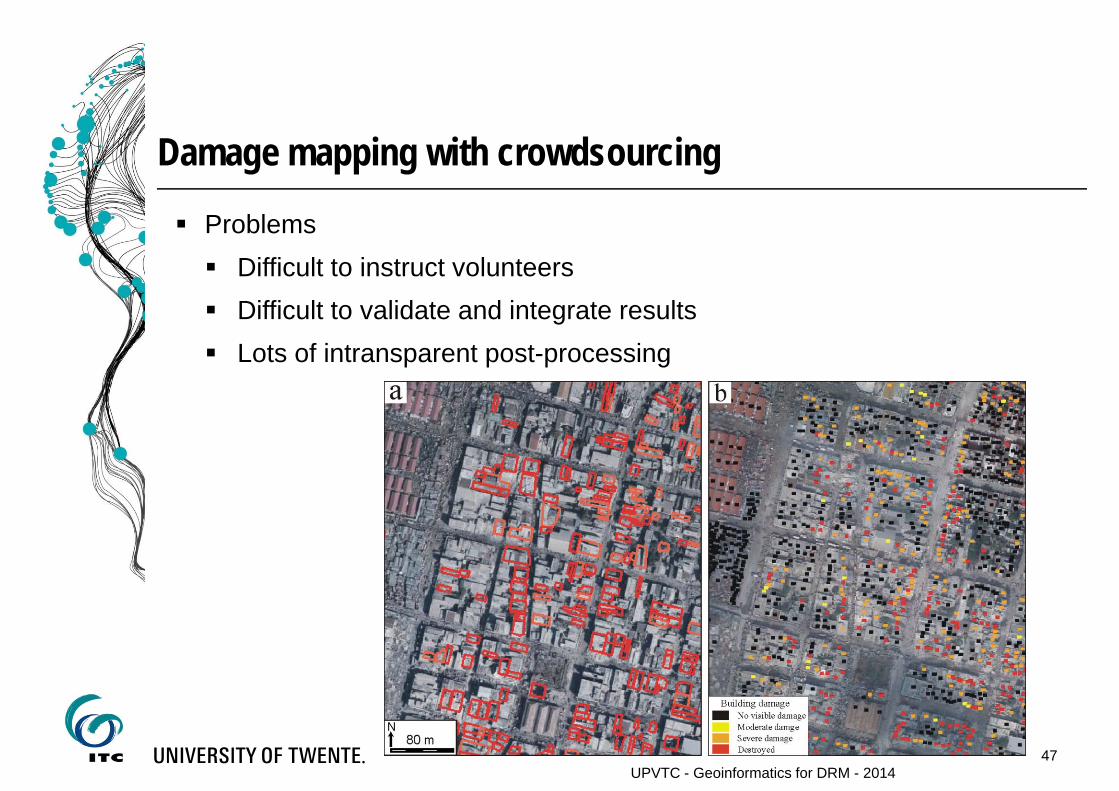
47
Problems Difficult to instruct volunteers Difficult to validate and integrate results Lots of intransparent post-processing
Damage mapping with crowdsourcing
UPVTC - Geoinformatics for DRM - 2014
48
What comes after damage mapping?
UPVTC - Geoinformatics for DRM - 2014
Knowledge on damage is only the first step
Little effort on tracking rehabilitation and recovery
Focus quickly switches to the next disaster
Lack of mandate, no donated images
Lots of changes to track
Debris removal
People leaving, coming back
Settlement camps
Secondary disasters – more/ different damage
Slow recovery/ rebuilding
Response vs. reconstruction vs. rehabilitation vs. recovery
49
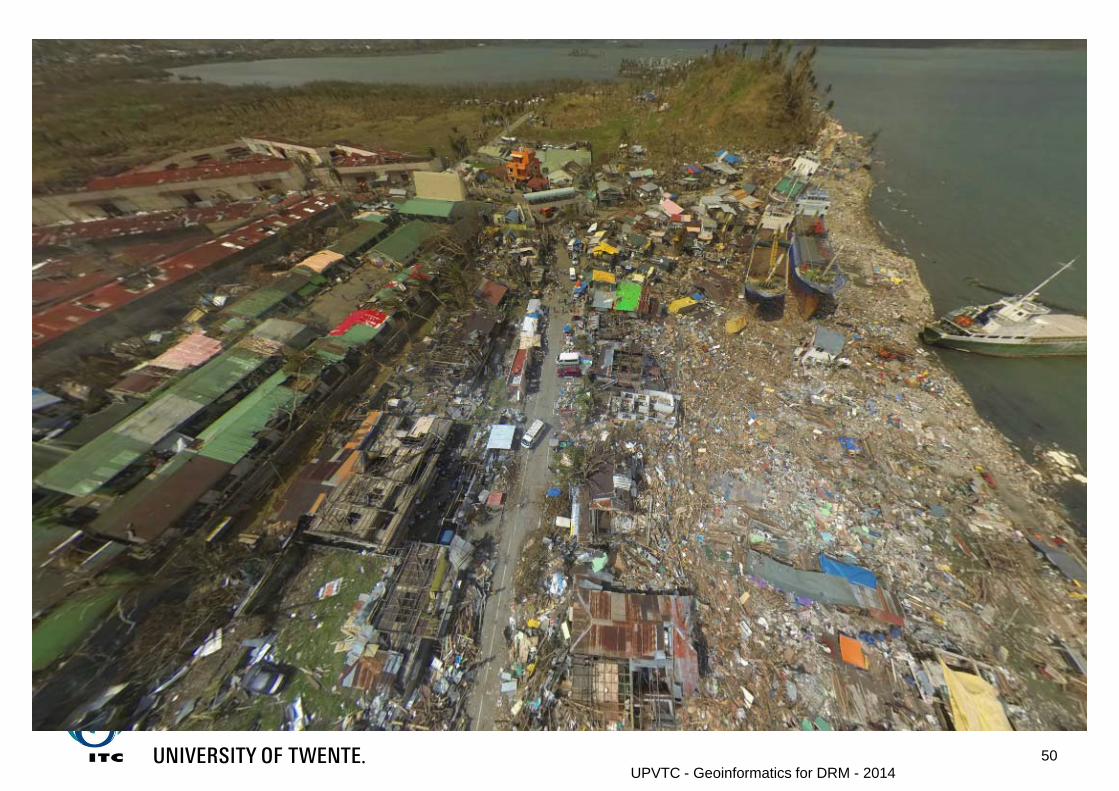
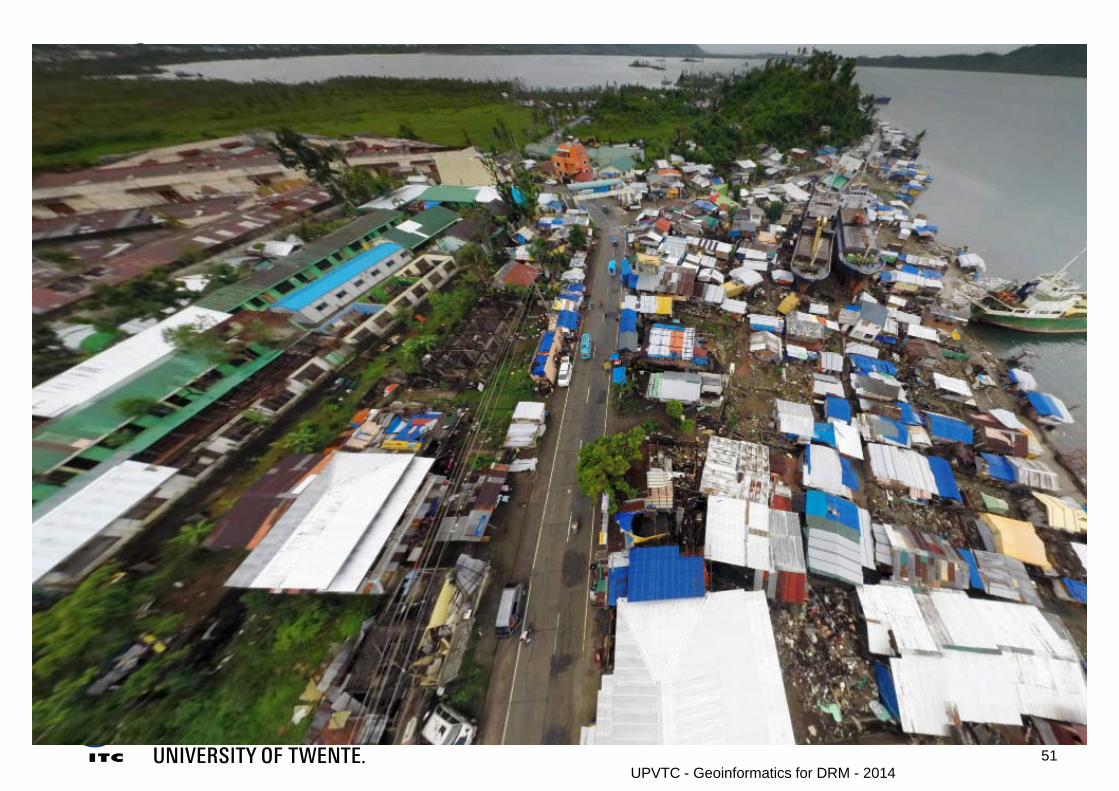
Is Tacloban recovering?
UPVTC - Geoinformatics for DRM - 2014
UPVTC - Geoinformatics for DRM - 201450
UPVTC - Geoinformatics for DRM - 201451
52
Is Tacloban recovering?
UPVTC - Geoinformatics for DRM - 2014
Initial response to Haiyan was a success (no outbreak of disease, no widespread breakdown in law and order, and enough supplies of emergency food and clean water)
After six months, less than 150 permanent new houses had been built. The master-plan calls for 200,000
Finding suitable land has been a challenge
53
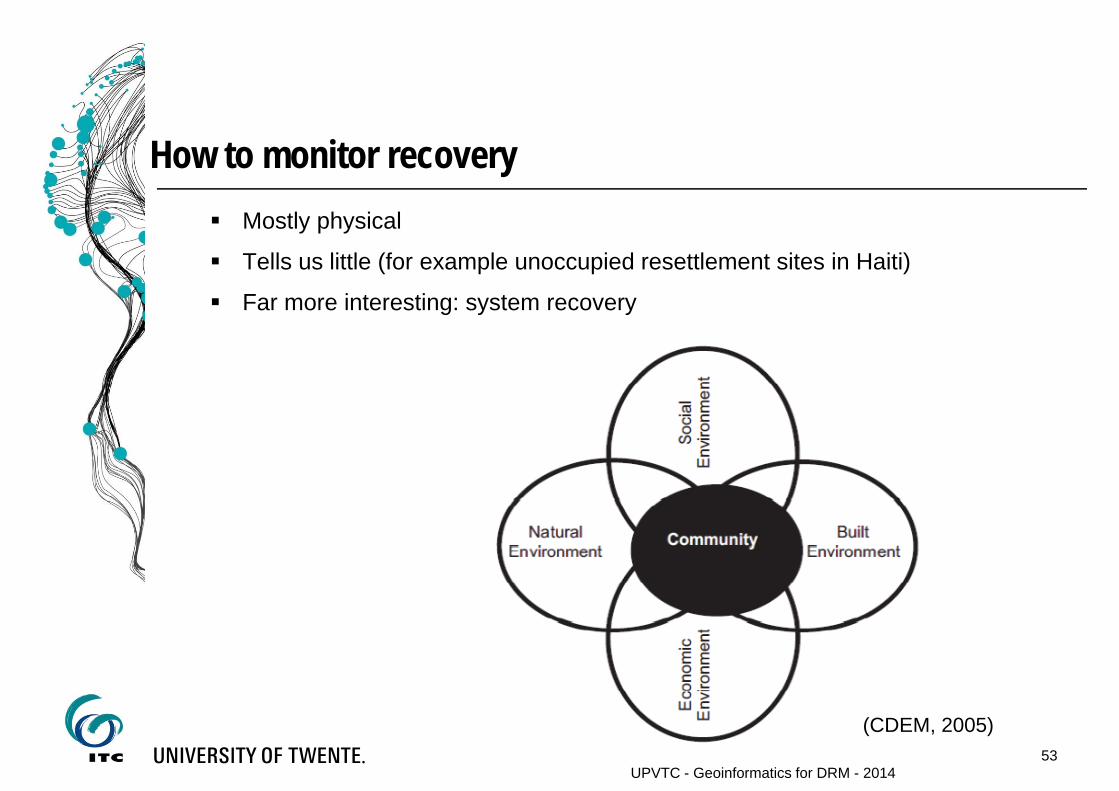
How to monitor recovery
UPVTC - Geoinformatics for DRM - 2014
Mostly physical
Tells us little (for example unoccupied resettlement sites in Haiti)
Far more interesting: system recovery
(CDEM, 2005)
54
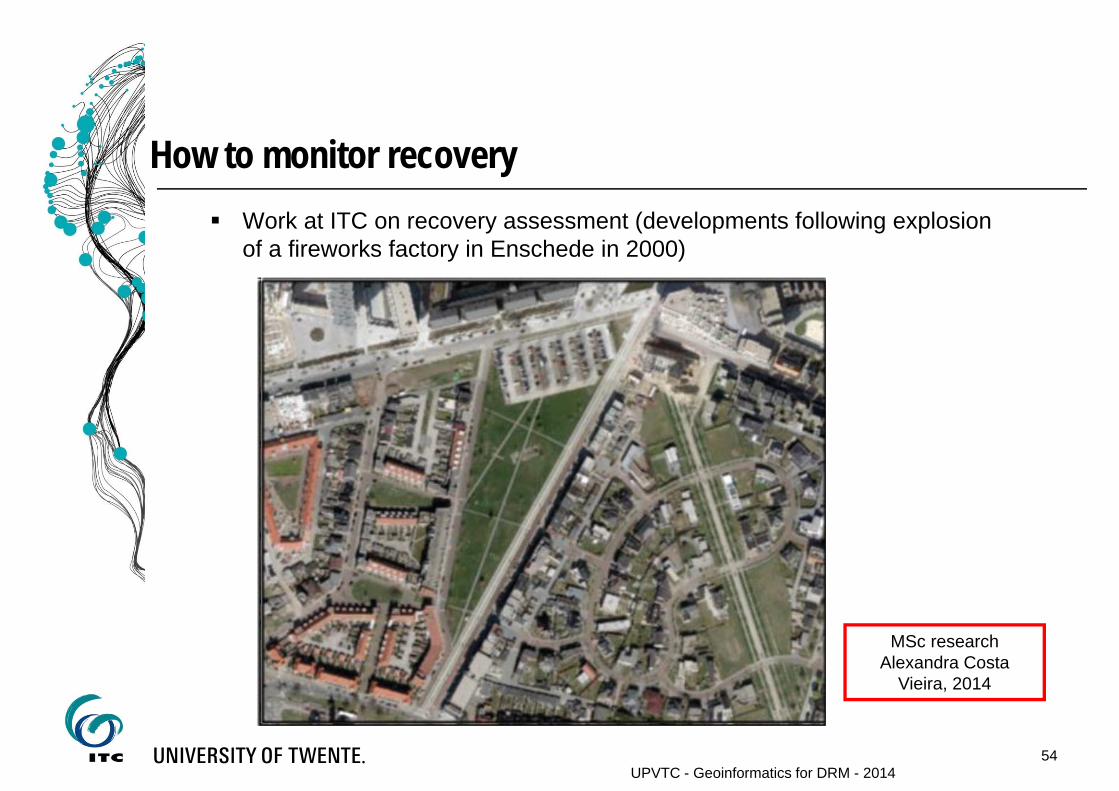
How to monitor recovery
UPVTC - Geoinformatics for DRM - 2014
Work at ITC on recovery assessment (developments following explosion of a fireworks factory in Enschede in 2000)
MSc research Alexandra Costa
Vieira, 2014
55
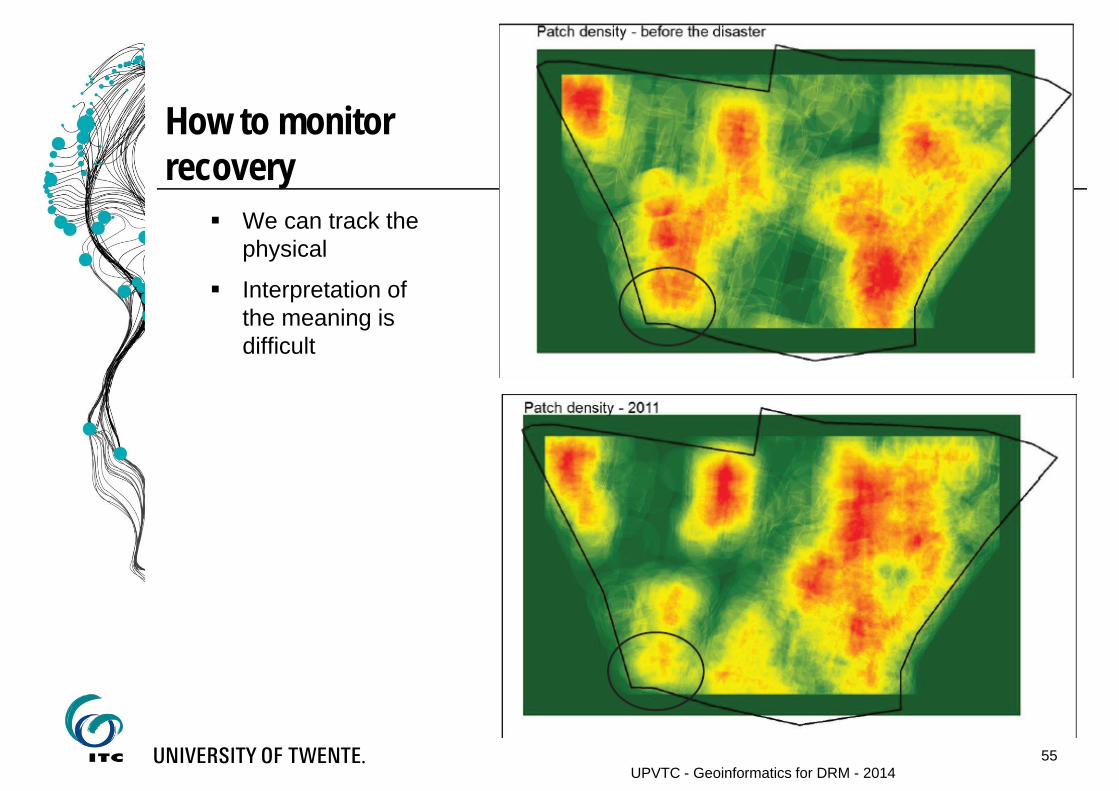
How to monitorrecovery
UPVTC - Geoinformatics for DRM - 2014
We can track the physical
Interpretation of the meaning is difficult

56
How to monitor recovery
UPVTC - Geoinformatics for DRM - 2014
Network analysis is possible
57
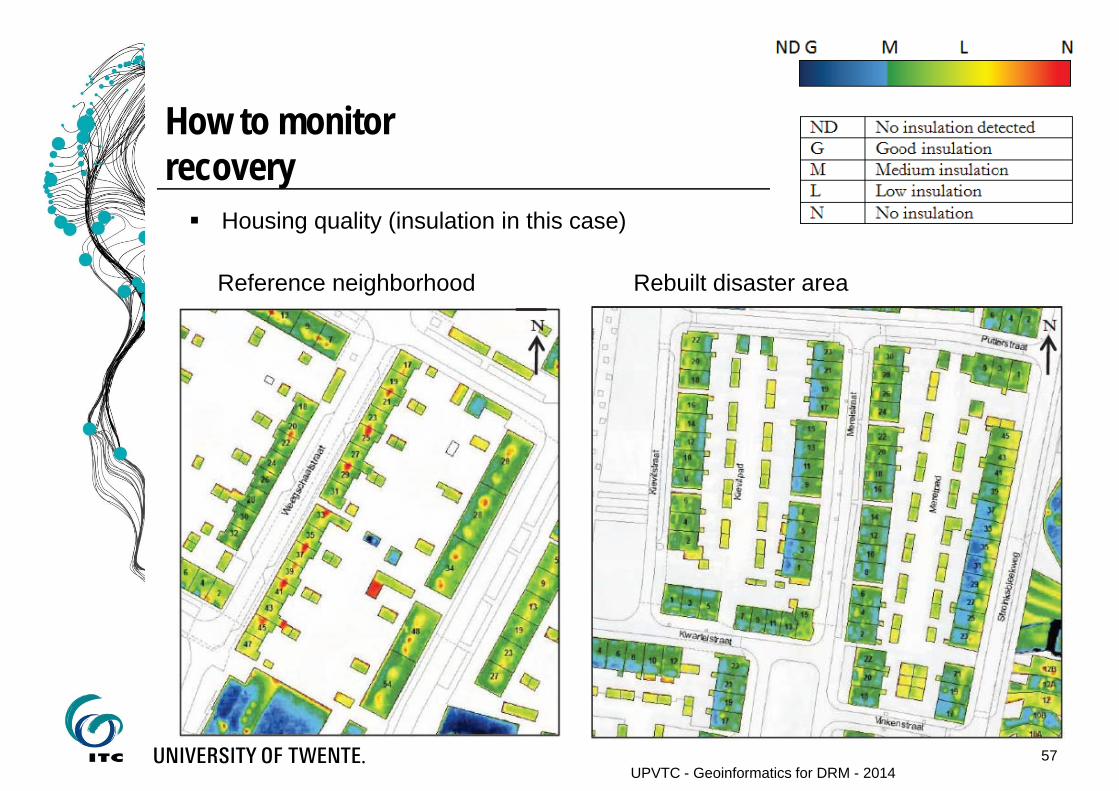
How to monitorrecovery
UPVTC - Geoinformatics for DRM - 2014
Housing quality (insulation in this case)
Reference neighborhood Rebuilt disaster area
58
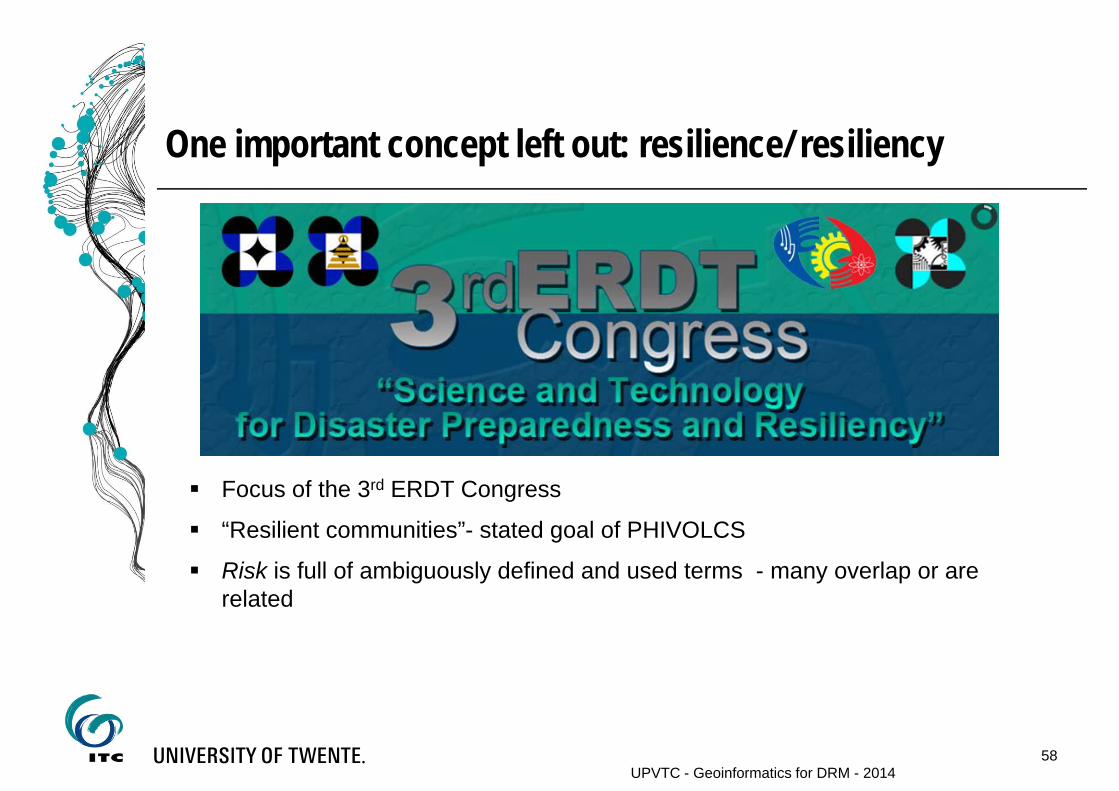
One important concept left out: resilience/ resiliency
UPVTC - Geoinformatics for DRM - 2014
Focus of the 3rd ERDT Congress
“Resilient communities”- stated goal of PHIVOLCS
Risk is full of ambiguously defined and used terms - many overlap or are related

59
One important concept left out: resilience/ resiliency
UPVTC - Geoinformatics for DRM - 2014
Resilience is important concept in risk assessment and mitigation
Old term that is still not part of operational risk quantification
Risk is a difficult concept (R=H x V)
Often not complete: resilience, coping capacity missing
Function of many aspects (social, political, environmental, economic)
Preparedness, early earning, evacuation, etc. all play a role here and determine how quickly a place bounces back
Resilience and recovery are related parameters
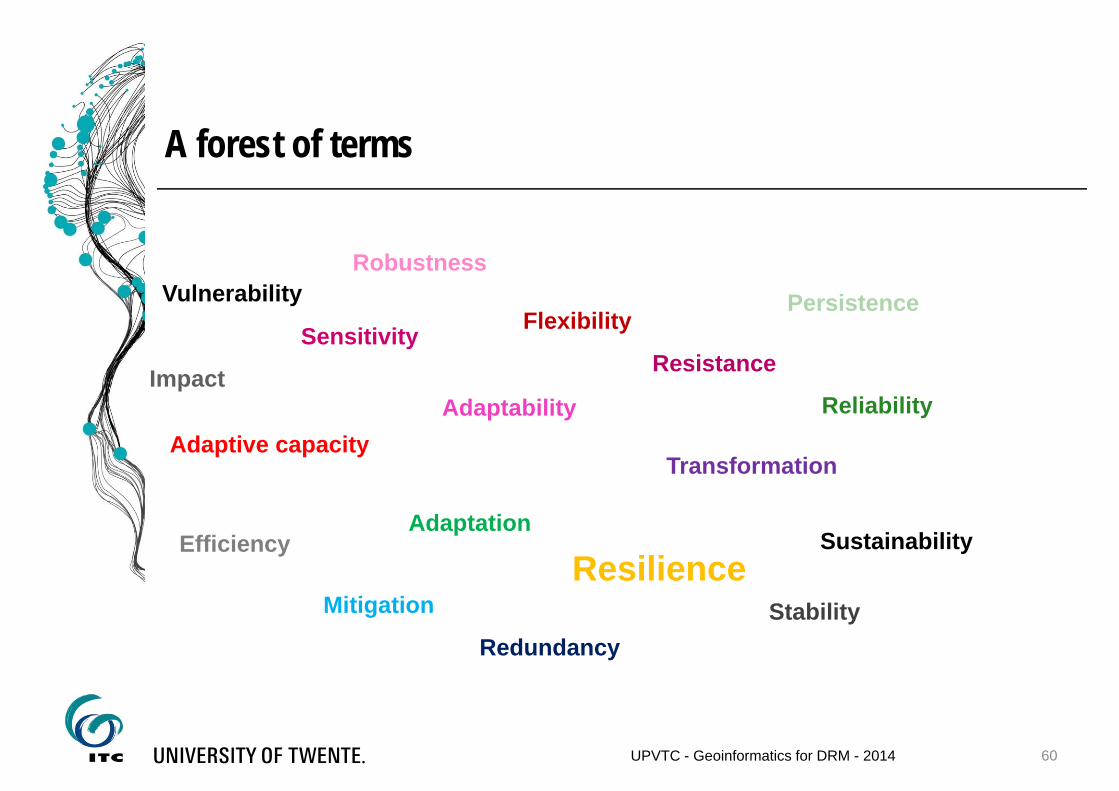
Adaptability
Vulnerability
Adaptation
Adaptive capacity
Flexibility
Impact
MitigationResilience
Resistance
Robustness
Sensitivity
Stability
Sustainability
Persistence
Redundancy
Transformation
Efficiency
60
Reliability
UPVTC - Geoinformatics for DRM - 2014
A forest of terms
61
A research proposal
UPVTC - Geoinformatics for DRM - 2014
Proposal with an economist colleague (Tatiana Filatova)
Couple image analysis and macro-economic agent-based modelling
Idea: resilience is not directly detectable. However, areas that recover more quickly than others must be more resilient
Add to that economic modelling to explain the developments in terms of socio-economic drivers
Use that to predict recovery trends, but also to influence them
62
A research proposal
UPVTC - Geoinformatics for DRM - 2014
Leyte could be a great case study
Many remote sensing images exist, 2 DREAM LiDAR surveys, ground information
Hazard maps have been created for Yolanda rehabilitation
Could involve the Yolanda Rehabilitation Scientific Information Center (YoRInfoCenter)

63
Summary
UPVTC - Geoinformatics for DRM - 2014
Image-based damage assessment remains the only practical way
However, there are inherent accuracy limitations
Multi-perspective oblique stereo images are ideal (though also have limitations)
Crowdsourcing is a great tool for many problems, but not for structural damage mapping
More coordinated image-based damage mapping is needed, which takes better account of user needs and abilities
Far more focus is to understand post-disaster recovery, find better ways to map and quantify is, and link it to resilience
= key to steer the process to a more desirable outcome
64
Questions?
UPVTC - Geoinformatics for DRM - 2014
Our disaster damage assessment, as well as OOA work continues – check www.itc.nl/ooa-group for updates
Same for full references
Papers also on
https://www.researchgate.net/profile/Norman_Kerle
Or email: [email protected]
Thank you