Using Technical Analysis to Augment Performance in … - How technical... · Using Technical...
41
CFA South Africa Investment Conference 10 September 2009 Johannesburg, South Africa Using Technical Analysis to Augment Performance in the Secular Bear Market Philip J. Roth, CMT Chief Technical Market Analyst, Miller Tabak + Co., LLC Director, MTA Educational Foundation
Transcript of Using Technical Analysis to Augment Performance in … - How technical... · Using Technical...
CFA South Africa Investment Conference10 September 2009
Johannesburg, South Africa
Using Technical Analysis to AugmentPerformance in the Secular Bear Market
Philip J. Roth, CMTChief Technical Market Analyst, Miller Tabak + Co., LLCDirector, MTA Educational Foundation
Copyright 2009. Market Technicians Association Educational Foundation, Inc. All Rights Reserved.
2
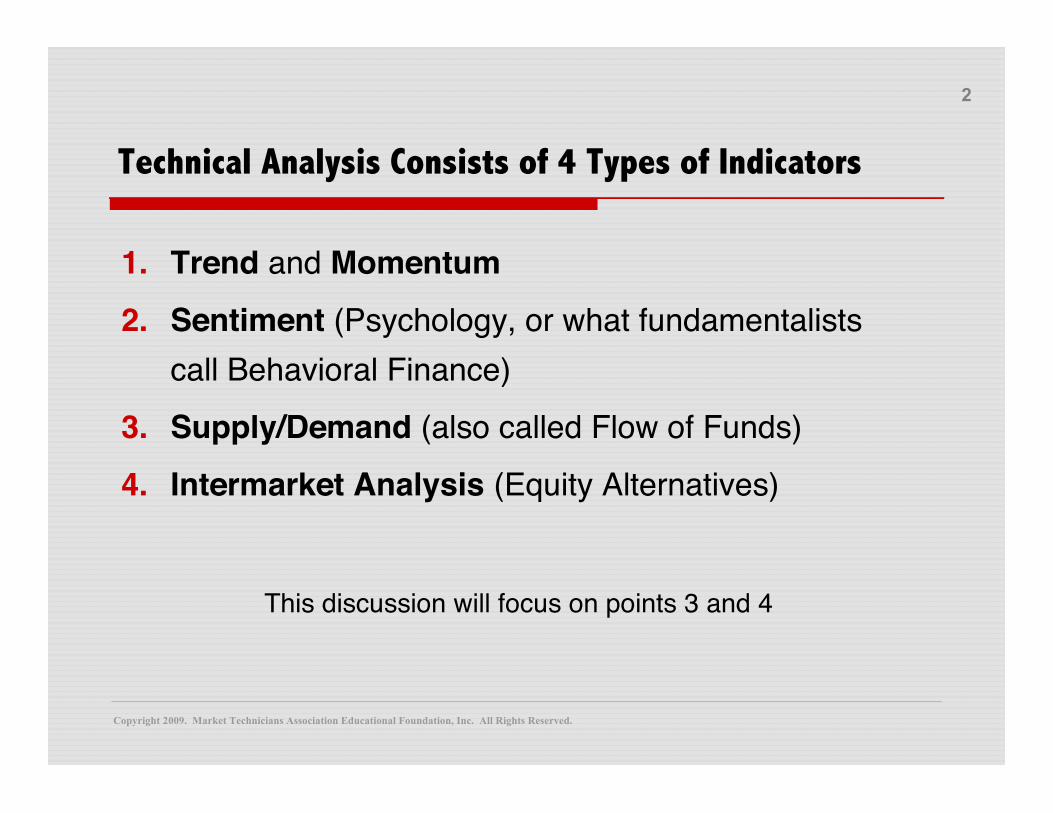
Technical Analysis Consists of 4 Types of Indicators
1. Trend and Momentum2. Sentiment (Psychology, or what fundamentalists
call Behavioral Finance)3. Supply/Demand (also called Flow of Funds)4. Intermarket Analysis (Equity Alternatives)
This discussion will focus on points 3 and 4
Copyright 2009. Market Technicians Association Educational Foundation, Inc. All Rights Reserved.
3
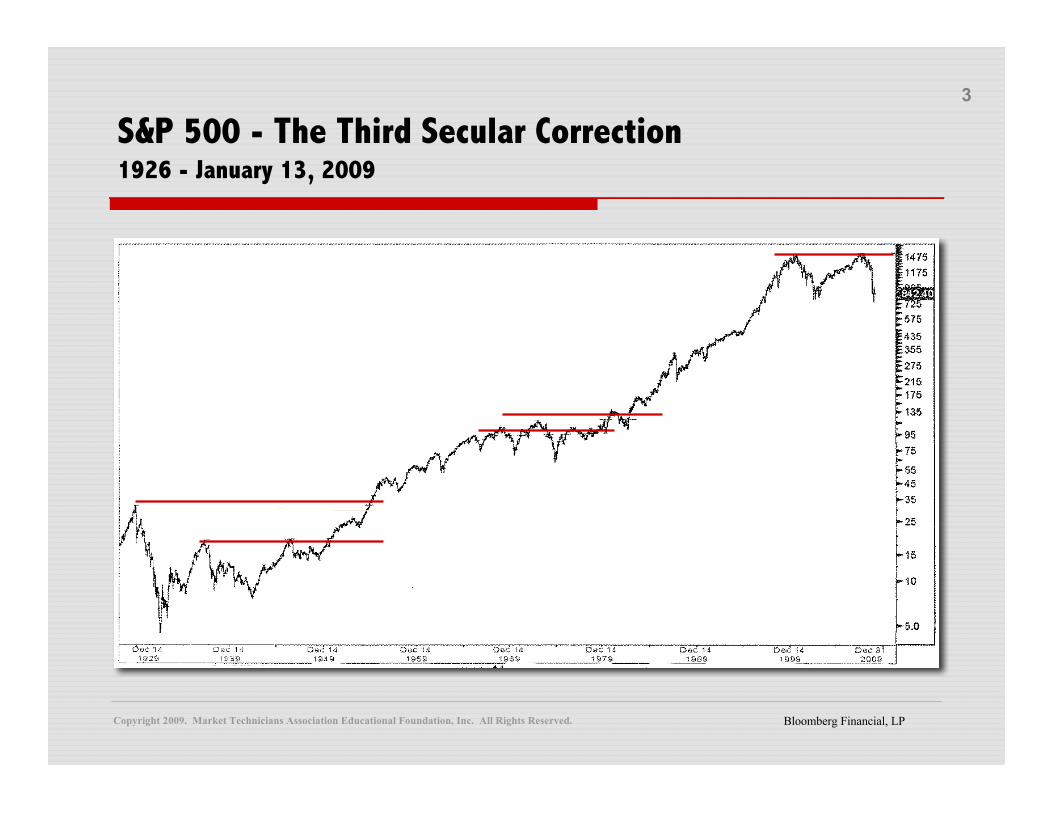
S&P 500 - The Third Secular Correction1926 - January 13, 2009
Bloomberg Financial, LP

Copyright 2009. Market Technicians Association Educational Foundation, Inc. All Rights Reserved.
4
Dow Theory of “Confirmation”Weekly DJIA and DJTA – May 2002-May 2005
StockCharts.com
Confirmationof New High
in Transports
New High
DJ Industrials - Weekly
DJ Transports - Weekly
StockCharts.com
Copyright 2009. Market Technicians Association Educational Foundation, Inc. All Rights Reserved.
5
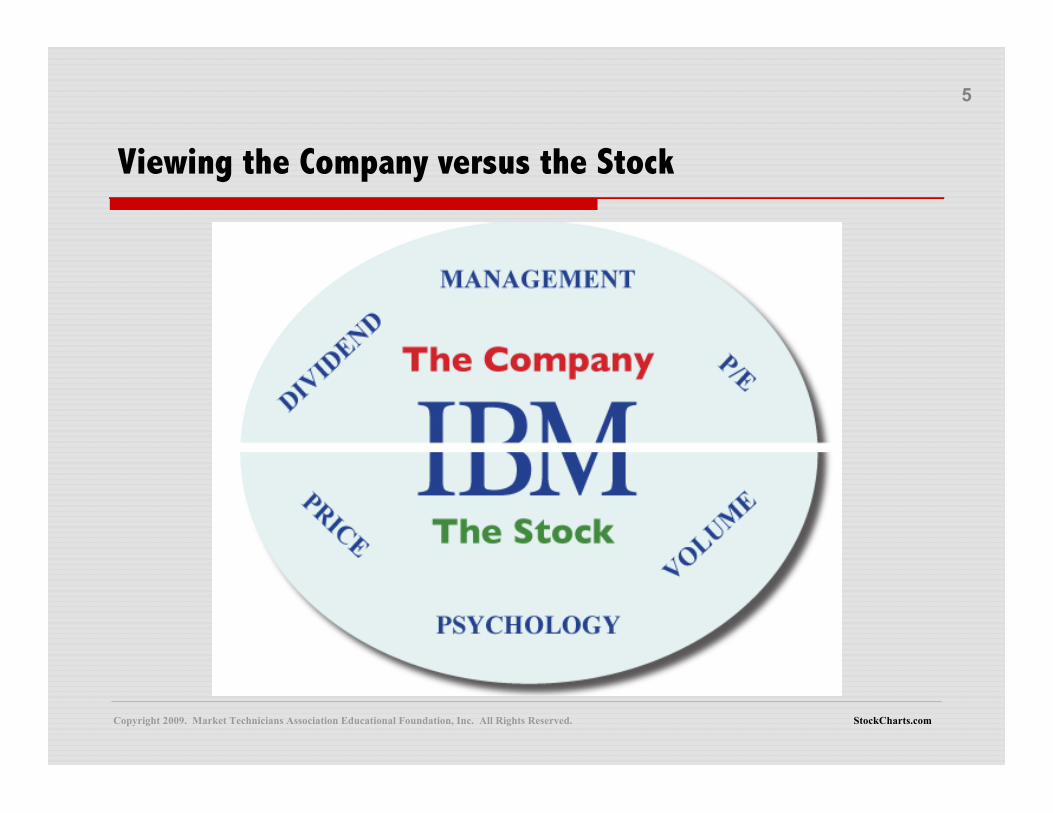
Viewing the Company versus the Stock
StockCharts.com
Copyright 2009. Market Technicians Association Educational Foundation, Inc. All Rights Reserved.
6
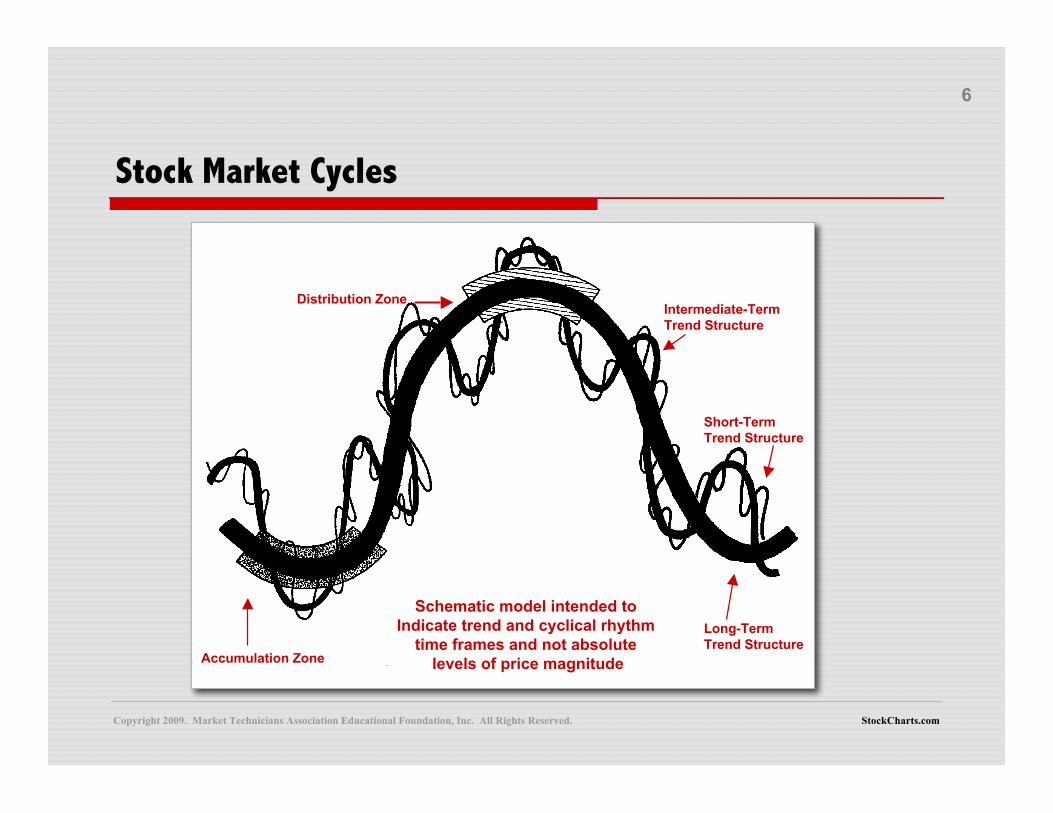
Stock Market Cycles
StockCharts.com
Schematic model intended to Indicate trend and cyclical rhythm
time frames and not absolute levels of price magnitudeAccumulation Zone
Distribution Zone Intermediate-Term Trend Structure
Schematic model intended to Indicate trend and cyclical rhythm
time frames and not absolute levels of price magnitude
Distribution Zone
Long-Term Trend Structure
Short-Term Trend Structure
Intermediate-Term Trend Structure
Accumulation Zone
Copyright 2009. Market Technicians Association Educational Foundation, Inc. All Rights Reserved.
7
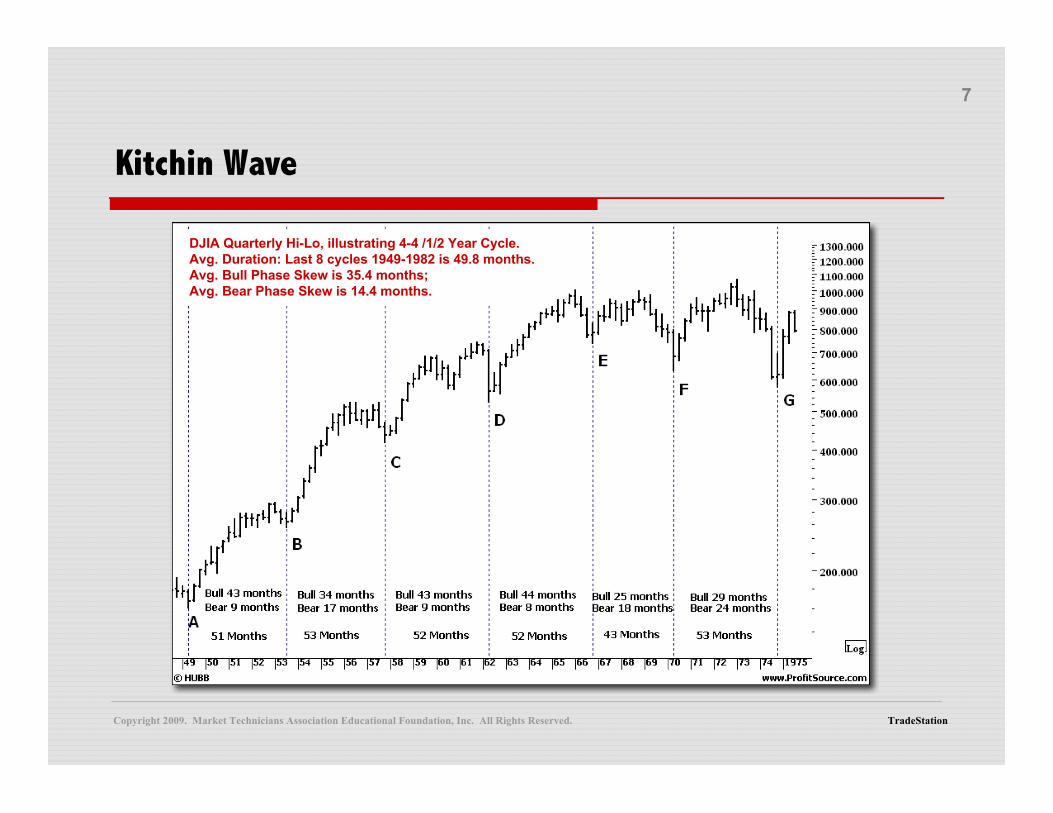
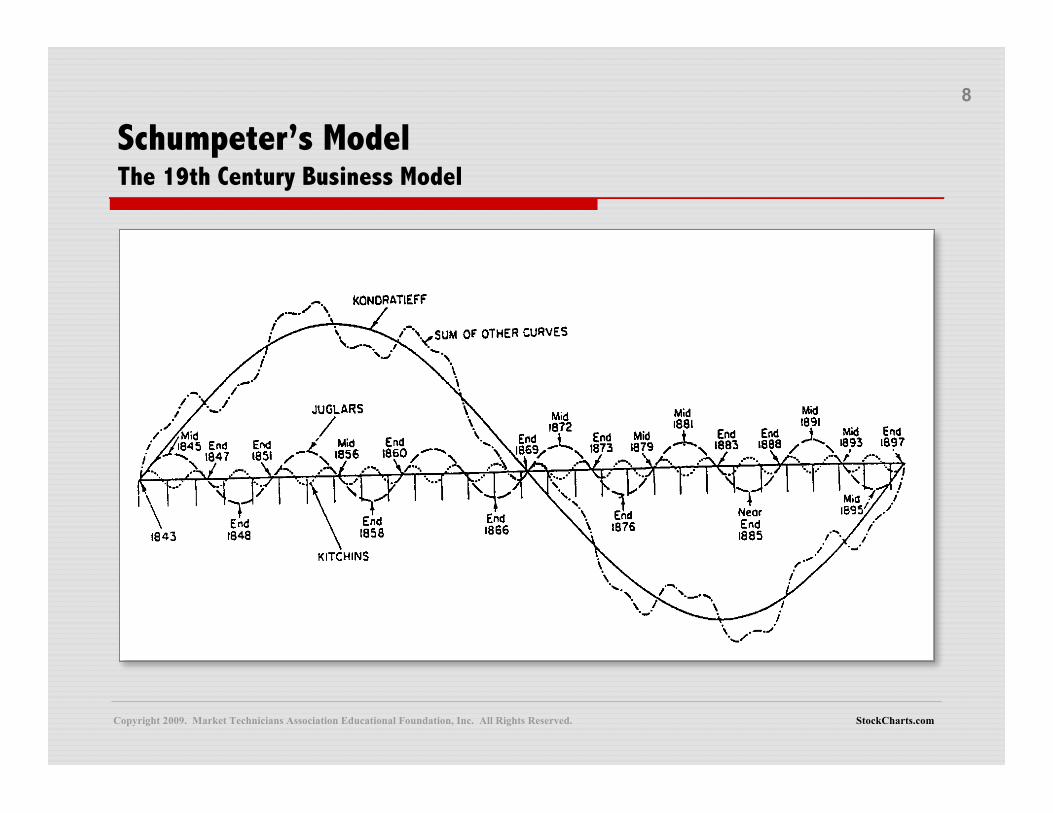
Kitchin Wave
TradeStation
DJIA Quarterly Hi-Lo, illustrating 4-4 /1/2 Year Cycle.Avg. Duration: Last 8 cycles 1949-1982 is 49.8 months.Avg. Bull Phase Skew is 35.4 months;Avg. Bear Phase Skew is 14.4 months.
Copyright 2009. Market Technicians Association Educational Foundation, Inc. All Rights Reserved.
8
StockCharts.com
Schumpeter’s ModelThe 19th Century Business Model
Copyright 2009. Market Technicians Association Educational Foundation, Inc. All Rights Reserved.
9
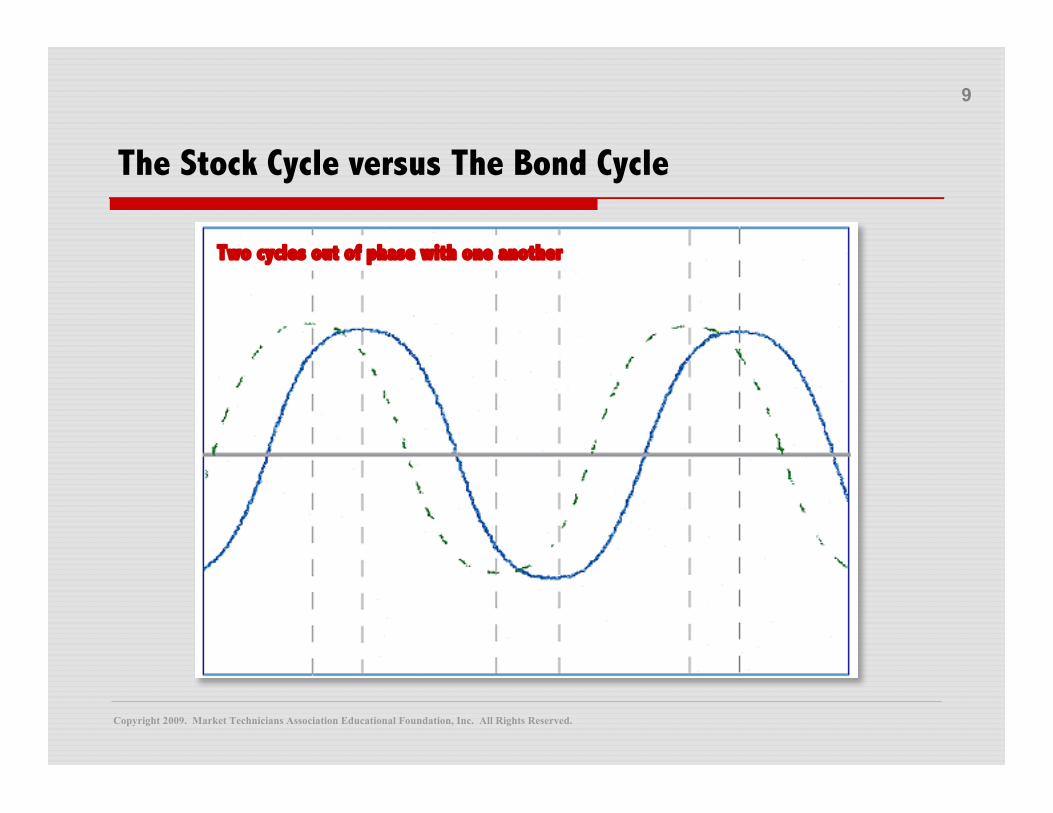
The Stock Cycle versus The Bond Cycle
Two cycles out of phase with one another
Copyright 2009. Market Technicians Association Educational Foundation, Inc. All Rights Reserved.
10
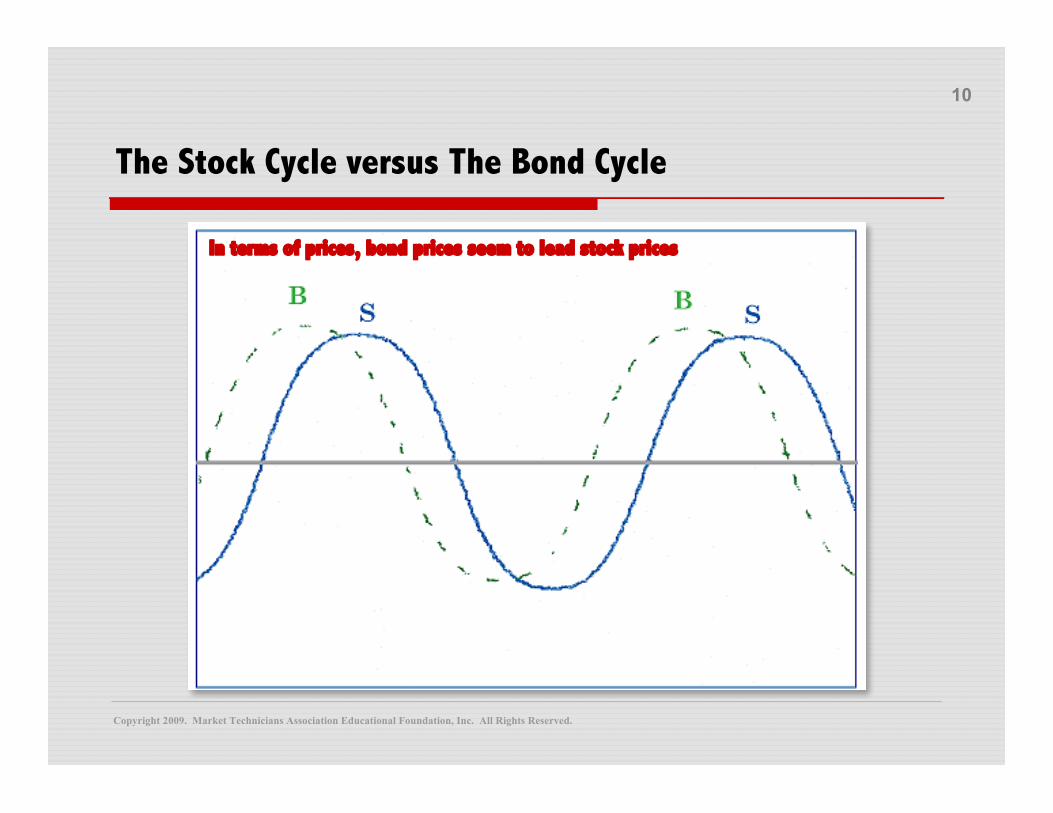
The Stock Cycle versus The Bond Cycle
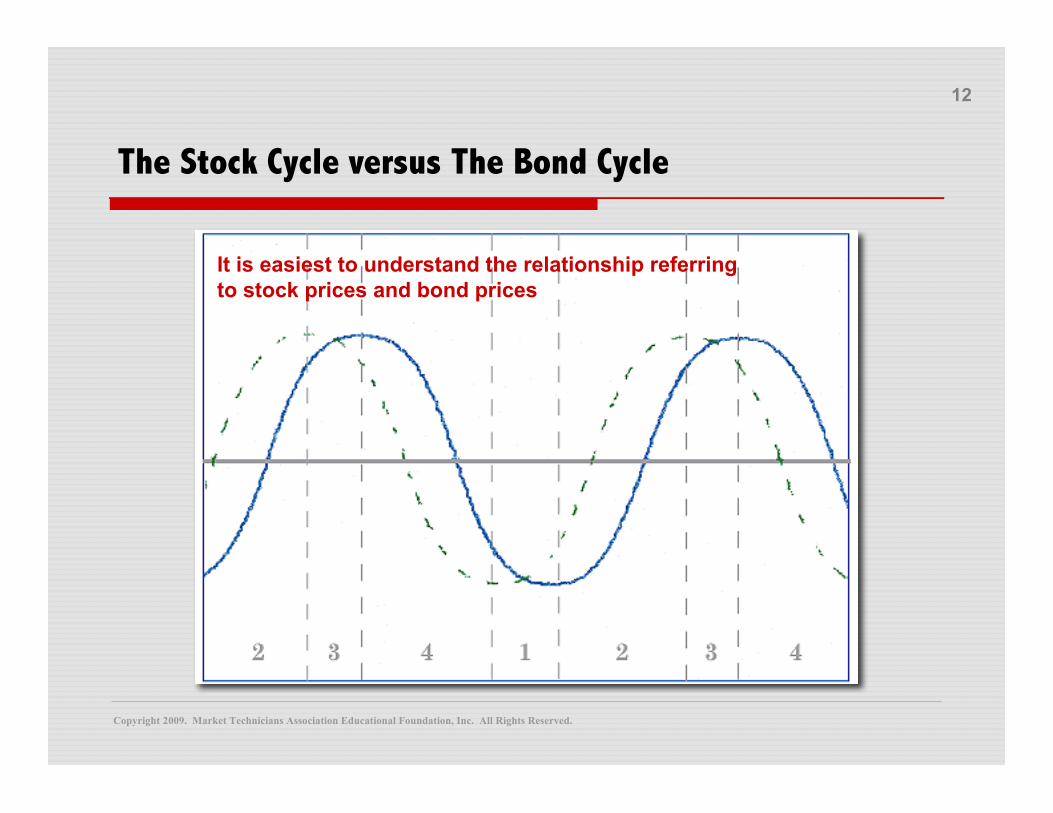
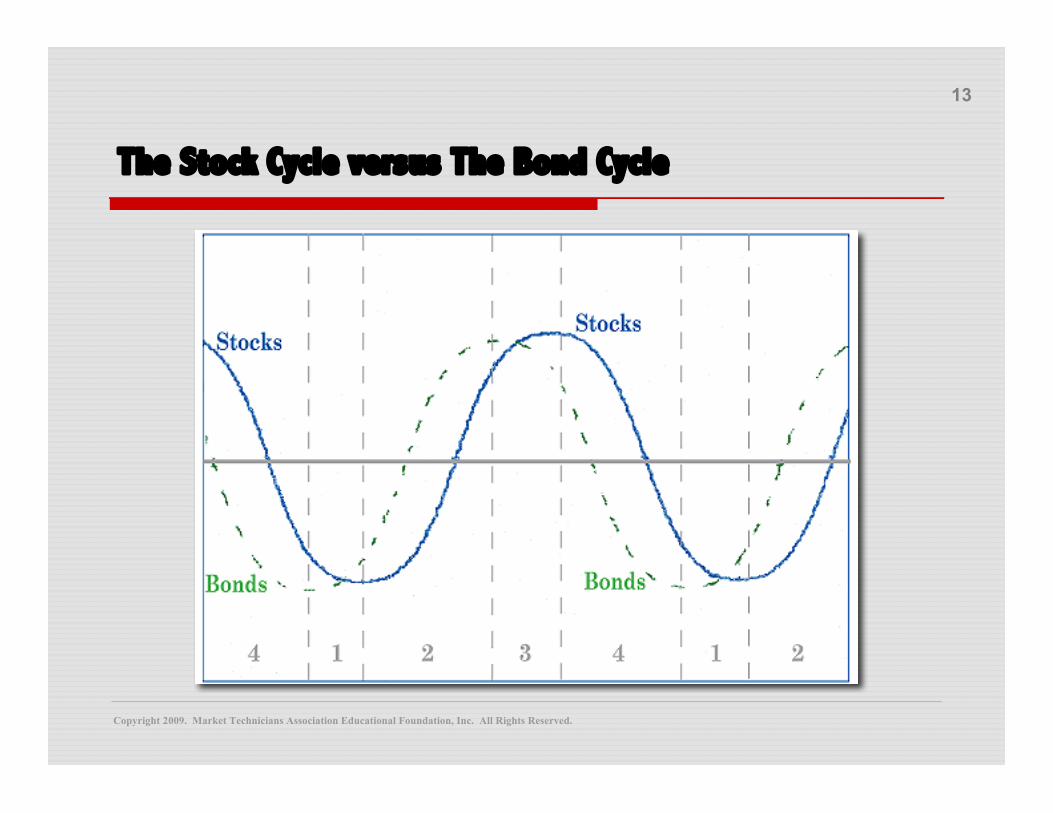
In terms of prices, bond prices seem to lead stock prices
Copyright 2009. Market Technicians Association Educational Foundation, Inc. All Rights Reserved.
11
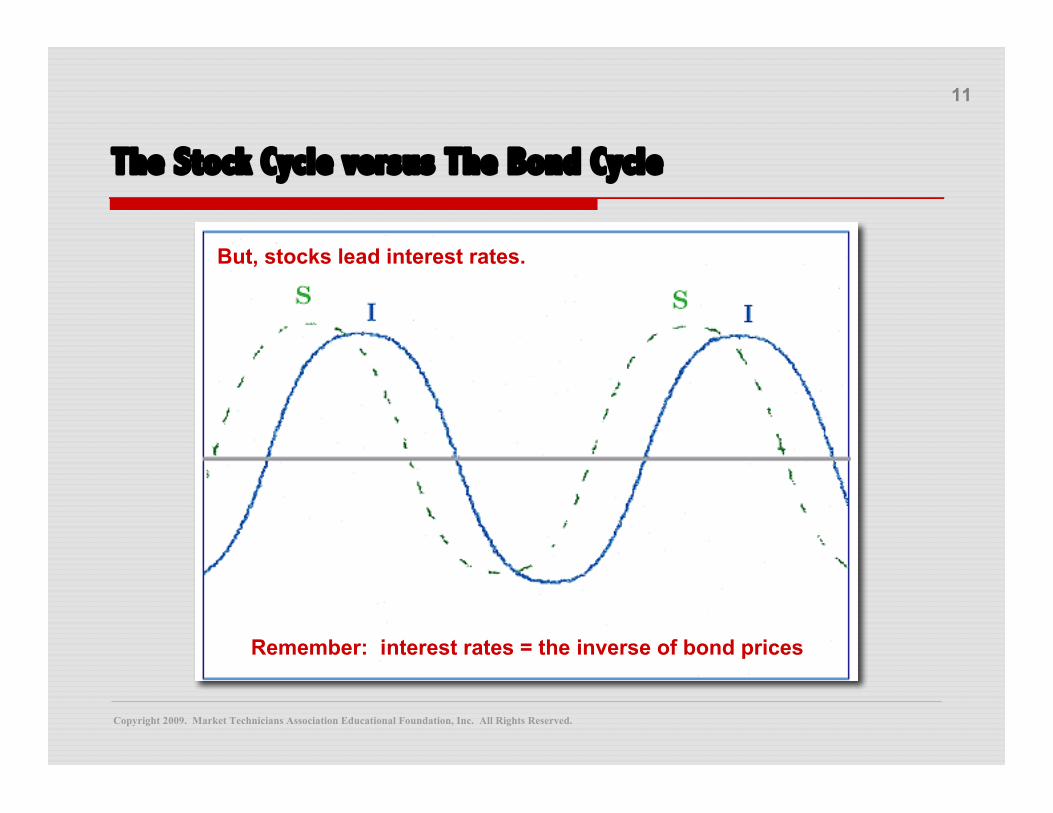
The Stock Cycle versus The Bond Cycle
But, stocks lead interest rates.
Remember: interest rates = the inverse of bond prices
Copyright 2009. Market Technicians Association Educational Foundation, Inc. All Rights Reserved.
12
The Stock Cycle versus The Bond Cycle
It is easiest to understand the relationship referringto stock prices and bond prices
Copyright 2009. Market Technicians Association Educational Foundation, Inc. All Rights Reserved.
13
The Stock Cycle versus The Bond Cycle
Copyright 2009. Market Technicians Association Educational Foundation, Inc. All Rights Reserved.
14
The Stock Cycle versus The Bond Cycle
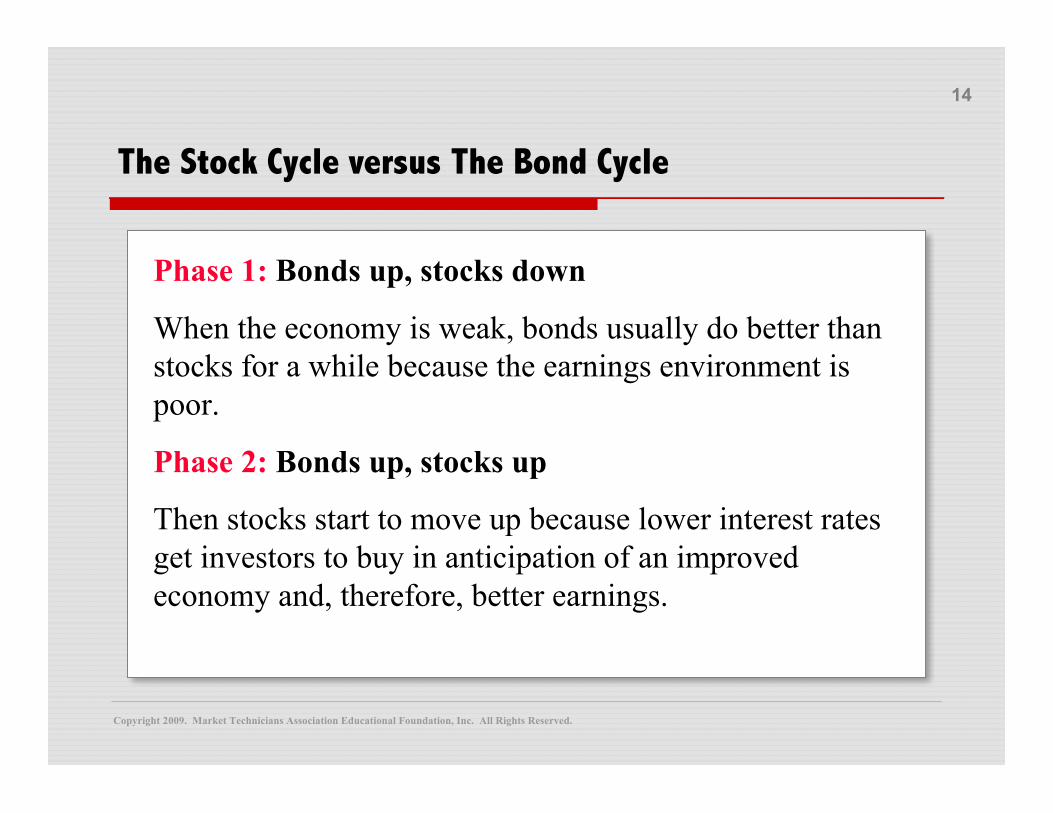
Phase 1: Bonds up, stocks down
When the economy is weak, bonds usually do better thanstocks for a while because the earnings environment ispoor.
Phase 2: Bonds up, stocks up
Then stocks start to move up because lower interest ratesget investors to buy in anticipation of an improvedeconomy and, therefore, better earnings.
Copyright 2009. Market Technicians Association Educational Foundation, Inc. All Rights Reserved.
15
The Stock Cycle versus The Bond Cycle
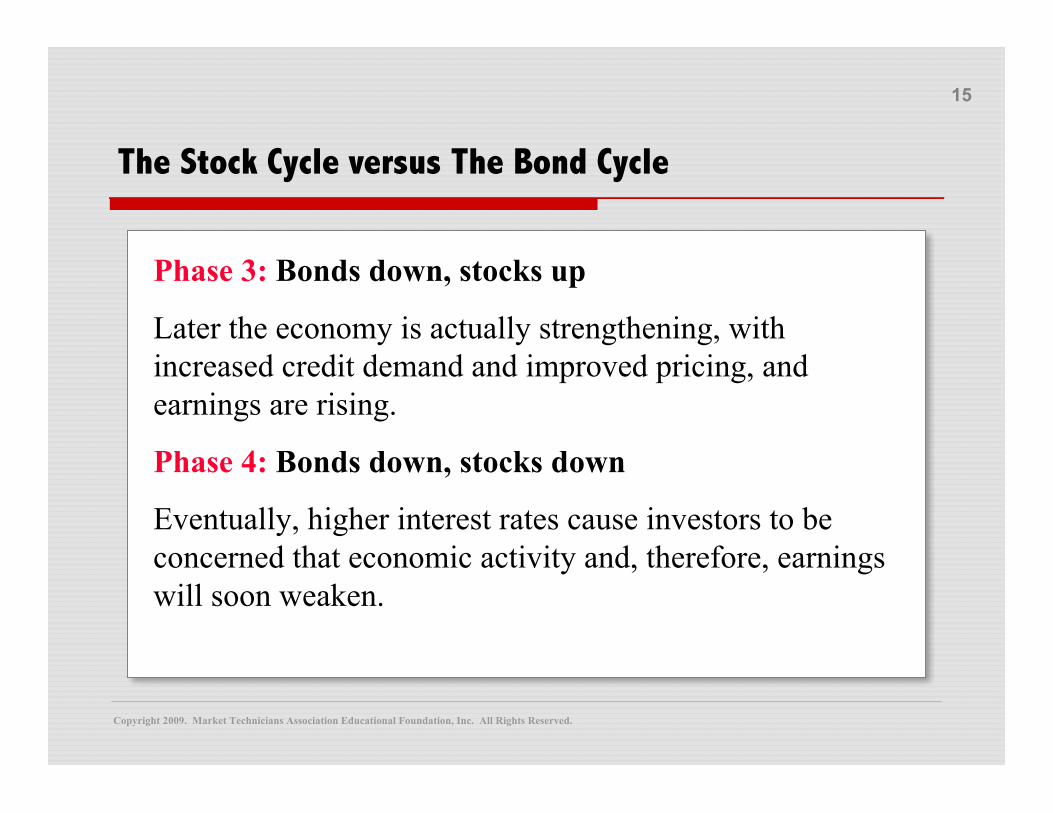
Phase 3: Bonds down, stocks up
Later the economy is actually strengthening, withincreased credit demand and improved pricing, andearnings are rising.
Phase 4: Bonds down, stocks down
Eventually, higher interest rates cause investors to beconcerned that economic activity and, therefore, earningswill soon weaken.
Copyright 2009. Market Technicians Association Educational Foundation, Inc. All Rights Reserved.
16
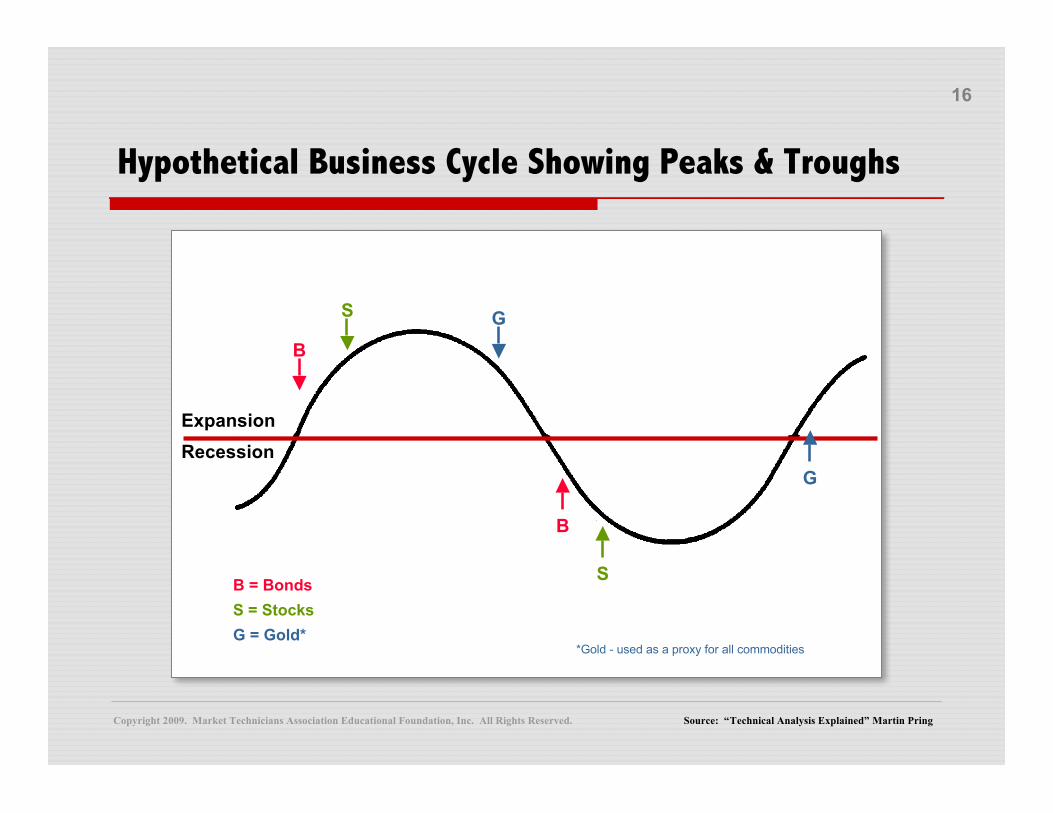
Hypothetical Business Cycle Showing Peaks & Troughs
Source: “Technical Analysis Explained” Martin Pring
*Gold - used as a proxy for all commodities
B
B
S
S
G
G
ExpansionRecession
B = BondsS = StocksG = Gold*
Copyright 2009. Market Technicians Association Educational Foundation, Inc. All Rights Reserved.
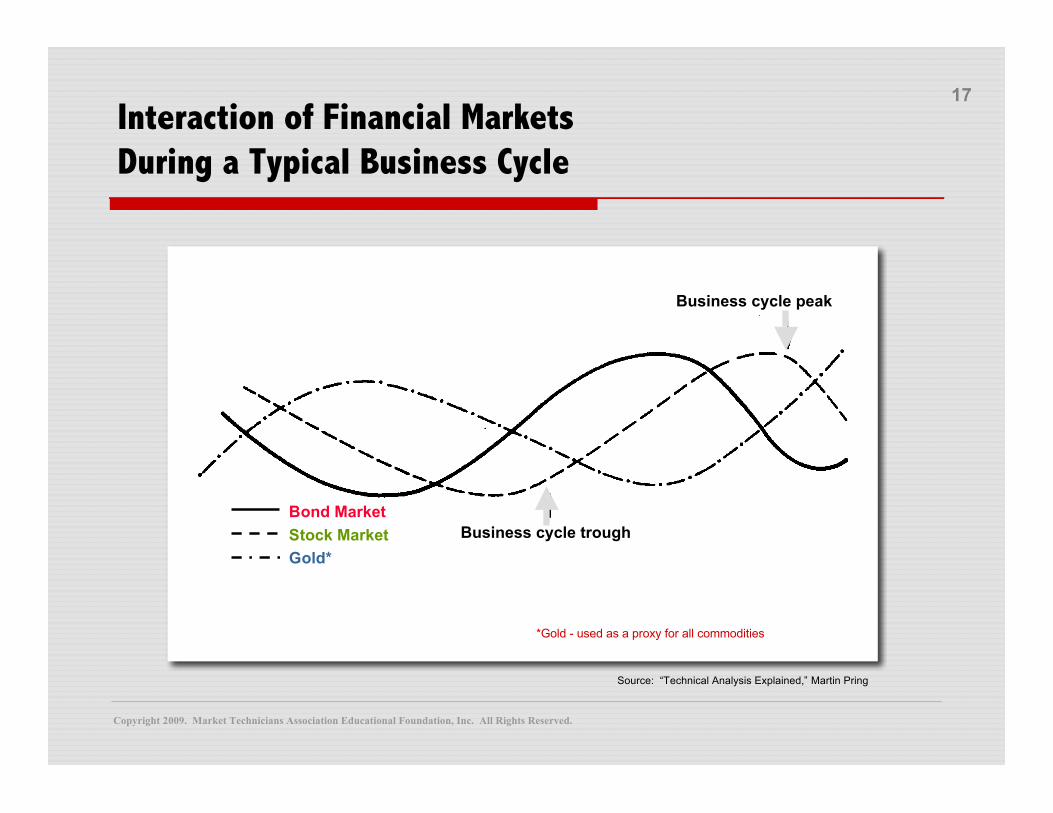
17Interaction of Financial MarketsDuring a Typical Business Cycle
Bond MarketStock MarketGold*
Business cycle trough
Business cycle peak
Source: “Technical Analysis Explained,” Martin Pring
*Gold - used as a proxy for all commodities
Copyright 2009. Market Technicians Association Educational Foundation, Inc. All Rights Reserved.
18
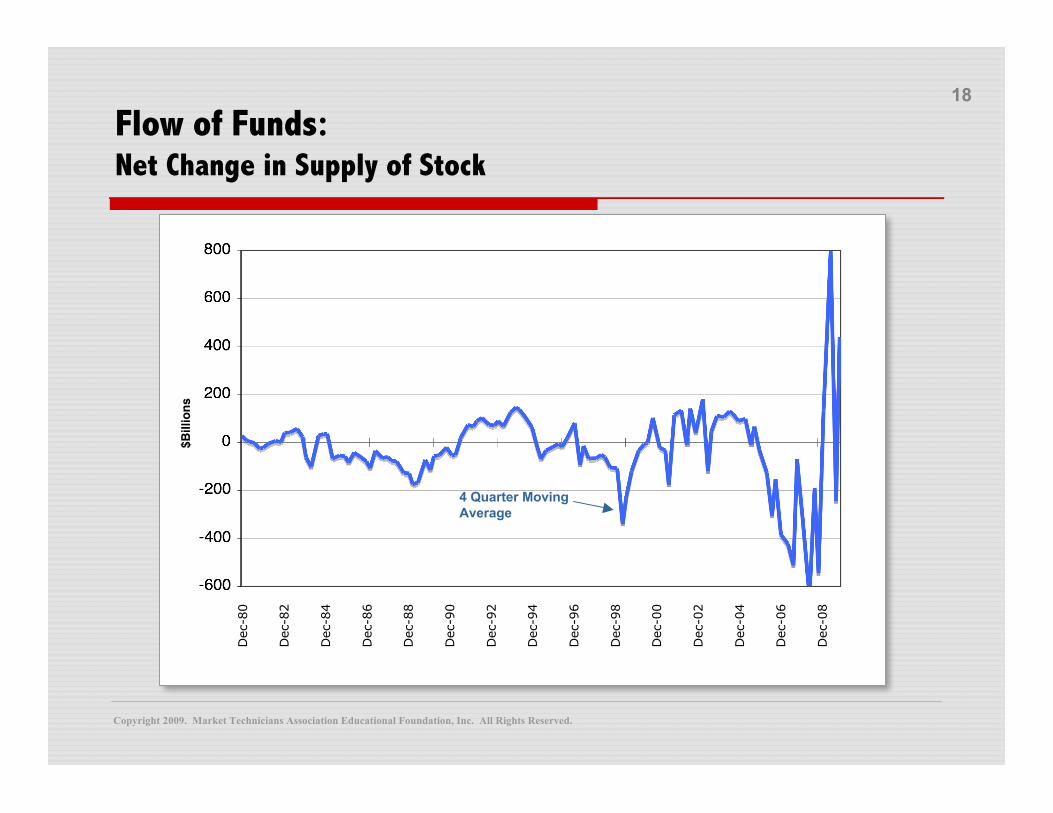
Flow of Funds:Net Change in Supply of Stock
Dec-80
Dec-82
Dec-84
Dec-86
Dec-88
Dec-90
Dec-92
Dec-94
Dec-96
Dec-98
Dec-00
Dec-02
Dec-04
Dec-06
Dec-08
4 Quarter MovingAverage
$Bill
ions
Copyright 2009. Market Technicians Association Educational Foundation, Inc. All Rights Reserved.
19
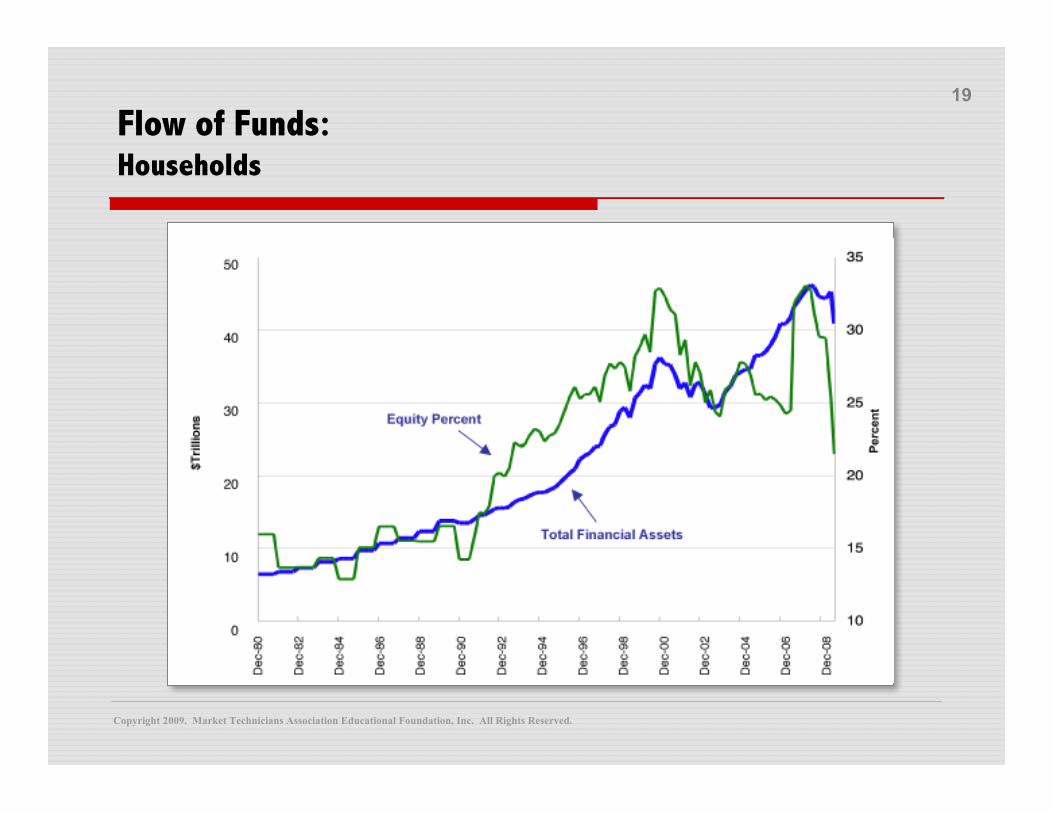
Flow of Funds:Households
Copyright 2009. Market Technicians Association Educational Foundation, Inc. All Rights Reserved.
20
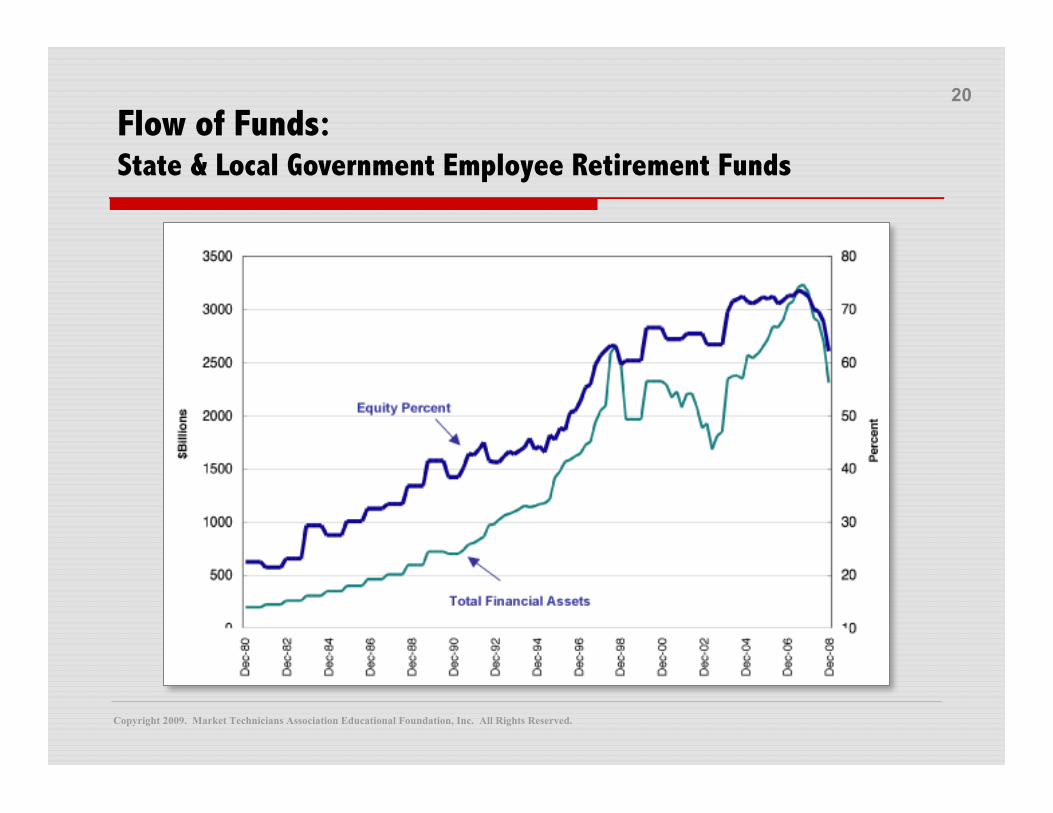
Flow of Funds:State & Local Government Employee Retirement Funds
Copyright 2009. Market Technicians Association Educational Foundation, Inc. All Rights Reserved.
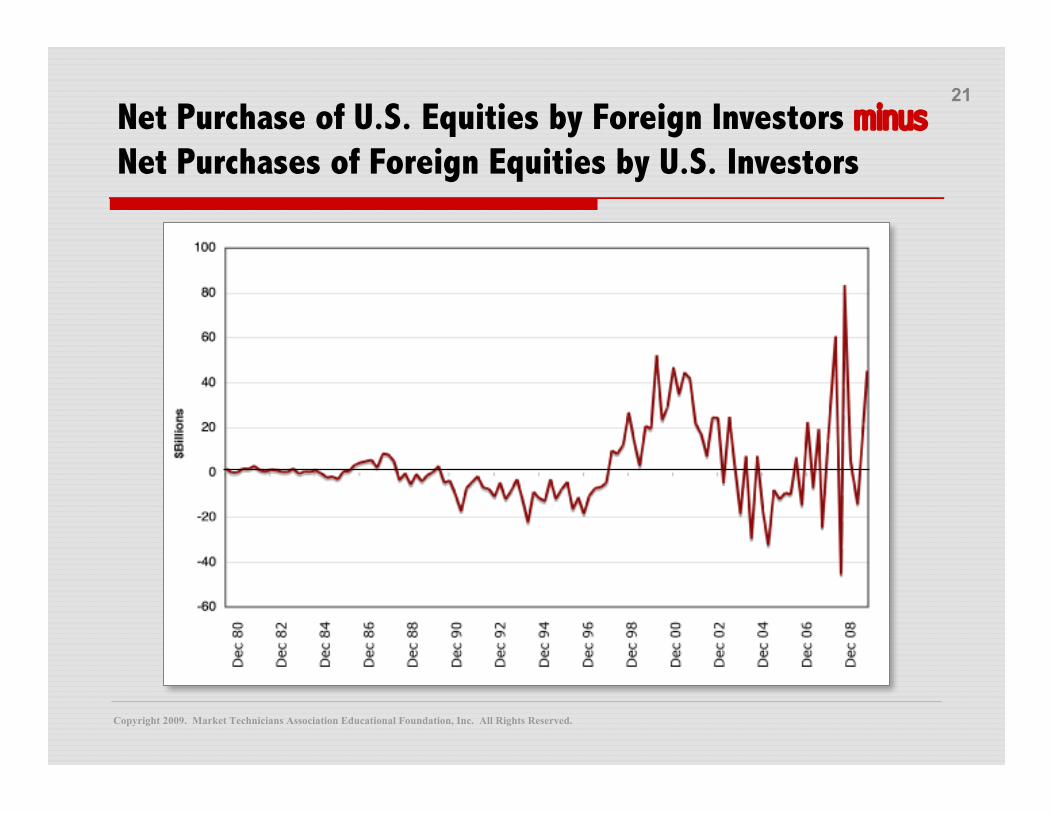
21Net Purchase of U.S. Equities by Foreign Investors minusNet Purchases of Foreign Equities by U.S. Investors
Copyright 2009. Market Technicians Association Educational Foundation, Inc. All Rights Reserved.
22
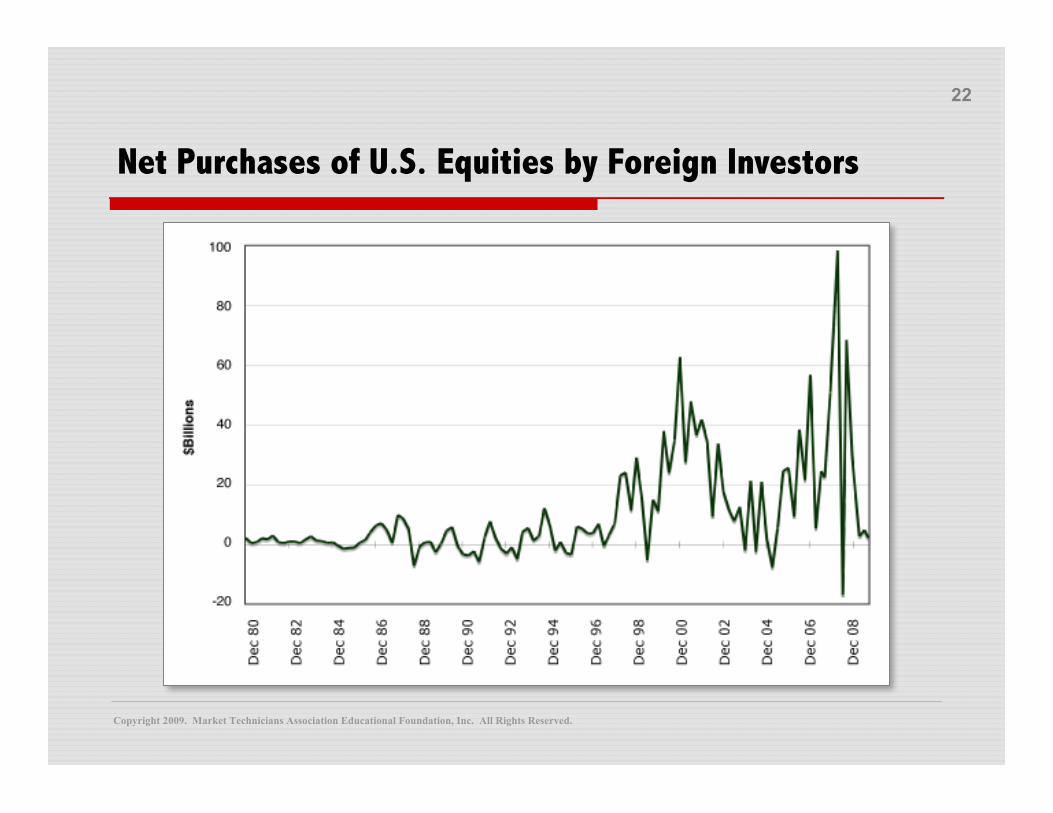
Net Purchases of U.S. Equities by Foreign Investors
Copyright 2009. Market Technicians Association Educational Foundation, Inc. All Rights Reserved.
23
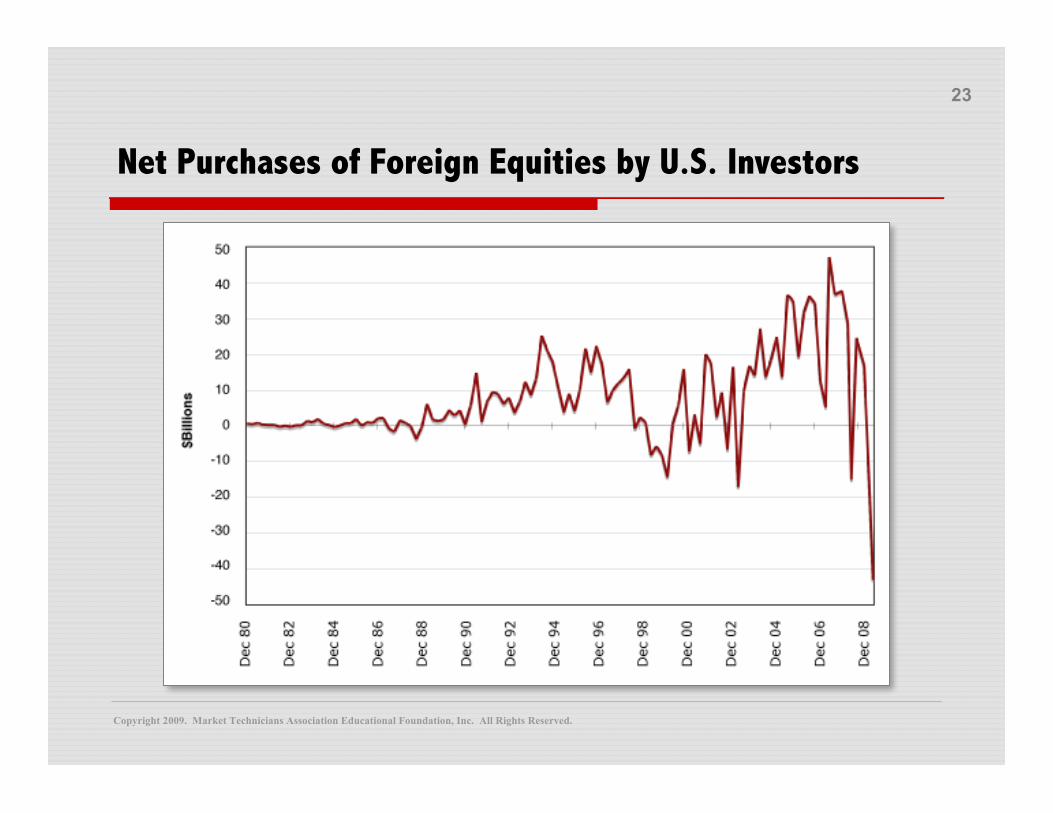
Net Purchases of Foreign Equities by U.S. Investors
Copyright 2009. Market Technicians Association Educational Foundation, Inc. All Rights Reserved.
24
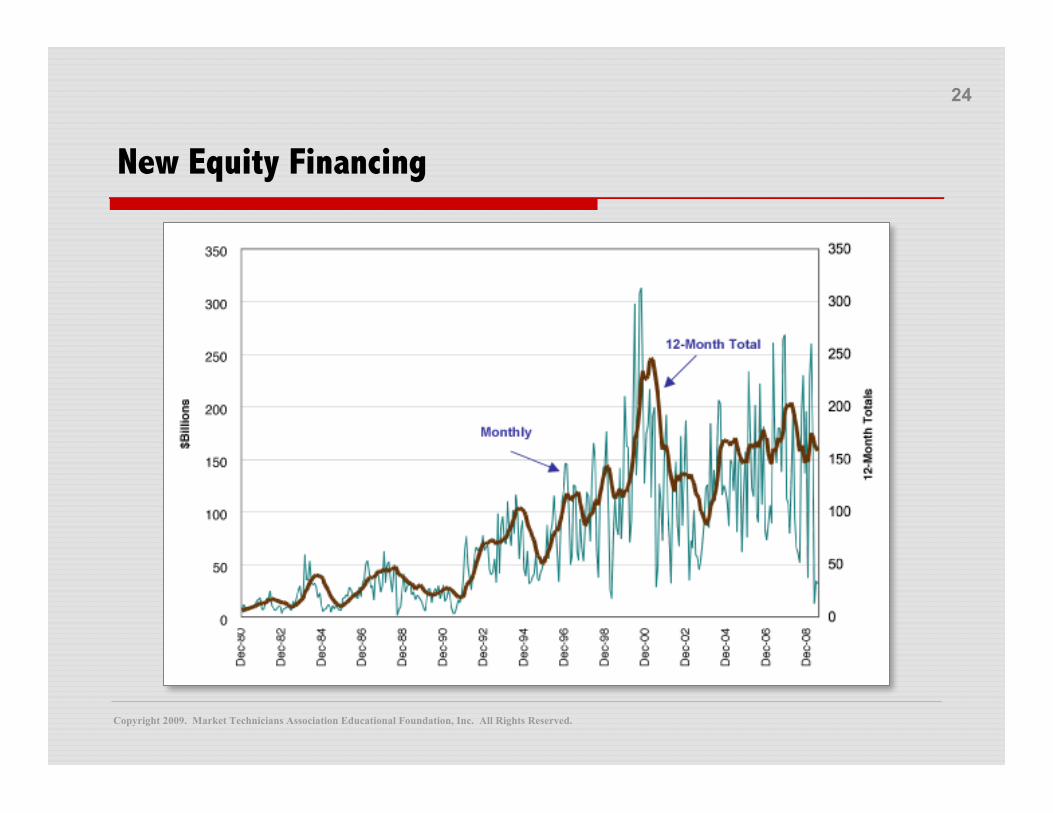
New Equity Financing
Copyright 2009. Market Technicians Association Educational Foundation, Inc. All Rights Reserved.
25
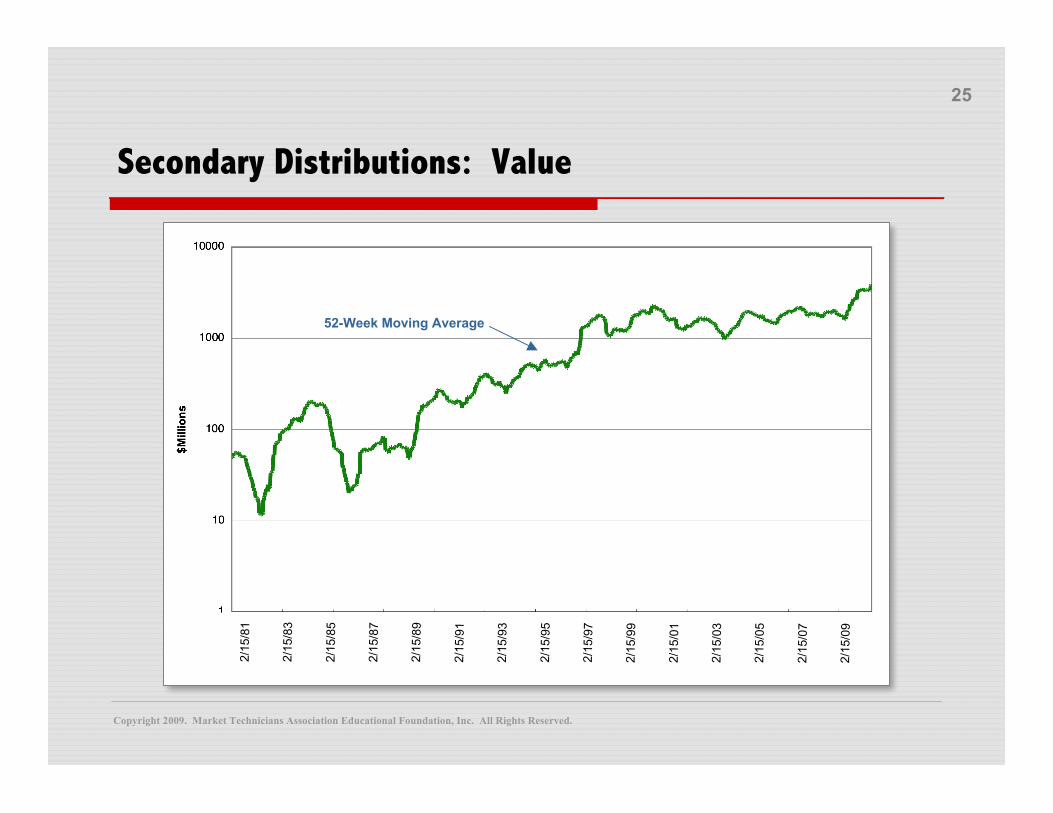
Secondary Distributions: Value
52-Week Moving Average
2/15
/81
2/15
/83
2/15
/85
2/15
/87
2/15
/89
2/15
/91
2/15
/93
2/15
/95
2/15
/97
2/15
/99
2/15
/01
2/15
/03
2/15
/05
2/15
/07
2/15
/09
Copyright 2009. Market Technicians Association Educational Foundation, Inc. All Rights Reserved.
26
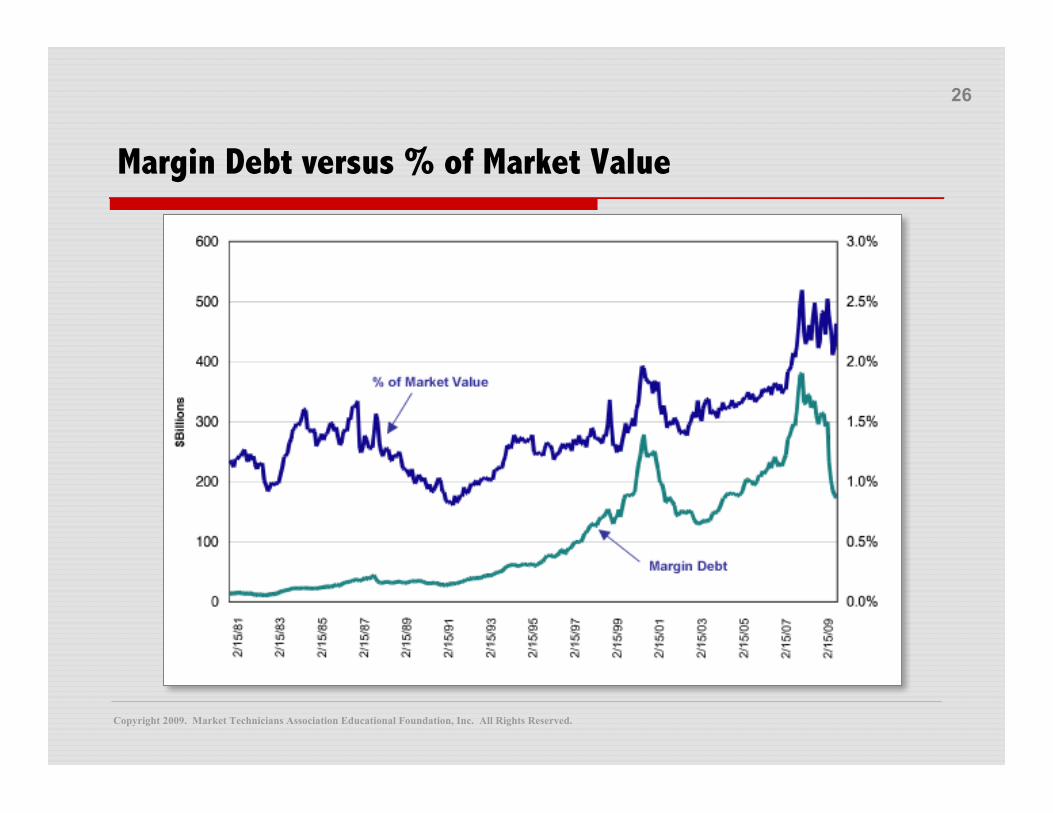
Margin Debt versus % of Market Value
Copyright 2009. Market Technicians Association Educational Foundation, Inc. All Rights Reserved.
27
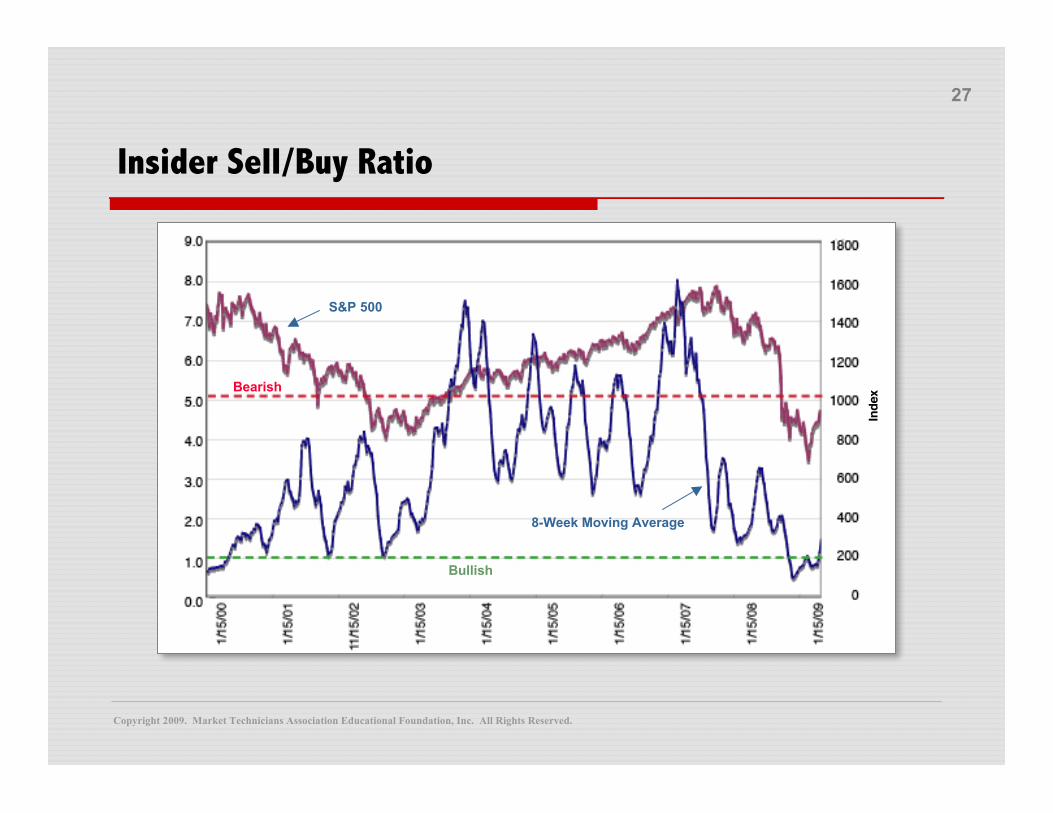
Insider Sell/Buy Ratio
Inde
xBearish
Bullish
8-Week Moving Average
S&P 500
Copyright 2009. Market Technicians Association Educational Foundation, Inc. All Rights Reserved.
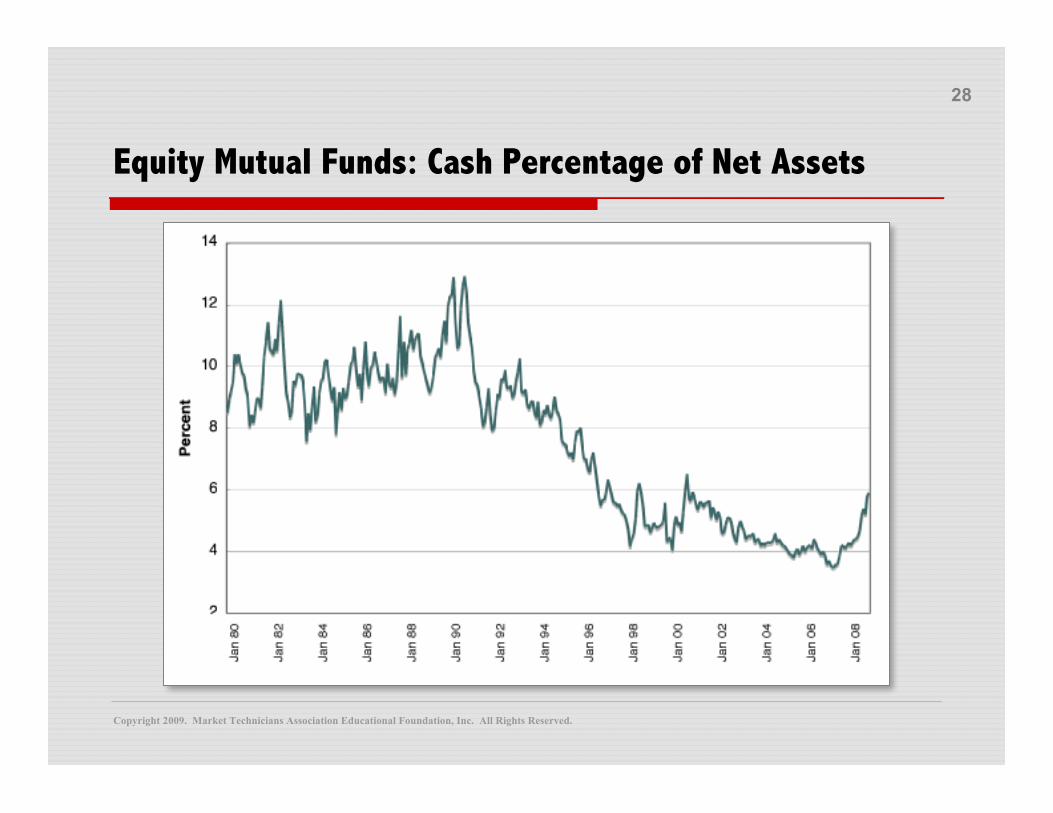
28
Equity Mutual Funds: Cash Percentage of Net Assets
Copyright 2009. Market Technicians Association Educational Foundation, Inc. All Rights Reserved.
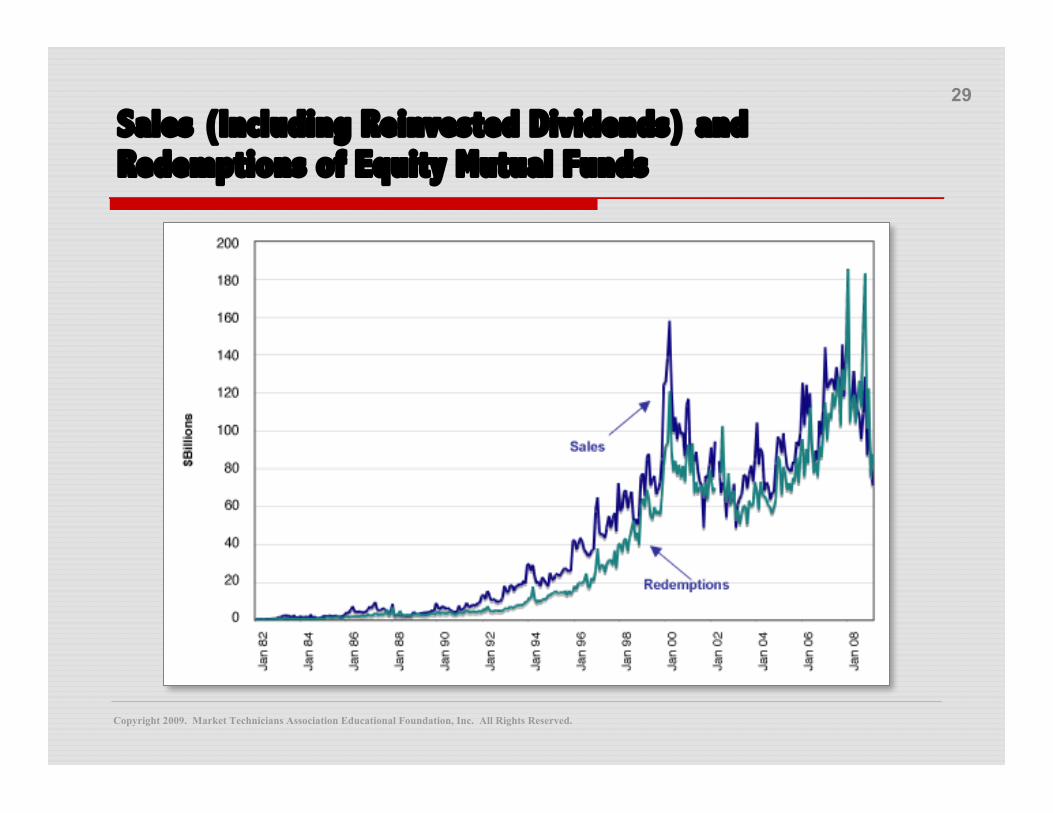
29
Sales (Including Reinvested Dividends) andRedemptions of Equity Mutual Funds
Copyright 2009. Market Technicians Association Educational Foundation, Inc. All Rights Reserved.
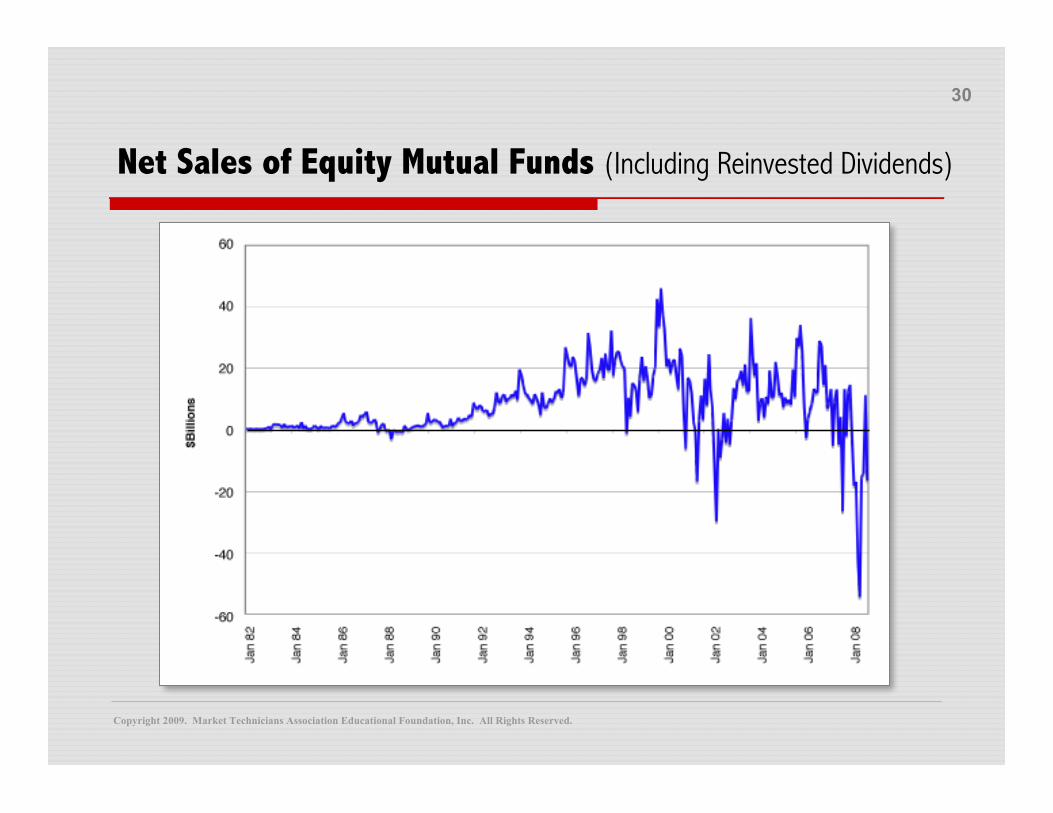
30
Net Sales of Equity Mutual Funds (Including Reinvested Dividends)
Copyright 2009. Market Technicians Association Educational Foundation, Inc. All Rights Reserved.
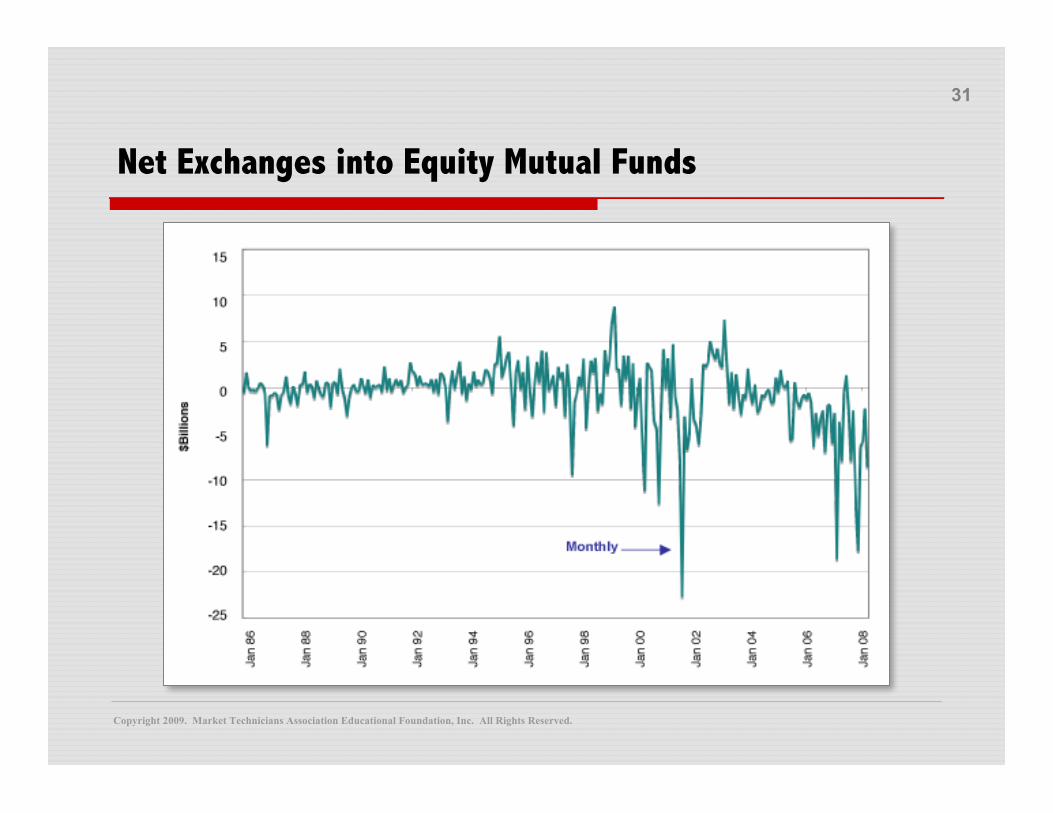
31
Net Exchanges into Equity Mutual Funds
Copyright 2009. Market Technicians Association Educational Foundation, Inc. All Rights Reserved.
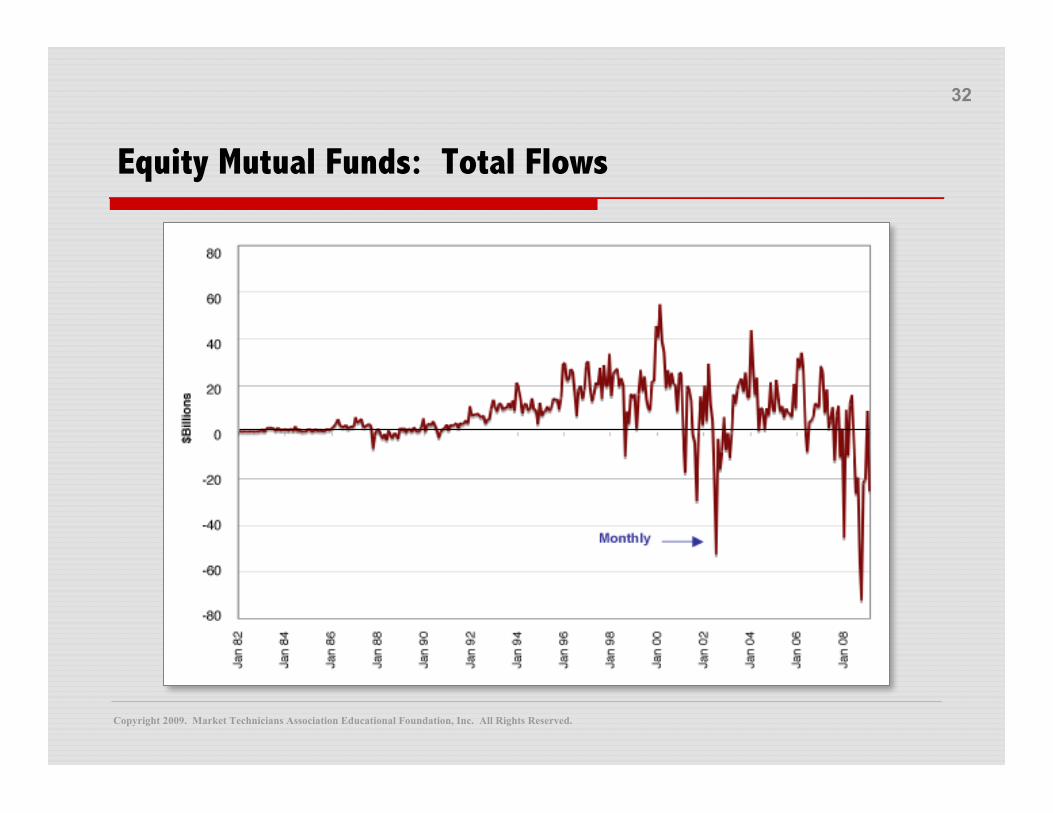
32
Equity Mutual Funds: Total Flows
Copyright 2009. Market Technicians Association Educational Foundation, Inc. All Rights Reserved.
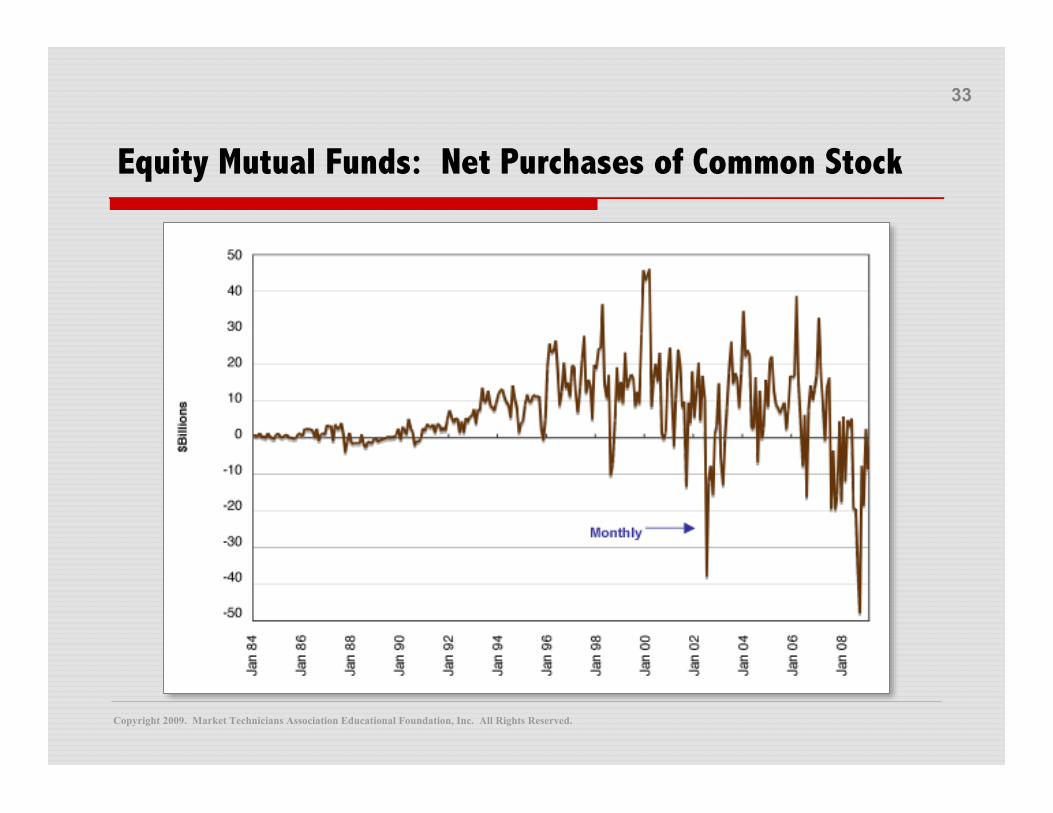
33
Equity Mutual Funds: Net Purchases of Common Stock
Copyright 2009. Market Technicians Association Educational Foundation, Inc. All Rights Reserved.
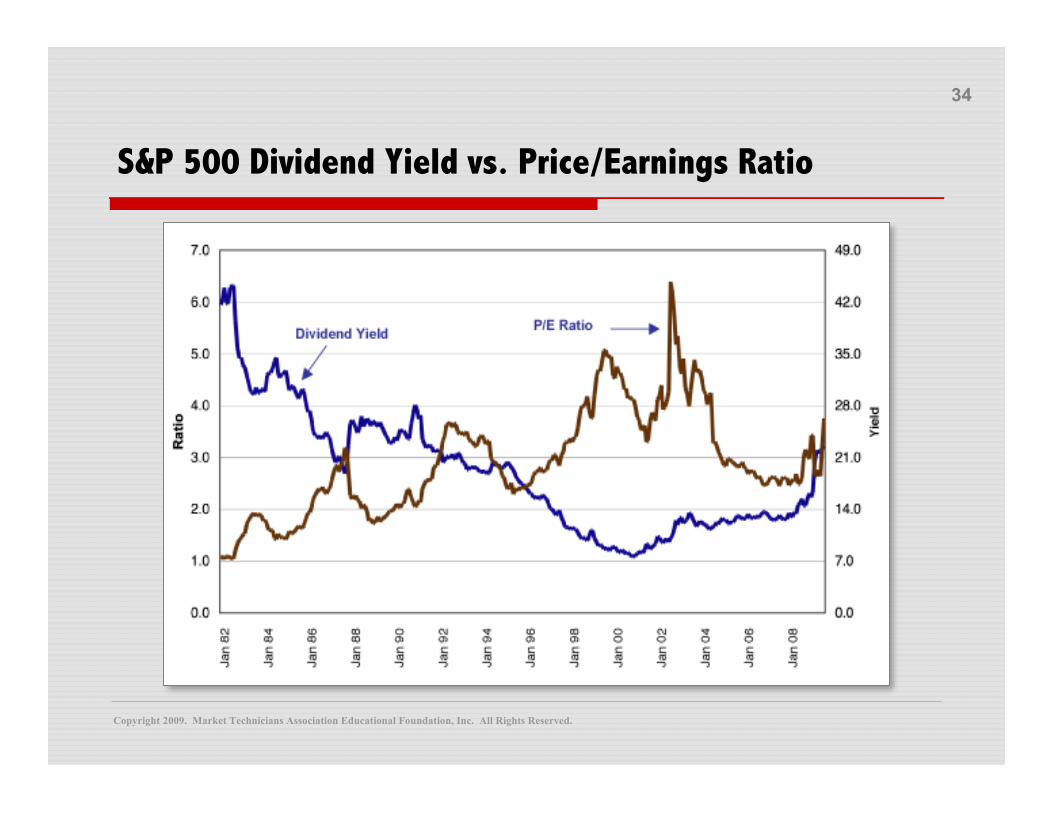
34
S&P 500 Dividend Yield vs. Price/Earnings Ratio
Copyright 2009. Market Technicians Association Educational Foundation, Inc. All Rights Reserved.
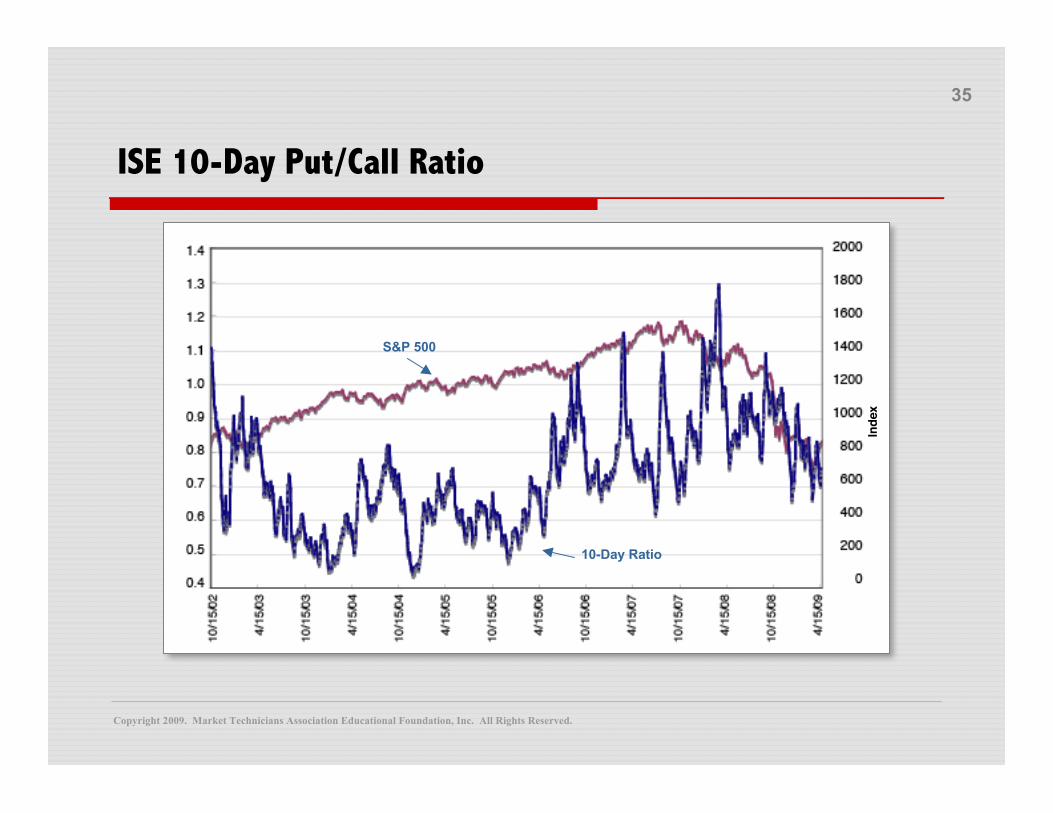
35
ISE 10-Day Put/Call Ratio
Inde
x
S&P 500
10-Day Ratio
Copyright 2009. Market Technicians Association Educational Foundation, Inc. All Rights Reserved.
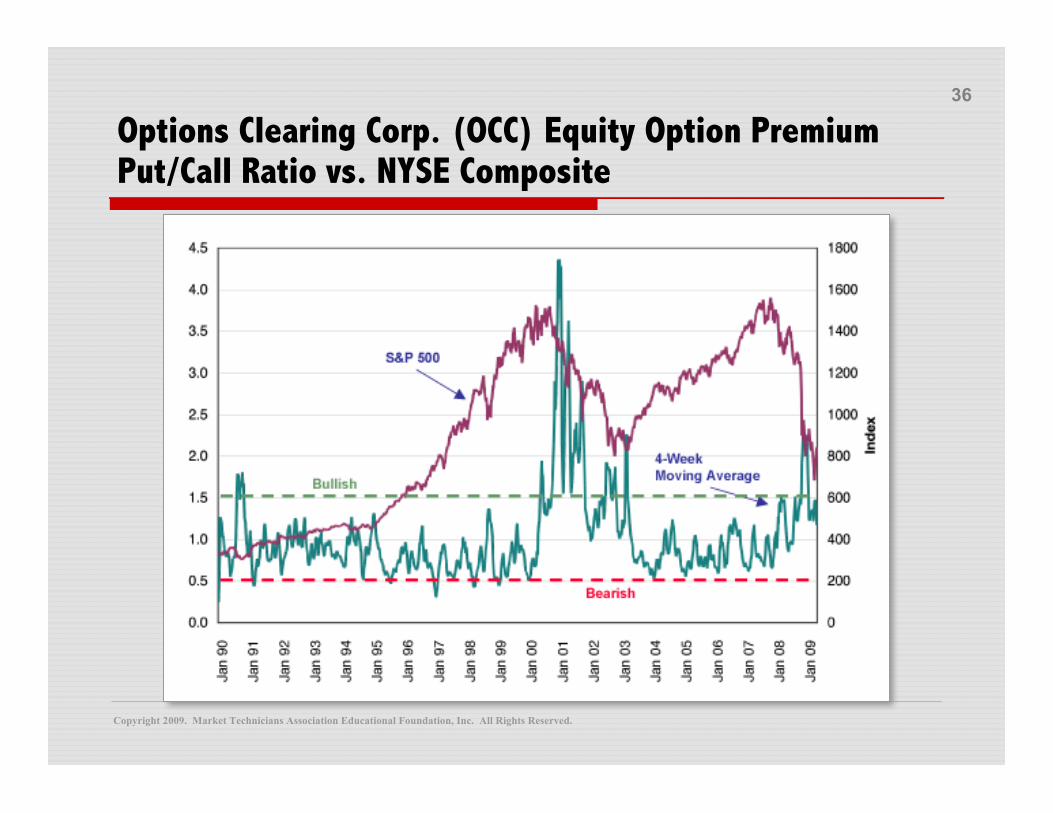
36
Options Clearing Corp. (OCC) Equity Option PremiumPut/Call Ratio vs. NYSE Composite
Copyright 2009. Market Technicians Association Educational Foundation, Inc. All Rights Reserved.
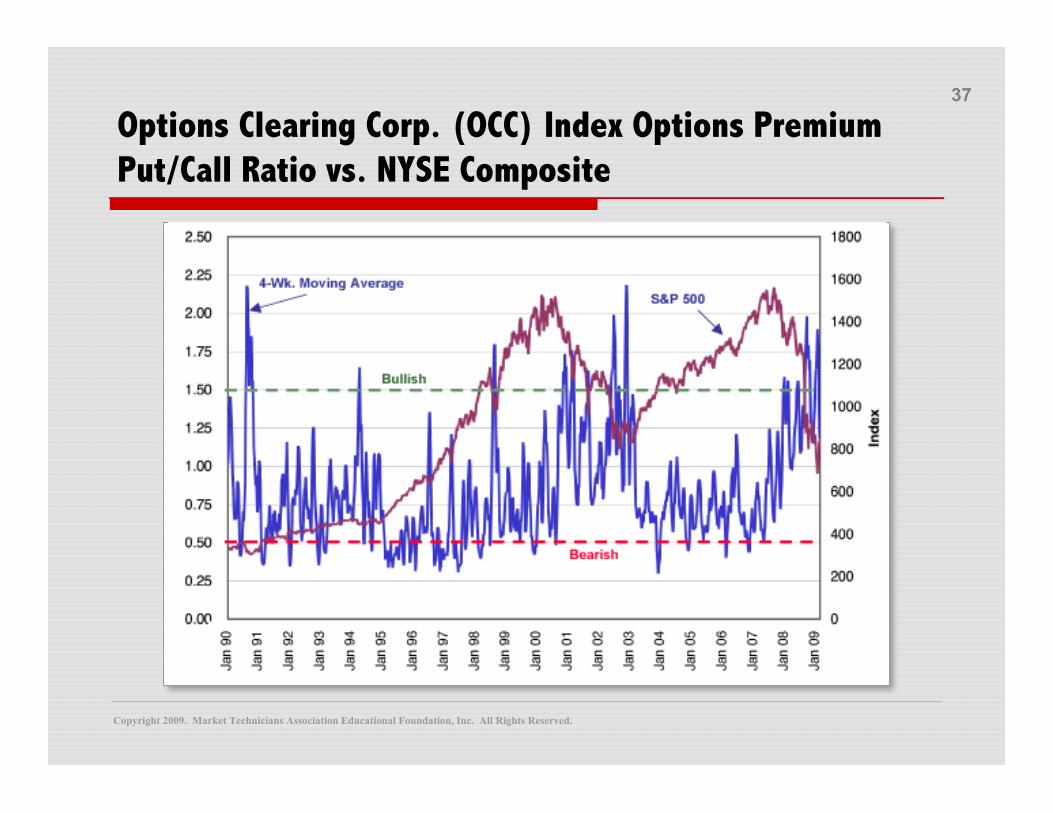
37
Options Clearing Corp. (OCC) Index Options PremiumPut/Call Ratio vs. NYSE Composite
Copyright 2009. Market Technicians Association Educational Foundation, Inc. All Rights Reserved.
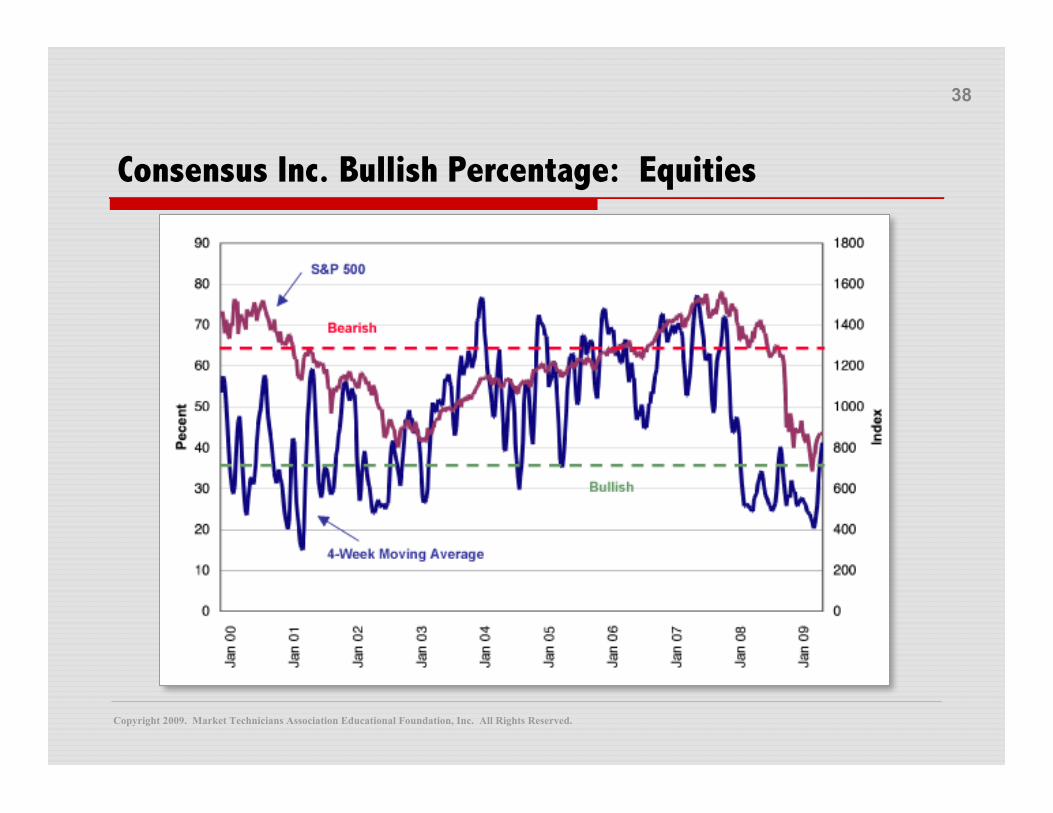
38
Consensus Inc. Bullish Percentage: Equities
Copyright 2009. Market Technicians Association Educational Foundation, Inc. All Rights Reserved.
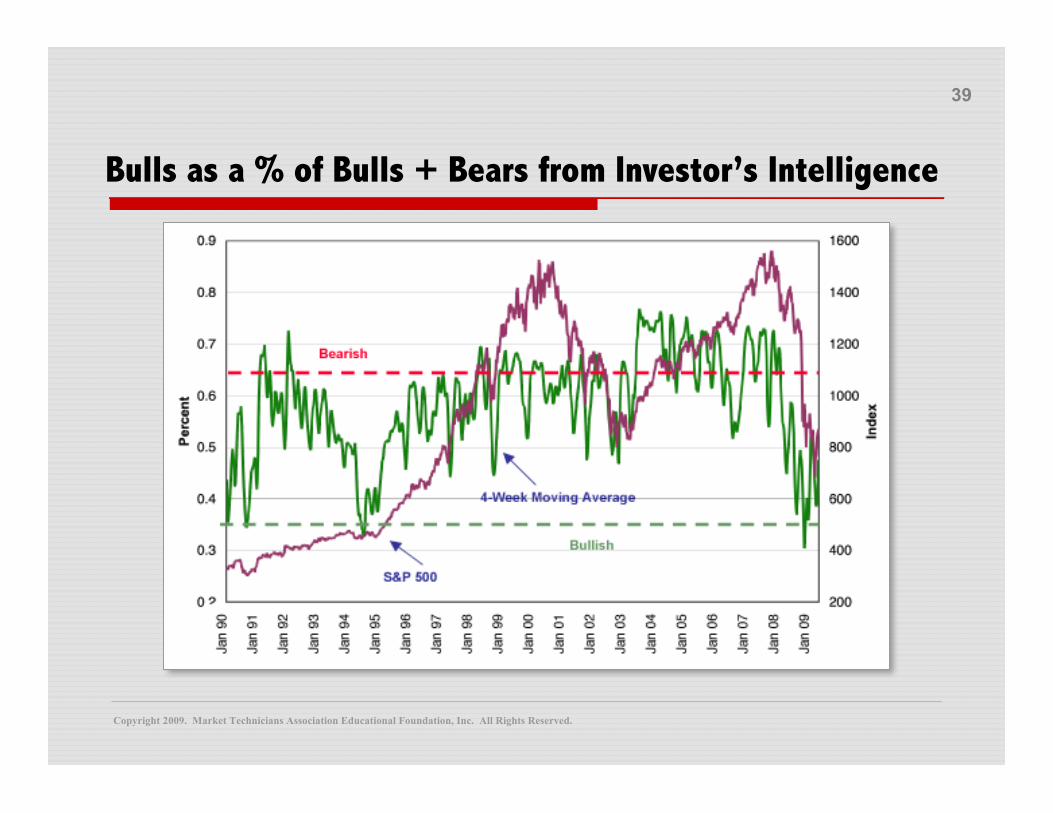
39
Bulls as a % of Bulls + Bears from Investor’s Intelligence
Copyright 2009. Market Technicians Association Educational Foundation, Inc. All Rights Reserved.
40
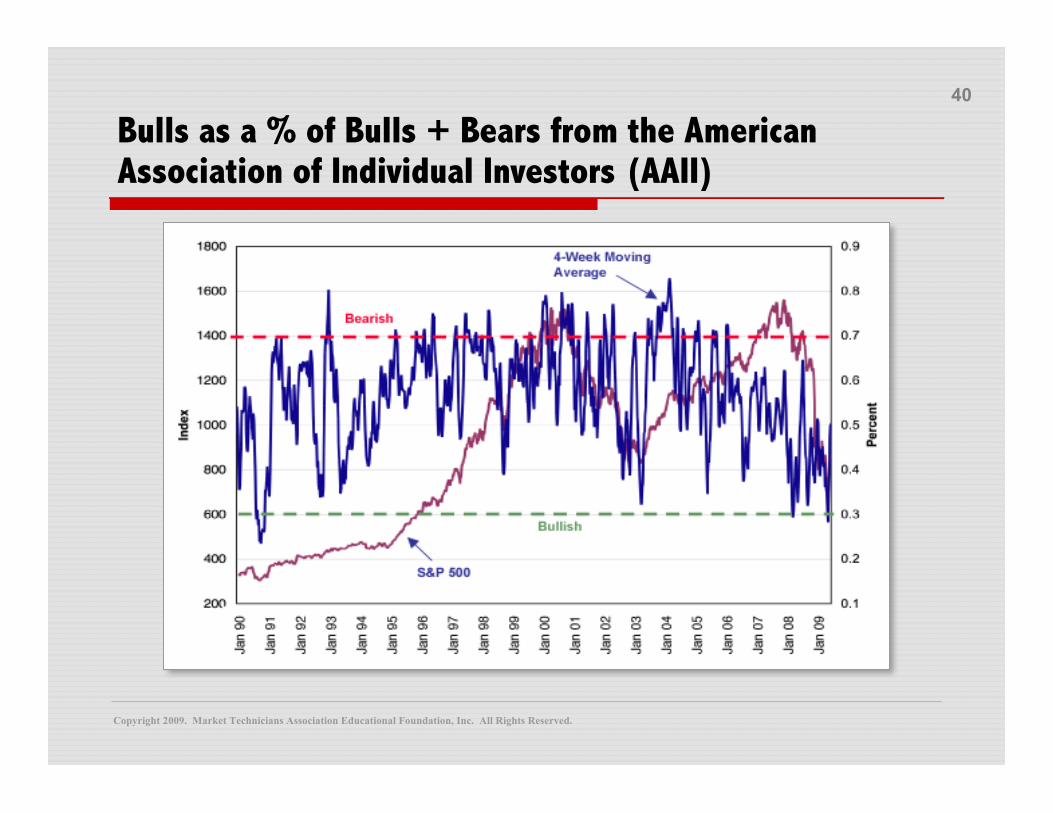
Bulls as a % of Bulls + Bears from the AmericanAssociation of Individual Investors (AAII)
Copyright 2009. Market Technicians Association Educational Foundation, Inc. All Rights Reserved.
41
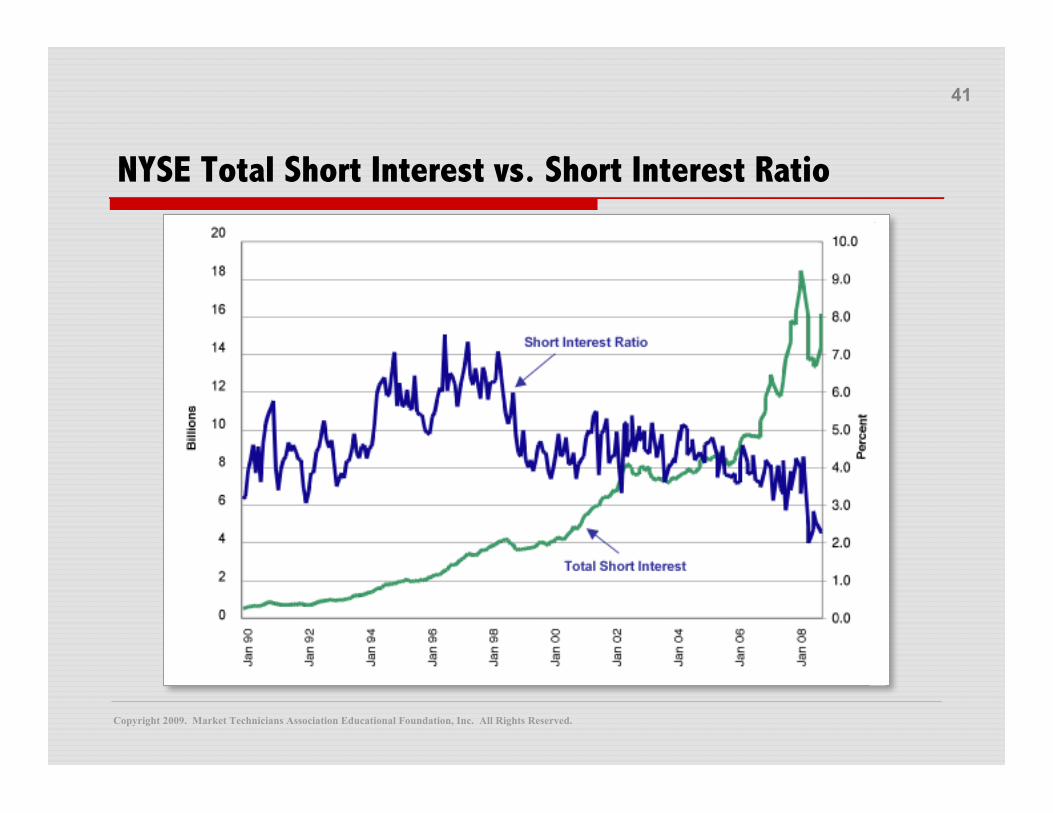
NYSE Total Short Interest vs. Short Interest Ratio