Grain size dependence of fracture toughness and crack-growth resistance

Using Crack Propagation Fracture Toughness to Characterize theDurability of Wood and Wood Composites
B. Mirzaei, A. Sinha, and J.A. Nairn∗
Wood Science and Engineering, Oregon State University, Corvallis, OR 97330, USA
Abstract
We measured fracture resistance curves (or R curves) for laminated veneer lumber (LVL) made with
Douglas fir veneer and polyvinyl acetate resin and for solid wood Douglas fir. The LVL and solid wood R
curves were the same for initiation of fracture, but the LVL toughness rose much higher than solid wood.
Because a rising R curve is caused by fiber bridging effects, these difference show that the LVL resin has
a large affect on the fiber bridging process. We exploited this resin effect to develop a test method for
characterizing the ability of a resin to provide wood composites that are durable to moisture exposure.
The test method exposed LVL specimens to soaking/drying cycles and then monitored the rising portion
of the LVL R curves as a function of the number of cycles. Douglas fir/polyvinyl acetate LVL lost about
30% of their toughness after 16 cycles. In characterizing toughness changes, it was important to focus
on the magnitude and rate of the toughness increase attributed to fiber bridging. We suggest these
properties are much preferred over other fracture or mechanical properties of wood that might be used
when characterizing durability.
Key words: Wood Based Composites, Adhesives, Durability, Fracture
1. Introduction
A persistent issue in wood products is moisture durability. When designing wood based composites,
moisture durability will depend on both the wood phase and the resin phase. A key question, therefore,
is how does one rank resins for their ability to convey moisture durability to wood composites? Most
current tests are qualitative such as exposing composites to moisture conditions followed by checking
for onset or extent of cracking [ASTM Standard D2559, 2012]. Other tests might monitor strength
∗Corresponding author, [email protected]
Preprint submitted to Elsevier December 16, 2014

as a function a moisture exposure. These tests may not be the best approach to ranking resins. Our
hypothesis is that measuring certain fracture properties as a function of moisture exposure can provide
new properties that will correlate better with resin quality for moisture durability.
Unlike metals, ceramics, and polymers, the fracture properties of wood are more complex and
more difficult to measure. One complexity in wood fracture is that crack propagation leaves a fracture
damage zone in the wake of the crack consisting of fibers that bridge the crack surfaces [Nairn, 2009].
Two consequences of fiber bridging are that the toughness of wood increases with crack growth and
measuring that increase requires methods that account for the fiber bridging. The measurement issue
has recently been solved for wood fracture [Matsumoto and Nairn, 2012] and the same methods work
well for crack propagation in wood composites [Sinha et al., 2012]. These new experiments measure
wood fracture toughness as a function of crack growth, which is known as the fracture resistance curve
or the R curve. After measuring the fracture properties of laminated veneer lumber (LVL), it was noted
that the R curve of LVL is much higher than the R curve of the solid wood for the species used in the
LVL veneer [Sinha et al., 2012]. Clearly, this large increment in toughness is caused by resin and/or by
wood/resin interactions. The goal of this work was to look for changes in wood composite R curves as
a quantitative marker for the role of a resin in moisture durability properties of that composite.
We focused on LVL experiments because the role of the resin is large and we could make custom LVL
billets with a variety of resins. Although some work has looked at LVL toughness, none have looked at
toughness changes due to moisture exposure. Sinha et al. [2012] studied the affect of elevated temper-
ature on the R curves of solid wood and some wood composites. They reported initiation and steady
state toughness of 1050 J/m2 for LVL with PF resin. Most other prior studies considered only initiation
toughness (Gini t) or total work of fracture (G f ) [Stanzl-Tchegg and Navi, 2009]. Ardalany et al. [2012]
reports an initiation toughness of 144 to 266 J/m2 for Pine LVL. They also investigated G f of Pine lum-
ber and Pine LVL. Although important characteristics, Gini t and G f provide incomplete characterization
of wood based composites. Gini t is highly scattered and does not provide any information about rising
R curves found for materials with fracture bridging, while G f falls short in monitoring the behavior of
the material throughout the fracture process. At best, G f provides an average toughness value. For
wood and wood composites, it is preferable to use the entire R curve when evaluating their fracture
properties.
This work’s objective was to use crack propagation fracture toughness as a method for characterizing
the moisture durability of wood composites (LVL) and solid wood. In these experiments, the fracture
2
toughness as a function of crack propagation was continuously monitored resulting in full R curves. A
challenge in following crack propagation in wood products is accurately recording crack length. We
solved this challenge by monitoring crack growth using digital image correlation (DIC) techniques
[Bruck et al., 1989]. In control experiments, the fracture toughness of LVL was compared to solid
wood of the same species. The fracture toughness at initiation was similar for LVL and solid wood, but
as the crack propagated, the LVL toughness became much higher. This extra toughness increase was
attributed to resin interactions with wood. We next measured changes in the rate and magnitude of the
toughness increase after exposing LVL specimens to 4 to 16 soaking/drying cycles. By careful analysis
of key features of the R curves, we could monitor the moisture degradation processes. We suggest these
fracture methods can provide a new tool for ranking the contribution of resins to the durability of wood
composites.
2. Materials and Methods
2.1. Materials
Laminated veneer lumber (LVL) billets were lab-made under controlled conditions using all B grade
Douglas fir veneers. Each billet consisted of 11 plies, and polyvinyl acetate adhesive was used to
bond veneers at room temperature. One-component PVA adhesive and the veneers were supplied by
Momentive R© Specialty Chemicals. The adhesive was spread on the veneers using a roll coater with
coverage of 250-300 g/m2. After stacking 11 layers, the billet was put in a hydraulic press at 2 MPa
(300 psi) at room temperature for about 1 hour. After pressing, the LVL billets were kept in a standard
conditioning room (20◦C, 65% RH) for about one week before further testing. These samples are
denoted DF/PVA LVL. Note that commercial LVL normally uses high-grade veneers on the surfaces and
low-grade veneers in the middle. For this work, however, it was important to have uniform grade veneer
throughout, especially for some experiments that propagated the crack through the center layers. Solid
wood specimens (for comparison) were cut from 2nd grade Douglas fir dimensioned lumber.
Crack propagation experiments were done using double cantilever beam (DCB) specimens (see
Fig. 1), which were cut from billets after they reached equilibrium and prior to moisture exposure. The
initial cracks were cut with a band saw. To avoid possible weak adhesion zones near the edges, the edges
of billets were marked before sawing and the initial specimen cracks were cut from the marked ends,
such that all cracks propagated away from the edges. Hence, the quality of the inner zone adhesion
3

RLTL
300
100
35
35
Figure 1: The top shows geometry of the DCB specimens, which were loaded by angle irons that fit into a slot on one edge. Thebottom shows TL and RL orientations for LVL fraction. The thin lines are glue lines between veneer layers in the LVL.
was tested. Dimensions of all DCB samples were 35± 2× 35± 2× 300± 5 mm3 and the initial, sawn
pre-crack was 100 mm.
Accelerated moisture exposure was carried out according to ASTM Standard D2559 [2012] but we
excluded the steam exposure step. Each cycle started by exposing the sampled to 85 kPa vacuum for
5 min followed by submersion in water in a pressure vessel at 517 kPa for 1 hour. After removal from
the pressure vessel, the samples were oven-dried at 65±2◦ C for 21-22 hours [ASTM Standard D2559,
2012]. These steps represented one moisture cycle. Samples were subjected to 4, 8, 12 and 16 of these
cycles. After these selected cycle numbers, samples to be tested were thoroughly dried at 103◦ C for 24
hours and then stored in the standard conditioning room to reach equilibrium. Details of the studied
materials and number of replicates are in Table 1.
4

Table 1: Test matrix with number of replicates for measuring R curves for DF/PVA LVL and for solid wood DF.
Treatment DF/PVA LVL Solid WoodControl (untreated) 10 5
4 cycles 7 38 cycles 7 5
12 cycles 7 516 cycles 7 5
2.2. Data Acquisition System
The load and displacement data during fracture tests were recorded using an Instron 5582 universal
testing machine. DCB fracture tests were conducted in opening mode under displacement control at
2 mm/min. The crack plane at the edge of each specimen was widened (see Fig. 1) and loading
was applied using angle irons inserted into the gap. Crack growth data were collected using the 3D
Digital Image Correlation (DIC) technique. For DIC data acquisition, two 50 mm Pentax lenses (stereo
system), attached to high speed Correlated Solutions R© cameras mounted on a tripod, were used to
capture images during the tests. Images acquired at 1 Hz. DIC is a technique to map strains by tracking
a small subset of pixels in deformed images [Bruck et al., 1989]. To facilitate the DIC analysis, a speckle
pattern was applied by painting the surface black and then spraying a random pattern of white dots.
Applying a proper speckle pattern is essential for good DIC analysis. Also, using an external light source
considerably improved test precision by reducing the subset size. Before conducting the test, the stereo
camera system was calibrated. No further adjustments of light condition, camera focus or position were
allowed after calibration. VIC 3D R© software analyzed the acquired images and mapped strains. The
tensile strain normal to the crack plane ahead of the crack tip was monitored throughout the loading.
The strain profiles were high near the crack tip and decreased as a function of distance away from
the crack tip [Matsumoto and Nairn, 2009]. Crack propagation was measured by observing shifts in
the position to reach 1% vertical strains between subsequent images. All DIC strain-position data were
exported to data sheets for further processing with Matlab. A Matlab script is written to populate crack
propagation data from DIC output based on the 1% strain criterion. The DIC approach did not precisely
measure the crack top location, but it accurately measured each crack growth increment. Fortunately,
the R curve analysis depends only on incremental crack growth and does not need the absolute crack
length.
5

2.3. Fracture Test and R-curve Construction
In materials that develop fracture process zones, such as fiber bridging in bone [Nalla et al., 2004]
or in wood [Wilson et al., 2013] and wood products [Matsumoto and Nairn, 2009], it is important to
monitor fracture toughness as a function of crack growth, which is known as the R curve. For fiber-
reinforced composites and by analogy for wood, energy methods are typically more useful than stress
intensity methods [Sinha et al., 2012]. For example, the stress intensity assessment by ASTM Stan-
dard E399 [2013] assumes crack propagation is self-similar implying a straight crack with traction-free
fracture surfaces — in other words, without an evolving fracture process zone as seen in wood. An al-
ternative to stress intensity methods is to directly measure released energy by experiments [Matsumoto
and Nairn, 2012]. Since energy methods do not depend on any assumed crack process, they can be
used for any material provided both energy and crack length are correctly measured and if the mea-
sured energy is correctly identified with fracture work and not some alternative mechanisms such as
crack-plane interference effects [Matsumoto and Nairn, 2009]. Crack-plane interference can be caused
by bridging fibers in the wake of crack propagation. Because these fibers can be damaged by unloading
phases commonly used in fracture testing, the R curve for wood and wood composites has to be mea-
sured by monotonically increasing loads with no unloading phases [Matsumoto and Nairn, 2009]. A
revised energy method was recently developed for direct R curve measurement. This method includes
four steps [Nairn, 2009]:
1. Measure force and crack length as a function of displacement.
2. Find the cumulative released energy per unit thickness by integrating the force, F(d), up to
some displacement point d and then assuming unloading from F(d), if it could be done without
interference, would return to the origin. This energy (per unit thickness) is:
U(d) =1
B
∫ d
0
F(x) d x −d
2F(d)
!
(1)
3. By treating U(d) and a(d) as parametric functions of displacement, the cumulative energy as a
function of crack length, U(a) can be plotted.
4. By energy analysis, R is the slope of U(a) or R = U ′(a). This slope calculation may benefit from
smoothing by spline fits or running-regression methods.
2.4. Wood and Wood Composite Fracture
Wood can be considered an orthotropic material with three perpendicular growth directions, namely,
longitudinal (L), tangential (T), and radial (R). Accounting for this anisotropy, six crack propagation
6

systems can be defined, i.e., TL, RL, LR, TR, RT and LT [Smith and Vasic, 2003]. The first letter stands
for the normal to crack plane while the second indicates the propagation direction. In the present
study, all fracture tests were either TL or RL crack propagation. For LVL specimens, T and L refer to
tangential and radial direction of the veneer layers; hence a TL crack spans all adhesive bond lines
while an RL crack would be along one bond line in the middle of the specimen (see Fig. 1). Our first
experiments looked at both RL and TL fracture. For solid wood, the TL R curve rises more the RL. In
LVL the differences are dramatic with much greater rise in R curve for TL compared to RL fracture.
The significantly higher TL R curves for LVL indicate more contribution of adhesive in this direction
compared to RL direction. In RL crack growth, the crack is along a single bond line or may deviate
into the veneer. Hence, it does not provide sensitive information on the adhesion quality. In contrast,
TL cracks span all adhesive bond lines in the specimen. Such cracks will always break bond lines and
veneers. For these reason, all crack propagation experiments reported here, for both LVL and solid
wood, were in the TL direction.
2.5. Statistical Analysis
Each moisture exposure condition was evaluated by replicate specimens. Each specimen gave an
R curve. Several approaches can average multiple R curves. One approach is to divide the crack
growth space into fixed-width boxes, collect all results that fall within each box, and then average those
results [Wilson et al., 2013]. Another approach is to determine a common range for the average curve
by performing interpolation/extrapolation on each curve to get new datasets with a common set of
crack length points, followed by averaging the corresponding interpolated toughness values. The latter
approach was used for all averaged curves in this paper. Standard deviation and coefficient of variation
of toughness were computed for each crack increment and plotted along with averaged R curves. For
additional statistical analysis, two-way ANOVA tests were carried out to account for the effect of crack
growth, accelerated aging, and their interaction on fracture toughness. Origin R© software was used for
the statistical analyses.
3. Results and Discussion
Individual specimen R curves in the TL direction for 10 control DF/PVA LVL samples made with
Douglas fir veneer are shown in Fig. 2. Initiation toughness was highly scattered and ranged from 40 to
400 J/m2 with an average of about 200 J/m2. The R curve for materials with fiber bridging is expected
7

Crack Growth (mm)
R (J
/m2 )
0 20 40 60 80 100 120 140 160 0
200
400
600
800
1000
1200
1400
1600
1800 **
*#
#
1
2
Figure 2: Fracture resistance curves (R curves) of 10 individual control DF/PVA LVL specimens. The dashed, bold curves are fourresults for specimen taken from a single billet. The labels (“‘”, “2”, “*”, and “#”) indicate specific result discussed in the text ofthe paper.
to increase as the fiber bridging zone develops. If that zone reaches a steady state, the toughness should
level off at a constant value [Sinha et al., 2012]. Figure 2 shows that all LVL R curves increased with
crack propagation but the increase started to slow down and level off at about 100-120 mm of crack
growth. While overall variation can be large, samples cut from a single billet (drawn with dashed, bold
lines and triangles) showed much less difference in their R curves then samples from different billets.
Because this study needed multiple billets to have enough specimens for all aging conditions, samples
cut within each billet were randomly assigned to the various treatment conditions. Some specimens
had a rapid rise in R near the end of the test (samples marker with “*”). These rises were attributed to
edge effects. The R value is determined from R = dU/da were U is energy area and a is crack length.
As the crack approaches the edge of the specimen, however, the crack slows down and da approaches
zero, which can cause R to become large and unreliable [Matsumoto and Nairn, 2012]. Two specimens
(samples marked with "#") decreased in toughness at long crack length, which could be due to material
heterogeneity such that toughness in those specimens happened to vary with crack length; in other
words the crack propagation in those specimen encountered a weaker region of the specimen.
We looked for several causes for variability in the R curves. Although density can be an important
source of variation for solid wood, the density of all tested LVL samples were similar (approximately
8

Figure 3: The crack propagation path for two control DF/PVA LVL specimens when tested in TL direction. The top path is forspecimen 1 and the bottom is for specimen 2; the R curves for these specimens are indicated in Fig. 2
0.62 g/cm3). The variability seen here was more likely caused by material heterogeneity and perhaps
sometimes by crack direction. In heterogeneous materials, the crack plane may deviate from the spec-
imen’s midplane causing mixed-mode fracture (mixed opening mode I and shear mode II). Because
mode II toughness is generally higher than mode I toughness, when a crack deviates to include mode II
character, the expectation is that the R curve will rise. The role of this phenomenon in the R curves of
solid wood was studied by Shir Mohammadi and Nairn [2014]. We observed similar crack deviations
in TL or RL LVL crack propagation. For example, Fig. 3 compares the crack paths of samples 1 and 2 (as
labeled in Fig. 2). The crack in sample 2 propagated fairly straight and it’s R curve leveled off at steady
state toughness of 750 J/m2. In contrast, the crack in sample 1 deviated from the midplane. Figure 2
shows that at 100 mm crack growth, the R curve for this sample increased to over 1400 J/m2. Part of
this increase was likely caused by the crack deviation.
To get average R curves, results of several specimens (such as in Fig. 2) were averaged as explained
in materials and methods. The averaging included all specimens and therefore averaged over billet-to-
billet variations and crack path deviations effects. Figure 4 plots the average R curve for control DF/PVA
LVL and compares it to average R curves for control solid wood and to both DF/PVA LVL and solid wood
after 16 wetting and drying cycles. The error bars indicate standard deviations. All R curves show
typical behavior where toughness increases as a function of crack length and the R curves approached a
steady state toughness at high crack growth. The wood curves stop at shorter total crack length because
9
Crack Growth (mm)
R (J
/m2 )
0 20 40 60 80 100 120 140 160 0
200
400
600
800
1000
1200
1400
DF/PVA LVL
Solid DF
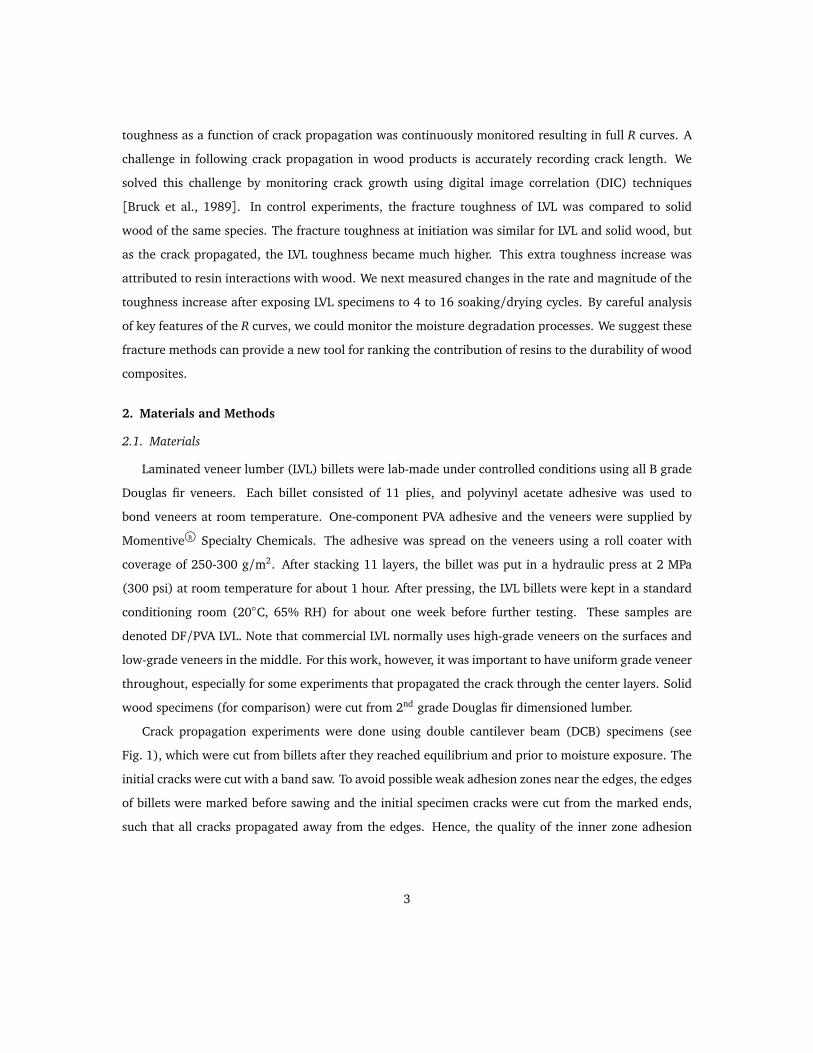
Figure 4: Fracture resistance curves (R curves) of DF/PVA LVL and solid wood (DF) for crack growth in the TL direction. The solidlines are control specimens and the dashed were exposed to 16 cycles. The error bars are standard deviations of the averagedcurves.
some samples broke after about 100 mm of crack growth. Because our averaging did not extrapolate
outside recorded data ranges, the averaging had to be limited to that lowest amount of crack growth.
Comparing control to aged specimens, both DF/PVA LVL and solid wood showed significant decreases
in toughness after 16 exposure cycles with the difference being larger than the standard deviations.
Comparing DF/PVA LVL to solid wood, the toughness increment with crack growth in both control and
aged solid wood is much smaller then the LVL results. For control specimen, both DF/PVA LVL and
solid wood start at about 200 J/m2 but DF/PVA LVL rises to about 1000 J/m2 while solid wood rises
only to 300 J/m2 at 140 mm of crack growth without reaching a steady state toughness. This result
corroborates a previous study on the R curve of Douglas fir [Wilson et al., 2013]. Similarly for samples
aged for 16 cycles, both DF/PVA LVL and solid wood start at about 100 J/m2 but DF/PVA LVL rises to
about 650 J/m2 while solid wood rises only to 150 J/m2 at 100 mm of crack growth without reaching
a steady state toughness.
Figure 4 has important results for understanding the role of resin in LVL toughness and for under-
standing the best methods for using R curves to evaluate the role of the resin in moisture durability.
Interestingly, the initiation toughness of solid wood is almost the same as the initiation toughness of LVL
exposed to the same number of treatment cycles. In other words, initiation of LVL cracking is mostly a
10

Figure 5: The fracture surface solid DF wood (top) and for DF/PVA LVL (bottom).
property of the wood in the LVL and not much affected by the resin. Any testing method to evaluate
resins that relies on initiation properties (e.g., onset of cracking) will likely be a poor predictor of resin
quality. Because the crack initiation was observed to correspond closely to the peak load in the force
displacement curves, any testing method that relies on maximum stress (i.e., standard strength tests)
will likely also be a poor predictor of resin quality. Instead, tests to evaluate resins should ignore the
initiation phase and focus instead on the increment in toughness or on the rate of toughness increase.
Figure 4 shows these properties to be vastly different in LVL then in solid wood. Because a rising R curve
in wood is associated with fiber bridging, these data show that the resin in LVL has a large impact on
fiber bridging; Fig. 5 visually shows more fiber bridging in LVL than in solid wood. The magnitude of the
rise is associated with the toughness of the bridging fibers while the rate of the rise is associated with
cohesive stress those bridging fibers can carry [Nairn, 2009]. Both the toughness and cohesive stress of
bridging fibers increased due to resin effects. Any test to evaluate resin quality based on fracture tests
should be based on these properties from the rising phase of R curves.
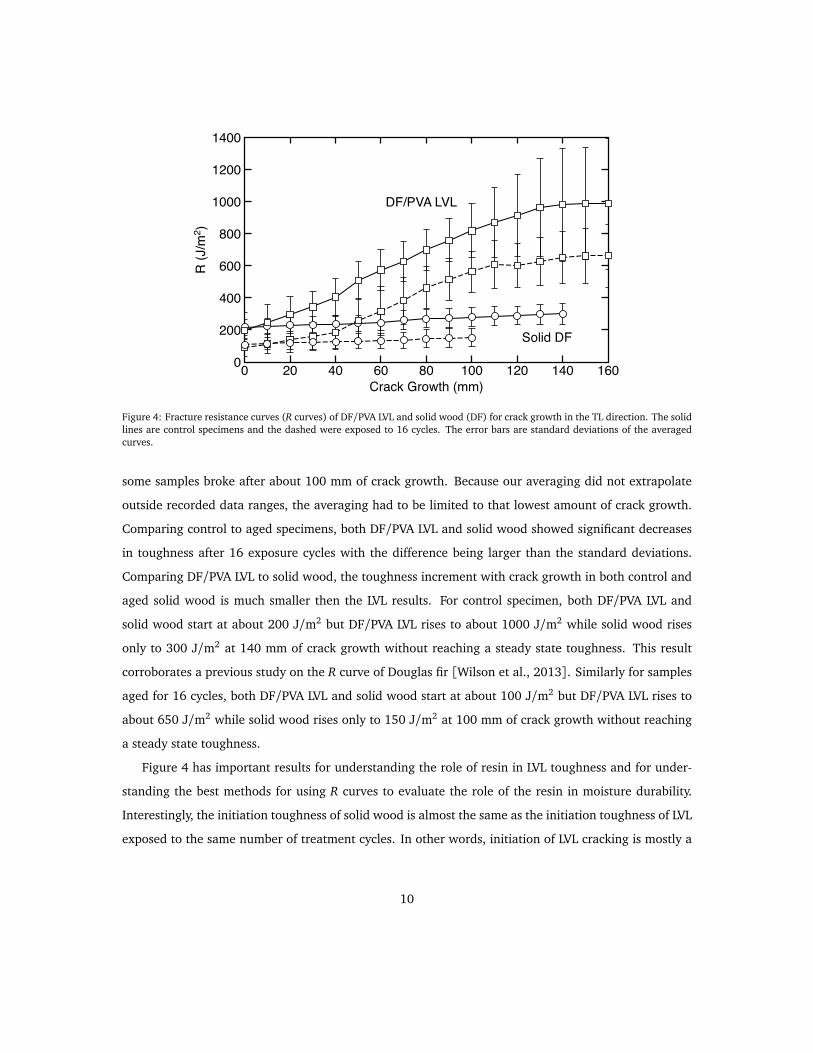
Figure 6 shows the changes in fracture resistance of DF/PVA LVL as a function of the number of
cycles of exposure from 0 to 16. Each curve was averaged as explained in materials and methods using
7-10 replicates. The error bars give the standard deviations of the interpolated points. All DF/PVA LVL
R curves increased with crack growth and generally trended to lower toughness as the number of cycles
increased. The toughness showed a significant drop between control and 4 cycles, but then remained
nearly constant from 4 and 12 cycles. Continuing to 16 cycles, however, resulted in another significant
11
Crack Growth (mm)
R (J
/m2 )
0 20 40 60 80 100 120 140 160 0
200
400
600
800
1000
1200
1400
Control
412
8
16
Figure 6: Degradation of fracture resistance (R curves) of DF/PVA LVL as a function of the number of cycles (Control, 12, and 16are solid lines, 4 is a dotted line, and 8 is a dashed line). The error bars are standard deviations of the averaged curves.
drop in toughness.
The onset of a steady state toughness was most clearly observed in the R curves for control, 4 cycle,
and 16 cycle samples. The other two R curves (8 cycle and 12 cycle samples) started to approach steady
state at 120 mm of crack growth, but then started to increase again at 160 mm of crack growth. As
mentioned above, this increase was likely an artifact due to edge effects. The fiber-bridging zone length
can be determined from the amount of crack propagation required for the rising toughness to start
leveling off. These data indicate the bridging zone for control specimen is about 130 mm and drops
slightly with aging to close to 100 mm for 16 cycle samples. Besides bridging length, the steady state
toughness for control and 16 cycled samples dropped from about 980 J/m2 to 650 J/m2, respectively.
The bridging toughness (GB), or the toughness associated with the fiber bridging mechanisms, is found
by subtracting initiation toughness from the plateau toughness. Therefore, GB of DF/PVA LVL for control
samples was about 780 J/m2 and GB dropped to about 560 J/m2 after 16 wetting and drying cycles.
Similarly, one could determine in situ resin toughness (or the incremental toughness associated with the
PVA resin) by subtracting the entire solid wood R curve from the LVL R curves. In this calculation, the in
situ resin toughness for control specimens starts at zero and plateaus at about 680 J/m2 while the in situ
resin toughness after 16 cycles rises from zero to about 510 J/m2. These results are clearly not equal
to PVA toughness. First, they depend on crack length. Second, they differ from the reported toughness
12

for PVA of about 200 J/m2 [Khan et al., 2013]. In other words, the LVL toughness is not simply the
summation of the toughness of its components. Rather, the rising R curve is caused by a complex
interaction between wood and resin that leads to a significant change in fiber bridging occurring in
LVL specimens compared to the fiber bridging of solid wood. Some interactions could be how the resin
reinforces bridging fibers, how it affects their strength, or how it affects the way the fibers pull out of
the fracture surfaces. Whatever the mechanism, the resin/wood interactions have a large effect on fiber
bridging and therefore evaluation of resin quality should focus on the fiber bridging results that depend
on the rising portion of R curves.
Figure 7 shows the changes in fracture resistance of solid wood DF as a function of the number of
exposure cycles from 0 to 16. Each curve is an average of 3 to 5 replicates. The increased heterogeneity
of solid wood (compared to LVL) can affect toughness. For example, toughness rises when a knot is
located at the pre-cracked tip and then suddenly drops as the crack propagates past the knot (not shown
here). To avoid such effects, we selected clear regions of the lumber samples for the fracture tests. The
aging trends are remarkably similar to the trends in LVL samples. Specifically, we observed a significant
drop between control and 4 cycles, very little change between 4 and 12 cycles, and then perhaps a
drop (albeit a smaller drop compared to LVL) between 12 and 16 cycles. The initiation toughness of
solid wood as a function of the number of cycles was very close to the corresponding toughness in LVL.
Compared to LVL, the solid wood R curves had much lower slope in the rising portion of the R curves.
Linear fits to the rising portion of solid wood R curves varied between 0.4 and 0.7 kPa, which is an
order of magnitude smaller than the corresponding slopes for LVL. Note that the slope of an R curve
has units of stress and is related (by a specimen-dependent conversion process) to the cohesive stress
carried by the bridging fibers [Nairn, 2009]. Hence, bridging zones in LVL samples carried about an
order of magnitude higher stress then bridging zones in solid wood samples.
A two-way ANOVA test was carried out to consider the effects of crack propagation, number of
cycles, and their interaction on the fracture toughness of LVL and solid wood. The effect of crack
length on toughness was statistically significant (p < 0.01), and toughness increased as function of
crack growth (as clearly displayed in all R curves). Hence, crack propagation should be considered
when studying the fracture toughness of wood-based materials with fiber bridging zones. This result
is true even for solid wood with relatively little fiber bridging capacity. The effect of number of cycles
on toughness was also significant (p < 0.01), but there is no significant interaction between number of
cycles and crack propagation.
13

Crack Growth (mm)
R (J
/m2 )
0 20 40 60 80 100 120 140 50
100
150
200
250
300
350
400
Control
1284
16
Figure 7: Degradation of fracture resistance (R curves) of solid wood DF as a function of the number of cycles (Control, 12, and16 are solid lines, 4 is a dotted line, and 8 is a dashed line). The error bars are standard deviations of the averaged curves.
The statistical analysis lumped all results together; perhaps more careful data selection would result
in better comparisons. The coefficient of variation (COV) of the DF/PVA LVL toughness as a function of
number of cycles for different extents of crack growth are shown in Fig. 8. The initiation toughness (0
mm) had the highest COV, again indicating that initiation toughness is a poor property for characterizing
fracture properties. As the amount of crack growth increased the COV dropped and reached a minimum
for 80 mm of crack growth. This drop can be seen graphically in Fig. 6. The magnitudes of the standard
deviation error bars were fairly constant for the first 100 mm of crack growth. Because the standard
deviation remained constant while the mean increased, the COV decreased. For longer crack growths
(120 and 160 mm), the COV increased again. This effect is also seen graphically in Fig. 6 by the
increased standard deviations for high crack growth. The larger deviations at high crack growth were
caused by mixture of specimen heterogeneity (e.g., reaching steady state at different amounts of crack
growth) and edge effects seen in some specimens.
With the goal of defining to a simpler quantity for analysis, we focused on results after some amount
of crack propagation rather than attempt to use the entire R curve. According to our statistical analyses
for both LVL and solid wood, toughness significantly increased as a function of crack growth and was
significantly degraded by moisture cycling. The observation of no significant interaction between crack
growth and cycles implies that the effect of aging does not depend on crack length. In principle,
14

Number of Cycles
CO
V (%
)
0 4 8 12 16 0
10
20
30
40
50
60
70
40 mm
80 mm
120 mm
0 mm160 mm
Figure 8: The coefficient of variation (COV) of DF/PVA LVL toughness as a function of the number of cycles at different amountsof crack growth.
therefore, the effect of aging on fracture toughness can investigated at any amount of crack growth.
One approach we tried was to focus on the results at the crack length that had the smallest COV. Based
on results in Fig. 8, the preferred crack length for characterization of DF/PVA LVL is 80 mm of crack
growth. This crack growth level had the minimum COV. It also had the maximum amount of crack
growth prior to the onset of higher statistical variations at higher crack growth. It is thus sensitive to
the increases in the R curve while being minimally affected by edge effects. In other words, initiation
toughness is not the best criterion to study the fracture toughness of wood based materials and artifacts
such as edge effects make R curves near the end of the sample unreliable. In contrast, evaluating
toughness in the middle of the rising R curve has potential.
A similar analysis of solid wood R curves suggested that 50 mm of crack growth was the optimal
amount of crack growth for characterization. Compared to LVL, the solid wood COV’s were less sensitive
to the amount of crack growth except at very high crack growth where they increased analogous with
LVL results. We choose 50 mm of crack growth because it had low COV and also included some amount
of the rising R curve. Comparing the toughness COV of LVL and solid wood revealed the toughness COV
of untreated solid wood was about 20% throughout fracture process, which is generally smaller than
15

Treatment (cycles)
Prop
erty
Ret
entio
n (%
)
-2 0 2 4 6 8 10 12 14 16 18 20 20 30 40 50 60 70 80 90
100 110 120 130
LVL @ 80 mm
R Curve Slope
Solid Wood @ 50 mm
Figure 9: The fracture toughness of DF/PVA LVL and solid wood as percent of control value and as determined at a specificamount of crack growth (at 80 mm for LVL and at 50 mm for solid wood). The “R Curve Slope” is slope of the R curve over thefirst 100 mm of crack growth as percent of the slope in the control samples.
that of the LVL. In some properties, such as strength and modulus, solid wood generally has a higher
COV than the LVL of the same species [Erdil et al., 2009], which is due to homogenization of defects in
LVL compared to solid wood. This higher COV, however, may not be true for toughness. Ardalany et al.
[2012] report a larger COV for the Gini t of LVL than for solid wood. Fruhmann et al. [2002] report a
high COV of 25-70% for Gini t of LVL in mode I testing.
Using the amounts of crack growth identified above, Fig. 9 plots toughness retention for both
DF/PVA LVL and solid wood as a function of number of exposure cycles. The retention percent is
defined as: (property after treatment/property for control samples)*100. For both DF/PVA LVA and
solid wood, the toughness at 80 mm crack growth (for LVL) or 50 mm crack growth (for solid wood)
indicates a near continuous decrease. As shown in Figs. 6 and 7, both materials dropped from 0 to 4
cycles, remained relatively constant between 4 and 12 cycles, and then dropped again between 12 and
16 cycles. Although solid wood dropped faster than LVL, the toughness in LVL is higher and includes
drops in fiber bridging toughness as well as in the solid wood component. In other words, the LVL re-
tention plot is characterizing resin effects in the moisture durability of DF/PVA LVL. Such experiments,
if applied to composites with other resins, can be used to compare and rank those resins for their ability
to make durable wood composite materials.
16

Beside toughness associated with fiber bridging, fiber-bridging effects can also be characterized by
the rate of rise of the R curve. Figure 9 also plots the slope of the DF/PVA LVL R curves as determined
by linear fits over the first 100 mm of crack growth and plotted as percent of the slope in the control
specimen. This slope is a function of the critical cohesive stress in the bridging fibers [Nairn and
Matsumoto, 2009]. The retention plot indicates a loss in the strength of those fibers with moisture
conditioning. The slope retention parallels the toughness retention. In other words, both the slope
of R curves and the magnitude of the increment over initiation toughness are good candidates for
characterizing the role of resin on the moisture durability of wood composites.
4. Conclusions
The fracture resistance, or R curve, of LVL can be measured and the results are significantly different
from the R curves for solid wood made out of the same species as the veneer in the LVL. Furthermore,
the differences are only apparent during crack propagation. The initiation toughness for LVL and solid
wood are very close, but the R curves rise much more for LVL than for solid wood. Because a rising R
curve can be attributed to fiber bridging, the conclusion is that resin and resin/wood interaction plays
a significant role in the strength and toughness of the fibers that bridge the crack surface.
Here we proposed to use the large resin affect on R curves to quantify the role of resin in the
moisture durability of LVL. The method works, but it was essential to focus on either the increment in
toughness over initiation toughness or the rate of rise of the R curves. The observation that initiation
toughness for LVL and solid wood are nearly the same suggests that any test protocol based on onset of
cracking or peak force in strength tests should be expected to be very poor tests for quantifying resin
effects in wood composite durability. The experiments here were for a single PVA resin. Future work
will compare the moisture durability for LVL made from various resins. The importance of fiber bridging
effects on the toughness of wood composites recommends future work aimed at modeling crack growth
with bridging fibers. Applying such modeling to crack growth in wood composites may help quantify
resin effects further.
Acknowledgements
Financial support was provided by the National Science Foundation Industry/University Coopera-
tive Research Center for Wood-Based Composites, Award No. IIP-1034975. We thank Momentive R©
Specialty Chemicals for supply all resins and veneer materials.
17

References
Ardalany, M., Deam, B., Fragiacomo, M., 2012. Experimental results of fracture energy and fracture
toughness of radiata pine laminated veneer lumber (LVL) in mode I (opening). Materials and Struc-
tures 45, 1189–1205.
ASTM Standard D2559, 2012. Standard specification for adhesives for bonded structural wood products
for use under exterior exposure conditions. ASTM International, West Conshohocken, PA.
ASTM Standard E399, 2013. Standard test method for linear-elastic plane-strain fracture toughness kic
of metallic materials. ASTM International, West Conshohocken, PA.
Bruck, H. A., McNeill, S. R., Sutton, M. A., Peters, W. H. I., 1989. Digital image correlation using
Newton-Raphson method of partial differential correction. Experimental Mechanics 28 (261–267).
Erdil, Y. Z., Kasal, A., Zhang, J. L., Efe, H., Dizel, T., 2009. Comparison of mechanical properties of solid
wood and laminated veneer lumber fabricated from turkish beech, scotch pine, and lombardy poplar.
Forest Products Journal 59, 55–60.
Fruhmann, K., Tschegg, E. K., Dai, C., Stanzl-Tschegg, S. . E., 2002. Fracture behaviour of laminated
veneer lumber under mode i and iii loading. Wood Science and Technology 36, 319–334.
Khan, U., May, P., Porwal, H., Mawaz, K., Colman, J. N., 2013. Improved adhesive strength and tough-
ness of polyvinyl acetate glue on addition of small quantities of graphene. Applied Materials and
Interfaces 5, 1423âLŠ1428.
Matsumoto, N., Nairn, J. A., 2009. The fracture toughness of medium density fiberboard (MDF) includ-
ing the effects of fiber bridging and crack-plane interference. Eng. Fract. Mech. 78, 2748–2757.
Matsumoto, N., Nairn, J. A., 2012. Fracture toughness of wood and wood composites during crack
propagation. Wood and Fiber Science 44 (2), 121–133.
Nairn, J. A., 2009. Analytical and numerical modeling of r curves for cracks with bridging zones. Int. J.
Fract. 155, 167–181.
Nairn, J. A., Matsumoto, N., 2009. Fracture modeling of crack propagation in wood and wood compos-
ites. In: 12th International Conference on Fracture, Ottawa, Canada, July 12-17.
18

Nalla, R., Kruzic, J., Ritchie, R., 2004. On the origin of the toughness of mineralized tissue: microcrack-
ing or crack bridging? Bone 34 (5), 790–798.
Shir Mohammadi, M., Nairn, J. A., 2014. Crack propagation and fracture toughness of solid balsa used
for cores of sandwich composites. Journal of Sandwich Structures and Materials 16 (1), 22–41.
Sinha, A., Nairn, J. A., Gupta, R., 2012. The effect of elevated temperature exposure on the fracture
toughness of solid wood and structural wood composites. Wood Science & Technology 44, 1127–
1149.
Smith, I., Vasic, S., 2003. Fracture behaviour of softwood. Mechanics of Materials 35 (8), 803–815.
URL http://dx.doi.org/10.1016/S0167-6636(02)00208-9
Stanzl-Tchegg, S. E., Navi, P., 2009. Fracture behaviour of wood and its composites. a review cost action
e35 2004–2008: Wood machining – micromechanics and fracture. Holzforschung 68 (139–149).
Wilson, E., Mohammadi, M. S., Nairn, J. A., 2013. Crack propagation fracture toughness of several
wood species. Advances in Civil Engineering Materials 2 (1).
19


![Determination of fracture toughness using the area of micro-crack … · 2017. 8. 27. · tip of the indented section [14]; whereas in the second (half-penny) model, the crack length](https://static.fdocuments.in/doc/165x107/60e00f9e9b39906d7619172c/determination-of-fracture-toughness-using-the-area-of-micro-crack-2017-8-27.jpg)