Crack propagation and fracture toughness of Ti6Al4V alloy ...
33
Accepted Manuscript Title: Crack propagation and fracture toughness of Ti6Al4 V alloy produced by selective laser melting Author: V. Cain L. Thijs J. Van Humbeeck B. Van Hooreweder R. Knutsen PII: S2214-8604(14)00030-X DOI: http://dx.doi.org/doi:10.1016/j.addma.2014.12.006 Reference: ADDMA 23 To appear in: Received date: 25-7-2014 Revised date: 27-11-2014 Accepted date: 12-12-2014 Please cite this article as: Cain V, Thijs L, Van Humbeeck J, Van Hooreweder B, Knutsen R, Crack propagation and fracture toughness of Ti6Al4<ce:hsp sp= ¨ 0.25 ¨ />V alloy produced by selective laser melting, Addit Manuf (2014), http://dx.doi.org/10.1016/j.addma.2014.12.006 This is a PDF file of an unedited manuscript that has been accepted for publication. As a service to our customers we are providing this early version of the manuscript. The manuscript will undergo copyediting, typesetting, and review of the resulting proof before it is published in its final form. Please note that during the production process errors may be discovered which could affect the content, and all legal disclaimers that apply to the journal pertain.
Transcript of Crack propagation and fracture toughness of Ti6Al4V alloy ...
Accepted Manuscript
Title: Crack propagation and fracture toughness of Ti6Al4 Valloy produced by selective laser melting
Author: V. Cain L. Thijs J. Van Humbeeck B. VanHooreweder R. Knutsen
PII: S2214-8604(14)00030-XDOI: http://dx.doi.org/doi:10.1016/j.addma.2014.12.006Reference: ADDMA 23
To appear in:
Received date: 25-7-2014Revised date: 27-11-2014Accepted date: 12-12-2014
Please cite this article as: Cain V, Thijs L, Van Humbeeck J, Van HoorewederB, Knutsen R, Crack propagation and fracture toughness of Ti6Al4<ce:hspsp=0̈.25/̈>V alloy produced by selective laser melting, Addit Manuf (2014),http://dx.doi.org/10.1016/j.addma.2014.12.006
This is a PDF file of an unedited manuscript that has been accepted for publication.As a service to our customers we are providing this early version of the manuscript.The manuscript will undergo copyediting, typesetting, and review of the resulting proofbefore it is published in its final form. Please note that during the production processerrors may be discovered which could affect the content, and all legal disclaimers thatapply to the journal pertain.
Page 1 of 32
Accep
ted
Man
uscr
ipt
1 2 3 4 5 6 7 8 9 10 11 12 13 14 15 16 17 18 19 20 21 22 23 24 25 26 27 28 29 30 31 32 33 34 35 36 37 38 39 40 41 42 43 44 45 46 47 48 49 50 51 52 53 54 55 56 57 58 59 60 61 62 63 64 65
1
Crack propagation and fracture toughness of Ti6Al4V alloy produced
by selective laser melting
V Caina,b
, L Thijsc, J Van Humbeeck
c, B Van Hooreweder
d and R Knutsen
a
aCentre for Materials Engineering, Department of Mechanical Engineering, University
of Cape Town, South Africa
bDepartment of Mechanical Engineering, Cape Peninsula University of Technology,
South Africa
cDepartment of Metallurgy and Materials Engineering, KU Leuven, Kasteelpark
Arenberg 44, B-3001 Leuven, Belgium
d Department of Mechanical Engineering, KU Leuven, Celestijnenlaan 300b, B-3001
Leuven, Belgium
Corresponding author; V.Cain
E-mail: [email protected]
Ph: +2721 650 3173
Abstract
The fracture toughness (K1c) and fatigue crack growth rate (FCGR) properties of
selective laser melted (SLM) specimens produced from grade 5 Ti6Al4V powder metal
has been investigated. Three specimen orientations relative to the build direction as
well as two different post-build heat treatments were considered. Specimens and test
procedures were designed in accordance with ASTM E399 and ASTM E647 standard.
The results show that there is a strong influence of post-build processing (heat treated
versus ‘as built’) as well as specimen orientation on the dynamic behaviour of SLM
*Manuscript
Page 2 of 32
Accep
ted
Man
uscr
ipt
1 2 3 4 5 6 7 8 9 10 11 12 13 14 15 16 17 18 19 20 21 22 23 24 25 26 27 28 29 30 31 32 33 34 35 36 37 38 39 40 41 42 43 44 45 46 47 48 49 50 51 52 53 54 55 56 57 58 59 60 61 62 63 64 65
2
produced Ti6Al4V. The greatest improvement in properties after heat treatment was
demonstrated when the fracture plane is perpendicular to the SLM build direction. This
behaviour is attributed to the higher anticipated influence of tensile residual stress for
this orientation. The transformation of the initial rapidly solidified microstructure during
heat treatment has a smaller beneficial effect on improving mechanical properties.
Keywords: Selective laser melting, Ti6Al4V, fracture toughness, fatigue crack growth
rate, microstructure
1. Introduction
Selective laser melting is an additive fabrication process in which successive layers of
powder are selectively melted by the interaction of a high energy density laser beam.
Molten and re-solidified material forms parts, while non-melted powder remains in
place to support the structure [1]. This layer-wise production technique offers some
advantages over conventional manufacturing techniques such as high geometrical
freedom, short design and manufacturing cycle time and made-to-order components.
Layer-wise production techniques have evolved rapidly in the last 10 years and SLM
has changed from a rapid prototyping to an additive manufacturing technique.
Consequently, the static and dynamic material properties must be sufficient to meet in
service loading and operational requirements. It is well known that the SLM process is
characterized by high temperature gradients leading to rapidly solidified, non-
equilibrium microstructures [2]. High localised thermal gradients and very short
interaction times, which leads to rapid volume changes, causes substantial residual
Page 3 of 32
Accep
ted
Man
uscr
ipt
1 2 3 4 5 6 7 8 9 10 11 12 13 14 15 16 17 18 19 20 21 22 23 24 25 26 27 28 29 30 31 32 33 34 35 36 37 38 39 40 41 42 43 44 45 46 47 48 49 50 51 52 53 54 55 56 57 58 59 60 61 62 63 64 65
3
stress development. Furthermore, the option of changing the process parameters can
have a strong influence on the microstructure, density and surface quality. As a result,
the mechanical properties of SLM parts can differ substantially from one another and
from those produced by conventional techniques. In this respect it is recognised that the
advantages of SLM can only be realised when the mechanical behaviour of the final
products is at least able to be matched to conventionally produced components of the
same material.
In recent years, much research has focused on optimising the SLM process. Kruth et al.
[3] concentrated on studying the SLM part and material properties specifications in
order to improve the quality of the resulting products. In another study Yasa et al. [4]
focused on how the mechanical properties obtained with SLM may differ from the ones
of bulk material. At present, Ti-alloys can be processed with high repeatability and
hence low variation in material density and mechanical properties. Vilaro et al. [5]
studied the effect of applying specific heat treatments to SLM produced Ti6Al4V in
order to produce a preferred final microstructure. Furthermore Thijs et al. [2]
concentrated on the effects on density that varying scanning parameters and scanning
strategies could have. Moreover, quasi-static material properties such as tensile strength,
hardness, and impact toughness have been well characterised [3] and are reported to
match those of conventional wrought materials. On the other hand, substantial
complexities arise when attempting to characterise the dynamic mechanical behaviour
since crack initiation and propagation is critically sensitive to the interaction between
fracture path, orientation, microstructure and loading conditions. In addition, residual
stresses which arise as a result of the rapid localised temperature fluctuations during the
Page 4 of 32
Accep
ted
Man
uscr
ipt
1 2 3 4 5 6 7 8 9 10 11 12 13 14 15 16 17 18 19 20 21 22 23 24 25 26 27 28 29 30 31 32 33 34 35 36 37 38 39 40 41 42 43 44 45 46 47 48 49 50 51 52 53 54 55 56 57 58 59 60 61 62 63 64 65
4
SLM process strongly influence crack initiation and growth. A previous study has
shown that these residual stresses have detrimental effects on the mechanical behaviour
of SLM parts [6]. The knowledge of these properties and the underlying failure
mechanisms remains limited, and consequently there is insufficient confidence in being
able to predict fatigue life. Nevertheless, a few studies have reported the potential for
SLM parts to meet the fatigue life requirements. In a study by Van Hooreweder et al.
[1], nearly fully dense (>99%) SLM-Ti6Al4V specimens were produced with fracture
toughness and fatigue crack growth properties similar to those of mill annealed vacuum
arc remelted (VAR) Ti6Al4V parts. More recently, a study by Leuders et al. [7]
investigated the influence of two building orientations and three post-build treatments.
The post-build annealing treatments were performed at 800° and 1050°C (for 2 hours)
and a hot isostatic pressing (HIP) process was performed at 920°C at a pressure of 1000
bar for 2 hours. All specimens were furnace cooled. Although residual porosity was
noted to assist crack growth, residual stresses and their subsequent elimination proved
to have a substantial influence on fatigue properties. The post-build annealing
treatments in the range 800°-1050°C not only relieve residual stress, but also modify the
as-built rapidly solidified microstructure which comprises of fine acicular martensite
(’ phase). The latter microstructure is highly directional as a result of the imposed
solidification mode during the vertical layer by layer build process. The purpose of the
annealing treatment is to generate the preferred lamellar + equilibrium structure
which provides a more desirable combination of strength and toughness. However, it is
important that the annealing treatment does not result in excessive grain growth as was
reported by Vrancken et al. [8] when heat treating above the transus temperature and
Leuders et al. [7] for the annealing treatment at 1050°C.
Page 5 of 32
Accep
ted
Man
uscr
ipt
1 2 3 4 5 6 7 8 9 10 11 12 13 14 15 16 17 18 19 20 21 22 23 24 25 26 27 28 29 30 31 32 33 34 35 36 37 38 39 40 41 42 43 44 45 46 47 48 49 50 51 52 53 54 55 56 57 58 59 60 61 62 63 64 65
5
The present work considers different post-SLM processing heat treatment compared to
those studied by Leuders et al. [7] and introduces a third building orientation in order to
more comprehensively evaluate the influence of anisotropy on mechanical properties.
Post-SLM processing heat treatment is directed at reducing residual stress and
transforming the as-built martensitic microstructure. In this regard, stress relief heat
treatment has been performed at 650°C whereas for the annealing heat treatment,
specimens were soaked at 890°C. The maximum annealing heat treatment temperature
does not exceed the -transus temperature as advised in the work of Vrancken et al. [8].
Furthermore only material with >99% density has been evaluated. The mechanical
properties, including tensile, fracture toughness and fatigue crack growth rate
measurements, were determined for the as-built (AB), stress relieved (SR) and annealed
(HT) conditions.
2. Materials and Methods
2.1 Materials
Standard tensile and compact-tension (CT) specimens were manufactured from grade 5
Ti6Al4V spherical powder for the determination of tensile, fracture toughness (K1c) and
fatigue crack growth rate (FCGR) properties. The powder particle size ranged between
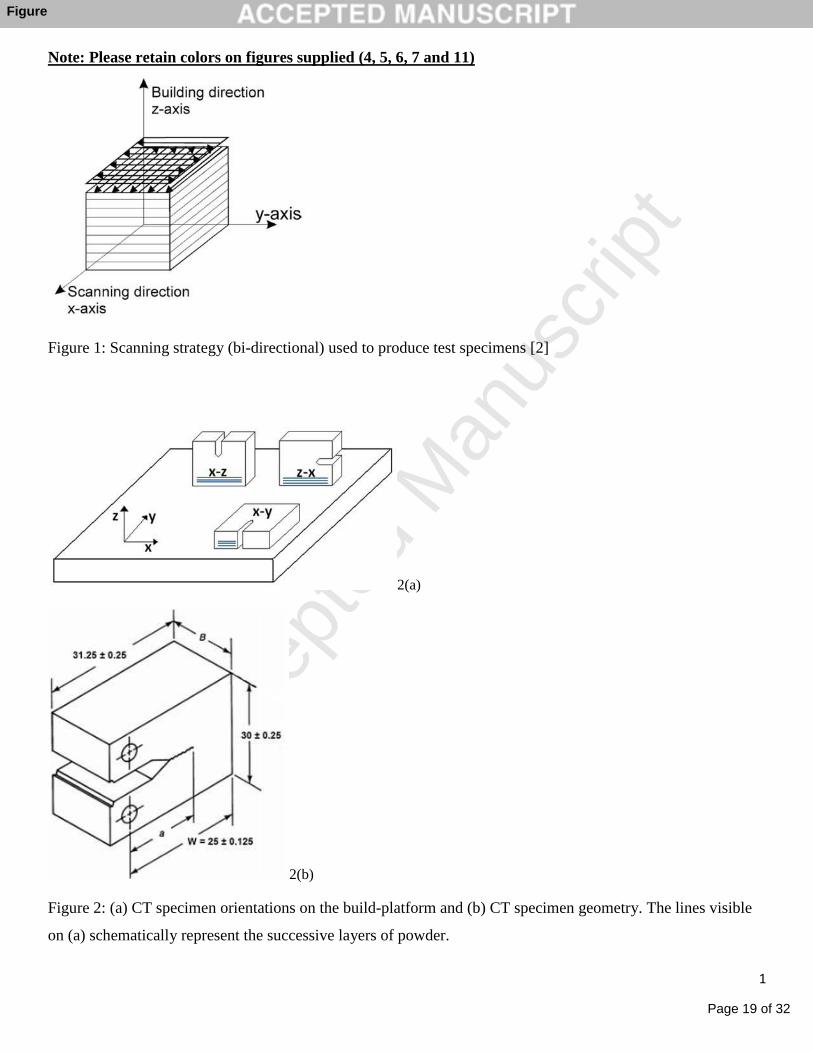
15μm and 45μm. Figure 1 designates the bi-directional scanning strategy (x-y plane)
and the Z-axis building direction that was used to produce all specimens via the SLM
process. After scanning the perimeter, the first layer is scanned in zigzag formation and
each scanning direction for the successive layer is rotated by 90°.
Page 6 of 32
Accep
ted
Man
uscr
ipt
1 2 3 4 5 6 7 8 9 10 11 12 13 14 15 16 17 18 19 20 21 22 23 24 25 26 27 28 29 30 31 32 33 34 35 36 37 38 39 40 41 42 43 44 45 46 47 48 49 50 51 52 53 54 55 56 57 58 59 60 61 62 63 64 65
6
The full set of tensile specimens and the CT specimens were manufactured respectively
in one build-platform to avoid potential variances associated with powder quality. The
orientation of the CT specimens on the build-platform, as well as their geometry, is
shown in Figure 2 (a, b).
For the determination of K1c, the thickness of the sample, B is equal to 12.5 mm, whilst
FCGR specimens have a thickness B equal to 6.25 mm. Other than this difference in B
value, specimens have the same geometry. The crack length is specified as a. The
dimensions of the test specimens are similar to the ones applied in a previous study by
Van Hooreweder et al. [1]. The CT specimens in Figure 2(a) are labelled according to
ASTM E399 standard: axis direction perpendicular to the notch plane followed by the
axis direction in which the crack is expected to propagate. Consequently, three different
specimen geometries arise, namely XZ, ZX and XY. The XZ and ZX specimens were
built individually on the platform whereas for the XY specimens a continuous block
extending in the Z direction was produced from which the individual specimens were
later sliced by electric discharge machining (EDM). In all cases the specimens were
slightly oversized and were machined to final dimensions prior to mechanical testing.
The crack notch was machined by EDM. The machined surface roughness (Ra) was
measured using an optical profilometer and in all cases the Ra values conformed to the
ASTM E399 and ASTM E647 standards. The density was measured for all the
specimens using the Archimedes method which indicated > 99% density in all cases.
The SLM build approach for the tensile specimens was the same as the CT specimens
and the two test orientations are indicated in Figure 3. Similar density to the CT
specimens was recorded.
Page 7 of 32
Accep
ted
Man
uscr
ipt
1 2 3 4 5 6 7 8 9 10 11 12 13 14 15 16 17 18 19 20 21 22 23 24 25 26 27 28 29 30 31 32 33 34 35 36 37 38 39 40 41 42 43 44 45 46 47 48 49 50 51 52 53 54 55 56 57 58 59 60 61 62 63 64 65
7
2.2 Heat treatment
In the case where heat treatment was applied to the as-built specimens, two different
processes were considered. For the stress relief (SR) treatment, specimens were soaked
at 650 ˚C for 4 hours. The annealing treatment was performed at 890 ˚C for 2 hours and
was based on the work by Vrancken et al. [8]. All heat treatments were carried out in a
horizontal tube furnace under a protective argon atmosphere and specimens were
furnace cooled. Heat treatments were performed prior to final machining.
2.3 Mechanical testing
Tensile testing, fracture toughness (K1c) and FCGR measurements were performed for
the respective AB, SR and HT conditions and three specimens were evaluated for each
test variable. Tensile tests were performed according to ASTM E8/E 8M standard. The
growth of pre-cracks and the measurement of FCGR was performed on a 160 kN
Schenk servo-hydraulic machine. For the preparation of pre-cracks, a 7 mm long pre-
crack was developed at the notch root by fully reversed cyclic loading at 7 Hz. The
crack length was monitored visually using a camera system. After pre-crack
development, fracture toughness was measured in tension at a displacement speed of 1
mm/min until failure of the specimen occurred. The fracture toughness test conditions
adhered to the ASTM E399 standard. Pre-crack lengths were confirmed after fracture
using a Mitutoyo non-contact precision optical measuring system.
Page 8 of 32
Accep
ted
Man
uscr
ipt
1 2 3 4 5 6 7 8 9 10 11 12 13 14 15 16 17 18 19 20 21 22 23 24 25 26 27 28 29 30 31 32 33 34 35 36 37 38 39 40 41 42 43 44 45 46 47 48 49 50 51 52 53 54 55 56 57 58 59 60 61 62 63 64 65
8
Fatigue crack growth rate (FCGR) experiments were carried out according to the ASTM
E647 standard. Prior to commencing the FCGR evaluation, a 1mm long pre-crack was
developed at the notch root by fully reversed cyclic loading at 5 Hz. The actual FCGR
was determined using a cyclic load in tension (R = 0.1) with a fixed amplitude ∆P and a
fixed cycle frequency of 5 Hz. The crack propagation was monitored visually with the
aid of a camera system and the raw data was translated to a crack length (a) versus
number of cycles (N) curve. Due to the visual nature of the measuring technique there
exists the possibility of a slight error in readings (up to 5%). The da/dN ratios were
then calculated for each curve and ∆K values were determined. The Paris parameters C
and m were determined from the da/dN versus ∆K plot according to the Paris equation.
The microstructure of the AB, SR and HT conditions was examined by preparing
metallographic sections perpendicular and parallel to the SLM build direction (Z-axis)
in order to account for the anisotropic grain growth during the SLM process. The
metallographic specimens were etched after conventional grinding/polishing in a
mixture of 100 ml distilled water, 2 ml HF and 5 ml HNO3 (Krolls reagent) and they
were examined using brightfield light microscopy.
3. Results
3.1. Tensile testing
The tensile mechanical properties of the material are shown in Figure 4 and are listed in
Table 1. No significant difference was observed between the XY an XZ specimen
orientations. Very little necking of the specimens was noticed during testing.
Page 9 of 32
Accep
ted
Man
uscr
ipt
1 2 3 4 5 6 7 8 9 10 11 12 13 14 15 16 17 18 19 20 21 22 23 24 25 26 27 28 29 30 31 32 33 34 35 36 37 38 39 40 41 42 43 44 45 46 47 48 49 50 51 52 53 54 55 56 57 58 59 60 61 62 63 64 65
9
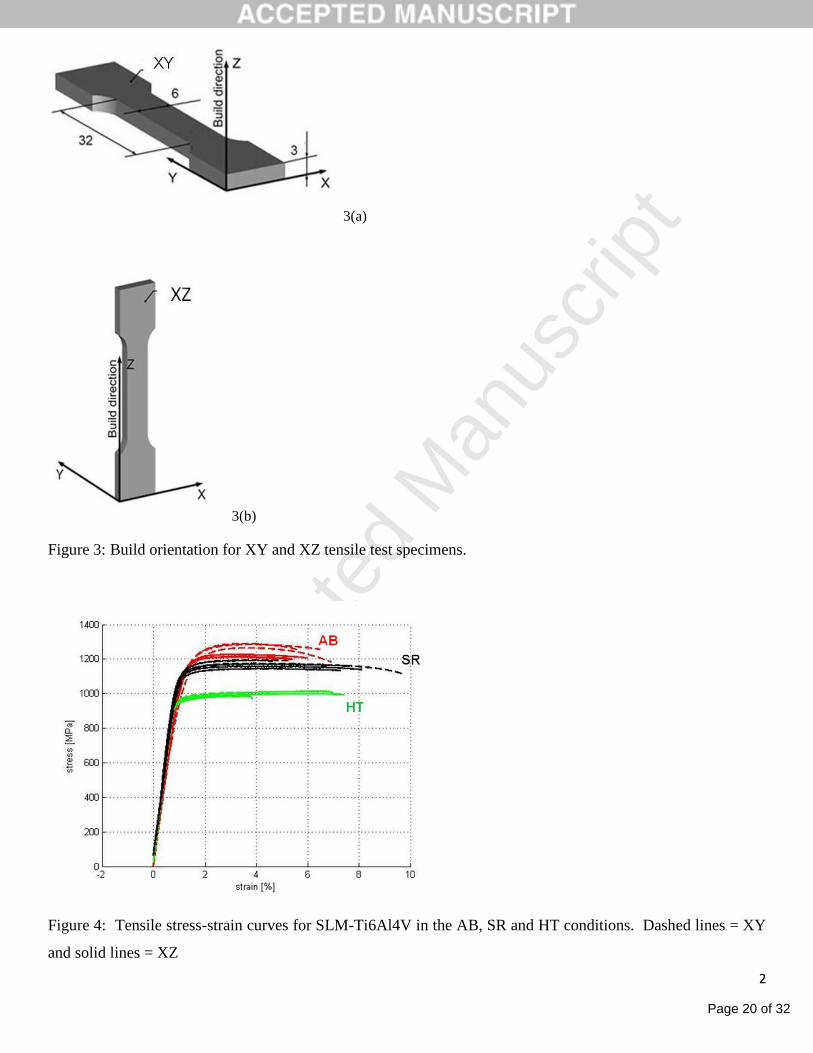
The AB tensile specimens showed an average ultimate tensile strength of 1248 MPa
with an average elongation at failure of about 6 %. After applying the SR heat
treatment at 650˚C the average ultimate tensile strength dropped to 1171 MPa with a
slight increase in elongation at failure. In the case of the high temperature annealing
heat treatment at 890˚C (HT condition), the average ultimate tensile strength further
decreased quite substantially to just below 1000 MPa whilst the elongation at fracture
surprisingly also reduced.
3.2 Fracture toughness
Table 2 summarises the K1C values for the three different AB, SR and HT conditions for
the respective specimen orientations. In most cases post-SLM processing heat
treatment increases the fracture toughness of the material with the largest difference
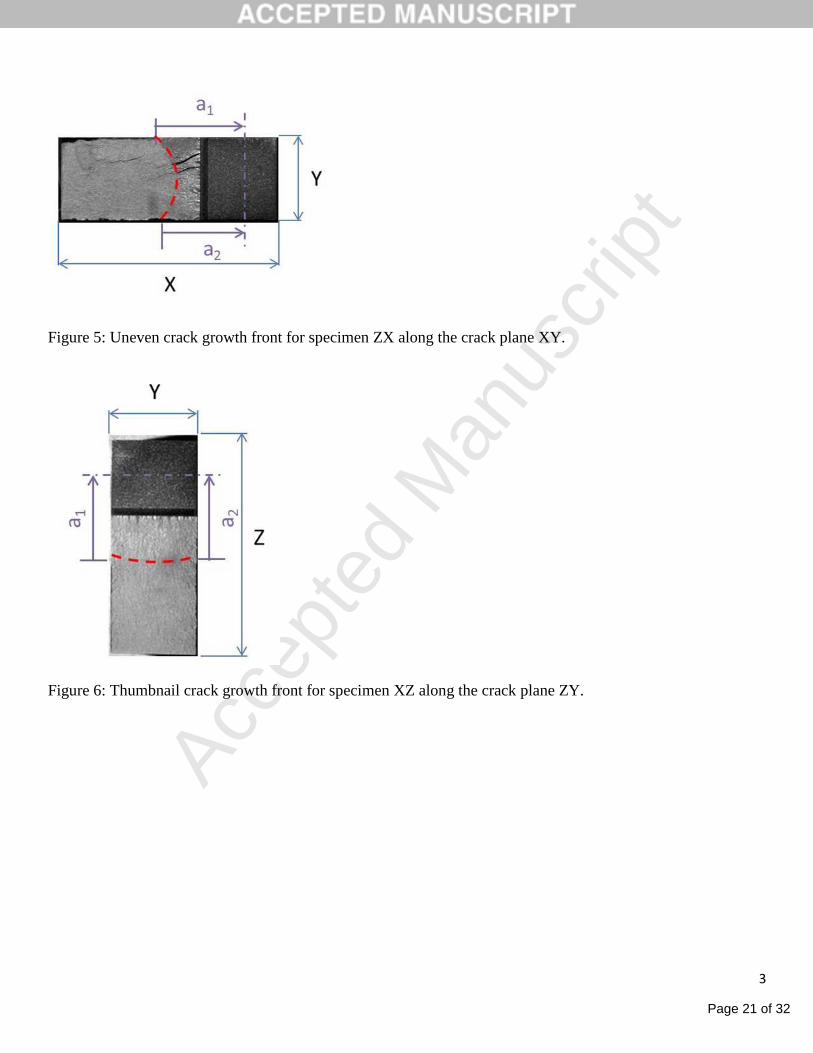
illustrated by the ZX orientation. It is worth pointing out that the pre-crack for the AB
specimens in the ZX orientation demonstrates an undesirable crack front (Figure 5)
compared to the classical thumbnail crack profile in Figure 6.
3.3 Crack propagation
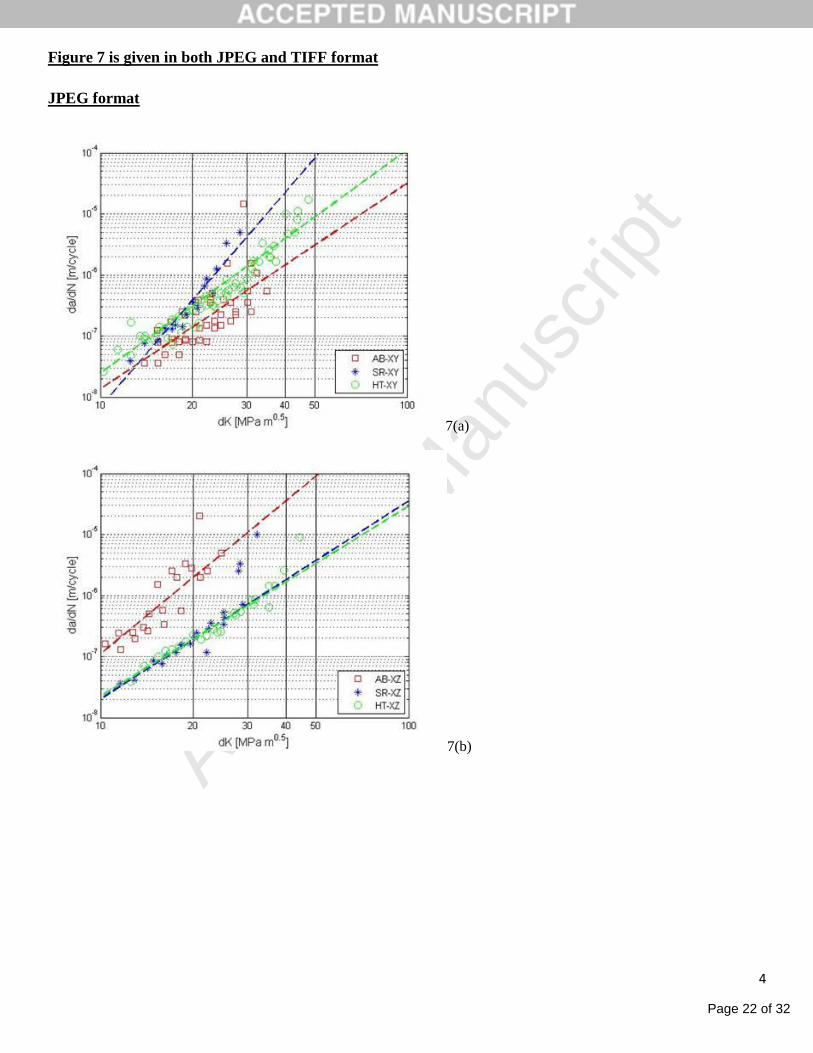
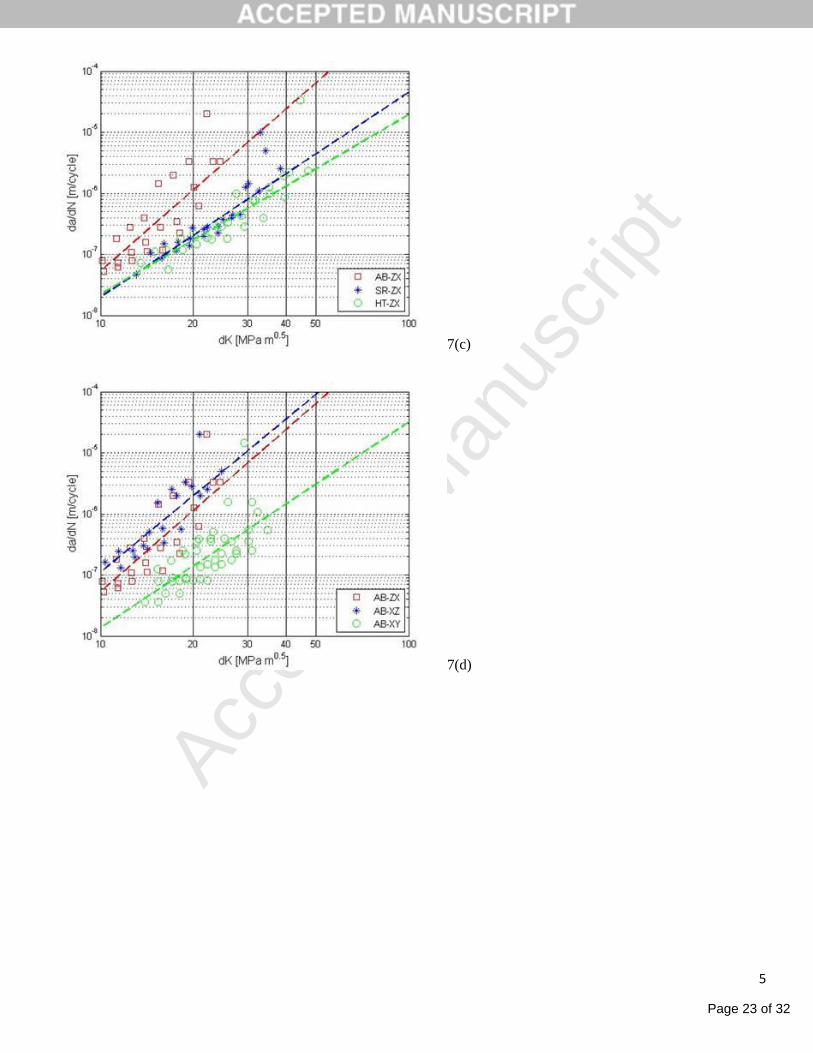
The results of the FCGR experiments are represented by the Paris curves shown in
Figure 7. Figure 7 (a) - (c) displays the effect of specimen process condition for each
specimen orientation, whereas Figure 7 (d) - (f) shows the effect of specimen orientation
for each specimen process condition. It must be noted that the experimental work did
not include the determination of the threshold K values.
Page 10 of 32
Accep
ted
Man
uscr
ipt
1 2 3 4 5 6 7 8 9 10 11 12 13 14 15 16 17 18 19 20 21 22 23 24 25 26 27 28 29 30 31 32 33 34 35 36 37 38 39 40 41 42 43 44 45 46 47 48 49 50 51 52 53 54 55 56 57 58 59 60 61 62 63 64 65
10
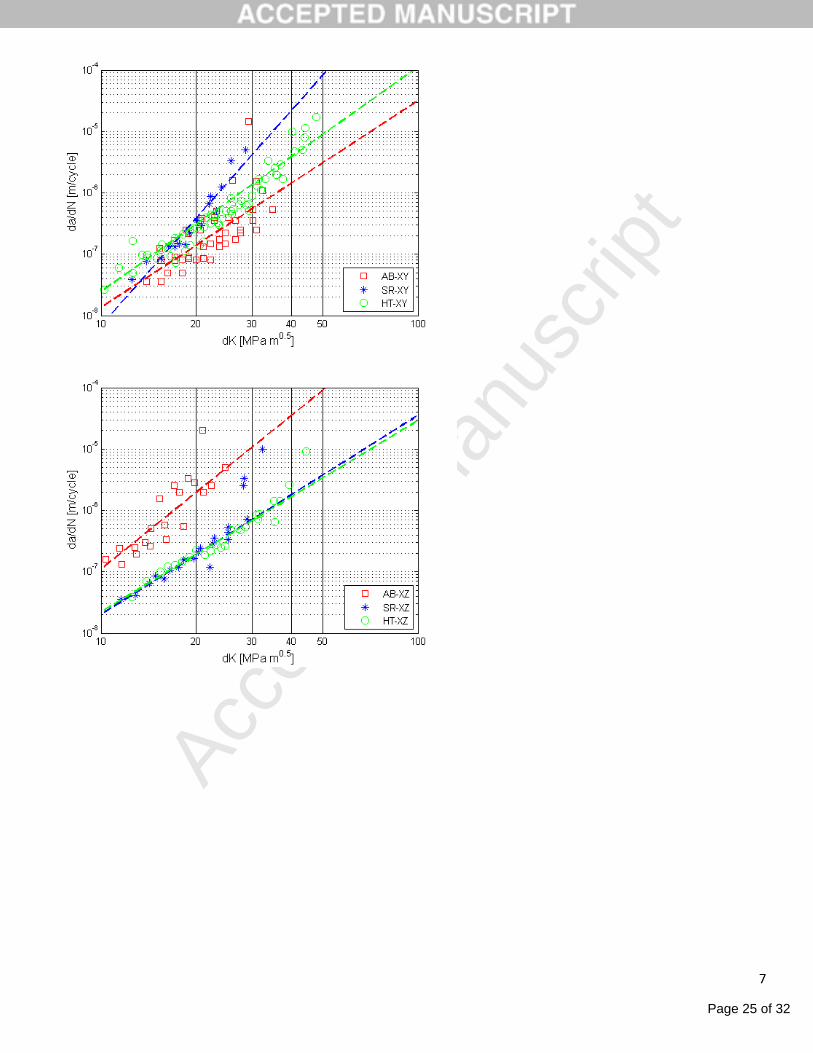
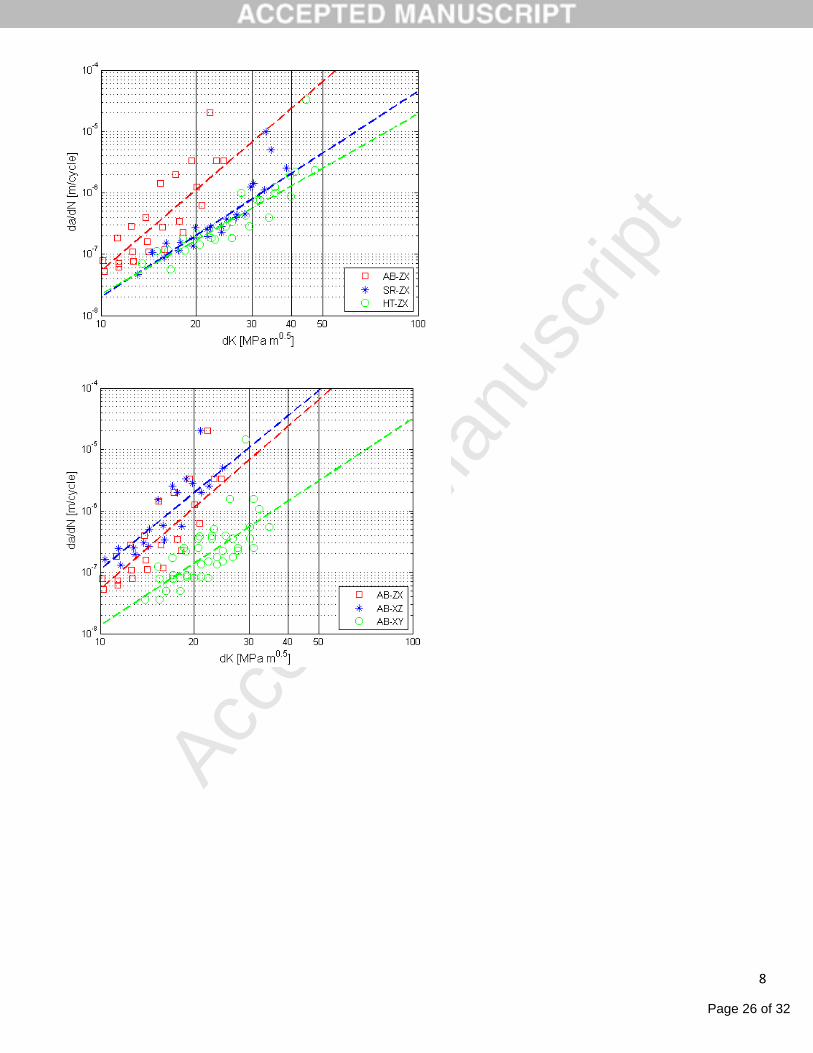
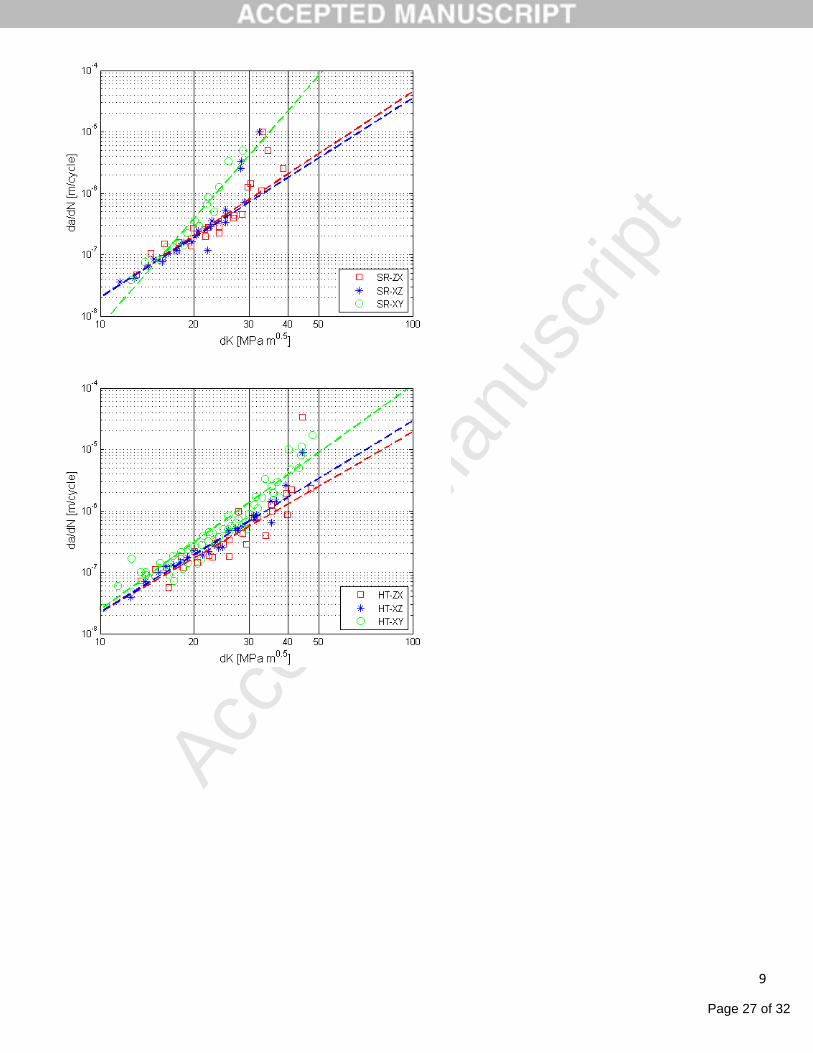
For the XY specimen orientation the AB condition shows the slowest crack
propagation, whereas the SR condition demonstrates the fastest crack propagation. For
the XZ orientation it is clear that the worst case crack growth rates are found for the
specimens in the AB condition. For the HT and SR condition there is no noticeable
difference between their FCGR behaviour. Similarly, for the ZX specimen orientation
the highest crack growth rates are observed for the AB condition. Overall it is shown
that the AB condition of the XZ and ZX specimens exhibit the highest crack growth
rates, while for the HT condition not only is the behaviour better than the AB condition,
but the spread is smaller (Figure 7(f)). The resulting Paris exponents (m), the Paris
crack growth rate constants (C) and the correlation factor (R2) between data and linear
fit is tabulated for all of the specimens in Table 3. The correlation factor improves
when specimens have undergone a post processing treatment, inferring that there is
more scatter in the AB data relative to the SR and HT data. The greater scatter for the
AB data could be a result of the variable residual stress distributions introduced by the
SLM process.
3.4 Microstructure
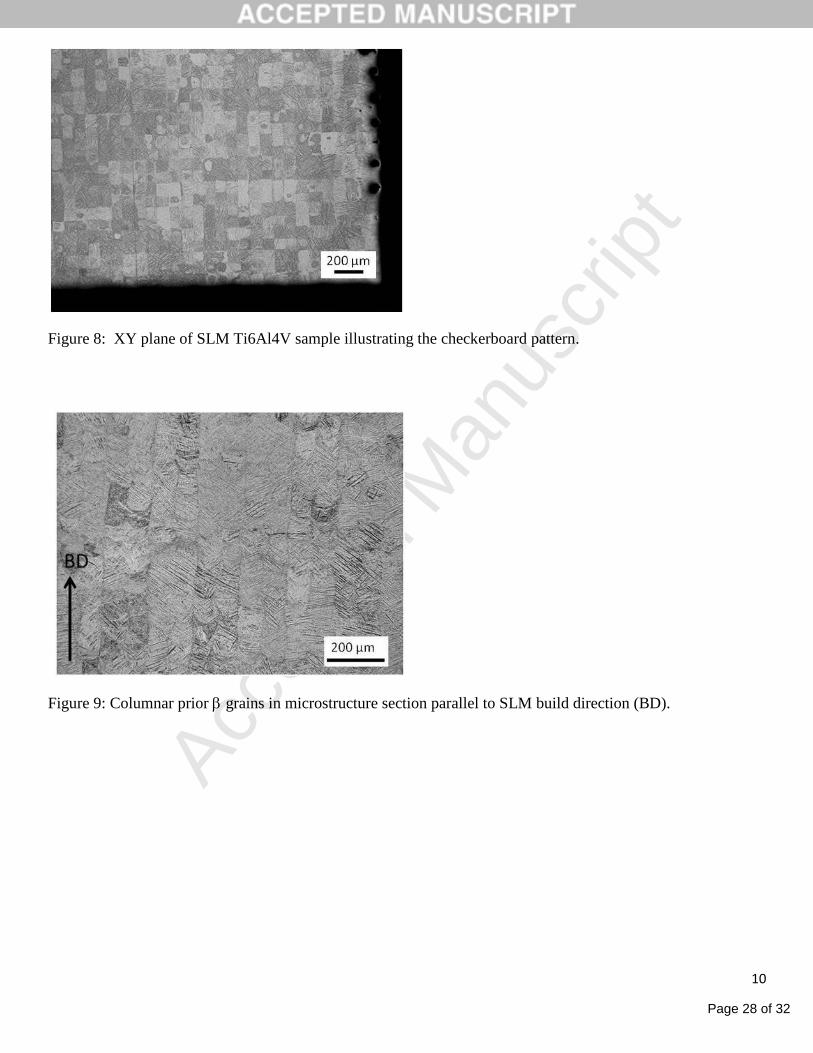
The bi-directional scanning strategy is clearly recognisable from the checkerboard
pattern displayed by the plane (XY) perpendicular to the build direction (Z-axis) as
indicated in Figure 8.
The microstructure parallel to the build direction is indicated in Figure 9.
Page 11 of 32
Accep
ted
Man
uscr
ipt
1 2 3 4 5 6 7 8 9 10 11 12 13 14 15 16 17 18 19 20 21 22 23 24 25 26 27 28 29 30 31 32 33 34 35 36 37 38 39 40 41 42 43 44 45 46 47 48 49 50 51 52 53 54 55 56 57 58 59 60 61 62 63 64 65
11
As is common for the SLM production of Ti6Al4V specimens, a columnar grain
structure is clearly visible which arises as a result of the epitaxial growth caused by the
successive layer deposition. The heat treatments in this study were designed to avoid
significant grain growth by maintaining the maximum temperature below the -transus
temperature (approximately 1000°C).
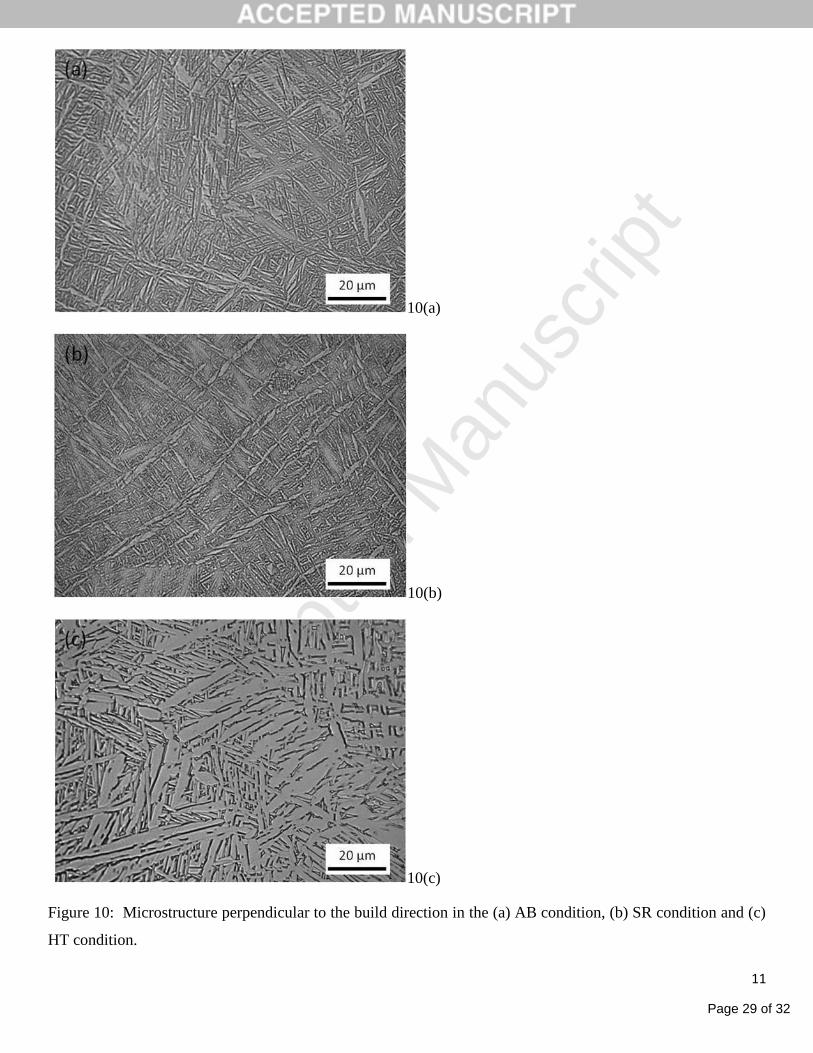
The metal powder solidifies to form the phase which subsequently transforms during
cooling. Closer inspection of the microstructure in Figure 10 (a) exhibits the
martensitic morphology consisting of fine ’ plates. When heated to 650˚C (SR
condition) the AB martensitic structure partially decomposes towards acicular as
indicated by the slight coarsening seen in Figure 10(b). On the other hand, when heated
to 890˚C (HT condition) the reformed phase upon subsequent cooling forms the
Widmanstätten / structure shown in Figure 10(c).
4. Discussion
The ultimate tensile strength and yield strength are substantially reduced after heat
treatment relative to the AB condition. This behaviour is consistent with the
transformation of the initial martensite structure. The more relaxed and coarser
microstructure constituents associated with the Widmanstätten morphology in the
annealed HT condition results in the lowest strength. However, unlike the findings of
Leuders et al. [7] where the elongation at fracture was increased by nearly an order of
magnitude (from 1.5% to 11.6%) after annealing at 1050°C, there was very little change
in tensile ductility in our case. This may be due to the better initial AB ductility and the
Page 12 of 32
Accep
ted
Man
uscr
ipt
1 2 3 4 5 6 7 8 9 10 11 12 13 14 15 16 17 18 19 20 21 22 23 24 25 26 27 28 29 30 31 32 33 34 35 36 37 38 39 40 41 42 43 44 45 46 47 48 49 50 51 52 53 54 55 56 57 58 59 60 61 62 63 64 65
12
lower annealing temperature compared to the test conditions imposed by Leuders et al.
[7].
In the as-built (AB) condition the fracture toughness (K1c) is highest for the XY
specimens (28MPa.m½) and decreases for the XZ specimens (23MPa.m
½) with the
lowest values recorded for the ZX specimens (16MPa.m½). The fact that the same
microstructure constituents exist in all the specimens suggests that microstructure
anisotropy and/or residual stress anisotropy plays critical roles in controlling the
fracture toughness behaviour of the differently oriented specimens. If microstructure
morphology only is considered, then it may be expected that the lowest fracture
toughness should be demonstrated by the XZ specimen orientation since the crack path
cleaves down the length of the columnar grains (akin to chopping wood along the
grain). In comparison, the ZX specimen might be expected to display the highest
fracture toughness since the crack path is perpendicular to the columnar grain structure
whereas the XY specimen could behave in a somewhat intermediate fashion. However,
the actual results are quite different to this argument. When residual stress is
considered, there are two strong indicators to suggest that the ZX specimen should
demonstrate the lowest fracture toughness. In the first instance, the study by
Rangaswamy et al. [9] concerning the measurement of residual stresses in AISI316
stainless steel and Inconel 718 samples produced by a similar net-shaping process,
indicates that the residual stresses are practically uniaxial with high stresses in the
growth (Z) direction. More particularly, their study shows very low residual x- and y-
component stresses whereas the residual z-component stress is compressive up to values
approximating 400MPa. Of course compressive residual stress will enhance fracture
Page 13 of 32
Accep
ted
Man
uscr
ipt
1 2 3 4 5 6 7 8 9 10 11 12 13 14 15 16 17 18 19 20 21 22 23 24 25 26 27 28 29 30 31 32 33 34 35 36 37 38 39 40 41 42 43 44 45 46 47 48 49 50 51 52 53 54 55 56 57 58 59 60 61 62 63 64 65
13
resistance when the stress is acting to close to the crack, but Rangaswamy et al. [9] have
shown that a profile of the z-component stress across the x- and y-directions manifests
in high tensile z-component stresses close to the specimen free surfaces in each case (up
to 200 MPa). This means that for the ZX specimen, the residual stress along the
specimen centre-line may act to reduce the applied tensile load, but the tensile residual
stresses near the lateral edges (free surfaces) of the fracture plane will substantially add
to the applied tensile load thereby giving rise to a reduction in fracture toughness. This
leads to the second indicator which may be argued to account for the lowest fracture
toughness for the as-built (AB) ZX specimen. Figure 5 displays an unfavourable pre-
crack front for the ZX specimen where the crack is longer close to the free surfaces
compared to the specimen centre-line. This particular crack morphology can be
accounted for by applying the same deductions illustrated above for the residual stress
measurements presented by Rangaswamy et al [9]. In fact, recent analysis by Vrancken
et al. [10] using the contour method for measuring the residual stress in the fracture
plane supports the presence of high tensile residual stress around the perimeter of the
(AB) ZX specimens. Due to the fact that the intention of SLM is to manufacture net
shape parts it is not viable to machine or cut away part of the component that might
relieve some of the residual stresses. If one then combines the suggested contributions
of the microstructure morphology and the residual stress condition, it is reasonable to
expect that the (AB) ZX specimen orientation could possess the lowest fracture
toughness (dominated by tensile residual stresses perpendicular to the fracture plane
near the free surfaces) despite the favourable grain orientation relative to the crack path.
The residual stress condition relative to the fracture plane, for reasons interpreted from
the work of Rangaswamy et al. [9] and Vrancken et al. [10], is similar for the XZ and
Page 14 of 32
Accep
ted
Man
uscr
ipt
1 2 3 4 5 6 7 8 9 10 11 12 13 14 15 16 17 18 19 20 21 22 23 24 25 26 27 28 29 30 31 32 33 34 35 36 37 38 39 40 41 42 43 44 45 46 47 48 49 50 51 52 53 54 55 56 57 58 59 60 61 62 63 64 65
14
XY specimens, but the microstructure anisotropy is expected to be slightly more
favourable towards resisting crack propagation in the case of the XY specimen. This
analysis is consistent with the reported fracture toughness values for the AB specimens
as function of specimen orientation.
After application of the stress relief heat treatment the fracture toughness values are
within reasonable agreement for all the specimen orientations suggesting that the
dominant residual stress effect argued above has been eliminated. Of course the
columnar grain structure is still maintained, but the heat treatment may have sufficiently
altered the planarity of the grain-to-grain interfaces to reduce the grain anisotropy
effect. This detailed view of the microstructure and its influence on crack propagation
remains to be investigated and is the topic of future research. In the case of the
annealed HT condition, one might expect a similar agreement in the fracture toughness
values for the respective orientations but, despite the overall increase in fracture
toughness (Table 2), there is a 20% difference between the highest (XZ and ZX) and the
lowest (XY) K1c values. There are once again likely to be detailed microstructural
aspects that might account for this behaviour, but the difference in K1c values between
the specimen orientations is substantially less than the 75% difference in the case of the
AB specimens. Although annealing heat treatments offer the most favourable fracture
toughness properties, it is once again reinforced in this study that the role of residual
stresses, and consequently stress relief heat treatments, is critically important in
influencing the competitiveness of parts produced by the SLM process. Knowles et al.
[11] and Leuders et al. [7] have reported a substantial decrease in residual stress levels
in SLM Ti6Al4V specimens after heat treatment (650ºC for 4 hours and 800ºC for 2
Page 15 of 32
Accep
ted
Man
uscr
ipt
1 2 3 4 5 6 7 8 9 10 11 12 13 14 15 16 17 18 19 20 21 22 23 24 25 26 27 28 29 30 31 32 33 34 35 36 37 38 39 40 41 42 43 44 45 46 47 48 49 50 51 52 53 54 55 56 57 58 59 60 61 62 63 64 65
15
hours respectively). Leuders et al. [7] also concluded that higher temperature heat
treatments did not provide any further favourable reduction in residual stress.
The fatigue crack growth rate (FCGR) behaviour very closely mimics the fracture
toughness properties for the respective specimen orientations and process conditions. In
the same way as for the fracture toughness values for the AB condition, the AB-XY
specimen demonstrates the lowest FCGR (Figure 7(d)). The ZX and XZ specimens in
the same condition have quite similar yet higher FCGR’s. Correspondingly, there is
more noticeable improvement in the FCGR resistance for the ZX and XZ specimens
after heat treatment compared to the XY specimen, which if anything, displays slightly
poorer FCGR resistance after heat treatment. Notwithstanding the fact that the more
subtle influences of microstructure development as function of heat treatment remain to
be investigated, the role of residual stress, and in particular the anisotropic influence of
this residual stress, has been comprehensively accounted for in this study by comparing
three different specimen orientations (relative to the build direction) and superimposing
the influence of stress relief and annealing heat treatments.
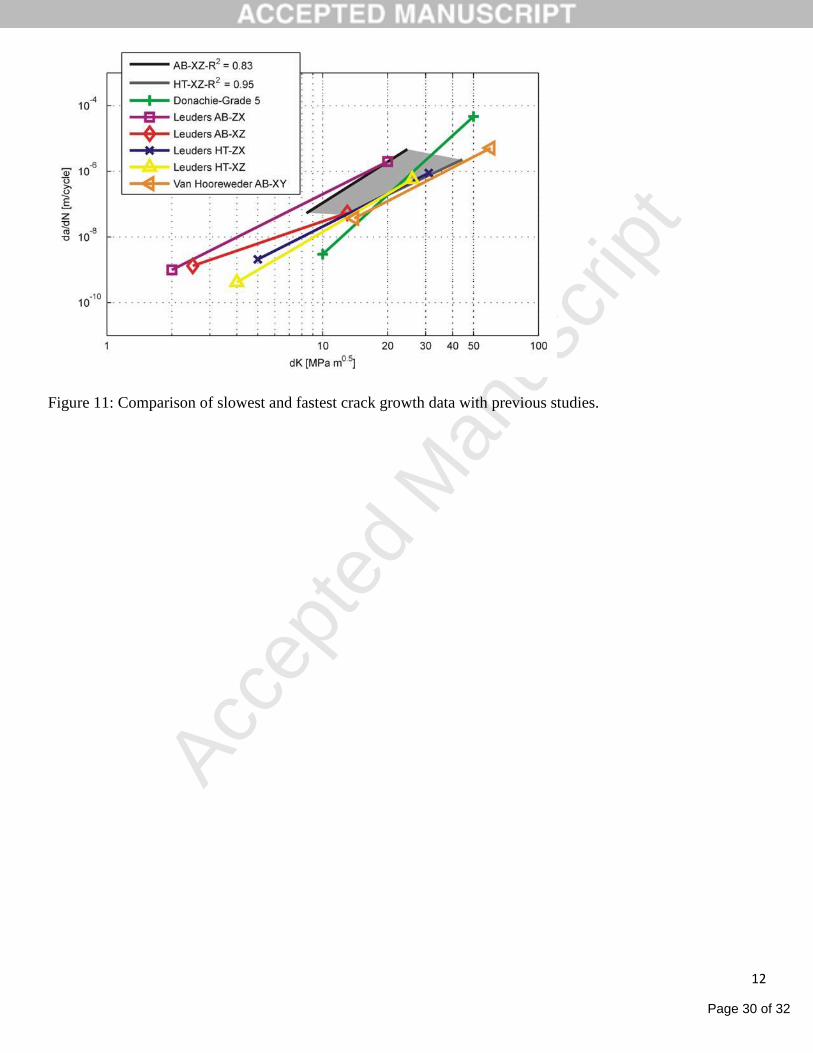
Finally, the FCGR results from our study are compared to the results reported in the
open literature (Figure 11).
Overall, there is a close correlation between the respective trend lines. For example, in
the study by Leuders et al. [7] it is reported that the AB-ZX specimens possess the
lowest FCGR resistance and there is a marked improvement with heat treatment. Of
particular interest in Figure 11 is the inclusion of FCGR data for conventional wrought
Page 16 of 32
Accep
ted
Man
uscr
ipt
1 2 3 4 5 6 7 8 9 10 11 12 13 14 15 16 17 18 19 20 21 22 23 24 25 26 27 28 29 30 31 32 33 34 35 36 37 38 39 40 41 42 43 44 45 46 47 48 49 50 51 52 53 54 55 56 57 58 59 60 61 62 63 64 65
16
Ti6Al4V [12]. The FCGR trendlines reported for SLM Ti6Al4V are not significantly
different to the conventional wrought Ti6Al4V alloy.
5. Conclusions
The consideration of SLM build orientation and process condition has highlighted the
sensitivity of mechanical properties to the anisotropic microstructural and residual stress
effects that arise from the highly directional and rapid transient nature of the SLM
manufacturing process. In particular, the following findings are highlighted:
The effect of the relationship between build direction and fracture plane on the
fracture toughness and fatigue crack growth rate is most noticeable when
material is tested in the as-built condition and may be accounted for by the
anisotropic residual stress distribution.
Low temperature stress relief and annealing heat treatments improve fracture
toughness and fatigue crack growth resistance relative to the as-built condition
and at the same time contribute to the elimination of the influence of anisotropy.
The uniaxial tensile properties are much less influenced by specimen orientation
relative to build direction.
Acknowledgments
The main author acknowledges the Erasmus Mundus scholarship funded by the
European Union. In addition, this work is based on the research supported in part by
the National Research Foundation of South Africa (NRF) for the grant 80561 and the
Agency for Innovation by Science and Technology (IWT) through the SBO-project
Page 17 of 32
Accep
ted
Man
uscr
ipt
1 2 3 4 5 6 7 8 9 10 11 12 13 14 15 16 17 18 19 20 21 22 23 24 25 26 27 28 29 30 31 32 33 34 35 36 37 38 39 40 41 42 43 44 45 46 47 48 49 50 51 52 53 54 55 56 57 58 59 60 61 62 63 64 65
17
e-SHM (Belgium).
“Any opinion, finding and conclusion or recommendation expressed in this material is
that of the authors and the NRF does not accept any liability in this regard”.
References
1. B. Van Hooreweder, D. Moens, R. Boonen, J.P. Kruth, P. Sas, Analysis of Fracture
Toughness and Crack Propagation of Ti6Al4V Produced by Selective Laser Melting,
Advanced Engineering Materials. 14 (2012) 92-97.
2. L. Thijs, F. Verhaeghe, T. Craeghs, J. Van Humbeeck, J.P Kruth, A study of the
microstructural evolution during selective laser melting of Ti6Al4V, Acta Mater. 58
(2010) 3303-3312.
3. J.P Kruth, M. Badrossamay, E. Yasa, J. Deckers, L. Thijs, J. Van Humbeeck, Part
and material properties in selective laser melting of metals, Proceedings of the 16th
International Symposium on Electromachining, Shanghai, China (2010).
4. E. Yasa, J. Deckers, J.P Kruth, M. Rombouts, J. Luyten, Experimental Investigation
of Charpy Impact Tests on Metallic SLM Parts, Proceeding of the International
Conference on Advanced Research in Virtual and Rapid Prototyping, Leiria, Portugal
(2009) 207–214.
5. T. Vilaro, C. Colin, J.D Bartout, As-Fabricated and Heat-Treated Microstructures of
the Ti-6Al-4V Alloy Processed by Selective Laser Melting Metall, Mater. Trans. 42A
(2011) 3190–3199.
Page 18 of 32
Accep
ted
Man
uscr
ipt
1 2 3 4 5 6 7 8 9 10 11 12 13 14 15 16 17 18 19 20 21 22 23 24 25 26 27 28 29 30 31 32 33 34 35 36 37 38 39 40 41 42 43 44 45 46 47 48 49 50 51 52 53 54 55 56 57 58 59 60 61 62 63 64 65
18
6. P. Mercelis, J.P Kruth, Residual stresses in selective laser sintering and selective laser
melting, Rapid Prototyping Journal. 12/5 (2006) 254–265.
7. S. Leuders, M. Thone, A. Riemer, T. Niendorf, On the mechanical behaviour of
titanium alloy TiAl6V4 manufactured by selective laser melting: Fatigue resistance and
crack growth performance, International Journal of Fatigue. 48 (2013) 300-307.
8. B. Vrancken, L. Thijs, J.P Kruth, J. Van Humbeeck, Heat treatment of Ti6Al4V
produced by Selective Laser Melting: Microstructure and mechanical properties, Journal
of Alloys and Compounds. 541 (2012) 177–185.
9. P. Rangaswamy, M.L Griffith, M.B Prime, T.M Holden, R.B Rogge, J.M Edwards,
R.J Sebring, Residual stresses in LENS® components using neutron diffraction and
contour method, Materials Science and Engineering. A399 (2005) 72–83.
10. B. Vrancken, V. Cain, R. Knutsen, J. Van Humbeeck, Residual Stress via the
Contour Method in Compact Tension Specimens produced via Selective Laser Melting,
Scripta Mater. 87 (2014) 29-32.
11. C.R Knowles, T.H Becker, R.B Tait, Residual stress measurements and structural
integrity implications for selective laser melted Ti6Al4V, South African Journal of
Industrial Engineering. 23 (2012) 119-129.
12. M.J Donachie, Titanium: A technical guide. ASM International, Materials Park,
Ohio, USA, 1988.
Page 19 of 32
Accep
ted
Man
uscr
ipt
1
Note: Please retain colors on figures supplied (4, 5, 6, 7 and 11)
Figure 1: Scanning strategy (bi-directional) used to produce test specimens [2]
2(a)
2(b)
Figure 2: (a) CT specimen orientations on the build-platform and (b) CT specimen geometry. The lines visible
on (a) schematically represent the successive layers of powder.
Figure
Page 20 of 32
Accep
ted
Man
uscr
ipt
2
3(a)
3(b)
Figure 3: Build orientation for XY and XZ tensile test specimens.
Figure 4: Tensile stress-strain curves for SLM-Ti6Al4V in the AB, SR and HT conditions. Dashed lines = XY
and solid lines = XZ
Page 21 of 32
Accep
ted
Man
uscr
ipt
3
Figure 5: Uneven crack growth front for specimen ZX along the crack plane XY.
Figure 6: Thumbnail crack growth front for specimen XZ along the crack plane ZY.
Page 22 of 32
Accep
ted
Man
uscr
ipt
4
Figure 7 is given in both JPEG and TIFF format
JPEG format
7(a)
7(b)
Page 23 of 32
Accep
ted
Man
uscr
ipt
5
7(c)
7(d)
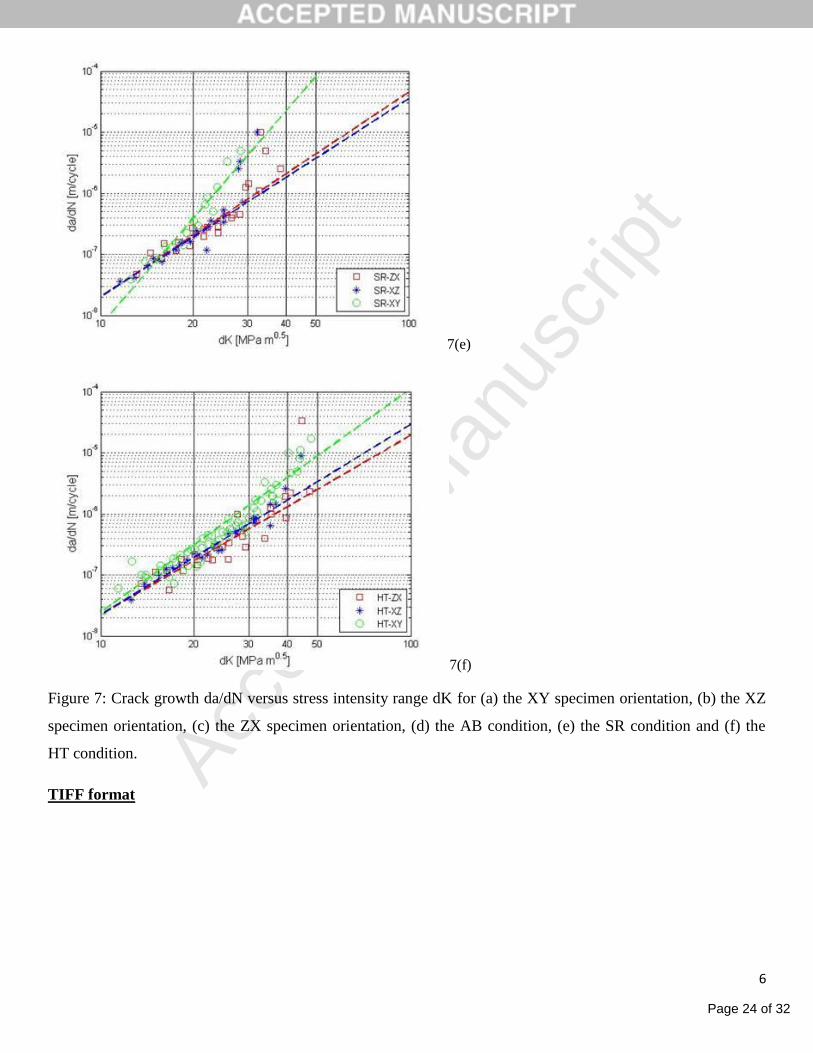
Page 24 of 32
Accep
ted
Man
uscr
ipt
6
7(e)
7(f)
Figure 7: Crack growth da/dN versus stress intensity range dK for (a) the XY specimen orientation, (b) the XZ
specimen orientation, (c) the ZX specimen orientation, (d) the AB condition, (e) the SR condition and (f) the
HT condition.
TIFF format
Page 25 of 32
Accep
ted
Man
uscr
ipt
7
Page 26 of 32
Accep
ted
Man
uscr
ipt
8
Page 27 of 32
Accep
ted
Man
uscr
ipt
9
Page 28 of 32
Accep
ted
Man
uscr
ipt
10
Figure 8: XY plane of SLM Ti6Al4V sample illustrating the checkerboard pattern.
Figure 9: Columnar prior grains in microstructure section parallel to SLM build direction (BD).
Page 29 of 32
Accep
ted
Man
uscr
ipt
11
10(a)
10(b)
10(c)
Figure 10: Microstructure perpendicular to the build direction in the (a) AB condition, (b) SR condition and (c)
HT condition.
Page 30 of 32
Accep
ted
Man
uscr
ipt
12
Figure 11: Comparison of slowest and fastest crack growth data with previous studies.
Page 31 of 32
Accep
ted
Man
uscr
ipt
Table 1: Summary of tensile mechanical properties for AB, SR and HT specimens.
σy [MPa] σUTS [MPa] εf [%]
AB (XY)
AB (XZ)
SR (XY)
SR (XZ)
HT (XY)
HT (XZ)
1093 ± 64
1125 ± 22
1145 ± 17
1132 ± 13
973 ± 8
964 ± 7
1279 ± 13
1216 ± 8
1187 ± 10
1156 ± 13
996 ± 10
998 ± 14
6 ± 0.7
6 ± 0.4
7 ± 2.7
8 ± 0.4
3 ± 0.4
6 ± 2
Table 2: Fracture toughness values for the as-built and heat treated XY, XZ and ZX specimen
orientations.
K1c (MPa.m½) XY XZ ZX
AB 28 ± 2 23 ± 1 16 ± 1
SR 28 ± 2 30 ± 1 31 ± 2
HT 41 ± 2 49 ± 2 49 ± 1
Table 3: Paris parameters and relevant correlation factors
m C (m.cycle) R2
XY-AB 3,37 5,79E-12 0.74
XY-HT 3,83 2,04E-12 0.91
XY-SR 5,84 9,93E-15 0.91
XZ-AB 4,17 7,51E-12 0.84
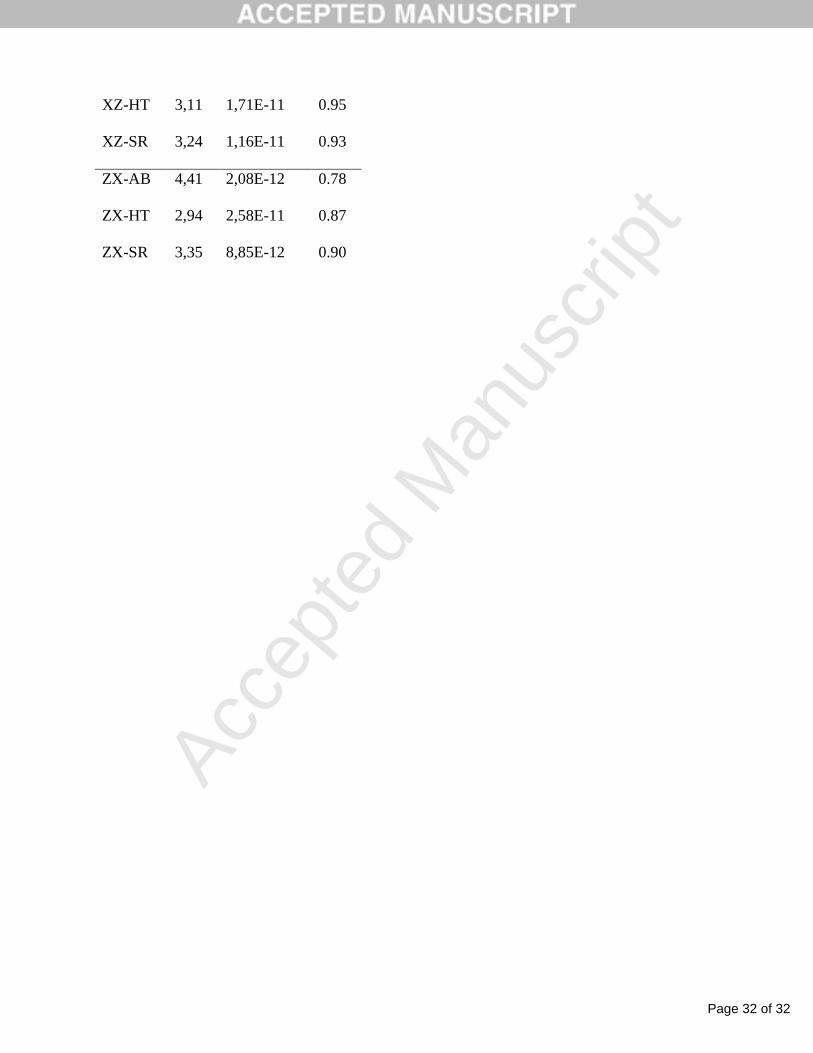
Table
Page 32 of 32
Accep
ted
Man
uscr
ipt
XZ-HT 3,11 1,71E-11 0.95
XZ-SR 3,24 1,16E-11 0.93
ZX-AB 4,41 2,08E-12 0.78
ZX-HT 2,94 2,58E-11 0.87
ZX-SR 3,35 8,85E-12 0.90