Uppala Use of Satellites in reanalysis rev - ECMWF Seminar on Recent development in the use of...
22
ECMWF Seminar on Recent development in the use of satellite observations in NWP, 3-7 September 2007 29 Use of satellite data in reanalyses S. Uppala European Centre for Medium-Range Weather Forecasts Reading, UK 1. Introduction Reanalyses are designed to produce long sequences of analyses by applying modern assimilation techniques to historical observations. Prior to reanalyses operational analyses were successfully used in general circulation studies. However due to the improvements in the forecasting system it was difficult to study interannual variations and it was impossible to study the climate change. There was also an increasing need to understand trends in the global atmosphere. In the late 1980s TOVS data, in particular MSU Channels 2 and 4, has successfully been used to study trends in the troposphere and the lower stratosphere. They have also been used to reveal discrepancies between observations and the operational analyses, Hurrell and Trenberth (1991) and Oort and Liu (1992). In this sense high expectations were expressed concerning the proposed reanalyses projects in the late 1980s. When, in early 1990s, the first reanalyses started, more than two decades of data from geostationary and polar orbiting satellites was available. Until then operational forecasting centres had assimilated satellite data in the form of low resolution temperature/ humidity retrievals or wind vectors in much the same way as the conventional data from radiosondes, pilot balloons and commercial aircrafts. Quality of conventional data, in particular the reported radiosonde heights/ temperatures, were monitored closely since their effect on the forecast quality was more clearly understood. In mid 1990s the advent of variational analysis techniques 3D- and 4D-Var (Courtier et al. 1994, Andersson et al. 1998 ) brought a “quantum leap” to the design of data-assimilation systems, and the way observations, in particular the satellite data, were used. The calibrated radiance data, with or without cloud clearing, was directly assimilated and the analysis became the retrieval of the atmospheric state. Today about 35 years of historical satellite data with improving quality is available for reanalysis from a large number of instruments. Satellite data has become the key input for the data assimilation and monitoring of satellite data an essential tool in understanding and improving the product quality. Physical processes in assimilating models closely interplay with satellite observations increasing the number of actively assimilated radiances from both polar orbiting and geostationary satellites. For reanalyses the rapid development in data assimilation and the use of satellite data means that instead of being viewed as a series of largely independent “one-off” exercises, reanalysis has come to be seen more as an iterative process. In this process, developments in modelling, data-analysis techniques and computing power with new data rescue efforts and experience from previous reanalyses, are used to produce a succession of reanalyses of increasing quality, for illustration see Figure 1. The first two reanalyses were carried out in the USA; at NCEP (National Centers for Environmental Prediction) for the period starting in 1948, Kalnay et al. (1996), and at NASA for the period 1980-1995, Schubert et al. (1995). These were followed by two European reanalyses, both performed at ECMWF: ERA- 15 (1979-1993), Gibson et al. (1997) and ERA-40 (1957-2002), Uppala et al. (2005). Japan also has recently completed a reanalysis of the period 1979-2004, Onogi et al. (2006).
Transcript of Uppala Use of Satellites in reanalysis rev - ECMWF Seminar on Recent development in the use of...

ECMWF Seminar on Recent development in the use of satellite observations in NWP, 3-7 September 2007 29
Use of satellite data in reanalyses
S. Uppala
European Centre for Medium-Range Weather Forecasts Reading, UK
1. Introduction Reanalyses are designed to produce long sequences of analyses by applying modern assimilation techniques to historical observations. Prior to reanalyses operational analyses were successfully used in general circulation studies. However due to the improvements in the forecasting system it was difficult to study interannual variations and it was impossible to study the climate change. There was also an increasing need to understand trends in the global atmosphere. In the late 1980s TOVS data, in particular MSU Channels 2 and 4, has successfully been used to study trends in the troposphere and the lower stratosphere. They have also been used to reveal discrepancies between observations and the operational analyses, Hurrell and Trenberth (1991) and Oort and Liu (1992). In this sense high expectations were expressed concerning the proposed reanalyses projects in the late 1980s.
When, in early 1990s, the first reanalyses started, more than two decades of data from geostationary and polar orbiting satellites was available. Until then operational forecasting centres had assimilated satellite data in the form of low resolution temperature/ humidity retrievals or wind vectors in much the same way as the conventional data from radiosondes, pilot balloons and commercial aircrafts. Quality of conventional data, in particular the reported radiosonde heights/ temperatures, were monitored closely since their effect on the forecast quality was more clearly understood.
In mid 1990s the advent of variational analysis techniques 3D- and 4D-Var (Courtier et al. 1994, Andersson et al. 1998 ) brought a “quantum leap” to the design of data-assimilation systems, and the way observations, in particular the satellite data, were used. The calibrated radiance data, with or without cloud clearing, was directly assimilated and the analysis became the retrieval of the atmospheric state. Today about 35 years of historical satellite data with improving quality is available for reanalysis from a large number of instruments. Satellite data has become the key input for the data assimilation and monitoring of satellite data an essential tool in understanding and improving the product quality. Physical processes in assimilating models closely interplay with satellite observations increasing the number of actively assimilated radiances from both polar orbiting and geostationary satellites.
For reanalyses the rapid development in data assimilation and the use of satellite data means that instead of being viewed as a series of largely independent “one-off” exercises, reanalysis has come to be seen more as an iterative process. In this process, developments in modelling, data-analysis techniques and computing power with new data rescue efforts and experience from previous reanalyses, are used to produce a succession of reanalyses of increasing quality, for illustration see Figure 1.
The first two reanalyses were carried out in the USA; at NCEP (National Centers for Environmental Prediction) for the period starting in 1948, Kalnay et al. (1996), and at NASA for the period 1980-1995, Schubert et al. (1995). These were followed by two European reanalyses, both performed at ECMWF: ERA-15 (1979-1993), Gibson et al. (1997) and ERA-40 (1957-2002), Uppala et al. (2005). Japan also has recently completed a reanalysis of the period 1979-2004, Onogi et al. (2006).

UPPALA, S.: USE OF SATELLITE DATA IN REANALYSES
30 ECMWF Seminar on Recent development in the use of satellite observations in NWP, 3-7 September 2007
Figure 1: Improving skill of ECMWF operational forecasts due to developments in the data assimilation - forecast system and in the quality of observing system. ERA-15, ERA-40 and ERA-Interim data-assimilation systems represent the state of art in 1995, 2001 and 2006.
An important user requirement for reanalyses is the capability to be able to monitor the climate change. This is achieved by running the reanalysis close to real time in a Climate Data Assimilation System (CDAS) mode. This has been adopted by NCEP and more recently by the Japan Meteorological Agency in extending. The latest ECMWF reanalysis ERA-Interim, Section 8, will also be run in CDAS mode. Whilst this approach provides users with up-to-date data in a conveniently familiar form, if continued too long it results in products of significantly lower quality than would be produced by a replacement reanalysis. In particular a fixed, older analysis system is unlikely to exploit well, if at all, new types of data from the evolving observing system.
Reanalyses are today used extensively to improve understanding of weather and climate, general circulation of atmosphere, long term variability and trends, tele-connections, atmospheric transport, hydrological cycle, surface processes, predictability (daily seasonal) and extreme weather, storm tracking and tropical cyclones. Reanalyses also provide initial states, external forcing and validation data for climate model integrations, ocean models, monthly and seasonal forecasting, chemical transport models and projects such as DEMETER, ENSEMBLES, ENACT, CANDIDOZ.
The paper will describe the observing system from reanalysis perspective, the use and impact of satellite data. The improvements seen in ERA-Interim will be demonstrated. It will be shown that the reanalysis products during satellite periods have markedly higher quality than during the pre-satellite period.
2. Observational input to ERA-40 reanalysis The global reanalyses so far have concentrated on the periods with enough digitized upper air data. ERA-40 was started in 1958, the International Geophysical Year (IGY), when upper air measurements at the main synoptic hours (00, 12 UTC) first became available. The coverage of the northern hemisphere by radiosondes is relatively good and to a large extent uniform from 1958 onwards, and their quality gradually improves

UPPALA, S.: USE OF SATELLITE DATA IN REANALYSES
ECMWF Seminar on Recent development in the use of satellite observations in NWP, 3-7 September 2007 31
over time. Even though the number of radiosondes decreased in the 1990s, the overall quality of the observing system has improved due to increases in satellite radiance data, winds deduced from successive images recorded by geostationary satellites, and winds and temperatures from commercial aircraft. The contribution of the fixed ocean weather ships (locations shown in Figure 2) to the observing system over the North Atlantic and North Pacific was important before 1979 until made redundant by the introduction of satellite data.
Figure 2: Frequency of radiosonde reports in 2001. Solid circles denote stations from which at least three reports are available every 2 days on average, open circles denote other stations reporting at least once every 2 days, and small dots represent stations reporting at least once per week. Red rectangles indicate the locations of historical Ocean Weather Ships. Ship “Mike” (M) off the Norwegian coast the only still operating.
All sources of input data conventional, satellite and reprocessed data for ERA-40 are schematically presented in Figure 3. The conventional data originate from various experiments and operational archives, for a detailed list see Uppala et. al (2005, Appendix B).
Figure 3: The observing system components in ERA-40 reanalysis.

UPPALA, S.: USE OF SATELLITE DATA IN REANALYSES
32 ECMWF Seminar on Recent development in the use of satellite observations in NWP, 3-7 September 2007
In 1972, the first polar orbiting satellite carrying an instrument (VTPR) that sounded through the depth of the troposphere and stratosphere was launched. In 1979, the year of the global weather experiment (FGGE, WMO 2004), an observing system comprising two polar orbiting satellites with microwave and infrared sounding instruments and five geostationary weather satellites was introduced. In the southern hemisphere and in the Tropics over the large ocean areas, and over the Antarctic, Africa and South America, the conventional observing system alone is not sufficient to produce high-quality analyses. Therefore, the year 1979 brings a more dramatic improvement in the quality of analyses in the southern hemisphere than in the northern hemisphere. This system proved successful and became a long-term component of the global observing system with further significant upgrades in 1987, 1991 and 1998. In recent years there has been a large increase of advanced scanning and limb radiometers, which not only measure the dynamic and hydrodynamic parameters, but also the greenhouse gases and atmospheric constituents high up to the mesosphere for monitoring and data-assimilation purposes.
The evolving observing system, the availability of observations and the analysis methods used form the basis for the quality of the assimilated products, both for traditional climate analysis and for dynamical climate reanalysis. Externally produced sea-surface temperature and sea ice data sets are important components in reanalyses, since they interact through the model physics with the data-assimilation. They have better quality and higher time resolution during the period of satellite observations from 1981 onwards.
3. Use of satellite data: ERA-15 ERA-40 The evolution of analysis schemes has evolved during the satellite era 1979 onwards together with the advances in technology; computing resources and mass storage system. The volume of satellite data in its full resolution in the early days was much beyond the capacity of the old mass storage systems. The real-time operational use of satellite data therefore had to be done after filtering the information to lower horizontal resolution. The statistical retrieval step from radiances to temperature and humidity soundings was done in the pre processing of the data independent from the model background. In the later development phase the physical retrieval technique made use of the assimilating model background and the latest versions used variational methods. The statistical Optimum Interpolation (OI) analysis, Lorenc (1981), used operationally at ECMWF during 1980’s and early 1990’s, was also used in ERA-15, and satellite sounder data was used as 1D-Var retrievals (Eyre et al. 1992).
ERA-40 used the First Guess at Appropriate Time (FGAT) version of the variational 3D-Var analysis method with a six hour analysis window and a T159L60 model. It obtains the analyses at 00, 06, 12 and 18 UTC by minimizing iteratively (until convergence) the distance of the current model state (all model variables) to the observations and to the background (or “first guess”). The background +9h forecast starts from the previous analysis and observations ± 3h around the analysis time are used. The distance to the background is calculated at the time of observation (FGAT), which is especially important for satellite data but also for other asynoptic observations such as aircraft data and the drifting sea-surface instruments.
The principal change from ERA-15 in ERA-40’s use of satellite data was its direct variational assimilation of raw radiances, in which basic model variables were adjusted to improve jointly the fits of simulated ‘model equivalent’ radiances to measured radiances, and the fits of the model to other types of observation. Radiances from the VTPR, HIRS, MSU, SSU and AMSU-A instruments were assimilated in this way, following the approach implemented operationally for assimilation of data from AMSU-A, MSU and a small number of HIRS channels (McNally et al. 1999, 2000). AMSU-A provides microwave temperature-sounding data with greater vertical resolution than MSU, but has been flown only since 1998. The operational raw-radiance assimilation scheme was thus extended for ERA-40 to process data from additional HIRS channels

UPPALA, S.: USE OF SATELLITE DATA IN REANALYSES
ECMWF Seminar on Recent development in the use of satellite observations in NWP, 3-7 September 2007 33
to provide extra tropospheric resolution, and from the SSU (Pick and Brownscombe 1981) to provide stratospheric coverage. This was the first time the SSU radiances had been used in multivariate data assimilation. The use of the additional HIRS data also compensated for the absence of microwave humidity data prior to the launch of SSM/I in 1987.
In contrast, ERA-15 assimilated temperature and humidity profiles below 100 hPa that were mostly generated by a 1D-Var physical retrieval of pre-processed HIRS and MSU radiances that had been adjusted to a nadir view and cloud-cleared by NOAA/NESDIS. Above 100 hPa it used the operational temperature retrievals produced by NOAA/NESDIS, except within the tropical band from 20oN to 20oS where no satellite data were used (Gibson et al. 1997).
In ERA-15 new satellite bias adjustments had to be calculated at the end of each month and applied the following month. In ERA-40, the bias tuning for each channel was much more stable. In most cases a single bias adjustment was applied for the lifetime of a satellite. Establishment of the adjustments for a new satellite was more straightforward when there was an overlap between satellites, as this allowed data from the new instrument to be monitored passively in the assimilation alongside the old, and the adjustments determined, prior to active assimilation of the new data.
Differences in bias from one satellite to the next could be quite substantial. For example, the global-mean adjustment applied to brightness temperatures from channel 4 of the MSU instrument was about 1.5 K for the NOAA-11 satellite and 0.2 K for NOAA-12; the difference in these adjustments is of the same order of magnitude as the warming seen in the MSU-4 measurements due to the eruption of Mt Pinatubo, which occurred at the beginning of the lifetime of NOAA-12 in mid-1991, Figure 4.
Figure 4: Departure of background simulated brightness temperatures for MSU Channel-4, without bias correction (blue) and with bias correction (red), from the NOAA-11 (upper) and NOAA-12 (lower) satellites. The measured brightness temperature anomaly as seven day moving averages is shown in black.
Several factors contributed to the stability of the bias adjustment in ERA-40. The method of determining adjustments was better. Scan-angle corrections were made latitudinally dependent, and background fields instead of radiosonde measurements were used as predictors of air-mass-dependent biases, with regression coefficients determined from background values close to radiosonde stations (Harris and Kelly 2001). The

UPPALA, S.: USE OF SATELLITE DATA IN REANALYSES
34 ECMWF Seminar on Recent development in the use of satellite observations in NWP, 3-7 September 2007
use of level-1c radiances itself reduced the magnitude of scan-dependent biases. Furthermore, it removed the need to change bias corrections in response to changes introduced by NESDIS in its operational production of cloud-cleared radiances and stratospheric retrievals. Satellite height and navigation were taken into account in the ‘forward’ radiative transfer calculation used to produce model equivalents of the measured radiances (Saunders et al. 1999), eliminating the need to adjust explicitly for the main effects of orbital drift.
Deciding when to start and when to stop using data from a particular channel or instrument can be important in re-analysis. The global nature of the coverage by a polar-orbiting satellite means that grossly erroneous data can quickly cause global corruption of analyses. This occurred, for example, in ERA-15 early in November 1986, when tropospheric temperatures exhibited a sudden jump to warmer values in the lower troposphere and colder values in the upper troposphere. This was especially apparent in the Tropics. The sudden changes were caused by a shift in radiances from the MSU-3 channel on NOAA-9, believed to be due to a solar flare. Effects were perpetuated in later ERA-15 analyses, primarily by the monthly bias-adjustment procedure (Trenberth et al. 2001).
Prior to production of the ERA-40 analyses, time series of brightness temperatures from the TOVS and ATOVS instruments were generated for three scan-position bands and six latitude bands, and examined for temporal consistency. A decision whether or not to use data was made accordingly. This was often a straightforward matter, as in the case of the MSU-3 data from NOAA-9 that were blacklisted from 25 October 1986, Figure 5.
Figure 5: Time series of brightness temperatures from MSU channels on NOAA-9 (scan positions 4 to 8) illustrating three types of problems, Hernandez et al. (2004)
It was less clear cut, however, in cases of gradual degradation of data from instruments with significant impact, for example the deterioration of SSU data due to leakage of gas from the pressure-modulated cell. Examples are presented by Hernandez et al. (2004) who also document the decisions that were made for each instrument. In addition to the pre-production data monitoring, the background fits to radiance data were monitored during production, and use of data from a particular instrument or channel was halted in the case of jumps or drifts for which a satisfactory compensatory bias-correction change could not be found.
From August 1987 onwards ERA-40, unlike ERA-15, also assimilated 1D-Var retrievals of TCWV and surface wind speed over sea from SSM/I radiances (G´erard and Saunders 1999). Its assimilation of surface

UPPALA, S.: USE OF SATELLITE DATA IN REANALYSES
ECMWF Seminar on Recent development in the use of satellite observations in NWP, 3-7 September 2007 35
winds over sea from the scatterometers on the ERS-1 and ERS-2 satellites from 1993 onwards is discussed by Isaksen and Janssen (2004). Altimeter data from the ERS satellites were used in ERA-40’s ocean wave analysis (Caires and Sterl 2005). Dethof and Holm (2004) give an account of the assimilation of SBUV and TOMS ozone retrievals.
In an ideal case all reanalyses would use the same observational input. In reality this is hardly true for any data type, but especially the use of satellite data varies between reanalyses, see Figure 6. The data assimilation system, the assimilating model and the use of satellite data explains most of the differences between products from different reanalyses.
Figure 6: Use of satellite data in different reanalyses
The quality of winds from geostationary satellites has improved during years. This can be seen from the observation-minus-background statistics in ERA-15, Figure 6. In preparation for ERA-40 EUMETSAT initiated a project to reprocess satellite image data from Meteosat-2 and Meteosat-3 in order to generate meteorological products using their latest algorithms. The atmospheric motion vectors were produced based on the recalibration of both infra red channels for the period 1982 to 1988.
Figure 7: RMSE of the vector wind, observation-background (red) and observation-analysis (blue), for high level winds 15N-30N in ERA-15 1979-1993 (Uppala 1997)
4. Satellite data impact on the quality of ERA-40 analyses The quality of both analyses and observations can be inferred from the comprehensive statistics of observation-minus-background and observation-minus-analysis differences (the background and analysis fits to data) that have been archived for each analysis time through the ERA-40 period. Figure 8 shows time series of background and analysis fits to surface-pressure measurements from land stations and ships
UPPALA, S.: USE OF SATELLITE DATA IN REANALYSES
36 ECMWF Seminar on Recent development in the use of satellite observations in NWP, 3-7 September 2007
(included in the 12UTC SYNOP and SHIP reports) for the extra tropical northern and southern hemispheres. The background fit in the northern hemisphere is closer, more confined and more stable than in the southern hemisphere. A general improvement in the fit occurs over the period of ERA-40. Changes in data coverage can affect this, as increased coverage in the subtropics, where variance is lower, tends to reduce values in plots such as these in which no area weighting is applied. This probably explains the shift for the southern hemisphere at the beginning of 1967, for example. However, the improvement in the background fit at the end of 1978 is a consequence of the major improvement of the overall observing system mentioned before. It is particularly marked in the southern hemisphere, where a distinct improvement can be seen also at the beginning of 1973 when satellite sounder data (VTPR) were first used. The data fits improve gradually from 1979 onwards, more so for the southern than for the northern hemisphere, and become similar for the two hemispheres by the end of the period. These and other results presented in Uppala et al. (2005) indicate a general improvement over time of the post-FGGE observing system, especially for the southern hemisphere.
Figure 8: Daily values of the root-mean-square background (blue) and analysis (red) fits to 12UTC SYNOP and SHIP measurements of surface pressure (hPa) over the extratropical northern (upper) and southern (lower) hemispheres
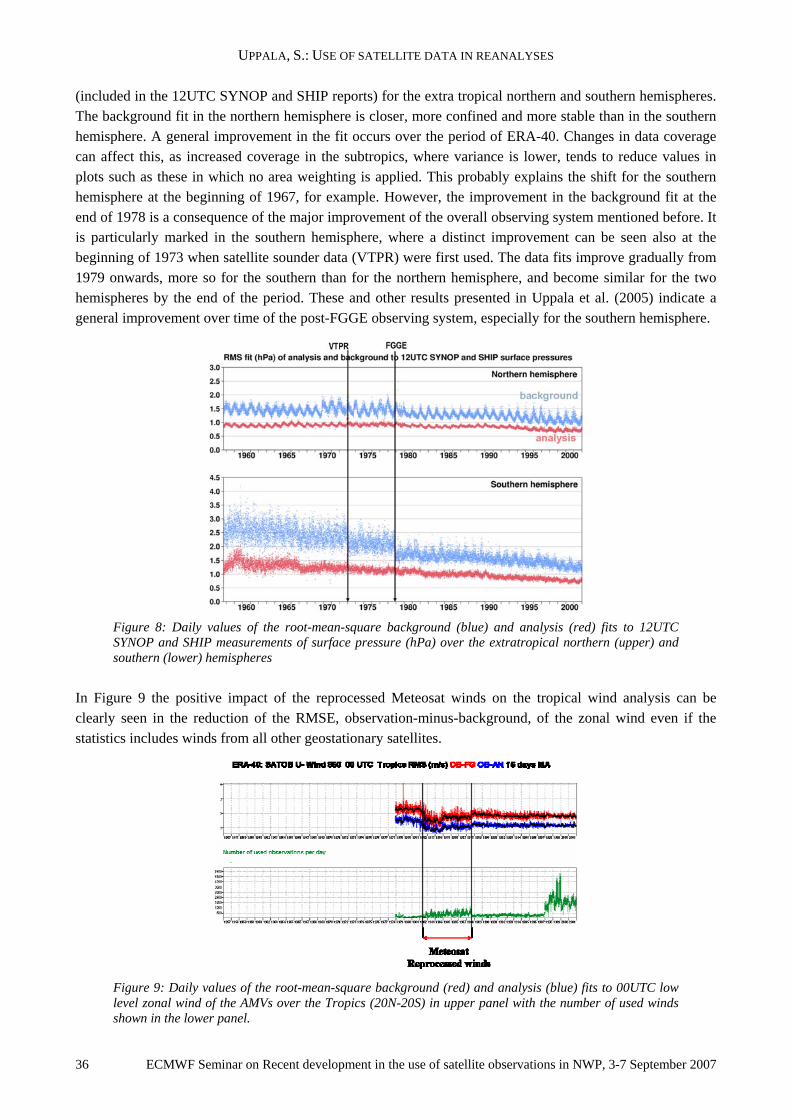
In Figure 9 the positive impact of the reprocessed Meteosat winds on the tropical wind analysis can be clearly seen in the reduction of the RMSE, observation-minus-background, of the zonal wind even if the statistics includes winds from all other geostationary satellites.
Figure 9: Daily values of the root-mean-square background (red) and analysis (blue) fits to 00UTC low level zonal wind of the AMVs over the Tropics (20N-20S) in upper panel with the number of used winds shown in the lower panel.

UPPALA, S.: USE OF SATELLITE DATA IN REANALYSES
ECMWF Seminar on Recent development in the use of satellite observations in NWP, 3-7 September 2007 37
Examination of global mass statistics provides further evidence of improvement over time in the quality of the surface pressure analyses, and indicates a measure of consistency over time of the analysed water content of the atmosphere for the latter half of the reanalysis period (Trenberth and Smith 2005). Prior to 1973 the diagnosed pressure of dry air, which is the difference of mean global surface pressure and mean global water vapour pressure, and should be almost constant in time, shows relatively large fluctuations in ERA-40, with a standard deviation of about 0.3 hPa, and a mean value that is about 0.3 hPa higher than for subsequent years.
Fluctuations are much smaller from 1973 onwards, and smaller still from 1979 onwards. Not only is there a degree of consistency over the final two decades of ERA-40 between the directly analysed annual cycle in net atmospheric water-vapour content and the analysed annual cycle in global-mean surface pressure, there is also a degree of consistency in the analyses of longer-term variations. Trenberth and Smith (2005) include comparisons with the NCEP/NCAR reanalyses. The results from ERA-40 are clearly superior from 1973 onwards.
Santer et al. (2004) show reasonable agreement between estimates of layermean tropospheric and lower stratospheric temperature changes from ERA-40 and independent processings of the microwave radiance record, Figure 10. Before 1979 the lack of stratospheric satellite data causes the lower stratospheric analysed temperatures towards the model state and they cannot therefore be used for estimation of trends. Santer et al. (2004) also show consistent evolution of tropopause height between ERA-40 and climate-model simulations that include anthropogenically influenced change.
MSU-4 data analyzed by Mears et al. (2003)
ERA-40 equivalent from Ben Santer
MSU-4 data analyzed by Mears et al. (2003)
ERA-40 equivalent from Ben Santer
MSU-4 data analyzed by Mears et al. (2003)
ERA-40 equivalent from Ben Santer Figure 10: Time series of global mean monthly anomalies in lower stratospheric temperatures from ERA-40 and from Remote Sensing Systems/ MSU data (Santer et al. 2004)
Satellite radar altimetry measurements (not used in reanalysis) indicate that the East Antarctic ice-sheet interior north of 81.6°S increased in mass by 45 ± 7 billion metric tons per year from 1992 to 2003. Comparisons with ERA-40 snowfall estimates suggest that the gain in mass was associated with increased precipitation (Davis et al. 2005). The agreement between the independent estimate and ERA-40 can be considered as a positive impact of satellite data. The precipitation over polar areas is affected by the radiance assimilation, the moisture over Antarctica is transported by the model from nearby oceanic areas, where the analysis is dominated by satellite data.
Another contribution of satellite data to the quality of ERA-40 analyses can be seen in the statistics of tropical cyclones. Figure 11 indicates the percentage of tropical cyclones detected (POD) in both hemispheres through 1957-2002. POD in the Northern Hemisphere is above 90% throughout the period even during the pre-satellite period helped by strategically important the Ocean Weather Ships. In the Southern Hemisphere POD exceed 90% after 1973, when VTPR radiances were introduced. It is worth noticing that the quality of the best track data used for the validation has also improved during the satellite years.

UPPALA, S.: USE OF SATELLITE DATA IN REANALYSES
38 ECMWF Seminar on Recent development in the use of satellite observations in NWP, 3-7 September 2007
Figure 11: Percentage of detection of tropical cyclones in the Northern (red) and Southern Hemispheres (from M Fiorino)
ERA-40 surface winds and temperatures have been used to estimate low-frequency variations in globally integrated tropical cyclone intensity from 1958 to 2001, Sriver and Huber (2006). The annually integrated power dissipation (PD) is explicitly calculated on a global scale, and results show an upward trend in PD during much of the ERA-40 project period. Comparing the estimated trend in PD with Emanuel's (2005) approximation to PD reveals good agreement after 1978, coinciding with the introduction of the satellites in ERA-40.
5. Impact of satellite data on humidity analysis Hydrological cycle plays a key role in understanding the earth climate system. Satellite estimates of evaporation, clouds and precipitation have brought new understanding of these processes. By assimilating satellite data directly we hope to interpret the data more accurately and that more information can be extracted by the assimilating model. While simulating the data, reanalysis by using the same model over a long period, gives a more homogeneous interpretation of the state of the system earth at each time. The use of humidity sensitive information in data assimilation is developing rapidly and in this sense the current reanalyses represent pioneering experiments, which help to refine the analysis of humidity and the modelling the moist processes for operations and future reanalyses.
As described by John Eyre (in these proceedings) the VTPR instrument introduced into ERA-40 has only one humidity sensitive channel. The impact of all eight VTPR channels on humidity analysis is large and comparable to the impact of HIRS from 1979 onwards as seen in Figure 12 for the Tropical atmosphere. The moistening measured by the Total Column Water Vapour (TCWV) is ~2 kgm-2 compared with the pre-VTPR period. The mean analysis-minus-background increment is positive after the radiance assimilation started and increases slightly in 1987 with the introduction of SSM/I and also 1991 due the Mt Pinatubo effect on the radiance bias tuning. Consequently model precipitation has the same increasing tendency.

UPPALA, S.: USE OF SATELLITE DATA IN REANALYSES
ECMWF Seminar on Recent development in the use of satellite observations in NWP, 3-7 September 2007 39
Figure 12: Tropical mean TCWV (kgm-2) (upper panel), Analysis-minus-background increment (kgm-2) (middle panel) and mean precipitation (mm/day).
Andersson et al. (2004) discuss how the analyses were generally moistened over tropical oceans by the assimilation of satellite data. The infrared VTPR and HIRS data were assimilated only in regions judged to be cloud-free, and SSM/I data were assimilated only in regions judged to be rain-free. Background forecasts in these regions were drier than indicated by the data, and moistening increments resulted. The problem of excessive rainfall arose in part from the way the humidity analysis spread increments in the horizontal, which not only moistened regions that the data indicated were too dry, but also added moisture in neighbouring regions that were already close to saturation, increasing rainfall there. It is also likely that the resulting excess latent heating in moist regions increased the tropical circulation, producing additional drying in regions of descent that in turn led to additional moistening by the data assimilation. As rainfall was enhanced where it tended to occur naturally, the overall patterns of wet and dry regions appear to be realistic, both climatologically and for seasonal anomalies (Betts and Beljaars 2003). The global average, however, shows an unrealistic excess of precipitation over evaporation (Hagemann et al. 2005).
Larger rainfall rates from the second half of 1991 onwards were due in part to effects of volcanic aerosols on HIRS infrared radiances following the eruption of Mt Pinatubo. These effects were not included directly in the forward radiative transfer model used in the variational analysis. Instead they needed to be absorbed into the bias corrections applied to the radiance measurements. This was a particular problem for data from the NOAA-12 satellite as it became operational close to the time Mt Pinatubo erupted. Inadequately corrected infrared radiance biases tend to result in humidity changes in the tropical troposphere, since the relatively low background errors in temperature force analysis changes to be predominantly in humidity. 1991 was a difficult year in this regard because there were no data available from two SSM/I channels, which reduced a control on the humidity analysis. In the light of experience, a revised thinning, channel selection and quality control of HIRS radiances was implemented from 1997 onwards in the first production stream, and this was also used for assimilation of all HIRS data prior to 1989 in the third stream.
The impact of satellite data on the humidity analysis and forecast can also be seen in variations in the 24 h forecast TCWV averaged over tropical oceans and their good correlation with variations in the tropical-mean SST analyses during the period of satellite data 1973 onwards. This is shown in Figure 13, where time series are presented for the whole of the re-analysis period.

UPPALA, S.: USE OF SATELLITE DATA IN REANALYSES
40 ECMWF Seminar on Recent development in the use of satellite observations in NWP, 3-7 September 2007
Figure 13: Monthly averages from 1957 to 2002 of 24 h forecast TCWV (blue; kg m-2; left-hand scale) averaged over tropical oceans, and the mean tropical SST used in ERA-40 (red; K; right-hand scale). The temperature scale is linear in saturation specific humidity for a reference surface pressure of 1013.25 hPa, and chosen to make the mean and standard deviation of the two time series equal for the SSM/I period from July 1987 onwards.
The relatively low values of TCWV occur prior to assimilation of the first satellite data at the beginning of 1973, and the comparison of these values with the SST time series and with TCWV later in the period suggests that the amplitude of the annual cycle of TCWV is underestimated in the early period, with particularly low values from March to May each year. The TCWV time series matches the SST series well from 1973 to 1978, giving some confidence in ERA-40’s extraction of humidity information from the VTPR radiances. TCWV is lower than suggested by SST in late 1979, early 1980 and in 1984, consistent with the comparison with SMMR data, which were not assimilated. The comparison with SST suggests that too dry ERA-40 values extend from 1984 until 1988.
Figure 14: TCWV comparisons: ERA-40 –SSM/I (top left), NCEP-SSM/I (top right), climate model integration HadAM3-SSM/I (bottom left) and ERA-40- SSMR (bottom right). (from Richard Allan)

UPPALA, S.: USE OF SATELLITE DATA IN REANALYSES
ECMWF Seminar on Recent development in the use of satellite observations in NWP, 3-7 September 2007 41
The relative quality of ERA-40/ NCEP reanalyses and a climate model integration by Hadley Center can be seen in Figure 14 (Richard Allan pers. communication) in comparison with independent TCWV estimates from SSM/I in 1988. SSM/I data was only used by ERA-40 reanalyses, SSMR data was not used by ERA-40 or NCEP. TOVS radiances were used by ERA-40, while NCEP used the NESDIS retrievals. The mean error in TCWV seems to be similar and relatively large in NCEP reanalysis and the climate integration, while ERA-40 clearly benefits from assimilation of SSM/I data and also from TOVS radiances proven by the comparison with the independent SMMR data.
The conclusion from the results presented here and (Andersson et al. 2004) is that the assimilation of satellite data improves the water-vapour content over tropical oceans in ERA-40, particularly as depicted by the short-range forecasts. This comes at the expense of high initial precipitation rates and lack of balance between precipitation and evaporation as the forecast model shifts to its preferred, drier state. Bengtsson et al. (2004) concluded, from an observing system experiment for single winter and summer seasons, that the ERA-40 assimilation system was able to generate a credible global hydrological cycle without the use of humidity observations. Whilst the hydrological cycle of the 6 h ERA-40 forecast would have been closer to physical balance from 1973 onwards had humidity observations not been assimilated, this would have been achieved with an atmospheric water-vapour content that was biased low in the Tropics, especially in boreal spring. This has been confirmed by several observing-system experiments.
6. Satellite data impact on the quality of ERA-40 forecasts The skill of daily 10-day 500 hPa forecasts for the period 1958-2001 is presented in Figure 15 for the northern hemisphere and for the Australia/New Zealand region, since over the latter area the verifying analysis has sufficient quality over the whole period in the southern hemisphere. The skill reflects the improving performance of the ERA-40 data assimilation seen in Figure 7. Over the northern hemisphere the combination of the Ocean Weather Ships (before 1980s), satellites (after 1979) and the land based observations have made it possible to produce good quality forecasts throughout the period. We can see the skill improving slowly until 1997, but during the following years we can see the skill drop slightly. The most likely explanation for the drop is not the deterioration of the observing system, but variation in predictive skill, since similar drop was observed in ECMWF operations in 1999 (Simmons and Hollingsworth 2002). In the southern hemisphere the improvement due to the use of satellite data is clear in 1973 and becomes dramatic in 1979, due to improved satellite observations combined with increasing numbers of aircraft and buoy data.
Figure 15: The skill of daily 500 hPa forecasts in the northern hemisphere (left) and in Australia/New Zealand (right) for 1958-2001. Each curve represents a 2-year moving average of the time in the 10-day forecast, when the anomaly correlation drops below a given percentage value; 100-90% with 0.25% interval, from 90% down with 1% interval.

UPPALA, S.: USE OF SATELLITE DATA IN REANALYSES
42 ECMWF Seminar on Recent development in the use of satellite observations in NWP, 3-7 September 2007
The performance of forecasts over the different areas in the northern hemisphere in Figure 16 shows clear improvement especially in short range forecasts due to improving observing system. In South West Europe there is a stepwise increase of skill due to the introduction of both geostationary and polar orbiting satellites in 1979.
Figure 16: As Figure 15 but for South West Europe (top-left), East Asia (top-right), North America (bottom-left) and North Atlantic (bottom-right).
7. ERA-40 assimilation Quality of satellite data Data assimilation offers one of the best tools to quality control the input data. The departure data, observation-minus-background, observation-minus-analysis, the results of the quality control and events during the analysis are recorded and archived. After reanalysis these data can be used to detect biases, instrument drifts and anomalous channel behaviours. Since the quality control procedures are not perfect problems in the data could be, and in many cases have been, absorbed in the analysis affecting the product quality.
By thorough investigation of these data the input for the next reanalysis can be either corrected or correctly used to produce reanalyses with better quality. This has already been done with radiosonde temperatures, where lessons from ERA-15 have been used in ERA-40 and a homogenization method has been developed using ERA-40 departure data for use in ERA-Interim (Haimberger 2007).
A good illustration of the power the data is the homogenization work done on SSU and AMSU by Shinya Kobayashi and described by Dick Dee in these proceedings. By combining the departure statistics time series and Simultaneous Nadir Overpass method (SNO) inconsistencies in overlapping SSU instruments have been identified. To homogenize the SSU record information characterizing each individual SSU instrument has been collected for the use in the radiative transfer model (RTTOV). SSU-channel-3 and AMSU channel-14 weighting functions have close similarity and by comparing their departures during an overlapping period a

UPPALA, S.: USE OF SATELLITE DATA IN REANALYSES
ECMWF Seminar on Recent development in the use of satellite observations in NWP, 3-7 September 2007 43
problem in modelling of AMSU radiances in RTTOV has been identified and corrected for use in ERA-Interim.
Example statistics are shown in Figure 17 for two bias corrected channels SSU-3 and MSU-4. MSU-4 shows a relatively stable behaviour from instrument to instrument, while SSU instruments show inconsistencies e. g between NOAA-6 and NOAA-7 and NOAA-6 and NOAA-9. Currently work is also going on at NESDIS to recalibrate the MSU data, using SNO technique and an attempt is being made also to recalibrate HIRS data record.
Detailed investigations of satellite data in the pre-processing phase have also identified anomalous orbital patterns. This information is passed to the reanalyses in so called blacklist describing to the analysis the input data not to use.
Figure 17: Time series of observation-minus-background departures (STD and bias) for SSU Channel-3 (peaks at 1.5 hPa) and MSU-4 (peaks at 90 hPa) over two months (May and June) from each year 1980
2002 and satellite NOAA-6 NOAA-14. Each dot corresponds to a six hour period.
8. ERA-Interim: Improved use of satellite data With limited human resources available from then onwards, effort was devoted to development of a new reanalysis system derived from the latest version of the operational ECMWF system. This new reanalysis system has now started, from January 1989, to produce an interim reanalysis (ERA-Interim) for the data-rich 1990s and 2000s, and continued as an ECMWF Climate Data Assimilation System (ECDAS) until superseded by a new extended reanalysis. The analysis has now reached 2000 and is expected to catch near real-time in the latter part of 2008.
With increased computer power available, the use of 4D-Var, in operations since 1997, became feasible for ERA-Interim. Preparatory experiments were carried out to evaluate 4D-Var, with 6- and 12-hourly cycling, in comparison with 6-hour 3D-Var as used for ERA-40. The tests employed the T159L60 model resolution used for ERA-40, but a newer version of the forecasting system, IFS Cy29r1. Also tested was a new variational bias correction scheme (VarBC) for radiance data. All pointed to a small but systematic edge in favour of 12-hour 4D-Var with VarBC.
Production of ERA-Interim began in summer 2006 with the horizontal resolution of T255. Vertical resolution was kept at the 60 levels used for ERA-40. The latest cycle of the model (IFS Cy31r1/2) was adopted, as introduced operationally in September and chosen for the next version of the ECMWF seasonal forecasting system. The main advances of the ERA-Interim data assimilation over the ERA-40 system are:

UPPALA, S.: USE OF SATELLITE DATA IN REANALYSES
44 ECMWF Seminar on Recent development in the use of satellite observations in NWP, 3-7 September 2007
• 12 hour 4D-Var.
• T255 horizontal resolution.
• Better formulation of background error constraint.
• New humidity analysis.
• Improved model physics.
• Data quality control that draws on experience from ERA-40 and JRA-25.
• Variational bias correction of satellite radiance data, and other improvements in bias handling.
• More extensive use of radiances, and improved fast radiative transfer model
• Assimilation of rain affected SSM/I radiances through 1D-Var
ERA-Interim uses mostly the sets of observations acquired for ERA-40, supplemented by data for later years from ECMWF’s operational archive. Boundary forcing fields are taken from ERA-40 until 2001, and from ECMWF operations for later dates. There are, however, a few exceptions:
• Altimeter wave-heights. A new ERS altimeter wave-height dataset has been acquired from ESA, providing data of more uniform quality than the Fast Delivery Dataset used from August 1991 onwards in ERA-40.
• Winds and clear-sky radiances. EUMETSAT provided reprocessed winds and clear-sky radiances from Meteosat-2 (1982-1988) for ERA-40 and are currently reprocessing later Meteosat data for ERA-Interim.
• Ozone profiles. Reprocessed GOME data from the Rutherford Appleton Laboratory will provide ozone profile information from 1995 onwards.
• Radio occultation measurements. CHAMP GPS radio occultation measurements, processed and archived at UCAR, have been obtained to cover the period from mid 2001 to mid 2006. Subsequent occultation data, from the constellation of CHAMP, GRACE and COSMIC receivers, has been received operationally.
ERA-40 used a scheme for correcting systematic errors in radiosonde temperatures due to short-wave radiation and other effects (Andrae et al. 2004). Using statistics archived from ERA-40 and subsequent operational data assimilation, observation-minus-background time series for individual radiosonde stations have been used to derive a homogenization scheme (Haimberger 2007), in which discontinuities in the mean temperature record due to equipment or data-processing changes are identified and removed. The resulting homogenized radiosonde temperatures are being used in ERA-Interim. The homogenisation does not account for seasonal variations in solar heating, which are dealt with by applying a revised version of the ERA-40 bias correction scheme to the homogenised data.
The altimeter wave height data from the European Remote Sensing satellites ERS-1 and ERS-2 have been compared with buoy measurements and bias corrections have been calculated for use in ERA-Interim. ERS scatterometer data have also been re-calibrated, based on triple collocation with buoy measurements and ERA-40 background 10-metre wind speeds.
Biases in satellite radiances in ERA-Interim are estimated and corrected using the variational bias correction (VarBC) scheme, (Dee 2005). Regression parameters describing the biases for each radiance channel are estimated during the data assimilation by treating them as additional degrees of freedom in the 4D-Var minimisation. This radiance bias correction scheme is adaptive and self-contained, in that it does not require
UPPALA, S.: USE OF SATELLITE DATA IN REANALYSES
ECMWF Seminar on Recent development in the use of satellite observations in NWP, 3-7 September 2007 45
any external information about satellite biases. It performed well in the preparatory experiments for ERA-Interim, and has been used in operations since September 2006. It solves most of the technical problems experienced with manual bias tuning, smoothly corrects bias drifts, handles data gaps, and can quickly develop bias corrections for new sensors. Variational bias correction of radiance data simultaneously with the adjustment of the model state appears to remove many of the detrimental side effects of sub-optimal and/or conflicting bias corrections seen in ERA-40. As a result, the fit to conventional data improves, and the system is able to assimilate larger numbers of observations overall.
ERA-Interim was started by applying bias correction to all channels. This resulted in much warmer, by some 7 to 11 K around 3hPa, upper stratospheric temperatures than in ERA-40. An assessment of uncertainties in climatologies of wind and temperature in the stratosphere and mesosphere by the SPARC (Stratospheric Processes and their Role in Climate) project has shown that the ERA-40 analyses for the early 1990s have an upper stratos-pheric cold bias of up to 5 K compared with the consensus of other climatologies. The warmer mean upper-stratospheric temperatures in ERA-Interim indicate that the bias has shifted from cold to warm for these years, but not changed much in magnitude. The bias correction for the SSU channel-3 (peaks around 1.5hPa) was very large compared with the observation error. ERA-Interim was restarted by removing the bias correction for SSU channel-3, while adaptive bias correction was still applied to all other radiance channels. As the result the upper-stratospheric temperatures were reduced by several degrees Kelvin, but remain higher than in ERA-40, and are now more consistent with other climatologies. The studies of “age of air” in the preparatory assimilations indicate that ERA-Interim will provide much better datasets than ERA-40 for driving models of stratospheric chemical transport and stratosphere/ troposphere exchange, for details see the paper by Dick Dee in these proceedings.
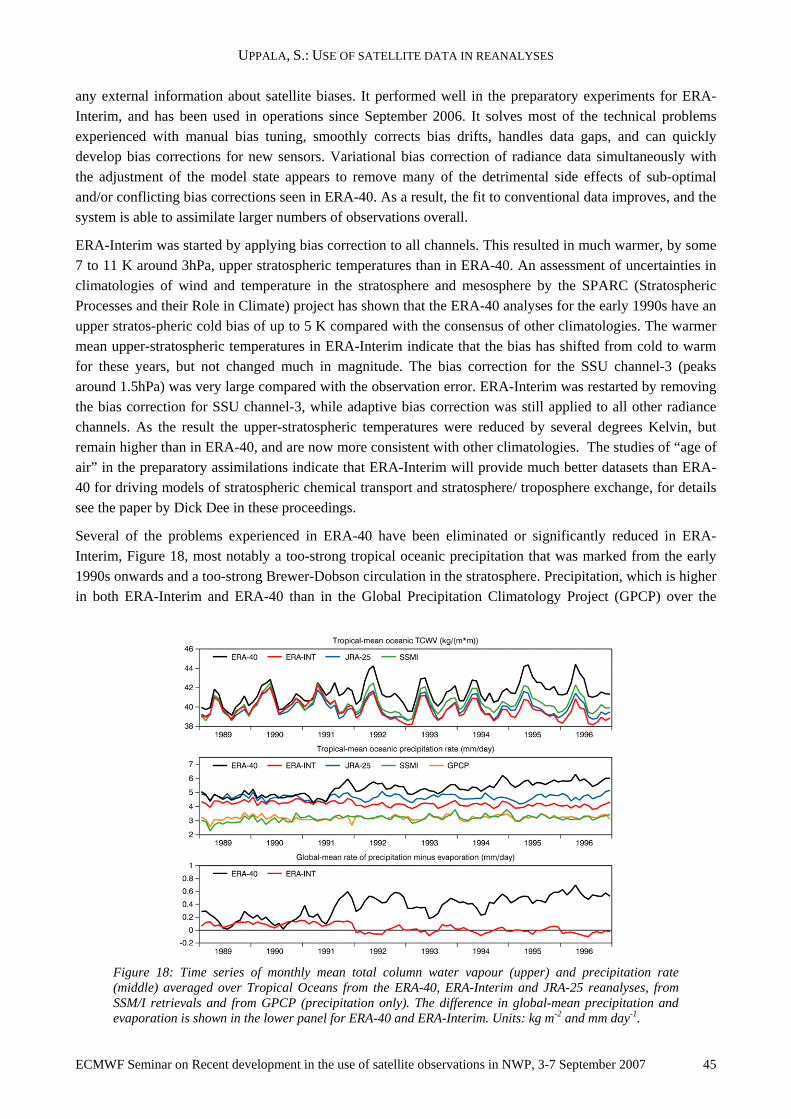
Several of the problems experienced in ERA-40 have been eliminated or significantly reduced in ERA-Interim, Figure 18, most notably a too-strong tropical oceanic precipitation that was marked from the early 1990s onwards and a too-strong Brewer-Dobson circulation in the stratosphere. Precipitation, which is higher in both ERA-Interim and ERA-40 than in the Global Precipitation Climatology Project (GPCP) over the
Figure 18: Time series of monthly mean total column water vapour (upper) and precipitation rate (middle) averaged over Tropical Oceans from the ERA-40, ERA-Interim and JRA-25 reanalyses, from SSM/I retrievals and from GPCP (precipitation only). The difference in global-mean precipitation and evaporation is shown in the lower panel for ERA-40 and ERA-Interim. Units: kg m-2 and mm day-1.
UPPALA, S.: USE OF SATELLITE DATA IN REANALYSES
46 ECMWF Seminar on Recent development in the use of satellite observations in NWP, 3-7 September 2007
tropical oceans, is closer to GPCP in ERA-Interim. ERA-40 and ERA-Interim are nevertheless in closer agreement with each other than either is to the GPCP estimate. Total column water vapour from ERA-Interim is significantly lower than from ERA-40, and closer to the SSM/I product by Remote Sensing Systems. A further indication of improvement of the hydrological cycle in ERA-Interim comes from diagnosis of the global balance of precipitation and evaporation. The excess of precipitation over evaporation seen in ERA-40 is much reduced in ERA-Interim. Precipitation remains higher than evaporation, however, consistent with the indications that rainfall over the tropical oceans is still somewhat too high, notwithstanding uncertainties in the accuracy of the observation-based estimates.
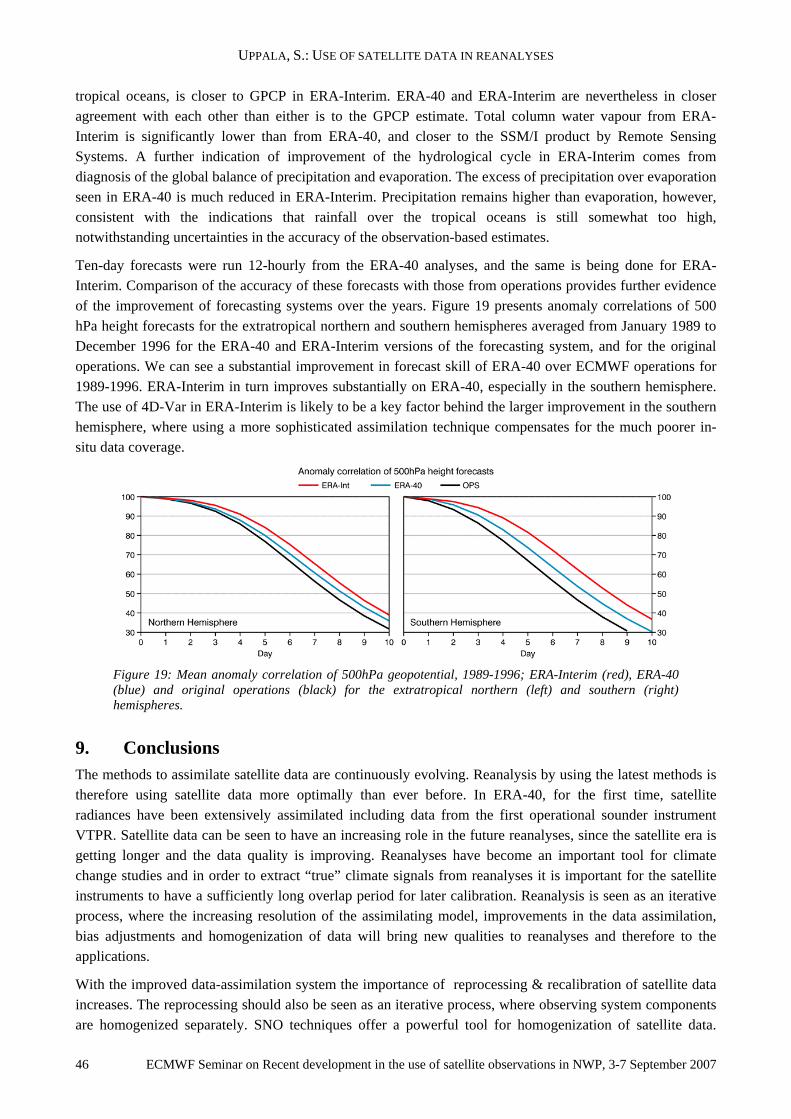
Ten-day forecasts were run 12-hourly from the ERA-40 analyses, and the same is being done for ERA-Interim. Comparison of the accuracy of these forecasts with those from operations provides further evidence of the improvement of forecasting systems over the years. Figure 19 presents anomaly correlations of 500 hPa height forecasts for the extratropical northern and southern hemispheres averaged from January 1989 to December 1996 for the ERA-40 and ERA-Interim versions of the forecasting system, and for the original operations. We can see a substantial improvement in forecast skill of ERA-40 over ECMWF operations for 1989-1996. ERA-Interim in turn improves substantially on ERA-40, especially in the southern hemisphere. The use of 4D-Var in ERA-Interim is likely to be a key factor behind the larger improvement in the southern hemisphere, where using a more sophisticated assimilation technique compensates for the much poorer in-situ data coverage.
Figure 19: Mean anomaly correlation of 500hPa geopotential, 1989-1996; ERA-Interim (red), ERA-40 (blue) and original operations (black) for the extratropical northern (left) and southern (right) hemispheres.
9. Conclusions The methods to assimilate satellite data are continuously evolving. Reanalysis by using the latest methods is therefore using satellite data more optimally than ever before. In ERA-40, for the first time, satellite radiances have been extensively assimilated including data from the first operational sounder instrument VTPR. Satellite data can be seen to have an increasing role in the future reanalyses, since the satellite era is getting longer and the data quality is improving. Reanalyses have become an important tool for climate change studies and in order to extract “true” climate signals from reanalyses it is important for the satellite instruments to have a sufficiently long overlap period for later calibration. Reanalysis is seen as an iterative process, where the increasing resolution of the assimilating model, improvements in the data assimilation, bias adjustments and homogenization of data will bring new qualities to reanalyses and therefore to the applications.
With the improved data-assimilation system the importance of reprocessing & recalibration of satellite data increases. The reprocessing should also be seen as an iterative process, where observing system components are homogenized separately. SNO techniques offer a powerful tool for homogenization of satellite data.

UPPALA, S.: USE OF SATELLITE DATA IN REANALYSES
ECMWF Seminar on Recent development in the use of satellite observations in NWP, 3-7 September 2007 47
Passive radiance assimilation is also useful to identify the relative biases between instruments and possible instrument drifts. Adaptive bias correction method offers technical and scientific advantages for radiance bias correction in the reanalyses. Integration of different bias handling schemes and the monitoring activities should have high priority. Expert system would be very important in the future to detect automatically signals in the atmosphere but also in the instrument behaviour. The radiance departure data from reanalyses is still underutilized and could help to understand instrument problems/ drifts as well as to help the satellite data producers to create metadata for future reanalyses.
Due to the use of satellite data, reanalyses have substantially better and more uniform quality after 1978 especially over the Southern Hemisphere. Todays reanalyses have, in part, reached the level required for climate studies. The trends from ERA-40 agree well with the climate trends from independent analysis of the observed values.
Acknowledgement Reanalyses have been and will also be in the future huge undertakings and I would like to acknowledge the numerous people both from inside and outside ECMWF who are involved or are contributing to the reanalysis activities by, Dick Dee, Shinya Kobayashi, Paul Berrisford, Adrian Simmons, J-N Thepaut, Per Kållberg, Peter Bauer, Jean Bidlot, Claire Delsol, Ioannis Mallas, Carole Peubey Hans Hersbach, Sean Healy, Lars Isaksen, Kållberg, Ulf Andrae, Vanda da Costa Bechtold, Mike Fiorino, Rex Gibson, Jan Haseler, Angeles Hernandez, Graeme Kelly, Xu Li, Kazutoshi Onogi, Sami Saarinen, Niko Sokka, Richard Allan, Erik Andersson, Klaus Arpe, Magdalena Balmaseda, Anton Beljaars, Leo van de Berg, Jean Bidlot, Nils Bormann, Sofia Caires, Frederick Chevallier, Antje Dethof, Milan Dragosavac, Mike Fisher, Manuel Fuentes, Stefan Hagemann, Elias Hólm, Brian Hoskins, Peter Janssen, Roy Jenne, Tony McNally, J-F Mahfouf, J-J Morcrette, Nick Rayner, Roger Saunders, Pascal Simon, Andreas Sterl, Kevin Trenberth, Agathe Untch, Drasko Vasiljevic, Pedro Viterbo, Jack Woollen, Leopold Haimberger, Byoung-Kwon Park and many others from ECMWF and the Member States.
References Andersson, E., Haseler, J., Undén, P., Courtier, P., Kelly, G., Vasiljevic, D., Brancovic, C., Cardinali, C., Gaffard, C., Hollingsworth, A., Jakob, C., Janssen, P., Klinker, E., Lanzinger, A., Miller, M., Rabier, F., Simmons, A., Strauss, B., Thépaut, J.-N. and Viterbo, P., 1998: The ECMWF implementation of three dimensional variational assimilation (3D-Var). III: Experimental results. Q. J. R. Meteorol. Soc., 124, 1831-1860
Andersson, E., Bauer, P., Beljaars, A., Chevallier, F., Hólm, E., Janiskova, M., Kållberg, P., Kelly, G., Lopez, P., McNally, A., Moreau, E., Simmons, A., Thépaut, J.-N. and Tompkins, A., 2004: Assimilation and modeling of the hydrological cycle in the ECMWF forecasting system. Bull. Am. Meteorol. Soc., 86, 387-402
Andrae, U., Sokka, N. and Onogi, K., 2004: The radiosonde temperature bias corrections used in ERA-40. ECMWF ERA-40 Project Report Series, 15, 34pp (Available from: www.ecmwf.int/ publications))
Bengtsson, L., Hodges, K. I. and Hagemann, S., 2004: Sensitivity of large-scale atmospheric analyses to humidity observations and its impact on the global water cycle and tropical and extratropical weather systems in ERA-40. Tellus, 56A, 202-217
Betts, A. K. and Beljaars, A. C. M. 2003: ECMWF ISLSCP-II near-surface dataset from ERA-40. ECMWF ERA-40 Project Report Series, No. 8. (Available from: www.ecmwf.int/ publications)

UPPALA, S.: USE OF SATELLITE DATA IN REANALYSES
48 ECMWF Seminar on Recent development in the use of satellite observations in NWP, 3-7 September 2007
Caires, S. and Sterl, A., 2005: 100-year return value estimates for wind speed and significant wave height from the ERA-40 data.. J. Climate, 18, 1032-1048
Courtier, P., Thépaut J.-N., Hollingsworth A., 1994: A strategy for operational implementation of 4D-Var, using an incremental approach. Q. J. R. Meteorol. Soc., 120, 1367-1387
Davis, C. H., Li Y., McConnell J. R., Frey M. M., Hanna E., 2005: Snowfall-Driven Growth in East Antarctic Ice Sheet Mitigates Recent Sea-Level Rise. Science, 308, 1898-1901 DOI: 10.1126/ science.1110662
Dee, D. P., 2005: Bias and data assimilation. Q. J. R. Meteorol. Soc., 131, 3323-3343.
Dethof, A. and Hólm, E., 2004: Ozone assimilation in the ERA-40 reanalysis project. Q. J. R.Meteorol. Soc., 130, 2851-2872
Emanuel, K., 2005: Increasing destructiveness of tropical cyclones over the past 30 years. Nature, 436, 686-688.
Eyre, J.R. and Kelly, G. and McNally, A.P. and Andersson, E., 1992: Assimilation of TOVS radiance information through one-dimensional variational analysis. ECWMF Technical Memorandum 187 (Available from: www.ecmwf.int/ publications)
Gérard, E. and Saunders, R. W., 1999: Four-dimensional variational assimilation of Special Sensor Microwave/Imager total column water vapour in the ECMWF model. Q. J. R. Meteorol. Soc., 125, 3077-3101
Gibson, J. K., Kållberg, P., Uppala, S., Nomura, A., Hernandez, A. and Serrano, E., 1997: ERA Description. ECMWF ERA-15 Project Report Series, 1, 74pp (Available from: www.ecmwf.int/ publications)
Hagemann, S., Arpe, K. and Bengtsson, L., 2005: Validation of the hydrological cycle of ERA40. ECMWF ERA-40 Project Report Series, No. 24. (Available from: www.ecmwf.int/ publications)
Haimberger, L., 2005: Homogenization of radiosonde temperature time series using ERA-40 analysis feedback information. ECMWF ERA-40 Project Report Series, 23, 67pp (Available from: www.ecmwf.int/ publications).
Haimberger, L., 2007: Homogenization of Radiosonde Temperature Time Series Using Innovation Statistics. J. Climate, 20, 1377-1403
Harris, B.A. and G. Kelly, 2001: A satellite radiance-bias correction scheme for data assimilation. Q. J. R. Meteorol. Soc., 127, 1453-1468
Hernandez, A., Kelly, G.A. and Uppala, S.M. The TOVS/ATOVS observing system in ERA-40. 2004 ECMWF ERA-40 Project Report Series, 16, 49pp (Available from: www.ecmwf.int/ publications)
Isaksen, L. and Janssen, P. A. E. M., 2004: Impact of ERS scatterometer winds in ECMWF\x{2019}s assimilation. Q. J. R. Meteorol. Soc., 130, 1793-1814
Hurrell, J.W. and Trenberth, K. E., 1992: An Evaluation of Monthly Mean MSU and ECMWF Global Atmospheric Temperatures for Monitoring Climate. J. of Climate: 5, 1424-1440.
Kalnay, E., M. Kanamitsu, R. Kistler, W. Collins, D. Deaven, L. Gandin, M. Iredell, S. Saha, G. White, J. Woollen, Y. Zhu, M. Chelliah, W. Ebisuzaki, W. Higgins, J. Janowiak, K.C. Mo, C. Ropelewski, A. Leetmaa, R. Reynolds, and R. Jenne, 1996: The NCEP/NCAR Reanalysis Project. Bull. Amer. Meteor. Soc., 77, 437-471

UPPALA, S.: USE OF SATELLITE DATA IN REANALYSES
ECMWF Seminar on Recent development in the use of satellite observations in NWP, 3-7 September 2007 49
Li, X., Kelly, G., Uppala, S., Saunders, R. and Gibson, J.K., 2005: The use of VTPR raw radiances in ERA-40. ECMWF ERA-40 Project Report Series, 21, 20pp (Available from: www.ecmwf.int/ publications).
Lorenc A.C., 1981: A Global Three-Dimensional Multivariate Statistical Interpolation Scheme. Mon. Wea. Rev., 109, 701-721, DOI: 10.1175/1520-0493(1981)109
McNally, A. P., Andersson, E., Kelly, G. A. and Saunders, R. W., 1999: The use of raw TOVS/ATOVS radiances in the ECMWF4D-Var assimilation system. ECMWF Newsletter No. 83, 2-7.
Oort, A. H. and H. Liu. 1993: Upper-Air Temperature Trends over the Globe, 1958-1989. J. of Climate, 6, 292-307.
Onogi, K., J. Tsutsui, H. Koide, M. Sakamoto, S. Kobayashi, H. Hatsushika, T. Matsumoto, N. Yamazaki, H. Kamahori, K. Takahashi, S. Kadokura, K. Wada, K. Kato, R. Oyama, T. Ose, N. Mannoji, and R. Taira, 2007: The JRA-25 Reanalysis. J. Meteorol. Soc. Japan, 85, 369-432
Pick, D. R. and Brownscombe, J. L., 1981: Early results based on the stratospheric channels of TOVS on the TIROS-N series of operational satellites. Adv. Space. Res., 1, 247-260
Santer, B.D.,Wigley, T.M.L., Simmons, A.J., Kållberg, P.W., Kelly, G.A., Uppala, S.M., Ammann, C., Boyle, J.S., Brüggemann, W., Doutriaux, C., Fiorino, M., Mears, C., Meehl, G.A., Sausen, R., Taylor, K.E., Washington, W.M., Wehner, M.F., and Wentz, F.J., 2004: Identification of anthropogenic climate change using a second-generation reanalysis. J. Geophys. Res., 109, D21104, doi:10.1029/2004JD005075.
Saunders, R. W., Matricardi, M. and Brunel, P., 1999: An improved fast radiative transfer model for assimilation of satellite radiance observations. Q. J. R. Meteorol. Soc., 125, 1407-1425
Schubert, S., C.-K. Park, C.-Y. Wu, W. Higgins, Y. Kondratyeva, A. Molod, L. Takacs, M. Seablom, and R. Rood, 1995: A multi-year assimilation with the GEOS-1 system: overview and results. NASA Technical Report Series on Global Modelling and Data Assimilation, No. 6, M. J. Suarez, ed., NASA, Goddard Flight Center, Greenbelt, MD
Simmons, A. J. and Hollingsworth, A., 2002: Some aspects of the improvement in skill of numerical weather prediction. Q. J. R. Meteorol. Soc., 128, 647-677
Sriver, R. and Huber, M., 2006: Low frequency variability in globally integrated tropical cyclone power dissipation. Geophys. Res. Lett., 33, L11705, doi:10.1029/2006GL026167.
Trenberth, K. E., Stepaniak, D. P., Hurrell, J. W., and Fiorino, M., 2001: Quality of reanalyses in the tropics. J. Climate, 14, 1499-1510.
Trenberth, K. E. and Smith, L., 2005: The mass of the atmosphere: A constraint on global analyses. J. Climate, 18, 864-875
Uppala, S., 1997: Observing system performance in ERA. ECMWF ERA-15 Project Report Series, No. 3. (Available from: www.ecmwf.int/ publications)
Uppala, S.M., Kållberg, P.W., Simmons, A.J., Andrae, U., da Costa Bechtold, V., Fiorino, M., Gibson, J.K., Haseler, J., Hernandez, A., Kelly, G.A., Li, X., Onogi, K., Saarinen, S., Sokka, N., Allan, R.P., Andersson, E., Arpe, K., Balmaseda, M.A., Beljaars, A.C.M., van de Berg, L., Bidlot, J., Bormann, N., Caires, S., Chevallier, F., Dethof, A., Dragosavac, M., Fisher, M., Fuentes, M., Hagemann, S., Hólm, E., Hoskins, B.J., Isaksen, L., Janssen, P.A.E.M., Jenne, R., McNally, A.P., Mahfouf, J.-F., Morcrette, J.-J., Rayner, N.A., Saunders, R.W., Simon, P., Sterl, A., Trenberth, K.E., Untch, A., Vasiljevic, D., Viterbo, P., and Woollen, J., 2005: The ERA-40 re-analysis. Q. J. R. Meteorol. Soc., 131, 2961-3012. doi:10.1256/qj.04.176
WMO, 2004: The global weather experiment: the 25th anniversary. WMO Bulletin Special Issue, 53(3), 289p.

50 ECMWF Seminar on Recent development in the use of satellite observations in NWP, 3-7 September 2007