
University of Bradford eThesis - COnnecting REpositoriesACKNOWLEDGMENTS I am indebted to Dr. Jim...
384
University of Bradford eThesis This thesis is hosted in Bradford Scholars – The University of Bradford Open Access repository. Visit the repository for full metadata or to contact the repository team © University of Bradford. This work is licenced for reuse under a Creative Commons Licence.
Transcript of University of Bradford eThesis - COnnecting REpositoriesACKNOWLEDGMENTS I am indebted to Dr. Jim...

University of Bradford eThesis This thesis is hosted in Bradford Scholars – The University of Bradford Open Access repository. Visit the repository for full metadata or to contact the repository team
© University of Bradford. This work is licenced for reuse under a Creative Commons
Licence.

THE FINANCIAL PERFORMANCE OF SMALL AND MEDIUM SIZED
COMPANIES
"A model based on accountancy data is developed to
predict the financial performance of small and medium
sized companies."
By
Jalal yousif ~armia
T\-Ct^SlS submitted for the degree
of Doctor of philosophy.
POsb - g p ~ d v 4 k 4 S&OO\ of Industrial Technology . - . . -.. . ,- -.
University of Bradford

D E D I C A T I O N
My father
Memory of my mother (R.1.P)
Memory of my wife ~assima (R.1.P)
My son Rody
My daughters Lida and Verva

ACKNOWLEDGMENTS
I am indebted to Dr. Jim Betts, my supervisor for
the help and encouragement that I received throughout all
the stages of this study. I also extend my thanks to Dr.
A. Z. Keller the chairman of the post-graduate school in
the Industrial Technology Department who was always
forthcoming when inspiration was needed.
My appreciation is also extended to Mr. Brian C.
Howlett of the University of Bradford Computer Centre for
his tremendous help in his professional field.
My sincere gratitude and appreciation goes to my
wife Bassima, for her support, encouragement and final
sacrifice, while she was fighting a terrible disease
which unfortunately meant that she left this life before
she was able to see the approval of my higher degree.
I thank my son Rody and my two daughters Lida and
Verva for their forbearance during this research.
However, their repeated admonitions to improve my typing
speed has alone made all the effort worthwhile.
Finally my work was supported by a grant from the
~inistw of Higher Education and Scientific Research of
the 1raqi Government which is fully appreciated.

ABSTRACT
THE FINANCIAL PERFORMANCE OF SMALL AND MEDIUM SIZED
COMPANIES
Jalal Yousif Earmia
Keywords : Financial ratios, Discriminant analysis, .. Company failure, Small-medium companies, Accountancy data, Failure prediction, Z-scores, Financial reporting, ~inancial performance, Trend analysis.
This study is concerned with developing a model to identify small-medium U.K. companies at risk of financial failure up to five years in advance.
The importance of small companies in an economy, the impact of their failures, and the lack of failure research with respect to . this population, provided justification for this study.
The research was undertaken in two stages. The first stage included a detailed description and discussion of the nature and role of small business in the UK economy, heir relevance, problems and Government involvement in this sector, together with literature review and assessment of past research relevant to this study.
The second stage was involved with construction of the models using multiple discriminant analysis, applied to published accountancy data for two groups of failed and nonfailed companies. The later stage was performed in three parts : (1) evaluating five discriminant models for each of five years prior to failure; (2) testing the performance of each of the .five models over time on data not used . i n their construction; (3) testing the discriminant models on a validation sample. The purpose was to establish the "bestn discriminant model. "Bestn was determined according to classification ability of the model and interpretation of variables.
ina ally a model comprising seven financial ratios measuring four aspects of a company's financial profile, such as profitability, gearing, capital turnover and liquidity was chosen. The model has shown to be a valid tool for predicting companies1 health up to five years in advance.

........................................... Dedication i
. . .................................... Acknowledgements -11
............................................. Abstract iii
List of Tables ....................................... x
List of Illustrations ................................ xiv
CHAPTER 1 : Introduction ............................... 1 1.1 The Nature of The Problem ........................ 1
ectives The Study
1.3 Research Methodology ............................. 7 1.4 Justification of The Study ....................... 8
................................ 1.5 Plan of The Study 9
....... -CHAPTER 2 : The Small Business In The UK Economy 11
2.1 Introduction ..................................... 11 2.2 The Nature and The Role of Small Business in
The UK Economy .................................. -11 2.2.1 The Importance of a Small Business ........... 12 2.2.2 The Definition of a Small Business ........... 16
...................... 2.2.3 Types of Small Business 18

.......... 2.2.4 Alternative Forms of Small Business 21
2.2.5 The Informal Economy ......................... 22 2.3 Government Involvement In The Small Business
Sector ........................................... 23 2.3.1 ~ecommendations of The Wilson Report ........ -25 2.3.2 Government Initiatives to Assist
Small Finns .................................. 30 2.3.3 The View as Seen by a Firm of Private
Management Consultants (P A Management) ...... 32 2.3.4 The Essex Business Centre .................... 34 2.3.5 Zones of Freedom ............................. 35
2.4 Finance And The Small Business ................... 36 2.4.1 Sources of Start up Capital .................. 36 2.4.2 Some Techniques of ~stimatin~ Capital
Requirement ................................. -36 .............................. 2.4.3 Financial Needs 38
2.4.4 The Problem of Raising Finance ............... 44 2.4.5 Venture Capital .............................. 45 2.4.6 Industrial and Commercial Finance
Corporation (ICFC) ........................... 46 2.4.7 Small Business and The Banks ................. 47 2.4.8 Finance for high Technology Ventures ......... 54
CHAPTER 3 : Review of Literature ...................... -62
3.1 Early Univariate Failure Analysis ............... -62 3.2 ~ultivariate Analysis of Company Failure ......... 70 3.3 S m T y ......................................... 100

3HAPTER 4 : Research Methodology ....................... 105 .................................... 4.1 Introduction 105
......................... 4.2 Statistical Methodology 106
4.2.1 Model Derivation ............................ 112 ....................... 4.3 variable selection Method 113
4.3.1 The Forward Selection Variables ............. 114 4.3.2 The backward Elimination method ............. 114 4 . 3 -3 Stepwise Selection of .Variables Based
on Wilks' Lambda ............................ 115 4.4 Model Validation ................................. 118 4.5 Assumptions of Discriminant ~nal~sis ............ 120 4.5.1 Distribution of The Data .................... 120 4.5.1.1 Chi-square Test ......................... 121 4.5.1.2 The ~olmorgorov-~rnirnov Test ............ 122
4.5.2 Tests for ~ultivariate Normality of the
Data ........................................ 125 4.5.3 Tests for Equality of the Variance. . .
Covariance Matrices ......................... 127 4.5.4 Problems of Deviation From Multivariate
Normality and Non Equality of the
. Variance Covariance Matrices ................. 130 .................. 4.5.4.1 Multivariate Normality 131
4.5.4.2 Unequal Dispersion Matrices ............. 132 4.6 Sample ~esign ..........................,.....J 35
...................... 4.6.1 The source of The Data 135
...... 4.6.2 Criteria For Inclusion In The Analysis 136

vii
............................ 4.6.3 Sample Selection 137
............... 4.6.4 Selection of Financial Ratios 139
4.6.5 Extraction of The Data ...................... 140
UPTER 5 : Published Accounts as a Reliable
...................... Source of Information 146
..................................... 5.1 Introduction 146
5.2 The Development of the Annual Reporting
in the UK ....................................... 147 5.3 The Objectives of Financial Reporting .....:..... 161 5.4 Users of Company.Accounts. ...................... 169 5.5 he Characteristics of Company Annual Reports ... 174 5 . 6 imitations of Published Accounts ............... 181
5.6.1 Methods of Depreciation and Valuation
of Inventories ............................. -183 5.6.2 Inflation ................................... 187
.... 5.6.3 The Probability of Bias on Certain Items 195
HAPTER 6 : Results and Interpretation
of the Research ........................... 199
6.1 Introduction .............................. ...... 199 6.2 General Characteristics of
the Sample Companies ............................ 199 .............. . 6.3 Results of The Discriminant Models 211
.......... 6.3.1 Evaluating the ~iscriminant Models 212

viii
6.3 .2 Testing the Performance of Discriminant
............................ Models over ~ i m e 216
6.3.3 Testing the Discriminant Models on the
Validation Sample ........................... 219
6 .4 General Trends of Financial Ratios Entering
Models One and Two Years Prior to Failure ....... 229
6 .5 The Performance of DFY2 on
the Validation Sample ........................... 252
6 . 5 . 1 Ex-post Analysis of the Performance
of the Model ................................. 254
6.5.2 The Performance of Univariate Analysis
in Identifying Failed Companies ............. 255
6 .5 .3 Multivariate Versus Univariate Analysis ..... 259
6 .5 .4 An Analysis of the Performance of DFY2
on Nonfailed Companies ....................... 2 9 1
CHAPTER 7 : Summary and Conclusions ................... 326
7 . 1 S-q ......................................... 326
7 . 2 Conclusions ..................................... 328
7 .3 Recommendations for Further Research ............ 3 3 1

A : Computation of the Discriminant Equation ...... 332
B : Critical Values of D, in the Kolmorgorov-Smirnov Test................... . ..336
C : Financial Ratios Used to Construct the Discriminant Models ...........................337
D : The Transformations Used for the Financial Ratios . . . . . . . . . . . . . . . . . . . . . . . . . . . . . . 3 3 8
E : Definition of the Components of the Financial Ratios used to Construct the Discriminant Models ........................................339
F : List of Failed Companies Comprising ........................... the Analysis Sample 341
G : List of Nonfailed Companies Comprising the Analysis Sample . . . . . . . . . . . . . . . . . . . . . . . . . . . 3 4 3

Table No. Page
2.1 Definition of Small Companies According
to Bolton and Wilson Report .................. 19
2 .2 Number of Small Businesses in 1983..... ...... 20
3.1 Financial Ratios Used in Selected Failure
Studies ..................................... 101
3.2 Specific Financial Ratios Used in Selected Failure studies ............................. 104
5.1 Topics Dealt With by Accounting Standards Committee (ASC) ................. ..I54
6.1 Means, Minimum, and Maximum Total, Assets
for the Sample ............................. -200
6.2 Changes in the Proportion of Assets Relative to Total Assets for Failed and
Nonfailed Companies.. ........ .....-........ -203 6.3 Distribution of Current and Fixed Assets
Relative to Total Assets Percent for Failed and Nonfailed companies ............-. 206
6.4 Distribution of Inventory, puick Assets and Fixed Assets Relative to Total ~ssets
Percent for Failed and Nonfailed Companies..207
6.5 Changes in Proportion of Liabilities and Equity,Relative to Total Assets for Failed
and Nonfailed Companies ..................... 210

6.6 Results of Discriminant Models......... ..... 214
6.7 Results of Testing the Performance of
Discriminant Models Over Time..... .......... 218
6.8 A list of Failed Companies Used to Validate
the Discriminant Models......... ............ 222
6.9 % of Classification Results Based on
Validation Sample ........................... 223 6.10 The contribution of Each Financial Ratios
in the "Bestn Discriminant Mode1............227
6.11 The Differences in Means of Financial
. Ratios Which Entered the "Best'
Discriminant Model.........:................228
6.12 Means of selected Financial Ratios for
Failed Companies ................... .........231 6.13 Means of Selected Financial' Ratios for
Nonfailed Companies ......................... 232
6.14 Value of Relevant Financial Ratios *lo0
for Company Ellenroad Mill .................. 262 6.15 Value of Relevant Financial Ratios *lo0
for Company Metamec Jentique ................ 265 6.16 Value of Relevant Finandial Ratios *I00
for Company Spencer (George) ............,... 268
6.17 Value of Relevant ~inancial Ratios *I00
for Company W1ribbons Holdings .............. 271

xii
6.18 Value of Relevant Financial Ratios *lo0
for Company Allen (W.G.) & Son (Tipton) ..... 274
6.19 Value of Relevant Financial Ratios "100 ............ for Company Cocksedge (Holdings) 277
6.20 Value of Relevant Financial Ratios *lo0 ............... for Company Herman Smith.... ;280
6.21 Value of Relevant Financial Ratios *lo0
for Company Lifecare International..........283
6.22 Value of Relevant Financial Ratios *lo0
for Company Nova (Jersey) Knit...... ........ 286
6.23 Value of Relevant Financial Ratios *I00
................... for Company Castle (G.B.) 289
6.24 Value of Relevant ~inancial Ratios "100
for Company Breedon and Cloud Hill
Lime Works .................................. 297 6.25 Value of Relevant Financial Ratios *lo0
for Company Bruntons (Musselburgh) ......... -300
6.26 Value of Relevant Financial Ratios *lo0
for Company Elbief......................-...303
6.27 Value of Relevant Financial Ratios *lo0
for Company Friendly Hotels.... ............ -306 6.28 Value of Relevant ~inancial Ratios *I00
... for Company Gnome photographic Products.. 309

xiii
6.29 Value of Relevant Financial Ratios *I00
for Company Harvey and Thompson ............. 312
6.30 Value of Relevant Financial Ratios *I00 for Company High Gosforth Park...... ........ 315
6.31 Value of Relevant Financia1;Ratios *lo0
for Company Ransom (William) and Son.. . . . . . .318
6.32 Value of Relevant Financial Ratios *I00
for Company Rivoli Cinemas. ................. 321
6.33 Value of Relevant Financial Ratios *loo'
for Company Wpp Group ...................... .324.

xiv
ligure No.
4 . 1 Two-Group Discriminant Analysis . . . . . . . . . . . . . 1 1 0
4 .2 A sample and Theoretical Distribution of x . . 1 2 4
6 . 1 Changes in the Proportion of Assets
Relative to Total Assets for Failed and ........................ Nonfailed Companies -202
6 .2 Distribution of Current and Fixed Assets
Relative to Total Assets percent for
Failed and Nonfailed Companies 205 . ..............
6.3 Changes in Proportion of ~iabilities and
Equity Relative to Total Assets for Failed
.................... and Nonfailed Companies -209
6.4 Plot of Mean Net Income to Total Assets
Ratio * 100 for Failed and Nonfailed
Companies ...................................233
6 .5 Plot of Mean Net Income to Net Worth
Ratio * 100 for Failed and on failed Companies . . . . . . . . . . . . . . . . . . . . . . . . . . . . . . . . . . . 2 3 4
6 . 6 Plot of Mean EBIT to Total ~ssets
Ratio * 100 for Failed and Nonfailed companies ..................................236

6.7 Plot of Mean Net Income to Total Liability
Ratio * 100 for Failed and Nonfailed Companies .................................237
6.8 Plot of Mean Total Liabilities to Total
Assets Ratio * 100 for Failed and Nonfailed Companies .................................:.239
6.9 Plot of Mean Net Worth to ~otal ~iability
Ratio * 100 for Failed and Nonfailed Comanies ..................................241
6.10 Plot of Mean Sales to Net' Worth Ratio *lo0
......... for Failed and Nonfailed Companies 243 , I k
6.11 Plot of Mean Sales to Total Assets
Ratio * 100 for Failed and Nonfailed ................................... Comanies 245
6.12 Plot of Mean Sales to Fixed Assets
Ratio * 100 for Failed and Nonfailed Cowanies ................................-'246
6.13 Plot of Mean Inventory to Sales
Ratio * 100 for Failed and onf failed Companies .................................. 248
6.14 Plot of Mean Quick Assets to Total Assets
Ratio * 100 for Failed and onf failed .................................. Comanies 250
6.15 Plot of Mean Working Capital to Total ~ssets' Ratio * 100 for Failed and Nonfailed
.................................. Companies 251
6.16 scores for Company Ellenroad Mill...... ... 261

6.17 Relevant Financial Ratios for Company .............................. Ellenroad Mill 263
4.18 Zscores for Company Metamec Jentique ........ 264
6.19 Relevant Financial Ratios for Company ............................ Metamec Jentique 266
6.20 Zscores for Company Spencer (George) ........ 267
6.21 Relevant Financial Ratios for Company
............................ Spencer (George) 269
6.22 Zscores for CompanyWgribbons Holdings ....... 270
6.23 . Relevant Financial Ratios for Company
for Company Wgribbons Holdings .............. 272
6 -24 Zscores for Company Allen (W.G. ) & Son
(Tipton) .................................... 273 6.25 Relevant Financial Ratios for Company
Allen (W . G. ) & Son . (Tipton) ............... .' -275
.... 6.26 Zscores for Company Cocksedge (~oldings) 276
6.27 . Relevant Financial Ratios for Company
........................ Cocksedge (Holdings) 278
6.28 Zscores for Company Herman Smith ............ 279
6.29 Relevant Financial Ratios for Company Herman Smith ................................ 281
6.30 Zscores for Company Lifecare International .. 282 .

xvii \
6.31 Relevant Financial Ratios for Company .
................... Lifecare International... 284
.... 6.32 Zscores for Company Nova (Jersey) Knit.. 285
6.33 Relevant Financial Ratios for Company
Nova (Jersey) Knit..... ..................... 287
6.34 Zscores for Company Castle (G .B. ) .......... -288
6.35 Relevant Financial Ratios for Company , . Castle (G.B.) .............................. 290
6.36 Zscores for Company Breedon and Cloud '
Hill Lime Works....................,.,.....296
6.37 Relevant Financial Ratios for Company
Breedon and Cloud Hill Lime Works..........298
6 -38 Zscores for Company Bruntons
(Musselburgh) ............................. .299
6.39 Relevant Financial Ratios for Company
................ Bruntons (Musselburgh)..... 301
6.40 Zscores for Company Elbief ................. 302 6.41 Relevant Financial ~atios for Company
Elbief ................................... ..304
6.42 Z S C O ~ ~ S for Company Friendly Hotels,.... ... 305
6.43 Relevant Financial Ratios for Company Friendly Hotels..........................-.307
xviii
6.44 Zscores for Company Gnome Photographic Products .................................... 308
6.45 Relevant Financial Ratios for Company ................. Gnome Photographic Products 310
6.46 Zscores for Company Harvey and Thompson ..... 311
6.47 Relevant Financial Ratios for' Company ......................... Harvey and Thompson 313
...... Zscores for Company High Gosforth Park 314
Relevant Financial Ratios for Company
High Gosforth Park .......................... 316 6 -50 Zscores for Company Ransom (William)
and Son ..................................... 317
Relevant Financial Ratios for Company
Ransom (William) and Son .................... 319
. 6.52 Zscores for Company Rivoli Cinemas .......... 320 6.53 Relevant Financial Ratios for . Company
Rivoli C i n m s .............................. 322
6.54 Zscores for Company Wpp Group ............... 323
6.55 Relevant Financial Ratios for Company
Wpp Group ................................... 325

INTRODUCTION
In recent years the small company sector has become
an increasingly , interesting subject to most western
governments. This is primarily because it has been seen
as having an increasingly important role to play in'
new products and employment opportunities.
i s now widely believed that small companies contribute to \
the economy by increasing the,level of competition in the
economy through competing with large companies and
~roviding inputs to large companies in world markets.
Birch (1979) found in his study of the Dun .and Bradstreet
data files that 66 percent of the increase in .employment
i n the United States between' 1969 and 1978 was generated
by companies employing twenty or fewer employees, and
fifty Percent of these jobs were by independent small
entrepreneurs.
There are at least 1 1/4 million small firms in the
u . K . They give employment to some 6 million people or
2 5 % of the employed populat,ion, and are responsible for
nearly 20% of the gross national product. (Bolton, 1971).

1 However the poor performance of the U.K. economy in i . I ; -3ecent years has been marked by an upturn of business
gailures in all sectors, but especially in small
.pusiness. Coupled with the current drive by the British
jovernment to promote small businesses, failures have
: pcreased along with successes. The worth of a successful
33~siness is measured by increased emp'loyment' rising with
he continued success and expansion of the business,
+creased profit for investors, and wealth to the economy
jn taxes, and social services. Successful small companies
- Blso provide the base for future key companies. Failures,
powever, cause personal crises, heavy financial losses
pnd wastage. . \
The major factor which distinguishes small companies
. from large is their relatively high probability of
failure. Out of companies which fail within ten years of , .
starting business, 50 percent of failures occur in the
-' f:rst two and a half years, . 33 percent in. the next two
. and a half years, and only 17 percent in the following
five years, Ganguly, (1985) .
st seems there are two important issues related to company - - - - - - - -
failure :
First: how a company gets on to the failure track
and whether it is then possible to prevent
failure.

Second: whether the failure of a company is
predictable prior to the actual event
and what is the probability that any
business on the failure track will fail in
the near future.
Regarding the first issue, the factors that
contribute t o a company's performance can be broadly
divided into two categories; macroeconomic and
microeconomic. At the macroeconomic level, the
performance of a company is linked to all economic
factors, such as the prevailing monetary policy of the
country, 5nvestors1 expectations, the state of the
economy, etc. Once a measurable (quantitative) historical
relationship among a set of explanatory economic
indicators and the performance of a company is
established, and if one is prepared to assume that the
future is an extrapolation of the past, then it is
possible to predict whether a company is expected to
continue or fail in the near future. At the microeconomic
level, a company's performance is believed to be the
result of many internal factors, such as liquidity, level
of inventory, product selection, marketing policy, etc.
These are of course, linked to macroeconomic events.
Therefore, the micro/macro dichotomy is simply a rough
one- Argenti (1976) argues that these micro causes of
failure are attributable to management either directly or
indirectly and he developed a descriptive theory of the
causes and smtoms of failure. Indeed most of the causes

he accounted for are not sufficiently measurable to be
incorporated into a predictive model.
Concerning the second issue which is very relevant
to this study , early researches in this area were of a
univariate nature whereby a single accounting ratio such
as the traditional current ratio (current assets to
current liabilities) was considered in isolation. The
growing realisation that a single ratio could not fully
reflect as company's financial profile, and that a method
of simultaneously dealing with--several ratios could add
significantly to the effectiveness of a . company
bankruptcy prediction model, led to the development of
the multivariate approach. Studies from 1968 onwards have
used multivariate statistical techniques, particularly
@discriminant analysisn . ~ltman (1968) perhaps has been most influential in adopting multivariate discriminant
analysis to bankruptcy prediction. Among the early
studies Taffler (1977) is the only one based on UK data
concentrating on the industrial sector. More recently
~etts (1984) made a significant contribution to the- field
of company failure by incorporated measures of stability
in his model based in U.K. data. In general., small
companies have been neglected somewhat because of the
general paucity of financial information available on
them. ~dminster's study (1972) is an exception which was
carried out on American small businesses .and because his
research is very relevant to this study which is based on

small and medium sized companies the His model
discussed in detail in chapter three.
Before attempting to build a model, one should
define "failure". It is however, difficult to define
precisely the point of failure because it encompasses a
wide range of financial difficulties. For example, a
company is regarded as being technically insolvent if it
unable meet its current obligations they fall
due. However, such insolvency may be only temporary and
subject to .remedy. The remedies applicable to a company
can vary in severity according to the degrees of
financial difficulty. If the outlook is hopeless,
liquidation may be the only feasible ., alternative, which
is the end point of the process of failure. ~inancial
failure includes the entire range of possibilities
between the two extremes ; temporary hardship and
liquidation.
Existing empirical studies reflect this problem in
that there is no consensus of what constitutes nfailure"
with definitions varying significantly, and arbitrarily,
across studies. "failuren for this study constitutes
companies which had:
A. entered into receivership; or ,+
B. .gone into voluntary liquidation; or
C . entered into creditors1 liquidation; or
D. been compulsorily wound up by order of the Court
or by Government action.

predictive models which provide early warning signals of
potential failure would enable a company to take
corrective actions, and reduce its risk.
Recent research have dealt with the development of
multiple discriminant analysis models to predict the
: failure of companies based on different accounting and
financial' ratios and other indicators. However, most of
these research studies have dealt with large companies.
In general, small companies have been neglected somewhat
because of the general paucity of financial information
available on them.
The primary objective of the current study is to
identify those accounting and financial characteristics
of small and medium sized companies in the U.K. which are
indicative of success or failure. More specifically, the
objectives of the study are to answer the following
questions:
1 Which specific financial ratios distinguish between
failed and nonfailed small and medium sized U.K.
companies, five years , four years, three years, two
years, one year, prior to failure ?

. -3. Are the financial ratios which predict failure five
years prior to failure the same as those financial
ratios which predict failure closer to the time of
failure ?
.
3 - Is the predictive ability of failure or nonfailure
dependent on the number of years prior to failure
for which the data is obtained ?
. .
- &. Which discriminant model among the five perform .the
bestn over time.
This study was restricted to a sample of identified
failed companies selected from an Exstat Tape available
at the University of Bradford and supplied " by Extel
statistical Services Limited for the period 1975-1982.
. he selection of independent variables was limited to
those accounting and financial ratios used in previous
studies. Multiple discriminant analysis was 'used to
develop a model because of its proven results for
problems of this nature. The ratios were selected based
on results ' of previously published failure studies,
financial and accounting textbooks.
The data for computing the financial ratios for both
failed and nonfailed companies were obtained from the
Exstat Tape which is 'in a computer readable form. The

total sample consisted. of 30 failed companies and 80
onf failed companies that had the same industrial
classification and total assets not exceeding E l 0
pillion. Multiple discriminant analysis was used to
identify the financial ratios which best predicted the
failed and nonfailed companies in the sample. More
detailed discussion of the research methodology will be
presented in chapter 4.
With small and medium size companies being the
1 backbone of the economy providing the modal number of the
jobs in the country, building a model capable of
providing early warning signals of impending failure
would be of significant value. The greatest value would
be derived by interested individuals and companies who
Dave .business relationships with potentially failing
' companies.
~f a company could determine far enough in advance, that
financial probl6ms which if left unchecked would lead to
failure in the near future, it could initiate corrective
action before the credibility of the company proves
impossible to restore. Once a company loses its
credibility within its business environment and
customers, no amount of money pumped into the company
Mill restore the lost credibility. Thus the secret of
success will be for the company to identify early shifts

its overall performance be£ ore credibility lost.
his identification of impending problems- could perhaps
create sufficient time for the company to ' attempt
solution to its problems. Birch (1979) found that with
each additional year a company stays in business the
chances of failure are reduced. In addition, Birch
concluded that the greatest risk of failure occurs when a
business remains static in comparison to other companies
in the same industry. This indicates the need for a model
to predict failure as early as possible and to enable. the
companies and its management to take corrective action.
Chapter two examines. small business in: the U.K.
economy, the role they play, the particular problems they
have especially with finance and government initiatives
to overcome these problems.
Chapter three presents a discussion of research on
company failure relevant to the present study. In I
addition, some weakenesses of these studies are noted.
able 3.1 summarizes and compares the various financial
ratios used within the references cited.
Chapter four contains an indepth discussion of the
research methodology for this study. The population of
companies is defined, the sample selection is explained . and .the extraction of the data is discussed, together

with a detailed examination of* statistical techniques
used in this study and an explanation of statistical
problems encountered in using discriminant analysis.
Chapter five examines in detail published accounts
as a source of financial data and whether this source of
data gives sufficient quantity and quality information
to assess the financial position of a company.
Chapter six presents. the general. characteristics of
the failed and nonfailed companies, the results of the
discriminant analysis, together with the results obtained
for the validation sample. The chapter also contains
general trends of selected. variables that the research
determined to be important, as well as the trends in Z-
score histories for failed companies in validation
sample.
The conclusions and recommendations, for further
'research are presented in chapter seven.

SMArlTl RUSXWSSGS IN THE U . K. ECQNOMY
Small businesses are very much a subject of current
affairs, generating tremendous enthusiasm within the
business world. 'Because of the controversy involved, much
has already been written about the subject, however, this
chapter contains the relevant issues concerned with the
subject as a whole, as I saw them. The next section,
therefore, is a descriptive account of what they are and
their relevance. The two most important areas of concern
for small businesses, as 1 see the situation, is the
involvement of the government in the small business
sector and the ways in which its assistance is designed,
and the most prevailing problem that of raising finance,
these two issues are outlined and reviewed in. section 2.3
and 2.4.
2 02 NATURE AND ROLR OF SMATtTI RU-SSES IN U.K. ECONOMY:
his section examines the importance of small
businesses in the U.K. economy with special reference to
the findings of the Bolton report (1971), the first major
enquiry into the small firm sector,. and D.J.' Storey's
book '~ntrepreneurship and the New - Firmw, (1982). . The

section then goes on to offer a definition of what is
considered' a small business in the U.K. again with
special reference to the Bolton and Wilson report.
Finally we look at the different types of small business
including a1 ternative f oms such as enterprise workshops,
worker co-operatives and franchising, and what is known
as the Iinfomal economy1.
2.2.1 THE 1-CE OF A SMATlTl BUS-:
The Bolton report ,of 1971 was the first major
enquiry in to the small firm sector, prior to the
appointment of this committee there had never been a
comprehensive study, ,official or otherwise,of the small
firm sector in the UK., it states :
J
We had no doubt from the first that the
future prosperity of the small firm sector was
important matter, its sheer size and
ubiquity are sufficient to ensure that.
There are at least 1 1/4 million small firms in
the U.K., they give employment to some 6
million people or 25% of the employed
population, and are responsible for nearly 20%
of the gross .national product . still more
important than its quantitative contribution is
the fact that the small firm plays .a vital role
in the preservation of a competitive enterprise
system.

We believe that the small firm is in fact an
essential medium through which dynamic change
in the form of new entrants to business , new
industries and new challengers to established
market leaders can permeate the economy. We
therefore believe that in the absence of an
active and vital small firm sector the economy
would ossify and decay ". (Bolton, 1971)
A study ~0mmi.ssioned by the Bolton inquiry, by C.W.
Golby and G. Johns, (1971) 'Attitude and motivation^,
concluded that small business certainly sees itself as
being of special benefit to the customer because there
was a feeling of emotional involvement and a
determination to find a way round difficulties and a
pride in . performance which, it was felt, larger firms
with their rigidity and _-_ bureaucratcy __ .____. -. _ could not equal.
., - . .
"One of the most important contributions of small
business to the community is that of providing a wide
range of choice and a high standard of personal service
to the customer. .....,, Many small firms exist to serve flinority groups, particularly in the service trades,
.:,.. Above all most of us value the personal service
~hich small businesses provide almost as a matter of
course and which large businesses have to' strive, not
always with success,
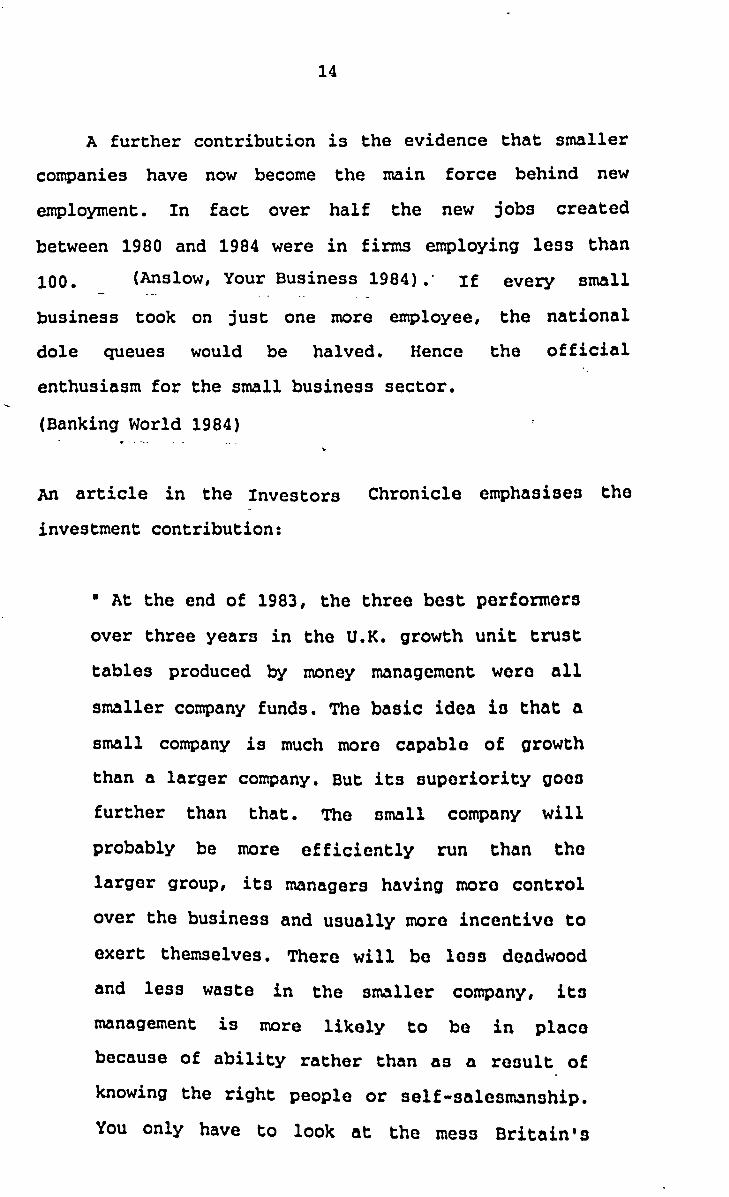
A further contribution is the evidence that smaller
companies have now become the main force behind new
employment. In fact over half the new jobs created
between 1980 and 1984 were in firms employing less than
100. - (Anslow, Your Business 1984) .' ~f every small . -. . . . . . "
business took on just one more eniployee, the national
dole queues would be halved. Hence the official
enthusiasm for the small business sector.
(Banking World 1984)
An article in the Investors Chronicle emphasises the
investment contribution:
a At the end of 1983, the three best performers
over three years in the U.K. growth unit trust
tables produced by money management wero all
smaller company funds. he basic idea i n that a
small company is much moro capablo of growth
than a larger company. ~ u t its auporiority goo0
further than that. he omall company will
probably be more efficiently run than tha
larger group, its managers having moro control
over the business and usually more inccntivo to
exert themselves. There will bo loss deadwood
and less waste in the smaller company, i t o
management is more likely to be in plsco
because of ability rather than as a rosult of
knowing the right people or self-salesnwnship.
You only have to look at the mess Britain's

large companies got themselves into during the
1981-83 recession to see their short comings."
(Investment Chronicle,l984)
Finally D.J. Storey, in his book "Enterpreneurship and
the new firmm, (1982) iists seven major function .which
small firnis are thought to perform :
1. Smaller firms provide a source of
competition (potential or actual) to larger
firms in their industry, limiting the latter's* --
ability to raise prices and/or be technically
inefficient in the use of production . 2. Small firms have been increasingly acclaimed
as major creators of new jobs in developed
countries since standardised products, which
have traditionally been produced in large a
enterprises are now increasingly produced by
developing countries.
3. Small firms are the seed corn from which the
giant corporations of future years will grow.
4. In the developing countries small firms can
co-exist with large foreign owned enterprises
and by using an appropriate local technology,
make a valuable contribution to growth..
5. Smaller firms can provide - a n harmonious
working environment where owner and employer
work, shoulder to shoulder, for their mutual
benefit. This is likely to be reflected in

fewer industrial disputes and lower
absenteeism.
6. The inner city areas of industrial nations
contain heavy concentrations the social
problems of unemployment, low incomes and poor
housing. argued that small firms can make
an important contribution to the regeneration
of such areas.
7. Small firms are likely to be innovative,
being found in industries where technical
development is essential for survival . (Storey 1982)
r It is not easy to define a small business especially
as small * business involve a large range of different
industries. However, some measures may be used to - -- ---_ _ __
distinguish small businesses from large ones'.
The Bolton committee report 1971 (Bolton committee, ' 1971,
p. 3) defined small firms as, those employing less than
200 people for manufacturing , under £50.000 turnover for
retailing and 5 vehicles. or less for road transport . So the Bolton committee used a statistical basis for its
- definition and the committee used different measures for
various industry groups .Quite correctly , they recognize different kinds of business . If we want to measure the size of manufacturing companies , it is quite different
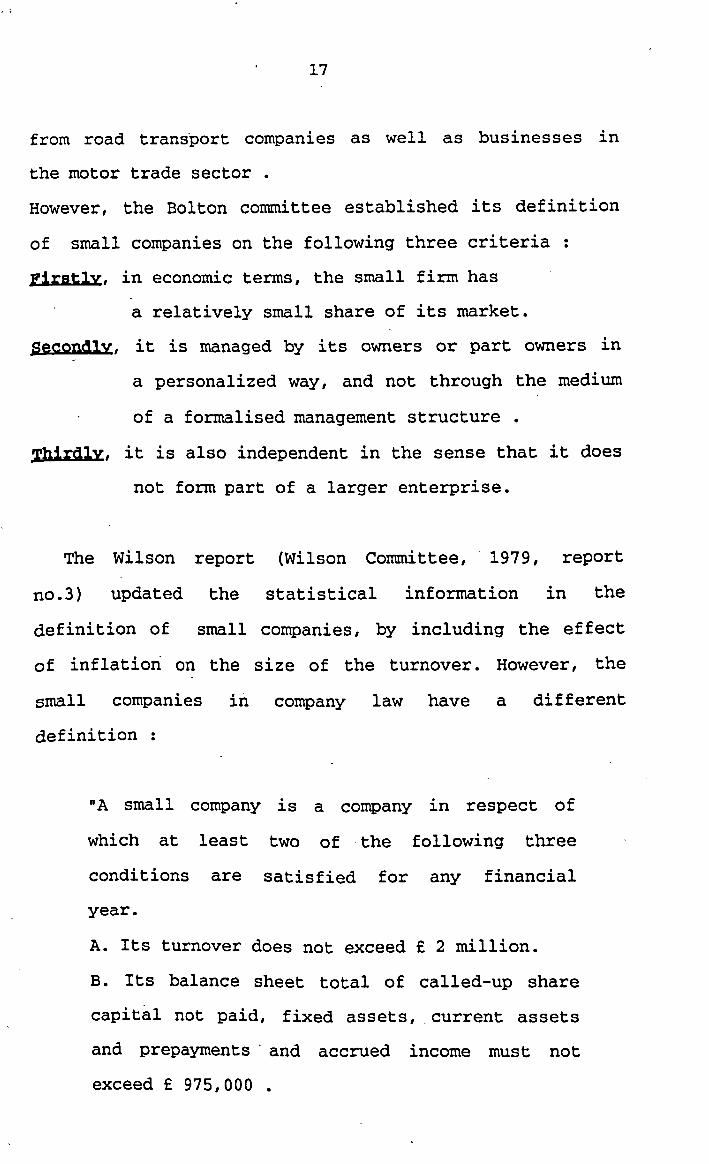
from road transport companies as well as businesses in
the motor trade sector . However, the Bolton committee established its definition
of small companies on the following three criteria :
a, in economic terms, the small firm has
a relatively small share of its market.
Sec-, it is managed by its owners or part owners in
a personalized way, and not through the medium
of a formalised management structure . w, it is also independent in the sense that it does
not form part of a larger enterprise.
The Wilson report (Wilson Committee, ' 1979, report
no.3) updated the statistical information in the
definition of small companies, by including the effect
of inflation on the size of the turnover. However, the
small companies in company law have a different
definition :
"A small company is a company in respect of
which at least two of -the following three
conditions are satisfied for any financial
year.
A. Its turnover does not exceed £ 2 million.
B. Its balance sheet total of called-up share
capital not paid, fixed assets, .current assets
and prepayments ' and accrued income must not
exceed £ 975,000 .

C. The average number of employees, determined
on a weekly basis must not exceed 50.
(Derek A., 1987, p.24.)
The Bolton committee, the Wilson report and company law
(use some similar factors to define the small companies,
which are the size of turnover and the number of . ,
employees but different values of the items are used in
the three definition. (see table 2.1)
It is quite difficult to keep an accurate check on
precisely how many small businesses there are, the
smaller they are the harder it is. The statistics
probably understate small business activity because not
gill the self-employed will necessarily show up in the
,value added tax registrations that are mainly used as the
pase for assessing the small business population. There
$re now two million people classified as self-employed
pnd many must be running probably one-man businesses.
(Harris 1984) . pout half of small businesses are involved in the
penrice sector with retailing outlets the largest single
pegment . gable 2.2 show Figures issued by the Department of Trade
<
P nd Industry's Sector for small businesses in 1983.

!J3muaa
DEFINITION OF SMALL COMPANIES ACCORDING TO BOLTON AND
WILSON REPORT
...................................................... Industry Bolton Wilson
.......................................................
Number of employees
manufacturing 200 or less 200 or less
construction 25 or less 25 or less
mining/quarrying 25 or less 25 or less
Turnover :
retailing .£50,000 or less £185,000 or less
wholesale trades £200,000 or less £750,000 or less
motor trade £100,000 or less £365,000 or less -
miscellaneous 1
services £50,000 or less £185,000 or lese
umber of vehicles:
Road transport 5 vehicles or less 5 vehicles or
less
catering all excluding multiples
and brewery managed public houses

NUMBER OF SMALL BUSINESSES IN 1983
Business Sector Number of small
businesses
Agriculture,
Production
Construction .
Transport 58,000
Wholesale 109,000
Retail 266,000
Finance: property & -
Professional services
Catering.
Motor trades
Other services
TOTAL

2.2.4 ALTERNATIVE FORMS OF SMALL BUSINESS:
F n t e m r i s e W o r w : Enterprise workshops originally
formed part of the 'Job creation Programmea and are run
as part of the special temporary employment programme.
They are intended to become viable businesses in their
own right, and hence to create permanent jobs, within two
years of being set up. The small number of workshops
currently in operation have had a fairly inauspicious
record with only 3 or 4% becoming viable. This is partly
because some have been inadequately designed and managed,
and partly because they are often grossly under financed
in normal business ' terms.
(Wilson report 1979, page 21.)
ves: The majority of worker co-ops
are small service businesses which involve an average of
about 10 members. As the service sector usually requires
less capital, less complex market research, .and less time
to start up, the attractions of the service sector are
obvious. The highest single.group of co-ops is in the
retail, distributive, catering and food processing areas.
(Churchill 1984)
. . anchl-: ranchi is in^-has been rapidly growing in both as a means of expansion for companies
lacking the resources to expand by themselves and as a
peans of entry into business by individuals who want to
enjoy ' the benefits of working for themselves while

limiting some of the drawbacks. It is the second
generation of mbusiness. formatm franchise operations,
where most of the growth is being recorded. These
franchises are usually fast food outlets or services such
as rapid printing or cleaning.
The failure rate of franchises who take on a franchise
offered by an association member is very low and Patrick
Salaun 'franchise manager for Barclays Bank1 points out
that
"so far we have not experienced any bad debtsm.
(Churchill, 1984)
2.2.5 W E INFORMAL ECONOMY:
Mr Pom Ganguly, government statistician with the
~epartment of Trade and Industry, yearly reports on
business birth and death rates. However, the figures used
are based on Inland Revenue Schedule 'Dl returns. The
~conomist Intelligence unit estimate 2.3 million small
businesses, the additional amount being' largely made up
of very small companies, not registered for ' VAT, or
dealing in zero-rated goods; such as undertakers or
opticians. Although costing the U.K. revenue in taxes,
there is another way of viewing the Informal Economy:
"If informal work in the 'cash economy1 is
increasing while 'fofiaalU employment declines, this could
provide new avenues for small business formation and
growth.' It has further been suggested that this trend is
further encouraged by the increasing burden of state
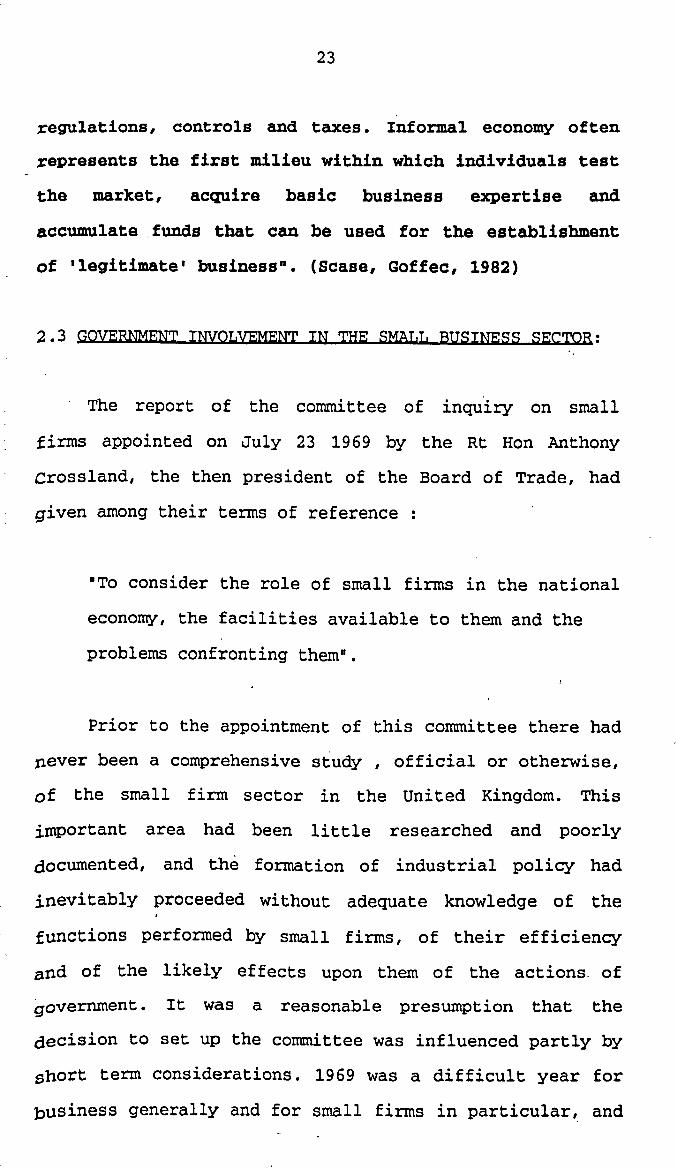
regulations, controls and taxes. Informal economy often I
represents the first milieu within which individuals test ~ - I the market, acquire basic business expertise and
accumulate funds that can be used for the establishment
of 'legitimate1 businessn. (Scase, Goffec, 1982) I -
The report of the committee of inquiry on small
firms appointed on July 23 1969 by the Rt Hon Anthony 1 . !
: crossland, the then president of the Board of Trade, had
. given among their terms of reference : I .
"To consider the role of small firms in the national
economy, the facilities available to them and the
problems confronting themn.
Prior to the appointment of this committee there had
pever been a comprehensive study , official or otherwise, of the small firm sector in the United Kingdom. This
important area had been little researched and poorly
documented, and the formation of industrial policy had
inevitably proceeded without adequate knowledge of the
functions performed by small firms, of their efficiency
and of the likely effects upon them of the actions. of
government. It was a reasonable presumption that the
decision to set Up the committee was influenced partly by
short term considerations. 1969 was a difficult year for
business generally and for small firms in particular, and

this gave rise to considerable pressure for an
investigation of the immediate position of the small
firm. The Bolton report 1971 stated the following:
It emerged very clearly from the written
evidence we received that many small firms
believed themselves to be operating in a
generally hostile environment as a result of
the action of Government. Much of our evidence
received before the change of the-Government in
June 1970 revealed a large measure of straight
forward political prejudice against the labour
government at that time. It is commonly assumed
that the overwhelming majority of small
businessmen themselves, despite their numbers ,-
have been extremely ineffective as a pressure .
group. The main reason for this is that small
businessmen are often fiercely independent,
very reluctant to join in group activities, and
also heavily overworked. The most telling
criticism of government in this field is not
that its policy towards small business is .
mis-conceived or , hostile, but that it has no
policy. Indeed most of the rare ini.tiatives of
government designed to help small firms are ,
comparatively recent developments." (Bolton
report 1971)

2.3.1 BECO-ATIONS OF THE WILSON RRPQPT ( 197 9 1 :
The Wilson report was commissioned in 1977 to
enquire into the role and functioning at home and abroad,
of financial institutions in the United Kingdom and their
value to the economy ,to review in particular the
provision of funds for industry and trade, to consider
what changes are required in the existing arrangements
for the supervision of these institutions, including the
~ossible extension of the public sector, and to make
recommendations. It was published in 1979. The committee
appointed had already published a number ,of volumes of
oral and written evidence, two research reports and a
progress report on the financing of industry and trades.
~ u t this interim report on small firms was the first time
they had drawn any conclusions or made any
recommendations. The main reason for singling out the
mall firms for special treatment in this way was the
virtual consensus in the submissions they had received --
that there were problems with the. arrangements about -Y
/ financing smaller businesses, whatever the funds and -'.
their availability for industry and trade as a whole.
There appeared to be a case for closer' examination of
these claims, both because of their importance in their
om right and because of the general lessons which might
be expected from a scrutiny of the financial system which
was widely believed to be one of their weakest links.
The recommendations are summarised below and it was
believed that if accepted, they would bring some measure
of benefit to small firms, encouraging more new firms and
enabling more existing firms to grow in a faster rate.
1. The department of industry should review the
thresholds of all their industrial support
schemes with a view to introducing greater
flexibility and ensuring that small firms are
not excluded.
2. The case for changing the law to allow small
companies to raise equity in a redeemable form,
andother ways of allowing proprietors of small
companies to , raise outside capital without
risking their overall control, should be given
3urther consideration by the department of
trade, the treasury and other departments
concerned.
3. The department of trade, the treasury and
-other departments concerned should consider how
best to promote the facilities of Over The
Counter (OTC) markets in this' country and the
case for removing some of the impediments to
their development which are alleged to exist at
present. ,

4. Steps should be taken to promote the
creation of a new type of institution, the
Small Firm Investment Company (SFIC), by
removal of the present fiscal and other
constraints on the spontaneous development of
such a medium. A specific limited relief of
personal taxation should be given for the
purchase of SFIC shares.
5. An English Development Agency to small firms
should be set up with financial powers and
objectives similar to those of the Small
Business Divisions of the Welsh and Scottish
Development Agencies. As an interim step, so
the Council-for Small Industries in Rural Areas
(CoSIRA) should be given the additional
financial powers already possessed by its
counter parts in Scotland and Wales.
6. A publicly underwritten loan guarantee
scheme, .with a limited subsidy element and some
part of the risk retained by the banks,should
be set up on experimental basis as soon as
possible. . .
7. The ~ x ~ o r t Credits Guarantee Department
(ECGD) ,.should review their general
responsiveness to .the needs of small firms and
should consider the appointment of a small

firms representative to the Export Guarantees
Advisory Council.
8. The banks should take steps to ensure that
their policy in respect of the effect on
existing facilities ECGD guarantees advances
is clearly understood at branch level.
9. The National Research Development
Corporation should review their practices
relation to the margins of their markets to see
whether it is possible 'to take on more projects
put forward by proprietors . of the small
businesses within their requirement to break
even. They should also examine their working
relations with other financial institutions in
related fields to ensure that viable projects
which fail to get their support are passed on
to more appropriate places.
10. Those concerned with the provision of
advice to small firms, including accountants
and the banks as well as the public sector
agencies, should take steps to ensure that
information about the National Research
~evelopment Corporation and ~echnical
Development Capital Ltd is as widely
disseminated as possible'.

11. Consideration should be given to ways in
which the present rather fragmented
arrangements for between small
firms and centres of higher education could be
put on a more systematic basis, a pilot scheme
should be established whereby educational
establishments could obtain grants to undertake
more prototype development and testing for
small firms.
12. The accountancy bodies should take steps to
ensure that their members are. both equipped and
encouraged to take a more active role in
providing adequate advice to their smaller
business clients.
13. The Confederation of British Industry (CBI)
and other representative bodies should consider
whether there are any further steps that might
usefully be taken to encourage larger firms to
release executives to assist smaller businesses
with general advice or assistance on particular
projects.
14. Those public and private institutions
concerned with providing finance to small f inns
who do not already do so should consider
publication of the criteria which they apply
when judging applications for assistance and of

guide lines showing the manner in which the
required information should be presented.
15. A small statistical unit should be set up
within the Department of Industry specifically
charged with collecting and co-ordinat ing
statistical information about the small firms.
Storey (1982) outlines briefly the measures taken by
a conservative government in Britain to assist the small
firm, and encourage more individuals to start their own
businesses :
l.~usiness start-up schemes: outside investors
buying shares in new small trading companies obtain
tax relief at rates up to 75% on investments of up
to £10,00O/year (now revised into the business
expansion scheme obtaining tax relief at rates of up
to 60% on investments of up to f40,000/year).
2'.Loan Guarantee Scheme: Government will guarantee
80% of new loans for between 2 and 7 years, on
values of up to £75,000 (100,000 after 1 April
1989) . The remaining 20% is carried by the financial institutions making the loan.

3.0ther financial benefits: corporation tax
liability has been reduced . The VAT threshold has been raised.
Trading losses can be offset ' against tax more
generously. Redundancy payments of up to £25,000 are
free from tax, if the money is used to start a
business.
4.Premises and planning: an extension programme of
the building of small factory premises has been
undertaken.
Eleven enterprise zones have been created within
which planning restriction are much less onerous and
where rates relief is given over a ten years period.
5.Information and statistics : The number of forms
which government issues have been substantially
reduced. on the other hand, the businessman can
obtain advice on a variety of topics from small firm
information centres. (see the Essex Business Centre)
6.Employment legislation : his has been relaxed for
small firms employing less than 20 people, who are
not liable for claims for unfair dismissal by
workers employed by the firm for less than two year. .
5
.$hat was 1979-81 , In February 1984 the Prime Minister
announced that government schemes for small firms are to
be simplified by May, so that small firms can see what
schemes are on offer from the Department ot Trade and
Industry , avid Tripper, Minister with special . \
responsibility for small fir& said, 'We must make clear
to industry what is on offer in the simplest terms and
then make it as straight forward as possible for them to
take advantage of itm.(British Business 1984)
Certainly the value of the loan Guarantee Scheme has been-
the centre of controversy, so much that Robson-Rhodes
(1983) were commissioned to report on the effectiveness
of the scheme.
In general -Robson-Rhodes (chartered accountants)
commented on the value of this scheme, its place in the
range of facilities available to stimulate business, and
indicated its contribution to generating new business and
jobs. The scheme has clearly made a significant
contribution to getting small businesses started and, has
rekindled interest in appraising and financing small
businesses in more risky situations.
Extracts taken from a report in, the Sunday Times
business supplement ;
"The creation of new worthwhile jobs remains* the
most pressing social, political and economic problem
in Britain today. We in P.A. believe we have part of
the answer. Economic recovery and growth by
themselves cannot provide an answer, and nor can
training measures. Neither of these, whilst clearly
of benefit themselves can provide the full-answer to
the size and, scale of the problem now being faced.

The scale of run down in traditional industries in
some regions is now so great that economic recovery
and a stimulus to the economy as a whole will not
provide the jobs that are needed in these areas in
the number and speed required. For example, Northern
Ireland has lost aboutd a half of its manufacturing
jobs in the last ten years, whilst the West Midlands
has lost a third of its manufacturing employment in
just the last five years.. These losses will take
years to replace under even the most favourable
conditions. P.A. has been working in both these
regions in the last couple of years in unique
schemes to assist local job creation. The .main
lessons we have learnt are :
. * That the most secure and long-lasting job creation
comes from the expansion of existing local firms.
* That growth of new business should be incremental
in the sense that it should be an extension of
existing local business and skills.
* That the correct marketing of local job creation-
is essential to success.
* That existing public funds and 'pump priming
should be much more focused, both in terns of
covering ,smaller 'core' areas and i n concentrating
on fewer worthwhile initiatives,
In ~ondonderw several hundred new jobs have been
created in the last two Years and the effect on the .
local industrial Property market ' has been

significant with private investment stimulated. The
ingredients for this success are many and varied but
I would point particularly to the coming together of
public and private interests to provide a 'one stop'
advice and counselling service to fledgling
enterprisers and the imaginative marketing and back-
up facilities firmly rooted in the community."
As an example of recent government policy to assist
small business. centres have been formed on aregional
basis specifically to provide information and expert help
to new and existing small and medium sized companies, one
such centre is Essex.
Since its inception at the beginning of 1984 the Business
centre (in Chelmsford) has experienced a rapidly
increasing demand for its services and the range of
activities undertaken has also expanded. The aims of the
centre is to provide access to all ranges o f services - - ---- --A
available to business from both the county council and
voluntary agencies in Essex, and to draw together these
different strands. The centre provides a wide range of
expert advice on finance, marketing, exports and general
business planning. It also acts as a focal point for
businesses seeking help.

Whether you are setting a new business or relocating
an established one, the Enterprise Zones offer an
unrivalled package of incentives. ,The scheme was started
by government in 1981 to stimulate industry and
employment in selected inner-city areas. There are at
present 25 zones with individual sites varying from about
120 acres to over 1100 acres, locations include : Corby,
Hartlepool, Isle of Dogs, Middlesborough, Scunthorpe,
Swansea, Clydebank and Belfast. The land is ripe for
development and zones offer great potential for service
and light industries.
The principal benefits are:
# Complete exemption from rates on industrial and
commercial property.
# Exemption from development land tax.
# 100% allowances for capital spending on buildings.
# Exemption from industrial training levies and from '
the requirement to supply information to ~ndustrial
Training Boards.
# Greatly simplified planning controls.
# Assisted customs facilities.
oespite criticism that the zones have already encouraged .
firms in the area to move short distances, there is
evidence that extra jobs have been created.

2.4.1 SOURCES OF START UP CAP=:
" Generally speaking individuals setting up in
business for the first time fall into one.of three
'.: " . , . . broad categories:
i . A. Those starting completely from scratch, where the
proprietors have no experience in, or connection
-._. . with, existing enterprises. . . . . -
: . % * . , , B. Ex- employees .. of existing firms starting up in
. . .- . similar or related areas.
C. Those who take over existing business with the
intentions of developing them along different lines.
In almost every case the main initial source of
capital will be equity subscribed by the proprietor
himself or his family. ' (Wilson report 1979) '
holly independent new firms in Cleveland (North
East ~ngland ) were asked for the sources of finance
which founders used to begin their business: 53% of
all f inancia1 sources wefe personal savings.
(Storey 1982)
In financial requirement the prospective
faces a necessaIy but difficult task. part , .
of the difficulty .results from the problem of trying to . ,

peer into the future. Although the prospective
entrepreneur should personally dig as deeply as . possible
into future financial needs, he or she ,should also seek
factual information and counsel from various outside
sources. It is often, quite feasible to visit other
businesses, similar to , but not directly competitive
with, the proposed business.
AS a first step in estimating capital requirement, it is
necessary to determine the volume of sales that may be
expected. This step is required because the minimum
amount of many assets fluctuates directly with business
volume: One approach to sales production is to select a
desired profit figure and to work back from that to
sales; the next step is to compute the amount of assets
necessary for that particular. sales volume. The
' prospective entrepreneur may use the double-barrelled
approach. of applying standard ratios and cross-checking
by empirical investigation. Industry standard ratios are
compiled for numerous types of business concerns. They
are available from Dun and Bradstreet, Bankers, trade
associations, and many other organisation. (Broom-
~ongenecker 1975)
Another method is to construct a forecasted profit and
loss account, balance sheet and cash flow. These are the
three main mechanisms for keeping an eye on your money.
The balance sheet gives you a still picture of your
business's money at a given moment; the prof it and loss
account tells you how the business has done over a period

(usually a year), and the cash flow forecast tries to
predict what you will be spending money on during the
next year and when. (Starting Your Own Business -Barclays
Bank 1986)
As a final check it may be possible to achieve a break-
even point percentage for the proposed type of business.
This is the percentage of capacity or normal level that
must be reached to avoid losses.
.._ .
The following section is' based on - . . .
'- . '>I, .,
R.B. ~ard~reaves - . . . . . - 'Starting a ~usiness' . (1983) 1t considers the different types of financial needs and
. . how they can be minimised.
; .. FIXED:
The new business may require plant and machinery if
it is to manufacture a product and will, whatever its
business, need office fittings,furniture and equipment.
. . his can involve large sums of money particularly if bare
premises are rented which need screens, carpets, heaters
and light fittings . Office equipment will include desks, typewriters , telephones and telex. Motor Vehicles
including cars may also be needed. \

The list of needs is likely to be long and should be
carefully reviewed until it only includes the items which
must be had to run the business properly. It is probably
better to start with too little overhead rather than too
much for this reason. For example, of £ice equipment can
often be minimal : photocopying equipment is not
justified until itlwould show a cost advantage over using
a specialist service bureau.
There are strong arguments for renting property. First,
unnecessary finance is not tied up in bricks and mortar.
Secondly, greater flexibility can be obtained by short
term lets of premises which are likely to be tooxnall in
two or three years .time. renting of ocher assets may be
economic if they are only needed for short period at a
time.
CURRENT:
Cash saving on debtors may be difficult as the terms
of trade of the industry may dictate the length of credit
available; nevertheless, there is no excuse for not
planning to collect debtors promptly. Stock is an ,area
where planning can be very valuable as too much is more
often held than too little. One of the difficulties can
be the wide range of stock items which many businesses
need. The secret of minimizing stock levels is good stock
control. I
creditors m y be an area where there is little scope for
savings by increasing credit taken. Indeed the new

business may have to pay cash for a while before credit
will be given by suppliers. This is one reason for with
dealing relatively few suppliers to establish a level of
business at which credit and may be discounts will be 4
given as soon as possible. If cash is tight, it may be - ---
wiser to choose a supplier which offers credit but is
expensive rather than one who does not but is cheaper.
OVERHEADS:
Finally, all overhead areas need a close look. For
example, some costs can be linked to income which reduces
~verheads . A high percentage of sales commission rather than salary to salesmen one of doing this. Other
areas involving the build up of cost before income also
need thought- For example the initial number of staff.
Some services can be purchased on a part time basis to
start with if the work does not justify a full time
salary. Book-keeping is a possible example.
FINANCIAL:
A basic concept of financing the needs of any
business, new or long established is known as 'matching'.
There has 'however been a technical argument to the

contrary, but to simplify the matter we will assume that
the concept will give the new business person an insight
into a workable philosophy on the financial structuring
of their company.
The principle is to keep the life of assets and their
relevant financing of similar length. For example if a
computer is to' have a productive life of , say five years
it is appropriate to finance it over a similar period.The
financial needs of the company should be taken down into
fixed assets, working capital and contingency to help . . ..
with matching. The matching principle .. -. -. . suggests
providing for the variable working capital from short
term but renewable sources of cash. Plant,, office
equipment, vehicles and the like are medium investments;
while buildings, long lasting plant and some 'hard core'
element of working capital are longer investments.
The simplest and most common form of short term
finance is an overdraft facility. It must. not be
forgotten, however, that overdraft technically
repayable on demand and the bank is likely to object if
the current account is not in credit at some time in each
month. Most businesses, both small and large, use an
element of overdraft financing within their total
financing. common security is a legal charge (debenture)
on all the assets of the business.

credit factoring can be a useful form of finance if the
business starts to grow quickly, because a higher lending
advance against each sales invoice (say 80%) is comrnon.If
used properly it need not be expensive and is worth
considering seriously when sales are growing fast to a
relatively few high quality customers. However, it of ten
does not mix well with an overdraft facility because the
banks main security usually includes the 'debtors.
The common forms of medium-term finance are a bank
medium term loan, hire pur'chase, and leasing. A medium
term loan from a bank has greater continuity than an
overdraft. It will be for a dkfinitive period repayable
in agreed, say monthly instalments over the period. ~t
will cost more than the overdraft by one or two percent
and may involve some restriction such as a limit on total
borrowings of the business.
Long-term loans are usually less well understood
than shorter types of finance and the following features
are worth noting:
A. Security - will reflect the length therefore
greater risk in lending; loans are ~ s ~ a l i ~
secured on the assets they finance.

B. Interest rates are often fixed.
C. Repayment over seven to twenty years may be
available in a variety of ways such as equal
periodic instalments.
D. convertible loans - these are sometimes used
where security is inadequate or where the ability
of the business to service the loan is in doubt. The
lender usually has the option for a fixed period to
subscribe money for shares in the business .at a
price or formula fixed at the outset.
Another form of long term finance is preference
shares. These are shares in the business which rank ahead
the ordinary shares both for dividends and capital.
The capital rights give the shareholders the right on
liquidations or sale of the business to receive a fixed
repayment of their shares ahead of the ordinary
shareholders.
Equity: equity share capital is the most permanent form
of capital; they usually carry all the votes which give
control over the management of the business.
AS a general rule, one's own money should be used for
permanent capital though personal guarantees of an P
overdraft are a convenient way of providing for shorter
term- needs. 'a - rule- ... . ~ - of thumb should not' be difficult
to ~btain at least as much finance from. out side, as
which has' already-been raised Personally, and still keep
in control of new'business.

In 1931 the Macmillan Report was published and this
highlighted the great difficulties experienced by smaller
companies when attempting to raise longer term finance in
relatively small amounts. Macmillan believed this to be
mainly the results of a gap in the supply of suitable
funds to support the growth of smaller companies.
(~acmillan Report 1931) . This phenomenon became known as the "Macmillan Gapm, which has been described as " the
lack ,of provision for small and medium-sized firms of
long-term capital in amounts too small for public
issues." It led to the setting up of various institutions
specialising in the financing of small firms, notably
charterhouse Industrial Development, Credit for Industry,
and ~eadenhall Securities. But these institutions could
only tackle Part of the problem. Accordingly, in 1945,
the major clearing banks, with support from the Bank of
~ngland, set up the Industrial and Commercial Finance
corporation. (ICFC) which at once became and remains bf
far the most important institutional provider of long-
term capital to small and medium enterprise in Britain.
(Chadwick 1978).
Mr J.E. Bolton, Chairman of the Cornittee of Inquiry
on small firms ( the Bolton Report 1, commented in May
1976 on what was the major problem of small firms, namely
the availability of working capital. This rests fairly
and squarely with the clearing banks. The double squeeze

of high inflation - causing a need for increased working capital just to stand still - and depreciation in the value of the assets which the small firm can offer as
security has caused an ever increasing gap. (Bolton 1976)
As far as bank credit' is concerned the small
business suffers from certain handicaps as compared with
large firms. In the first place they cannot offer the
same security and secondly the smallness of their loans
involves banks in higher administrative costs. Thirdly,
the volume of investment loans to the smaller enterprises
is apt to fluctuate because financial institutions have a
tendency to start by cutting their money supply 'to the
smaller companies when the money becomes tight because of
the extra risk involved.
VENTURE:
The ideas behind venture capital come from the
united States, where it has been a source of finance for
20 years. Venture capitalists are prepared to wait for
several Years before they see a return on their
investment - if at all - in the hope that it will be worth millions when it takes off. Recently, the
~overnment's Business ~xpansion Scheme has allowed
individuals to claim tax relief on investments up to
f40,000, and this has opened up the gates for a multitude
of new funds.
Most recently a new breed of independent 'pro-
active' organisations has emerged. They have
identified potential gaps in the market unfulfilled
by the banks or the various government schemes. That
potential is for close involvement in the management
of the company being backed, and in the planning and
ownership of the company, over a period of perhaps
five to seven years. (Layton, 1984) .
The venture capital industry has grown extremely
rapidly during the last four years. There are now
nearly 80 specialist organisations providing venture
capital to growing private business compared with
fewer than 20 at the beginning of 1980." (Lloyd,
1984)
2.4.6 UQYSTRUIJ AND COmCIAJi FINANCE CORPORATIW
ICFC is part of 'Investors in Industry' an
independent private sector group whose main business is
providing long-term and permanent investment capital to
companies of all sizes. Investors in industry is owned by . .
nine ond don and Scottish banks (85%) and the Bank of
England (15%),
Since their formation in 1945 they . have built up an
~nrivalled track record in meeting the financing needs of
smaller private companies. In the ten years 1967/8 - 1977/8 ICFC lent £16.5 million to 277 firms to start-up
(i.e. a business launch which was less than three years
old) . One-third of those start-ups subsequently failed, with ten percent either having been taken over or ICFC
having sold their interest. (Storey 1982)
"The often heard observation that ICFC drives a hard
bargain has a lot of truth in it, but it takes more
risks than other investor (a one third failure. rate
is expected) and has long experience on its side. "
Anslow (1984)
a avid Marlow, chief executive for ICFC, states that in
his view, that what distinguishes ICFC - apart 'from the sheer volume of its investments, which now runs at over
El30 million a year - is the fact that it can take a long-term view. Other funders who can loosely be grouped
under the heading "venture capitaln' are often looking for
an "out" within five to seven years. ICFC, supported by
the big four clearing banks, can look further ahead and,
indeed, is still reasonably happy at being locked into
investments it made nearly 40 years ago. (Marlow 1984)
Although banks are frequently criticised (not always
justifiably) for their lack of response to ideas for new
businesses, clearing banks in fact provide more money to
mall businesses than any other source through their
13000 branches around the country and are often the
independent businessman's only point of contact with an

: external finance system. It is virtually impossible to go
into business without personal resources some kind
. not unreasonably, the banks expect a financial commitment
: from the potential businessman that there sharing
of the risks involved between him and the bank. Senior . ~
managers say, and there is really no reason to doubt .
them, that commitments should be on a ratio of 1:l of
personal resources and bank advances. But it is not
difficult
I approve
find the branch
the more liberal
manager who does not really
trends banking and does
not consider that the time and effort on the part of the
businessman and the laying of his whole livelihood on the
line counts as a commitment or acceptance of risk. Anyone
who is unfortunate enough to come up against this kind of
manager should have no regret about taking his ideas to a
higher level, another branch, or eventually another bank.
There are plenty of lenders today looking for viable
propositions. (Woodcock 1982 )
During the past decade there has been a tremendous growth
in the provision of medium-term finance for business, as
the traditional bank practice of lending for short
periods only has been relaxed following , two major reports
published in the early 1970's on competition and credit
control and 0x1 small fkns. The range of choice for the
smaller business is now wide, and is a recognition of the'
dominant desire of most small businessmen to raise their
finance through loans. -rather than part with any degree
. of control by selling a share stake in their'companies to
an outsider.

"The reason I am convinced that the local bank
manager must see himself as the entrepreneur
of the 1980's also stems in part from the
scale of the problem we face, and in part
from the role he has played in 'new frontier'
situations in other places and in other times - and make no mistake about it we're in a new
frontier situation and we have an urgent need
for the resurgence of the pioneer spirit.
(Bolton 1978)
Bolton in his article 'The bank manager: entrepreneur of
the 1980's' then goes on to recite what. J.P. Morgan is
reputed to have told his young trainees in Wall Street
'Young man - a banker is someone who lends without
adequate security. Any damn fool can make a loan if it Is
fully secured.' And again Bernard Baruch the American
~ financier. friend of Sir Winston Churchill, is quotable as
~ : - having .said 'Money is like manure. I£ you leave it in a pile it just rots and then stinks. ~ u t if you spread it
around it's surprising how many things it will help to
grow.
1 . . Most smaller businesses will probably find
themselves using, or being steered towards, the various
special schemes set up by the banks in recent years.
~edium-tern loans from Midland Bank, for example, are

usually for amounts of £5000 upwards, repayable over
periods of three to seven years. But in order to cater
for the smaller independent business Midland has
developed its Venture Loan Scheme which provides loans
from f5000 to £250000 for up to 10 years. The scheme is
designed to meet the medium-term finance needs of sole
traders, partnerships, professional practices and
incorporated companies. -Venture loans are secured and
interest is charged at 3% over Midland bank base rate
regardless of the amount of the loan. An arrangement fee
of 0.5% 5s payable, subject to a maximum of f500. Because
of the time that can pass before a major additional asset
generates sufficient cash flow to meet capital
repayments, it is possible to- arrange for the interest
only to be paid during an initial period of up' to two
years.
PRISE L O U :
Lloyds .Bank offers general medium term lending
facilities to industry and commerce, and the professions
too, ^but in addition provides for the independent
business a special scheme called the Small Firms Loan
~uarantee Scheme, backed by Government guarantees . These cover 70% of the outstanding loan or 85% for "Inner City
ask Force Areasn in parts of: Birmingham, Bristol,
Coventry, Doncaster, Hartlepool, Leeds, Leicester,
London, ~anchester, Preston and Rochdale . Each individual can borrow between £2000 and £100000 with any number of

loans up to the maximum limit .The loan is repayable over
two to seven years. If the loan is for more than £15000,
the bank offer a two years capital repayment holiday in
which the interest will be paid only. This type of
finance is available to almost every kind of small
business with 200 employees or less in manufacturing,
retailing, construction and service industries, whether
they may be trading already or ready to start. The bank
offer a special low interest rate in which the Government .
levy a 2.5 percent premium on the part of the loan they
are guaranteeing . On loans under £15000 this is charged as a single fee at the outset. For larger loans it is
paid quarterly in advance reducing as the loan is repaid,
that is from year two of the loan the rate goes down by
1/4 percent provided that the borrower keep inform the
bank with regular management reports on the progress that
he is making.
National Westminster Bank's special scheme for the
small business is called the ~usiness Development Loan.
The bank has made more than 50000 business development
loans since it began the scheme in 1971, and more than
£400 million is now out on loan. The bank's recent
experience has been that between 2000 and 2500 new loans
are being granted each month for total sums of around E25
million. The Business Development Loan is similar to the
loan scheme available to farmers in that it provides

loans ranging from f2000 to £250000 over period of one to
twenty years . For loans up to £50000 , repayments are spread over any period up to ten years. Rates on
unsecured loans are usually one percent higher than for
secured loans, and loans for six to ten years are 0.5
percent higher than those for one to five years.
The arrangement fees for six to ten year loans is
1.5 percent of the amount borrowed and for one to five
years it is one percent. The rates quoted are fixed for
the duration of the loan, and repayments are taken on a
monthly basis, including the interest. The borrower is
expected to have a life policy covering the amount of the
loan; borrowers can be either businesses or professional
practices, including those buying into a practice, as
well as farmers. Farm Development Loans are provided for
buying farms, livestock, machinery and new buildings,
modernisation of old buildings, and other projects likely
: to improve profitability, such as drainage, fencing; . .
liming and fertilisation.
Where a customer requires a loan of ,say, €100 000,
but wants to negotiate a repayment plan which can be
. tailored to his anticipated cash flow needs. The bank has
an alternative fixed rate medium term lending scheme
which its managers can offer.

RUSIITf7SS EXPANSION J t O u :
In addition to the normal range of medium-term
finance facilities, Barclays Bank has developed its
~usiness Expansion Loan Scheme, which covers both medium
and long-term requirements. Its main features includes a
term of two to twenty years at fixed or variable rates of
interest, finance for up to 100% of the asset being
bought, with the option of a capital repayment 'holiday'
of up to two years. Any security taken by the bank is
limited to the asset being financed by the loan. Its aim
is to provide finance for capital spending for companies
which can demonstrate a successful track record and
future growth prospects. Such businesses would generally
have products for which long-term demand can reasonably
be expected and be controlled by experienced management
able to show the viability of the new investment.
While Business Expansion Loans are available for
terms of between 2 to 20 years the term of one loan would
not exceed the life of asset bought and in the case of
plant and machinery would not normally be more than 10
years. Barclays has so launched a new loan scheme for
holders of self-employed pension plans'issued through the
bank ' s subsidiary, Barclays Life Assurance Company. It is
~lanned to extend the loan scheme to holders of pension
' schemes issued by other life assurance companies, the
first of these being the Legal and General ~ssurance
societyo The aim of the scheme is to overcome the fear .of

being left short of finance which in the past deterred
people from investing the maximum possible in pension
schemes. The Barclay ' s plan tries overcome this
offering pension plan holders the opportunities for loan
facilities on acceptable terms.
There are many frustrated entrepreneurs who complain
that financiers cannot grasp the significance of their
ideas, particularly of a high technology nature. On the
other side, those with funds to invest complain equally
about a shortage of worthy projects. There seems to be a
serious failure of communication.
In one respect high technology ventures are no
different from any .other business venture. They all
respect risks, and never far from any venture capitalists
mind is the harsh statistic that one in three start-ups
will fail within the first three years. The difference
from other risk ventures is that those. based on high
technology ideas may have long gestation periods and
require far more. financial aid during the early years of
growth. Despite the fact . that bio-technology,
microelectronics and computer-related businesses are the
~unshine industries or the future, not all financiers are
re pared to steel themselves to sit out the years of
promise. A good many investors are looking for returns in
the short term. Those prepared to be more patient and

wait up to ten years for the pay off are in the minority. /
For high-technology companies at the beginning of their' - lives equity funding is common. Its merit is that to
remove the burden of high interest repayments on loans in
early years, when the struggling company can least af f ord
to hake them. Many companies which go under during the
first few years do so because of the crippling effect of 5
loan payments.
There are about 40 companies in the U.K. which
specialise in the provision of venture capital, and an
increasing number are interested in high technology
sectors. Although several include new technology ventures
in their investment portfolios by no means all are well
equipped to grapple with the technical dimension of their .
applicant's propositions. Nor are they all prepared to
take on the more active role which distinguishes their
American counterparts, especially in terms of equity
participation and management guidance.
The following are some examples for high technology
ventures taken from "~aising Finance, The- Guardian Guide
for Small ~usiness' (Woodcock 1982) :
As a major source of long term finance for small
and medium sized British companies, ICFC set up TDC in
1962 to combine the need to translate a promising new

idea into a viable commercial product or service with an
understanding of the special requirements of funding
technical ventures. TDC has since made more than 200
investments in technology based companies, covering
electronics, genetic engineering for livestock,
scientific instruments, computers and software, plastics
technology based projects, namely that development can be
a lengthy and costly exercise and that the pay-back
period may be brief because of the limited time
to exploit a technical advantage before competition
catches up. It can therefore, in addition to financial
help, also provide qualified assistance from an
experienced executive team drawn from high-technology
industries. In the area of electronic development , TDC has backed companies like Tape Automation, said to be the
sole .U.K. manufacturer of high speed automatic tape
cassette duplication and winding machinery. This
investment helped the company to gear up its sales and
marketing operations in the specialised audio tape
market. It has also developed a video tape cassette
loading unit with which it plans to dramatically undercut
its Japanese competitors. TDC seeks to invest 'in
companies with long term growth potential and each
application is individually assessed as to product,
market and profit projections, with particular emphasis
on the personal qualities and background of the managers
of the venture. once a favourable assessment has been
made a financial package is designed to meet the needs of
the business. Experience has shown that a minority

holding combined with a medium term loan is often the
most common scheme but other arrangements are considered
depending on the circumstances. Interest on any loan is
at commercial rates, fixed for the whole period and
charged on the outstanding balance only.
I Repayments of the principal start only when the budget
projections show that the venture has the ability to
I repay and are spread over an agreed period.
I
Finance may be invested in total at the outset or in I
/ stages, according to an agreed programme. The progress of I 1 each investment and appropriate guidance offered but the
1 . day-to-day running of the venture remains the I I responsibility of the management team. TDC does not I - 1 appoint members of its staff to. the boards of companies i I I it helps to finance, but it may reserve the right to I 1 appoint a nominee director who can add to the strength of i
the business and is acceptable to the other directors.
In financing high risk projects a comensurately
high return is anticipated, generally from a dividend
based on profits or sales receipts and by realising a
capital gain, if and when the entrepreneurs buy TDCRs
shareholding or they jointly decide to sell the company.
TDC is prepared to leave its funds in a company for an
indefinite period and inject further funds' as
appropriate, provided its investment is clearly
increasing in value.

IVE RESFARCH GRANTS S m :
and ~ngineering - The Science Research Council (~SERC) has set up a
scheme to promote co-operation between manufacturers who
wish to develop new products or processes requiring
research with academic content beyond their own
research and development resources and academics. It
encourages universities and polytechnics to carry out
research projects collaboration with industry,
bring academic expertise bear research important
industry and assist in the improvement of commercial
products or industrial operations. Grants may be sought
in all the physical, biological and engineering sciences SERC
for which the- snc-is responsible.
The SERC ... .- will consider supporting the academic side
of the collaboration provided that the company makes a
substantial . contribution of effort, material and
expertise. The &RC contribution may, however, be up to
three times that of the company in. terms of direct costs.
~pplications -for grants can be made by acad&ic staff in
association- with a company. Any company is eligible which
is directly engaged in the manufacturing or extraction
industries, or in the provision of commercial services,
and has the intention of exploiting the results of the
research.
. .
c he SERC is anxious that more small and medium-sized
companies should not be deterred from participating

because they have limited research and development
resources; the council will advise them and may be able
- to suggest an academic partner.
The company which uses the scheme is eligible for
: external funding for the part of the costs of research
- projects which are of direct value to it but which may be
. ' beyond- its own resources. In- return for its contribution
- to the project the company is assigned any patent or
other intellectual property rights arising from the work,
subject only to a small royalty to the SERCon successful
- ' exploitation. In the first 18 months of the . scheme's
operations 54 grants to a total value of £1.3 million
were approved and the annual budget was increased as a
result of this successful response.
TIOGY GROUP (BT') :
The BTG was formed to bring together and build on
the . facilities offered by ' the National Research
Development Corporation , formed in 1949 since when it ,
has provided support for the exploitation of inventions
- , and . finance for innovation by industrial companies, and
the ~ational. Enterprise Board , which has a shorter
histom of providing venture capital for new initiatives
in advanced technology and funds for developing new
industries in the assisted areas of England.

BTG can provide finance for technical innovation in
any field of technology, to companies as well as
individual entrepreneurs. There are a number of ways in
which this finance is provided: joint venture finance,
recirculating' loans, equity and loan funds, specific
funding schemes for innovatory small firms in assisted
areas, venture capital for electronics related business
as well as funds for more traditional industries. There
is also a relationship with Department of Industry
schemes whereby companies which have received grants from
Department Industry schemes can BTG for
additional finance. If a firm has received a 25% grant
from the Dlepartment of 1:ndustry or a requirements board,
it can then apply to BTG for 50% of the balance; that is
37.5% , making a total of 62.5% from the two sources. The
Department of Industry regards B E finance as private
sector finance.
A levy on sales can be arranged to meet particular
circumstances, to recover the investment and this is
usually in two parts: the first applies until the BTG has
recovered its capital with interest at a rate roughly
related to' the cost of borrowing; this is followed by a
second usually at a' lower percentage, for a
limited period to provide a risk premium or profit
element. In calculating levies the group seeks a rate of
return which reflects the overall forecast return on the
~roject and the estimated degree of risk; the rate of
levy may vary substantially from one project to another

depending on the circumstances. The cost of joint venture
finance can not be compared with the rate of interest on
loan capital because, in the event of failure, joint
venture finance does not have to be repaid. There is no
minimum or maximum size of investment. The group shares
the risks in the project but without taking shares in the
company and repayments do not start until the product is
being sold.
Funds aimed specifically at the smaller company are
provided through Oakwood Loan Finance ( a subsidiary of
the BTG) , .and the Small Company ~nnovation Fund (SCIF) . SCIF is like Oakwood, part of the Small Companies
~ivision of BTG and is intended to help small innovative
businesses 'including startups1 to develop new products
or processes and to expand the scope of their activities.
while some other forms of BTG finance are linked to the
success of a particular product or process the main
objective of SCIF is to provide finance for the total
business.
BTG has a wide investment role in the ~nglish
regions, particularly the assisted areas and mainly in
the North and' South-west, supporting both technical
innovators and companies in traditional industries. The I
aim is to stimulate economic activity in established
companies with potential for growth or for improved
efficiency by modernisation or rationalisation.

CHAPTER THREE
During the late 1800's ratios were developed to
compare the current assets of an enterprise t o its
current liabilities, but it was not until the early of
1900s that the development of financial statements led to
comparability of financial ratios within industries.
~lexander Wall (1919) examined seven different ratios of
981 firms and published the ratios according to
geographical areas and types of business. In effect he
popularised the use of ratios with empirical evidence.
For a detailed history of early financial statement
analysis, the "reader is advised to see or rig an
(1965,1968,1978 ) .
Interest in ratios increased widely during the 1920s
with a substantial growth of publication in the subject
of ratios analysis. Bliss (1923) suggested that for ratio
analysis to be complete industry factors such as type and
size must be incorporated within any study. Gilman (1925)
listed .a set of objections to using ratios. He believed
that ratios-were "artificial" measures which change over
time and that they did. not portray ,"fundamental
relationships within the business". Littleten (1926)
found that the literature had contended that differences

exist among industries according to the types of products
sold. Furthermore, he found that these differences
prevent the direct comparison of companies with other
industries .
Prior to the development of quantitative measures of
a company's performance, agencies such as Dun and
~radstreet, Inc., supplied information which could be
used to determine the credit-worthiness of companies. A
number of articles by Foulke (1933 a,b, 1934 a,b) .. -
in the Dun and Bradstreet monthly review were
particularly important in the development of ratic.
analysis.
Formal studies to explain why business failed first
appeared in the literature in 1930s . A comprehensive
analysis of twenty four ratios for twenty nine failed
companies representing seventeen different kinds of
industries was reported by the university of 11linois
Bureau of Business Research (1930). It was found that the
following ratios resulted in an uninterrupted indication
or symptom of weakness for the majority of companies
several years before failure; working capital to total
assets , surplus and reserves to total assets , net worth
to fixed assets , and'fixed assets to total assets .
~itzpatrick (1932) randomly selected nineteen ,
companies which failed in the 1920s , matching them
according to asset size , sales volume, type of industry,

and geographical area with nineteen successful companies
from the same time period.
He considered thirteen ratios and examined each set of
the companies's ratios three years prior to failure to
identify trends. He found that the ratios of failed
companies deteriorated as the year of failure approached.
The most revealing indicators were net worth to debt and
net profit to net worth . His study was too small and selective to be applied generally .
A study was completed by Smith and Winakor (1935) to
determine which ratios would indicate that a business
would fail . Their data was from the period 1923 - 1931 and they considered twenty one ratios. .They concluded
that of the current debt paying ability ratios, working
capital to total assets was the most dependable and
unchanged indicator of failure from those ratios
considered.
Most of the research up to this period was in large
asset size companies . It was Merwin (1942) who carried
out a study on small manufacturing companies those under
$ 25,000 in total assets during the period 1926.- 1936 . His study covered 581 continuing and dis continuing small
companies in five manufacturing industries . He concluded three ratios were very sensitive predictors o f ,
ndiscontinuancen up to four or five years before the
event :
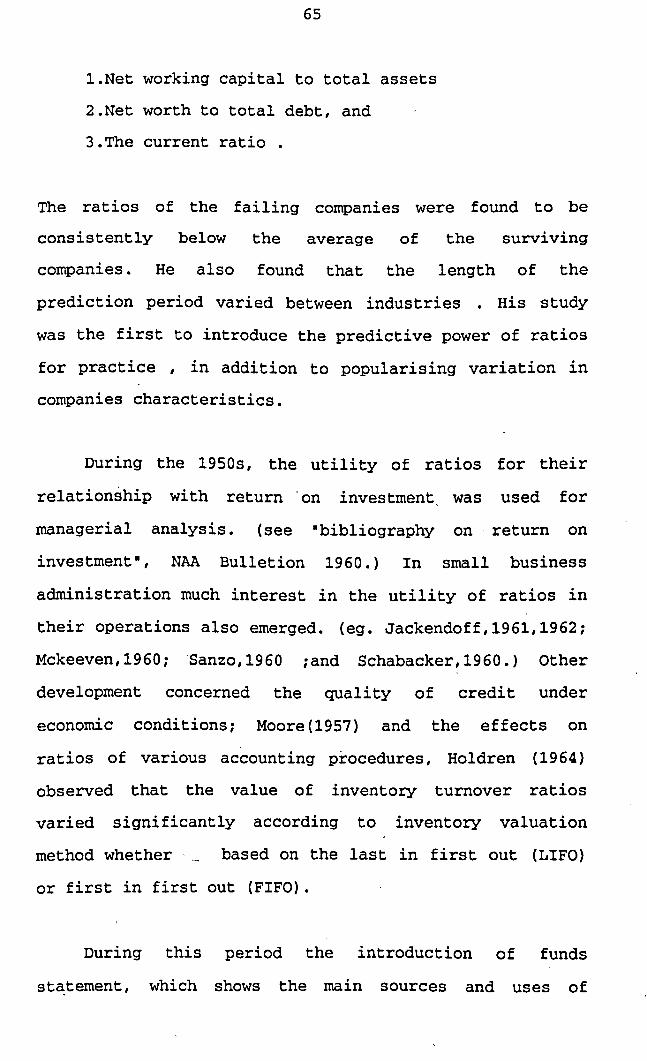
1.Net working capital to total assets
2.Net worth to total debt, and
3 .The current ratio .
The ratios of the failing companies were found to be
consistently below the average of the surviving
companies. He also found that the length of the
prediction period varied between industries . His study was the first to introduce the predictive power of ratios
for practice , in addition to popularising variation in
companies characteristics.
During the 1950s, the utility of ratios for their
relationship with return 'on investment. was used for
managerial analysis. (see "bibliography on return on
investment", NAA Bulletion 1960. ) In small business
administration much interest in the utility of ratios in
their operations also emerged. (eg. Jackendof f, 1961,1962;
Mckeeven,1960; 'Sanzo,1960 ;and Schabacker,1960.) Other
development concerned the quality of credit under
economic conditions ; Moore (1957) and the effects on
ratios of various accounting procedures, Holdren (1964)
observed that the value of inventory turnover ratios
varied significantly according to inventory valuation
method whether . .- based on the last in first out (LIFO)
or first in first out (FIFO) .
During this period the introduction of funds
statement, which shows the main sources and uses of

funds, emerged. Until then it was viewed that current
assets were the resources used by company to pay its
current liabilities and that by allowing some acceptable
margin for shrinkage one could evaluate the debt paying
ability of the company both as a going concern, and on a
liquidation basis,
A new school of thought was developed, Howard and
Upton (1953) argued that the main problem in making
a decision about a business IS short-term financial
position was in taking into account the future ability of
business's cash generation to meet all operating and
financial obligation by their due date . Following this line of the new school of thought Walter (1957) argued
that companies are paying off their existing current
liabilities and incurring new ones during the normal
operating cycle of the business, normally within the
annual period. They also realise current assets and
generate new ones by way of new sales.
So the current assets never will meet currently
maturing obligations and at the same time the current
liabilities are never wholly discharged . This way of comparison will not be a direct indicator of the ability
of the company to meet its current .obligation as and when
they fall due. He. viewed the current ratio and its like
as static measures of a dynamic flow.
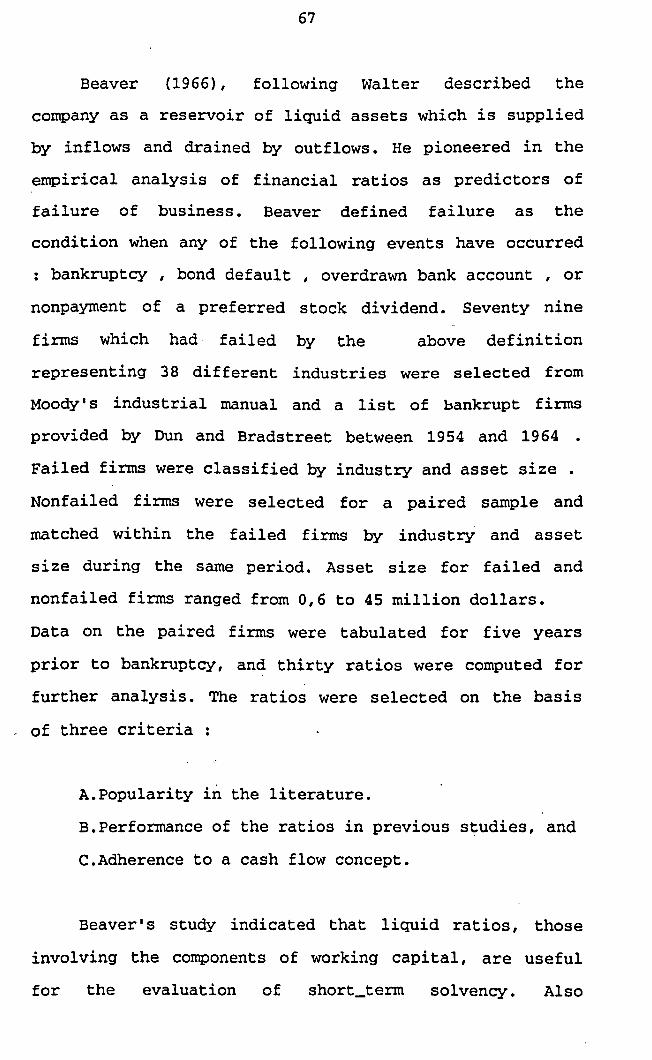
Beaver (19661, following Walter described the
company as a reservoir of liquid assets which is supplied
by inflows and drained by outflows. He pioneered in the
empirical analysis of financial ratios as predictors of
failure of business. Beaver defined failure as the
condition when any of the following events have occurred
: bankruptcy , bond default , overdrawn bank account , or
nonpayment of a preferred stock dividend. Seventy nine
firms which had. failed by the above definition
representing 38 different industries were selected from
Moody's industrial manual and a list of bankrupt firms
provided by Dun and Bradstreet between 1954 and 1964 . Failed firms were classified by industry and asset size . onf failed firms were selected for a paired sample and
matched within the failed firms by industry and asset
size during the same period. Asset size for failed and
nonfailed firms ranged from 0,6 to 45 million dollars.
Data on the paired firms were tabulated for five years
prior to bankruptcy, and thirty ratios were computed for
further analysis. The ratios were selected on the basis
of three criteria :
. ,
A. Popularity in the literature.
B.Performance of the ratios in previous studies, and
C.Adherence to a cash flow concept.
Beaver's study indicated that liquid ratios, those
involving the components of working capital, are useful
for the evaluation of short-term solvency. Also
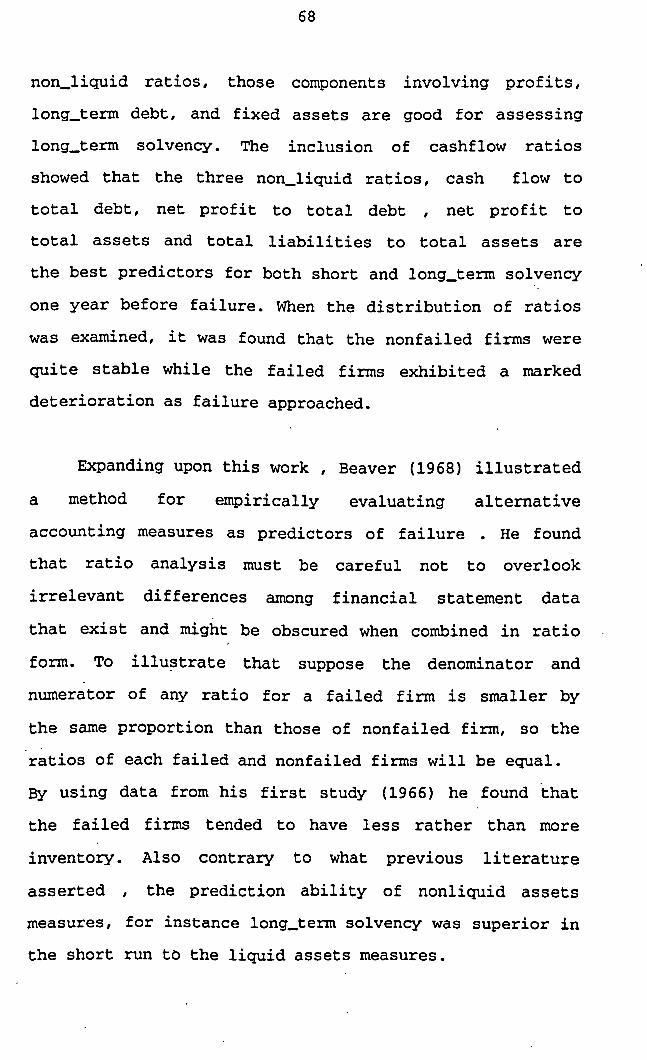
non-liquid ratios, those components involving profits,
long-term debt, and fixed assets are good for assessing
long-term solvency. The inclusion of cashflow ratios
showed that the three non-liquid ratios, cash flow to
total debt, net profit to total debt , net profit to
total assets and total liabilities to total assets are
the best predictors for both short and long-term solvency
one year before failure. When the distribution of ratios
was examined, it was found that the nonfailed firms were
quite stable while the failed firms exhibited a marked
deterioration as failure approached.
Expanding upon this work , Beaver (1968) illustrated
a method for empirically evaluating alternative
accounting measures as predictors of failure . He found that ratio analysis must be careful not to overlook
irrelevant differences among financial statement data
that exist and might be obscured when combined in ratio
£om. To illustrate that suppose the denominator and
numerator of any ratio for a failed firm is smaller by
the same proportion than those of nonfailed firm, so the
ratios of each failed and nonfailed firms will be equal.
BY using data from his first study (1966) he found that
the failed firms tended to have less rather than more
inventory. Also contrary to what previous literature
asserted , the prediction ability of nonliquid assets
measures, for instance long-term solvency was superior in
the short run tb the liquid assets measures.

All the empirical studies. considered so far treated
ratios individually . Researchers started to express
concern about the univariate approach, that is the
assessment of solvency based on single characteristics
one at a time. They thought this could lead to faulty
interpretation. For instance, a company with poor
profitability and/or solvency may be regarded as a
potential bankrupt. However, because of its above average
liquidity the situation should not be taken too
seriously.
In general before a final collapse of any company ,
some factors go negative , probably low liquidity , decline in profitability , high leverage , imperfect resource utilisation, etc. Meanwhile the financial Status
of a company .is actually a multidimensional
characteristic and no single ratio is able to capture
these dimensions. For reasons cited above several authors
and researchers realised the appropriateness of multiple
discriminant analysis approach to assessing the financial
health of companies. This is the subject of the next
section.

3 2 MUrtTIVARIATE WT1YSTS OF COMPANY FAITlURF,:
It was seen in the above section that all research
in this area up to 1960 were of a univariate nature and
with the realisation by academics that a single ratio
could not fully reflect a companyms financial profile and
with the development of multivariate statistical models
for the simultaneous treatment of several variables led
to the adoption of a multivariate approach to predict of
business failure.
Most of studies have used the technique known as
~ultiple Discriminant Analysis (MDA) . ~t is a
classificatory technique that has a wide range of uses in
several fields. It is used primarily to classify and/or
make predictions in problems where the dependent variable
appears in qualitative forms , e.g. male or female ,
bankrupt or non-bankrupt. In statistical terms , multiple
discriminant analysis is a technique whereby an
individual observation is classified into one of two or
more groups based on the observationsm individual
characteristics.
An important advantage of this technique is that it
can consider an entire profile of characteristics as well
as the interaction between these properties. More details
, of the theory and calculations of linear discriminant
functions will discussed in chapter 4 .

Financial ratios analysis has been employed by many
researchers in the field of predicting business failure.
As Altman (1968) .- . pioneered - - -.. . . - this application, his study is
considered in detail,
Altman's '(1968) initial study on the prediction of
corporate bankruptcy utilised the technique of multiple
discriminant analysis . This study consisted of sixty six corporations of which half had filed bankruptcy petitions
under chapter X of the National Bankruptcy Act during the
period 1946 - 1965 . The mean asset size of these firms was $ 6.4 million with a range of $ 0.7 million to $ 25.9
million.
Failed and non-failed firms were matched as regards
asset size and industry . Financial data were collected and twenty two ratios were compiled for evaluation. These
fell " ' into five categories of liquidity , ratios ,--,--.. -
prof itability 0 leverage , solvency and activity ratios.
The ratios were chosen on the basis of popularity in
literature and potential relevancy to the study.
From the original twenty two ratios , five ratios were
finalWly ' selected using ,a MDA computer program developed ,
by Cooley and Lohnes (1962). - --
. -- (--
The final discriminant function was as follows :
where

X1 = Working capital / total assets
X2 = Retained earning / total assets
X3 = Earning before interest and taxes / total
assets
X4 = Market value equity / book value of total debt
'X5 = sales / total assets
Z = overall index
These five ratios were chosen f6r their independence,
predictive accuracy, and statistical significance
according to the results of the MDA model.
The resulting model, using data one year before
bankruptcy, was found to be extremely accurate in
correctly classifying 95% of the initial sample one year,
72% two years, 48% three years, 29% for four years and
36% for five years prior to bankruptcy. Altman says that
there is an area of uncertainty between 1.81 and 2.99
which is defined as a grey area or zone of ignorance
because of' susceptibility to error classification. He
concludes that all firms having a z score of greater than
2.99 clearly fall into the non-bankrupt group , while
those firms having a Z score below 1.81' are all bankrupt.
I
From the predictive accuracy of the model between
year one and year five prior to bankruptcy one can
realise that the predictive power of the model declines
consistently with the exception of years four and, five.
Altman comments that the most logical reason is that

after the second year the discriminant model becomes
unreliable in its predictive ability. In addition he
states " one would expect on an a prior basis that , as
the lead time increase, the relative predictive ability
of any model would decrease. This was true in the
univariate studies cited earlier, and it is also quite
true for the multiple discriminant modeln , Altman (1968
p. 604)
Altman, however, thought that the predictive power
of this sample should always be high because the
variables which entered the final discriminant ' function
were derived from that sample data. He decided that this
should be followed by a validation test of the original
function, which means testing the original discriminant
function with a new sample of companiest accounting data.
H ~ S second bankrupt sample contained 25 firms in the same
asset range as of the initial sample. The prediction
accuracy of the validation sample using the original
discriminant function was 96% , in fact superior to the
result with the initial sample '(94%) .
: Altman examined both his previous study (1968) and
the Beaver (1966) study and determined that some
suspicion existed regarding the predictive ability of a *
model even within the same industry, if the accounting
methods were not standardised. For this reason , Altman
(1971) conducted a second study using data from the
railroad industry. The railroads had a uniform accounting

system since they are government regulated. Altman
admitted that this study did have a weakness in that the
length of time a railroad can spend in the bankruptcy
status can greatly. attempted rectify this
shortcoming by attaching weights to the variables
included in the model to remove any bias due to trend
movement. The resulting model found that the railroads
were extremely sensitive to changes- in the economy. The
model showed that the earned surplus to total assets and
total debt to total assets ratios were the most powerful
indicators of failure. The ,time period of this study was
1939-1970.
eyer and Pifer (1970) investigated the prediction of bank failure. They determined that four factors could
explain bank failure: local and general economic
conditions, the quality of management, and the integrity
of the employees. In selecting their sample, each failed
bank was matched with a solvent bank using the
characteristics of the same economic area, age, and'size.
The authors summarised the financial information into
twenty eight operating ratios and four balance sheet
levels. After calculating five forms of each of these
thirty two financial measures ( i.e. 160 variables),
a stepwise regression procedure was used to produce
several models. Two main conclusions were reached:
1. ~inancial measures allow an evaluation of the relative
strength of a bank and

2. The recency of data was an important factor in
predicting failure.
They found that with a lead time of one or two
years, about eighty percent of the firms could be
classified correctly with a coefficient of determination
of 0.70 . As the lead time exceeded two years, financial variables were not able to discriminate as well between
the failing and nonfailing banks.
A study of ratio analysis to predict default of
Small Business Administration (SBA) loans for the years
1954-1969 was reported by Edmister (1971, 1972). He
selected a sample from firms which had either received
loans or loan guarantees from the SBA. He used two
samples of firms, one for -whom three consecutive
statements are available prior to the date when the loan
was granted and the other for whom only one annual
statement was available. The former sample consists of 42
firms and the later 566 firms, both containing failed and
nonfailed firms to repay their loans. He examined 19
ratios and found that for small business the discriminant
function fails to separate between failed and nonfailed
firms when only one year of financial statements are
available. Then he used the first group of samples which
have three years data.
using stepwise multiple discriminant analysis on a
set of dummy variables, Edmister found seven variables

which predicted failure better than any others, he
obtained the following function:
- o.452x5 - 0.352x6 - 0.924X7 where :
XI = 1 if the funds flow/current liabilities ratio
is less than 0.05, otherwise Xl = 0.
X2 = 1 if the equity/sales ratio is less than
0.07, otherwise X2 = 0.
X3 = 1 if the net working capital/sales ratio
divided by its respective Robert Morris
Associates (RMA) ratio is less
than -0.02, otherwise X3 = 0.
X4 = 1 if current liabilities/equity divided by the
respective SBA ratios has average less than
0.48, otherwise X4 = 0.
,X5 = 1 if the inventory/sales ratio divided by the
respective RMA ratios has shown an uptrend
and is still less than 0.04, otherwise,X5=0.
X6 = 1 if the quick ratio/= trend is down and its
level just prior to the loan is less than
0.34, otherwise X6 = 0.
X7 = 1 if the borrowersi quick ratio divided by the
RMA quick ratio shows an up-trend, otherwise
X7 = 0.

The cut-off point was 0.520, and the model was able
to predict with 92% accuracy on the original sample, but
when he tested on the control sample, its accuracy
declined to 57% , which was not so different from by
chance. It may have been caused by the small sample size,
biased populations or as Gru (1973) suggested, the
exclusive use of zero-one dummy variables, which violates
the underlying assumption of normal distribution in the
multiple discriminant analysis?
Deakin (19721, employing the fourteen ratios of
Beaver (19661, devised a decision rule that would be .
valid over a cross-sectional sample of firms. Thirty two
firms which failed between 1964-1970 were selected.
Deakin found when using three years of data prior to
failure, that the second year prior to failure proved to
have the greatest classification ability.
Gru (1973) conducted a study on small business to
build a predictive model for assessing the credit
worthiness of potential debtors in the U.S, and whether
financial ratios together with the application of
multivariate discriminant analysis could be used in small
business sector. He defined small business as one with
total assets less than $ 2,200,000. His study
consisted of 68 firms representing an equal number which
failed and which have not failed, and a secondary sample
of 13 failed and 15 nonfailed firms.

The final model contained five ratios correctly and
predicted 94% of the primary sample, and 86% of the
secondary sample. His model was as follows:
where
XI = Earning before tax plus depreciation/total
debt
X2 = Working capital / total assets
X3 = Net sales / total assets h
X4 = Operating profit / total assets
X5 = Total. debt / total assets
Z = Discriminant score
It can be seen that the variables X2, X g l X4 are the
same ratios that Altmin had used in the analysis of large
manufacturing companies in 1968. The major criticism of
this study is the period of time of 16 months for
collecting the data before the date of failure which is
not a significant duration for prediction.
Trieschmann and Pinches (1973) studied insurance
company insolvency and constructed a model to identify
those companies with a high probability of financial
distress. Six variables from an initial set of seventy
were included in the multiple discriminant analysis model
which correctly classified 49 of the 52 companies

included in the study, which means a 94 percent accuracy.
The researchers suggested that although their model based
on financial data was quite accurate for the time period
of the study (1966-1971), the identification of
financially failed companies is virtually worthless
unless regulatory authorities intervene before it is too
late.
Blum (1974) believed that a failing company was
likely to harm the community in which it was located in
addition to the employees, creditors, and owners
associated with the failing company. This study was
carried out to construct a theoretical model, based on
accounting and market data which can distinguish failing .
from nonfailing companies. His 'sample consisted of 115
companies failed during 1954 - 1968 and 115 nonfailed .
The failed and nonfailed companies matched for
industry, sales, employees and fiscal year. For both
groups data were collected from balance sheets, income
statements and stock market prices. for a consecutive
period of eight years when available, but five years of
data prior to failure was found to be optimal. Failure in
this study was based on' inability of the company to pay
debts as they fell due, entrance into a bankruptcy
proceeding and explicit agreement with creditors to
reduce debts.
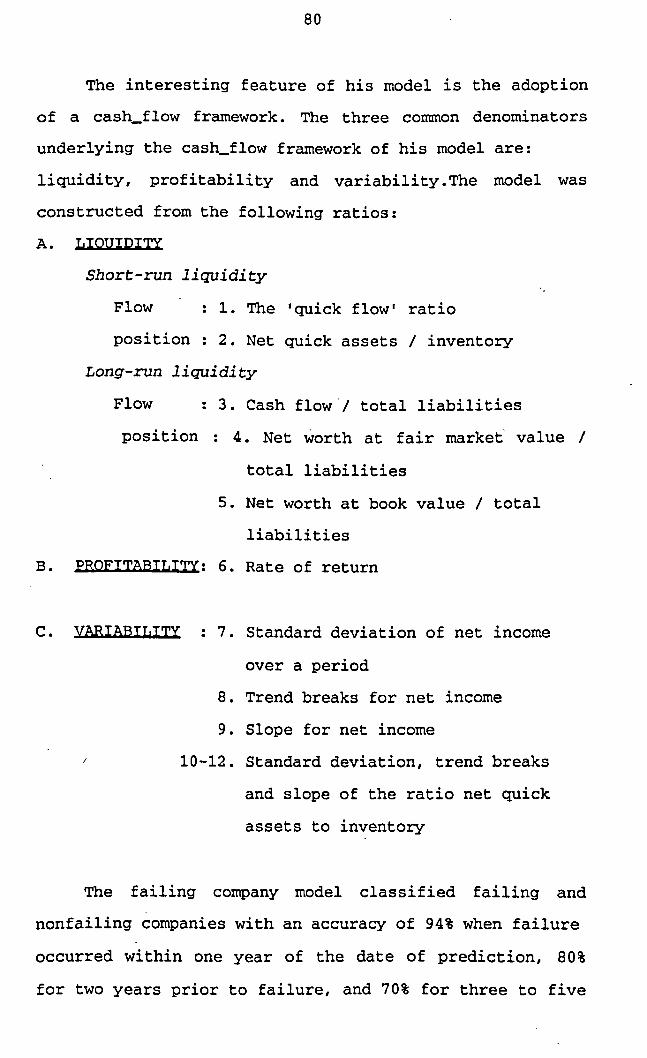
The interesting feature of his model is the adoption
of a cash-flow framework. The three common denominators
underlying the cash-flow framework of his model are:
liquidity, profitability and variability.The model was
constructed from the following ratios:
A. LIOUIDIm
Short-run liquidity
Flow : 1. The 'quick flow1 ratio
position : 2. Net quick assets / inventory
Long-run l i q u i d i t y
Flow : 3. Cash flow'/ total liabilities
position : 4. Net worth at fair market' value /
total liabilities
5. Net worth at book value / total
liabilities
B. PROFITABILITY: 6. Rate of return
C. YAUAlU= : 7. Standard deviation of net income
over a period
8. Trend breaks for net income
9 . Slope for net income
10-12. Standard deviation, trend breaks
and slope of the ratio net quick
assets to inventory
The failing company model classified failing and
nonfailing companies with an accuracy of 94% when failure
occurred within one year of the date of prediction, 80%
for two years prior to failure, and 70% for three to five

years prior to failure. This model shows a long term
predictive accuracy but it is rather complicated to use
and the information cost is high.
Chesser's research (1974) was to ascertain if the
evaluation process of commercial loans could be improved
through the utilisation of financial ratios. His primary
objective was to develop a model to predict
customers'noncompliance with the loan agreement. The
period of the study was 1962-1971 with data collected
from the loan files of four commercial banks. The study
utilised fifteen ratios which he grouped under the
categories of liquidity, leverage, activity, and
~ r o f itability. Discriminant analysis identified a subset
of six ratios:
1. Cash and marketable securities to total assets.
2. Net cash to cash and marketable securities.
3. Earnings before interest and taxes to total assets.
4. Total debt to total assets.
5. Fixed assets to net worth, and
Working capital to net sales.
The probability model developed from these ratios had a
degree accuracy predicting loan noncompliance
one year prior to its occurrence.
Libby (1975) ' investigated the ability of loan
officers to interpret ratio information for predicting
business failure. The officers reviewed five ratios for
sixty companies used in the study conducted by Deakin
(1972). The ratios were:
Net income to total assets.
Current assets to sales.
Current assets to current liabilities.
Current asset to total assets.
Cash to total assets.
The loan officers had a "prediction achievement" average
of 74% , and, they ranked current assets to current
liabilities and net income to total assets as the most
important ratios of those provided. Libby aiso found that
the loan officers who indicated a greater emphasis on the
net income to total assets ratio had a higher prediction
accuracy.
Altman and Loris (1976) constructed a failure model
utilizing a quadratic multiple discriminant analysis on
the over the counter broker-dealers. Twenty four ratio
and non-financial indicators were used to determine which
of these ratios and indicators would show significant
differences between active and failed companies. Their
final model consisted of the following six variables:
1. Net income after taxes / total assets.
2. Total liabilities plus subordinated loans / ownersi
equity.
3. ,Total assets 1 adjusted net capital.
4. Ending capital less capital additions / beginning

capital.
5. Scaled age.
6. A composite of ten other elements.
Their primary sample contained 40 failed and 113
active companies. The resulting model was 90% accurate on
classification of the primary sample and 67% for a hold
out sample of 24 companies.
Moyer (1977) re-examined Altmanls (1968) original
failure model with a different data set which involved
companies from the period 1965 - 1975 with a larger asset size, while Altman's data set involved companies from the
period 1946 - 1965. He found that Altman's model was
sensitive to either the time span or to the asset size
and the predictive power of the original model decreased
greatly. By using the stepwise .multiple discriminant
approach Moyer re-estimated the parameters and he
observed that somewhat better Iexplanatory1 power could
be obtained from the model if the market value of equity
to total debt and sales 'to total assets are eliminated
from the model.
A study of financial ratios for listed public
companies in Australia was reported by Bird and. McHugh
(1977). The authors were concerned with the food,
electrical, and accommodation industries during the .1967-
1971 period. The total sample size was 118 companies of
which fifty companies were a random control group. The
authors considered- five ratios concerned with liquidity,

financial structure, and operating efficiency of a
company. The mean, variance, and skewness were calculated
for each ratios for each industry in each year. The
~hapiro-Wilk's test for normality and rank correlation
tests for stability were performed on the ratios. The
authors concluded there is some evidence to support the
concept that industries differ in their ratios. The study
found that the distribution of ratios within an industry
were approximately normal in most cases. This study was
limited due to:
1. using only five ratios.
2. The selection of companies was concerned only
with those that did not fail.
Most of the studies carried out in this area up to
early seventies were by American researchers, however in
mid seventies the first British study as far as I know
was reported by Taffler, R and Tisshaw, H., (1977) They
selected a sample of 46 failing and an equal number of
nonfailing companies matched by size and industry.
Failure in this study was defined as entry into
receivership, creditors voluntary liquidation, compulsory
winding up by order of the Court or reconstruction with
Government financial aid. They examined 80 financial
ratios using multiple discriminant analysis for the
identification of potentially bankrupt manufacturing
companies in advance of failure. From those 80 different
ratios only four were able to predict with 98% accuracy

one year prior to failure. The final discriminant
function was in the form:
Where
Z = overall index
Co= a constant
C1 - C4 = ratios weights or coefficient
R1 = profit before tax / current liabilities
R2 = current assets / total liabilities
R3 = current liabilities / total assets . R4 = no-credit interval
The four ratios of Tafflerus model measure four
different aspects of a company's operation:
1. R1 : profit before tax / current liabilities
This ratio measures a companyus profitability and its
ability to cover its current liabilities through its
earning power, its contribution to the predictive ability
of the model was 53% , and ranked the first.
2. R2 : current assets / total liabilities
This ratio measures the liquidity of the company its
contribution the model was and ranked the
- fourth.
3. R3 : current liabilities / total assets.
his ratio is one of the indication of company's
capital structure. It ranked the second according to its
contribution which was 18% .

4. R4 : No-credit interval, defined as
This
~uick assets - Current liabilities .................................. Total sales - pre-Tax profit ratio measures the short liquidity the
company and is the time in days for which the company can
continue to finance its operations from its resources if
its short term finances are cut off. ~t accounts for 16%
of model's power and ranked third.
The authors did not report the actual coefficients or
ratios weights and the constant value but the greater R1,
R2, R4 and the lower the R3, the higher the Z-score and
then the less the company is in risk.
Taffler concluded that the model was able to predict
with a near 100% accuracy of company failures and in some
cases up to four to five years prior to the failure
event, whereas only 22% of the 46 quoted and none of the ' .
31 unquoted manufacturing bankrupt companies' final
audited reports contained auditors' opinions indicating
going concern problems. He suggests that the auditors may
find the Z-score model an important tool for the
prediction of company solvency and for the evaluation of
corporate credit-worthiness .-~. . .- as well as banks, controllers,
and creditors.
Altman; Haldeman, and Narayanan (1977 ) developed the
ZETA model for bankruptcy prediction of retailing and
manufacturing corporations. The model is commercially

available through by Wood, Struthers and Winthrop, and
ZETA is their trade mark. The average asset size of their
study was one hundred million dollars in total assets for
both groups of failed and nonfailed companies. They
selected 53 bankrupt firms which failed during 1969-1975
and a matched sample of nonbankrupt firms, they examine
27 variables , the final model contained seven variables.
he Lachenbruch, -(1967) validation test had an overall
prediction accuracy of 92% one year prior to failure.
They found that the ZETA model appeared to be quite
accurate for up to five years prior to failure with
prediction power ranging from 90% to 70% one to five
years prior to failure respectively.
Belkaoui (1978) published research using sixteen
financial ratios to predict the probability of takeover
of ~anadian companies. A dichotomous classification test
found that nonliquid asset ratios showed superiority in
predicting takeovers, with an 80% accuracy - in
classification. The author stated that the model has to
be used cautiously since a limited number of industries
and companies were involved.
Bulow and Shoven (1978) presented an economic model
to investigate the circumstances under which companies
can be forced into bankruptcy. Their model was concerned ,
with the conflicts of interests among those who have
claim to the assets ,and income flow of the company. The
three classes of claimants that the authors considered

were the bondholders, the bank lenders, and the equity
holders. The conclusions bf the study were based on the
analysis of the econo&c model and were not tested
against any empirical data. The authors concluded that
the equity holders were' adverse to bankruptcy since they
would be the last to receive payment on liquidation of
the company. They found that companies with asset
portfolios containing a higher percentage of liquid
assets would increase their chances of continued
existence. Also, the existence of negative net worth was
not considered to be a sufficient condition for choosing
bankruptcy. Finally, the study found that when tax
considerations are included in the model, the company
would tend to attempt a merger. The authors concluded
that the lack of symmetry in the tax system encourages
the continuance of a company instead of liquidation.
Hoeven (1979) published a study to determine when
small businesses would default on their loans. The sample
of non-Sma11 Business Administration (SBA) , small
business comercial bank loans was provided by twelve
banks in Denver. An initial set of thirty-eight ratios
was constructed. Factor analysis of these ratios
identified eight distinct groups, five of which explained
. 89% of total variance. The dominant ratios indicated a
strong significance of liquidity type variables. The five
variable discriminant function developed from these
results correctly classified only sixty-two percent of
the cases. A second (stepwise) discriminant analysis was

performed using all thirty-eight ratios. The best results
65% correct classification were obtained for a seven
variable model. Only one common variable was chosen in
both the stepwise procedure and the factor analysis, this
being the net working capital to sales ratio. Additional
research found that percent change or trend variables
were better predictors of default than static financial
ratios.
Ohlson (1980) presented empirical results to predict
corporate failure in which the data set was for 1970-
1976. The 105 bankrupt companies were derived 'from the
COMPUSTAT files . Nine independent variables were used in the study and the conditional logit model predicted
correctly 96% of the companies. Ohlson found that the
ratios deteriorate as a company moves from the
nonbankrupt to the bankruptcy stage.
In addition, four factors were identified as
statistically significant in assessing the probability of
bankruptcy within one year: size of company, financial
structure, performance measures, and some current
liquidity measures.
Whittington (1980) considered the use of accounting
ratios'in statistical procedures and the basic properties
underlying their use. He stated that the basic assumption
of ratio analysis is that a proportionate relationship
exists between two variables whose ratio is calculated.
In his opinion ratios can be used either for estimation
of a functional relationship, usually for purposes of
prediction, or for a normative role in which the ratio is
compared with a standard. The conclusion of the study was
that ratios lend themselves to statistical use due to
their ability to reduce variables to similar scales, but
the correlation of ratios can lead to biased results if
not considered in the analysis.
~asey (1980) , replicating Libby's (1975) research
under somewhat different conditions, reported the ability
of bank loan officers to predict failure of companies
based on six financial ratios: net income to total
assets, net sales to current assets, current assets to
total assets, current assets to current liabilities, cash
to total assets, and total liabilities to owners' equity.
~orty-six loan officers were given three years of
financial data for thirty companies (of which half had
failed) and were asked to identify the failed companies.
The author attempt match bankrupt and
nonbankrupt companies and stated that the extent to which
the predictions were affected were unknown. The study
found that 41 of the 46 subjects could predict the
nonbankrupt companies over 50% of the time, while none of.
the loan officers could predict the bankrupt companies
over 50% of the time. The author perceived that the loan
officers considered total .liabilities to ownerso equity
and 'current assets to current liabilities as the most
important of the six ratios,used.

The characteristics that would aid in the
identification of failure in the banking industry were
examined in a paper by Rose and Scott (1980) . Their study also attempted to determine if recent changes in industry
practices, being toward more aggressive profit seeking,
were associated with failures of the commercial banks.
Since the authors found that existing research had not
yet identified any pre-failure characteristics for the
largest U.S. bank failures, they used the eleven largest
commercial bank failures in the 1970s. A control group of
nonfailed banks was selected with the only requirement
that total deposits exceeded seventy-five million
dollars. Their model focused on the determinants of
return on equity; leverage ratios, asset turnover, and
net after tax profit margin. These factors were then
expressed in terms of total loans to total assets,
municipal securities to total assets, interest on
deposits to total time and savings deposits, interest and
fees on loans to total loans, 'equity capital to total
assets, and interest-sensitive liabilities to earning
assets. The authors found that the statistical outlier
technique contained within program multiple discriminant
(MULDIS) developed by Eisenbeis and Avery did not provide
evidence of a relationship between the banks1 failure and
their financial profiles. In addition, changes in banking
practices toward more profit-seeking and greater risk-
taking were not associated with failure. The failure of
major banks seems to be due to endogenous factors of the
individual banks and their management.
A' significant contribution to this field was made by
Ismael G. Dambolena and Sarkis J. Khoadry, (1980) when
they incorporated measures of stability in their model
and succeeded in improving the predictive power of the
model. Although Altman in his study of 1977 called ZETA
model had introduced the stability measure of earnings,
Dambolena and Khoudry claimed that Altmanos model was far
from adequate because not all the ratios had been tested
for stability over time.
They considered a sample of 34 failed companies
during 1968-1975 and an equal number of nonfailed
companies. The failed and nonfailed companies was matched
by industrial classification as appeared in Dun and
~radstreet's million dollar directory. Data for both sets
of failed and nonfailed companies were collected for the
eight years prior to failure. They examined 19 ratios
which cover four dimensions of company's operations:
profitability, activity, liquidity, indebtedness, and
they defined the following variables measuring the
stability of the ratios over time ;
1. The standard deviation of ratios over a three year and
a four year period.
2. The standard error of estimate- around a four year
linear trend.
3. The coefficient of variation over a four year periods.
They found the standard deviation of the ratios give
the best results, thus two discriminant functions were

evaluated, first by using ratios alone and second by
using both ratios and their standard deviations. The
classification performance of the discriminant function
was as follows:
Percent Correct Classification .................................... Years Prior to Failure ................................
1 3 5 ......................................................... ~atios Alone 94.4 79 .7 70.3
~atios & Standard 95.7 89.1 82.6 ~eviations .........................................................
They concluded that their model performs better with
the inclusion of the stability measures for the years one
three five prior to failure as it can be seen clearly
from the result above.
The use of nonfinancial variables in small
businesses by loan officers was evaluated in a paper by
Cowen and Page (1982). The authors examined eight
nonfinancial variables which they grouped into three
classification: demographic characteristics of the owner,
characteristics of the company, and the characteristics
of the loan. The data used in their multiple discriminant
analysis was drawn from the client files of the office of
~inority Business Enterprise of Cleveland, Ohio. A sample
of 60 companies was selected and consisted of 26
successful loans and 34 unsuccessful loans. The authors

examined the variables for correlation and found that the
various groups of variables had low correlation. The
Lachenbruch holdout method of classification was used for
validation of the resulting model. The model consisting
of three variables owners1 age, ownersa net worth, and
the size of the loan, correctly classified 73% of the
cases. The authors concluded that the model should be
used with caution due to the local nature of their
sample.
The use of the Altman (1968) bankruptcy model as an
active tool to aid in the financial turnround of a
company was discussed by Altman and La Fleur (1981). The
authors showed that the decisions which helped to save
the financially troubled GTI Corporation were
specific all^ motivated by understanding the financial
ratios in the bankruptcy model. Using the model as a
guide, the company8s management was able to avoid the
impending bankruptcy and create a sound financial base.
The authors believed active use of certain predictive
models as tools in the decision process,-offers management
more opportunities to improve business strategies.
Konstans and Martin (1982) presented a financial
model which would be simple and useful to businessmen.
The authors stated that although mathematical models are
very helpful to the decision maker, these models
introduce additional complexities to the users. They also
believed ratio analysis of financial data is a powerful

tool which has not received enough attention. Ratio
analysis has the merits that:
1. Financial ratios are easy to compute.
2. The ratios are expressed in a common dimensionality,
and,
3. The necessary data are easily obtained from the
financial statements.
The authorsm model structured around profitability
and f inancia1 stability, contained eighteen ratios. The
ratios were classified as either primary or secondary
ratios, representing the problems and the symptoms of
problems, respectively. The authors also grouped the
ratios according to variables they measured: margin,
turnover, balance, liquidity, and solvency. They
concluded that perhaps ratio analysis has been neglected
due to the large number of commonly employed ratios, and
that the large number of ratios may overwhelm the
businessman in their analysis. Ratio analysis should
result in identifying the underlying causes of a problem
and not merely lead to an evaluation of a problemms
symptoms
Research concerning general trends and macroeconomic
conditions that affect business failures was published by
Altman (1983). He constructed a first difference
distributed-lag . regression model to evaluate the
aggregate economic. influences in the United States for
the period 1951-1978. The dependent variable was the
change in the business failure rate as reported by Dun
and Bradstreet.
Four independent variables used in the model were:
1. Percentage change in real GNP.
2. Percentage change in the money supply.
3. Percentage change in the Standard and Poor's 1ndex.
and,
4. Percentage change in new business formation.
Altman found that the model's overall results were
quite encouraging considering the problem of aggregation
of the microeconomic events that led to failure. The
model was also used to predict the changes in the
business failure rate in the future, and the prediction
was for a record number of filings for bankruptcy in 1980
and 1981 which did occur.
~ollowing the same approach of the stability of
financial ratios used by Dambolena and Khoury (1980),
Betts and Belhoul (1987) carried out a study on U.K.
companies to build a more sophisticated model to identify
companies at risk. of failure. The period of their study
covered the years 1974 to 1978 for the failed companies,
and because of missing data the number of failed
companies used were 39 in the first year before failure,
36 in the second and 31 in the third year. The companies
for the going concern group were 93 selected from an

Exstat tape, they do not attempt to match the failed and
nonfailed companies by size, industry, or financial year.
They evaluated four classes of variables:
1. Financial ratios:
29 financial ratios were selected on
the basis of their popularity in the
literature and their ability to
discriminate between.failed and
nonfailed companies in previous
studies.
2. Measures of stability:
a. Financial ratios stability measures;
They compute the standard deviation of each of the
29 ratios over three years period.
Balance sheet decomposition measure ;
This measures the changes in the assets and
liabilities structure over the previous year.
3. Measures of trend; -
They select the total assets, total
sales, total employees, and
inventory to compute the trend over
three years period for these
variables as well as the changes in
the above variables over the
previous year.

4. Measures of size:
The three measures of size they
select were total assets, total
sales, and total employees.
The authors construct two discriminant functions for
each of one, two, three years before failure, the first
function contained only the financial ratios, and' the
second with all variables ( financial ratios plus the
four stability measures described above) . Neither the
trend measures nor the balance sheet decomposition
measures appear in any of the discriminant models which
were obtained by using the stepwise procedure based on
~ilks' lambda, the reasons for that they state :
the case
are
can
likely
the
argued
balance
that
carry
the
most
sheet decomposition
financial stability
its potential
measure ,
measures
inf ormat ion
content and therefore. make it redundant once they are
included in the models. However, regarding the trend
measures, .it is more difficult to relate their
- information content to that of financial ratios and
stability measures. might that the short term rate
of growth of a company is not as important as a well
balanced and stable structure in determining its chances
of survival.'
heir best discriminant function was chosen on the basis
of the classification results from the analysis sample as

well as a validation sample, however they do not report
the actual coefficients or ratios weights of the
variables that entered their best function which finally
was tested for multivariate normality and equality of
dispersion matrices. They conclude that the test for the
multivariate normality was rejected for both failed and
going concern groups whereas the test for equality of
dispersion matrices was not strongly rejected.
The final conclusion they reach was:
'The inclusion o f the financial s tab i l i t y concept i n the
framework o f the discriminant model for identifying
bankruptcies improved the ability o f the model t o
distinguish between failed and nonfailed firms, b u t i t
could be argued t h a t a standard deviation based on three -
observations does not have any s tat is t ical meaning.
However, i t could be suggested that these measures should
not necessarily be regarded as estimates o f the s tab i l i t y
o f financial ratios, b u t rather as a description o f their
behaviour over the last three years.
The variables selected are related t o financial
dimensions t h a t were found to be relevant i n most o f the
previous research, namely prof i tabi l i ty , financial
leverage, and liquidity. The selected financial s tab i l i t y
measures account for the same kinds o f financial
dimensions, w i t h the addition o f credit management. It
therefore seems that the ffnanci a1 s t a b i l i t y concept does
not reduce the. role played by. financial r a t i o analysis i n
forecasting compaqy failure, but is merely camplementary

t o it. Consequently, i t appears l i k e l y t h a t this k i n d o f
concept could prove u s e f u l i n o t h e r a reas o f f i n a n c i a l
and company performance research. a (Betts and Belhoul,
1987, P. 332)
Although the research studies cited in this chapter
were concerned with the development of models to predict
n ~ ~ ~ c e s s n or 'failuren of companies, all studies did not
use the same types of financial variables. This
difference in the selection of financial variables could
be attributed to the different time periods investigated
and to the various industries for which the data were
collected. Numerous studies reduced a large set of
financial variables to a much smaller set of significant
variables through the employment of statistical
procedures such as regression analysis and multiple
discriminant analysis.
The predictive power of these analyses seems to be
dependent upon the choice of analytical procedures
utilised as well as the selection of specific ratios and
other indicators. Several financial ratios were found to
be good predictors. in more than one study; however, no
particular ratio appears to loom predominantly. Table 3.1
presents a summary of some selected references along with
categories of financial ratios used by the authors. Table
3.2 detail the specific ratios.

$1 L)
k -rl
2 $ 2 JJ OL) -rl E: U 4 k 4 " 3 a
d ca a,G
.rl tnd 0 a-rl % B " m C 3 Q)
.rl at3 Crcd-
n
$1 JJ JJ
d C-rl 0 a d
E d J J S kmca s o u JJ S-rl a, d'u d H O
k PI w
d E: k
Q) "'E $ .rl
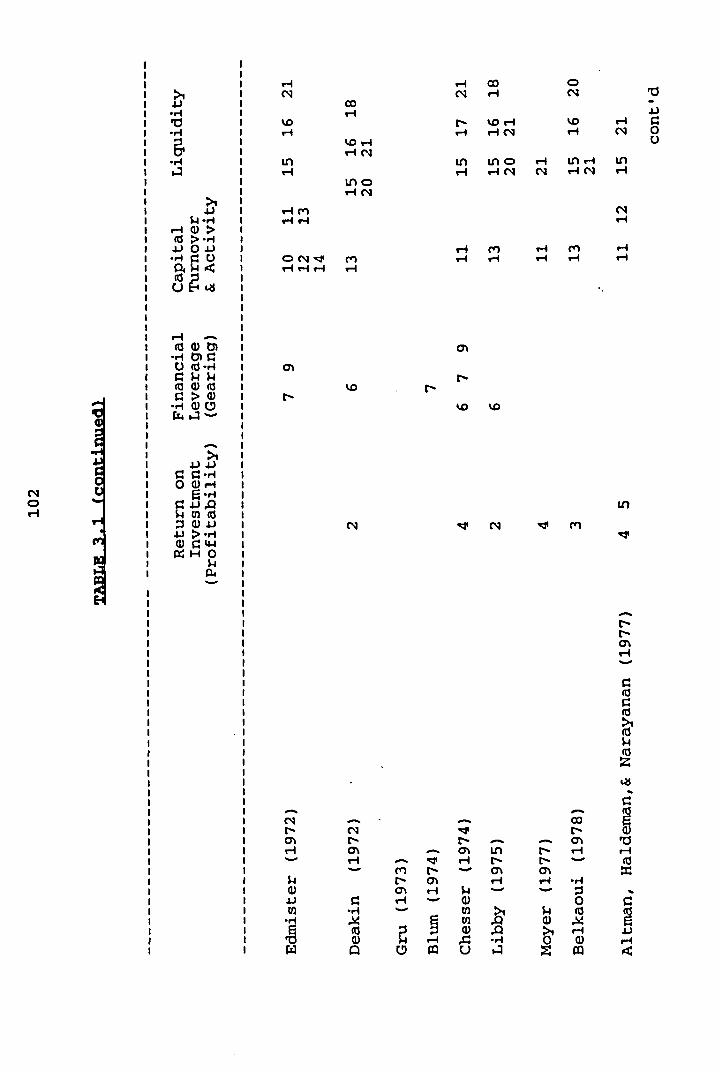

..................................... ..................................................... Return on Financial Capital Liquidity Investment Leverage Turnover
(Profitability) (Gearing) & Activity ...........................................................................................
Hoeven (1979)
Ohlson (1980) 2 -. 6 15 21
Dombolena & Khoury (1980) 1 2 3 6 7 9 , 10 13 15 16 14
Casey (1980) 2 7 15
Taf fler (1980) 4 7 16
Altman & La Fleur (1981) 4 11 21
Konstans & arti in (1982)
Taffler & Sudarsanam (1982) 4 7 14 20
Betts & Belhoul (1987) 4 ...........................................................................................
(1) The specific financial ratios representing the numbers under each category appears in table 3.2 and were used in at least three of the references cited. In most studies other variables were also incorporated in the analysis. In addition, some authors used the reciprocal of a particular ratio (e.g., net wort/sales and sales/net worth). It should be noted also that terminology which define the components of a ratio has not been used consistently and as a result, computations of a particular ratio have not been standardised ( i.e., there are no agreed on standards in computing financial ratios).

SPECIFIC FINANCIAL RATIOS USED IN SELECTED FAILURE STUDIES PRESENTED IN TABLE 3.1
RATIOS - ON I N V E S T M E N T O R = RATIOS
1 Net Income 7 Sale 2 Net Income / Total Assets
3 Net Income / Net Worth 4 Earnings Before Interest And Tax / ~otal Assets 5 Net Income / Total ~iabilities
GE (GEARING)
6 . Total Liabilities / Total Assets
7 New Worth / Total Liabilities 8 Net Worth / Total Assets 9 Fixed Assets / Net Worth
0- ACTIVITY RATIOS
10 Sales / Net Wort 11 Sales / Total Assets. 12 Sales '/ Fixed Assets
13 Working Capital / Sales
14 Inventory / Sales
15 Current Assets / Current Liabilities 16 Quick Assets / Current Liabilities 17 Cash / Total Assets
18 Cash / Current Liabilities 19 Inventory / Current Assets 20 Quick Assets / Total Assets 21 Working Capital / Total ~ssets
22 Working Capital / Current Liabilities

The objective of this study is to attempt to
construct a financial model using accounting ratios
derived from published financial statements. These
statement,s are readily available from a number of
sources. The model is to be used to help identify small
and medium sized companies in the U.K in danger of
financial failure up to five years before its occurrence.
A classification problem arises, when classification is
based on a single financial ratio at a time. This was
described in the first section of chapter three.
However due to the multivariate nature of finance,
the predicting power of ratios is cumulative. No single
ratio. predicts nearly as well as a small group of ratios.
The development of multivariate statistical models led
to the adoption of a multivariate approach to this
problem.
Although various ' statistical techniques are
&ailable under this approach, the more recent studies
have used the technique known as ~ultiple Discriminant
~nalysis as described in the second section of chapter
three. This technique was first developed by U.S

archaeologists working in Arizona Desert, Chandrasekaran
(1983). They were digging up skulls and wanted to know
which of the two Red Indian tribes they belonged to. They
began by examining skulls where they knew the owner's
tribe to see what characteristics best discriminated
between the two tribes. All Sioux may have thick skulls
but that does not help if the Iroquois do too. So they
looked for characteristics where the difference between
Sioux and Iroquois was greatest. NO single characteristic
is enough by itself, Sioux may have generally pronounced
cheekbones and Iroquois flat cheekbones, but if there are
a few flat-cheeked Sioux something else must be used as
well. ~ndividual characteristics are combined to produce
a picture of the two Red Indian tribes. Each
characteristic is allocated a value and the total of
these values is known as a Z score. This might be
arranged so that a positive Z score represented a Sioux
and a negative Z score meant an Iroquois.
STATISTICAL:
~ultiple discriminant analysis is a statistical
technique which classifies a categorical dependent
variable into one of two or more groups depending upon
characteristics of several independent variables. The two
groups in this study correspond to the failed companies
and the nonfailed companies while the characteristics are
the financial ratios. I

Klecka (1975, p.435) stated that "the mathematical
objective of discriminant analysis is to weight and
linearly combine the discriminating variables in some
fashion so that the groups are forced to be as
statistically distinct as possiblem.
ise en be is and Avery (1972) stated that:
"Discriminant analysis encompasses both predictive ' .
and inferential multivariate statistical techniques.
It deals with a specific class of statistical
problems focusing on the analysis of group population
and/or data sets. In general, the underlying
assumptions of discriminant analysis are that (1) the
groups being investigated are discrete . and
identifiable, (2) each observation in each group can
be described by a set of measurements on m
characteristics or variables, and (3) these rn
variables are assumed to have a multivariate normal
distribution".
The objectives . of discriminant analysis are well suited
to accomplishing the objectives of this study, these
being:

1. To determine if statistically significant
differences exist between the average score
profiles of the two a priori defined groups (i.e.
failed and nonfailed companies).
2. To establish procedures for classifying the
statistical units small-medium companies)
into groups on the basis of their scores on
several variables ( i.e. financial ratios).
3. To determine which of these independent
variables account most for the differences in
the average score profiles of the two groups.
These objectives introduce the concepts . of a priori
defined groups and average score profiles. These concepts
are explained graphically in figure 4.1 for the two
variables, two group discriminant problem. While this
figure illustrates only two measurement (XI and X2) for
each failed and nonfailed company, twenty two measurement
were utilised initially in the statistical analysis of
the present study.
Figure 4.1 portrays a scatter diagram of the two
measurements xl and x2. These could be for some companies
of the two groups. The ellipses F and N could depict the
two a priori defined groups of companies which fail (F)
and did not fail N . Particular companies which failed
and did not fail are represented with an * (asterisk) and
a . (dot) respectively. Although a company can only be a member of one of the two groups, some overlap of the
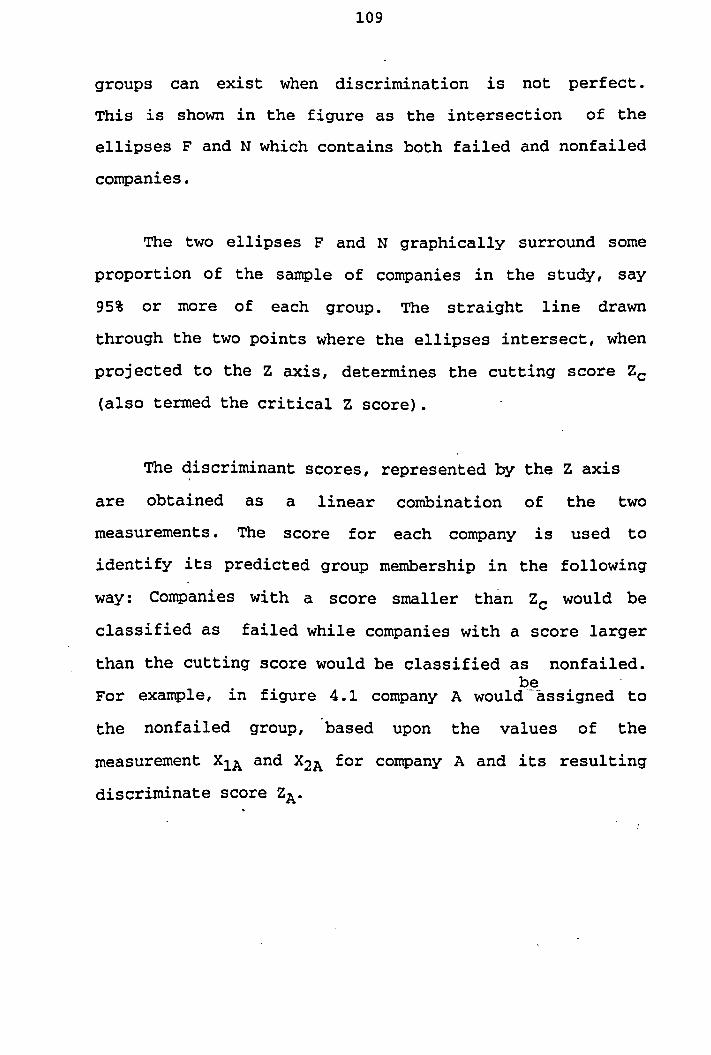
groups can exist when discrimination is not perfect.
d his is shown in the figure as the intersection of the
ellipses F and N which contains both failed and nonfailed
companies.
The two ellipses F and N graphically surround some
proportion of the sample of companies in the study, say
95% or more of each group. The straight line drawn
through the two points where the ellipses intersect, when
projected to the Z axis, determines the cutting score Zc
(also termed the critical Z score).
The discriminant scores, represented by the Z axis
are obtained as a linear combination of the two
measurements. The score for each company is used to
identify its predicted group membership in the following
way: Companies with a score smaller than Zc would be
classified as failed while companies with a score larger
than the cutting score would be classified as nonfailed. b_e_ For example, in figure 4 . 1 company A would assigned to
the nonfailed group, based upon the values of the
measurement XIA and for company A and its resulting
discriminate score ZA.

FIGURE 4.1
Two-Group Discnmlnant Analysis
Source: Roben 8. Welker "Oiscnminant Analysis as an Aid to Employee Selec- tion." 739 Accaunang Renew, XLlX (July. 1974). p. 5 15.

F1 and N' represent the distributions of the
discriminant scores for companies in groups F and N. The
shaded area, corresponding to the overlap of the
distributions F a and N1, is smaller than that which could
be obtained for any other line drawn through ellipses F
and N. The separation of the groups F and N is maximized
by the minimisation of this overlap between the
distributions F1 and N1. Altman (1968) referred to this
overlap as the zone of ignorance, which represents the
range of discriminant scores for which rnisclassifications
can occur.
Thus, discriminant analysis determines the linear
combination of two or more independent variables that
best separates the a priori defined groups. This
discrimination is accomplished by the statistical
decision rule of maximizing the betw- - Yariance
relative to the . . - variance , as expressed in
ratio form. Discriminant analysis can be useful in two
ways :
(1) determining group differences,' and
(2) classifying companies into their apparent group
memberships.
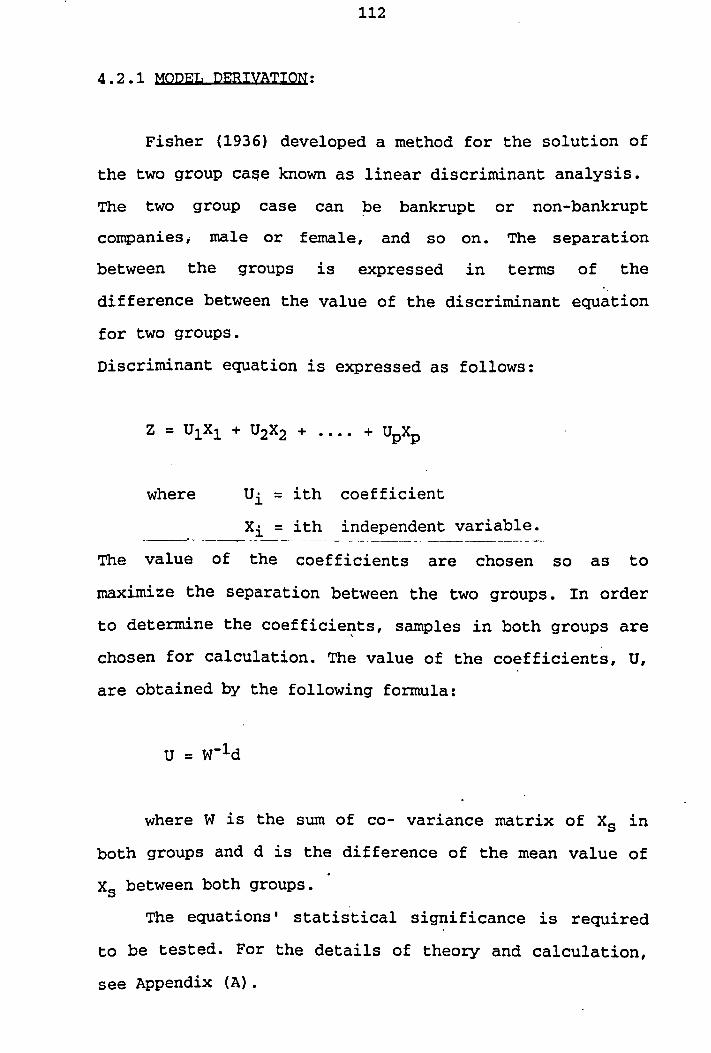
MODEL:
l is her (1936) developed a method for the solution of
the two group cage known as linear discriminant analysis.
The two group case can be bankrupt or non-bankrupt
companies, male or female, and so on. The separation
between the groups is expressed in terms of the
difference between the value of the discriminant equation
for two groups.
~iscriminant equation is expressed as follows:
where Ui = ith coefficient
Xi = ith independent variable. -
The value of the coefficients are chosen so as to
maximize the separation between the two groups. In order
to determine the coefficients, samples in both groups are
chosen for calculation. The value of the coefficients, U,
are obtained by the following formula:
where W is the sum of co- variance matrix of Xs in
both groups and d is the difference of the mean value of
xS between both groups. The equations statis.tica1 significance is required
t
to be tested. For the details of theory and calculation,
see Appendix (A).
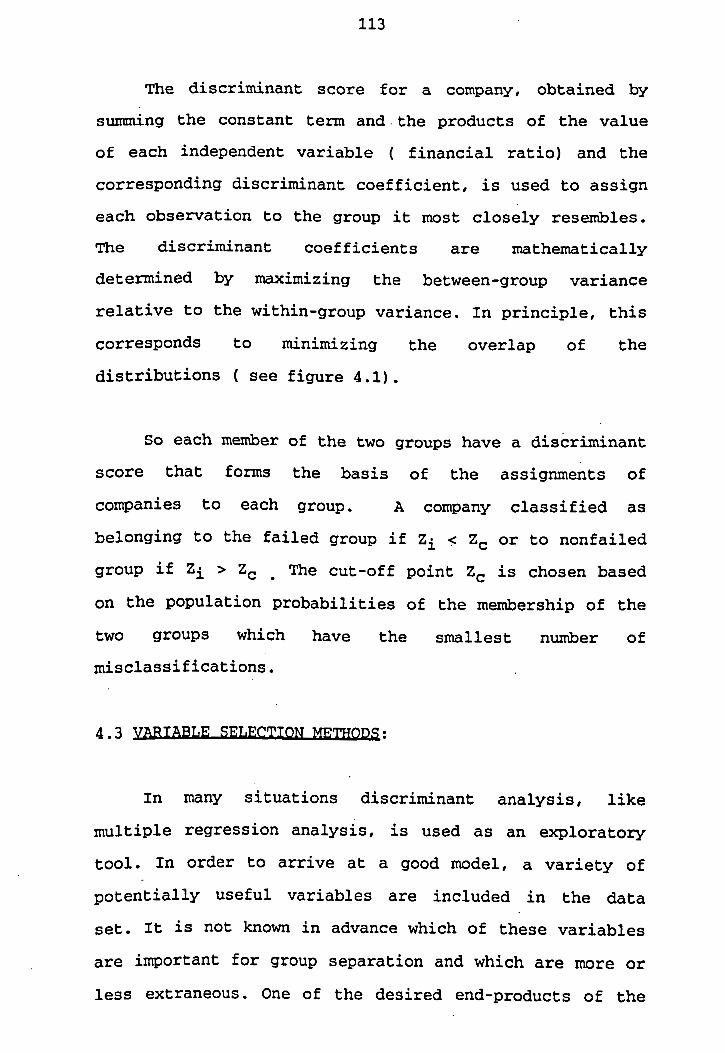
The discriminant score for a company, obtained by
summing the constant term and - the products of the value
of each independent variable ( financial ratio) and the
corresponding discriminant coefficient, is used to assign
each observation to the group it most closely resembles.
The discriminant coefficients are mathematically
determined by maximizing the between-group variance
relative to the within-group variance. In principle, this
corresponds to minimizing the overlap of the
distributions ( see figure 4 .l) .
So each member of the two groups have a discriminant
score that forms the basis of the assignments of
companies to each group. A company classified as
belonging to the failed group if Zi < Zc or to nonfailed
group if Zi > Zc . The cut-off point Zc is chosen based on the population probabilities of the membership of the
two groups which have the smallest number of
~sclassifications.
4 . 3 u a r m , R S F T I F C T I O N :
In many situations discriminant analysis, like
multiple regression analysis, is used as an exploratory
tool. In order to arrive at a good model, a variety of
potentially useful variables are included in the data
set. It is not known in advance which of these variables
are important for group separation and which are more or
less extraneous. One of the desired end-products of the

analysis are the identification of the mgoodm predictor
variables. The most three commonly used algorithms for
variables selection available on S P S S ~ are :
1. The forward entry.
2. The backward elimination, and
3. The stepwise selection based on Wilks' lambda.
In the forward selection method variables are added
to the discriminant function one at a time until there is
no increase in the discrimination between the two data
groups. At each step a variable enters the discriminant
function, all other variables already in the new function
will be tested for their contribution to the discriminant
function's power. It should be stated that variables
entering the function in any previous steps could be
removed from the discriminant function if they no longer
make any contribution to the function's discrimination
power.
. While the forward selection method starts with no
independent variables in the equation and sequentially
enters them, backward elimination starts with all
variables in the equation and sequentially removes them.

Instead of entry criteria, removal criteria are
specified.
Two removal criteria are available in SPSS~. The \
first is the minimum F value (FOUT) that a variable must
have in order to remain in the equation. Variables with F
value less than this F to remove are eligible for
removal. The second criterion available is the maximum
probability of F to -remove (POUT) a variable can have.
4.3.3 *1RS RASRD ON W I T =
LAMBDA:
Since stepwise variable selection combine the
features of forward selection and backward elimination,
this method will be discussed in,details.
~ilks' lambda A is the ratio of the within groups sum of
squares of cross products (W) to the total sum of squares
of cross products (T) for p variables. .Therefore Wilks'
lambda for (1,2, . . . . . ,p) is :
1f a variable is added then a partial statistic can be
derived as follows:
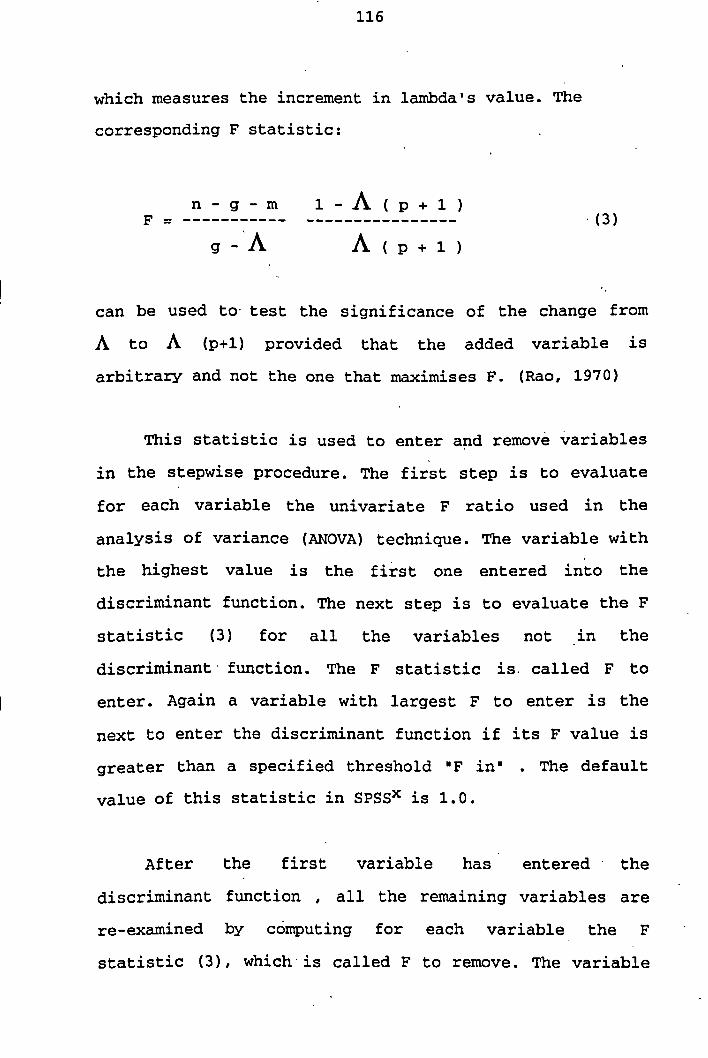
which measures the increment in lambda's value. The
corresponding F statistic:
n - g - m l - A ( p + l )
can be used to- test the significance of the change from
to (p+l) provided that the added variable is
arbitrary and not the one that maximises F. (Rao, 1970)
This statistic is used to enter and remove variables
in the stepwise procedure. The first step is to evaluate
for each variable the univariate F ratio used in the
analysis of variance (ANOVA) technique. The variable with
the highest value is the first one entered into the
discriminant function. The next step is to evaluate the F
statistic ( 3 ) for all the variables not -in the
discriminant' function. The F statistic is. called F to
enter. Again a variable with largest F to enter is the
next to enter the discriminant function if its F value is
greater than a specified threshold in8 . The default value of this statistic in S P S S ~ is 1.0.
After the first variable has entered ' the
discriminant function all the remaining variables are
re-examined by computing for each variable the F .
statistic (31, which, is called F to remove. The variable

with lowest F 'to remove is deleted if its F value is
smaller than a second threshold value, "F outm which is
not necessarily the same as for "F inm, although the
default value is 1.0 in the SPSS~. Variable selection
terminates when no more variables meet entry or removal
criteria, and the best subset of variables so far
selected is the one which accounts for most of the
difference between the two groups.
In the current study, determination of the
discriminant function was accomplished using an initial
set of twenty two .' financial ratios and 'stepwise
selection of variables based on Wilks' lambda to identify
those variables which were statistically significant in
distinguishing between failed and nonfailed companies.
The stepwise method was chosen rather than the7 all
inclusive method since the all inclusive method creates
the discriminant function from the entire set of
independent variables, not taking into the account the
discriminant Power of each independent variable.
ise en be is and Avery (1972) contented that "significant "
amounts of computer time are needed once the number of
variables exceeds fifteen .
he advantage of stepwise discriminant analysis can
be supported by additional remarks by Klecka (1975) :
"In many instances the full set of independent
variables contains excess information about the

group diiferenees, or perhaps some of the
variability may not be over useful in discriminating
among the groups. By sequentially selecting the
"next.bestm discriminator at each step, a reduced
set of variable8 will be found which is almost as
good as, and sometimes better than, the,full setn .
The Wilks' lambda and the F statistic as the
criteria to select those variables which best
discridnateJ between failed and nonfailed companies are
available at the University of Bradford's Computer Centre
within the SPSS~. The Wilkst, lambda statistic takes into
consideration, both the differences between groups and the
homogeneity within groups. .The variable which have the
smallest lambda would be the one selected to be included
during ,each step ,of the procedure. The F statistic is
used for the determination of the variable that has the
largest differences between , the groups and then allows
this variable to enter the model. Klecka (1975) noted
that ' in ' a stepwise discriminant procedure either
statistic will generate the same results.
classification of the original sample' using the
parameters of the model is generally expected to measure
the predictive power of the model and is expressed as the
proportion of correct classification to total sample

size. Many researchers thought that this method of
assessment might be biased and lead to, over optimistic
estimation of how well the model might perform in the
general population. Lachenbruch (1974) has suggested
alternative methods of estimating classification errors.
The two methods that are employed often and
mentioned in the literature are:
1. The holdout method, and
2. The 'Lachenbruch8 or U method.
For the first method, samples are split with one set
used to estimate the discriminant function and then
employed to classify the other (holdout) sample. The
sample proportion of misclassified observations for both
the groups are then estimated. The estimated proportion
by this method are consistent and unbiased but unless the
samples are large this method cannot'be used.
For the second method one observation is held out at
a time and 'classified by means of estimates evaluated 1L remaining
using the--. N1 + N2 -1 observations. This. will be
repeated until all observations are classified. This
method is applicable for both large and small samples and
gets around the sample. size limitation which i's
associated with the 'holdoutn method. Eisenbeis and Avery
(1972) used this method on problems associated with
unequal dispersions and more than two groups. These two
methods although less biased than the original sample
method, only deal with descriptive accuracy. ~ssessing
the actual performance of the model outside the original
time period would be more appropriate than the method
described above. In this study parameters evaluated from 'I
the original sample were tested on a new sample drawn
outside the original period.
Linear discriminant analysis is based on assumptions -
of multivariate normality of variables in each group and
the equai dispersion matrices of groups.
The standard discriminant analysis procedure assumes
that variables used to characterise the members of the
groups being investigated are multinormally distributed.
~espite the contention that the linear discriminant
functions could produce m&leading results because of
non-normalit~, In his study of 1972 Deakin concludes
that the larger the sample the more approximate to normal
distribution. Whereas Lachenbruch (1973) found that the
performance of linear discriminant functions tended to
deteriorate when the distribution of variables was not
- multinormal. Deakin (1976) found that prior
transformation of ratios to approximate normality. is

ineffective. So it seems sensible to test for
multinormality and if this hypothesis is rejected, to
attempt to transform the variables. Although the separate
univariate normality of each variable is not a sufficient
condition to ensure the multivariate normality of the
data set, it was thought that multivariate normality
would be more likely if this .is the case. (Taffler,
- 1982).
In order to test the normality of the variables a
goodness of fit test was performed. The most appropriate
tests in this situation are the chi-square test and the
~olmorgorov-Smirnov test.
The observations are firstly divided into a number
of classes say k. Each class size is determined by the
number of observations which requires a minimum of five
observations.
The test is. to evaluate if the differences between
the observed and expected frequencies are significant to
reject the h~pothesised. distribution as a good fit. The
test statistic used is:

where: Oi is the number of observations in the i'th
class, and Ei is the expected number of observations
in the i'th class under the null hypothesis. K is
the number of classes.
W has a chi-square distribution with k - s - 1
degrees of freedom, if the difference between Oi and Ei
is normally distributed , the degrees of freedom will be
k - 3 , because s is the number of parameters of the
hypothesised distribution, which means s equal two -for
the normal distribution. However, the chi-square test is
sensitive to extreme values and to the number of classes ,
selected, it was not used in this research and the .
~olmorgorov-Smirnov test for goodness of fit was
preferred and used in the analysis. I
This test was first presented by two Russian
whose names are attached to it. The test
statistic depends on the absolute value of the maximum
deviation between an assumed cumulative distribution of
X, F (x) and a corresponding function of X, sn (x) . The interesting feature of the test is its4independence of
--- -- -----~~. F,(X). The test is as follows:
I

I I
~ e t xl ,x2 ,............ X denote a random sample
from a population with assumed cumulative distribution
function F(X) and let xl, x2,. . . . . . . . . . .xn denote the
ordered sample. A sample distribution function is
constructed is given by the formula:
Sn (XI is clearly a step function. A graph of Sn(x)
together with a graph of a typical 'F(x) is given in
figure 4 . 2 . For any particular ~ ( x ) it is possible
to compute IF(^) - sn(x)l for each element in the
ordered sample. It is also possible to compute :
Dmax = max IF(x) - sn(x)l X
which is the maximum vertical distance between the graph
of F(x) and the corresponding value of sn(x) for all the
elements in the sample. It can be shown that Dmax is
independent on F(x) and can therefore be used to
construct a non-parametric test for F(x). However,
because Sn,(x) differ from sample to sample, that means
obviously Dmax is a random variable. Its distribution can
be worked out numerically for any particular values of n
by using combinatorial methods..

FIGURE 4 .2 f
A sample a d theoretical distribution of .x
F (x) I
and s, (XI
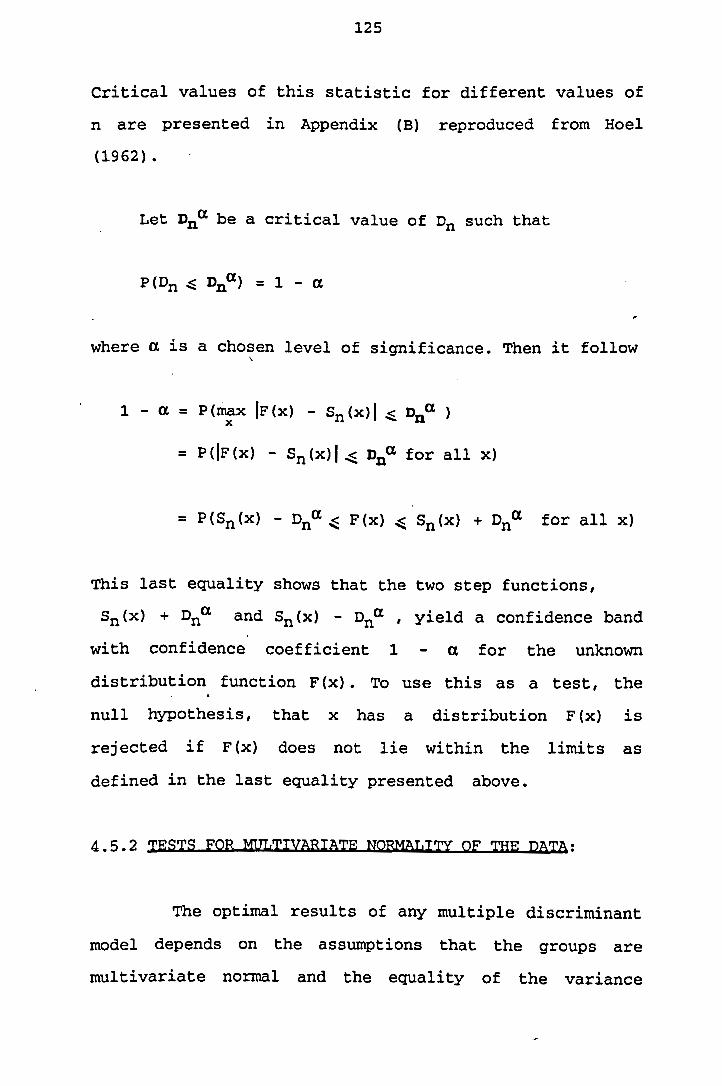
Critical values of this statistic for different values of
n are presented in Appendix (B) reproduced from Hoe1
(1962) .
Let D,~ be a critical value of D* such that
where a is a chosen level of significance. Then it follow
1 - a = xiax ax IF(X) - sn(x)l q nna ) X
= P(IF (x) - s,(x) 1 q D,U for all x)
= P(Sn(x) - Dna< F(x) 6 S,(X) + ona for all X)
his last equality shows that the two step functions,
Sn(x) + Dna and Sn(x) - D,~ , yield a confidence band with confidence coefficient 1 - a for the unknown
distribution function F(x). To use this as a test, the
null hypothesis, that x has a distribution F(x) is
rejected if F(x) does not lie within the limits as
defined in the last equality presented above.
The optimal results of any multiple discriminant
model depends on the assumptions that the groups are
multivariate normal and the equality of the variance

covariance matrices. Several tests for multivariate
normality have been developed. A discussion about their
application can be found in Andrews et a1 (19731,
Malkowich and Afifi (1973), but most of them are
difficult to implement. Mardia (1970) developed a test
for multivariate skewness and kurtosis, which is readily
available on computer programs (~ardia and Zemroch,
1975). He defines the measures:
and
A - b2,p = ----- t {xi - Z I S - ~ (xi - x )I n i=1
of a set of n independent p variate observations xl,xa,
x3 t . . . . . . xn I ~ I I P is a measure of multivariate skewness -
and b2,p is a measure of multivariate kurtosis. x denotes
. the sample mean vector and S .. the sample variance
covariance matrix. He then derives:
and

where n is the number of observations. These two
statistics follow respectively a x2 distribution with
p(p+l) (p+2) /6 degrees of freedom and a standard nonnal
distribution, N(0,l) and can be tested accordingly. The
null hypotheses are that : bl,p = 0 and bZ,p = p(p+2). If
the hypothesis that bl,p = 0 is rejected, it means that
the sample is skewed. While if the hypothesis that b2,p = .
p(p+2) is rejected, the conclusion will be that the
sample does not have the same kurtosis as the
multivariate normal sample. .
4.5.3 ZESTS FOR EOUATlITY OF TITF VARUNCE COVAEIWCF,
MATRICES:
Suppose there are g groups, and each group contains
n observations on p variables. Suppose also that the
variance covariance matrix of:
group 1 = C
group 3 = Z 3 , .... etc.
A criterion suggested by Box (1949) and based on the work
of Bartlett (1937) for testing the equality of groups
variance covariance matrices is that:

In general the population variance covariance matrices I
are not available, so sample estimates of the k
dispersion matrices are made.
Box defines the criterion as:
M = n log )sJ - Z (nilog IsiI) irl
where S is the pooled variance covariance matrix of the g
groups, Si is the variance covariance matrix of group i ,
n is the total number of observations and nit the number
of observations in the ith group.
In order to test the significance of M, two statistics
have to be computed:
B 1 1 (P - 1) (p +I)
A2 -------------- r.1 ni2 n2 6 (g - 1)
I£ A2 - is > 0 then

follows a F' distribution with fl and f2 degrees of
freedom where
2 f2 = (fl + 2 ) / (A2 - A1 )
and
I£ A2 - A1 is c 0 , the following is used:
£1 = 0.5 (g - 1) p (p + 1)
and
follows an F distribution with fl and f2 degrees of
freedom.
If the results from the test -' lead to reject the
equality of the variance covariance matrices of the two I
groups', a quadratic rule is implied; but before reaching

this conclusion one should review what other researchers
said when they faced the same problem and how best they
proceed. This will be the subject for the next section.
4.5.4 PRORT*EMS OF n E V m O N FROM -TE NO-
NON EOUATITTY OF mq- V m C F : COVA-CF,
MATRICES:
pinches (1980) identified various factors which may
directly influence the reported. classification results
investigated by users of discriminant analysis. He
grouped these factors as those under the control of the
researcher and those not under control of the researcher.
The first group can directly influence the' group means
arid / or dispersion matrices, while the second require
classification decisions by the researcher. ?t.lo.problem
areas of multivariate nonnormality and unequal
dispersion matrices are discussed below. For additional
references regarding statistical and methodological
problems associated with the use of discriminant
analysis, see Ashikaga and Chang (1981) , Clarke,
~achenbruch, and Broffitt (19791, Conover and Iman
(1980), is en be is (19771, Frank, Massy, and Morrison
(1965) , Gilbert (19691, Joy and Tollefson (1975)-,
Lachenbruch and Goldstein (19791, Lachenbruch,
sneeringer, and Revo ,(1973), Marks and Dunn (1974), Wahl
and Kronmal (1977) .

If the test of mu1tin0rmali.t.~ for variables in the
failed and nonfailed group which enter the discriminant
function does not hold, that means the performance of the
discriminant model will not be optimal. However most of
the researchers assume that the standard discriminant
procedures yield reasonable approximations and proceed as
if this assumption held. Eisenbeis (1977) believed that
deviations from the normality assumption appear to be the
rule rather than the exception. This has been.recently
confirmed by two researcher. Belhoul (1983) carried out
the tests described in section 4.5 .2 and 4.5.3 for
multinormality and unequal dispersion matrices, on a
large sample of UK companies in an attempt to develop
multiple discriminant models to identify high performing
companies. He concluded that mdltinormality and unequal
dispersion matrices were 'rejected..
Betts (1984) arrived at the same conclusion, when he
implemented the same tests during the development of a
multiple discriminant model to. identify companies at risk
of financial failure. Therefore in the current study,
th&e findings have been accepted and the research has
proceeded as if these assumptions were rejected. ---- C_____._..
----- --.
Bias may enter into the tests of significance and
the classification accuracy due to nonnormality. Gilbert

(1968) determined that there was only a small loss in the
predictive accuracy using the linear function when
multivariate nonnormality exists. Lachenbruch (1973)
determined that the linear function was sensitive to
nonmultivariate normality. However the problem was
reduced when the distribution of the variables are
bounded. Lachenbruch, Sneeringer, and Revo (1973)
examined the robustness of both linear and quadratic
procedures using nonmultivariate normal distributions.
conclusions were that standard linear procedures
may be quite sensitive to nonmultivariate normality. They
also noted that the general classification error rates
were not affected as much as the individual group error
rates. Their suggestion was that data . should be
transformed if possible to approach normality. This
research proceeded as have most researchers, based on the
conviction that the techniques used generate reasonable
approximations as if the normality assumption held.
A second critical assumption of linear discriminant
analysis is the equality of group dispersion matrices.
el ax at ion of this assumption affects the significance
test for the difference -- in the means of group, assessment
of the relative importance of variables in the model, as
well as appropriate form of the classifications rules.

According to Pinches (1978), the larger the sample
size, the higher is the possibility that there exist.,
significant differences between the groups being
analysed. The larger sample sizes are also likely to
generate unequal dispersion matrices and require the
quadratic rather than linear procedures. Pinches (1978)
also found that the chances of misclassification will
decrease as the size of the sample increases.
Unequal dispersion implies a quadratic rule is
appropriate (Eisenbeis and Avery, 1972). Altman, when he
tested his original model of 1968 on a new set of data
drawn in 1976 to see whether it had retained its validity
and relevance over the past decade, also tested for group
dispersion similarity in the original two sample.
H ~ S test revealed that 'the group dispersion were not
identical. So, quadratic discriminant analysis was
performed and the comparison between the linear
discriminant analysis and quadratic discriminant analysis
classification accuracy on the original samples and the
validation test results was made.
The differences in accuracy of the two models were
observed to be insignificant. Altman commented that the
five explanatory variables separated the two groups to
such an extent that the statistical structure made little
difference. He added, however, in studies where overlap
is substantial quadratic discriminant analysis is likely
to improve the classification accuracy.

Marks and Dunn (1974) investigate the same problem
and concluded that large samples are necessary in
quadratic discriminant analysis to avoid spurious
discrimination through over-fitting and a resulting
biased function, the risk of which increases with the
number.of variables.
ise en be is (1977) studied the case when the
dispersion matrices were unequal and the linear model was
employed. He concluded:
"Significant differences can occur which are
directly related to the differences in the
dispersion, the number . . of variables and the
Separation among the groups. Agreement between
the two procedures declines as the differences
between the dispersions and the number of
variables increase. The further apart the
groups are for given dispersions, the less
important are the differences between the linear
and quadratic resultsn. (1977, p.879).
Further, Lachenbruch, etc. (1975) , concluded from __. .__-
their simulation study of the effect of departure .from
normality in the two group discriminant case that .to fit
a quadratic model in the case of unequal covariance
matrices, depends yon the type of non-normality. It may
well make matters worse rather than better to use a
linear approach. Finally none of the related empirical

studies upto date of which the author is aware have
reported the superior predictive ability of a quadratic
discriminant function on other data than from which the
function was derived.
So for the reasons cited above the linear
discriminant model approach which is simple to use and
interpret, will be used in this study.
~imited liability companies are required by law to
supply Companies House with their accounts and balance
sheets together with many other information. This is the
part of the price to pay because they have limited
liability. This published accountancy data is available
for any Iimited company and it, is also available from
companies House.
A far better source of the data is the Exstat tape
provided by Extel Company Limited, which contain all
detailed balance sheet and.profit and loss account 'on
' over three thousand British companies, other European, - ~ustralian and Japanese quoted and unquoted concerns.
Data on other characteristics of the companies are also
provided' such as industrial classification, number of
employees, country of registration, number of years for
which data is available (year being defined as an
accounting period of any duration), etc. So the Exstat
Tape as the source of data was used in this research.
4.6 .2 a I T F R I A FOR THE INCLUSION IN mF: ANAT,YSIS:
The companies included in this study were selected
according the following criteria:
1. A company was defined in its broadest sense as a
complete legal entity involved in any commercial or
industrial activities was considered as a company.
In other words for the company to be included in'the
analysis it should not be a subsidiary company.
2. ~ccounting practice and company laws differ from
country to country which make the comparision of the data
almost impossible. so for the sake of the comparability
the companies should be only British companies.
3. No restriction was made regarding the type of
ownership. Many researchers carry out their studies on
~ublic companies, for instance; Mulondo (1981) and
~affler '(19761, the reasons for that were the
and uniformity of the data. Public companies
are required hy law to supply Companies H ~ O U S ~ and to make -. -- ! '
their accounts and balance sheets with many other
information available to the public, so these
requirements made these for public companies uniform and
readily available than the private companies. In the
current study as the Exstat tape is the source of the

data , the presentation of the data . is uniform and these
problems are overcome.
4. The companies had at least five years of complete
data.
The failed companies selected from * the Exstat tape
were identified as having entered into receivership; or
gone into voluntary liquidation (although voluntary
liquidation m y not be for solvency reasons, in this
study they were observed to be for their inability to
continue to trade ; or been compulsorily wound up by
order of the Court or by Government action.
ailed companies , denoted' as group 1 , comprised all
companies which failed during January 1975 to December
1982 and having total assets not exceeding Elom.
Data for one to five years prior to .failure were
extracted from the Exstat tape where the year- prior to
failure is defined as the latest period. Similarly, data
two years prior to failure consist of data drawn from the
accounting period preceding the latest period and so on.
In the case of nonfailed companies the decision was
made to select only those companies of the same -asset
size and the same industrial classification. The
excluded companies beyond this size was due to the total
asset range and the industrial classification ' of

companies in group 1 ( failed companies ) . So from a total population comprising of 810 noenfailed companies ,
ten-th' every- observation was selected to get a sample size
of 80 nonfailed companies ( denoted as group 2 j .
Any random sample of nonfailed companies could
contain some companies that still nonfailed but in
reality have a failed company financial profile.
~affler (1976) preferred to select apparently "healthy
companies" rather than nonfailed on the grounds that the
sample of nonfailed companies could include companies
with financial characteristics no different from those in
the failed set. He argued that by adopting his approach
clear discrimination between the two groups could be
achieved-and any overlap will be almost insignificant.
~affler's approach . may improve the classification
efficiency by reducing the type 2 errors, ( predicting a
nonfailed company as failed company ) but the
discriminant function resulting from this method can not
be used for extrapolation to classify' the total
population of nonfailed companies, in addition to the
problem which arises in defining the criteria to identify
healthy companiesm. So for these reasons I preferred a
random sample of nonfailed companies rather than to
choose the "healthy companiesm.

4.6 .4 S E L E C T I O N C I A T a RATIOS :
Since a wide range of financial ratios is available
for selection, the important points to be considered in
selecting ratios for any particular study are: -
A. How far the ratios selected are appropriate for
the particular use and how far can they help an
analyst to discover the economic reality behind
the figure.
B. Whether the ratios chosen are theoretically sound
Therefore, the initial step in selecting the
financial ratios to be considered for inclusion in the
statistical analysis was to consult previously published
failure studies, financial textbooks, and accounting
textbooks. Four criteria were used in the final selection f?.
of the ratios. These were: (1) data availability
permitted calculation of the financial ratios, (2) their
ability to predict failure in previouD studies, (3) their
~o~ularity in the literature, and (4) the development of
a comprehensive set of ratios representing traditional
categories of ratio analysis, such as profitability,
gearing, capital turnover, and liquidity.
The final list of twenty two financial ratios, all
of which had been tested in the studies described in
chapter three, appears in appendix (c). Table 3.1 shows
the studies from which the choice was made. The .

transformations chosen to give the best approximation to
univariate normality described in section (4.5.1.21,
appears in appendix (D), Meanwhile, definition of the
components of these financial ratios is presented in
appendix (El .
4.6.5 EXTRACTION OF THE R m :
~aving decided the source of data together with the
criteria for inclusion in the analysis and the
statistical methodology to be used in this study, it
remained to select the two groups of companies and the
required accountancy data to construct the company
failure models up to five years before the event of
failure .
: The data on the Exstat Tape are located in three
sections, these are section B, C and D. However Section B
comprises thirty nine items ( B1 - B39 ) of information
usually called as "Company Datan. The kind of data in
this section is company issuer code (Bl), company name
(B8), country of registration (B9), date of creation on
Extat file (Bll), industrial classification (B13),
subsidiary company marker (B22), etc.
Section C has items from C1 to C30 containing
accounts data, such as exports. (C14) , domestic employees
remuneration (C161, charitable donations (C20), political
contribution (C21) etc. Items from C31 to C82 contain

profit and loss account data, and items from C83 to C121
contains the balance sheet assets data, while the balance
sheet liabilities data are located in items C122 to C164.
Section D contains the Security Data, but there is
no access to this data at the present time according to
the Document Number: EXSTAT-2 dated January 1987 and in
the same time these Security data are not relevant to
this study. In order to extract the data from the Exstat
Tape, one should identify the label refer to that item as
it is given in the Exstat User Manual 1983, and by
following the instructions given in the Document EXSTAT-
2, then a program can be written to extract the required
data. The first step is to create an input file. Line one
of the input file must contain the word DATA. The lines
following this contains the names of the data items that
user requires and this may be entered consecutively on
each line separated either by spaces or commas or one
item per line. The maximum length of a line is eighty
characters. After data items required have been
specified, then the program must be terminated by the
word "END". The next line of the. input file must ' contain
the word "SELECT", followed by criterion and must be
terminated by "END" again. If companies are selected on a
single criterion the request would take the form:

where :
Data item is the name of the field to be tested
Relation is: EQ . equals
NE not equal
LT less than
LE less than or equal ie. not greater
than
GT greater than
GE greater than or equal ie:not less
, than
Condition the value against which the data item
is to be tested. These conditions may be strung together
using- 'ANDS' and 'ORSn and grouped using brackets to
clarify the meaning. To illustrate that lets consider the
extraction of the failed companies according the
conditions cited in the preceding section.

GROUP
DATA .
END
( B9 EQ E X O R B9 EQ EY OR B9 EQ EV OR B9 EQ EW ) AND
B22 EQ N AND
( B32 GE 1 9 7 5 0 1 0 1 AND B32 LE 1 9 8 2 1 2 3 1 ) AND
( B35 EQ R OR B35 EQ C OR B35 EQ V) AND
END

The data items are:
~1 = company issuer code
B8 = company name
B9 = country of registration
~ 1 1 = date of creation on Exstat file
~ 1 3 = industrial classification
B22 = subsidiary company marker
~ 3 0 = number of periods for which data available
~ 3 2 = end date of last period for which data held
B35 = company marker B (dead company)
C115 = Total assets.
AS this research is on U.K. based companies, so B9 has to
be equal 'EX" , 'EYn , 'EVn , and "EWn. where
EX = the code given registered companies
EY = the code given to Scotish registered companies
EV = the code given to Channel Island
EW = the code given to Isle of Man
B22 should be equal 'Nn, that means the companies to be
selected are not subsidiary companies. As B32 is the end
date of last period for which data held, the conditions
under this item was made to select only those companies
failed between the first of January 1975 and the 31st of
~ecember 1982, that is the time period for the failed
companies in this study. In addition, the failed
companies item "B3SA was selected equal ( R , C , v ) .

where :
R = receivers appointed
c = compulsory liquidation
v = voluntary liquidation
Finally the selected failed companies should have at
least five consecutive years of accountancy data
available for analysis, and that is the condition ~ 3 0 to
be greater than or equal to five.
The following statement will run the program to obtain
the required data:
Where "INPUT 1" is the name of input data file and
is the name of the file that the extracted data is to be
written in the format described in the Exstat User Manual
(1983) Section three.
In the same way all the accounting data required to
compute the financial ratios can be extracted for both
failed and nonfailed companies in order to construct the
discriminant models.

ACCOUNTS AS A R W L E SOURCR OF INFO-
In the preceding chapter it was decided that
published financial information through the companiess'
annual reports will be used as a source of- data.
heref fore one should ask whether these published
financial reports together with the accounting ratios
derived from 'the,& financial reports give the right ---- information in sufficient quantity and quality in order
to assess the financial performance of the companies.
The purpose of this chapter is to clarify that, and
to provide a review of some of the more important topics
which arise in connection with published annual reports,
making reference where appropriate to the relevant
literature. Since this subject has a large coverage, the
chapter cannot claim to provide a detailed review of all
the controversy surrounding the subject of the data
derived from published financial reports as a reliable
source of ,- information about a company's, financial
position.

The approach adopted is to look first at the
development of annual reporting in the U.K., to discover
the improvement in quantity and quality of the reported
data, in particular the disclosure requirement of the
latest Companies Acts, and the contribution of the
~ccounting Standards Cormnittee. The following examines
the objectives, the users and their needs, and the
controversy surrounding this subject. Then, the seven
desired characteristics of financial reporting that make
the financial information useful, will be reviewed.
Finally, the limitation of published accounts have been
discussed, hoping that the justification of using
published financial accounts and their reliability as a
source of information will emerge.
Corporate disclosure through the annual reports was
first introduced by the Companies Act 1844,. Such
statements were originally designed to assist in the
of shareholders and creditors from fraud and
mismanagement; Edey and Partipakdi (1954) . Audits were made compulsory for all companies by 1900. By 1908
companies were required to publish accounts other than to
&areholders. Disclosure of financial information in the
published accounts of British Limited Companies has been
influenced by a series of Companies Acts which have laid
down certain minimum disclosure requirements. The Acts
were passed at approximately twenty year intervals and

each Act has called for the disclosure of more
information than its preceding one; Jones (1974).
Since 1942 the Institute of Chartered Accountants in
England and Wales (ICAEW) has regularly issued official
recommendations on increased disclosure and auditing
standards (ICAEW, 1949) . The quantity and quality of the reported data have improved considerably over a long
period of time with the Companies Act 1948, which gave
positive guide-lines on how accounts' should be prepared.
But up to this time the public were not allowed to have
access to these accounts. It was the companies Act 1967
that made the accounts of limited companies available to
the public. Companies Act 1976. and 1980 added little to
these disclosure requirement, but in 1981 a further
companies Act substantially scrutinized accounting
requirements that bring these into line with the
provision of the EEC Fourth ~irective; John Blake (1987).
Finally, the Companies Act,l985 codifies the Acts from
1948 to 1981 into one single status, proving to be an
important milestone in the 'development of the quality of
annual reports, and to be primarily a legal basis in the
present system of annual reporting by companies.
~egarding the influence of standards-setter and
regulations created by professional bodies on the
development and improvement of annual reporting. For many
years The Institute of Chartered Accountants in England

and Wales (ICAEW) issued a series of recommendations on
~ccounting Principles, starting in 1942. These were
generally summaries of existing practice, and they were
in no way mandatory on the members of the ICAEW. By the
1960s it was becoming clear that the practical results of I
this approach were not acceptable, because different
companies in similar circumstances were following
different accounting policies, leading to different and
incompatible results, Carsberg . '(1974) . Accountants and . -
their professional bodies were being publicly criticized.
TO counter this deficiency the ICAEW set up the
~ccounting Standards Steering Committee (ASSC) in 1970.
The ASC, as it is now called, includes representatives
from the following additional bodies:
The Association of Certified Accountants
The Institute of Chartered Accountants in Scotland
The Institute of Chartered Accountants in Ireland
The Institute of Cost and Management Accountants
The Institute of Public Finance and Accountancy
The joint committee of the six member bodies is
acting collectively as the Consultative Committee of
Accounting Bodies (CCAB) . The accountancy profession
hopes to bring about a greater uniformity of practice,
especially between companies with similar accounting
problems. One of the main aims of accounting standards is
to make financial statements reasonably comparable with
one another. The ASC is responsible for preparing draft
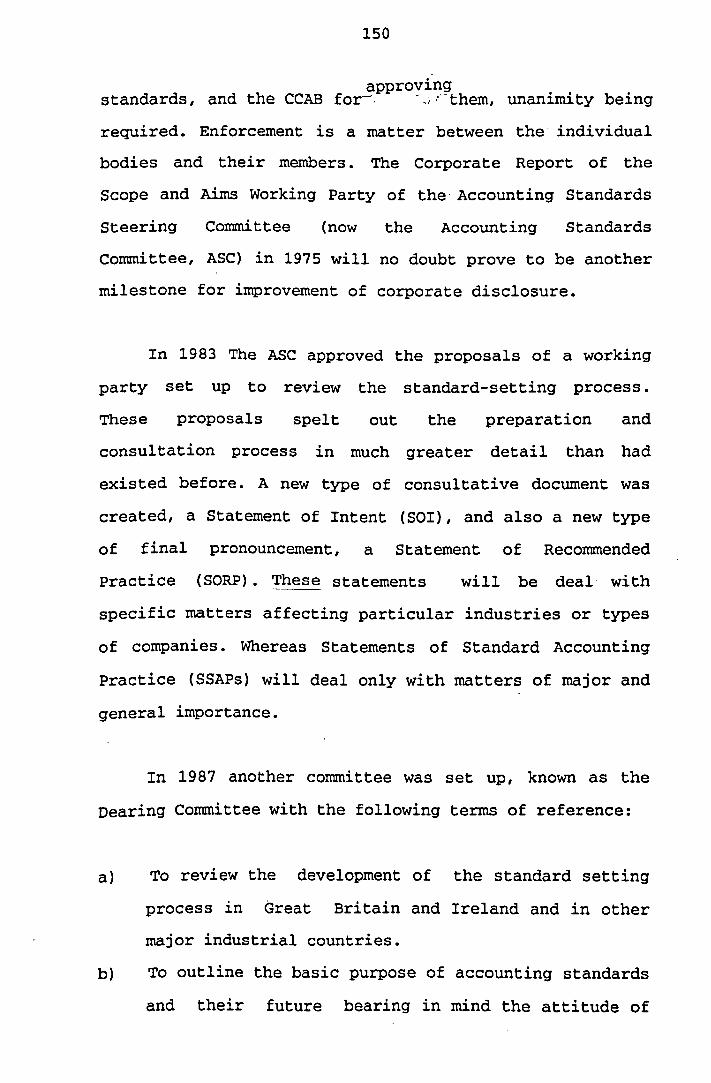
approving standards, and the CCAB for-. - -1 :-them, unanimity being
required. Enforcement is a matter between the' individual
bodies and their members. The Corporate Report of the
Scope and Aims Working Party of the. ~ccounting Standards
steering Committee (now the ~ccounting Standards
committee, ASC) in 1975 will no doubt prove to be another
milestone for improvement of corporate disclosure.
In 1983 The ASC approved the proposals of a working
party set up to review the standard-setting process.
These proposals spelt out the preparation and
consultation process in much greater detail than had
existed before. A new type of consultative document was
created, a Statement of Intent (SOI), and also a new type
of final pronouncement, a Statement of Recommended
practice (SORP) . These statements will be deal- with
specific matters affecting particular industries or types
of companies. Whereas Statements of Standard ~ccounting
practice (SSAPs) will deal only with matters of major and
general importance.
In 1987 another committee was set up, known as the
~earing Committee with the following terms of reference:
a) TO review the development of the standard setting
process Britain and Ireland and other
major industrial countries.
b) To outline the basic purpose of accounting standards
and their future bearing in mind the attitude of
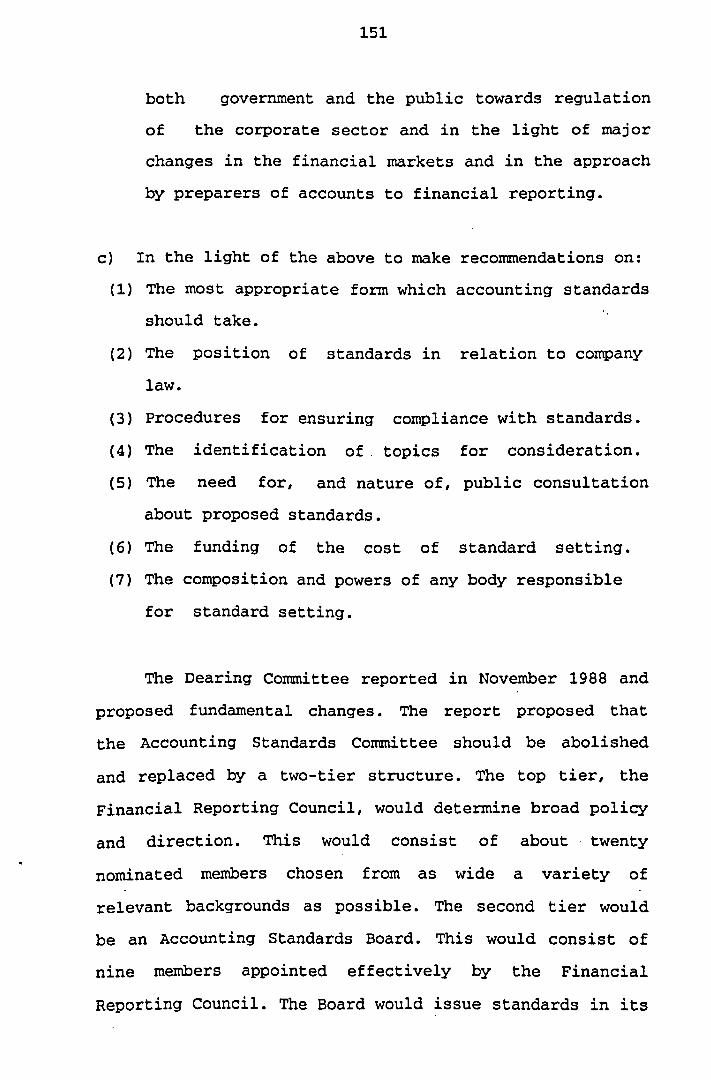
both government and the public towards regulation
of the corporate sector and in the light of major
changes in the financial markets and in the approach
by preparers of accounts to financial reporting.
c) In the light of the above to make recommendations on:
(1) The most appropriate form which accounting standards
should take.
(2) The position of standards in relation to company
law.
(3) Procedures for ensuring compliance with standards.
(4) The identification of. topics for consideration.
(5) The need for, and nature of, public consultation
about proposed standards.
(6) The funding of the cost of standard setting.
(7) The composition and powers of any body responsible
for standard setting.
The Dearing Committee reported in November and
proposed fundamental changes. The report proposed that
the
and
Accounting Standards Committee should
replaced two-tier structure. The
abolished
tier, the
~inancial Reporting Council, would determine broad policy
and direction. This would consist of about . twenty
nominated members chosen from as wide a variety of
relevant backgrounds as possible. The second tier would
be an Accounting Standards Board. This would consist of
nine members appointed effectively by the Financial
Reporting Council. The Board would issue standards in its

own right ,not through the individual CCAB members, and
in order to avoid compromise solutions, a majority of two
thirds would be sufficient for a standard to be approved.
his proposal would increase the speed with which new
standards could be introduced or existing standards
amended.
The report explicitly recommended that the movement
towards the development of a general conceptual framework
should be encouraged. The committee also clearly hoped
that its suggested requirement of a two-thirds majority
rather than unanimity will encourage the development of
precise and explicit standards requirements rather than
compromises found in recent years so often.
The final important area tackled by the Dearing
committee Report, and perhaps the most important of all,
is the question of compliance with SSAPs. It was
recommended that.a Review Panel be established to examine
any identified material departures from accounting
standards which in its view, involve an issue of
principle or which might result in .the accounts in
question not giving a true and fair view. The Panel would
only be concerned with the accounts of large companies.
~ t s constitution would be determined by the same
committee as that responsible for determining membership
of the Accounting Standards Board. It is proposed that
each departure from a standard would be examined by a
tribunal whose membership would differ, but drawn from

a central pool of experts by the chairman of the Review
Panel. Where a company fails to amend its accounts along
with the suggestion made by the Review Panel it is
suggested that, under a new statutory power under civil
law, the directors be required by the court to circulate
additional/revised infonn+tion to all those entitled to
receive the accounts so as to ensure compliance with the
requirements of the Companies Act or with the true and
fair requirement.
It seems that, there is a general agreement that
something needs to be done to make SSAPs both stronger in
their pronouncements and requirements, and effectively
observed and followed.
since the setting of ASC in early 1970, there have
been a number of SSAPs, each SSAPs has dealt with a
problem area or topic. It is noticeable that the rate of
appearance of SSAPs has slowed down sharply in recent
years, sea table 5 .l. It took a full three years between
the Issue of SSAP 23 Accounting for Acquisitions and
Mergers in May 1985 and the SSAP 24 Accounting for
pension Costs in May 1988.

TOPICS DEALT WITH BY ASC
Associates ED Accounting for the Results of
Associated Companies
SSAP 1
June 1970
Accounting for Associated Companies Jan. 1971 (amended Aug. 1974 revised April
Accounting for the Results of Associated Companies
Oct. 1979
ED 2 Disclosure of ~ccounting Policies June 1971
SSAP 2 Disclosure of Accounting Policies Nov. 1971
Accounting for Acquisitions and Mergers
ED 30 Accounting for Goodwill
Accounting for Acquisitions and Mergers
SSAP 22 Accounting. for Goodwill
sSAP 23 Accounting for Acquisitions and Mergers
ED 44 Accounting for Goodwill - additional disclosures
Feb. 1971
Oct. 1982
Oct. 1982
Dec. 1984
Apr. 1985
Sept. 1988
cont d

Ed 4 Earnings per Share Mar. 1 9 7 1
SSAP 3 Earnings per Share Feb. 1972
ED 5 Extraordinary Items and Prior Year Aug. 1 9 7 1 Adjustments
ED 7 Accounting for Extraordinary Items July 1972
SSAP 6 Extraordinary Items and Prior Year Apr. 1974 Adjustments (revised
Aug.1986)
ED 1 6 Supplement to m~xtraordinary Items Sep. 1975 and Prior Year Adjustmentsm
ED 36 Extraordinary Items and Prior Year Jan. 1985 Adjustments
ED 6 Stocks and Work in progress
SSAP 9 Stocks and Work in progress
ED 40 Stocks and Long Term Contracts - ED 81 . Accounting for Changes in the
Purchasing Power of Money
SSAP 7 Accounting for Changes in the Purchasing Power of Money
May 1972
May 1975 (revised
Nov. 1988)
Nov. 1986
Jan. 1973
May 1974
cont d

ED 18 Current Cost Accounting
Current Cost Accounting
SSAP 16 Current Cost Accounting
Accounting for the Effects of Changing Prices
Nov. 1976
Apr. 1979
Mar. 1980
July 1984
ED 9 The Accounting Treatment of Grants Mar. 1973
under the Industry Act 1972
SSAP 4 Accounting Treatment of Government Apr. 1974 Grants
The Accounting Treatment
Government Grants
ED 10
SSAP 5
Accounting for VAT
Accounting for Value Added Tax
June 1988
May 1973
Apr. 1974
ED 11 Accounting for Deferred Tax May 1973
SSAP 11 Accounting for Deferred Tax
ED 19 Accounting for Deferred Taxation
SSAP 15 Accounting for Deferred Tax
~ccounting for Deferred Tax
Aug. 1975 (withdrawn Oct. 1978) May 1977
Oct. 1978 (revised May 1985)
June 1983

The Treatment of axa at ion under the Imputation System in the Accounts of companies
SSAP 8 Treatment of Taxation under the Imputation System
May 1973
Aug. 3974
Statement of Source and ~pplications Apr. 1974 of Funds
SSAP 10 .Statement of Source and Applications July 1975 of Funds
(R & Dl
ED 14 Accounting for R&D
ED 17 . Accounting for R&D - Revised SSAP 13 Accounting for R&D
ED 41 Accounting for R&D
ED 15 Accounting for Depreciation
SSAP 12 Accounting for Depreciation
Accounting for .Investment Properties
sSAP 19 Accounting for Investment Properties
ED 37 Accounting for Depreciation
Jan. 1975
Apr. 1976
Dec. 1977
Jan. 1987
Jan. 1975
Dec. 1977 (amended Nov. 1981 revised Jan. 1987)
Sept. 1980
Nov. 1981
May 1985
cont d
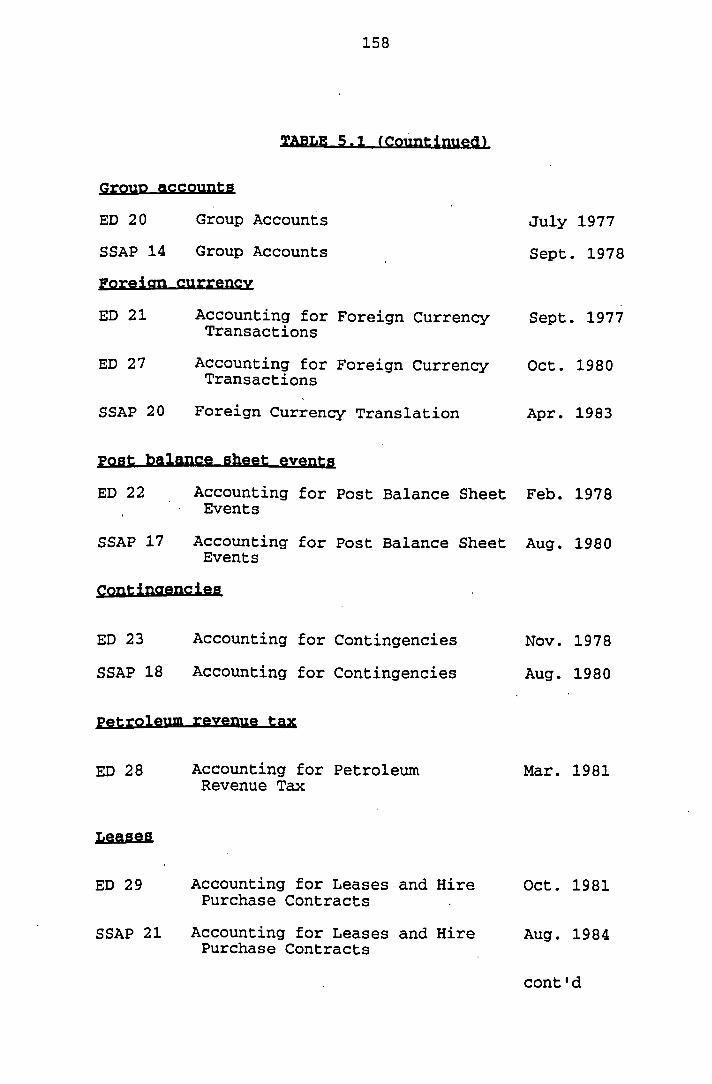
ED 20 Group ~ccounts
SSAP 14 Group Accounts
ED 21 Accounting for Foreign Currency Transactions
ED 27 Accounting for Foreign Currency Transactions
SSAP 20 Foreign Currency Translation
July 1977
Sept. 1978
Sept. 1977
Oct. 1980
Apr. 1983
ce sheet events
ED 22 Accounting for Post Balance Sheet Feb. 1978 Events
SSAP 17 Accounting for Post Balance Sheet Aug. 1980 Events
ED 23 Accounting for Contingencies
SSAP 18 Accounting for Contingencies
Accounting for Petroleum Revenue Tax
Accounting for Leases and Hire Purchase Contracts
sSAP 21 Accounting for Leases and Hire Purchase Contracts
Nov. 1978
Aug. 1980
Mar. 1981
Oct. 1981
Aug. 1984
cont d

ED 32 Disclosure of Pension ~nformation May 1983 in Company Accounts
ED 34 pension Scheme Accounts
SORP 1 Pension Scheme Accounts
Apr. 1984
May 1986
ED 39 Accounting for Pension Costs May 1986
SSAP 24 Accounting for Pension Costs May 1988
Charities ED 38 Accounting by Charities
SORP 2 Accounting by Charities
ED 42 Accounting for Special Purpose Transactions
Nov. 1985
May 1988
May 1988
ED 45 Segmental Reporting Nov. 1988
1. The topics are shown in order of the first Exposure Draft (ED) on each subject. The date of issue of each document follows its title.
2 . AS well as producing EDs and SSAPs, ASC has published Statements of Recommended Practice (SORPs) and is franking SORPs for various industry groups. It has also produced several discussion papers, guidelines, statements of intent,etc.
* so-: Financial Reporting 1988 - 1989; A survey of UK published Accounts; ICAEW 1989.

~ t , seems to suggest that the ASC believes that most of
the essential area have been covered by the standards
programme concentrated dealing with the current
problem of the moment and that revision and refinement
are now its major tasks.
However, the five aims originally set out as a-
standards programme to ASC have been all at least
partially achieved, Hanson, (1989). The hopes of the
accountancy profession were bring about greater
uniformity, yet ,they still remain hopes two decades after
setting up the ASC in early 1970. The main reasons for
that in my opinion are the lack of an effective
enforcement mechanism. A second reason is that the
approach of dealing with problem areas individually has
the disadvantage inconsistency. For example the
different methods of valuation in use at the present time
and the inconsistency between certain SSAPs, like the-one
between SSAP 12 on depreciation and SSAP 19 which
advocates non depreciation investment properties. This
approach is like the treatment of the symptoms rather
than the disease which can lead to the . problems
reappearance in a different form. The more effective way
of treatment is to design standards in depth to deal with
problems as single problems to avoid the conflict and
inconsistency. , ~
~~espite of shortcomings discussed above, there is a
general'agreement that the overall quality and quantity

of published accounts has been improved remarkably in the
past two decades, among many -who share this view is
Hanson, (1989).
In conclusion, it is the opinion of the author that
as a result of the latest Companies Acts, in particular
the 1985 Companies Act and the important contribution
made the ASC, the published accounts now contain
valuable information for assessing companies8 financial
positions in greater detail, which is unlikely to be
available from any other source.
The early objectives of published accounts were to
assist in the protection of shareholders and creditors
from fraud and mismanagement. Accounting information is
useful to the extent that it facilitates decision-making.
The question which arise almost always in l'iterature is:
what kinds of information should a company disclose about
its operations 3 Writers have been proposing
modifications ta the accounting methods for many years
which seems to suggest that there was no agreed and clear
objective on published accounts even between the
professional accounting bodies in the U.S and U.K. For
instance, in 1936 when the American Accounting
~ssociation said: The purpose of the statements is the
expression, in financial terms, of the utilization of the
economic resources of the enterprise and resultant
changes in the position of the interests of creditors and
investors. Accounting is thus not essentially a process
of , valuation but the allocation of historical costs and
revenues to the current and succeeding periodsen The
~nstitute of Chartered Accountants in England and Wales
(ICAEW) responded to the above expression as follows:
n.... the purpose for which the annual accounts are
normally -prepared is not to enable individual
shareholders to take investment deciaion~.~ n ... the results shown accounts prepared on the basis of
historical cost are not a measure of increase or decrease
in wealth." And U s A balance sheet is mainly an
historical document which does not purport to show the . .
realizable value' of assets . . . and so is not a statement of the net worth of the undertakingon Carsberg et all
(1974).
~ncreasingly from the early sixties there has been
some change, in which American accountants have come to
believe that part of the answer to what kinds of
information, should a company disclose, lies with the
user of'the financial statements. In other words, what is
the purpose for which each' particular type of user
the information 3
he ref ore, published annual reports have become ' the .
inost debated topic in the field of accountancy and
finance. As a result of the controversy surrounding this-
subject and in particular, the preparation and

presentation of the final accounts, two groups have been
emerged. The first group believe that accounts should be
prepared independent of the users, that is, no regard
should be paid to satisfy any user or any special group
of users; (Spouse and Moonitz, 1962). Whereas, the second
group disagree with this approach on the grounds of
company ownership and management. They argue that the
business belongs to the. shareholders, and management are
hired to run the business. therefore, the management is
responsible to report to shareholders only through the
annual financial reports, in order to facilitate the
owners assess to their business. However, Chamber (1966)
came out against this school of thought, when he stressed
that the purposes of published accounts are that they
should be laid out in a fashion understandable by the
recipients and divulge sufficient information in order to
reach the conclusions on a specific company. The user
orientated approach has become clear and well recognised.
A significant increasing level .of interest in the
specification of objectives of published accounts has
been published from early sixties. Perhaps the most
significant one, is Moonitz s "Basic Postulates of
~ccounting" (19611, as it was the first research study
undertaken under the sponsorship of the American
Accounting Principles Board for an attempt to provide a
theoretical basis for accounting; Hawkins (1971). Moonitz
defined the objective of company reporting as -the
provision of data to be used as a basis for choosing
between available economic alternatives and for checking
and evaluating the results, when he state:
~uantitative data are helpful in making
rational economic decision, i.e., in making
choices among alternatives so that actions
are correctly related to consequencesm.
The same view was shared by the Committee to Prepare
a Statement of Basic Accounting Theory (American
~ccounting Association, 1966), and by Yuji Ijiri & Robert
Jaedicke, (19 66 . However, Moonitz while recognizing the
potential of a user approach warn that: .
n.... any one who stresses 1usefulness8 as a
criterion, in accounting or elsewhere, must
answer the two pointed questions - useful to whom 3 and for what purpose 3 And herein
lies the danger. we could easy be trapped
into defining accounting and formulating its
postulates, principles, and rules in tern
of some special interest, such as the business
community, or the regulatory agencies, or
investors,.-or tax collectorsn.
It is clear that he accepts the full implication of
this line of thought, that different information might
reasonably be provided for different people and for

different purposes. He thought it might be dangerous to
formulate accounting principles for special interest
groups, - Carsberg, (1974) . Moonitz points out the one
important factor in the problem of reporting equally to
all groups' interests. That factor is the need of
accounting information which will be of help in making
economic - decisions.
This school of thought or Moontiz's theory was
actually supported by the Association of the Institute of
Corporate and Public Accountants (AICPA, 1973), when they
stated that the purpose of the financial statements was
to provide 'information . .. useful to investors,
creditors, for predicting, comparing and evaluating
potential cash flows in terms of amount, timing and
related uncertaintyeeen
Regarding for whom the accounts should prepared, they
conclude that all financial statements should be directed
to those who have limited access to companies inside
information.
However, Pankoff and Virgil (1970) gave this subject
another increase by extending the concept of financial
statement to include the predictive factor, when they
state:
while financial accounting reports may have
an historical perspective, the value of those
reports can not be measured solely by the

accuracy with which they reflect the past. It
seems safe to say that most users, investors
and creditors, for example, are not interested
at all in the past per se, but only to the
extent that the past can be used to reveal the
future. In other words, firms8 past records are
useful to the extent that they help users make
decisions about an uncertain future."
But there were some others who did not agree in
associating the purpose and value of accounting
information directly with decision making, among them,
Bevis (1965) who relegates decision making to secondary
status when he states that:
"....The fact that prospective investors may use
the information contained in the report to assist
_ them in making projections in connection with
investment decisions does not belie the report's
essential nature and purpose as an historical
accounting of what has taken place."
Most of the opinions summarized and discussed in
this section. so far are from American writers,
researchers and accounting organizations. However, the
objectives of published accounts were not very much
discussed in the U.K. The serious stage in this subject
was taken up from early seventies, when in 1970 the
~nstitute of Chartered Accountants in England and Wales

(ICAEW) commissioned the Accounting Standard Steering
Committee (ASSC),"as it then was, to neenarrowing the
areas of difference and variety in accounting practice by
published authoritative statements on best accounting
practice.. .". In 1974 'the (ASSC)' -appointed a sub-
committee to prepare a wide-ranging discussion paper. Its
terms of reference were:
The purpose of this'study is to re-examine the scope'
and aims of published financial reports in the light
of modern needs and conditions. It will be concerned
with public accountability of economic entities of
all kinds,. but especially business enterprises.
It will seek to establish a set of working concepts
as a basis for financial reporting., Its aims will be
to identify the persons or groups for whom published
financial reports should be prepared, and the '
infomation appropriate to their interests. It will
consider the most suitable means of measuring and
reporting the economic position, performance and
prospects of undertakings for the purposes and
persons -identified above.
The report of this committee was published in 1975
under the title The Corporate Report. It summarised the
objectives of published accounts as:

, "The fundamental objective of corporate reports
is to communicate economic measurements of and
information about'the resources and performance
of the reporting entity useful to those having
reasonable rights to such informati~n.~
published accounts have been an area of exceptional
innovation in the U.K. during the 1980s, however being so
deep and varied subject, a lot has been written about
this topic which has precipitated some controversy. The
more recent work on this subject are by McMonnies, 1988
and The Solomons Report (Solomons, 1989) in the U.K., and
of the International Accounting Standards Committee
(IASC, 1989) and the conceptual framework projects of the
Financial Accounting Standards Board (FASB) in the USA.
A1 though there full agreement the objectives
published accounts, all these sources are generally
agreed that:
a Published accounts. are expected to serve users and
that the equity investors and lenders are among
others the most important class of users.
b) The balance sheet and profit and loss account,
together with a statement of cash flows are the
fundamental financial statements. I
c) The concern of the users is with economic evaluation
and decision making.

So, it is the author's opinion that the objectives
of published accounts are to provide information to any
one who has no access to inside information of the
company in order to help him reach the decisions about
the company for whatever purpose.
In order to understand the information available in
published annual reports, it would seem useful to find
out who are the users. The users are here taken as those
who have reasonable right to information concerning the
reporting company. Several different user groups have
been cited in the literature of published corporate
reports. However, The Corporate Report identifies seven
separate user groups, namely, the equity investor group,
the loan creditor group, the employee group, the
analyst/adviser group, the business contact group, the
government and' finally the public. ,
~ssentially this group consists of shareholders. The
aim of this group is to consider whether or not to invest
in a company, that simply means to buy shares or probably
to buy more shares, and alternatively, whether or not
to sell shares. Usually equity investors look for on'e or
two things; the first is the income which is a money
return to them within the payment of dividend, and

secondly the capital gain which is a money return by
selling shares at more than their purchase price.
The point is that investors need information about
future profits. As published accounting information is
almost always about the past, the need to make the past
results useful for estimating the future is an important
influence on some of the detailed disclosure
requirements, such as share prices and dividend policy .. etc. The ,general trend is to make reported accounting
statement as suitable as possible for the investor to
make his own estimations.
his group comprises long, medium or short-term
lenders of money. The important question for a loan
creditor to consider is wether he will get his money back
not? short-term loan creditor will interested
in the amount of cash a company has got or will get very
soon. For protection purposes, he will also be
interested in the net realisable value of all the assets,
and the priority of the various claims other than his own
on the available resources. On the other hand long-term
lenders will clearly need a relatively longer-term view
of the company's future cash position. That means, they
can not restrict their interest to cash. They need to
assess, as the Corporate Report correctly says, the
economic stability and vulnerability of the borrowerm.
heir needs are to estimate the overall strength and
position of the company in the future.
3. THE EMP&OYEE GROUP:
Employees need financial information about the
company for two main reasons; first for the wage
negotiations and second, for the assessment of their job
security at present and future. So they will need
information in a clear 'and simple non-technical way, as
well as nonfinancial information, for instance, they want
to know about management attitudes to staff involved in
making decisions about the conditions of service in
general.
his group consists of experts that advise other '
groups. Stockbrokers and investment analysts will advise
Trade union advisers will advise employees.
Government statisticians will advise the government, and
so on. The needs of this group are clearly the needs of
the special group they are advise. But because they are
advisers and probably experts, with no doubt one can say
that they will need more detail and more sophisticated
information to be presented to them.

5. THR RUSINESS CONTACT:
This group consists of all that have dealings with
business, but are not included in any other group. It
can be divided into three subgroups as follows:
a) suppliers and trade creditors need similar information
to that rewired by short-term loan creditors, but at,the
same time they will also need to have a longer-term idea
of the future of the business. Therefore they need to
estimate the future of their customers, as they are
primarily concerned with the sufficiency of cash to pay
the immediate debts, the continuing existence of the
company and security of their claims.
b) Customers will wish to assess the reliability of the
companies both in the short term sense and in the long
tern sense, such as, whether they get the goods on time
and in good condition and an effective guarantee, that
the service is available after sale.
c) competitors need to find out as much as .possible about
the financial, technical and marketing structure of the
companies . But here it is important to mention that the
companies will not be keen for disclose this information
for it and to become generally available within the
industry. At the same time it is well recognized that
companies have a -reasonable right to keep the causes of

their success secret. Further if the competitors want to
consider a merger or a straight take-over bid, which is a
common case in recent years, for these purposes they need
the above information as well as and in addition to the
information required by the equity investor group.
Government need financial information for purpose of
taxation- This could be the most clear use by government,
but it is not necessarily the most important one.
Government 'also needs information for making decisions
which, affect particular companies or industries. They
need information as a base for their economic decisions,
which will be varied and veqy detailed.
This group consists of individuals and pressure
groups who may need information for their personal use.
Moreover as companies are part of the society at large
and they react and interact with society, they will be
concern about such things as employment, health and
safety, and contribution to charities. It should be noted
that much of this information is non-financial
information, and some can not be even measured, so
whether it is accounting information or not is hard to
judge, but, with no doubt it is useful information.

From the discussion above it is clear that different
users with varied purposes, may require different
information about the same items and also different users
will require and be able to understand different degrees
of complexity. Therefore the question is whether general
financial statements will meet the needs of diverse user
groups, despite that some sort of common needs can be
noticed.
The following quotation might be,useful here:
All these groups have a legitimate interest in
the activities of a corporation, although clearly
some groups are more af facted by these activities
than others. While the corporation is not legally
obligated to report directly to all these groups,
it certainly can be argued that a moral obligation
exists. such reporting obligation
would most likely be met within the framework
of accounting system. (Stone, 1967)
TICS OF C-fl REPORTS:
certain characteristics or qualities of
financial reporting make financial information useful.
providing information that has each of these qualities is
an objective of financial accounting. These qualitative
objectives are at least partially achieved at present,
although improvement is probably desirable with each one

of them. Full achievement of the qualitative objectives
are caused by conflicts between objectives, as well as by
lack of complete understanding of them.
Therefore, it is useful not only to consider the
purposes for which the information is required, but also
to consider the characteristics of useful information.
These characteristics were considered by ~ccounting
standard Steering Committee (ASSC) through The Corporate
Report (1975). It suggests seven desirable
characteristics that corporate reports should have and
hold, if they are to meet the objectives of published
accounts. These are:
1. Relevance
2. Understandability
3. Reliability
4. Objectivity
5. Completeness
6. Timeliness, and
7. Comparability.
1. Relevance:
Corporate reports should seek to satisfy as far as
possible, the user's needs (Accounting Objectives Study
Group 1973, American Accounting Association 1966,
Carsberg et a1 1974). The objective of relevance helps in
selecting methods of measuring and reporting in financial

accounting that are most likely to aid users in making
the sorts of economic decisions for which they use
financial accounting data. To make a judgement about
relevance of information, attention is focused in the
common needs of users and not on specific needs of
particular users. An important task is to determine those
common needs and the required information that is
relevant to them- The concept of relevance has been
advocated as important to financial reporting for some
time; Lee T.A. (1971); Staublus G.J. (1970), and has been
defined as follows:
"Relevance is the primary standard and requires that
the information must bear upon or be usefully associated
with actions. It is designed to facilitate, or results
desired to ,be produced. Known or assumed information
needs of potential users are of paramount importance in
applying this standardn American Accounting ~ssociation,
(1966). Relevance is the key for information, "if
information is not relevant to some needs, it is indeed,
worse than uselessn American Accounting Association
(1966). So relevance is the primary qualitative objective
because information that does not bear on a decision is
useless, regardless of the extent- to which it satisfies
the other objectives.

2. understandability:
All material information must be given in the
clearest possible manner. Where appropriate the main
features 'should be presented in a simplified form for use
by less sophisticated readers ( Staubus 1971, ~ccounting
objectives Study Group 1973, Carsbery et'al 1974).
Understandability is important because accounting
information must be readable if it is to be useful. Users
of financial statements can understand the information
only if the data presented and their methods of
presentation are meaningful to them. As different 'users
will obviously have different levels of ability as
regards understanding accounting information.
understandability also requires that the users have some
understanding of the complex economic activities of
companies, the financiaL accounting process, and the
technical terminology used in financial statements.
understandability does not necessarily mean simplicity.
~ t ' means to take into the account the abilities and
knowledge of the users concerned. Therefore problems do
not arise'when an accountant has to report on complex
activities,"but to the nonexpert user.
3. Reliability:
It should be credible. The credibility of
information contained in corporate reports is enhanced if

it is independently verified (ASSC 1975). Verifiable
financial accounting information provides results that
would be substantially duplicated by independent
measurers using the same measurement methods. It is not
suggested, that a high degree of accuracy is necessary,
only that which is possible given the constraint of time
and expenses (Accounting Objectives Study Group 1973).
Objectivity:
The information presented should be fair and
neutral. It must be based on verifiable evidence
(whenever possible). It should not be biased towards the
interest of any particular user group (Spacek 1969,
Carsberg et a1 1974, Barback 1976). Measurement can not
be completely free from subjective opinions and
judgement. Nevertheless, the usefulness of information
is enhanced if it is verifiable, which means, if the
attribute or attributes selected for measurement and as
well as the measurement methods used provide results
which can independent measurers.
Neutral financial information is directed to the
common needs of users and is independent of presumptions
about particular needs and desires of specific users of
the information. Measurements that are not based on
presumptions about particular needs of specific users
enhance the relevance of the information to common needs
of users. Therefore preparers of financial information

should not try to increase the helpfulness of the
information to a few users to the detriment of others.
Completeness:
It must disclose all material matters to provide
users, as far as possible, with an overall picture of the
economic activities of the reporting company (ASSC,
The annual report should be published reasonably
soon after the end of the accounting period to which it
relates. It should not be so out of date as to be useless
for decision making (Grady, 1965). Therefore approximate
infomation if it is to be made available in time to
assist with some decision is likely to be more useful
than precise and accurate information presented after the
decision has been already made.
7. comparability:
The results should be presented in such a way that
they are comparable with those of other accounting
periods and other reporting entities. It is also
necessaw for the accounting concepts and policies to be
applied with some degree of consistency in methodology,
particularly for the comparison of the company against
itself and for inter-company comparison lee, 1975,
~ccounting Objectives study Group, 1973.
These are all the important conditions of good
communication, but many are difficult to meet
simultaneously in practice. However, the corporate
reports should make a balance of these seven desirable
characteristics. For example, relevance may have to be
sacrificed to some extent to obtain a sufficient level of
objectivity while a balance is needed for completeness
and understandability. ~ l s o judgment is needed to settle
conflicts between completeness and timeliness (ALIA,
1976).
The follow up of one objective or one set of
objectives may conflict with the following up of others.
For example, it is not always possible to have financial
statements that are highly relevant on the one hand, and
also timely on -the other hand. At the same time it is .not
always possible to have financial accounting information
that are both as verifiable and as relevant as desired.
conflicts between qualitative objectives might be
resolved by arranging the objectives in order of relative
importance and determining a desirable compromise.
However, except for the primary of relevance, neither the
accountants nor users now agree as to their relative
importance. In addition, determining a desirable
compromise requires judgement.
The following quotation is a useful summary:

The qualitative characteristics financial
statements, like objectives; should be based
largely upon the needs of the user of the
statements. Information is useless unless it is
relevant and material to a user's decision.
Information should be as free as possible from
any biases of the preparer. - In making decisions,
users should not only understand the information,
presented, but also should be able to assess its
reliability and comgare it with information '
about alternative opportunities and previous
experience. In all cases,,information is more
useful if it stresses economic substance rather
than technical formm. A C C O U ~ ~ ~ Objective ~
Study Group, (1973).
5.6 L I M I T A T I O N S D ACCW.NI3:
Achievement of the qualitative objectives of
financial accounting enhance the reliability of financial
statements. Reliability of information is important to
users because decisions based on the information may
affect their results. However reliability does not imply
full precise information in the published accounts,
because financial accounting involves approximation and
judgement.

The responsibility for the reliability of a
company's published accounts rests with its management.
These responsibilities are discharged by applying
generally accepted principles that are appropriate to the
company's circumstances, by. maintaining effective
accounts systems and internal control, and by reporting
adequate financial statements.
There is an inherent limitation in final accounts,
in so far that they are designed to .meet the information
requirements of different users or group of users (as
discussed in section 5.4) and hence the result is a
compromise. For example, trade creditors are initially
concerned with adequate cash to pay immediate debts, the
continuing existence of the .. company, and finally the
security on their claims, therefore the accounting data
provided in annual financial statements for them is
insufficient on the grounds of frequency and timeliness.
They argue that the information is available only once a
year, and is several months out of date. More reliance is
placed on their own estimates. On the other hand the
banks are risk lenders, in that their primary function is
the security of the loan rather. than the earnings of the
business ., Robson Rhodes (1982) indicates that the . high
failure rate of companies financed under the Government
Loan Guarantee Scheme was partially attributable to the
. lack of caution in bank lending. The banks at that time
were entitled to recover 80% from the Government .in the
event of loan default.

The following are some criticisms regarding the
reliability of published accounts:
INVENTORIES:
In accordance with standard practice, annual
published accounts are prepared under certain accouking
conventions. However, within these accounting
- conventions, there is still considerable scope for
arbitrary and personal judgment. In practice, companies
provide for depreciation of fixed assets at a much higher
. rate than their actual.rate. Usually, the fixed assets
are used long after the cost is fully depreciated. The
methods and rates are based on a mixture of convenience,
together with estimates of the useful working life of the
assets as well as the resale value of the assets. The
method of depreciation selected will give different
values to assets over the years and different charges to
the profit and loss account, even though the same useful
working life is used.
The two most commonly used methods of depreciation
are the straight line method and the declining balance
method. The straight line depreciation method allocates
the cost of a fixed asset less any resale value equally
to operations over the estimated useful working life of
the asset. The depreciation, ( D is computed by the
formula :

mere : k = estimated number of years of useful working
life
c = cost of asset
s = estimated resale price ( scrap value)
The declining balance sheet method on the other hand
charges a greater proportion of an asset's total'
depreciation to operations during the early years of its
estimated useful working life than during latter years.
In other words, a constant proportion is used each year
but it i s applied to the portion of the cost not
previously depreciated. The followirig formula is used to
compute the annual depreciation:
( the symbols are the same as in above)
The obvious difference between these two. depreciation
methods can be demonstrated by the following example:
Assume that an asset is bought for fl60,OOO with an
estimated useful working life'of five years by the end of
which its resale value is expected to be f5,000. The

table below demonstrates the differences in employing the
two depreciation methods:
......................................................... Straight Line Declining method balance
method ......................................................... Asset value at beginning
of year 1 E160,OOO £160,000 Depreciation for year 1 - 31,000 - 80,000 ------------ ----------- Asset value at beginning
of year 2 129,000 80,000 Depreciation for year 2 - 31,000 - 40,000 ------------ ----------- Asset value at beginning
of year 3 98,000 40,000 Depreciation for year 3 . - 31,000 - 20,000
Asset value at beginning of year 4 67,000 20,000
depreciation for year 4 - 31,000 - 10,000 ----------- ------------- Asset value at beginning
of year 5 36,000 10,000 depreciation for year 5 - 31,000 - 5,000
resale value
Each of these two methods has its legitimate
economic reasons for when and why it should be applied.
For example, asset s operating costs are constant
over its entire life, the straight line depreciation
is the more appropriate because it allocates the
cost of asset equally to operations for each accounting
period. While, on the other hand the declining balance
depreciation method is likely to be more suitable when a
particular asset requires a greater maintenance in its
latter years of operation.
As it is clear from the table above, the
depreciation method will have a great effect on the
resulting profit of the company particularly when the
depreciating assets are expensive. Therefore this
loophole can be used by management to reach a desired
prof it under certain circumstances. For instance, the
declining balance depreciation method can be used to hold
down earnings and conserve funds by reducing
shareholders ' .pressure to increase dividend distribution,
and also to provide an argument against pay increases. In
other situations, the straight line depreciation method
can be utilised to smooth earnings, and in times of
depressed profits it helps to switch from the declining
balance depreciation method to the straight line method
to boost profits with the hope that this will maintain
the market price of the company's shares. The choice of
useful working life for a depreciated asset can also be
used in a similar way to further the achievement of
management's financial objectives. ' - _ - _ _ -_ --_ _. - -
The valuation of inventories is another area which
brings a lot of criticism to published accounts regarding
the different methods that have been employed in
practice. The effect of using the well known two methods
of valuation of the inventories, namely, First in first
out (FIFO), and last in first out (LIFO) will be
demonstrated below with the impact of inflation on
published accounts.

INFLATION:
A second major criticism is that financial
statements prepared on the historical cost basis do not
reflect the effects of inflation. Inflation has an impact
in two main ways. First, the profit figure in each year
is overstated and second, the value of comparing the
trend of performance over consecutive years is impaired.
An example will be useful to illustrate that :
Suppose that company A, began business on December
31, 19x1, and its balance sheet at that time was as
following:
Balance Sheet For Company (A) At 31 - 12 - 19x1
ASSETS LIABILITIES AND
NET WORTH
Equity 480,000
Inventoq 200,000
Net fixed assets 200,000

The fixed assets are depreciable over 10 years by
using the straight line depreciation method. Inventory is
reported on a first in first out (FIFO) basis. Sales
occurred at the end of the first year of operation, and
inflation for that year was 10 percent, assuming that it
occurred at the beginning of 19x2.
The income statement for the first year' of
operations reported on an historical cost basis was as
follows :
-- -----------------
Income Statement On Historical Cost Basis For Company (A)
Sales £ 280,000
Cost of goods sold
~eginning inventory
Purchases
~nding inventory
~epreciation (200,000/10)
selling and administrative
expenses
Net profit

It is noticeable that the company's ending .inventory
is higher than its beginning inventory by the percentage
increase in prices, . namely 10. - percent. However the
balance sheet of the company at December 31, 19x2, would
be:
Balance Sheet On Historical Cost Basis F O ~ Company (A)
At 31 - 12 - 19x2 .........................................................
ASSETS LIABILITIES AND
NET WORTH
......................................................... f f
Cash 110,000 Equity 480,000
Inventory 220,000 ~etained
Net fixed assets 180,000 earnings 30,000
-------- -------- 510,000 510,000
-------- -------- -------- --------
- If two of the more widely used profitability ratios,
computed from the results above, They will be:
Net profit margin = net profit after tax / sales
(30,000/280,000) *lo0 = 10.71%
Return on assets = net profit after tax / total assets
(30, 000/510, 000) "100 = 5.88%

In both cases, the profitability of the company is
overstated, because of using (FIFO) method, inventories
that are sold are assumed, to have been purchased at the
prices prevailing when the oldest items in the inventory
were purchased. With inflation, these prices will be
considerably below their replacement costs. So the
inventory sold are valued at E200,OOO for accounting
purposes, whereas their replacement cost at the time they
were sold was f220,OOO. The costing of inventory in this
manner tends to understate costs and to overstate
profits. A remedy is to use the last in first out (LIFO)
method. -With this method, the inventory most . recently
purchased is employed in the cost of goods sold. As a
result, the value affixed to the inventory will be nearer
the replacement cost.
In addition to inventory valuation on the FIFO basis
overstating profits, depreciation charges are based on
the original cost of the fixed assets, less accumulated
depreciation. Again with inflation, the original cost is
less than the current replacement cost of these assets.
I£ these assets increase in value by 10 percent, their
replacement value is f 220,000, and depreciation would be
22,000 instead of the 20,000 used for accounting
depreciation purposes.
~eproducing the income statement of company A on a
replacement cost basis, it would look like this for 19x2:
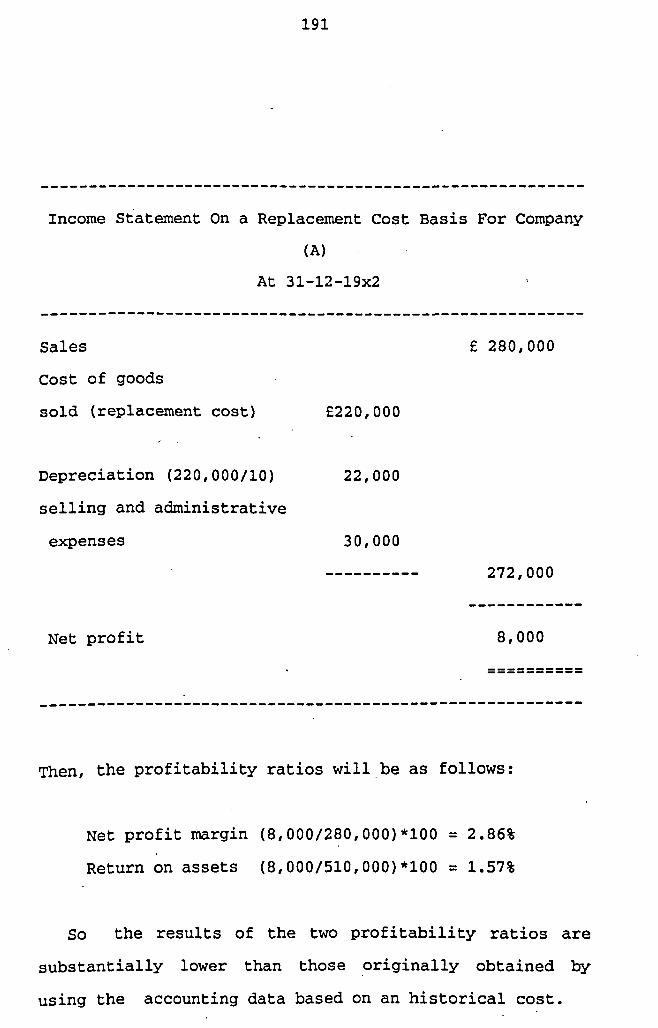
Income statement On a Replacement Cost Basis For Company
(A)
At 31-12-19x2
......................................................... Sales f 280 ,000
cost of goods
sold (replacement cost)
~epreciation (220 ,000/10)
selling and administrative
expenses
Net profit
Then, the profitability ratios will be as follows:
Net profit margin (8 ,000 /280 ,000 ) * I 0 0 = 2.86%
Return on assets (8 ,000 /510 ,000 ) * I 0 0 = 1 .57%
SO the results of the two profitability ratios are
substantially lower than those originally obtained by
using the accounting data based on an historical cost.

Assume in 19x3 no inflation occurs, the income
statement of the company will be as follows on an
historical cost basis:
Income Statement On Historical Cost Basis For Company (A)
At 31 - 12 - 19x3
Sales
Cost of goods sold
inventory
Purchases
~nding inventory
~epreciation (200,000/10)
selling and administrative
expenses
Net profit
Therefore the profit of the company drops
substantially from E30,000 reported in the 19x2 year to
f10,000 in 19x3 year despite using historical costs to
compute the profit figure.

This deterioration of the profit performance is
primarily due to inflation, and not to the management.
~ooking at the income statement on a replacement .cost
basis for 19x3, it will be :
Income Statement On a Replacement Cost Basis For Company
(A) At 31 - 12 - 19x3
Sales
Cost of goods sold
~epreciation ,(220,000/10)
selling and administrative
expenses
Net profit
~ h i s profit figure is exactly the same as that for 19x2,
on a replacement cost basis.
In- order to compute the two profitability rptios on
a replacement cost basis, ,it is necessarily to reproduce
the 19x2 balance sheet on a replacement costs. This
balance sheet becomes: 1
I -

Balance Sheet On a Replacement Cost-Basis For Company (A)
ASSETS LIABILITIES AND
NET WORTH
.........................................................
Cash
Inventory
Net fixed assets
E f
110,000 Equity 480,000
220,000 Retained
198,000 earnings 8,000
gain 40,000
The gross fixed assets are adjusted for inflation by
10 percent to £220,000. When the subtraction of the first
year's depreciation of £22,000, takes place the net fixed
assets becomes £198,000. The holding period gain of
f40,000 is comprised of the inventory profit of £20,000
which arises from the FIFO method, together with the
increase in value of the fixed assets of £20,000. Both of
these gains are due to inflation during 19x2. With
f528,000 as the asset value, the profitability ratios for
19x3 using replacement cost data are:

Net profit margin (8,000/280., 000) *I00 = 2.86%
Return on assets (8,000/528,000)*100 = 1.51% #
mile the net profit margin is the same as in 19x2, the
return , on assets is lower. This is due to the
denominator, beginning total assets, being larger than
that for the preceding year.
W OF RIAS ON CERTAIN-:
The 'static nature of annual financial staterhents
opens up the question of bias. For example inventory and
debtors at the end of the year may not be representative
of their respective levels during the year. There are
also opportunities for window dressing e.g. inventory can
be reduced prior to the balance sheet by reducing
purchases. This would improve cashflow and liquidity.
Debtors could be reduced by discouraging credit sales or
by encouraging debtors to settle quicker with larger
discounts. Liquidity ratios could be improved by short
term borrowing just prior to the balance sheet data.
The limitations cited above are some of the .
~eakne~se!L of published accounts as regards their , ____--- -
reliability, to people who have no other source of
information. However, a number of researchers and-writers
in this field have put forward some suggestions to
improve their reliability. Notes accompanying the

accounts are necessary if the users have to have more
accurate knowledge about the company's financial position
(Myre (1946), Stamp and Marley (1970), Mulondo (1981) 1 .
These notes would include information such as the various
accounting methods used for depreciation and valuation of
inventories etc .
The debate and controversy over the years on the
subject of depreciation and the effect of revaluation of
assets on the depreciation charge no doubt led the ASC
to issue a cowletely revised version of SSAP 12 in
January 1987, known officially as SSAP 12 (revised) . It states the following in paragraphs 25, 26 and 27:
"25. The following should be disclosed in the
financial statements for each major class
of depreciable asset:
(a) The depreciation methods used;
(b) The useful economic lives or the depreciation
rates used;
(c) Total depreciation charged for the period; and
(d) The gross amount of depreciable assets and the
related accumulated depreciation.
26. Where there has been a change in the
depreciation method used, the effect, if
material, should be disclosed in the
year of change. The reason for the change -
should also be disclosed.

27. Where assets have been revalued, the effect
of the revaluation on the depreciation
charge should, if material, be disclosed in
the year of revaluation.
It is worth mention that these requirements are in
line with the .requirements of Companies Act 1985 Schedule
(4). Regarding the criticisms in connection with the
methods of valuation of inventories discussed above,
again the ASC came under pressure to issue a revised SSAP
9 in September 1988. This time it was not in line with
same requirement of the 1985 Companies Act. The SSAP 9
states that:
"The amount at which stocks are stated in
periodic financial statements should be the
total of the lower of cost-and net realisable
value of the separate items of stock or of
groups of similar itemsn.
The Companies Act 1985 .Schedule 4 paragraph 27
allows the use of LIFO, as well as FIFO, weighted
average, and any other method similar to any of these
three. here i.s therefore large scope for companies to
chose methods or to switch from one method to others when
they need to control their approximate desired paper
prof it.

Despite the limitations cited above, the
similarities followed by practices in preparing financial
statements are more greater than the differences.
published accounts are valuable sources of accounting
data and have led to a large number of financial analysis
studies which have made major contributions to the field
of financial analysis.

TITS AND I m R P R R T q T I O N O F THE RESEN?=
his chapter presents the findings obtained from
this study. The chapter is divided into five sections:
1. General characteristics of the failed and nonfailed
-companies.
2 . Results of the analysis and models derived as well as
the results of the validation tests.
3. ~eneral trends of selected financial ratios that the
research determined could distinguish between failed
and nonfailed small-medium size companies.
4. The performance of the "best8 discriminant model
(DFY2 ) on the failed company set comprising the
validation sample, and finally;
5. An analysis of the performance of . DFY2 on some
nonfailed companies in validation sample.
his study consisted of thirty failed companies and
eighty nonfailed companies selected from the Exstat Tape
provided by Gtel Company Limited. A list of companies
represented in this sample, together with the date of
last report, the number of years for which accounting
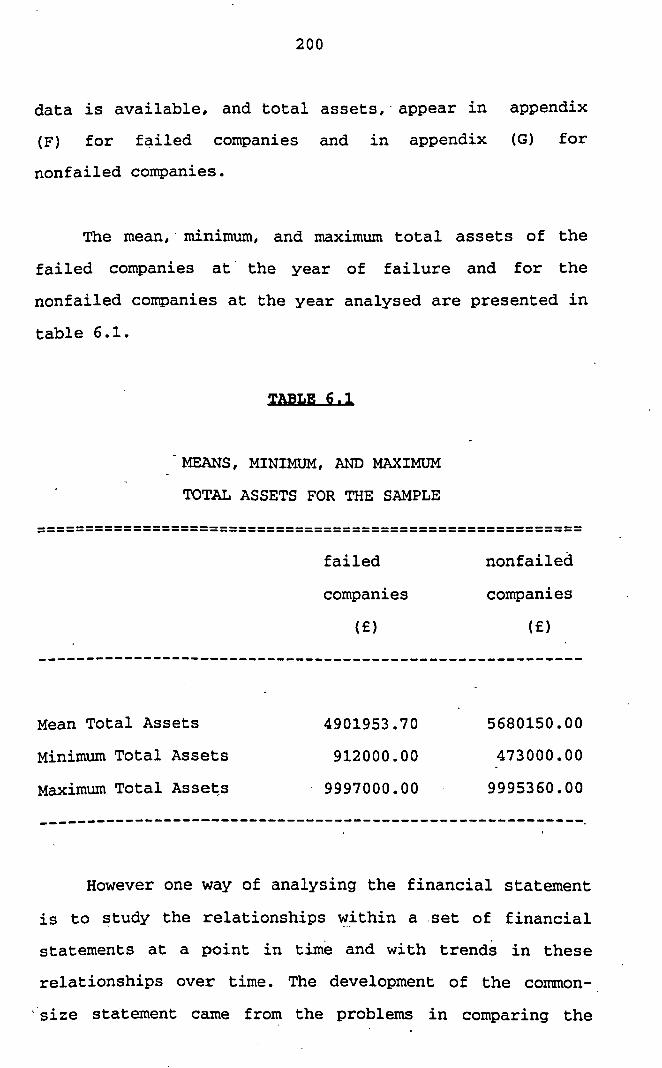
data is available, and total assets, - appear in appendix
( F ) for failed companies and in appendix (G) for
nonfailed companies.
The mean,' minimum, and maximum total assets of the
failed companies at' the year of failure and for the
nonfailed companies at the year analysed are presented in
table 6.1.
MEANS, MINIMUM, AND MAXIMUM
TOTAL ASSETS FOR THE SAMPLE
failed nonfailed
companies companies
Mean Total Assets
~inimum Total Assets 912000 .OO 473000.00
Maximum Total Assets 9997000.00 . 9995360.00
However one way of analysing the financial statement
is to study the relationships within . .. a .set of financial
statements at a point in time and with trends in these
relationships over time. The development of the common-
,'size statement came from the problems in comparing the

financial statements companies that were different
size. For example, suppose that company (A) had
liabilities of f 50000.00 and company (B) had f30000.00
long-term liabilities. Regarding the possible size
differences between'the two companies (in total assets),
it would be misleading to say always that company (A) is
more highly geared than company (B) . So one way of
controlling the differences in size is to make' the
components of the balance sheet as a percentage of total
assets, and the emergent statement is called a common-
size statement. By doing so many references can be
reached from the new statement, such as the utilisation
of assets and methods used to finance their assets. In 1
the same way the comparison could be made . - between the
two groups comprising the sample, that is failed
companies and nonfailed companies, in order to have a
clear-view about the components of the balance sheet as a
percentage of total assets (liabilities and equity or
shareholder's fund) and the changes in these components
over the five years prior to failure. .
Figure 6.1 presents the changes in the composition
of assets for failed (F) and nonfailed (NF) companies
for one through five years prior to failure . The percentage in this' figure are tabulated in Table 6.2.

FIGURE 6.1 CHANGES IN THE PROPORTION OF ASSETS
RELATIVE TO TOTAL ASSETS FOR F & NF CO'S
YEARS PRIOR TO FAILURE
LEGEND
CASH AND EQUIVALENT DEBTORS INVENTORY FIXED ASSETS
F - FAILED NF - NONFAILED

CHANGES IN THE PROPORTION OF ASSETS RELATIVE TO TOTAL
ASSETS FOR FAILED AND NONFAILED COMPANIES .........................................................
Failed Companies
Years prior To Failure
Cash & Equivalent 2.45 3 -30 1.70 1.70 2.59
Debtors 27.36 27.53 29.57 28.66 24.45
stock & Work in 22.55 20.17 19.70 21.94 20.10
Progress
~ i x e d Assets 47.63 48.99 49.03 47.70 52.86 .........................................................
Nonfailed companies .........................................................
Years Prior To Failure ..................................... 1 2 3 4 5
......................................................... % % % - % %
Cash & Equivalent 5.95 5.43 5.5 4.91 5.5
Debtors 32.30 32.40 32.84 32.40 32.50
stock & Work In 27.54 27.45 27.59 28.83 29.03
Progress
Fixed Assets
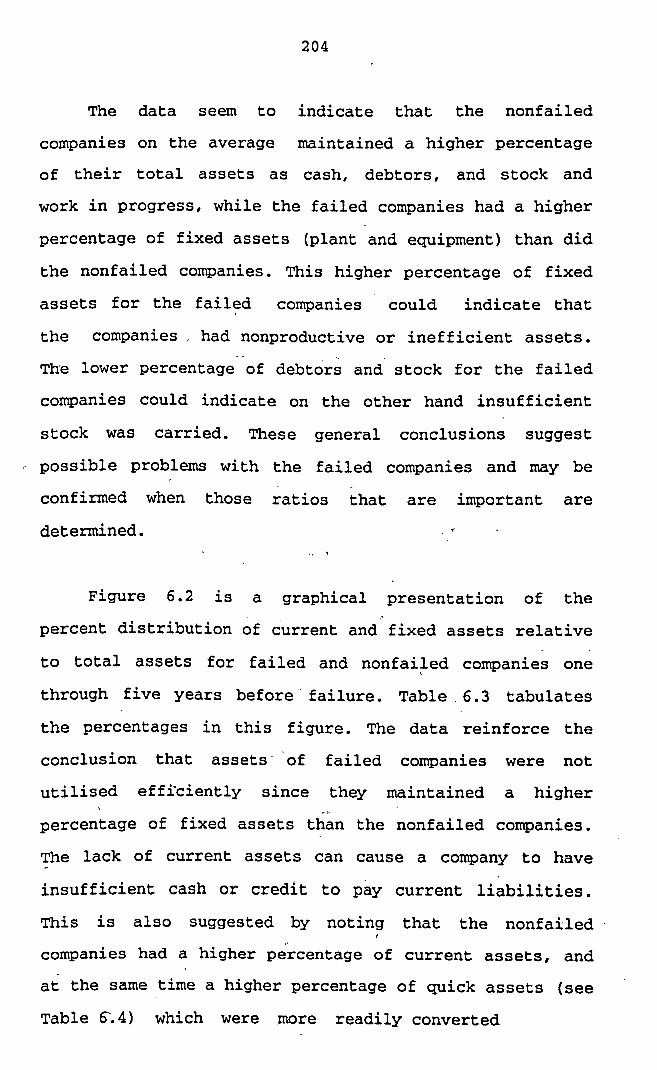
The data seem to indicate that the nonfailed
companies on the average maintained a higher percentage
of their total assets as cash, debtors, and stock and
work in progress, while the failed companies had a higher
percentage of fixed assets (plant and equipment) than did
the nonfailed companies. This higher percentage of fixed
assets for the failed companies could indicate that
the companies . had nonproductive or inefficient assets. . .
The lower percentage of debt&$ and stock for the failed
companies could indicate on the other hand insufficient
stock was carried. These general conclusions suggest
possible problems with the failed companies and may be
confirmed when those ratios that are important are
determined. t
. . *
~igure 6.2 is a graphical presentation of the
percent distribution of current and" fixed assets relative
to total assets for failed and nonfailed companies one
through five years before'failure. Table.6.3 tabulates
the percentages in this figure. The data reinforce the
conclusion that assets' 'of failed companies were not
utilised effi'ciently since they maintained a higher C i,
percentage of fixed assets than the nonfailed companies.
The lack of current assets can cause a company to have
insufficient cash or credit to pay current liabilities.
his is also suggested by noting that the nonfailed I
companies had a higher percentage of current assets, and
at the same time a higher percentage of quick assets (see
Table 6'.4)' which were .more readily converted

FIGURE 6.2 DISTRIBUTION OF CURRENT & FIXED ASSETS
RELATIVE TO TOTAL ASSETS PERCENT FOR F&N
YEARS PRIOR TO FAILURE
LEGEND
CURRENT ASSETS FIXED ASSETS
F - FAILED COMPANIES NF NONFAILED COMPANIES

PERCENT DISTRIBUTION OF CURRENT AND FIXED ASSETS
RELATIVE TO TOTAL ASSETS FOR FAILED AND NONFAILED
COMPANIES
Failed Companies .........................................................
Years Prior To Failure ..................................... 1 2 3 4 5
......................................................... % . % % % %
Current Assets 52.37 51.01 50.97 52.30 47.14
~ i x e d Assets 47.63 48.99 49.03 47.70 52.86 .........................................................
Nonfailed companies .........................................................
Years Prior To Failure
% % % % %
Current Assets 65.79 65.28 65.93 66.15 67.03
Fixed Assets 34.21 34.72 34.07 33.85 32.96
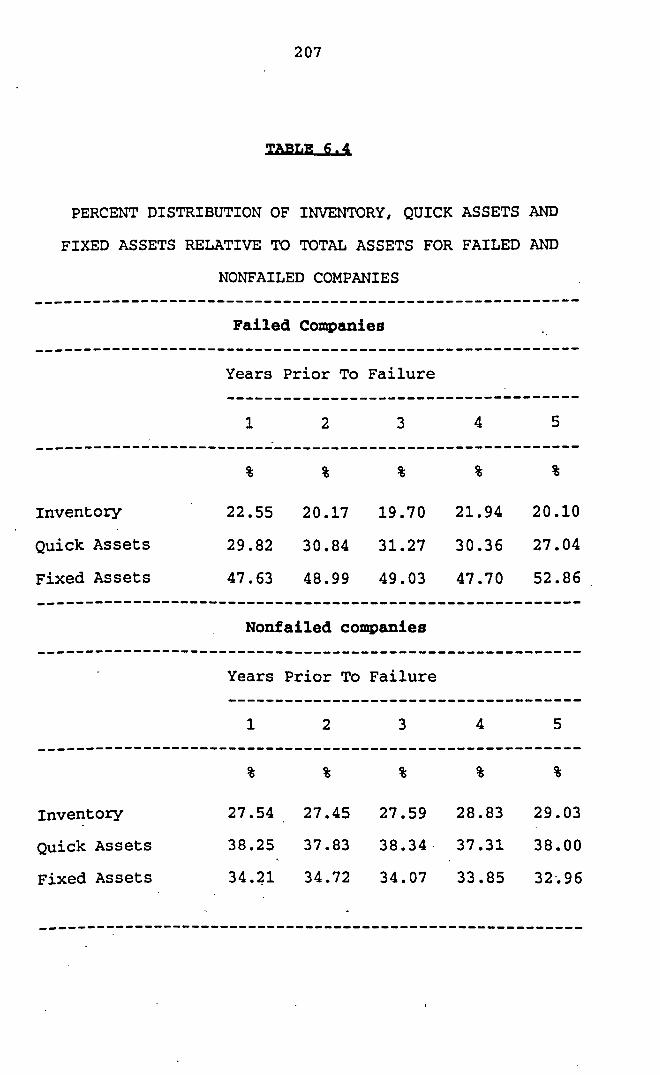
PERCENT DISTRIBUTION OF INVENTORY, QUICK ASSETS AND
FIXED ASSETS RELATIVE TO TOTAL ASSETS FOR FAILED AND
NONFAILED COMPANIES .........................................................
Failed Companies
Years Prior To ~ailure
Inventory 22.55 20.17 19.70 21.94 20.10
Quick Assets
Fixed Assets 47.63 48.99 49.03 47.70 52.86 ,
......................................................... Nonfailed companies
......................................................... Years Prior To Failure ..................................... 1 2 3 4 5
......................................................... % % % % %
Inventory
Quick Assets
Fixed Assets

into cash to meet adverse changes in business conditions.
~espite that the nonfailed companies had almost double
the cash and equivalent than the failed companies. This
liquidity allows a company to respond to changing
conditions and improves its ability to survive during
times of economic downturn.
Figure '6.3 presents the changes in the proportions
of liabilities and equity (shareholder's fund) relative
to total assets for the sample of companies up to five
years before failure. The percentage in this figure are . tabulated in Table 6.5 .
The data represent methods companies used to finance
their asset acquisitions . A healthy company will have an easier time using the equity markets for long-term
financing. This conc1;sion is supported by the higher
~ercentage of equity for the nonfailed companies compared
to the failed companies. The failed companies used the
current and long-term liabilities as their major sources
of financing. When a company has to rely on financing
assets through short (current) or long-term liabilities,
its interest expenses will be greater. If a company
encounters financial difficulties, the ability to
rollover short-term debt may become a major problem which <
could hasten the demise of the company, and this is
really what happening to the companies in U.K.

a . FIGURE 6.3 CHANGES IN THE PROPORTION OF LIABILITY & EQUITY RELATIVE TO TOTAL ASSETS FOR F&NF
1 I
F 1 NF1 F 2 N F 2 F 3 N F 3 F 4 NF4 F 5 NF5
YEARS PRIOR TO FAILURE '
LEGEND
BANK LOANS& OVERDRFT CREDITORS U LONG-TERM LIABILITY EQUITY
F FAILED COMPANIES' NF= NONFAILED COMPANIES

CHANGES IN PROPORTIONS OF LIABILITIES & EQUITY RELATIVE TO
TOTAL ASSETS FOR FAILED AND NONFAILED COMPANIES .........................................................
Failed Companies .........................................................
Years Prior To Failure ..................................... 1 2 3 4 ' " 5
Bank Loans And Overdrafts
creditors 33.08 30.89 29.68 28.26 23.38
Long-term ~iabilities
Nonfailed companies .........................................................
Years Prior To Failure
Bank Loans .And Overdrafts
Creditors
Long- t e m Liabilities
~uring 1990 because of the higher interest rate most of
the small companies are in financial difficulties and
quite a large number failed.
As presented in chapter four the variables selection
method to be used in multiple discriminant analysis"wil1
be the stepwise procedure selection of the SPSS~ (1985).
his procedure based on Wilks' Lmbda maximises the F-
ratio for the, test of differences between group centroids a
and does not increase the overall rate of
misclassification (Mclachlan, 1980).
The analysis proceeded in three stages:
The first Stage is concerned with evaluating five
discriminant models .for each of the five years prior to
failure.
The second stage is to assess the performance of each of
the five models over time. In other words to test the
performance of the five models on data not used in their
construction, . that 'means for each of the five
discriminant functions a further four discriminant runs
will be made to assess the performance of each model.
For example the resulting linear discriminant function
from the first year prior to failure will be tested on
data years two, three, four, and five prior to failure.

Similarly the linear discriminant function which
emerges from using data two years prior to failure will
be tested on data year one, three, four, and five prior
to failure, and so on for the discriminant models years
three, four, and five . In total 20 discriminant runs will be made in addition to the five discriminant runs
for each of the five years prior to failure.
The third stage concerned the validation technique,
it was however, considered that at this stage, that the
model is basically explanatory as it is tested on the
groups from which it was originally derived. Only when
new companies are classified applying the model would it
then become predictive in nature.
It was, therefore decided to test each of the five
models precisely over the time on a new.sample drawn from
the Exstat Tape which comprised 10 failed and 56
nonfailed companies selected on the same basis of the
original sample according the total assets and industrial
classification.
~he.required data for the validation sample was extracted
from the Exstat Tape up to five years prior to failure.
~egarding the first stage , five discriminant
functions for years one, two, three, four, and five
before failure have been determined. As mentioned earlier

in section 5.3 , the method used for all five
discriminant functions was Wilks forward selection, and
it is available on the S P S S ~ (1985). The results of
applying the discriminant function for years one to five
prior to failure, together with their performance in
classifying the companies whose accounting data was used
in constructing them are presented in Table 6.6 .
It can be :seen from this Table that the best
~erforming model is the one year prior to failure model
which classifies 93.3% of the failed companies correctly,
whereas model the two years prior to failure classifies
only 83.3% of the failed companies correctly. The three
years prior to failure model classifies 76.7% of the
failed companies correctly and the four years prior to
failure model classifies 86.7% of failed companies
correctly. Finally the five years prior to failure model
, classifies 84.0% of failed companies correctly.
It is clear that the Wilks' Lambda for the one year prior
to failure model is the lower among all the models and
because of. the method chosen to select a subset of
variables from all possible discriminant variables that
dnimised this statistic and maximises its equivalent F-
ratio for the test of the differences between group
centroids this model was consider to be the best one at
this stage at least.

TABLE 6 . 6
RESULTS OF DISCRIMINANT MODELS
Percentage of Correct Classification .......................... Wilks' F- Degrees
Years Prior Variables Entered the Nonfailed Failed Total Lambda Value of to Failure Discriminant Function Freedom ..........................................................................................
1 R2PR R3PR R4PR RSPR R7GE R12TR R21LQ 95.0 93.3 94.55 0.3733 24.461 7,102
2 R3PR R6GE RlOTR RllTR R14TR R20LQ R21LQ 88.8 83.3 87.27 0.4761 16.032 7,102
3 R2PR R3PR R6GE RlOTR R16LQ R20LQ 77.5 76.7 77.27 0.6551 8.951 6,102
4 R2PR R4PR R5PR R6GE RlOTR RllTR R16LQ R20LQ 88.5 86.7 87.96 0.5518 10.049 8,99
5 R6GE R7GE R9GE RlOTR R13TR R16LQ R17LQ R18LQ 79.5 84.0 80.58 0.5812 6.6280 10,92
R19LQ R20LQ
F6,60 = 4.37 , for a = 0.001 F6,120 = 4.04 for a = 0.001
F7,60 = 4.09 , for a = 0.001 F7,120 = 3.77 for a = 0.001
F8,60 = 3.87 , for a = 0.001 F8,120 = 3.55 for a = 0.001
F10,60= 3.54 , for a = 0.001 F10,120= 3.24 for a = 0.001
The threshold value of F7,102 at the 99.9% level of
significance is between 3.77 and 4.09, while the computed
value of f7,102 has a value of 24.461 for the one year
prior to failure model and 16.032 for the two year prior
to failure model. This meam that there is a very
significant separation between the group centroid of the
failed and nonfailed small-medium sized companies.
However, it is not sufficient that the discriminant
function to be chosen should work or had the higher
classification accuracy in one year only prior to
failure, but the best discriminant model would have to
work over time, in other words it was decided to test the . -
performance of each of the model one, two, three years
before failure on data not used in its construction as it
was stated on stage two in the beginning of this section.
The reason for not examining the performance of
models four and five years prior to failure was mainly
because the numbers of financial ratios entering these
two models made them difficult to use in practice,
particularly model five years prior to failure, which
contained ten variables, whereas model four years prior
to failure had eight variables. On the other hand three
variables R2PR, R4PR, and RSPR, appearing in the model
four years before failure are already included in model.
one year before failure. The variables R6GE, RlOTR,
R~ITR, and R20LQ, are included model two years before
failure and the only remaining variable R16LQ in model

. four years before failure appears as well in model three
years before failure, so it was decided that nothing
further could be gained from carrying out the assessment
and performance of this model.
Turning to model five years prior to failure it can
be seen from Table 6.6 that variables R6GE, RlOTR, and
R~OLQ are included in model two years before failure and
variable R7GE appears in model one year before failure,
while variable R16LQ is included in model three years
before failure, the main reason for not pursuing its
performance any further was because of the huge number of
variables (10) in this model, which definitely will not
be easy to use in practice.
6.3.2 D s T I N G THF: PWOWANCF: OF nISCRIMINANT MODGTlS OVER
TIME:
In order to choose the best discriminant model from
the resulting model obtained from stage one, it is,
necessaw to examine the performance of each of the first
three discriminant models from years one, two, and three
prior to failure over the time.
he results of this examination are given in e able 6.7. It can be seen from this results that, as the lead
time increases, the relative predictive abili-ty of any
model would decrease and this is expected on an a
priori basis.

However as Altman (1968) stated that the bankruptcy
prediction model is an accurate forecaster of failure up
to two 'years prior to bankruptcy and that the accuracy
diminishes substantially dkcreases as the lead time
increases." This is also true based on results in Table
6.7 column three for DFYl and DFY2.
Any way to choose the best discriminant model. the
question is should one take the correct classification of
the failed companies only or the total percentage of the
correct classification for the entire sample (failed and . nonfailed small medium size companies).
However, only the correct classification the failed
companies have to be taken as a criterion to choose the -- --
best model, and up to two years before failure, which is
quite enough time for action to be taken before the event
of failure, it is clear that discriminant function two is
the best one, which correctly classifies failed
companies in the first year before failure and 83.3% in
the second year. It also correctly classifies 88.18%,
87.27% of the sample of companies in year one and two
respectively prior to failure.

RESULTS OF TESTING THE PERFORMANCE OF DISCRIMINANT MODELS
(1,2,3) YEARS PRIOR TO FAILURE OVER TIME ......................................................... DISCRIMINANT YEAR PRIOR PERCENTAGE OF NUMBER OF
FUNCTION * TO FAILURE CORRECT THE
CLASSIFICATION COMPANIES ............................ F NF TOTAL F NF
.........................................................
1 80.0 75 .0 76 .36 30 80
2 73.3 76.3 75.45 30 80
3 76.7 77 .5 77.27 30 80
4 76.7 87.2 84.26 30 7 8 .
5 80.0 87.2 85.44 25 7 8 ......................................................... * DFY1, DFY2, DFY3 represent the discriminant function
one, two, and three years prior to failure respectively
from stage one.

The discriminant function one,. correctly classified
93.3%, 73.3% of failed companies in the first and second
year respectively before failure, but its total percent
of correct classification for the first year is superior
to DFY2 (94.55%), and in the second year had the same
result (87.27%) .
It was thought however to test all the three
discriminant models on a new sample of failed - and
nonfailed small medium sized companies in order to reach
a precise decision of choosing the best discriminant
model, and that will be the subject of the next section.
6.3 - 3 =-ANT ~ T I S ON THR VAT- SAMPLE.
Classification of the original sample using the
parameters of the model is generally expected to measure'
the predictive ability of the model and is expressed as
the proportion of correct classiiications over the total
ample size. Many researchers, however, considered that
this method of assessing the groups from which the model
was originally generated may be biased and lead to overly
optimistic estimation of how well the model would perform
the whole population of companies.

It was, however considered that at this stage, that
any model is basically explanatory as it is tested on the
groups from which it was originally derived. Only when
new companies are classified by applying the model would
the model then become predictive in nature. It was
therefore, decided to test the three models rigourously
on a new sample drawn from the Exstat Tape which
comprised ten failed and fifty-six nonfailed small-medium
sized companies, selected on the same bases of selection
as the analysis sample.
A list of these failed companies, together .with the
date of failure, date of last report, type of failure and
the elapsed time between the last report and the date of . .
failure are given in table 6.8.
The data required to test the three discriminant
models on the validation sample was extracted from the
Exstat Tape up to five years before failure. The results
of this test are given in Table 6.9. It is obvious that
the accuracy of the model two years prior to failure is
better than any of the two others. This model correctly
classified 80% of the failed companies in year one and
two prior to failure, 66.7%, 55,6%, 44.4% in years 3, 4,
5 before failure respectively, however if the results
given in Table 6.7 should be also taken in to account
when considering the selection of the best discriminant
model among the three models, this model was nearly the ?

best even at that stage , because of the instability of
the performance of DFY3 over time. The same problem
arose with this model in the validation test ( see Table
6.7 and 6.9 q ) .
Moreover the correct classification of model DFY2 on the
validation sample for years 3, 4, and 5 prior to failure
is superior for the same years when it tested over 'time
on the oriiinal sample, with the exception of the fifth
year prior to failure.
Since this study concerned with developing
model to help predict failure of small-medium sized
companies as soon as possible in order to take the
corrective action before the event of failure, the
discriminant model two years prior to failure was
considered the "best8 overall discriminant model.
~ndeed, this model was capable to classify correctly
67 percent of failed companies in validation sample three
year before failure. That means it gives a two year lead
time in which necessary action could have made to try to
prevent the failure of companies.

A LIST OF FAILED COMPANIES USED TO VALIDATE THE DISCRIMINANT MODELS
COMPANY NAME DATE OF DATE OF MONTHS FAILURE LAST ELAPSED
REPORT BETWEEN FAILURE & .. LAST
1 Ellenroad Mill RA: 29.01.84 31.03.83 10
2 Metamec Jentique RA: 30.06.84 30.06.83 12
3 Spencer George RA: 04.05.84 31.12.83 4
4 W Ribbons VL: 23.05.86 30.06.83 35 Holding
5 Allen (W.G.1 & RA: 30.06.85 31.03.84 Sons (Tipton)
6 cocksedge RA: 28.02.85 31.03.84 11
(Holdings )
7 Herman Smith RA: 30.06.85 30.06.84 12
8 ifc care RA: 29.06.86 31.12.84 ~nternational
9 Nova (Jersey) RA: 03.01.87 31.03.84 33 Knit
10 Castle (G.B.) RA: 29.05.86 26.7.85 10
RA = Receiver Appointed VL = Voluntary Liquidation

CLASSIFICATION RESULTS BASED VALIDATION SAMPLE
......................................................... YEAR DFYl DFY2 DFY3 (1) PRIOR ---------------- -------------- --------------- TO F NF TOTAL F NF TOTAL F NF TOTAL FAIL .........................................................
(1) F denote failed companies and NF nonfailed companies.

224
The best discriminant function chosen was:
Z = 0.526 + 4.997 R3PR - 7.751 R6GE + 0.142 R l 0 m
+0.810 RllTR + 1.96 R14TR + 3.725 R20LQ
+2. 083R21LQ
where
R3PR = Net Income / Net worth
RgGE = Total Liabilities / Total Assets
RloTR = Sales / Net Worth
RllTR = Sales / Total Assets
R14TR = Stock / Sales
R20LQ = Quick Assets / Total Assets
R21LQ = Working Capital / Total Assets
These financial ratios represent the profitability
dimension (R2PR) , the financial leverage (Gearing)
dimension (R6GE) , the capital turnover and activity
dimension (RIOT& RllTR, R14TR), and finally the
liquidity dimension ( R20LQ, RZILQ ) . The centroid of the groups is failed Z= -1.70
and nonfailed Z= 0.64 , the range -1.7 to 0.64 is called
the "grey zone' . A cut-off score of Z=O was selected. by . .
adjusting the value of the constant. When using the model
proper interpretation of the Z-score important.
score below zero does not mean that a company will fail , but merely implies that it exhibits characteristics
similar to those of past failures. Companies in the grey
area together with those of a score below zero required
closer analysis, including an examination of the trend of

z-scores in previous accounting periods. A steady decline
in the z-score would certainly indicate a high
probability of failure.
It is interesting to have a measure of the
individual - importance -. -.- - -. .- - of every variable in the "best"
discriminant model. However, one useful technique in
getting the final variable profile for measuring" the
-contribution of each variable in the discriminant
function is by ordering the standardised coefficients . This method is available on SPSS~ and it is similar to a
multiple regression analysis. The standardised
coefficients associated with each discriminant variable
is a measure of its contribution to the discriminatory
power of the function. Table 6.10 presents the
contributions of each variable in the "bestn discriminant
function. It can be seen from this table that The gearing
ratio R6GE and the profitability ratio R3PR, appear to be
equally important contributors to the total
discriminating ability of the model. They ranked the
first and second respectively. The third and forth ratios
are the capital turnover and activity ratio RlOTR and
R ~ ~ T R , while the liquidity ratios R2OLQ and R21LQ ranked
the fifth and. sixth. The remaining capital turnover and
activity ratio R14TR ranked the seventh.
Another method of measuring the individual
importance of each variable is to compute the mean of
every variable in both sets of failed and nonfailed

companies and then perform an F-test which is the
relevant one here for a significant difference between
the means. This test relates the difference between the
mean values of the ratios in each group to the
variability of values of the ratios within each group.
The results of this test are presented in table 6.11.
It can be seen from this table that there -is a highly
significant difference between the means of the R3PR,
R6GE, RlOTR, R20LQ and R21LQ, whereas there is no
significant difference between the means of variable
RllTR and R14TR is significant only at the 10% level.
However, table 6.10 shows these two variables
ranked the forth and seven most important contributors to
discrimination between the two groups respectively. This
is an indication of the importance of the .: multivariate
approach to this kind of problem. In other words using
the traditional univariate analysis, RllTR would not have
been identi,fied as an important variable when searching
for companies in danger 0-f failure.
More detailed discussion on the significance and the
importance of financial ratios which entered the best
discriminant function DFY2 together with those in DFYl
are presented in section 6.4 along with a plot of their
five year trends for both failed and nonfailed companies.

THE CONTRIBUTION EACH FINANCIAL RATIOS THE "BEST"
DISCRIMINANT FUNCTION
......................................................... FINANCIAL FINANCIAL DIMENSION STANDARDISED
RANKING RATIOS COEFFICIENTS .........................................................
Profitability
R6GE Financial leverage -1.284 1
RlOTR Capital turnover & 0.765 3 Activity
R ~ ~ T R Capital turnover & 0.501 4 Activity
R14TR Capital turnover & 0.375 7 Activity
R20LQ Liquidity 0.482 5
R2 1LQ Liquidity 0.423. 6

THE DIFFERENCES IN MEANS OF FINANCIAL RATIOS WHICH
ENTERED THE BEST DISCRIMINANT FUNCTION
FINANCIAL MEAN VALUE OF FINANCIAL RATIOS RATIOS FOR F ........................ STATISTIC SIGNIFICANT
FAILED NONFAILED COMPANIES COMPANIES .........................................................

6.4 G E N E R A L S OF FI-a RATIOS J?lTl"TRING MODFTfi DNF: YEARS PRIOR TO FAILUSE;.
It was thought not only to present the trends of
variables that entered the best discriminant model but
also the trends of the variables in discriminant model
one year prior to failure. The reason for this was that
the model was the best in stage one of the ana1,ysis.
ope fully this will help to understand the reason why its
classification accuracy declined in predicting the failed
companies overtime and as well as in the validation
sample, despite its overall performance on the sample
being better than the discriminant model two year prior
to failure. These two models used in total, twelve unique
variables from the original set of twenty two entering
the discriminant function one and two years prior to
failure. This section graphically presents five years
trends for each of these along with discussion of their
significance. Tables 6.12 and 6.13 contain the numerical
value of these variables for each year prior to failure.
The magnitude, too high or too low, of some ratios
are indicative of 'various types- of problems. However,
caution should be exercised as ranges for many ratios
vary between and within industries. Also, trends
resented here are based on averages, and might obscure large variations.

The plot of net income to total assets (R2PR)
appears in Figure 6 . 4 . This ratio is a measure of
~rofitability and may be regarded as a measure of long-
tern viability of the company, that is of its viability
both to generate the funds required to support its
continuation and expansion and its attractiveness to
~otential lenders and providers of new capital.
~xamination of Figure 6 . 4 shows clearly that the failed
companies had a sharp decrease in this ratio between the
third and second years before failure and between the
second and first year which indicate their inability to . continue in business, while for the nonfailed companies
this ratio was more stable during the same time period.
The plot of net income to net worth (R3PR) appears
in Figure 6 . 5 . This ratio is a fundamental test of true
profitability. It measures the return applicable to
shareholders after the deduction of interest payments to
creditors. The graph indicates that the failed companies
had a large decrease in this ratio especially from third
years to first year prior to failure, which means they
were suffering from big losses on one hand, and
decreasing equity on the other hand (see Table 6 . 5 ) , while the nonfailed companies had increasing values of
this ratio through the fifth year to first year.

MEANS OF SELECTED FINANCIAL RATIOS FOR FAILED COMPANIES
YEARS PRIOR TO FAILURE
1 2 3 4 5 FINANCIAL RATIOS
R2 PR
R3 PR
R4 PR
R5PR
R6GE
R7 GE
RlOTR
RllTR
R12TR
R14TR
R2 OLQ
R2 lLQ

MEANS OF SELECTED FINANCIAL RATIOS FOR NONFAILED COMPANIES
YEARS PRIOR TO FAILURE
FINANCIAL RATIOS
R6GE 43.112 42.898 41.832 41.326 41.847
R7 GE 169.919 191.874 380.858 264.858 237.926
RlOTR 343.790 358.147 378.036 382.764 402.605
RllTR 154.401 159.773 156.954 154.046 155.809
R12TR 738.852 756.554 752.735 696.716 737.233
R14TR 18.500 19.641 18.646 19.939 20.447
R2 OLQ 38.275 37.921 39.840 38.522 37.420
R21LQ 29.327 28.471 29.638 29.933 29.968
.........................................................

FIGURE 6.4 PLOT OF MEAN NET INCOME TO TOTAL ASSETS
RATIO *I00 FOR F & NF COMPANIES
2 . 3 4 YEARS PRIOR TO FAILURE
LEGEND: -0.- FAILED' --'<--' NONFAILED
F FAILED NF' NONFAILED

FIGURE 6.5 PLOT OF MEAN NET INCOME TO NET WORTH
RATIO *I00 FOR F & NF COMPANIES
2 , 3 4 YEARS PRIOR TO FAILURE
LEGEND: TYPE
-*- FAILED NONFAILED
F FAILED NF NONFAILED

Figure 6.6 portrays the earnings before interest and
taxes to total assets ratio (R4PR). This ratio measures
the return on total assets before interest payment on
debt and tax payments. As a rule, the higher this ratio
the better utilisation of the assets. For the failed
companies, this ratio decreased as the time of failure
approached (except for the fourth year) and it was
negative two years and one year prior to failure.
~enerally speaking as earnings continue to decline, the
ability to obtain financing also declines and thus
accelerates the demise of a company.
Figure 6.7 presents the trend between net income to
total liabilities (RSPR). This ratio does not differ from
the other profitability ratios discussed above which all
indicate a large and sharp decrease for the failed
companies as the time of 'failure approached, and even
become negative particularly from the third year to final
year before failure, while nonfailed companies maintained
a relatively constant and higher ratio through the five
years prior to failure. However, this is a clear
indication that the profitability dimension, which is the .
net result of a large number of policies and decisions,
gives some insight into the effectiveness of a company's
management.
-

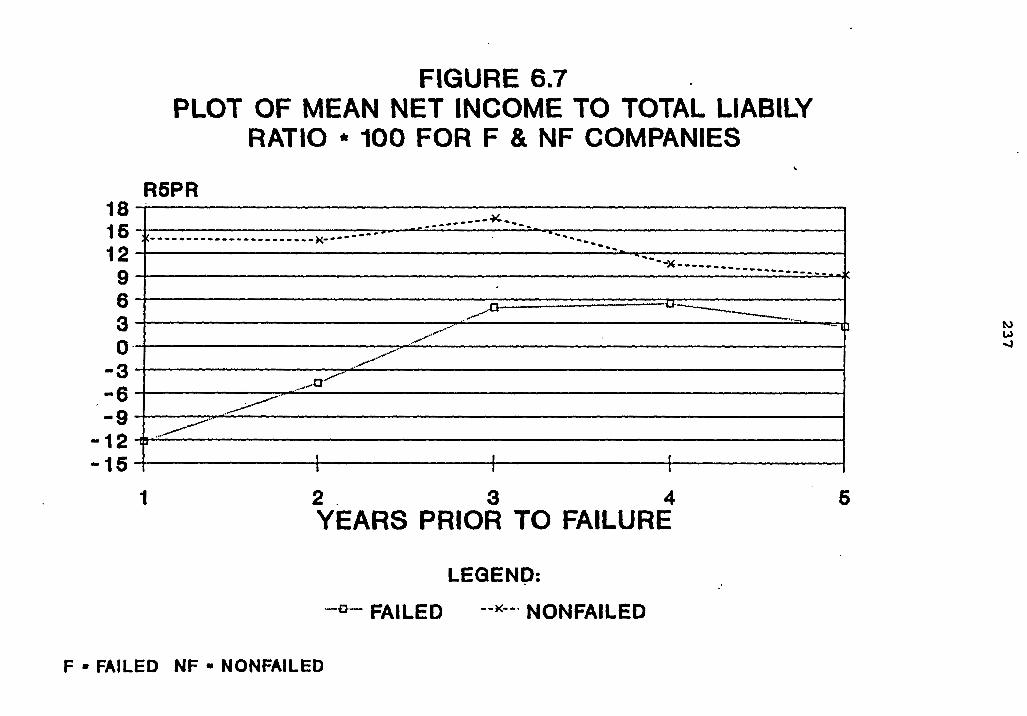
FIGURE 6.7 PLOT OF MEAN NET INCOME TO TOTAL LlABlLY
RATIO * 100 FOR F & NF COMPANIES
2 . 3 4 5 YEARS PRIOR TO FAILURE
LEGIEND:
-a- FAILED --+ NONFAILED
F - FAILED NF - NONFAILED

The trend between total liabilities to total assets
(R6GE) is plotted in Figure 6.8. However total assets
being based on book values are vulnerable to the effects
of inflation. This ratio, generally called the, debt ratio
which measures the percentage of total funds that have
been provided by creditors.
creditors generally prefer moderate debt ratios, since
the lower the ratio the greater the cushion against
creditors' losses in the event of liquidation. Private
companies are generally likely to be more highly geared
than public companies which had the option available to
raise more equity on the Stock Exchange. Private
companies also tend to be more risk averse since they
are generally funded by a few people. In circumstances
that the owners'stake in their companies is large
relative ' to the fund provided by creditors, their
speculating activity may either yield a high return on
assets or alternatively can result in a substantial loss
to themselves and at the same time small losses to the
creditors. For large companies, which have large number
of share holder, losses or gains to individual
shareholders are expected to have a less effect in terms
of the impact on each one. Beaver (1966) found this ratio
to be the third best predictor of failure. In his study
the mean of this ratio increased sharply five years prior
'to failure for the failed companies, whereas for the
nonfailed it remained stable.

FIGURE 6.8 PLOT OF MEAN TOTAL LIABILITIES TO TOTAL ASSETS RATIO * 100 FOR F & NF COMPANIES
2 3 4 YEARS PRIOR TO FAILURE
LEGEND:
FAILED - - + + ( - - a NONFAILED
F - FAILED NF - NONFAILED

In this study however the situation is the same
regarding the nonfailed companies which maintained a
relatively constant and smaller ratio than the failed
companies five years prior to failure, while for the
failed companies a substantial increase in this ratio
occurred between the third and second years prior to
failure, and between the second and final year before
failure. The trend of this ratio supports the fact, that
the failed companies obtained more funds through long-
term financing than through the equity markets, (see Table
6.5). Another point worth mentioning is that the mean of
this ratio in Beaver's study for nonfailed companies one
year prior to failure was around 0.37 as compared to 0.79
for failed companies. Whereas in this study it was 0.43
for the nonfailed companies and 0,69 for failed companies
during the same period.
The relationship between net worth to total
liabilities (R7GE) is plotted in Figure 6.9. Generally
speaking the higher this ratio the more solvent is the
company . For example, if the net worth of a company is flOOO and its total liabilities f500 , that means it
could experience a two-thirds decline in asset value
before insolvency, while the same company with £250 in
net worth will be insolvent if its assets decline only
one-third in value. This ratio is a measure of financial
gearing or in U.S.A. leverage.
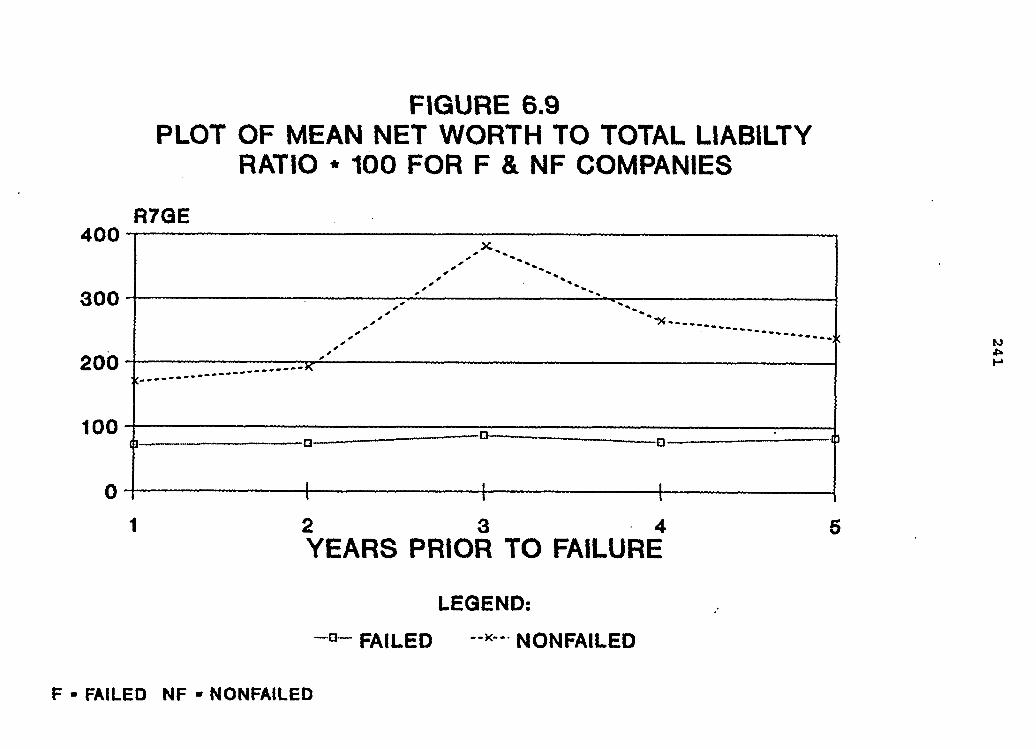
FIGURE 6.9 PLOT OF MEAN NET WORTH TO TOTAL LlABlLTY
RATIO * 100 FOR F & NF COMPANIES
2 3 . 4 YEARS PRIOR TO FAILURE
LEGEND: -.m- FAILED --'C--- NONFAILED
F - FAILED NF NONFAILED

The graph illustrates the percentage of the total assets
that are financed. The nonfailed companies had a higher
ratio through five years prior to failure, while the
failed companies had a lower ratio during the same time
which indicate they are more heavily geared than the
nonfailed companies.
The graph of sales to net worth (RlOTR), a capital
turnover and activity ratio is presented in figure 6.10.
his ratio indicates the activity of the investment in a
business. The level of this ratio varies significantly
depending on the nature of the industry. For example a
heavy engineering industry will have a lower ratio than a
service industry because it would need substantial
capital investment. However, a large increase in this
ratio may indicate an increased volume of business but
the company may be operating on a thin margin of invested
capital and over usage of credit available, and the
company may not realise it is overtrading.
his can be seen to be more the situation for failed
companies by examining Figure 6.10 and Table 6.5. It is
clear from Figure 6.10 that this ratio for failed
companies five years prior to failure was nearly at -the
same level as for nonfailed companies, then it goes up in
the forth years before failure to become very close to
the s&ne level of nonfailed companies by the third years
before failure.
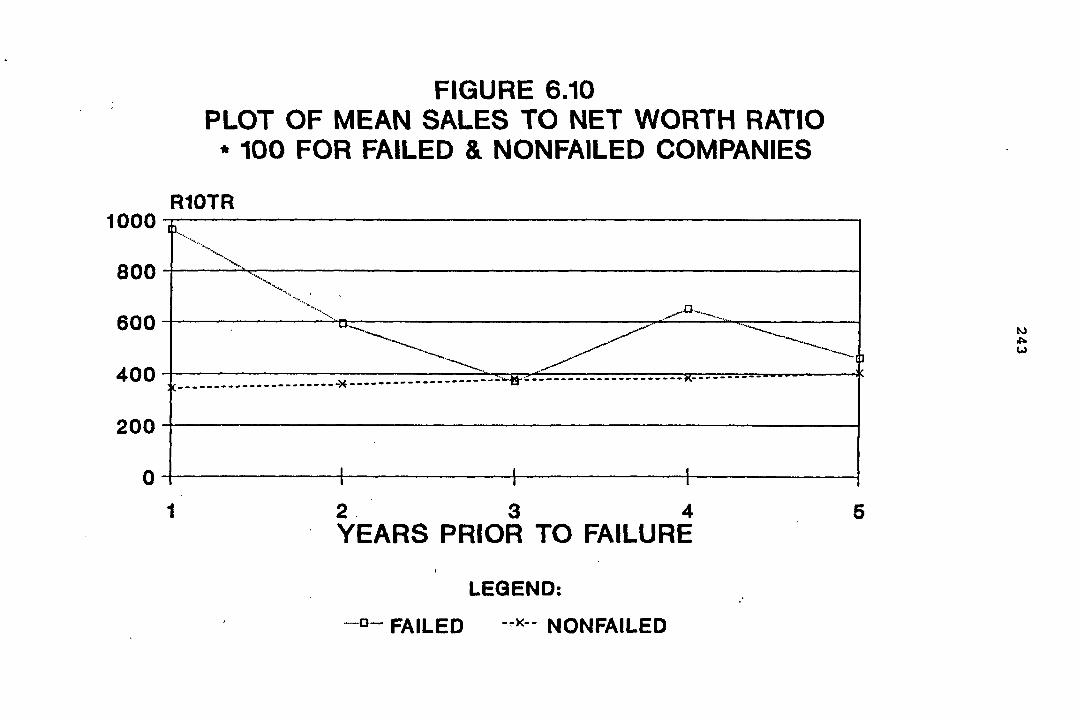
FIGURE 6.10 PLOT OF MEAN SALES TO NET WORTH RATIO
* 100 FOR FAILED & NONFAILED COMPANIES
YEARS PRIOR TO FAILURE
-- FAILED --'<-- NONFAILED

A sharp increase in this ratio appears between the
third and second years, and between the second and final
year prior to failure, while this ratio for nonfailed
companies remained nearly stable through the same period.
The sales to total assets ratios (R11TR) is a
measure of the activity of the assets and the efficient
of the cowany to generate revenue from its assets;
Figure 6-11. A higher ratio indicates more efficiency.
~uring the five years prior to failure, the failed
companies had a lower percentage of sales generated from
their assets base, except for the forth years before
failure, which suggest inefficient use of the assets.
The plot of sales to fixed assets (R12TR) is
presented in Figure 6.12. Again it can be seen that
nonfailed companies maintained a higher percentage and
were relatively constant during the five years prior to
failure, while failed companies had a lower percentage
through the same period. Caution however, should be
taken when interpreting this ratio, as fixed assets
being based normally on historic cost and- sales on the
current year's selling price, so when compared may be
distorted. Further-, the fixed assets figures of companies
are affected in different way by changing pr.ices,
including the frequency. of purchase and revaluations to
current figures. For example land and buildings may be
revalued for balance sheet purposes.

FIGURE 6.11 PLOT OF MEAN SALES TO TOTAL ASSETS
RATIO '* 100 FOR F & NF COMPANIES
2 . 3 4 YEARS PRIOR TO FAILURE
LEGEND:
--o- FAILED ' --*--- NONFAILED
F FAILED NF = NONFAILED
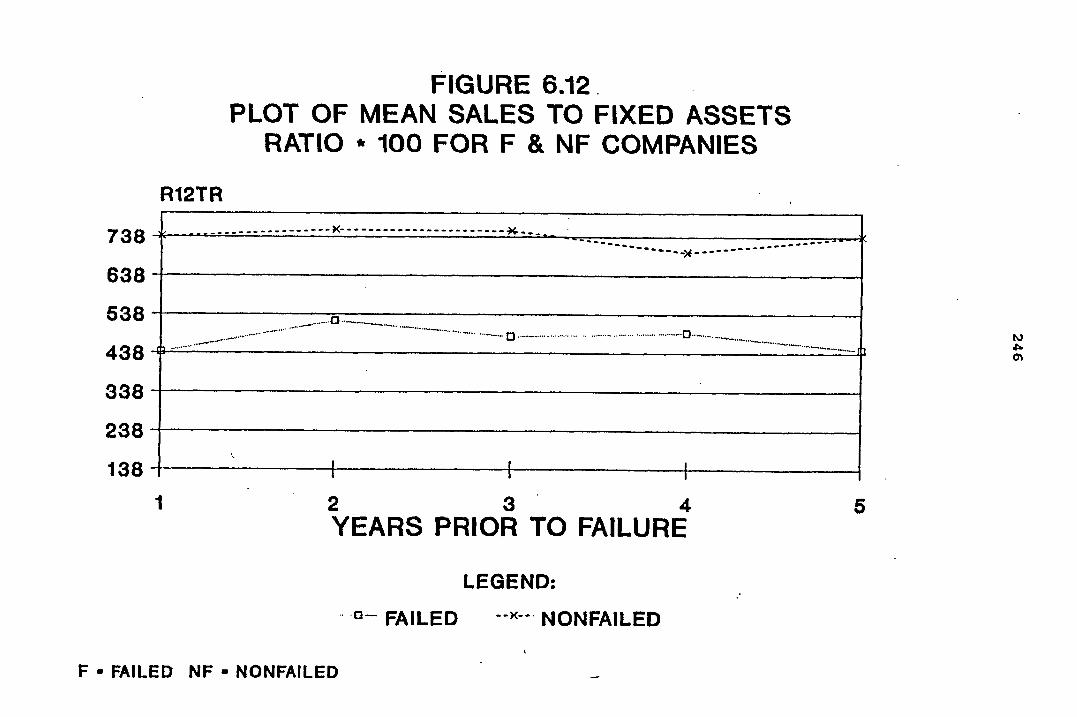
FIGURE 6.12. PLOT OF MEAN SALES TO FIXED ASSETS
RATIO * 100 FOR F & NF COMPANIES
I 2 3 4 YEARS PRIOR TO FAILURE
LEGEND:
- 'O- FAILED --)<--. NONFAILED
F FAILED NF - NONFAILED

Figure 6.13 is a plot of the relationship of the
changes in the stock .(inventory) to sales ratios (R14TR).
à his ratio is one measure of efficiency in employing
inventory. While inventory is quite sensitive to changes
in business activity. Inventory which is not in balance
with business activity can create increased costs,
production disruptions, ... etc. The graph indicates that the failed companies had a large increase in ' the
percentage of inventory carried relative to net sales
between the third and second years prior to failure.
Then, between the second and final year before failure,
the failed companies reduced inventory relative to sales.
whereas for the nonfailed companies, this ratio seems to
be stable through the five years before failure. In
addition to unbalanced inventory with business activity
, the inventory comprise stocks of raw materials,
purchased components, work in progress and finished
.goods. AS such this ratio is expected to vary
significantly between industries. An above average level
for the industry concerned means that too much inventory
is being held and is not -normally earning an adequate
return. However, if replacement cost is rising fast
useful gains may be earned in holding inventory.
furthemore it may be an advantage due to tax reasons if
a high inventory figure in the balance sheet produces
inventow relief.
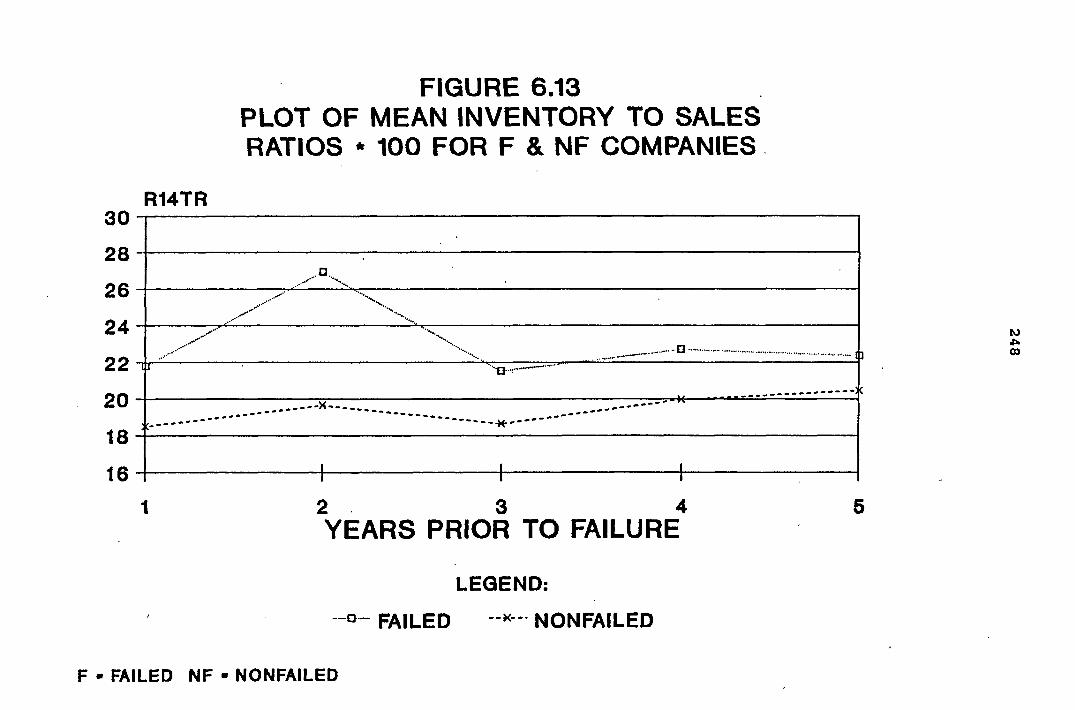
FIGURE 6.13 PLOT OF MEAN INVENTORY TO SALES RATIOS * 100 FOR F (L NF COMPANIES.
2 . 3 4 YEARS PRIOR TO FAILURE
LEGEND: , --a,-- FAILED --X-<-" NONFAILED
F - FAILED NF - NONFAILED

The quick assets to total assets ratio R20LQ, is a
measure of liquidity position of the company. A plot of
this ratio is presented in Figure 6.14. The quick assets
are -the items of current assets excluding the stock and
work in progress, which potentially can be converted into
cash. The higher the ratio, the higher the liquidity
position of the company, and the greater the ability of a
company to meet its short-term financial ob1igations"when
and as they fall due. However, examining Figure 6.14
clearly indicates, that nonfailed companies maintained a
higher percentage of quick assets relative to total
assets through five years prior to failure, while failed
companies had a lower percentage.of quick assets relative
to total assets during the same period, and moreover a
large decrease in this ratio is quite clear between the
forth year. and final year prior to failure which support
the weakness position of liquidity of the failed
companies.
A plot of working capital to total assets ratio,
R ~ ~ L Q , is presented in ~igure 6.15. his -ratio is a
measure of the net liquid assets of the company relative
to the total assets. Working capital is the surplus of
the current assets which can be realised in the short
run, over and above those needed to meet short-term
claims on the company.

FIGURE 6.14 PLOT OF MEAN QUICK ASSETS TO TOTAL ASSET
RATIO * 100' FOR F & NF COMPANIES
2 - . 3 ' 4 YEARS PRIOR TO FAILURE
LEGEND:
-.-O-.- FAILED --)C--- NONFAILED
F - FAILED NF - NONFAILED

FIGURE 6.15 PLOT OF MEAN WORKING CAPITAL TO TOTAL ASSETS RATIO * 100 FOR F IL NF COMPANIES
2 . 3 4 YEARS PRIOR TO FAILURE
LEGEND: -- FAILED --)<--' NONFAILED
F - FAILED NF NONFAILED

Ordinarily, a company suffering from operating
losses will have shrinking current assets in relation to
total assets, and this is really the situation for the
failed companies when the examination of profitability
ratios ; Figure .6.4 to 6.6 ; was discussed earlier in
this section. As a rule, the higher this ratio the better
the ability of. the company to meet its current
obligations as and when they fall due. For the failed
companies, this ratio decreased as the time of failure
approached and was negative one year prior to failure,
while the nonfailed companies maintained a relatively
constant ratio. This ratio .was found to be the best
indicator differentiating between failed and nonfailed
companies Smith (1930), Smith and Winakor (1945) and
by ~erwin (19421, in their univariate studies, whereas
Altman found this ratio to be the most valuable among the
three liquidity ratios evaluated in his study in 1968.
his section is concerned with testing the
effectiveness of model DFY2 in identifying failed
that have not been used in the construction of
the model. It should be recalled that the main reason for
constructing the discriminant model is to help to
identify failing companies as soon as possible in order
to take appropriate action to reverse the failure process
before it could be too late.

As this is the case, therefore the trend in
companies' z-scores would be useful in predicting the
future z-scores. However, it is worth mentioning that a
company might not have a negative z-score and therefore
not have a financial profile of a failed company, but
when examining its 2-score trends, a negative z-score
could be expected next year, which indicates action
should be taken in advance to prevent the impending
failure.
The method of presenting the z-scores is to compute
the z-scores of failed companies for which published
accountancy data is readily available and to plot these
Z-scores against time. However the literature on z-scores
generally does not present an analysis of the
effectiveness of the discriminant models in identifying
failing companies whose published accounting data was not
used in their construction. Watts (1983) has criticised
~affler and Tisshaw (1977) for not having any ex-post
test. In response to 'this criticism Taf f ler (1983)
reexamined the performance of companies that had negative
z-scores in 1975. He found that about 50% of these
companies have since effectively failed. That means they
have gone into receivership, have received emergency
support from government, a bank or elsewhere , or have
been acquired by another company to avoid receivership or
have been closed. 33% of the companies at risk in his
1976 sample still had an at risk profile in 1983. Only
32% managed to recover, Betts (1984) .
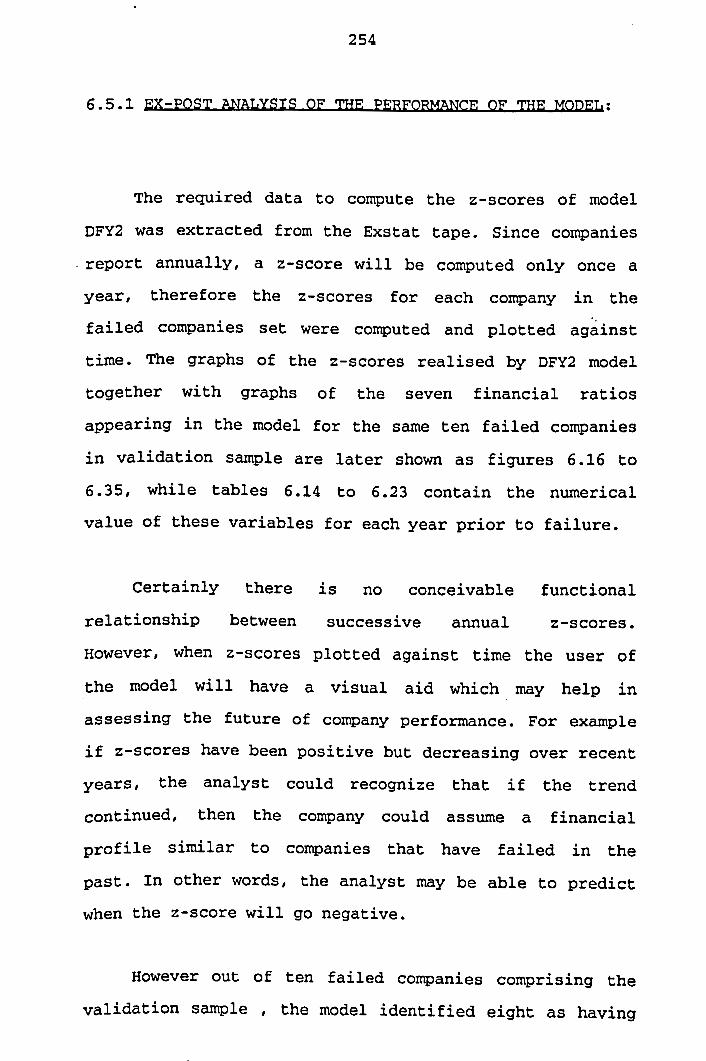
The required data to compute the z-scores of model
DFY~ was extracted from the Exstat tape. Since companies
report annually, a z-score will be computed only once a
year, therefore the z-scores for each company in the
failed companies set were computed and plotted against
time. The graphs of the z-scores realised by DFY2 model
together with graphs of the seven financial ratios
appearing in the model for the same ten failed companies
in validation sample are later shown as figures 6.16 to
6.35, while tables 6.14 to 6.23 contain the numerical
value of these variables for each year prior to failure.
Certainly there is no conceivable functional
relationship between successive annual z-scores . However, when z-scores plotted against time the user of
the model will have a visual aid which may help in
assessing the future of company performance. For example
if z-scores have been positive but decreasing over recent
years, the analyst could recognize that if the trend
continued, then the company could assume a financial
profile similar to companies that have failed in the
past. In other words, the analyst may be able to predict
when the z-score will go negative.
However out of ten failed companies comprising the
validation sample , the model identified eight as having

failed company financial profiles before receivers were
appointed. That is correctly identify 80% of the failed
companies. The two companies that were not identified were: -. . - - - -- L
~ifecare ~nternational figure 6 . 3 0 which failed to report
for 18 months before a receiver was appointed and Nova
Jersey Knit company figure 6 . 3 2 which failed to report .
for 33 months before a receiver was appointed.
So in both cases at least the last years accounting
data were missing. However, it should be noted that both
companies would have been identified if their z-score
trend given by the model continued ; see figure 6 . 3 0 and
6 . 3 2 . Therefore the ~erformance of DFY2 is mite identifyi-Eg:
-
remarkable in - - -_ companies in danger of failure.
6 . 5 . 2 2lF PERF-CE OF U N I V ~ E -1s IN
To compare the effectiveness of z-score models in
assessing the financial position of companies over the
univariate financial ratios analysis, a plot of seven
financial ratios comprising the discriminant model for
each failed company in the validation sample was carried .
out for the same period of time.
~xamining these graphs reveals that some of these
might be useful for identify failed companies. For
instance, the profitability ratio R3PR appear to be a
good indicator in which nine out of the ten companies

have this ratio., declining immediately before failure.
However the'question which arises here is at which value
or level of this ratio would the company be considered or
classified as a failed company. 'AS this ratio measures
the profitability dimension , the obvious level to choose
is that R3PR to be negative. Eight out of ten companies
have declining and negative value for 'R3PR ratio . ,
immediately before failure .
The next ratio to examine as a good indicator is the
gearing ratio R6GE. Eight out of ten companies have a
continuous increase in this ratio for at least three
years prior to failure. The remaining two companies are
if ecare International, figure 6.31 and table' 6.21, which
portray a sharp increase from the fifth year to the
fourth year prior to failure then a slight increase in
the following three years and finally a sharp decline
from the second year (75.90) to the first year (48.28)
prior to failure, which could be due to creative
'accounting as a possible reason for unexpected final
movement. The other remaining company was Nova Jersey
Knit, figure 6.33 and table 6.22. The gearing ratio R6GE
for this company seems to be more or less equal during
the same period of time.
However, the problem to' determine the level for
which a company could classify as a failed company- still
arises. Therefore the continuous increasing of three

years prior to failure might be an indication that the
company is in trouble.
~xamining the graphs of sales to net worth ratio
(RlOTR) as a useful indicator of companies' performance
reveals, that nine out of ten failed companies have this
ratio increasing one year prior to failure, which is
quite an unexpected result for the failed companies
despite a number of failed companies in the validation
sample having this ratio declining . as far as from the
forth to the second .year prior to failure. See figures
(6.17, 6-23, 6-29. 6.35).
However, a detailed discussion of the significance
and magnitude of this ratio was carried out in section
6.4. It was reported that it is quite difficult to
determine the threshold value of this ratio because it
varies significantly depending on the nature of the
industry. Furthermore, this ratio excessive, the
company is often referred to as a poor credit risk due to
insufficient capital to support sales (Altman, 1968).
Therefore -this ratio alone is not a good indicator of
company failure.
The next financial ratio to appear in the
discriminant model is the sales to total assets R11TR.
his ratio seems to behave in the same way as ratio RlOTR
and that means it cannot be used as a possible useful
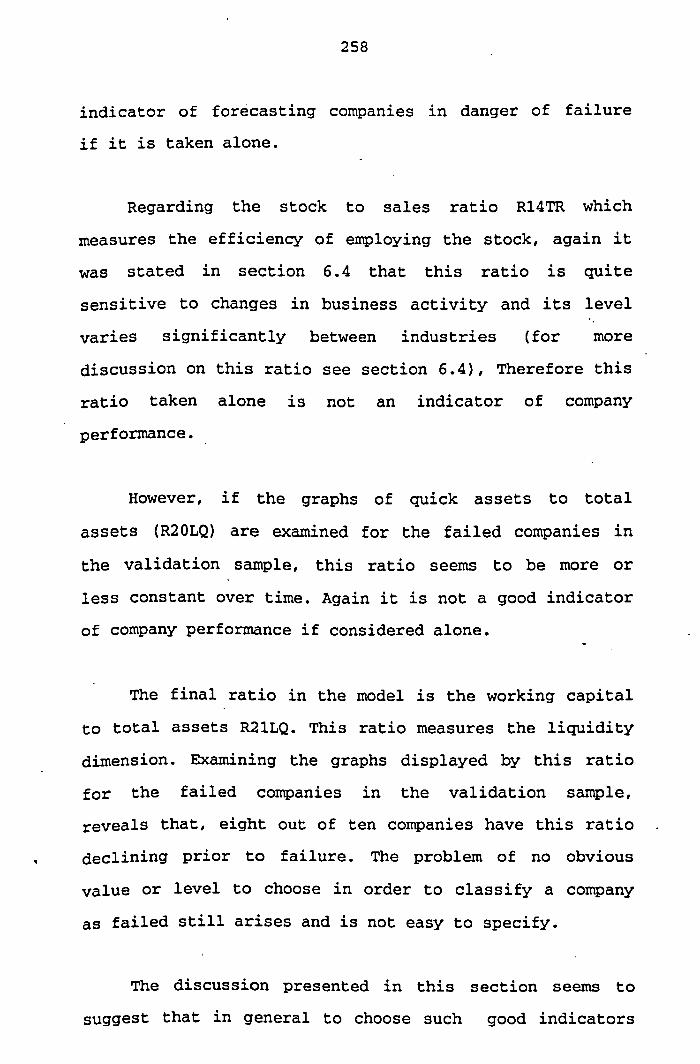
indicator of forecasting companies in danger of failure
if it is taken alone.
~egarding the stock to sales ratio R14TR which
measures the efficiency of employing the stock, again it
was stated in section 6.4 that this ratio is quite
sensitive to changes in business activity and its level
varies significantly between industries (for more
discussion on this ratio see section 6.4), Therefore this
ratio taken alone not indicator company
performance.
However, if the graphs of quick assets to total
assets (R2OLQ) are examined for the failed companies in
the validation sample, this ratio seems to be more or
less constant over time . Again is not a good indicator
of company performance if considered alone.
The final ratio in the model is the working capital
to total assets R21LQ. This ratio measures the liquidity
dimension. Examining the graphs displayed by this ratio
for the failed companies in the validation sample,
reveals that, eight out of ten companies have this ratio .
declining prior to failure. The problem of no obvious
value or level to choose in order to classify a company
as failed still arises and is not easy to specify.
The discussion presented in this section seems to
suggest that in general to choose such good indicators

in order, to classify companies in danger of failure , it
might be helpful to have a negative profitability ratio
R3PR, together with a continuous increase in gearing
ratios R6GE and declining liquidity ratio R2lLQ.
here fore if the conditions described above are used,
then only six out of ten companies in the validation
sample would be classified as failed.
In conclusion univariate ratio analysis is useful in
that it indicates some measures of company performance,
but setting critical levels' for single ratios to spot
companies in financially risk does not appear to be a
satisfactory approach and hence it is a poor substitute
for the multivariate approach in identifying companies in
danger of failure.
The only means by which comparison. between the
performance of the univariate and multivariate approach
appears appropriate here is on the grounds of getting a
much earlier warning . It can be seen when examining the graphs represented by univariate financial ratios
appearing in the model for -the failed companies in
validation sample, that, changes in these ratios are
quite noticeable prior to failure. Meanwhile, the major
shifts of ratios occur one or two years prior to failure.
However, by comparing these movements with changes in the
Z-score trends, it is obvious that the trends in the z-
scores give early warning of companies in financial
trouble better than the trends obtained by any one or all
financial ratios in the DFY2 model. This was the case for
~ifecare International Company figure 6 . 3 0 , and Nova
Jersey Knit figure 6 . 3 2 .
Both companies did not have failed company z-scores
for the data which was available, but an examination of
trend in their z-scores illustrated by DFY2 will indicate
that, their predicted z-score would have been negative in
the year prior to failure. Whereas, examining the trends
of financial ratios for both companies does not reveal
that it is possible to be recognizable as having failed
companies profile.

FIGURE 6.16 ZSCORES FOR COMPANY
ELLENROAD MILL
1978 , 1979 1980 1981 1982 YEARS PRIOR TO FAILURE
-
Receiver Appointed 20th January 1984
...' P -
- -
- - -
,."" 1, *....
....- '.\ 0 7 ,..... .+..- '+ ', a"' '.,
'.. %\
'.%,
't..
'.,, . ', a- .....\--.
----..-. -0.24 -- -j-~.- '4. - 0 g 9---.,
-'--.. -.. a .,,,---.-.....- "... ' "- a,. -1.26 -1.18 *.%,\*

VALUE OF RELEVANT FINANCIAL RATIOS *lo0 FOR
COMPANY ELLENROAD MILL
YEARS
RATIOS 1977 1978 1979 1980 1981 1982 1983
__---- ...........................................................
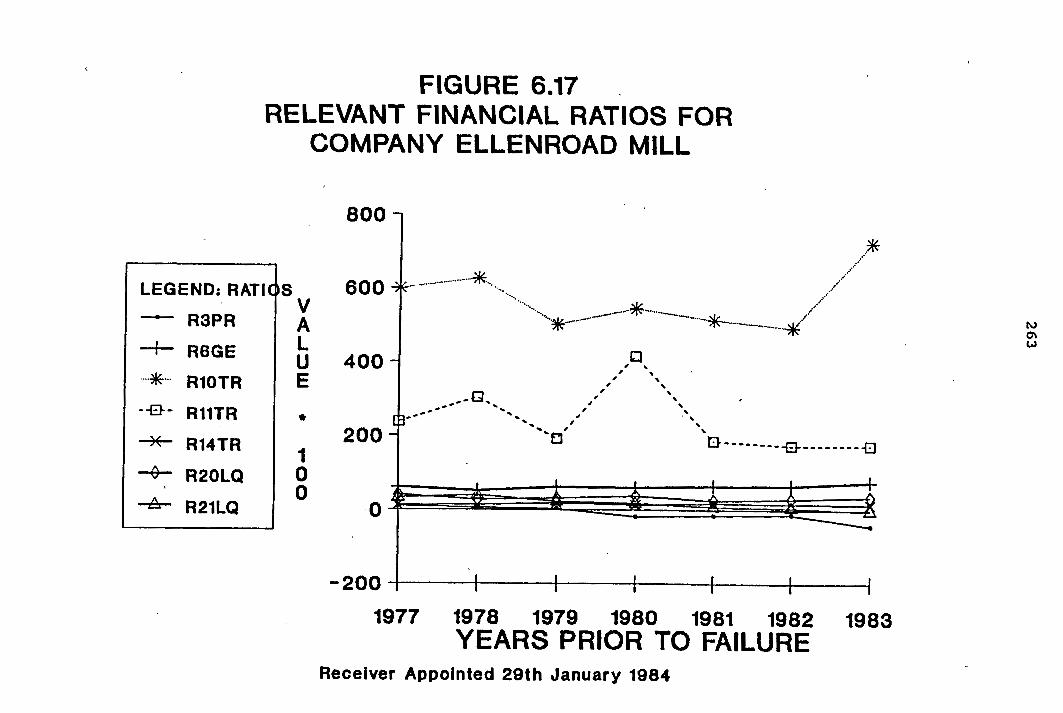
FIGURE 6.17 RELEVANT FINANCIAL RATIOS FOR
COMPANY ELLENROAD MILL
1977 1978 1979 1980 1981 1982 1983 YEARS PRIOR TO FAILURE
1Ac
Receiver Appointed 29th January 1984
f
LEGEND: RATIOS --C R3PR
+ R6GE .... * .... RIOTR
'D- R11TR - R14TR
-6- R2OLQ
R21LQ
..>
' 8 - \
8
D--------+------- Q

FIGURE 6.18 2-SCORES FOR COMPANY
METAMEC JENTIQUE
1978 1979 1980 1981 1982 YEARS PRIOR TO FAILURE
Receiver Appointed 30th June 1984

mBLuLl5
VALUE OF RELEVANT FINANCIAL RATIOS "100 FOR
COMPANY METAMEC JENTIQUE
................................................................... ' YEARS
..........................................................
RATIOS 1977 1978 1979 1980 1981 1982 1983
------ ..........................................................

FIGURE 6.19 RELEVANT FINANCIAL RATIOS FOR
COMPANY METAMEC JENTIQUE
LEGEND: RAT1 S L R3PR
f 250
YEARS PRIOR TO FAILURE Receiver Appointed 30th June 1084

FIGURE 6.20 ZSCORES FOR COMPANY
SPENCER (GEORGE)
1978 1979 1980 1981 1982 YEARS PRIOR TO FAILURE
Receiver Appointed 4th May 1084

VALUE OF RELEVANT FINANCIAL RATIOS *lo0 FOR
COMPANY SPENCER (GEORGE)
................................................................... YEARS
.......................................................... 1978 RATIOS 1977 1979 1980 1981 1982 1983

FIGURE 6.21 RELEVANT FINANCIAL RATIOS FOR
COMPANY SPENCER (GEORGE)
LEGEND: RAT1 -C R3PR
1977 1978 1979 1980 1981 1982 1983 YEARS PRIOR TO FAILURE
Receiver Appointed 4th May 1984

FIGURE 6.22 ZSCORES FOR COMPANY
W'RIBBONS HOLDINGS
1977 1978 1979 1980 1981 1982 ' 1983 YEARS PRIOR TO FAILURE
Went into voluntary liquidation 23rd May 1986.

VALUE OF RELEVANT FINANCIAL RATIOS *I00 FOR
COMPANY W'RIBBONS HOLDINGS
................................................................... YEARS
..........................................................

FIGURE 6.23 RELEVANT FINANCIAL RATIOS FOR COMPANY W'RIBBONS HOLDINGS .
1977 1978' 1979 1980 1981 '1982 1983 YEARS PRIOR TO FAILURE
--
LEGEND: RATlCbS -c- R3PR
-f- R6GE
- RlOTR
-0- R l l T R ' - R14TR
-9- R20LQ
-e, R21LQ ----.. -- -
Went into voluntary liquldatlon 23rd May 1986.
600
v 500 A
400 U E
300
200 1
O 100 0
0

FIGURE 6.24 ZSCORES FOR COMPANY
ALLEN(W.G.) & SONS (TIPTON)
1979 1980 1981 1982 1983 YEARS PRIOR TO FAILURE
Receiver Appointed 30th June 1986

VALUE OF RELEVANT FINANCIAL RATIOS *I00 FOR
COMPANY ALLEN (W .G. ) & SONS (TIPTON)
YEARS
RATIOS 1978 1979 1980 1981 1982 1983 1984

FIGURE 6.25 ,'
RELEVANT FINANCIAL RATIOS FOR COMPANY ALLEN (W.G.) B SONS
............. " ,.,__...--. ; '* ..."
.... ....... ....
LEGEND: RATlClS ....... ..... ....... - R ~ P R v 140 ..-..-
+ R6GE a%-_ ----a U E 100 - - R i R
1978 1979 1980 1981 1982 1983 1984 YEARS PRIOR- TO FAILURE
Receiver Appointed 30th June 1086

FIGURE 6.26 ZSCORES FOR COMPANY
COCKSEDGE ( HOLDINGS )
1978 1979 1980 1981 1982 1983 1984 YEARS PRIOR TO FAILURE Receiver Appointed 28th February 1986

VALUE OF RELEVANT FINANCIAL RATIOS *I00 FOR
COMPANY COCKSEDGE (HOLDINGS)
................................................................... YEARS
........................................................... RATIOS 1978 1979 1980 1981 1982 1983 1984
_----- ...........................................................

FIGURE 6.27 RELEVANT FINANCIAL RATIOS FOR
COMPANY COCKSEDGE ( HOLDINGS)
1978 1979 1980 1981 1982 1983 ,1984 YEARS PRIOR TO FAILURE
Receiver Appointed 28th February 1986

FIGURE 6.28 ZSCORES FOR COMPANY
HERMAN SMITH
- 1.5 - I -
0.5 - 0
Z -0.5 - - - 1 - S -1.5- C 0 -2 -
-2.5 - R E -3 - s -3.6 -
-4 - -4.6 -
- 5 - -6.5 -
-6 -
1.48 9..
"... 0.22 . -..... 0,".
.... f e../-." ----.. %.. ,..........-a.'"' --...... ~..#-.'.' a..-'--._
....... -0.56 -0.36 -0.51 --.-
-1.02
\ 3%
i '! i "1 '\ i j,
'1
\, \
j, I I I I I I
4 . 9 1978 1979 1980 1981 1982 1983 1984
YEARS PRIOR TO FAILURE Receiver Appointed 30th June 1986

VALUE OF RELEVANT FINANCIAL RATIOS * l o 0 FOR
COMPANY HERMAN SMITH
YEARS
RATIOS 1978 1979

FIGURE 6.29 .
RELEVANT FINANCIAL RATIOS FOR COMPANY HERMAN SMITH
LEGEND: RAT1 ---C R3PR
I -Q- RllTR I
1978 1979 1980 1981 1982 1983 1984 YEARS PRIOR TO FAILURE
Receiver Appointed 30th June 1986

FIGURE 6.30 ZSCORES FOR COMPANY LIFECARE INTERNATIONAL
1978 1979 1980 1981 1982 1983 1984 YEARS PRIOR TO FAILURE
Receiver Appointed 29th June 1986

VALUE OF RELEVANT FINANCIAL RATIOS "100 FOR
COMPANY LIFECARE INTERNATIONAL
................................................................... YEARS
..........................................................

FIGURE 6.31 RELEVANT FINANCIAL RATIOS FOR
COMPANY LIFECARE INTERNATIONAL
I LEGEND: RAT1 S (I" 800
1978 1979 1980 1981 1982. 1983 1984 YEARS PRIOR TO FAILURE
Receiver Appointed 29th June 1986

FIGURE 6.32 ZSCORES FOR COMPANY
NOVA (JERSEY) KNIT
1978 1979 1980 1981 1982 1983 1984 YEARS PRIOR TO FAILURE Receiver Appointed 3rd January 1887

VALUE OF RELEVANT FINANCIAL RATIOS *I00 FOR
COMPANY NOVA (JERSEY) KNIT
YEARS

FIGURE 6.33 RELEVANT FINANCIAL RATIOS FOR
COMPANY NOVA (JERSEY) KNIT
LEGEND: RATIOS 320 -C R3PR
R6GE
;'*.- R1OTR Q 0 \
-a- R11TR 4 8
0 0
8 8
0 0
8 8 * R14TR 8
\ 8
.+ RPOLQ 4 R21LQ
-
YEARS PRIOR TO FAILURE Receiver Appointed 3rd January 1987

FIGURE 6.34 ZSCORES FOR COMPANY
CASTLE ( G. B. )
YEARS PRIOR TO FAILURE Receiver Appointed 29th May 1886

VALUE OF RELEVANT FINANCIAL RATIOS *lo0 FOR
COMPANY CASTLE (G.B.) '
................................................................... YEARS

FIGURE 6.35 RELEVANT FINANCIAL RATIOS FOR
COMPANY CASTLE (G . B )
7 - - - YEARS PRIOR TO FAILURE
Receiver Appointed 29th May 1886

6.5.4 AN ANATlYsIs OF 'ME: P E R F ~ ~ c ~ OF DFY2 ON N o N F ~ ~
COMPANIES:
It was thought to examine the z-scores histories
together with the trends in financial ratios appearing in
the model DFY2 for a number of nonfailed companies in a
validation sample for a comparison purposes. Figures 6.36
to 6.55 show the Z-score histories created by '.DFY2
together with trends of the seven univariate financial
ratios entering DFY2 for ten nonfailed companies in the
validation sample.
It can be seen that for many cases it is easy to
detect changes in the z-scores correlated at the same
time with changes in many financial ratios entering the
DFY~. In particular, the profitability ratio R3PR, the
gearing ratio R6GE and the liquidity ratios R2OLQ and
R21LQ. In other words, for any year through the analysis
~eriod an increase in the .profitability ratio R3PR,
together with a decrease in the gearing ratio R6GE,
coupled with an increase in the liquidity ratios (either
RZOLQ or R21LQ) will reflect an increase in the z-score
for the same time and ---. vice'versa - . It should be noted also that the movement of capital turnover and activity
RlOTR, RIITR, are more or less in the same
direction of Z-scores.

This is well illustrated by Breedon & Cloud Hill
Lime Works company; Figure 6.36, 6.37 and table 6.24. It
can be seen that the increase in the z-score from 1980 to
1981, and 1982 to 1983 and from 1985 to 1986, is well
reflected by an increase in profitability ratio net
income to net worth R3PR, together with a decrease in the
gearing ratio total liabilities to total assets R6GE,
coupled with an increase of both capital turnover and
activity ratios, sales to net worth RlOTR, sales to total
assets RllTR, and finally an increase in the liquidity
ratios quick assets to total as'sets R2OLQ, and working
capital to total assets R21LQ, for the same period of
time. At the same time the decline in the z-scores from
1981 to 1982, and between 1984 to 1985 is also well
reflected in the financial ratios specified above, but
with the opposite sign for each individual ratio and for
the same years.
A similar phenomenon is again displayed by Bruntons
(~usselburgh) Company (Figures 6.38, 6.39 and table
6.251, and by Elbief Company (Figures 6.40, 6.41 and
table 6-26). The changes in z-scores from 1979 to 1983 I
are very well correlated by changes in the individual
ratios entering DFY2. However, later it could be
identified as a high performing company despite the
model not being designed to identify high performing
companies.
The changes the z-scores reflected changes
the individual ratios in DFY2, particularly the 0
profitability ratio R3PR is interesting in the case of
~riendly Hotels (Figures 6.42, 6.43 and table 6.27) . This company has a sharp decline in its z-score from (1.21) in
1980 to a (-0.08) in 1981, then a continuous decline in
years 1982, and 1983, followed by an increase in z-score
in years 1984 and 1985. Examining the individual ratios
movement, reveal that the profitability ratio, net income
to net worth R3PR is almost parallel to z-scores which
display a negative R3PR value in years 1981, 1982, 1983
together with an increase in the gearing ratio, total
liabilities to total assets and a decrease in both
capital turnover and activity ratios, sales to net worth
R~OTR, and sales to total assets, R11TR. It should be
noted that also the liquidity ratios, quick assets to
total assets, R20LQ and working capital to total assets,
RZlLQ, are moving in the same direction during the same
period of time.
A similar phenomenon is illustrated by Harvey and
Thompson (Figures 6.46, 6.47 and table 6.29). This
company has a continuous decline in z-scores in 1979 to
1980 then a negative z-score for the following two years,
1981, 1982, followed by a sharp increase from (-0.79) in
1982 to (0.75) in 1983, then an increase in 1984,
forlowed by a decrease in -1985. Examining Figure 6.47,
.reveals that the profitability ratio R3PR is always
almost in parallel to z-Scores for the same years. It

should be noted that the increase in gearing ratio R6GE,
together with the changes in sales to total assets RllTR
and working capital to total assets R21LQ are moving in
the same direction as, the profitability ratio R3PR, from
1979 to 1985 which reflected very well the changes in z-
scores.
In general the analysis of z-score histdries
produced in this section reflected very well the changes
in many individual ratios in DFY2 through the same period
of time for any of those companies that have been
discussed, or the remaining which display more or less
similar trends in z-scores reflected by changes in the
individual ratios entering the DFY2 model.
It is clear that univariate analysis is us'eful in
measuring company performance, but these analyses are not
as good as the z-score analysis. In other words the
analysis of company performance using univariate
financial ratio, will produce a reasonable indication of
company's financial position and that can be obtained
only when companies must not be in real danger of
failure. AS we saw in preceding section, the univariate
ratio analysis for the failed companies revealed that
this kind of analysis is not helpful in identifying
companies in danger of failure.

The z-score method should be used when the aim is to
help to predict company failure as soon as possible in
order to take appropriate action to reverse the failure
process before it is too late.

FIGURE 6.36 ZSCORES FOR COMPANY
BREEDON & CLOUD HILL LIME WORKS
1980 1981 1982 1983 1984 1986 1986 YEAR

VALUE OF RELEVANT FINANCIAL RATIOS *I00 FOR
COMPANY BREEDON & CLOUD HILL LIME WORKS
YEARS
RATIOS 1980 1981 1982 1983 1984 1985 1986

FIGURE 6.37 RELEVANT FINANCIAL RATIOS FOR
COMPANY BREEDON & CLOUD HILL LIME WORKS
LEGEND: RATICIS ---C R3PR
R6GE
.-%..- R1OTR
--- R11TR - R14TR
R20LQ
R21LQ
1980 1981 1982 1983 1984 1985 1986 YEAR

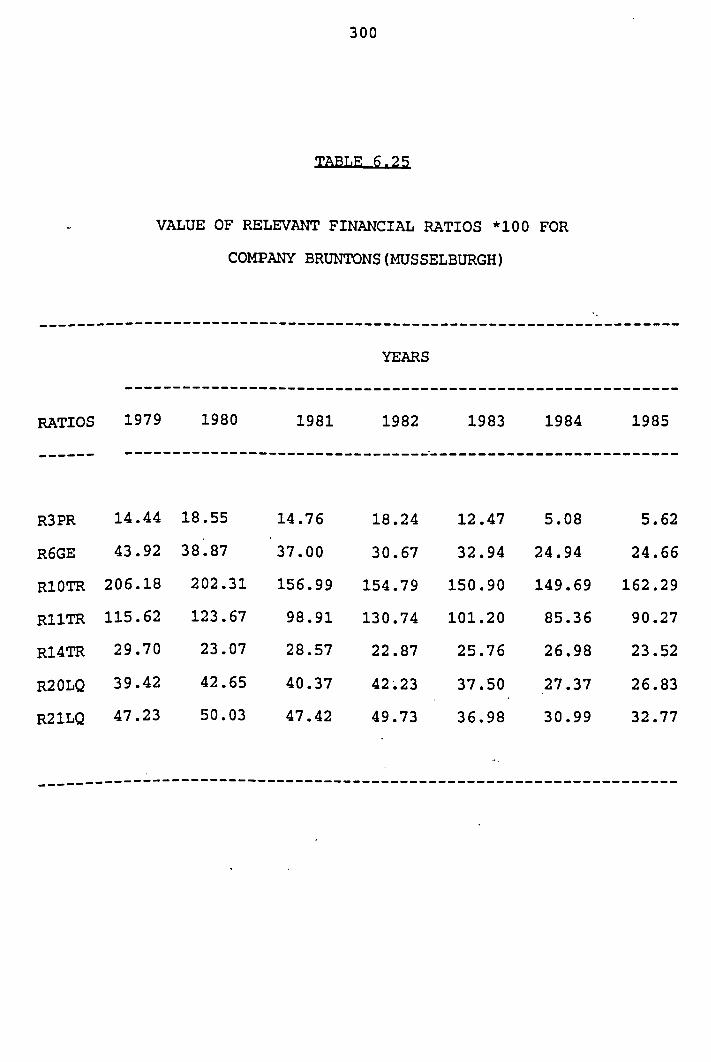
VALUE OF RELEVANT FINANCIAL RATIOS *I00 FOR
COMPANY BRUNTONS(MUSSELBURGH)
YEARS

FIGURE 6.39 RELEVANT FINANCIAL RATIOS FOR
COMPANY BRUNTONS (MUSSELBURGH)
1 LEGEND: RAT1 --C R3PR
1979 1980 1981 1982 1983 1984 1985 YEAR
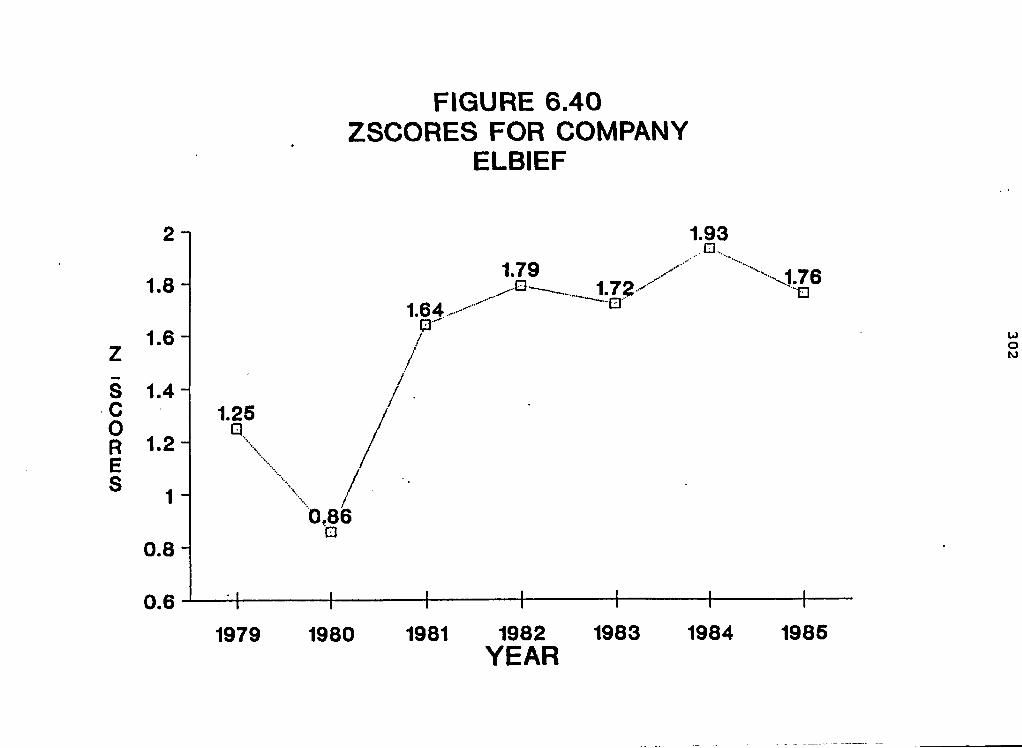
FIGURE 6.40 ZSCORES FOR COMPANY
ELBIEF
YEAR

VALUE OF RELEVANT FINANCIAL RATIOS *I00 FOR
COMPANY ELBIEF .
................................................................... YEARS
.......................................................... RATIOS 1979 1980 1981 1982 1983 1984 1985
------ - ---------a------------,,,------------------------------------

LEGEND: RATICI --.c- R3PR
R6GE
...%... RlOTR
-e- R11TR - R14TR
* R20LQ
4 R21LQ .
I
FIGURE 6.41 RELEVANT FINANCIAL RATIOS FOR
COMPANY ELBIEF
1979 1980 1981 1982 1983 1984 1986 YEAR

FIGURE 6.42 ZSCORES FOR COMPANY
FRIENDLY HOTELS
t .w
', '\, '%* ,/ '
1
0 ...- .- ................ ....- a".. "... ... -.. / f '
I I -0,08 -0.1 .. ---.. ..-.- H *,a / I I w
I 1
YEAR

VALUE OF RELEVANT FINANCIAL RATIOS *lo0 FOR
COMPANY FRIENDLY HOTELS
................................................................... YEARS
.......................................................... RATIOS 1979 1980 1981 1982 1983 1984 1985
------ ..........................................................

\
FIGURE 6.43 RELEVANT FINANCIAL RATIOS FOR
COMPANY FRIENDLY HOTELS
LEGEND: RAT14 L R3PR
R6GE
..* R1OTR
-a- R11TR
++ R14TR
4 R20LQ
* R21LQ
YEAR
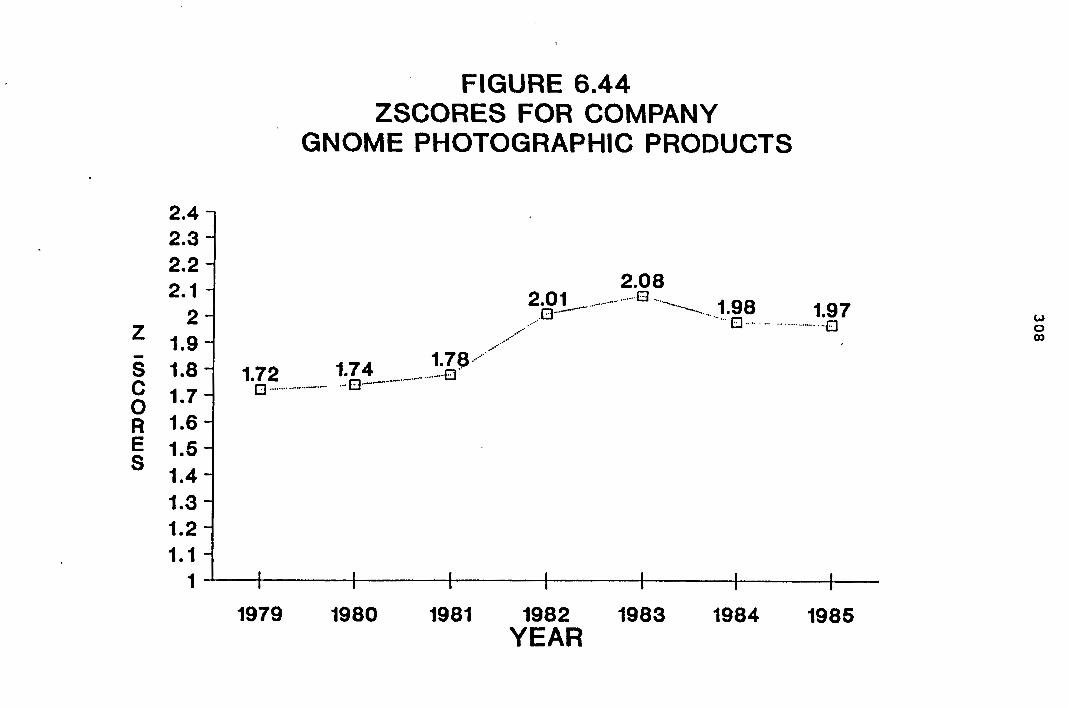
FIGURE 6.44 ZSCORES FOR COMPANY
GNOME PHOTOGRAPHIC PRODUCTS
1979 1980 1981 1982 1983 1984 1985 YEAR

VALUE OF RELEVANT FINANCIAL RATIOS *I00 FOR
COMPANY GNOME PHOTOGRAPHIC PRODUCTS
YEARS

FIGURE 6.45 RELEVANT FINANCIAL RATIOS FOR
COMPANY GNOME PHOTOGRAPHIC PRODUCTS
LEGEND: RATI( -C R3PR
RGGE
.-.*-. R1OTR
-a- R11TR - R14TR
-$- R20LQ - R21LQ
1979 1980 1981 1982 1983 1984 1985 YEAR

FIGURE 6.46 ZSCORES FOR COMPANY
HARVEY & THOMPSON
1979 1980 1981 1982 1983 1984 1985 YEAR
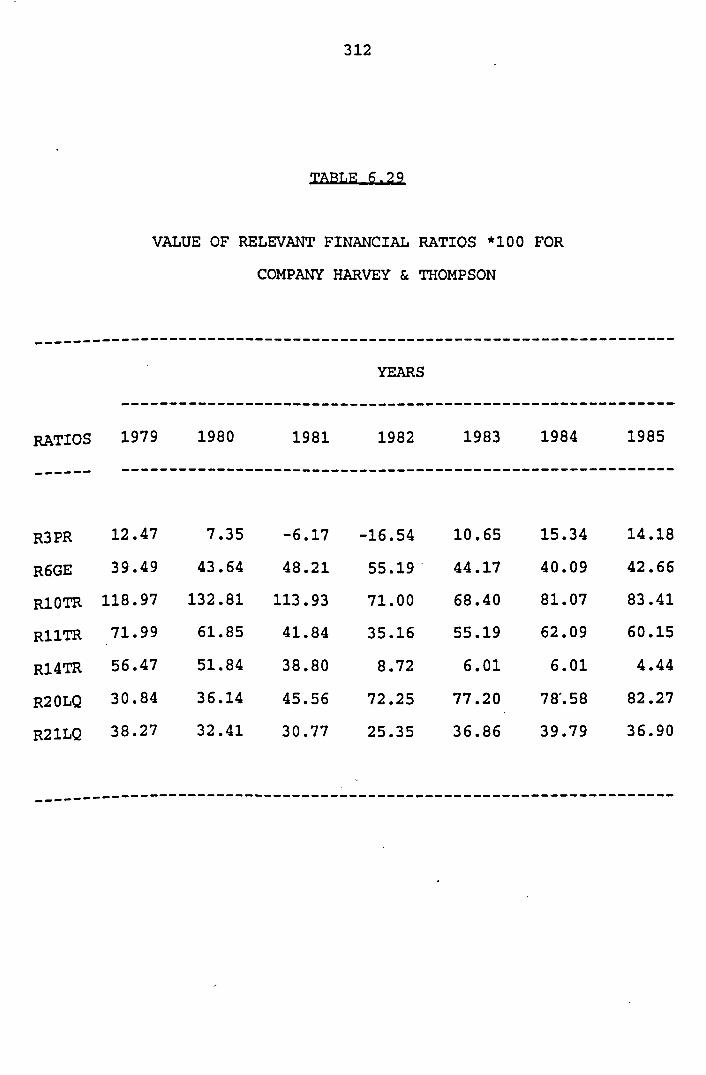
VALUE OF RELEVANT FINANCIAL RATIOS *lo0 FOR
COMPANY HARVEY & THOMPSON
YEARS

FIGURE 6.47 RELEVANT FINANCIAL RATIOS FOR COMPANY HARVEY & THOMPSON
LEGEND: RAT1 S I"
1979 1980 1981 1982 1983 1984 1985 YEAR

FIGURE 6.48 ZSCORES FOR COMPANY
HIGH GOSFORTH PARK
1979 1980 1981 1982 1983 1984 1985 YEAR

VALUE OF RELEVANT FINANCIAL RATIOS *I00 FOR
COMPANY HIGH GOSFORTH PARK
YEARS

FIGURE 6.49 RELEVANT FINANCIAL RATIOS FOR COMPANY HIGH GOSFORTH PARK
1979 1980 1981 1982 1983 1984 1985 YEAR

FIGURE 6.50 ZSCORES FOR COMPANY RANSOM(WILL1AM) & SON
1979 1980 1981 1982 1983 . 1984 1985 YEAR

VALUE OF RELEVANT FINANCIAL RATIOS *I00 FOR
COMPANY RANSOM (WILLIAM)& SON
................................................................... YEARS
.......................................................... RATIOS 1979 1980 1981 1982 1983 1984 1985
- w e - - - .........................................................

FIGURE 6.51 RELEVANT FINANCIAL RATIOS FOR
COMPANY RANSOM (WILLIAM) & SON
LEGEND: RAT1 --C R3PR
R6GE
...*..- R1OTR
-=- R11TR - R14TR
4 R20LQ
R21LQ
1979 1980 1981 1982 1983 1984 1985 YEAR

FIGURE 6.52 ZSCORES FOR COMPANY
RlVOLl CINEMAS
YEAR

VALUE OF RELEVANT FINANCIAL RATIOS *I00 FOR
COMPANY RIVOLI CINEMAS
YEARS
RATIOS 1979 1980 1981 1982 1983 1984 1985
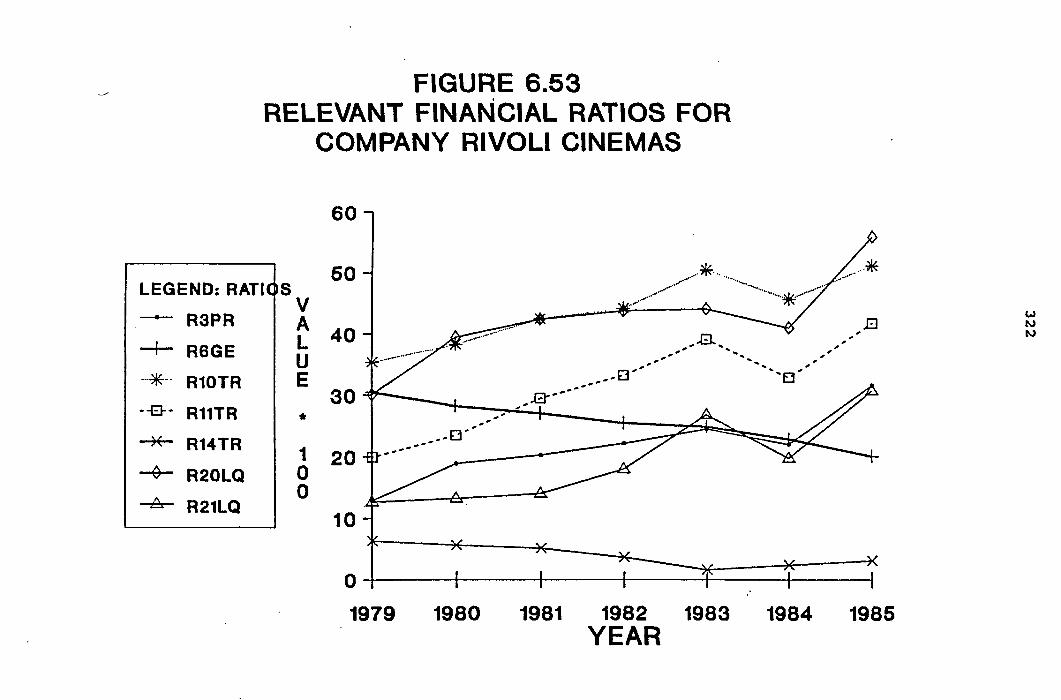
FIGURE 6.53 RELEVANT FINANCIAL RATIOS FOR
COMPANY RlVOLl CINEMAS
LEGEND: RATIC) -C R3PR
+ RGGE
R1OTR
-a- R11TR
++ R14TR
-$- RPOLQ
4 R21LQ A
1979 1980 1981 1982 1983 1984 1985 YEAR

. FIGURE 6.54 ZSCORES FOR COMPANY
WPP GROUP ,
1979 1980 1981 1982 1983 1984 1985 YEAR

TABLE 6 . 3 3
VALUE OF RELEVANT FINANCIAL RATIOS *I00 FOR
COMPANY WPP GROUP
YEARS
.......................................................... RATIOS 1979 1980 1981 1982 1983 1984 1985
------ ..........................................................
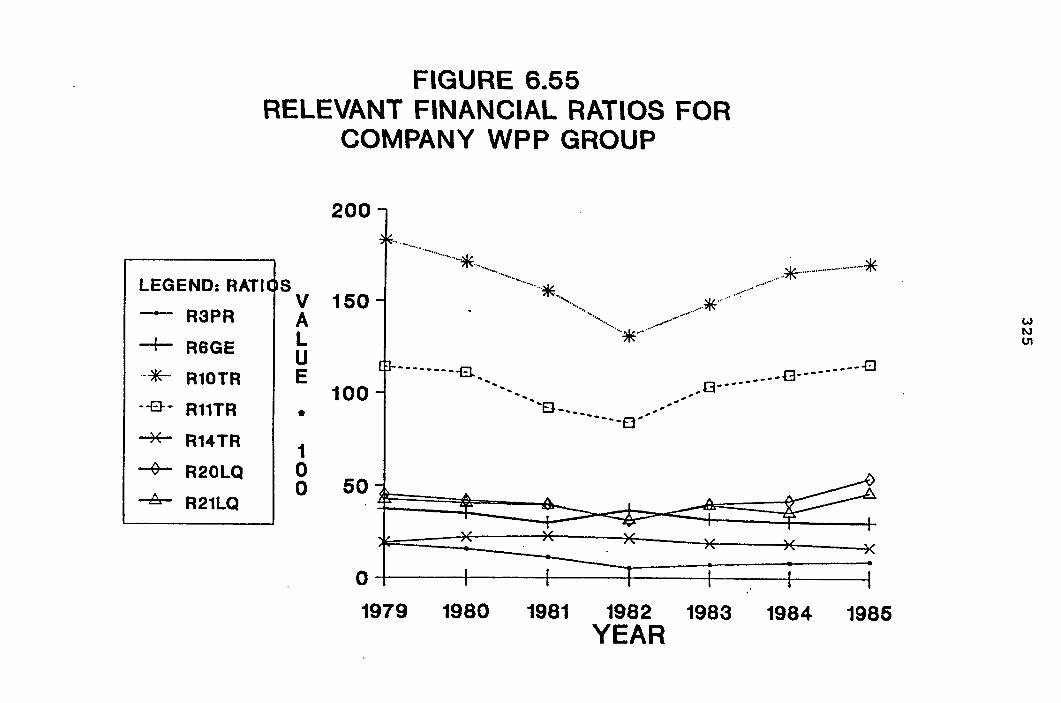
FIGURE 6.55 RELEVANT FINANCIAL RATIOS FOR
COMPANY WPP GROUP
LEGEND: RAT1 S - R3PR 1 , 150
1979 1980 1981 1982 1983 1984 1985 YEAR

his chapter contains a summary of the study,
conclusions and some recommendations for future research.
SUMMARY:
The underlying premise of this study was that there
exists a group of accounting and financial
characteristics of small-medium companies, which, when
identified and properly evaluated, are indicative of
nsuccessn or "failuren. As cited in chapter three, most
reported research studies have dealt with the development
of statistical models to predict failure of large
companies. Research suggests that these models are not
directly applicable to the small companies. of
The hortance-~small companies in an economy, the impact
of their failures, and the lack of failure research with
respect to this population, provided justification for
this study.
~iview of 'the relevant literature showed that ratio
can be an accurate and efficient method to
~ignify possible failure of a company. Contemporary
failure analysis reduced a large set of financial
variables to a' much smaller set of significant variables

through the employment of various statistical procedures.
However, all studies did not use the same types of
financial variables. Differences in the selection of
financial variables could be attributed to the different
time periods investigated and to the various industries
for which the data were collected.
Further, the predictive power of the statistical
models appears to be dependent upon the choice of
methodology utilized, as well as the type of companies,
time period of the data, and the specific ratios and
other financial indicators used. Table 3.1 presented a
summary of some selected references along with categories
of financial ratios used by the authors. The specific
ratios were presented in table 3.2.
\
This study was restricted to a sample of companies
selected from the Exstat tape provided & Extel Company . ".P
~imited. Selection of financial ratios used in the
analysis was based on four criteria:
1. Data availability permitting calculation of the
financial ratios. .
2 . heir ability to predict failure in previous studies.
3. heir popularity in the literature, and
4 . The development of a comprehensive set of ratios
representing traditional categories of ratio analysis,
such as capital turnover, profitability, gearing and
liquidity.

Multiple discriminant analysis was employed to
determine the "bestm discriminant function. nBesta was
determined according to classification ability of the
function and interpretation of the .variables. The
analysis was performed in three stages. In stage one five
discriminant functions were evaluated for each of five
years prior to failure/ whereas, in stage two the
performance of those functions was tested over time.
Finally stage three was concerned with a validation
technique. Selection of the final model was based on the
classification ability and interpretation of the
variables.
In view of the results presented within chapter'six,
examining the general characteristics of the failed and
nonfailed companies (section 6.2), it was concluded that:
1. Assets of failed companies were not utilised
efficiently since they maintained a higher percentage of
fixed assets than the nonfailed companies.
2. ~aiied companies rely on short and long term borrowing
as their major sources of finance, whereas the nonfailed
~ompanies maintained a higher percentage of equity
compared to the failed companies.
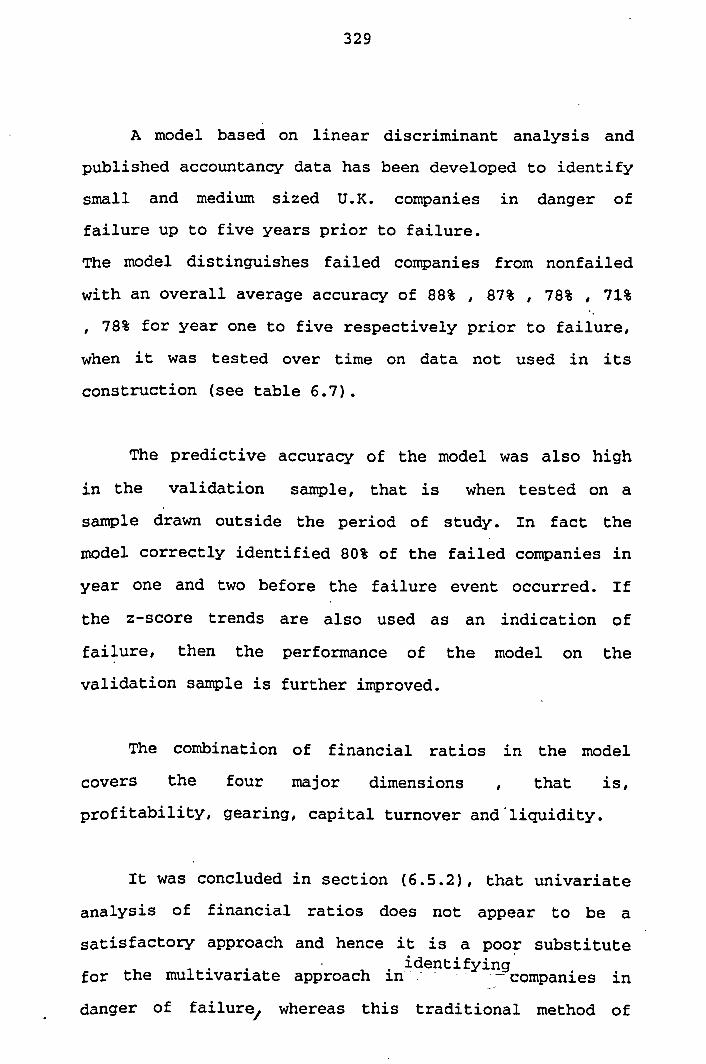
A model based on linear discriminant analysis and
published accountancy data has been developed to identify
small and medium sized U.K. companies in danger of
failure up to five years prior to failure.
The model distinguishes failed companies from nonf ailed
with an overall average accuracy of 88% , 87% , 78% , 71%
, 78% for year one to five respectively prior to failure, when it was tested over time on data not used in its
construction (see table 6.7).
The predictive accuracy of the model was also high
in the validation sample, that is when tested on a
sample drawn outside the period of study. In fact the
model correctly identified 80% of the failed-companies in
year one and two before the failure event occurred. If
the z-score trends are also used as an indication of
failure, then the performance of the model on the
validation sample is further improved.
The combination of financial ratios in the model
covers the four major dimensions , that is,
profitability, gearing, capital turnover and 'liquidity.
It was concluded in section (6.5.2), that univariate
of financial ratios does not appear to be a
satisfactory approach and hence it is a poor substitute identifying
for the multivariate approach in-. - - - - -, --companies in
danger of failure, whereas this traditional method of

analysis generated useful information about the
performance of the nonfailed companies.
Financial ratio analysis could be useful when a
model, capable of providing early warning signals of
impending failure, would allow a company to determine
financial problems which if left unchecked would lead to
failure in the near future. When a company can identify
problems which indicate failure and initiate corrective
actions, the credibility of the company will not be lost.
However, the model developed here with the
constituent ratios representing each dimension of a
company has shown to be a valid tool for predicting
companies' health up to five years in advance. With such
valid in£ ormation, lenders, investors and- credit
underwriters should be able to identify those companies
that are at risk of failure from the rest and a detailed
examination before agreeing to give any financial help
should be made.

7.3 mCow~ATIQNS FOR FIJFvI"HFR RESEARCH:
This study provided the researcher with several
recommendations for future research in the area of small
company failure analysis.,some are provided below: ___C-
1. ~eplication and extension to more recent data to allow
comparison over different time periods.
2. The impact of inflation on input data is worthy of
study, since certain ratios are expected to be affected
more than the rest, because of unadjusted historical cost
accounts.
3. The use of factor analysis to enhance variable
selection is recommended to avoid the problem of
information redundancy of financial ratios. It should be
noted that, this procedure ' has been employed in
predicting the failure of large companies.

332
Appendix A
Comgutttion of the Discriafnant Equat im
~ i s c r i 3 i n i X I t equation is defined a s
We a r e deal ing with two groups, Group 1 and Grzup 2 , s o
put t ing a small number representa t ive of t h e s o u p a t t he
end,
Zil = U X 1 ill + u2Xi21 + a * . + u X P i p l
represent the value of Z f o r the i M ind iv idua l i n each
group. .
. The mean of the value of Z i n each group is e ~ r e s s e d as
follows: n,
If we l e t
and i f

where u' = (uiu2 ... u ) P
.. We now def ine Zil =zil - Z1 - ---
then the varianca within each group w i l l become
where S1 = 1 . S [ sp:l . . . p p l
T3e sum of the VlZiance of each group may now be expressed a s
15 we l e t W = S 1 + S2 -

The d iscr iminant c r i t e r i o n i s expressed a s
TO determine t h e value of u which maximizes A , we take t h e
f irst d e r i v a t i v e of (10) wi th r e s p e c t t o u and s e t it equal
t o zero. *
aD a (ula) = whereas - = - au au
Hence from (11)
Assuraing t h a t t h e inverse of w e x i s t s ,
Since t h e m u l t i p l i e r 1 D w i l l n o t a f f e c t t h e p ropor t iona l i ty
aiong the elements of u, it w i l l be convenient t o s e t it
,qua1 t o one. Thus, we may s t a t e ,
NOW t h e values of ul t o up i n t h e d i s c r f m t n a t e equation (1)
is obtained.

We now have t o t e s t whether the di f ference i s s t a t i s t i c a l l y
s ign i f i cant . F-test can b e conducted with hypothesis;
Table A . l may be useful for the ca lculat ion of F-value.
Table A . 1
Sum of Degrees o f Mean source Squares Freedom Square F
. " ~ e t w e e n S s ~ = n x D~ Groups
Within Groups
--
(Lindeman 1 9 80)

APPENDIX B
Critical values of Da in the Kohgorov-Smirnov Test .

FINANCIAL RATIOS USED TO CONSTRUCT THE DISCRIMINANT MODELS
RlPR Net Income / Sale R2PR ~et'1ncome / Total Assets R3PR Net Income / Net Worth .
R4PR Earnings Before Interest And Tax / Total Assets RSPR Net Income / Total ~iabilities
R6GE Total Liabilities / Total Assets R7GE New Worth / Total Liabilities R8GE Net Worth / Total Assets R9GE Fixed Assets / Net Worth
R ~ O T R Sales / Net Wort ~ l l m Sales / Total Assets Rl2TR Sales / Fixed Assets R13TR Working Capital / Sales
R 1 4 m Inventory / Sales
Current Assets / Current Liabilities Quick Assets / Current Liabilities Cash / Total Assets Cash / Current ~iabilities Inventory / Current Assets Quick Assets / Total Assets Working Capital / Total Assets ,
Working Capital / Current Liabilities

THE TRANSFORMATIONS USED FOR THE FINANCIAL RATIOS
......................................................... FINANCIAL RATIOS TRANSFORMATION
NUMBER
RlPR
R2PR
R3PR
RQPR
RSPR
R6GE
R7GE
R8GE
R9GE
RlOTR
RllTR
Rl2TR
R13TR
Rl4TR
RlSLQ
R16LQ
R17LQ
Rl8LQ
R19LQ
R2OLQ
R2lLQ
RaaLQ
NONE
NONE
NONE NONE
NONE
NONE
SQR NONE
NONE
NONE NONE
LOG
NONE
NONE
LOG
LOG
NONE
NONE
NONE
NONE
NONE
SQR
LOG = Logarith SQR = Square root

TJOGY AND DFFINITION'OF THE CO-S OF THE
VARIARTIRS USRr) IN m S STUDY
Cash - : Cash and equivalent. : Cash plus other items that can be
easily turned into cash or sold /
consumed during the normal
operating cycle, that is (cash +
quoted investment + debtors +
inventories) .
Curren+~U&abil.iLiea : Total of all liabilities due within
a year from debt statement ( bank ,
loans and overdrafts + short term
borrowing + creditors + payables +
current taxation + proposed
dividend) . - Interest T- : This is the profit earned by
company before deduction of
interest and taxes.
: These are the assets of permanent
nature held for use in the
operation of 'a company ( Total net
property + net other fixed assets).

Sale
: Profit after deduction of taxes and
interest.
: This is same as shareholders fund
or equity which comprises
(preferred capital + ordinary
capital + share premium account +
reserves + government grants).
: These are the most near-cash items
of current assets ( the same items
of current assets excluding
inventory.
: The volume of the business
transacted in pounds for a specific
year.
- , . t : This is the sum of stocks of raw
materials, finished goods and work
in progress.
: These are fixed assets, intangible
assets, associated companies, trade
investments and current assets.
Tatal liabilities - : Short term and long term debt
( total assets - shareholders fund). - : Current assets minus current liabilities.

LIST OF FAILED COMPANIES
COMPANY NO. OF DATE OF TOTAL NAME YEARS LAST ASSETS
DATA REPORT AVAILABLE f ............................................................
1 BRITTAIN GROUP LTD 4 1975.06.28 7028473 .OO
2 HIGHLIGHT SPORTS 4 1975.05.19 6206500.00
4 MCNEILL GROUP 7 1977.12.31 9742000.00
5 SOUTHERN CONSTRUCTIONS(HLDGS) 8 1978.12.31 4752000.00
6 BURRELL & CO 9 1979.12.31 9997000.00
7 DOXFORD(M.L.)&CO.
8 DYKES (J. ) (HLDGS)
9 BLACKMAN & CONRAD
10 BRITISH ANZANI
11 FINDLAY HARDWARE GROUP
12 ' GARTONS PLC
13 GOLDMAN(H.)GROUP
14 NORVIC SECURITIES
15 WHITELEY(B.S.& W.)
16 YORKSHIRE FINE PLC
17 AUSTIN(F. ) (LEYTON)
18 BASTIAN INTERNATIONAL PLC
19 BERWICK TIMPO PLC
20 CAWDAW INDUSTRIAL HLDGS
cont d
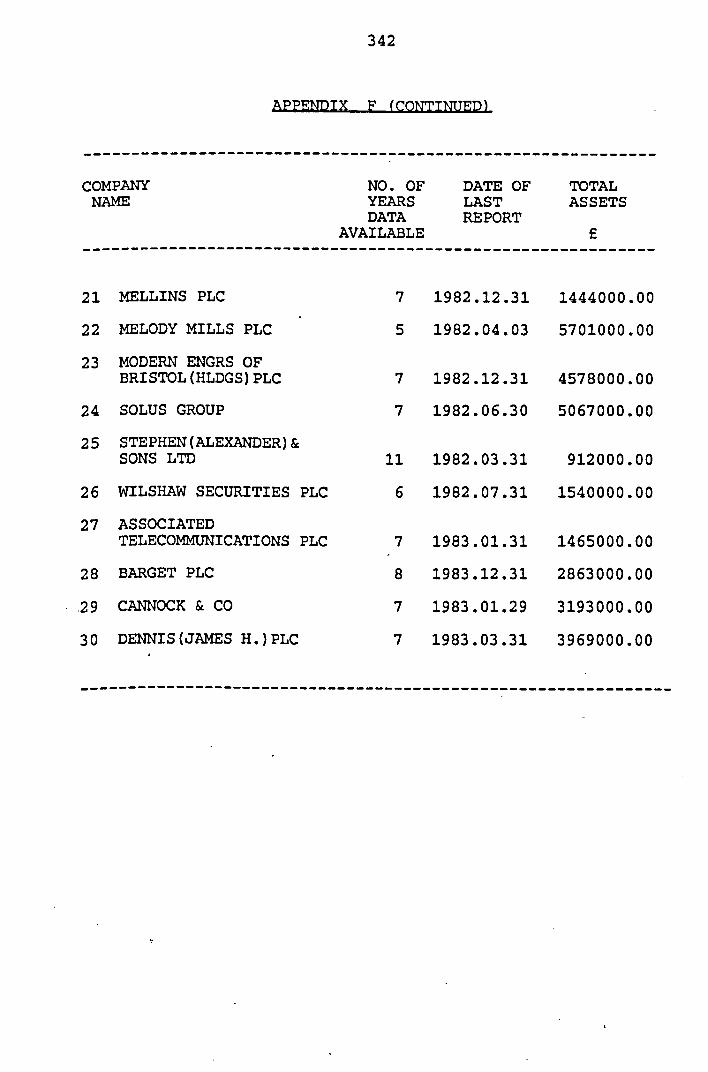
COMPANY NO. OF DATE OF TOTAL NAME YEARS LAST ASSETS
DATA REPORT AVAILABLE f ............................................................
MELLINS PLC
22 MELODY MILLS PLC 5 1982.04.03 5701000.00
23 MODERN ENGRS OF BRISTOL (HLDGS) PLC
24 SOLUS GROUP 7 1982.06.30 5067000.00
2 5 STEPHEN (ALEXANDER) & SONS LTD 11 1982.03.31 912000.00
26 WILSHAW SECURITIES PLC 6 1982.07.31 1540000 -00
27 ASSOCIATED TELECOMMUNICATIONS PLC 7 1983.01.31 1465000.00
28 BARGET PLC 8 1983.12.31 2863000.00
,29 CANNOCK & CO 7 1983.01.29 3193000.00
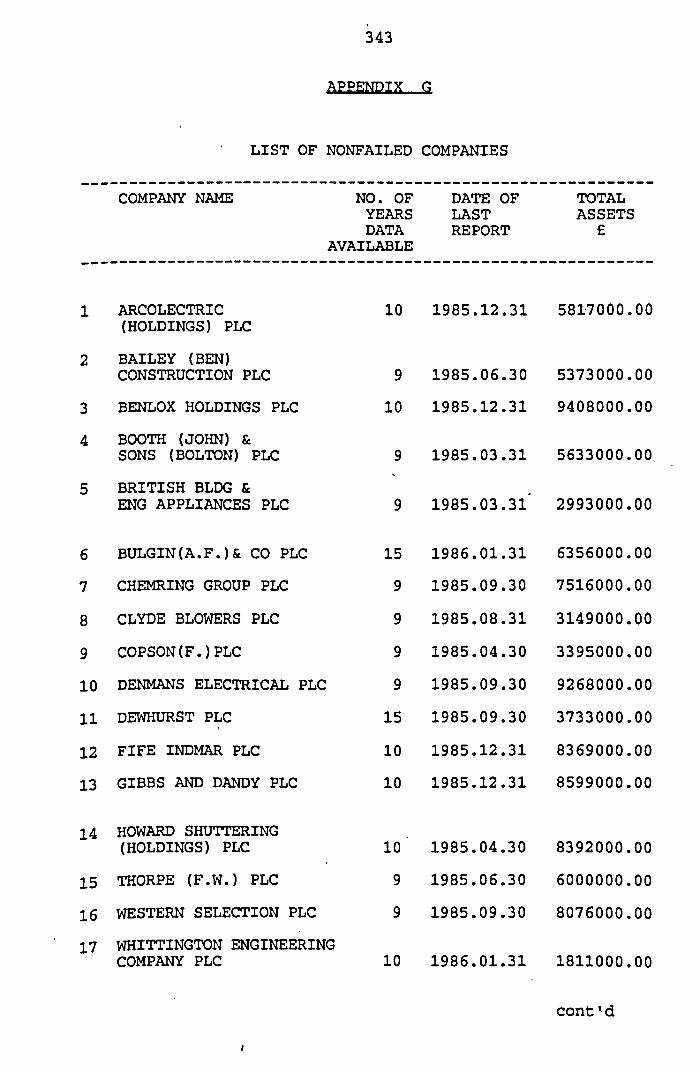
LIST OF NONFAILED COMPANIES
............................................................ COMPANY NAME NO. OF DATE OF TOTAL
YEARS LAST ASSETS DATA REPORT f
AVAILABLE ............................................................
1 ARCOLECTRIC (HOLDINGS) PLC
2 BAILEY (BEN) CONSTRUCTION PLC
3 BENLOX HOLDINGS PLC 10 1985.12.31 9408000.00
4 BOOTH (JOHN) & SONS (BOLTON) PLC
5 BRITISH BLDG & ENG APPLIANCES PLC 9 1985.03.31' 2993000.00
6 BULGIN(A.F.)&CO PLC 15 1986.01.31 6356000.00
7 CHEMRING GROUP PLC 9 1985.09.30 7516000.00
8 CLYDE BLOWERS PLC 9 1985.08.31 3149000.00
9 COPSON (F . ) PLC 9 1985.04.30 3395000.00
10 DENMANS ELECTRICAL PLC 9 1985.09.30 9268000.00
11 DEWHURST PLC 15 1985.09.30 3733000.00
12 FIFE INDMAR PLC 10 1985.12.31 8369000.00
13 GIBBS AND DANDY PLC 10 1985.12.31 8599000.00
14 HOWARD SHUTTERING (HOLDINGS) PLC 10 1985.04.30 8392000.00
15 THORPE (F.W.) PLC 9 1985.06.30 6000000.00
16 WESTERN SELECTION PLC 9 1985.09.30 8076000.00
17 WITTINGTON ENGINEERING COMPANY PLC 10 1986.01.31 1811000.00
cont '.d
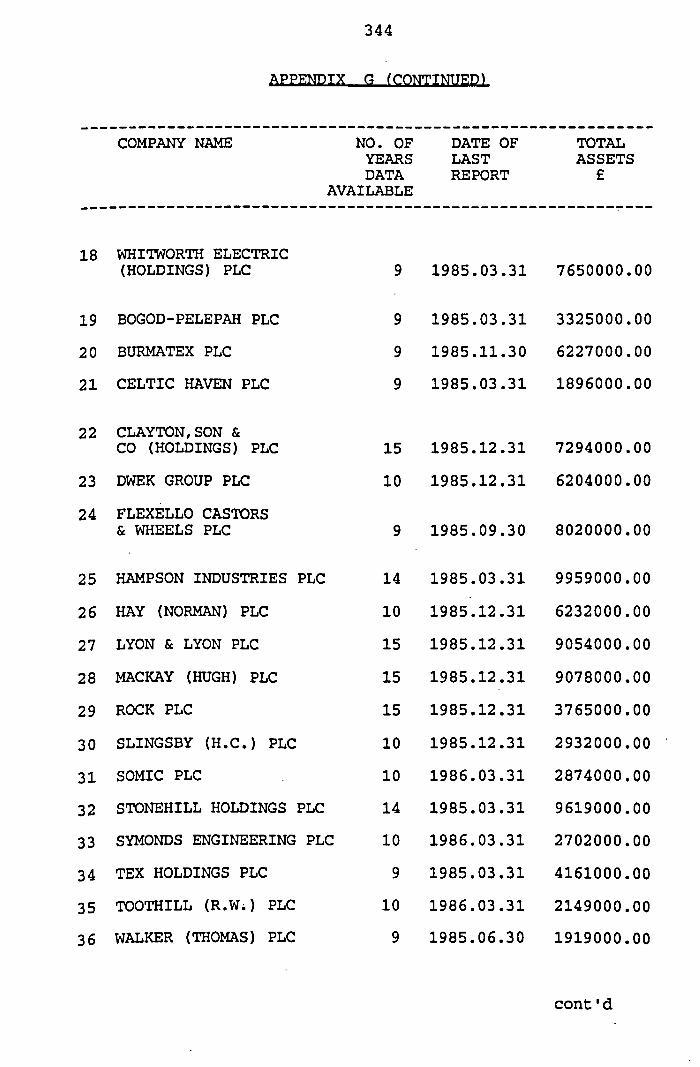
----
COMPANY NAME NO. OF DATE OF TOTAL YEARS LAST ASSETS DATA REPORT f
AVAILABLE ............................................................
18 WHITWORTH ELECTRIC (HOLDINGS) PLC
19 BOGOD-PELEPAH PLC
20 BURMATEX PLC
21 CELTIC HAVEN PLC
22 CLAYTON,SON & CO (HOLDINGS) PLC
23 DWEK GROUP PLC 10 1985.12.31 6204000.00
24 FLEXELLO CASTORS & WHEELS PLC
25 HAMPSON INDUSTRIES PLC 14 1985.03.31 9959000 .OO
26 HAY (NORMAN) PLC 10 1985.12.31 6232000.00
27 LYON & LYON PLC 15 1985.12.31 9054000.00
28 MACKAY (HUGH) PLC 15 1985.12.31 9078000.00
ROCK PLC
SLINGSBY (H.C. ) PLC
SOMIC PLC
STONEHILL HOLDINGS PLC
SYMONDS ENGINEERING PLC
TEX HOLDINGS PLC
TOOTHILL (R.W.) PLC
WALKER (THOMAS) PLC
cont d

A P P E m I X G (CONTINUED)
---------------- COMPANY NAME
------------- NO. OF YEARS DATA
AVAILABLE
- - - - - - - - - DATE OF LAST REPORT
TOTAL ASSETS
f
37 WIDNEY PLC
38 WOOD(ARTHUR)& SON (LONGPORT) PLC
39 ALBION PLC
40 AMBER DAY HOLDINGS PLC
-41 ATKINS BROTHERS (HOSIERY) PLC
42 BEALES (JOHN) PLC
43 BREMNER PLC
44 DAVENPORT KNITWEAR PLC
45 DELANEY GROUP PLC
46 DELYN PACKAGING PLC 10 1986.02.02 4311000.00
47 ELYS (WIMBLEWN) PLC 10 1986.02,.01 8133000.00
48 EXECUTEX CLOTHES PLC 10 1985.12.31 2319000.00
49 FINLAY PACKAGING PLC 10 1985.12.31 5901000.00
50 FORMINSTER PLC 10 1985.04.30 7628000 .OO
51 LANCA PLC 10 1985.12.31 2071000.00
52 LINCROFT KILGOUR GROUP PLC (THE)

............................................................ COMPANY NAME NO. OF DATE OF TOTAL
YEARS LAST ASSETS DATA REPORT E
AVAILABLE
53 SOMMERVILLE (WILLIAM) & SON PLC 9 1985.05.31 3880000.00
54 STAVERT ZIGOMALA PLC 9 1985.03.31 473000 .OO
55 TOWLES PLC 15 1986.02.28 8787000.00
56 -0OD GROUP PLC 10 1986.01.31 3562000.00
57 UNIGROUP PLC 15 1985.04.30 2245000.00
58 WALKER & STAFF HOLDINGS PLC
59 BRITISH BENZOL PLC 12 1986.03.31 9850000 .OO
60 CONTINUOUS STATIONERY PLC 10 1986.03.31 2043000.00
61 DINKIE HEEL PLC 10 1985.12.31 2344000.00
62 EARLY S OF WITNEY PLC 15 1986.02.01 6236000.00
63 FII GROUP PLC 9 1985.05.31 9062000.00
64 FUTURA HOLDINGS PLC 10 1985.12.28 3362000.00
65 HEADLAM, SIMS & COGGINS PLC
66 JEROME (S.) & SONS ' (HOLDINGS) PLC 15 1985.12.31 8645000 .OO
67 JOURDAN (THOMAS) PLC 10 1985.12.28 7260000.00
68 KYNOCH(G.& G.) PLC 9 1985.08.31 3424000.00
69 NEWBOLD & BURTON HOLDINGS PLC
cont d

............................................................ COMPANY NAME NO. OF DATE OF TOTAL
YEARS LAST ASSETS DATA REPORT f
AVAILABLE
70 PRESTWICH HOLDINGS PLC
71 RICHARDS PLC 15 1985.09.30 8849000.00
72 SANDERSON MURRAY 6r ELDER (HLDGS) PLC
73 SPEAR (J.W.) & SONS PLC 11 1985.12.31 9357000.00
74 TEXTURED JERSEY PLC 9 ' 1985.04.30 9933000~00
75 TOYE & CO PLC 10 1985.12.31 5333000.00
76 WILKES (JAMES) PLC 15 1985.12.31 5674000 .OO
77 YOUNG (H.) HOLDINGS PLC 9 1985.07..'27 7723000 .OO
78 SCANRO HOLDINGS PLC 9 1985.12.31 3379000.00
79 SWAN (JOHN) & SONS PLC 10 1986.04.30 2205000.00
80 WADE POTTERIES PLC 14 1985.07.31 9619000.00

348
REFERENCES
Accounting Objectives Study Group, (1973), Obiectives of ma1 Stat-, American Institute of Certified
public Accountants.
Accounting Standard-Steering Committee, (1975), The Cornor-
ReDort.
~ssociation of Lecturers in Accountancy (ALIA) , (1976), '~oods in Parts Accountancy Lecturers' View- on the Corporate Reportn, ~ A c c o u R h x l L , Vol 175, 15th December, pp68-69.
American Accounting Association, (1966) , A Stat- of R a s k
Acco-. New York.
Altman, E.I., (1968) , 'Financial Ratios, Discriminant Analysis and the Prediction of Bankruptcy" ,, Vol XXIII, NO 4, Sept 1968, pp589-609.
Altman, E.I. , (19711, S&rnor&e Ra-tcv in, Health Lexington Books. .
Altman, E.I. , (1971) , ?Railroad Bankruptcy Propensitym ,, Journal of1 Vol XXVI, No 63,, May 1971, pp333-345.
Altman, E.I., and Loris, B., (1976), "A Financial Early Warning
System for Over-The-Counter Broker-Dealers', Journal of
Finance, Vol XXXI, No 4, Sept 1976, pp1201-1217.
~ltman, E.I., Hald-n, R.G. and Narayaman, P., (1977), "ZETA ANALYSIS: A New Model to Identify Bankruptcy Risk of corporations', Journal of R-, Vol 1, NO 1, pp29-54.

Altman, E.I., and La Fleur, James K., (1981), "Managing a Return to Financial Healthn, m e J o m of B u s i n e s s S t r a t e a v , vol 2, No 1, Summer 1981, pp31-38.
Utman, E.I., (1983), "Why Businesses Failn, m e Jourmof, es3 Stratecrv, Vol 3, No 4, Spring 1983, pp15-21.
Andrews, D.F., Gnanadesikan, R. and Warner, J.L., (19731, "Methods for Assessing Multivariate Normalityn,
ivariate u v s i s I=, edited by P.R. Krishnaiah,
Academic Press, pp93-116.
Anslow, A * , (19841, "Your Businessn, Vol 2, No 14, October.
~nslow, M a r (19841, "3i Setting Strategy for Venture Successn, Business, Vol 2, No 13 September.
~rgenti, J., (1976), -orate ~ o u s e . l e s & m. New York ; John Wiley and Sons, Inc.
~shikaga, T. and Chang, P.C., (1981), nRobustness of Fisher's
in ear Discriminant Function Under Two-Component Mixed Modelsn, Journal of the American Sta-tica . . Normal
Bssoc1atlon. . ,
Vol 76, No 375, pp676-680.
"A Test Analysis of Unsuccessful Industrial ~ompanies~, Bulletin UQ 31. Urbi3.m. Il#au of
. . . . ear& 1930.
~artlett, M.S. I (19371, "Properties of Sufficiency and statistical Testsn, proc-as o f Roval Societv, A, Vol 160, ~~268-182.
~eaver, W.H., (1966) , "Financial Ratios as Predictors of . . Failuren, EmDlrlcal R e m c h in A c c o u a . Selected studies. 1966. Supplement to Journal of Acco- p e s a Vol 4, January 1967, pp71-111. .
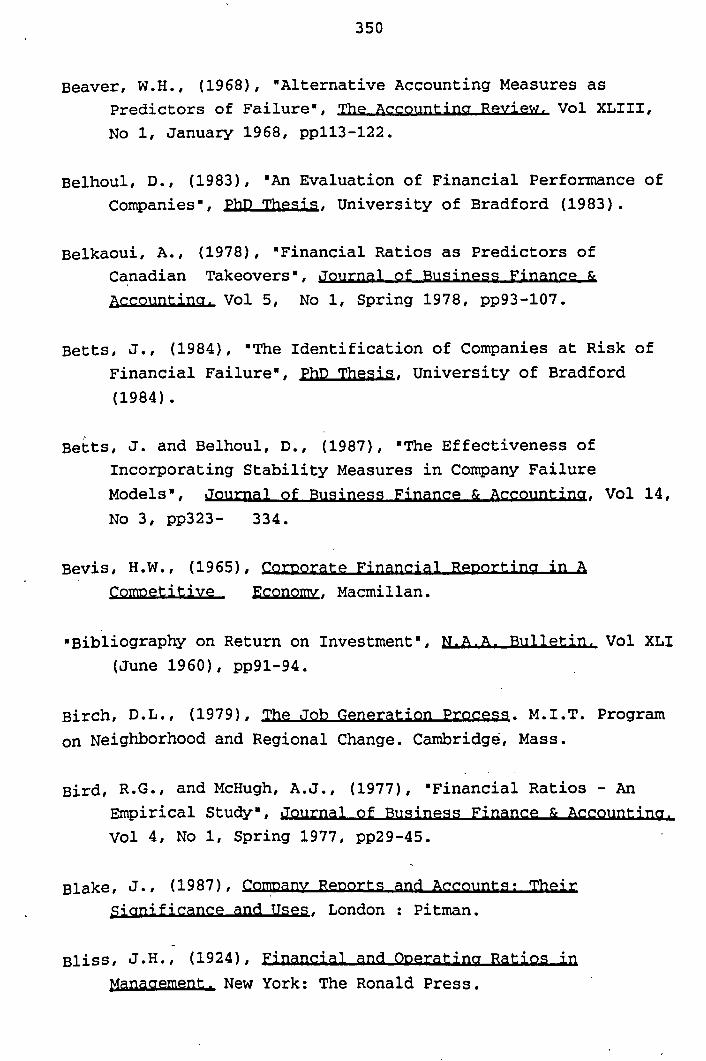
Beaver, W.H., (1968), "Alternative Accounting Measures as Predictors of Failurea, me Accountina Review. Vol XLIII, No 1, January 1968, pp113-122.
Belhoul, D.1 (1983), "An Evaluation of Financial Performance of Companiesm, Phn Thesh, University of Bradford (1983) .
Belkaoui, A., (19781, 'Financial Ratios as Predictors of Canadian Takeoversn, Journal of B u s i n e s s e &
Vol 5, No 1, Spring 1978, pp93-107.
Betts, J., (1984), 'The Identification of Companies at Risk of Financial Failuren, phn T h d , University of Bradford (1984).
~etts, J. and Belhoul, D., (1987), "The Effectiveness of Incorporating Stability Measures in Company Failure Modelsn, Journal of Business F w c e & m, Vol 14, No 3, pp323- 334.
F-m, Maanillan.
"Bibliography on Return on Investment " N.A. A. R u l l ~ t b Vol XLI (June 1960), pp91-94.
Birch, D.L., (19791, m e Job Generation Procesa. M.I.T. Program on ~eighborhood and Regional Change. Cambridge, Mass.
. . ,
Bird, R.G., and McHugh, A.J., (1977), "Financial Ratios - An Empirical Studyn, J o u r n a l o f F- & Accauntina. Vol 4, No 1, Spring 1977, pp29-45.
Blake, J* , (1987) , m a n v Re~0r-t~ and ~c-ts : Their d Usea, London : Pitman.
Bliss, J*Hot (19241, #and0 ~ a t b s i,,Q Manaaement. New York: The Ronald Press.

~lum, M., (19741, "Failing Company Discriminant Analysisn, a Research. Vol 12, No 1, Spring 1974,
ppl-25. I
Bolton Cormnittee, (19711, 'Small Firms: Report of the Cormnittee of inquiry on Small Firmsn, CMND 4811, HMSO, London.
Bolton, J.E., (19761, 'Keeping Small Firms Afloatm, maern- ~ c c o ~ , Vol 54, No 5, (May) .
Bolton, J.E., (19781, 'The Bank Manager: Entrepreneur of the 1980'sn, Bankers Maaazk, Vol CCXXII, No 1607, pp8-10.
BOX, G.E.P., (19491, 'A General Distribution for a Class of ~ikelihood Criterian, m, Vol 36, pp317-346.
Brian, Not (19841, 'Small Companies Lead The Wayn, mm. ~ 1 % Vol 67, No 854, March 23, pp x-xiii.
room-Longenecker, (19751, 'Small Business Managementn, South- Western Publishing Co., pp226.
~ulow, J.I., and Shoven, J.B., (1978), "The Bankruptcy ~ecisipn' , Re11 Journal ofEconomics. V O ~ 9, NO 2, AU~UUI 1978, pp437- 456.
r
carsberg, B a r Hope, A. and Scapens, R.W., (1974), "The
objectives of Published Accounting Reportsn, m u n t a n a * -
e s s Research, Val 5, NO 15, pp162-173.
Casey, C.J., Jr., (19801, 'The Usefulness of Accounting Ratios for Subjects' Predictions of Corporate Failure:
~eplication and Extensions8, Journal of Acco- Research,. Vo118, No 2, Autumn 1980, pp603-613.
chadwick, L., (1978) , 'The Problems of Financing Small and ~edium Sized Firms', Certified Accountant,

Chambers, R.J., (19641, 'Measurement and Objectivity in Accountingn, T h e c o u L h g ~eview, Vol XXXIX, April
Chambers, R.J., (1966), Accountina Eval- , Prentice-Hall.
Chesser, D.L., (19741, 'Predicting Loan Noncompliancem, ~ o u r w o f f Vol 56, No 12, August 1974, pp28-38.
churchill, D., '(1984) , "Small Businesses", Financial Times Survey, 12 June 1984.
clarke, W.R., Lachenbruch, P.A. and ~roffitt, B., (1979), 'How Non- normality Affects the Quadratic Discriminant . . unction' , -cat ions m c s . Th~orv and Methods, Vol A8, No 13, pp1285-1301.
~ooley, W.W. and Lohnes, P.R., (1962), w v a r M . e P r o w
w. John Wiley & Son, New York.
Conover, W.J., and Iman, R.L., (1980). 'The Rank rans sf or mat ion As a Method of Discrimination With Some Examples', . .
q n ~ l S t a t l s t l c s . , Vol A9,
No 5, pp465-487.
Cowen, S.S., and Page, A.1., (1982), 'A Note on the Use of Selected Nonfinancial Ratio Variables to Predict Small ~usiness Loan Performancem, &clsion Sciences, . .
Vol 13, No 1, January 1982, pp82-87.
~~mbolena, I.G., and Khoury, S.J., (1980). "Ratio Stability and Corporate Failuren , , t T o u o f c e . Vol XXXV, NO 4,
Sept 1980, pp1017-1026.

~eakin, E.B., (1972), "A Discriminant Analysis of Predictors of ~usiness Failuren, Journal of Ac-ear& Vol 10,
No 1 Spring 1972, pp167-179.
~eakin, E.B., (19761, 'On the Nature of the Distribution of ~inancial Accounting Ratios: Some Empirical Evidencen, pcco- Vol LI, No 1, pp90-96.
Dun and Bradstreet;Business F- New York, 1982.
. . Edey, H.C. and Partipakdi, P., (1956), P r l t l s h Co-
a an ttleton @d R.S.
Studies in the History of Accounting.
~dmister,R.O., (1971), "Financial Ratios and Credit Scoring For Small Business Loansn , m e Jo- of C-al B&
Lendina. Vol 54, No 1, Sept 1971, pp10-23.
~dmister~R.0.~ (1972), "An Empirical Test of Financial Ratio ~nalysis for Small Business Failure Predictionm, Journal of
ve Vol VII, No 2, March 1972, pp1477-1493.
ise en be is, R.A., (1977), mPitfalls in the Application of Discriminant Analysis in Business, Finance, and Economicsm,
of F-, Vol XXXII, No 3, pp875-900.
. . ise en be is, R.A. and Avery R.B., (1972), -t
and -on P r o c e P * . .
Lexington Mass,: D.C. Heath and Company.
Extel (198311 Exstat, Extel Group, London.
~itz~atrick, P., (19321, "A Comparision of the Ratios of
~uccessful Industrial Enterprises with Those of Failed . . . . companiesn, W t l f l e d P U c Accountant. October-December
1932, ~~598-605, 656-663, 727-731.

Foster, G., (1986) t #, prentice Hall.
Foulke, R.A., (19331, "Three Important Balance Sheet Ratiosn,
P a , and R r a R ~ugust 1933, pp7-11.
Foulke, R.A., (19331, "Three Important Inventory Ratiosn, pyn ~ r m t r e e t Mouhlv ~eview, December 1933, pp6-11.
Foulke, R.A., (19341, "Three Important Sales Ratiosn, Dun and May 1934, pp6-11.
Foulke, -R.A., (19341, 'Three Important Net Profit Ratiosn, hlv ~e- November 1934, pp2-7.
Foulke, R.A., (1961), prac&al Financial Statement 5th ed. New ~ork: McGraw-Hill Book Publishing Company.
Frank, R.E., Massy, W.F., and Morrison, D.G., (19651, "Bias in
~ultiple Discriminant Analysis ", Journal of W k e t h Research, Val 11, ~~250-258.
~anguly, Pot (19831, "British Businessn, pp 838-845.
~anguly, Pot (19851, I L K . Small R-s Statmlcs . . , Harper & Row, London.
Gilbert, E.S., (19681, "On Discrimination Using Qualitative . . Variables ", Journal of st-
I .
soclatlo~t Val 63, NO 324, ~~1399-1412.
Gilbert, E.S.,\ (19691,. 'The Effect of Unequal Variance- covariance Matrices on Fisher's Linear Discriminant
Functionn, Biometries, V O ~ 25, NO 3, pp505-515.
- . ~ilman, S. ' (19251 , AxUlvzinff F-al Statements. Revised
~dition. New York: The Ronald Press.

Gru, L.G., (1973), "Financial Ratios Multiple Discriminant ~nalysis and The Prediction of Small Company Failuren,
phD T h h , University of Minnesota. (1973).
air, J.F., Anderson, R.E., Tatham, R.L., and Grablowsky, B.J., (1979), Ul-e I7ata -is: With R e a u . Tulsa, Oklahoma: Petroleum Publishing Company.
Hanson, J.D., (1989) #a1 ReDortina- - A , Part 1 of Financial Reporting 1988-89, A Survey of UK Published Accounts, Twentieth Anniversary ~dition.
~ardgreaves, R.B-1 (19831, 'Starting a Businessn, Heinemann: London Chapter 5&6.
~arris, D.1 (19841, "Small Business - a Special Reportn, Times, Thursday 21 June.
Harvey, D., (1984), "Sources of Business Financen, The Institute of Directors, Chapter 10.
~oel, P.C., (19621, Introduction t o Mathematical Stat- . , 3rd edition, John Wiley & Sons, Inc.
Hoeven, J.A.1 (19791, "Predicting Default of Sinall Business Loans " , of C C Vol 61,
No 8, April 1979, pp47-60.
~oldren, G.C., (19641, "LIFO and Ratio Analysisn, The A c m
peview, Vol XXXIX, January 1964, pp70-85.
orr rig an, J.O., (19651, "Some Empirical Bases of Financial Ratio ~nalysis", A C C Q U R ~ ~ Q U Review. Vol XL, No 3, July 1965, ,
pp558-568. '

orr rig an, J.O., (19681, "A Short History of Financial Ratio Analysisn, The Acco-a Review. Vol XLIII, No 2, April
1968, pp284-294.
orr rig an, J.O., (1978), # pers~ectjve. Reprint Edition. New York: Arno Press.
~oward, B. and Upton, M., (19531, nroductim to BUS- Finance. McGraw-Hill, New York.
IASC, (19891 , F r a m e w o r k f o r a t i o n and Presentation of a1 Stat-, The International Accounting
Standards Committee.
~nstitute of Chartered Accountants in England and Wales, (1949), erst Handbook, Part 2, S.1.
ICAEW, (19681, 9 . . I The
~nstitute of Chartered Accountants in England and Wales.
~ackendoff, No, (19611, 'The Use of ~inancial Ratios and Other Financial Techniques and Services by Small Businessn, Philadelphia: Temple University, Bureau of Economic a d
ess Re-
jackendof f, N., (19621 , 'A Study of Published Industry Financial and Operating Ratiosn, Economics ~us-ss B-
~emple University March 1962.
Jones, D.M.C., (19741, "Evolution of Accounting as Management
Aid" #, (July/~ugust) , vol 52, NO 7, pp197-200;
JOY, O.M., and Tollefson, J.o., (19751, "On the Financial
~pplications of Discriminant Analysisn, Journal of

titative mvsiz-, Vol X, No 5, pp723-
739.
Kenley,W.J. and Staubus, G.J., (1972), Obiectives Conce~w cia1 Stat-, The Accounting Research
Foundation.
~lecka, W.R., (19751, "Discriminant Analysis8, m t l c a . . for the Social science^, 2nd ed., New York:
McGraw-Hill Book Company.
Konstans, C. and Martin, R.P., (1982), "Financial Analysis for . Small Business: A Model for Controln, Business. Vol XXXII, No 1 January-March 1982, pp21-26.
~achenbruch, P.A., (1967), "An Almost Unbiased Method of
Obtaining Confidence Intervals For The Probability of Misclassification In Discriminant Analysisn, -, Vol 2'3. No 4, pp639-645.
~achenbruch, P.A., (1975), -t Analvsls. . . ' Hafner Press,
New York.
~achenbruch, P.A., .(1974), 'Discriminant Analysis When the
Initial Samples are Misclassified. I1 Non-random Misclassification Models8, -tries.' Vol 16, No 3, August 1974, pp419-429.
~achenbmch, P.A. and Goldstein, M., (1979), "Discriminant Analysis', W t r i a , Vol 35, No 1, pp69-85.
I
~~chenbruch, P.A., Sneeringer, C. and Revo, L.T., (1973), "Robustness of the Linear and Quadratic Discriminant unction to Certain Types of on-~ormality~,
V O ~ 1, NO 1, ~~39-56.
Layton, S., (19841, "Nothing Ventured', Banking World, vol, 2, No 1, P30-31.

Lee, T.A., (1975), "Accounting Standards and Effective Financial
~eporting: A Review in Principlen, Accountant -.
Lee, T.A., (19711, 'Utility and Relevance, the Search for Reliable Accounting Informationn,
B-21, V O ~ 1, NO 3, ~~242-249.
Libby, R., (1975), "Accounting Ratios and the Prediction of Failure: Some Behavioral Evidencen, Research. Vol 13, .No 1, Spring 1975, pp150-161.
~loyd, S., (1984), "Improved Climate for The Risk Takersn, Your Business, Vol 2, No 13, September.
Littleton, A.C., (1926), "The 2 to 1 Ratio Analyzed8, w e f l e d . . Public August 1926, pp244-246.
Madllan Report, (19311, "Committee On Finance & Industry8, CMD 3897, HMSO, London.
Mclachan, G.S., (1980), "On the Relation Between the F-Test and the Overall Error Rate for Variable Selection in ?tJo Group ~iscriminant Analusism, ' Vol 36, pp501-510.
Malcolm, C I (1984) , "Small is Popularn, . . , Vol 2, NO 1, pp32-33.
~alkovich, J.f. and Afifi, A.A., (1973), "On Tests for Multivariate Normalityn, Journal of the m r i c m
I I . . gtatutlcal BSSociatlqn, Vol 68, No 341, pp176-179.
Mardial K.V., (19701, "Measures of Multivariate Skewness and ~urtosis With Applicationsn, m, Vol 57, pp519-530.
Mardial K.V., (1974). "Applications oi Some Measures of Multivariate Skewness and Kurtosis in ~esting Normality and
Robustness Studiesn, m, Vol 36, pp115-128.

~ardia; K.V. and Zemroch, P.J., (19751, "Measures of 0 . ~ultivariate Skewness and Kurtosisn, w e d St-,
Vol 24, pp262-265.
~ardia, K.V., Kent, J.T. and Bibby, J.M., (1979), m i a t e m, Academic Press.
Marks, P.J., (19871, Exstat-2, Bradford University Computing Centre Document.
Marks, S. and Dunn, 0. J., (1974), "Discriminant Functions When
Covariance Matrices Are Unequaln, Journal of , Vol 69, No 346, pp555-559.
McKeeven, J.L., (19601, "A Study of the Problems of Small ~etailers in Wyoming8, University of Wyoming, College of
Commerce and Industry, Division of Business and ~conomic research, December 19'60.
~c~onnies, ' P. (ed.) (19881, Makina C o m m t e R ~ D o ~ ~ s Va-, The Institute of Chartered Accountants of Scotland.
~arlow, D.1 (19841, See Anslow, M., "3i Setting the Strategy for Venture Successn.
MerWin, C. La , (19421 , 'Financial Small Corporations in Five 'Manufacturing Industries 1926-19368, National oof
c Research. Vol 22.
eyer, P.A. and Pifer, H.w., (1970), "Prediction of Bank failures", me Journal of Finance, Vol XXV, No 4, September 1970; pp853-868.
~oonitz, Mot (19611, The Basic Postulates o f , I '
~ccounting Research Studies, No 1, AICPA. New York.

Moore, G.H., (1957), "The Quality of Credit in Booms and ~epressions', #s of nav.
Thirty-Seventh Annual Report, National Bureau of Economic Research.
, Moyer, R.C., (1977) , "Forecasting Financial Failure: A Re-
Examinationn, -t. Vo16, No 1, Spring
~ulondo, K.J., (1981), "Company Reorganisation as a Business Turnround Strategyn, phn thesis, University of Bradford, UK .
wre, J., (1946), "Fallacies in the Balance Sheet Approachn,
, Vol 21, (January) . Ohlson, J.A., (1980) , "Financial Ratios and the Probabilistic
Prediction of Bankruptcyn, # Vol 18, No 1, Spring 1980, pp109-132. .
. pankoff and Virgil, (1970), W n the Usefulness of Financial Statement Informationn, E C C O ~ C I Revieu, Vol XLV, pp269-
279.
, ..
pinches, G.E., (19781, "Classification Results and Multiple Discriminant Analysisn, Working Paper No 116, University of Kansas.
pinches, G.E., (19801, 'Factors ~nfluencing Classification Results from Multiple Discriminant Analysisn, Journal of
, Vol 8, No 4, pp429-456.
pinches, G.E., Eubank, A.A., Mingo, K.A., and Caruthers, J.K.,
(1975), "The Hierarchical Classification of Financial ~atios", J o u r n a l l & , R e s e a r c h , Vol 3, No 4, pp295- 310.

pinches, G.E. and Kent A. Mingo. (1973), 'A multivariate Analysis of Industrial Bond Ratings', The Journd of Finance, Vol XXVIII, No 1, ppl-18.
Rao, C.R., (19731, Linear s-~nference . . on, Wiley.
~obson Rhodes-, (19841, '2nd Report on Small Business Loan Guarantee Schemen, D., Tripper, April 4.
Rose, P.S. and Scott, W.L., (1980), 'A Return-on-Equity Analysis of Eleven Largest U.S. Bank Failuren, Review of Rusbess d EconQmic Research. Vol XVI, No 2, Winter 1980-81, ppl-
, 11.
Sanzo, R., (1960), utio u v s i s f o r -11 BUS-, Small Business Management Series, No 20, 2nd ed: Small Business ~dministration.'
Scase, R., and Gof f ee, R., (1982) , 'The Entrepreneurial Middle Class', pp15.
schabacker, J.C., (19601, 'Cash Planning in Small Manufacturing Companiesn, B d e q s Research s- NO 1, Small
Business Administration, 1960.
sheila Gunn, (19861, 'Small Businesses Get No Assistancea, Times, April. 10.
sir Ron Dearing, (1988), mMakina of
ICAEW.
R.F., and Winakor, .A.H., (1935) , # ure of m f u l Bulletin
No 51, Urbana, Illinois: University of Illinois Bureau of
B U S ~ ~ ~ S S Research, 1935.

S O ~ O ~ O ~ S , D. (1989), t F o r 1 R e ~ o r t h
Standards, ICAEW.
sprouse, R. and Moonitz, M., (19621, "AICPA Research Studyn, No 3 .
spacek, L. , (1969) , E S e a r c h ' a k n c s ~ a i r n e s s i a l Report- to - P U , Arthus Anderson & Co.
SPSS~, (1986) , ,SPSS? User's G u i k , SPSS Inc. McGraw-Hill Book Company.
9 . stamp, E. and Marley, C., (1970), &countino P r ~ m e s e for Refom, Butterworths, London.
staubus, G. J., (19711, Accountina for Investors, Scholars Book Co .
Stone, D.E.1 (1967), 'The Objective of Financial ~epoeting in the Annual Reportn, A c c o w a Review, April, pp331-
337..
' Storey, D.J. , (1982) , 'Entrepreneurship and The New Firmn, Croom Helm LTD, London.
sue, L., (1984), ' Finance and The Small ~usiness~, Investors Chronicle, Vol 67, No 848, February 10, pp iii - xxxiii.
. Taf fler, R.J., (1976), ~ - 'Finding those Firms in ~iscriminant Analysis and Financial ~atio -, Business School, City Universi
fler, R.J. and Tisshaw, H., (1977), nGoing, Four Factors Which Predictn,
March 1977, pp50-54.
Danger Using -
Data', Y o r k k
.ty, UK.
Going, Gone - Vol 88, No 8003,
Taf f ler, R. J. , (1982) , 'Forecasting company Failure in the U.K. Using Discriminant Analysis and Financial Ratio Datan,

1 of & Roval S t a t w a l Societv . . . , Series A, Vol 145, pp342-358.
~affler, R.J. and Sudarsanan, P.S., (1980), "Auditing the Board: A New Approach to the Measurement of Company Performancen,
en-, Vol 5, No 2, pp127-147.
~affler, R.J., (19831, 'The Z-score Approach to Measuring Company Solvency', T m r ' March, pp91-96.
~rieschmann, J.S., and Pinches, G.E., (1973), "A Multivariate
Model for Predicting Financially Distressed P-L Insurersn, The Journal of &k and Vol 40, No 3, Sept 1973, pp327-338.
/
wahl, P.W. and Kronmal, R.A., (1977), "~is.crirninant Functions When Covariances are Unequal and Sample Sizes are Moderate", Vol 33, No 3, pp479-484.
wall, A., 9 1 9 'Study of Credit Barometricsn, Federalenre
Bulletin. Vol 5, No 3, March 1919, pp229-243.
Walter, J.E., (19571, "Determination of Technical Solvencyn, ess, Vol 30, January, pp30-43.
welker, R.B., (197'4) , "Discriminant Analysis as an Aid to Employee Selectionn, -n-, v01 XLIX, NO 3, pp514-523.
mittington, G., (1980), "Some Basic Properties of dccounting
~atios", J o u m of --s F-ce & Acco- Vol 7, No 2, Summerl980, pp 219-232.
wilson Report, (19791, 'The Financing of Small Firmsn, ~ ~ 2 1 .
woodcock, C., (19821, "Raising Finance - The Guardian Guide for the Small Businessn., Chapter 1.

yuji Ijiri and Robert, K.J., (19661, .Reliability and
Objectivity of Accounting Measurementsm, me A c c o a
peview, XLI , pp474-483.