University of Bath - BCURA
28
University of Bath Department of Chemical Engineering BCURA Contract Number B56 Advanced Characterisation of Industrially–Important Coal–Based Carbons BCURA Final Report Period Covered: 1 October 2002 – 30 September 2005 Project Duration: 1 October 2001 – 30 September 2005 Principal Author Ms Edwige Sima-Ella E-mail : [email protected] University Project Manager Dr Tim Mays Department of Chemical Engineering University of Bath BATH BA2 7AY Tel : 01225–386528 ; Fax : 01225–385713 E-mail : [email protected] BCURA Project Officer Mr Brian Smith Mitsui Babcock Energy Limited 11 The Boulevard CRAWLEY West Sussex RH10 1UX Tel : 01293–584788 ; Fax : 01293–584321 E-mail : [email protected]
Transcript of University of Bath - BCURA

University of Bath Department of Chemical Engineering
BCURA Contract Number B56
Advanced Characterisation of Industrially–Important Coal–Based Carbons
BCURA Final Report Period Covered: 1 October 2002 – 30 September 2005 Project Duration: 1 October 2001 – 30 September 2005
Principal Author
Ms Edwige Sima-Ella E-mail : [email protected]
University Project Manager
Dr Tim Mays
Department of Chemical Engineering University of Bath BATH BA2 7AY
Tel : 01225–386528 ; Fax : 01225–385713 E-mail : [email protected]
BCURA Project Officer
Mr Brian Smith Mitsui Babcock Energy Limited
11 The Boulevard CRAWLEY
West Sussex RH10 1UX Tel : 01293–584788 ; Fax : 01293–584321
E-mail : [email protected]

1. EXECUTIVE SUMMARY
Coal is and will remain a vital raw material for the foreseeable future, both as a fuel in energy conversion plant and as a reducing agent in the iron - and steel-making industry. However, the continuous legislative pressure on emissions, with respect to NOx, SOx and CO2, puts a considerable pressure on these industries. Other recurrent problems include slagging, fouling and corrosion, which damage the power station boilers and the tuyères of the blast furnace. Characterisation of the coal is therefore important for these industries, in order to determine the chemical and physical properties of the coal. Hence, a better understanding of coal combustion is becoming increasingly essential in these industries, where the specifications of the fuel are crucial design parameters [1]. In fact, adequate coal characterisation data is required for several reasons: design of the gasifier and furnace; fuel utilisation efficiency; and for operating conditions in these industrial processes [2]. One key property of the coal is the intrinsic kinetic parameters of the char. These parameters describe the dynamics of the combustion reactions. They are used as an indicator to predict and compare the performance of different coals and coal blends. In fact, it has been shown that computerised-fluid-dynamics (CFD) modelling of char combustion can, given accurate char intrinsic kinetic data, successfully predict burnout time within small scale test facilities [3]. In addition, intrinsic reactivity data are currently being used as a predictive tool in full-scale power station boiler design (Mitsui Babcock Energy Ltd, 2005).
In effect accurate intrinsic kinetic data are required for the design of power station boiler, gasifier, and blast furnaces. Hence this study was designed to investigate a highly accurate characterisation technique, which will be an invaluable tool for industrial processes such as pulverised-fuel combustion and steel making where fast and adequate coal characterisation is essential. This novel method focussed in developing a simplified, though rigorously based thermogravimetric analysis method to determine the intrinsic reactivity parameters for the oxidation in air of coal and coal derived materials. Such an improved science based coal characterisation technique will be useful in predicting performance of existing and new plants, with respect to process efficiency, NOx emissions, slagging, fouling and corrosion characteristics, with a view to increasing fuel flexibility and hence fuel cost.
The intrinsic reactivity of coal chars is most commonly measured by thermogravimetric analysis (TGA) techniques. These techniques, however, are either time-consuming or unreliable. This instability is because the evaluation of the kinetic parameters is strongly influenced by experimental conditions. For example, the rate at which the sample is heated affects the kinetic analysis. Modern thermal analyses are, consequently, moving towards TGA techniques, which are not affected by the rate of heating. In these techniques, the reaction rate of the sample determines the heating mode of the sample; thus they are termed sample controlled thermal analysis (SCTA). These new techniques are still in development as it is not possible to determine the reactivity parameters due to the random variation of the temperature. Hence, there is a need for a procedure of char characterisation for which the results are not influenced by the methodology of the analysis.
Ten coals, extending from anthracite to subbituminous, were supplied by Mitsui Babcock Ltd and Corus UK Ltd the industrial collaborators on the project, as samples
page 2 of 28
representative of the wide range used in power industries and steel-making industry, respectively. These coals were first charred following guidelines from the British Standard BS 1016-104.3:1998, and subsequently oxidised in dry air. The oxidation reaction was performed at various constant rates of heating from 1 - 50 ºC min -1. A kinetic model based on a modified Coats-Redfern method for analysing linear TGA experiments, was applied to derive the kinetic parameters of the coal chars.
It was found that the rate of heating strongly influenced the measured reactivity of the char, in that reactivity increased as the heating rate was increased. It was clear that a single TGA experiment, at an arbitrary heating rate could not provide a unique estimate of the intrinsic reactivity of the material. The modified kinetic model, however, enables these reactivity data to be inputted independently for simulation of the oxidation of the char. It appeared that the simulated decomposition profiles did not always correspond to the experimental ones. Yet, there existed a clearly defined heating rate range at which the predicted oxidation profile exactly fitted with the experimental burnout profile. At this specific heating rate range, therefore, there is no interference with the kinetic analysis, and true reactivity parameters are derived. This heating rate was termed the ‘optimum-heating rate’ was in the range 25 – 35 ºC min -
1. This optimum heating rate is believed to be an instrumental factor, so that each TGA instrument possesses an optimum-heating rate range at which true kinetic data are obtained. In this way, only single experimental TGA run is required once this optimum-heating rate has been established.
The resulting reactivity parameters at this optimum-heating range were found to be constant, and corresponded to values presented in the literature for similar materials. The validity of this method was also confirmed by comparing these results with those derived using conventional kinetic analyses. These methods consisted of time-consuming isothermal analyses and very popular isoconversional methods. It appeared that all methods were in good agreement, although the novel TGA technique presented a narrower error margin in comparison. In order to complement this work, a novel SCTA method was also investigated to provide a new insight into coal characterisation. However, this technique proved to be more complex and trickier than conventional TGA methods. The overall weight loss required close monitoring and the oxidation reactions were subjected to strong mass transfer effects.
In conclusion, a reliable TGA method has been developed, and thus all the objectives of the project have been achieved. The project has culminated in the availability of a new state of the art TGA procedure, which is more accurate and simpler than established methods. At the same time, this novel technique presents a great potential for industry in coal combustion and pyrolysis where the accurate and fast coal characterisation is essential. Moreover, there is scope for patenting this characterisation procedure by both the University of Bath and BCURA.
Proposed work for subsequent project would be to relate highly accurate derived reactivity data with process performance. Performance indices may be in terms of process efficiency, slagging factor, or emissions, so that a good correlation between these indexes and the reactivity of the char could arise. In this light, it will be possible to predict more precisely the performance of a coal in service.
The beneficiaries of this work are coal-firing industries, especially in power generation and the steel-making industry. Two journal publications have arisen from
page 3 of 28
this work (1-2) and a third is in preparation. This work has been disseminated at national and international conferences, including the “7th World Congress on Chemical Engineering”.
The University Project manager (T.J. Mays) and the project Student (E. Sima-Ella) are very grateful to BCURA for financial support, and to the project collaborators (Mitsui Babcock Energy Ltd and Corus UK Ltd) and especially to the BCURA project officer (B. Smith) who coordinated the work.
page 4 of 28

CONTENTS LIST. 1) EXECUTIVE SUMMARY 2) INTRODUCTION. 3) EXPERIMENTAL AND THEORY. 4) RESULTS. 5) DISCUSSION 6) CONCLUSIONS 7) PROPOSED WORK FOR A SUBSEQUENT PROJECT 8) PUBLICATIONS ARISING FROM THIS WORK 9) ACKNOWLEDGEMENTS 10) REFERENCES. TABLE 1 - 11. FIGURES 1- 6.
page 5 of 28
2. INTRODUCTION
Reactivity data of various coal chars in air is extensively discussed in the literature [4, 5]. However, many researchers have considered the overall or effective reactivity as opposed to the intrinsic char reactivity [6-8]. The main reason behind this approach is that, intrinsic kinetic data are related to the structure of the material, and therefore are not easily measurable. In spite of that, Smith [9] calculated the intrinsic reactivity in oxygen of various types of carbons. He estimated the different properties of the particle in terms of characteristic particle size, density, specific surface area and pore diameter. In a similar manner, others have studied the oxidative intrinsic reactivity of coal chars by examining the changes in surface area and porosity [10]. This approach is somewhat time-consuming, and may be bypassed by carrying out experiments in the chemical control regime, so that intrinsic rates are directly measured. In light of this, Russell et al. [11] suggested direct measurement of intrinsic reactivity by means of thermogravimetric analysis (TGA) experiments at low temperature (< 1000 °C); where reaction is not influenced by transport of gaseous reactants from the bulk gas to the particle surface. In the TGA, the char in the furnace is subjected to a controlled temperature programme. Experiments are ideally carried out non-isothermally, at a constant heating rate. This way, it is possible to obtain kinetic parameters in one single experimental run, and at the same time achieve complete char conversion in a short period of time (nomrally < 2 hours).
These types of experiments are usually performed at an arbitrary heating rate. This is not such a reliable technique for estimating the activation energy. In fact, it has been observed that heating rate influences the shape of the thermogravimetric curve so that activation energy values vary with heating rate [12-14]. These investigators suggested that kinetic parameters derived from thermogravimetric curves largely depend on procedural variables, especially on the heating rate. Thermal effects are induced on the sample at different heating rates. It is believed that heating rate influences the reaction of a compound in a rather complex manner. In some cases, recrystallization may occur followed by a melting process at low heating rates, whereas, superheating may take place at higher heating rates [15]. It is likely, therefore, that there exists an optimum-heating rate at which these thermal effects are minimised or eliminated, and accurate activation parameters are obtained.
Some researchers have recommended heating rates of 5 or 10 °C min –1 [16], whilst others, have suggested 15 °C min –1 [11]. Many researchers have followed these guidelines [17-19]. Zolin et al. [20], on the other hand, averaged reactivity values from two different heating rates. In any case, they failed to verify that their chosen heating rate was the best option.
Because of this uncertainty in the determination of kinetic parameters from single heating rate experiments, modern thermal analyses have encouraged the use of isoconversional methods [21-23]. These methods combine multiple heating rates, which minimise the thermal interferences occurring from single heating rate measurements. Others still prefer to carry out time-consuming isothermal analyses [24, 25]. In addition, modern thermal analyses are moving towards TGA techniques, which are not affected by the rate of heating. In these new approaches, referred to as sample controlled thermal analysis (SCTA), the temperature is varied in order to maintain a specific reaction rate. This way, the mechanism of the chemical reaction is
page 6 of 28
determined to a higher degree of accuracy compare to conventional linear heating rate approach. Nonetheless, the main drawback from SCTA methods is that the reactivity parameters (activation energy E and pre-exponential factor A) cannot be determined easily.
The main aim of this project is to develop a new thermogravimetric analysis (TGA) method to determine the oxidation reactivity of carbons derived from coal. The impetus for the project is that the new method is expected to be quicker and more reliable than existing methods for characterising reactivity.
3. EXPERIMENTAL AND THEORY Materials
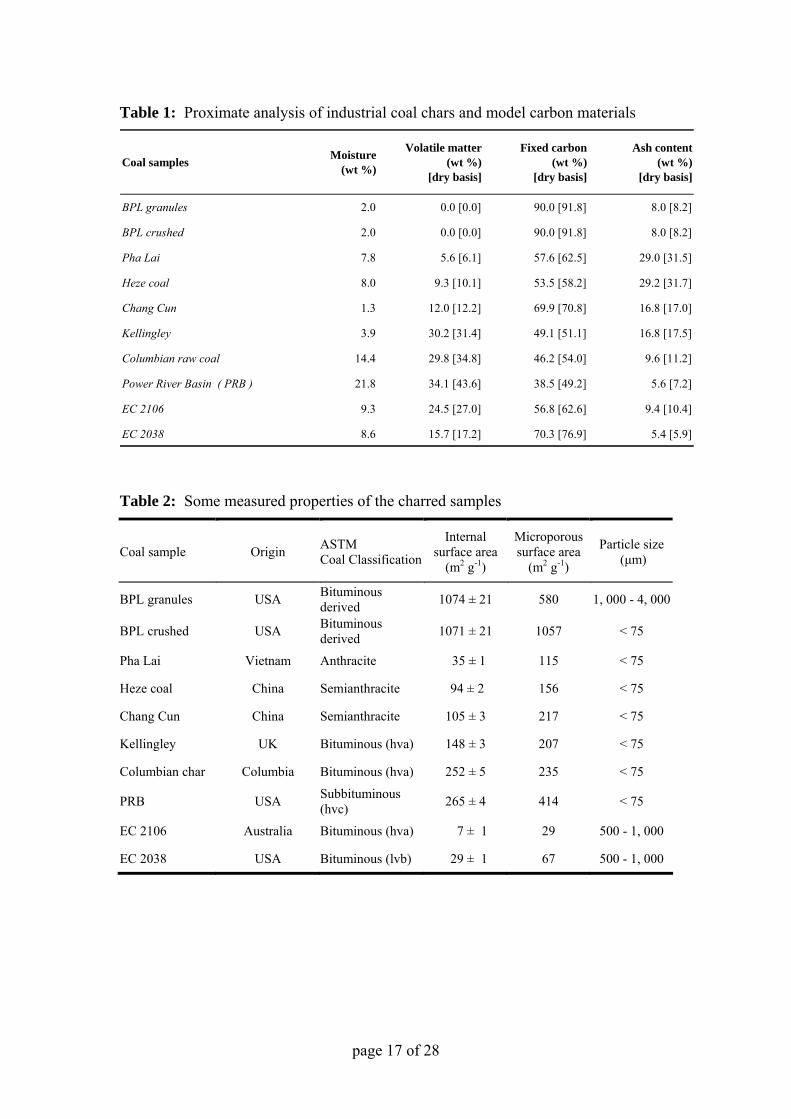
Ten different types of materials, ranging from anthracite to subbituminous coals, were selected for this study. Two of them included a commercial activated carbon, BPL, studied in two distinct particle sizes. This material is derived from bituminous coal and manufactured by Calgon Carbon Ltd (United States). It was selected as a suitable char model, in the development of the new analysis method introduced in the previous section, as it embraces all different types of coal derived chars. In fact, an activated carbon may be considered as a ‘perfect’ char, since it is highly homogeneous, has a high degree of purity and contains virtually no volatile. The selected industrial coal chars were provided by Mitsui Babcock Energy Ltd, and Corus UK Ltd. Both companies are based in the United Kingdom. The first one supplied a selection of six industrial coals, from anthracite to subbituminous, used in British power stations. These coals originate from various worldwide locations, and so are named after the seam, from which they are extracted: Pha Lai (from Vietnam), Heze (from China), Chang Cun (from china), Kellingley (from the United Kingdom), Columbian coal (from Columbia) and Power River Basin (or PRB from the United States). Corus UK Ltd, on the other hand, supplied two major coals used in the steel making industry. These two coals are denoted EC2106 (from Australia) and EC2038 (from the United States). They are both representative of the ones used in this industry, where the range is somewhat restricted to bituminous coals. A summary of properties for all these coals is given in Table 1 and Table 2.
Theory
The reaction rate for solid-gas systems is generally assumed to be a first order reaction with respect to the carbon [4, 26]:
( α )α−= 1k
dtd
(1)
The intrinsic rate constant k is given by the Arrhenius equation in terms of activation energy and pre-exponential factor:
page 7 of 28

⎟⎠⎞
⎜⎝⎛−=
RTEexpAk (2)
k = intrinsic reactivity, s–1
A = pre-exponential factor, s–1
E = activation energy, kJ mol –1
T = absolute temperature, K R = universal gas constant = 8.314x10⁻³ KJ mol –1
Equation (1) may be rewritten as
( ) ( )RT
EAdTd −−
= exp1βαα
(3)
Where, α = fractional weight conversion of carbon = 1- W/W0W = weight of dry ash-free char, mg Wo = initial weight of dry ash-free char, mg β = heating rate, °C min –1
Integration of the equation (3) is difficult, since the right hand side is not mathematically solvable in closed form (analytically). This temperature integral has no analytical solutions, and can only be approximated. A series of approximations have been derived in the literature and are still appearing [23, 27, 28]. Most of these approximations were reviewed and compared. From a detailed analysis, it emerged that the approximate function of Coats and Redfern [29] was the simplest and most accurate for modelling the kinetics of char oxidation:
( ) ( )( ) ⎥
⎥⎥
⎦
⎤
⎢⎢⎢
⎣
⎡−
≈−∫ 20 RT
ERTEexp
ERdTRT
EexpT
(4)
By integrating equation (3) and incorporating the above, a linear form of the reaction rate equation is derived as:
( )
RTE
E.R.Aln
Tlnln −⎟⎟
⎠
⎞⎜⎜⎝
⎛=⎥⎦
⎤⎢⎣⎡ −−
βα
21
(5)
Straight lines are obtained by plotting ln [ln (1- α) / T2] versus 1/T, E and A are estimated from the slope and intercept respectively. Full details on the derivation of Equation (5) and analysis of isothermal data are given in Sima-Ella and Mays [30], and also in Sima-Ella et al. [31].
Experimental methods
Chars were produced by heating 5 g of coal samples in a Carbolite CSF tube furnace, in flowing N2 (99.99 % purity) at 1 bar. The temperature was raised at a rate of 2 °C min-1 from room temperature, 20 °C to 900 °C and held at this temperature for 5 hours. This dwelling time was selected to ensure that all volatile matter had evolved.
page 8 of 28
Determination of surface area of the produced chars was performed by volumetric adsorption in a Micromeritics ASAP 2010 instrument, by nitrogen adsorption at –196 °C. Particle size distributions in each char samples were estimated using a Jeol JSM-6310 scanning electron microscope (SEM).
The oxidation of the char was performed in a Setaram TG92 thermogravimetric analyser. The sample was reacted in dry air (20 mole % O2) flowing at 16 ml [STP] min-1. Linear heating rate from 1-50 °C min were applied to raise the temperature from 20 °C to a predetermined maximum temperature. This maximum temperature was established as the limit for kinetic control regime.
page 9 of 28

4. RESULTS Activation parameters
Estimated reactivity parameters E and A are given in Table 3 and Table 4. These parameters represent the arithmetical mean value obtained from two or three samples. A standard error of the mean σ is also shown in the tables. The results are also presented in Figure 1. As can be seen in the figure, the activation energy varies with the rate of heating. Overall, the value of the activation energy decreases with increasing heating rate. This trend suggests, therefore, that strong thermal effects are in operation during the reaction process, within the kinetic control regime, disguising the true activation energy value. In addition, there is a linear relationship between the activation energy and the natural logarithm of the pre-exponential factor (referred to as the compensation effect), as revealed in Figure 2. This relationship suggests that the applied kinetic analysis has only one free parameter. In other words, discussion may only be based on the activation energy since it relates directly with the pre-exponential factor.
Optimum heating rate
Given the resulting kinetic parameters from the previous section, it was now possible to predict a weight-loss profile for the char in the kinetic control regime, using the reaction rate equation (2). An example of a simulated burnout profile is given in Figure 3, for the oxidation of EC2106 in air at 5 and at 20 °C min –1. It appeared that as the rate of heating increases, the calculated and experimental profiles become more coincident. After a threshold in the rate of heating, nevertheless, these two profiles start to diverge again. The root-mean square (RMS) σ was used as a measure of fit in comparing the simulated weight-loss curves with the experimental ones. This way, it is possible to evaluate how the fit differ from experimental data varies at each heating rate. This type of error measurement was calculated, as:
( ) ( )100
21
21
22
×
⎥⎥⎥⎥⎥⎥
⎦
⎤
⎢⎢⎢⎢⎢⎢
⎣
⎡−
+
−
=
∑∑=
=
=
=
n
n
(%)
max
i
max
i
tn
tiexp,icalc,i
Tn
Tiexp,icalc,i αααα
σ (6)
Where, α i,exp is the experimental char weight conversion (daf); α i,calc is the predicted char weight conversion(daf); and n representes the number of experimental data. Table 5 provides the RMS values obtained for the simulation of experimental data at different heating rates. These data are also plotted in Figure 4, for greater clarity. It appears that the RMS value always reaches a minimum value, for any of the coals studied. It is highly possible therefore that there exists an optimum-heating rate at which the predicted burnout profiles correspond to the experimental data. At this heating rate, true kinetic parameters are observed since they are not masked by the experimental environment. This minimum RMS value appears to always be reached at a heating rate between 20 and 50 °C min-1, for any of the chars.
page 10 of 28

Nonetheless, the optimum-heating rate may be selected as the cut-off point where the RMS value is smallest and the value of the activation energy does not change significantly. For these reasons, it emerges that the optimum-heating rate in this case is located in the range of 25 to 35 °C min-1.
Method Validation
The activation parameters were then calculated by interpolation of values at a heating rate of 20, 30 and 50 °C min-1. These values were then compared with those derived by isothermal analysis techniques and isoconversional methods. The resulting activation energy values from these existing techniques are given in Table 6. These values are also compared with those presented in the literature for similar materials in Table 7. As revealed from these tables, the optimum-heating rate analysis leads to kinetic reactivity parameters, which are in good agreement with those derived by existing kinetic analysis techniques, and those presented in the literature. Furthermore, the error margin in the optimum-heating rate analysis is very small in comparison, suggesting that this novel technique is highly accurate.
Step-ramp oxidation
As previously mentioned, a new range of thermogravimetric techniques has recently been developed. These techniques are known as sample controlled thermal analysis (SCTA), where feedback from the sample controls the temperature programme and decides whether heating or cooling of the sample should proceed. The main benefit lies in determining the reaction mechanism of a process with a higher degree of accuracy; since it is believed that SCTA methods enable the separation of close-lying or overlapping reactions. Nonetheless, the inherent disadvantage of these methods is so that kinetic parameters cannot be evaluated easily [reference].
In light of this, Sorensen [32, 33] introduced the so-called forced stepwise isothermal analysis (FSIA), where the temperature of a predetermined reaction step is maintained constant. After a maximum of 10-wt% of the material has reacted, the temperature is forced to increase 5 °C or to the temperature of the next reaction step. This way, the process takes place in a series of isothermal reaction steps combined in a single experimental run. However, the FSIA technique is designed to operate in conjunction with any existing SCTA technique, which can clearly identifies the individual reactions of a whole chemical process. Hence, the overall procedure can be time-consuming. For this reason, this work investigated the use of FSIA method, where the temperature may be raised as desired without prior knowledge of the overall reaction mechanism. Such technique may be termed ‘step-ramp oxidation’, where there is not a fixed temperature increase increment. The kinetic reactivity parameters are deduced from each isothermal steps i, so that equation (1) leads to the following:
( ) tkln i=−− α1 (7)
Plots of –ln (1-α) versus t, should therefore generate straight lines, with the slope corresponding to the reactivity ki. Then, using an Arrhenius plot of ln ki versus 1/RTi,
page 11 of 28
the activation energy E and the pre-exponential factor A are deduced from the slope and the intercept respectively. It was found that various step-ramp programmes had an effect on the accuracy of the derived reactivity parameters.
The heating rate employed between each step did not affect the overall analysis, whereas, both the duration of the isothermal step and the temperature interval between each isothermal steps, had considerable effects. These observations are summarised in Table 8, Table 9 and Table 10. The material for this investigation is granular BPL carbon, which has an activation energy value E = 122.4 ± 7.0 kJ mol-1 and pre-exponential factor ln (A / s-1) = 9.2 ± 1.1.
In order to obtain accurate reactivity parameters with this step-ramp oxidation, it was found that the weight loss during each isothermal step was to be kept below 5wt%, and the effects of mass transfer had to be accounted for. By complying with these two conditions, any temperature interval and isothermal duration can be selected. As given in Table 11, the resulting activation parameters for all the char samples correspond with those derived by the optimum-heating rate analysis.
5. DISCUSSION
Index for material comparison
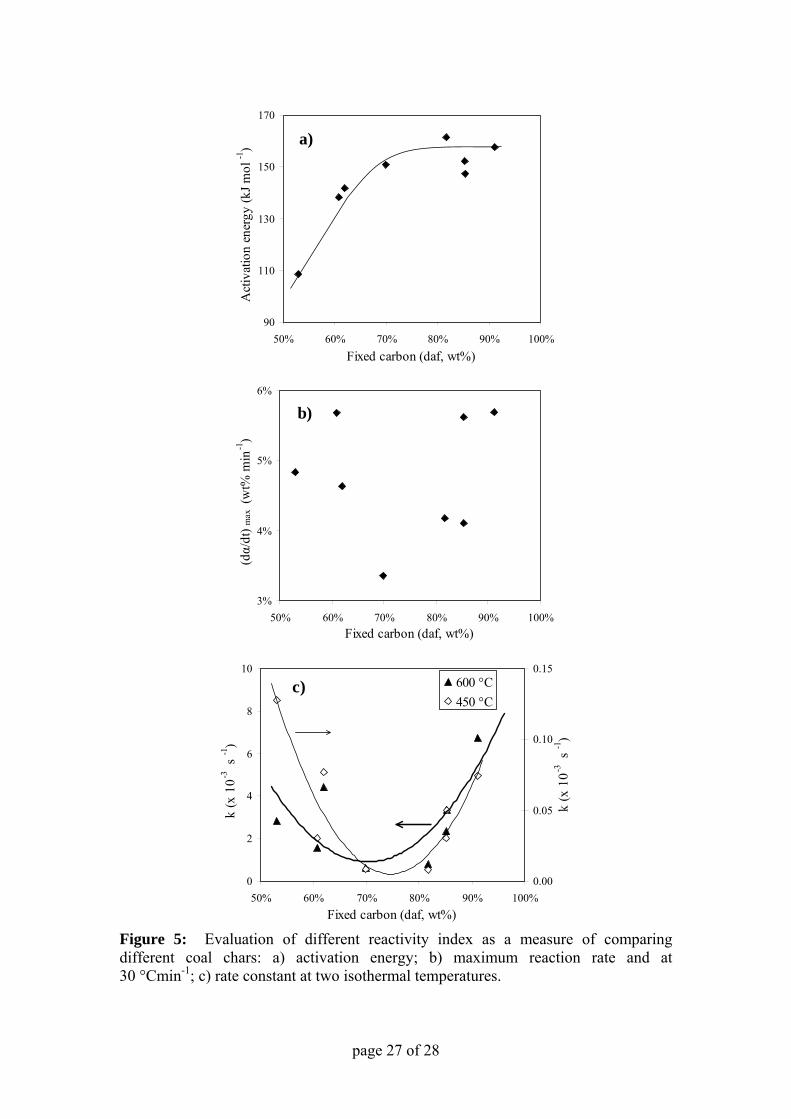
As shown in Figure 5, accurate intrinsic reactivity parameters can be used as an index for comparing materials, as opposed to the maximum reactivity or reactivity at a particular conversion. A correlation may be derived between the type of char and the activation energy; whereas, there is no obvious relationships between the maximum reaction rate and the rank of coal. In addition, a possible correlation between the rate constant k and the rank of coal may be extracted. As suggested in the figure, it is possible that a quadratic relationship exists between the change in reactivity and the rank of coal. This variation is so that, the reactivity is always minimum for coals containing between 65 – 85-wt% carbon (daf), independently of the reaction temperature.
Correlation with the structure of the material
The relationships between the activation energy and the rank of coal is strongly linked to the structure of the material. As revealed in Figure 6, there is a positive increase in the activation energy value with elemental carbon content. In fact, an ordered or graphite-like carbon structure is more difficult to break up, so that the activation energy is higher. On the other hand, there is a negative trend between activation energy and the surface area of the char.
In these cases, low surface area chars require a higher energy input to start reacting. These patterns may be explained by collision theory; where the larger the available
page 12 of 28
surface area for collisions will increase the amount of active sites with sufficient energy for the reaction to take place. Hence, the activation energy required to start the reaction is much lower.
In addition, a good linear correlation is obtained between the activation energy of the char and the elemental carbon content of the coal, for instance; as well as with both the available surface area, as shown in the figure. Such relationships are somewhat typical of carbonaceous material within the chemical control regime, as pointed out by Arenillas et al. [34]. This linear trend could therefore be used to predict the reactivity of a coal char in air.
Nonetheless, few scattered points are observed with the BET surface area variation. In fact, both the Australian char (EC2106) and the Colombian char fail to follow the linear trend for BET surface area. These two chars are from the southern hemisphere, and it is very likely that they have a large inertinite content compared with the others [35]. For this reason, the change in reactivity with surface area will differ considerably, since inertinite slows the oxidation process. However, when measuring the microporous surface area, these scattered points disappear and the correlation is more linear. These results are in agreement with findings from Alonso et al [36], who observed that the intrinsic reactivity of the chars decreases very much depends on its maceral content rather than the rank of coal. They found that inertinite rich char have a lower activation energy value than vitrinite rich high rank char; but, they do have a higher activation energy than vitrinite rich low rank char. Hence, this could explain the reason for EC2106 char having a higher activation energy value than the other bituminous coals.
Furthermore, it is clear that the precision of these kinetic parameters leads to a correlation with structural properties. Such relationships could be useful in predicting and understanding structural changes of the char during combustion processes under kinetics control regime, as suggested by many researchers [37].
Project achievements
The objectives of this work were to develop a novel thermogravimetric analysis procedure, which is quicker and more reliable than the existing techniques. The optimum-heating rate analysis is indeed, much faster than the existing TGA procedure and also provides a higher degree of accuracy than these established methods. Although the emerging SCTA techniques offer a great potential in that they are simple and accurate in principles, these procedures have underlying problems, which make them more complicated than conventional TGA techniques. It is clear therefore, that the novel TGA procedure, which identifies an optimum-heating rate, may prove to be an invaluable tool for estimating the intrinsic reactivity parameters of the oxidation of coal chars. In other words, it is an important facet of machine calibration, which provides a fast and reliable characterisation technique. These attributes offer a great potential to UK industries with regard to pulverised-fuel combustion and pulverised coal injection in blast furnaces for iron and steel-making, where fast and adequate coal characterisation is essential
page 13 of 28
6. CONCLUSIONS
• The objectives of this project have been met, in that a novel thermogravimetric procedure has been implemented, which is quicker and more reliable than the existing techniques.
• This novel method consists of identifying an optimum-heating rate, at which true activation parameters are derived. This optimum heating rate is believed to depend on the type of TGA instrument only.
• The alternative step-ramp oxidation technique is also highly accurate, yet more complex, and unstable than the optimum-heating rate analysis.
• The level of accuracy resulting from the optimum-heating rate analysis allows for a clear and simple correlation between the kinetic parameters and structural properties of the char.
• Finally, the optimum-heating rate method is an original procedure, which has never been performed before, hence offering a scope for patenting this new machine calibration method.
7. PROPOSED WORK FOR A SUBSEQUENT PROGRAMME A follow-up programme from this work could investigate a correlation between the reactivity parameters of the char and their performance in industry. It has been shown that, the level of accuracy obtained with the optimum-heating rate method enabled a clearer correlation with the structure of the materials. In the same manner, it may be possible to derive a correlation with performance indices. These indices may relate to the process efficiency, NOX emission, slagging, fouling, or corrosion. In addition, there is an opportunity for this new TGA technique to be incorporated into a routine characterisation technique for the coals available in the BCURA coal bank. This eventuality may also constitute a subsequent BCURA proposal. 8. PUBLICATIONS ARISING FROM THE PROJECT
1. Sima-Ella, E. and T. J. Mays (2005). Analysis of the oxidation reactivity of carbonaceous materials using thermogravimetric analysis. Journal of Thermal Analysis and Calorimetry 80 (1), 109-113.
2. Sima-Ella, E., G. Yuan and T. Mays (2005). A simple kinetic analysis to
determine the intrinsic reactivity of coal chars. Fuel 84 (14-15), 1920-1925.
page 14 of 28

3. Sima-Ella, E. and T. Mays (2005). Oxidation reactivity of coal chars: a simple kinetic analysis. 7th World Congress of Chemical Engineering, Glasgow, UK, CD ROM.
4. Sima-Ella, E. and T. Mays (2004). Analysis of the oxidation reactivity of an
activated carbon using thermogravimetric analysis. Book of Abstracts. 13th International Congress on Thermal Analysis and Calorimetry, Sardinia, Italy.
10. ACKNOWLEDGEMENTS This project would not have been possible without the financial support of the DTI and BCURA under project number B56. 11. REFERENCE 1. Carpenter, A.M. and N.M. Skorupska, Coal combustion analysis and testing.
Vol. 1. 1993, London: IEA Coal Research. 2. Ulloa, C., A.G. Borrego, S. Helle, A.L. Gordon, and X. Garcia, Fuel, 2005.
84(2-3): p. 247-257. 3. Williams, A., R. Backreedy, R. Habib, J.M. Jones, and M. Pourkashanian,
Fuel, 2002. 81(5): p. 605-618. 4. Smith, I.W. The combustion rates of coal chars: a review. in Nineteenth
symposium (International) on combustion. 1982. Pittsburgh. 5. Smoot, D.L. and P.J. Smith, Coal combustion and gasification. The Plenum
Chemical Engineering Series. Vol. 2. 1985, New York: Plenum Press. 6. Field, M.A., Combustion and Flame, 1969. 13(3): p. 237-252. 7. Herbig, C. and A. Jess, Fuel, 2002. 81(18): p. 2387-2395. 8. Feng, B., A. Jensen, S.K. Bhatia, and K. Dam-Johansen, Energy & Fuels,
2003. 17(2): p. 399-404. 9. Smith, I.W., Fuel, 1978. 57(7): p. 409-414. 10. Chan, M.-L., J.M. Jones, M. Pourkashanian, and A. Williams, Fuel, 1999.
78(13): p. 1539-1552. 11. Russell, N.V., T.J. Beeley, C.K. Man, J.R. Gibbins, and J. Williamson, Fuel
Processing Technology, 1998. 57(2): p. 113-130. 12. Serageldin, M.A. and W.-P. Pan. Coal decomposition: Effects of heating rate
and furnace atmosphere. in 32nd Canadian Chemical Engineering Conference. 1982. Vancouver, Canada.
13. Wendlandt, W.M., Thermal methods of analysis. Chemical analysis. Vol. 19. 1964: Interscience.
14. Zsáko, J., E. Kekedy, and C. Varhelyi. Kinetic analysis of thermogravimetric data IV: Influence of heating rate and sample weight on thermal decomposition. in 3rd ICTAC. 1971. Davos.
15. Pinheiro, G.F.M., V.L. Lourenco, and K. Iha, Journal of Thermal Analysis and Calorimetry, 2002. 67(2): p. 445-452.
16. Hatakeyama, T. and L. Zhenhai, Handbook of thermal analysis. 1998, Chichester: Wiley. 452.
17. Lester, E. and M. Cloke, Fuel, 1999. 78(14): p. 1645-1658.
page 15 of 28
18. Peralta, D., N.P. Paterson, D.R. Dugwell, and R. Kandiyoti, Fuel, 2001. 80(11): p. 1623-1634.
19. Tang, L.G., R.P. Gupta, C.D. Sheng, and T.F. Wall, Fuel, 2005. 84(2-3): p. 127-134.
20. Zolin, A., A.D. Jensen, P.A. Jensen, and K. Dam-Johansen, Fuel, 2002. 81(8): p. 1065-1075.
21. Vyazovkin, S.V. and A.I. Lesnikovich, Journal of Thermal Analysis, 1989. 35(7): p. 2169-2188.
22. Vyazovkin, S.V. and A.I. Lesnikovich, Journal of Thermal Analysis, 1990. 36(2): p. 599-615.
23. Brown, M.E., Introduction to thermal analysis: Techniques and applications. 2nd ed. Hot topics in thermal analysis and calorimetry, ed. J. Simon. 2001, London: Kluwer Academic. 264.
24. Arenillas, A., C. Pevida, F. Rubiera, and J.J. Pis, Fuel, 2003. 82(15-17): p. 2001-2006.
25. Slaoui, S. and T. Bounahmidi, Comptes Rendus Chimie, 2004. 7(5): p. 547-557.
26. Van Krevelen, D.W., Coal: typology, physics, chemistry, constitution. 3rd ed. 1993, Amsterdam: Elsevier. 979.
27. Starink, M.J., Thermochimica Acta, 2003. 404(1-2): p. 163-176. 28. Tang, W.J., Y.W. Liu, H. Zhang, and C.X. Wang, Thermochimica Acta, 2003.
408(1-2): p. 39-43. 29. Coats, A.W. and J.P. Redfern, Nature, 1964. 201: p. 68-69. 30. Sima-Ella, E. and T.J. Mays, Journal of Thermal Analysis and Calorimetry,
2005. 80(1): p. 109-113. 31. Sima-Ella, E., G. Yuan, and T. Mays, Fuel, 2005. 84(14-15): p. 1920-1925. 32. Sorensen, O.T., Journal of Thermal Analysis, 1992. 38(1-2): p. 213-228. 33. Sorensen, O.T., Journal of Thermal Analysis and Calorimetry, 2003. 72(3): p.
1075-1076. 34. Arenillas, A., F. Rubiera, C. Pevida, C.O. Ania, and J.J. Pis, Journal of
Thermal Analysis and Calorimetry, 2004. 76(2): p. 593-602. 35. Magasiner, N., C. Van Alphen, M.B. Inkson, and B.J. Misplon, International
Sugar Journal, 2002. 104(1242): p. 251. 36. Alonso, M.J.G., A.G. Borrego, D. Alvarez, and A. Menendez, Fuel Processing
Technology, 2001. 69(3): p. 257-272. 37. Chen, Q., R. He, X.C. Xu, Z.G. Liang, and C.H. Chen, Energy & Fuels, 2004.
18(5): p. 1562-1568. 38. Hecker, W.C., P.M. Madsen, M.R. Sherman, J.W. Allen, R.J. Sawaya, and
T.H. Fletcher, Energy & Fuels, 2003. 17(2): p. 427-432. 39. Lopez-Fonseca, R., I. Landa, M.A. Gutierrez-Ortiz, and J.R. Gonzalez-
Velasco, Journal of Thermal Analysis and Calorimetry, 2005. 80(1): p. 65-69. 40. Varhegyi, G., P. Szabo, E. Jakab, and F. Till, Journal of Analytical and
Applied Pyrolysis, 2001. 57(2): p. 203-222.
page 16 of 28
page 17 of 28
Table 1: Proximate analysis of industrial coal chars and model carbon materials
Coal samples Moisture (wt %)
Volatile matter (wt %)
[dry basis]
Fixed carbon (wt %)
[dry basis]
Ash content (wt %)
[dry basis]
BPL granules 2.0 0.0 [0.0] 90.0 [91.8] 8.0 [8.2]
BPL crushed 2.0 0.0 [0.0] 90.0 [91.8] 8.0 [8.2]
Pha Lai 7.8 5.6 [6.1] 57.6 [62.5] 29.0 [31.5]
Heze coal 8.0 9.3 [10.1] 53.5 [58.2] 29.2 [31.7]
Chang Cun 1.3 12.0 [12.2] 69.9 [70.8] 16.8 [17.0]
Kellingley 3.9 30.2 [31.4] 49.1 [51.1] 16.8 [17.5]
Columbian raw coal 14.4 29.8 [34.8] 46.2 [54.0] 9.6 [11.2]
Power River Basin ( PRB ) 21.8 34.1 [43.6] 38.5 [49.2] 5.6 [7.2]
EC 2106 9.3 24.5 [27.0] 56.8 [62.6] 9.4 [10.4]
EC [17.2] 70.3 [76.9] 5.4 [5.9] 2038 8.6 15.7
Table 2: Some measured properties of the charred samples
Coal sample Origin ASTM Coal Classification
Internal surface area
(m2 g-1)
Microporous surface area
(m2 g-1)
Particle size (μm)
BPL granules USA Bituminous derived 1074 ± 21 580 1, 000 - 4, 000
BPL crushed USA Bituminous derived 1071 ± 21 1057 < 75
Pha Lai Vietnam Anthracite 35 ± 1 115 < 75
Heze coal China Semianthracite 94 ± 2 156 < 75
Chang Cun China Semianthracite 105 ± 3 217 < 75
Kellingley UK Bituminous (hva) 148 ± 3 207 < 75
Columbian char Columbia Bituminous (hva) 252 ± 5 235 < 75
PRB USA Subbituminous (hvc) 265 ± 4 414 < 75
EC 2106 Australia Bituminous (hva) 7 ± 1 29 500 - 1, 000
EC 2038 USA Bituminous (lvb) 29 ± 1 67 500 - 1, 000

Table 3: Arithmetical mean activation energy values (± standard error, kJ mol –1) estimated using the proposed reactivity model
Char samples
Heating rate, (°C min –1)
BPL (granules)
BPL (powder) Pha Lai Heze Chang Cun Kellingley Columbian PRB EC2038 EC2106
1 218.2 ± 2.1 219.9 ± 2.1 175.3 ± 2.7 171.2 ± 2.2 205.9 ± 2.5 161.7 ± 0.8 202.9 ± 1.6 161.1 ± 1.6 160.1 ± 2.3 170.2 ± 1.6 5 190.6 ± 1.3 189.5 ± 2.4 167.8 ± 1.0 161.4 ± 3.0 163.6 ± 1.2 163.9 ± 1.8 158.1 ± 0.8 127.3 ± 0.5 171.1 ± 3.1 176.6 ± 1.5
10 171.8 ± 1.3 165.5 ± 2.8 170.8 ± 0.8 157.1 ± 1.6 160.7 ± 0.2 161.7 ± 0.8 151.6 ± 0.3 119.6 ± 0.2 176.3 ± 0.5 165.6 ± 1.3 15 155.6 ± 1.0 148.8 ± 2.3 168.5 ± 3.4 154.0 ± 0.8 154.2 ± 3.1 154.3 ± 0.6 149.5 ± 1.2 114.4 ± 0.5 175.5 ± 6.1 158.2 ± 0.7 20 135.9 ± 0.8 136.1 ± 2.8 163.5 ± 0.2 153.6 ± 0.7 152.1 ± 1.3 146.1 ± 0.7 148.2 ± 1.3 110.1 ± 0.7 171.9 ± 2.2 151.8 ± 1.0 30 122.9 ± 1.0 122.8 ± 1.1 156.3 ± 0.4 152.0 ± 1.7 147.0 ± 3.1 141.5 ± 0.6 135.4 ± 2.5 108.9 ± 0.5 160.9 ± 2.6 151.4 ± 0.1 50 92.6 ± 0.6 102.8 ± 3.3 151.3 ± 0.9 149.9 ± 4.2 139.2 ± 3.8 134.1 ± 0.5 133.2 ± 5.0 104.3 ± 1.0 143.3 ± 7.4 145.63 ± 0.1
Page 18 of 29

Table 4 Arithmetical mean of the natural logarithm of the pre-exponential factor (± standard error) estimated using the proposed reactivity model
Char samples
Heating rate, (°C min –1)
BPL (granules)
BPL (powder) Pha Lai Heze Chang Cun Kellingley Columbian PRB EC2038 EC2106
1 24.9 ± 0.0 25.2 ± 0.0 19.4 ± 0.0 18.8 ± 0.0 25.2 ± 0.0 18.2 ± 0.0 24.5 ± 0.0 18.4 ± 0.0 15.5 ± 0.0 17.6 ± 0.0 5 20.0 ± 0.0 19.9 ± 0.4 17.9 ± 0.1 17.1 ± 0.5 17.7 ± 0.2 18.1 ± 0.3 16.5 ± 0.0 12.3 ± 0.1 17.2 ± 0.5 18.5 ± 0.6
10 17.0 ± 0.0 16.0 ± 0.4 18.3 ± 0.2 16.1 ± 0.2 17.1 ± 0.0 17.4 ± 0.2 15.1 ± 0.0 10.9 ± 0.0 176.9 ± 0.1 16.2 ± 0.5 15 14.3 ± 0.0 13.4± 0.4 17.6 ± 0.5 15.3 ± 0.2 15.8 ± 0.5 16.2 ± 0.1 14.5 ± 4.2 10.0 ± 0.1 17.4 ± 0.9 14.7 ± 0.3 20 11.3 ± 0.0 11.5 ± 0.4 16.6 ± 0.0 15.2 ± 0.0 15.4 ± 0.2 14.9 ± 0.0 14.3 ± 0.2 9.3 ± 0.1 16.8 ± 0.3 13.8 ± 0.4 30 9.3 ± 0.4 9.4 ± 0.2 15.4 ± 0.1 14.9 ± 0.2 14.6 ± 0.4 14.0 ± 0.1 12.1 ± 0.4 9.1 ± 0.1 15.0 ± 0.4 13.4 ± 0.1 50 4.8 ± 0.0 6.4 ± 0.5 14.6 ± 0.2 14.6 ± 0.6 13.3 ± 0.6 12.7 ± 0.1 11.7 ± 0.8 8.4 ± 0.2 12.3 ± 1.2 12.6 ± 0.0
Page 19 of 29

Table 5: Root mean square (RMS) values in the fit of the calculated thermogravimetric profiles with the experimental data at various heating rates
Char samples Heating rate,
–1(°C min ) BPL BPL Pha Lai Heze Chang Cun Kellingley Columbian PRB EC2038 EC2106 (granules) (powder)
1 1.78% 1.84% 4.50% 3.48% 3.48% 2.01% 2.50% 2.42% 4.32% 3.52%
5 1.28% 1.20% 1.03% 1.83% 0.68% 0.78% 0.94% 0.70% 0.50% 0.52%
10 0.89% 0.33% 0.58% 0.93% 0.22% 0.20% 0.43% 0.81% 0.26% 0.22%
15 0.68% 0.11% 0.29% 0.54% 0.14% 0.21% 0.29% 0.61% 0.06% 0.08%
20 0.25% 0.08% 0.22% 0.25% 0.08% 0.20% 0.21% 0.60% 0.03% 0.04%
30 0.09% 0.07% 0.08% 0.15% 0.06% 0.06% 0.07% 0.35% 0.02% 0.03%
50 0.16% 0.12% 0.10% 0.19% 0.06% 0.09% 0.10% 0.42% 0.02% 0.04%
Page 20 of 29
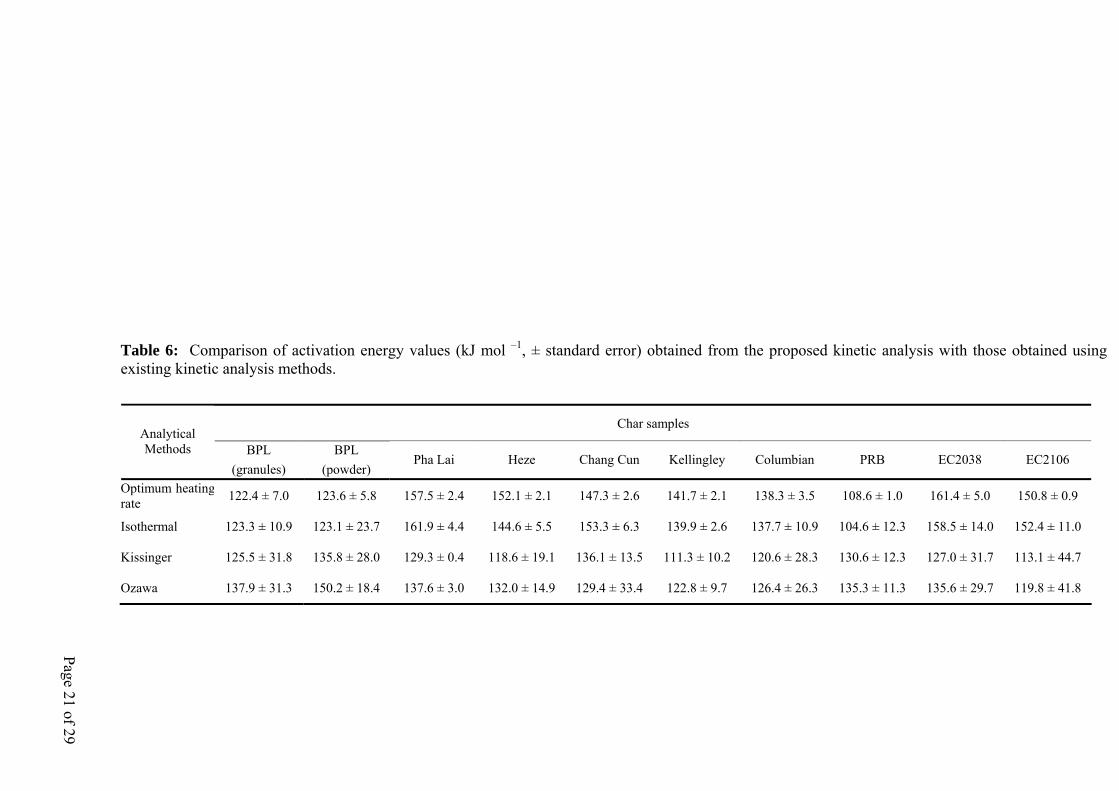
Table 6: Comparison of activation energy values (kJ mol –1, ± standard error) obtained from the proposed kinetic analysis with those obtained using existing kinetic analysis methods.
Char samples
BPL BPL Analytical Methods
(granules) (powder) Pha Lai Heze Chang Cun Kellingley Columbian PRB EC2038 EC2106
Optimum heating rate 122.4 ± 7.0 123.6 ± 5.8 157.5 ± 2.4 152.1 ± 2.1 147.3 ± 2.6 141.7 ± 2.1 138.3 ± 3.5 108.6 ± 1.0 161.4 ± 5.0 150.8 ± 0.9
Isothermal 123.3 ± 10.9 123.1 ± 23.7 161.9 ± 4.4 144.6 ± 5.5 153.3 ± 6.3 139.9 ± 2.6 137.7 ± 10.9 104.6 ± 12.3 158.5 ± 14.0 152.4 ± 11.0
Kissinger 125.5 ± 31.8 135.8 ± 28.0 129.3 ± 0.4 118.6 ± 19.1 136.1 ± 13.5 111.3 ± 10.2 120.6 ± 28.3 130.6 ± 12.3 127.0 ± 31.7 113.1 ± 44.7
Ozawa 137.9 ± 31.3 150.2 ± 18.4 137.6 ± 3.0 132.0 ± 14.9 129.4 ± 33.4 122.8 ± 9.7 126.4 ± 26.3 135.3 ± 11.3 119.8 ± 41.8 135.6 ± 29.7
Page 21 of 29
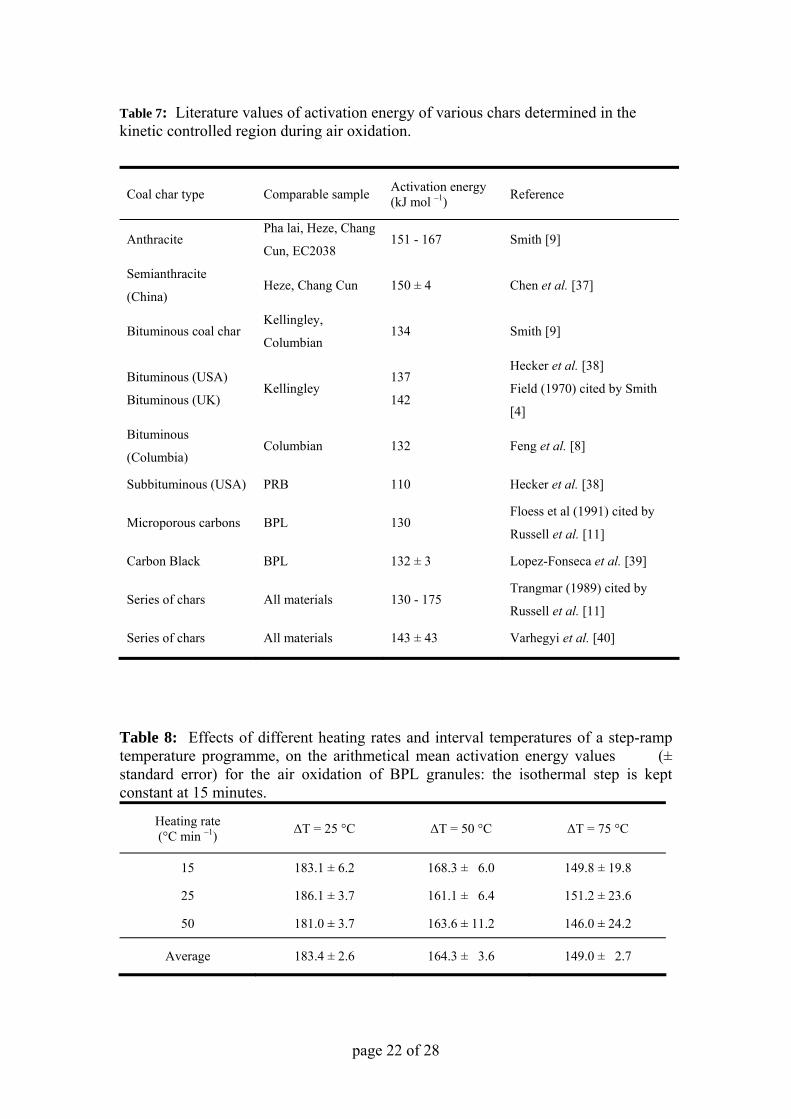
Table 7: Literature values of activation energy of various chars determined in the kinetic controlled region during air oxidation.
Activation energy (kJ mol Coal char type Comparable sample Reference –1)
Pha lai, Heze, Chang
Cun, EC2038 Anthracite 151 - 167 Smith [9]
Semianthracite
(China) Chen et al. [37] Heze, Chang Cun 150 ± 4
Kellingley,
Columbian 134 Smith [9] Bituminous coal char
Hecker et al. [38] Bituminous (USA) 137
Kellingley Field (1970) cited by Smith
[4] Bituminous (UK) 142
Bituminous
(Columbia) Feng et al. [8] Columbian 132
Hecker et al. [38] Subbituminous (USA) PRB 110
Floess et al (1991) cited by
Russell et al. [11] Microporous carbons BPL 130
Lopez-Fonseca et al. [39] Carbon Black BPL 132 ± 3
Trangmar (1989) cited by
Russell et al. [11] Series of chars All materials 130 - 175
Varhegyi et al. [40] Series of chars All materials 143 ± 43
Table 8: Effects of different heating rates and interval temperatures of a step-ramp temperature programme, on the arithmetical mean activation energy values (± standard error) for the air oxidation of BPL granules: the isothermal step is kept constant at 15 minutes.
Heating rate ΔT = 25 °C ΔT = 50 °C ΔT = 75 °C –1(°C min )
15 183.1 ± 6.2 168.3 ± 6.0 149.8 ± 19.8
25 186.1 ± 3.7 161.1 ± 6.4 151.2 ± 23.6
50 181.0 ± 3.7 163.6 ± 11.2 146.0 ± 24.2
Average 183.4 ± 2.6 164.3 ± 3.6 149.0 ± 2.7
page 22 of 28
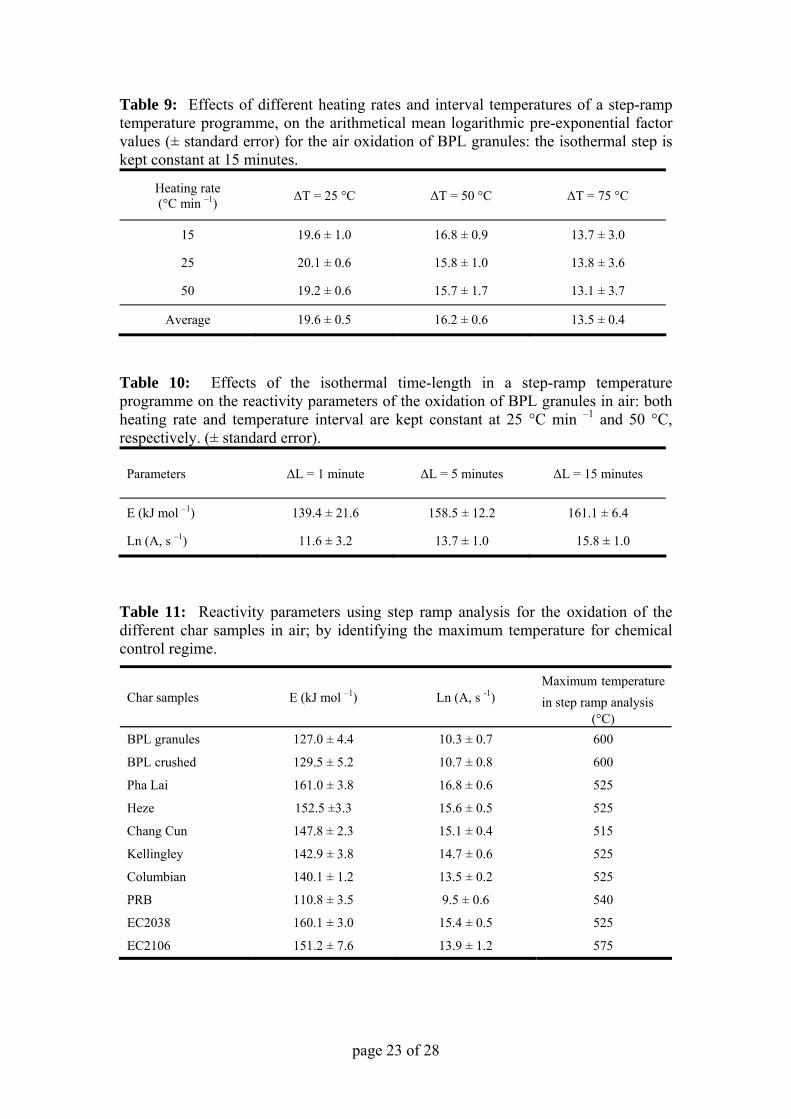
Table 9: Effects of different heating rates and interval temperatures of a step-ramp temperature programme, on the arithmetical mean logarithmic pre-exponential factor values (± standard error) for the air oxidation of BPL granules: the isothermal step is kept constant at 15 minutes.
Heating rate ΔT = 25 °C ΔT = 50 °C ΔT = 75 °C –1(°C min )
15 19.6 ± 1.0 16.8 ± 0.9 13.7 ± 3.0
25 20.1 ± 0.6 15.8 ± 1.0 13.8 ± 3.6
50 19.2 ± 0.6 15.7 ± 1.7 13.1 ± 3.7
Average 19.6 ± 0.5 16.2 ± 0.6 13.5 ± 0.4
Table 10: Effects of the isothermal time-length in a step-ramp temperature programme on the reactivity parameters of the oxidation of BPL granules in air: both heating rate and temperature interval are kept constant at 25 °C min –1 and 50 °C, respectively. (± standard error).
Parameters ΔL = 1 minute ΔL = 5 minutes ΔL = 15 minutes
–1E (kJ mol ) 139.4 ± 21.6 158.5 ± 12.2 161.1 ± 6.4
–1Ln (A, s ) 11.6 ± 3.2 13.7 ± 1.0 15.8 ± 1.0
Table 11: Reactivity parameters using step ramp analysis for the oxidation of the different char samples in air; by identifying the maximum temperature for chemical control regime.
Char samples E (kJ mol –1) Ln (A, s Maximum temperature in step ramp analysis
-1) (°C)
10.3 ± 0.7 BPL granules 127.0 ± 4.4 600
129.5 ± 5.2 10.7 ± 0.8 BPL crushed 600
161.0 ± 3.8 16.8 ± 0.6 525 Pha Lai
Heze 152.5 ±3.3 15.6 ± 0.5 525
147.8 ± 2.3 15.1 ± 0.4 515 Chang Cun
142.9 ± 3.8 14.7 ± 0.6 525 Kellingley
140.1 ± 1.2 13.5 ± 0.2 525 Columbian
110.8 ± 3.5 9.5 ± 0.6 540 PRB
160.1 ± 3.0 15.4 ± 0.5 525 EC2038
151.2 ± 7.6 13.9 ± 1.2 575 EC2106
page 23 of 28

80
100
120
140
160
180
200
220
0 10 20 30 40 50 6
Heating rate ( °C min -1)
Act
ivat
ion
ener
gy (k
J mol
-1 )
0
BPL granules BPL powderPha Lai HezeChang Cun KellingleyColumbian PRBEC2038 EC2106
Figure 1: Variation of activation energy values with heating rate upon oxidation in air of the different chars.
0
5
10
15
20
25
80 100 120 140 160 180 200 220
Activation energy (kJ mol -1)
Ln (A
, s -1
)
BPL granules BPL powderPha Lai HezeChang Cun KellingleyColumbian PRBEC2038 EC2106
Figure 2: Correlation between activation energy of the char and the pre-exponential factor at different heating rates.
page 24 of 28

0.50
0.60
0.70
0.80
0.90
1.00
460 500 540 580
Temperature (˚C)
(1-α
)
c)a)
0.94
0.95
0.96
0.97
0.98
0.99
1.00
480 500 520 540 560 580
Temperature (˚C)
(1-α
)
c)b)
0.98
0.99
1.00
460 480 500 520 540 560 580
Temperature (˚C)
(1-α
)
c)
Figure 3: Comparison between experimental (■) and simulated (□) burnout profiles during the oxidation in air of EC2106 char at: a) 5 °C min –1; b) 20 °C min –1 and; c) 50 °C min –1
page 25 of 28

0%
1%
2%
3%
4%
5%
0 10 20 30 40 50 60
Heating rate ( °C min -1)
Stan
dard
erro
r in
fit
BPL granules BPL powderPha Lai HezeChang Cun KellingleyColumbian PRBEC2038 EC2106
a)
0.0%
0.1%
0.2%
0.3%
15 20 25 30 35 40 45 50 55
Heating rate ( °C min -1)
Stan
dard
erro
r in
fit
0.0%
0.2%
0.4%
0.6%
0.8%
Stan
dard
erro
r in
fit (P
RB
cha
r)
BPL granules BPL powderPha Lai HezeChang Cun KellingleyColumbian EC2038EC2106 PRB
b)
Figure 4: Variation of standard error with heating rate, in the fit of burnout profiles between the simulated and the experimental data for all the chars: a) overall view; b) enlarged view.
page 26 of 28
90
110
130
150
170
50% 60% 70% 80% 90% 100%Fixed carbon (daf, wt%)
Act
ivat
ion
ener
gy (k
J mol
-1) a)
3%
4%
5%
6%
50% 60% 70% 80% 90% 100%Fixed carbon (daf, wt%)
(dα/
dt) m
ax (
wt%
min
-1)
b)
0
2
4
6
8
10
50% 60% 70% 80% 90% 100%Fixed carbon (daf, wt%)
k (x
10 -3
s -1
)
0.00
0.05
0.10
0.15
k (x
10 -3
s -1
)
600 °C450 °C
c)
Figure 5: Evaluation of different reactivity index as a measure of comparing different coal chars: a) activation energy; b) maximum reaction rate and at 30 °Cmin-1; c) rate constant at two isothermal temperatures.
page 27 of 28

90
100
110
120
130
140
150
160
170
75% 80% 85% 90% 95% 100%
Elemental carbon (daf, wt%)
Act
ivat
ion
ener
gy (k
J m
ol -1
) a)
90
110
130
150
170
0 50 100 150 200 250 300
BET surface area (m 2 g -1)
Act
ivat
ion
ener
gy (k
J m
ol -1
)
b)
90
110
130
150
170
0 100 200 300 400 500
Microporous surface area (m 2 g-1)
Act
ivat
ion
ener
gy (k
J mol
-1)
c)
Figure 6: Relation between activation energy during oxidation in air and the structural properties of the char: a) elemental carbon content; b) available surface area; c) microporous surface area.
page 28 of 28