UNIVERSITA' DEGLI STUDI DI PAVIA · UNIVERSITA' DEGLI STUDI DI PAVIA Facoltà di Ingegneria...
105
Transcript of UNIVERSITA' DEGLI STUDI DI PAVIA · UNIVERSITA' DEGLI STUDI DI PAVIA Facoltà di Ingegneria...

UNIVERSITA' DEGLI STUDI DI PAVIA
Facoltà di Ingegneria
Dottorato di Ricerca inIngegneria Elettronica, Informatica ed Elettrica
XXIX CICLO
Solid-State Lasers for
High Spectral Resolution Lidar Applications
Advisor
Prof. A. Agnesi
Ph.D. Thesis of
Paolo Farinello
Academic Year 2015-2016

Winds in the eastMist coming in
Like something is brewingAbout to begin
Can't put me ngerOn what lies in store
But I feel what's to happenAll happened before.
Saving Mr. Banks, 2013

Introduction
Since the rst successful human spaceights in the early 1960s, the eld ofspace exploration became rapidly popular and ended up involving diversebranches of scientic research. As a matter of fact, laser instruments startedto play crucial roles, vital to the success of the missions to which they arecommitted. Currently, several examples could be adduced to prove their im-portance towards spaceborne applications. Only recently (2013), the successof the 30-days Lunar Laser Communication Demonstration (LLCD) mis-sion made history, by using a pulsed laser beam to transmit data over the385000 km between the Moon and Earth at a record-breaking downloadrate of 622 Mbps, eectively representing NASA's rst system for two-waycommunication using a laser instead of radio waves. Even more substantialopportunities of employment are oered to lasers by the eld of atmosphericsensing by means of lidar devices. The possibility to install laser systemsaboard shuttles and satellites is nowadays well known, thanks to the experi-ence earned from past lidar space projects. Of great emphasis is CALIPSO(Cloud-Aerosol Lidar and Infrared Pathnder Satellite Observation) 10-yearscelebration of cloud observations from space, with its more than 5.7 billionlidar measurements (updated to June 2016).
The challenge of taking a laser to the space environment is by itself ar-duous and demanding. The extremely harsh conditions encountered duringspace missions deal with mechanical (e.g. severe vibrations experienced in thelaunch phase) as well as thermal (e.g. huge temperature excursions, lack ofair cooling) issues. Moreover, the levels of radiation are substantially higherin vacuum than on ground. As a consequence, the components making upthe system should not only be produced in a particular way, they also have tobe tested in accordance to very strict standards in order to become qualiedfor space, leading to much higher costs with respect to commercial versionsof the same element.
Equipment qualication for spaceborne activities adds up to other re-quirements on the laser instrument, more closely related to the particularscientic application involved. In these regards, the solid-state Master Oscil-

4
lator Power Amplier (MOPA) architecture oers the unique versatility toachieve excellent spectral and spatial quality, while allowing to reach highpulse-energy levels. Thanks to the decoupling of performance aspects (at-tributed to the seeder) from the generation of high powers (associated insteadwith the amplier), it is possible to deal independently with the two prob-lems. Hence, as soon as a higher degree of spectral purity is needed, theadoption of a seeder capable to generate longer pulses (e.g. by means of gainswitching) is preferable; on the other hand, in case short pulse durations area major concern, a Q-switched based oscillator can be selected.
The focus of this work are single-frequency, solid-state laser sources, forapplications to spaceborne lidar instruments and to non-linear optics tech-niques, aimed at the extension of the spectral coverage oered by traditionalbulk devices. During the course of my PhD I had in particular the oppor-tunity to cooperate with Bright Solutions Srl for the development of a novellaser system intended for a High Spectral Resolution Lidar (HSRL). I alsoperformed non-linear optics experiments aimed at the identication of newcrystals suitable for frequency conversion by means of Stimulated RamanScattering (SRS). The thesis is organized as follows:
• Chapter 1 presents an overview of lidar systems, going through somehistorical notes summarizing the evolution of lidar technology, nallypointing out the motivations of HSRL;
• Chapter 2 contains a detailed description of the laser oscillator em-ployed to produce stable, single-frequency, narrow bandwidth pulsesfor HSRL applications;
• Chapter 3 introduces the rst stage of the amplication chain, referredto as pre-amplier, seeded by the train of pulses generated by the laseroscillator of chapter 2;
• Chapter 4 describes the power amplier used to increase the pulse en-ergy to the level requested by HSRL;
• Chapter 5 deals with Raman lasers and focuses on the behavior ofstrontium tungstate (SrWO4) crystalline medium.
Abstract
A solid-state laser delivering single-longitudinal-mode (SLM), narrow band-width, high energy pulses, at 1064 nm and 532 nm, is fully characterizedin terms of power, spatial, temporal and spectral performance. The laseris intended for spaceborne high spectral resolution lidar (HSRL) applica-tions, aiming at the discrimination between molecules and particulate mat-ter, through analysis of the spectral broadening induced into the backscat-tered radiation. The motivations for HSRL are thus presented, after thefundamental principles governing standard lidar techniques have been in-troduced. The laser prototype has been designed and assembled in BrightSolutions Srl with the help of the Laser Source Laboratory (LSL) of Univer-sità degli Studi di Pavia, in the framework of an international project alsoinvolving Consorzio Nazionale Interuniversitario per le Scienze siche dellaMateria (CNISM), Università degli Studi di Napoli Federico II, Universitàdegli Studi dell'Aquila, Advanced Lidar Applications Srl (ALA) and BeijingResearch Institute of Telemetry (BRIT).
The laser system exploits a master oscillator power amplier (MOPA) ar-chitecture, in order to secure both spectral purity and pulse energy requiredby HSRL. Its layout comprises three main parts, namely the laser oscillator, apre-amplier system and the power amplier. Each part is independently ad-dressed in dierent chapters of this work. First, a novel seeder based on gainswitching operation of a microchip cavity is presented. The key parametersgoverning spectral tuning of the laser wavelength are investigated in details,while the reader is also made aware of the typical trends associated withslope eciencies and pulse durations. Experimental results and theoreticalpredictions are thoroughly discussed, in order to understand the advantagesoered by the gain switching technique and to devise suggestions to overcomeits major limitations. The pre-amplier is thereafter introduced. Both CWand pulsed amplications mechanisms are considered, in combination withend-pump and side-pump geometries. In these regards, particular attentionis dedicated to the grazing incidence conguration, adopted for the pulsedampliers based on crystal slabs. Each stage of the amplication chain is

6
completely characterized, with the help of experimental measurements, the-oretical analysis and descriptions of the setup. The spectral bandwidth andstability of the laser pulses are at this point examined, taking advantage ofthe energy boost granted to the amplied beam. Two interferometric tech-niques with increasing accuracy are considered: in the rst case, the fringesproduced by 532 nm radiation traveling through a xed etalon, later recordedby a CCD camera, are used to estimate the laser spectral properties with aresolution on the order of hundreds of MHz; on the other hand, a scan-ning Fabry-Perot interferometer having accuracy < 10 MHz at 1064 nm isemployed. The power amplier, developed in agreement with total inter-nal reection face pumped laser geometry, is nally discussed. The outputpower values at 1064 nm and 532 nm wavelengths are given and some issuesconcerning operation of the laser device in vacuum are investigated.
Solid-state laser sources producing high brightness beams, with a highdegree of spectral purity, nd several applications in the eld of non-linearoptics too. In these regards, systems delivering short pulses, with timescaleson the order of sub-nanosecond to picoseconds, oer more practical benetsand are commonly employed to pump other Raman lasers. The possibilityto extend the spectral coverage of traditional solid-state devices by means ofthe stimulated Raman scattering (SRS) eect is particularly attractive, witha resulting increasing interest in the research of new cristalline media to beemployed with this purpose. In this framework, the behavior of a strontiumtungstate (SrWO4) sample is examined under dierent pumping conditions,in terms of both temporal regime and emission wavelength. The crystalspectral and thermo-mechanical properties are compared to those oeredby other available solid-state media for SRS, in order to identify low-cost,versatile alternatives to the state-of-the-art materials (e.g. diamond) appliedto solid-state Raman lasers. Raman scattering measurements carried out onSrWO4 are illustrated in details, as the properties of the Raman shifted beamare interpreted with the help of theoretical proofs.

Contents
Introduction 4
Abstract 6
1 LIDAR 13
1.1 History . . . . . . . . . . . . . . . . . . . . . . . . . . . . . . . 13
1.2 Operating Principle . . . . . . . . . . . . . . . . . . . . . . . . 15
1.3 Applications . . . . . . . . . . . . . . . . . . . . . . . . . . . . 19
1.4 High Spectral Resolution Lidar . . . . . . . . . . . . . . . . . 20
2 The Laser Oscillator 23
2.1 Gain Switching . . . . . . . . . . . . . . . . . . . . . . . . . . 23
2.2 Microchip Lasers . . . . . . . . . . . . . . . . . . . . . . . . . 28
2.3 Experimental Results . . . . . . . . . . . . . . . . . . . . . . . 32
2.4 Lessons Learned . . . . . . . . . . . . . . . . . . . . . . . . . . 39
3 The Pre-Amplier System 43
3.1 CW Amplication . . . . . . . . . . . . . . . . . . . . . . . . . 43
3.2 Pulsed Amplication . . . . . . . . . . . . . . . . . . . . . . . 46
3.3 Experimental Results . . . . . . . . . . . . . . . . . . . . . . . 48
3.3.1 CW pumped pre-amplier . . . . . . . . . . . . . . . . 48
3.3.2 Pulsed pre-amplier . . . . . . . . . . . . . . . . . . . 52
3.3.3 Laser linewidth measurements . . . . . . . . . . . . . . 55
3.4 Lessons Learned . . . . . . . . . . . . . . . . . . . . . . . . . . 61
4 The Power Amplier 63
4.1 Introduction to zigzag slab geometry . . . . . . . . . . . . . . 63
4.2 Second harmonic generation . . . . . . . . . . . . . . . . . . . 65
4.3 Experimental results . . . . . . . . . . . . . . . . . . . . . . . 67
4.4 The laser for HSRL . . . . . . . . . . . . . . . . . . . . . . . . 71
7

8 CONTENTS
5 Solid-State Raman Lasers 75
5.1 Stimulated Raman Scattering . . . . . . . . . . . . . . . . . . 755.1.1 Steady-state and transient SRS . . . . . . . . . . . . . 775.1.2 Spatial characteristics . . . . . . . . . . . . . . . . . . 78
5.2 Crystalline media for SRS . . . . . . . . . . . . . . . . . . . . 805.3 Experimental results . . . . . . . . . . . . . . . . . . . . . . . 82
5.3.1 SrWO4 crystal . . . . . . . . . . . . . . . . . . . . . . . 835.3.2 The pump sources . . . . . . . . . . . . . . . . . . . . 845.3.3 Results and discussion . . . . . . . . . . . . . . . . . . 86
Conclusions 93
Acknowledgements 95
List of Publications 97
Bibliography 99

List of Figures
1.1 Lidar milestones . . . . . . . . . . . . . . . . . . . . . . . . . . 141.2 Lidar setup . . . . . . . . . . . . . . . . . . . . . . . . . . . . 151.3 Doppler broadening . . . . . . . . . . . . . . . . . . . . . . . . 21
2.1 Steady-state solution . . . . . . . . . . . . . . . . . . . . . . . 242.2 Transient solution . . . . . . . . . . . . . . . . . . . . . . . . . 252.3 Relaxation oscillations . . . . . . . . . . . . . . . . . . . . . . 272.4 Microchip cavity . . . . . . . . . . . . . . . . . . . . . . . . . 292.5 Single-longitudinal-mode microchip . . . . . . . . . . . . . . . 302.6 Gain-related index guiding . . . . . . . . . . . . . . . . . . . . 322.7 Experimental setup . . . . . . . . . . . . . . . . . . . . . . . . 322.8 Microchip output power . . . . . . . . . . . . . . . . . . . . . 332.9 Microchip pulse duration . . . . . . . . . . . . . . . . . . . . . 342.10 Microchip spatial beam quality . . . . . . . . . . . . . . . . . 352.11 Microchip short term stability . . . . . . . . . . . . . . . . . . 362.12 Microchip performance vs pump pulse duration . . . . . . . . 362.13 Microchip spectra . . . . . . . . . . . . . . . . . . . . . . . . . 372.14 Microchip spectral tuning with temperature . . . . . . . . . . 382.15 Fluorescence spectra of Nd:YVO4 and Nd:YAG . . . . . . . . 39
3.1 Gain-extraction trade-o . . . . . . . . . . . . . . . . . . . . . 453.2 ASE . . . . . . . . . . . . . . . . . . . . . . . . . . . . . . . . 463.3 Pre-amplier spectral analysis . . . . . . . . . . . . . . . . . . 483.4 CW pumped pre-amplier setup . . . . . . . . . . . . . . . . . 493.5 Double-pass CW pumped pre-amplier . . . . . . . . . . . . . 503.6 Pre-amplier Beam Quality . . . . . . . . . . . . . . . . . . . 513.7 Second harmonic conversion eciency . . . . . . . . . . . . . . 523.8 Pulsed pre-amplier setup . . . . . . . . . . . . . . . . . . . . 533.9 Grazing incidence geometry . . . . . . . . . . . . . . . . . . . 543.10 Grazing incidence amplication . . . . . . . . . . . . . . . . . 543.11 Etalon setup . . . . . . . . . . . . . . . . . . . . . . . . . . . . 55
9
10 LIST OF FIGURES
3.12 Etalon interference fringes . . . . . . . . . . . . . . . . . . . . 563.13 Cut of the etalon fringes . . . . . . . . . . . . . . . . . . . . . 573.14 Scanning Fabry-Perot calibration . . . . . . . . . . . . . . . . 583.15 Scanning Fabry-Perot spectrum . . . . . . . . . . . . . . . . . 583.16 Microchip linewidth . . . . . . . . . . . . . . . . . . . . . . . . 593.17 Microchip spectral stability - no heater . . . . . . . . . . . . . 603.18 Microchip spectral stability - with heater . . . . . . . . . . . . 603.19 Microchip spectral stability - WS7 . . . . . . . . . . . . . . . . 61
4.1 Zigzag slab geometry . . . . . . . . . . . . . . . . . . . . . . . 644.2 Second harmonic - low eciency . . . . . . . . . . . . . . . . . 674.3 Power amplier setup . . . . . . . . . . . . . . . . . . . . . . . 684.4 Design of the input beam dimensions . . . . . . . . . . . . . . 684.5 Pump emission spectrum . . . . . . . . . . . . . . . . . . . . . 694.6 Amplier performance . . . . . . . . . . . . . . . . . . . . . . 704.7 Second harmonic conversion . . . . . . . . . . . . . . . . . . . 714.8 Laser prototype . . . . . . . . . . . . . . . . . . . . . . . . . . 72
5.1 Stimulated Raman scattering . . . . . . . . . . . . . . . . . . 765.2 SrWO4 refractive indexes . . . . . . . . . . . . . . . . . . . . . 835.3 Pump setup for steady-state SRS experiments . . . . . . . . . 855.4 Pump setup for transient SRS experiments . . . . . . . . . . . 865.5 Steady-state SRS conversion eciency . . . . . . . . . . . . . 875.6 Steady-state Stokes beam quality . . . . . . . . . . . . . . . . 885.7 Steady-state SRS spectral behavior . . . . . . . . . . . . . . . 895.8 Transient SRS conversion eciency . . . . . . . . . . . . . . . 905.9 Transient SRS spectral behavior . . . . . . . . . . . . . . . . . 91

List of Tables
2.1 Single-longitudinal-mode microchips . . . . . . . . . . . . . . . 292.2 Absolute frequency dependence on temperature . . . . . . . . 31
3.1 Pulsed pre-amplier performance . . . . . . . . . . . . . . . . 543.2 ASE . . . . . . . . . . . . . . . . . . . . . . . . . . . . . . . . 61
4.1 Laser specications . . . . . . . . . . . . . . . . . . . . . . . . 71
5.1 List of SRS active crystals . . . . . . . . . . . . . . . . . . . . 81
11

12 LIST OF TABLES

Chapter 1
LIDAR
The word lidar (LIght Detection And Ranging) refers to a technique involv-ing illumination of a target and subsequent observation of the backscatteredlight in order to retrieve information about its properties. Thanks to thevariety of interaction processes between the emitted radiation and the atmo-spheric constituents, lidar was naturally employed in atmospheric researches,where it allowed the determination of basic variables of state (temperature,pressure, humidity), measurements of concentration levels of trace gases andaerosols, monitoring of meteorological phenomena (hurricanes, frontal pas-sage, mountain lee waves), thus largely contributing to our knowledge of theEarth's atmosphere in the past decades.
The main issues concerning lidar model and implementation are discussedin the following chapter. An overview of its basic applications is also pre-sented, paying particular attention to high spectral resolution lidar devices,being at the same time the motivation and goal of a large part of the workreported in this thesis.
1.1 History
The introduction of the lidar principle dates back to pre-laser time. In 1930E. H. Synge proposed to study the density of the upper atmosphere usingsearchlight beams [48]. In 1938 light pulses generated by means of electricsparks or ashlamps were employed in the measurements of clouds height.The word lidar itself was introduced for the rst time by Middleton andSpilhaus in 1953 [36] in the context of meteorological instruments, althoughwithout directly implying what it could be the acronym of. After that, theadvent of laser systems fostered a rapid development in lidar technology. In1963 Fiocco and Smullin [20] published atmospheric observation with a ruby

14 CHAPTER 1. LIDAR
laser and in the following decade all basic lidar techniques were suggestedand demonstrated. The possibility to meet high requirements regarding pulseenergy, wavelength, beam shape, pulse width and spectral purity promotedthe development of brand-new custom laser devices, thus making lidar botha source and a beneciary of technological innovation.
The success experienced by lidar systems encouraged scientists in puttinga great deal of eort towards the realization of devices capable to y onaircrafts, allowing one to perform measurements over larger areas or areasnot easy/practical to access, instead of the ground-based counterparts. Therst downlooking airborne lidar was built by Stanford Research Institute andown in 1969 with the purpose of making lower tropospheric aerosol measure-ments during the Barbados Oceanographic and Meteorological Experiment[51]. It was followed by an uplooking system built by Langley Research Center(LaRC), making aerosol prole measurements to validate the satellite Earth-orbiting mission called the Stratospheric Aerosol Measurement-II (SAM II)out of Sondrestrom, Greenland, in November 1978. The main dierence be-tween downlooking and uplooking lidars is given by the possibility, in therst case, to compensate for the inverse-range squared decrease (equation1.7) in backscattered signal with the increased backscattering granted by thegreater atmospheric density with increasing range. After that the rst lidarconceived for high-altitude operation was the Cloud Lidar System (CLS),built by NASA Goddard Space Flight Center (GSFC) and own aboard theWB-57 aircraft in 1979. The experience gained from this project, especiallyconcerning operation with minimum pilot interaction, proved to be very use-ful for NASA and ESA, already working on the possibility to apply lidartechnology on satellite platforms. Their eorts ended up in LITE, Lidar In-Space Technology Experiment, representing the rst example of lidar systemfor atmospheric studies from space. Designed and built at NASA LaRC, thenpositioned inside the payload bay of Space Shuttle Discovery, LITE measuredthe Earth's cloud cover and tracked various kind of particles in the atmo-
Figure 1.1: Historical evolution of lidar instruments.

1.2. OPERATING PRINCIPLE 15
sphere as part of the STS-64 mission held in September 1994. It took nallyanother ten years before the rst long-duration spaceborne low-Earth-orbitight, with the Geoscience Laser Altimeter System (GLAS) launched aboardthe Ice Cloud and Elevation Satellite (ICESat) spacecraft in January 2003.Having the purpose of continuous global observation of Earth, GLAS per-formed various measurements dealing with ice-sheet topography, cloud andatmospheric properties, height and thickness of radiatively important cloudlayers needed for accurate short term climate and weather prediction.
Many more improvements are still to be done in order to enable the imple-mentation of new applications in the next decades (like studies of the carboncycle and forecasting through global tropospheric wind measurements), al-lowing to predict a bright future for spaceborne lidars, which are indeedestablishing themselves as a solid technology for the study of the Earth sys-tem.
1.2 Operating Principle
Figure 1.2: Lidar setup.
The basic architecture of a lidar system [54] is depicted in gure 1.2 andcomprises two parts, namely the transmitter and the receiver. The trans-

16 CHAPTER 1. LIDAR
mitter houses the laser device committed to illuminating the target. Wave-lengths used in lidar depend on the application and cover in general the rangefrom ultraviolet to mid-infrared. Solid-state laser technology in combina-tion with non-linear optics phenomena (e.g. optical parametric amplicationand stimulated Raman scattering) are nowadays largely employed because oftheir versatility in generating the various wavelengths suited for dierent li-dar techniques, as well as short light pulses with specic spectral properties.Being temporal resolution not an issue in most lidar measurements, pulserepetition rates of a few up to several thousands shots per second are accept-able, with lidar signals normally averaged over time intervals up to minutesin order to reduce the amount of data that must be stored. Although laserbeams are already highly collimated, their divergence is often further reducedwith a beam expander to values of the order of 100µrad before they leavethe transmitter and are sent out to the atmosphere. On the receiver side,a telescope is used to collect photons backscattered from the atmosphere.Thanks to preceding beam expansion, the telescope eld of view can also bechosen as low as a few hundreds µrad by means of a eld stop positionedin the focal plane, with several benets, among which: ecient reduction ofthe background light coming from the atmosphere; possibility to fulll therequirements of high spectral resolution lidar methods, employing opticaldevices with small acceptance angles. The telescope is usually followed byan optical analyzer, selecting specic wavelengths or polarization states outof the collected light. Polarizers, grating spectrometers, interferometers andatomic-vapor lters are examples of elements belonging to the optical analyz-ing system. Finally signal detection is achieved with photomultiplier tubes(PMTs) and photodiodes. When the backscatter signal is weak, e.g., whenit results from a weak scattering process or when the investigated region isfar away from the instrument, a photon counting technique based on PMTsor avalanche photodiodes (APDs) operated in Geiger mode is preferred. Forstrong backscatter signals on the other hand, analog recording, consisting inthe measurement of the average current produced by the light pulses, is themethod of choice.
Once understood the main constituents of a lidar setup, it is possible toderive an expression for the detected signal [54]. To a rst approximation,the power P received from distance R can be written as a function of fourterms:
P (R, λ) = KG(R) β(R, λ)T (R, λ), (1.1)
where K represents the performance of the lidar system, G(R) describesthe geometric arrangement of transmitter and receiver optics, β(R, λ) is thebackscatter coecient at distance R and T (R, λ) is the transmission term,

1.2. OPERATING PRINCIPLE 17
holding information about the amount of light lost on the way from the lidarto distance R and back. As it can be seen, the rst half of equation 1.1summarizes the factors which are completely determined by the lidar setupand can thus be controlled by the experimentalist. Conversely the secondhalf contains the subjects of investigation, which are in principle unknownto the researcher. The term K can in particular be expanded as follows:
K = P0cτ
2Aη, (1.2)
being P0 and τ respectively the laser pulse peak power and its temporal dura-tion, c the speed of light in vacuum, A the area of the primary receiver opticsresponsible for the collection of backscattered light and η the overall systemeciency. The factor cτ/2 represents the length of the volume from whichbackscattered light is received at a given time instant and is called the eec-tive (spatial) pulse length. Equation 1.2 points out the telescope area A, pulseenergy E0 = P0τ and system eciency η, including transmitter/receiver anddetection eciencies, as primary design parameters of a lidar system. Thegeometric term G(R) is instead given by the product of the so called laser-beam receiver-eld-of-view overlap function and the function R−2, accordingto:
G(R) =O(R)
R2. (1.3)
The O(R) function results from the combination of all geometric features ofthe lidar system (e.g. laser beam diameter and divergence, telescope focallength and size, location of transmitter and receiver optical axes relativeto each other). Its value is zero at the lidar and reaches unity when thelaser beam is completely imaged onto the detector through the eld stop.The quadratic decrease of the signal intensity with distance can be easilyunderstood considering the perception angle of the lidar for light scatteredat distance R: in case of isotropic scattering this is simply given by the ratioA/R2, being A the telescope area. The backscatter coecient β(R, λ) isthe primary atmospheric parameter that determines the strength of the lidarsignal. It actually describes how much light is scattered into the backwarddirection, therefore assuming the value of the extinction coecient α(R, λ)(see equation 1.5) for scattering angle θ = 180, having units [m−1 sr−1]. Inthe atmosphere laser light can be scattered by air molecules or particulatematter (i.e. aerosol particles), hence β(R, λ) can be written as:
β(R, λ) = βmol(R, λ) + βaer(R, λ). (1.4)
Molecular scattering, mainly occurring from nitrogen and oxygen molecules,depends on air density and thus decreases with height. As stated in sec-tion 1.1 this means that backscattering also decreases with distance if the

18 CHAPTER 1. LIDAR
observation is made from ground, otherwise increases for downward-lookingsystems on aircraft or spacecraft. On the other hand particulate scatteringis highly variable, because of the great diversication in particles nature:small liquid and solid air-pollution particles, larger mineral-dust and sea-saltparticles, biogenic material, rain droplets and ice crystals are all valid exam-ples of scatterers belonging to this family. Finally, the transmission term ofthe lidar equation T (R, λ) takes into account the light lost on the way fromthe instrument to the scattering volume and back. T (R, λ) can take valuesbetween 0 and 1 and complies with the following:
T (R, λ) = exp
[−2
∫ R
0
α(r, λ) dr
], (1.5)
with the extinction coecient α(R, λ) dened as the sum of all transmis-sion losses, having units [m−1]. Analytically α(R, λ) is given by the sum ofthe products between particles concentration and extinction cross-section,for each type of scatterer. Note that being β(R, λ) = α(R, λ, θ = 180),the backscattering coecient is likewise dened as the sum of the productsbetween particles concentration and the dierential scattering cross-section(for the backward direction), for each type of scatterer. Equation 1.5 resultsfrom the specic form of the Lambert-Beer-Bouguer law for lidar systems,with the factor 2 taking into account the two-way transmission path. Know-ing the extinction of light can occur because of scattering and absorption byparticles and molecules, we can also write α(R, λ) as the sum of dierentcomponents in a fashion similar to β(R, λ):
α(R, λ) = αmol,sca(R, λ) + αmol,abs(R, λ)
+ αaer,sca(R, λ) + αaer,abs(R, λ). (1.6)
Summarizing the discussion so far, we can rewrite equation 1.1 in a morecommon form, with the help of equations 1.2, 1.3 and 1.5:
P (R, λ) = P0cτ
2Aη
O(R)
R2β(R, λ) exp
[−2
∫ R
0
α(r, λ) dr
], (1.7)
Note that in our preceding investigation we did not consider a backgroundcontribution Pbg to the detected signal. In practical cases a certain amount ofbackground is always present in a lidar measurement, during daytime mainlycaused by direct or scattered sunlight, whereas at night coming from moon,stars and other articial light sources. The estimation and subtraction ofthe background is crucial for a correct evaluation of the lidar signal. Usuallya number of data points from either a region beyond the target (i.e. whereno signal is expected anymore) or from the period preceding the laser pulseemission are used to assess the background error.

1.3. APPLICATIONS 19
1.3 Applications
The capability of lidars to investigate a great variety of aspects of the at-mosphere is achieved with the implementation of dierent techniques, thefundamental of which are briey discussed below [54].
Elastic-backscatter lidar is the classic form of lidar, relying on the emissionof a single wavelength radiation, which remains unchanged during interac-tion with the target and until detection. This kind of instrument deliversinformation on the presence and location of aerosols and cloud layers and isoften referred to as Rayleigh-Mie lidar, after the name of the scientists whodeveloped the theory concerning interaction of radiation with particles of dif-ferent sizes. The term Rayleigh scattering in particular refers to the elasticscattering from particles that are very small compared to the wavelength ofthe scattered radiation. In the context of lidars it implies scattering frommolecules, with a major contribution given by nitrogen and oxygen, makingup about 99% of molecular atmosphere. It turns out that the intensity of aRayleigh scattered beam is proportional to λ−4, meaning that this processdominates for short laser wavelengths. On the other hand,Mie scattering the-ory actually comprises all sizes of spherical particles, even including Rayleighsolution. The term however is often used to describe the scattering from par-ticles with size comparable to or larger than the wavelength of the scatteredradiation. Whereas scattering from very large particles does not depend onwavelength anymore, in the region where particle radius and wavelength areof similar magnitude, it strongly depends on λ, making it possible to obtaininformation on several aerosol parameters (typically in the radius range fromabout 50 nm to a few micrometers) on the basis of a wavelength-dependentdetection. A very specic example of elastic-backscatter lidar is the highspectral resolution lidar, which will be described in section 1.4 .
Raman lidar exploits the inelastic Raman scattering process, involvingthe change of vibrational-rotational energy level of a molecule. Thanks tothe specicity of the frequency shift with the target (typically in the range ofa few hundreds to several thousands wavenumbers), this technique allows inprinciple the detection of a variety of atmospheric species. However, the com-parably low Raman cross-sections limit proper operations to gases present inrelatively high concentration (e.g. water vapor). Another application of Ra-man lidars deals with the measurement of atmospheric temperature proles.Because the population of energy levels follows Boltzmann's distribution law,the intensity distribution within the Raman bands contains information onthe temperature inside the scattering volume.
The detection of atmospheric gases with high sensitivity is possible withdierential-absorption lidar (DIAL). This technique relies on the emission of

20 CHAPTER 1. LIDAR
two wavelengths, one of which is absorbed more strongly than the other, inorder to determine the dierential molecular absorption coecient. If thedierential absorption cross-section for the two wavelengths is known, theconcentration of gas atoms and molecules can directly be deduced. Examplesof gases whose concentration can be measured by means of DIAL include O3,NO2, NO, N2O, SO2, CH4, HCl and NH4.
Resonance ourescence lidar is fullled as soon as the energy of the in-coming photon coincides with the energy gap between two levels of an atomor molecule. The word uorescence is used to imply that in general ree-mission of light can occur at longer wavelengths. When in particular theemitted and detected radiations share the same wavelength, the name res-onance scattering lidar is preferred. This form of lidar is largely employedto study upper atmosphere (about 100 km height), where layers of metallicatoms and ions can be found. The very high cross-sections typical for thiskind of interaction result in strong lidar signals, allowing the detection ofrather low target concentrations.
The investigation of the collective motion of atmospheric particles andmolecules is made possible by coherent Doppler lidar, which measures the fre-quency shift forced by wind along the lidar line of sight to the backscatteredradiation. The technique is based on the emission of single-longitudinal-modelaser radiation and coherent detection of the backscattered signal, which isin turn mixed with the radiation from a local oscillator. When the sign ofthe frequency shift is also to be determined, heterodyne detection must beapplied.
1.4 High Spectral Resolution Lidar
The lidar equation investigated in section 1.2 must be solved at each heightfor six dierent unknowns, given by the sum of the components of the extinc-tion coecient α(R, λ) (equation 1.6) and the backscatter coecient β(R, λ)(equation 1.4), making it an impossible task to extract any kind of informa-tion from the detected signal. Luckily the problem can be reduced to a muchsimpler form, comprising only two unknowns, with a procedure developed onthe basis of atmospheric properties. First βmol(R, λ) holds a proportional-ity with atmospheric density, according to Rayleigh theory, meaning that itsvalue is completely determined once ground-level temperature and pressureproles are known. The value of αmol,sca(R, λ) is then simply deduced fromthat of βmol(R, λ) according to geometric considerations. In most cases it isacceptable to simply assume αmol,abs(R, λ) = 0. Exceptions to this rule in-clude situations in which sizable concentrations of a certain molecule known
1.4. HIGH SPECTRAL RESOLUTION LIDAR 21
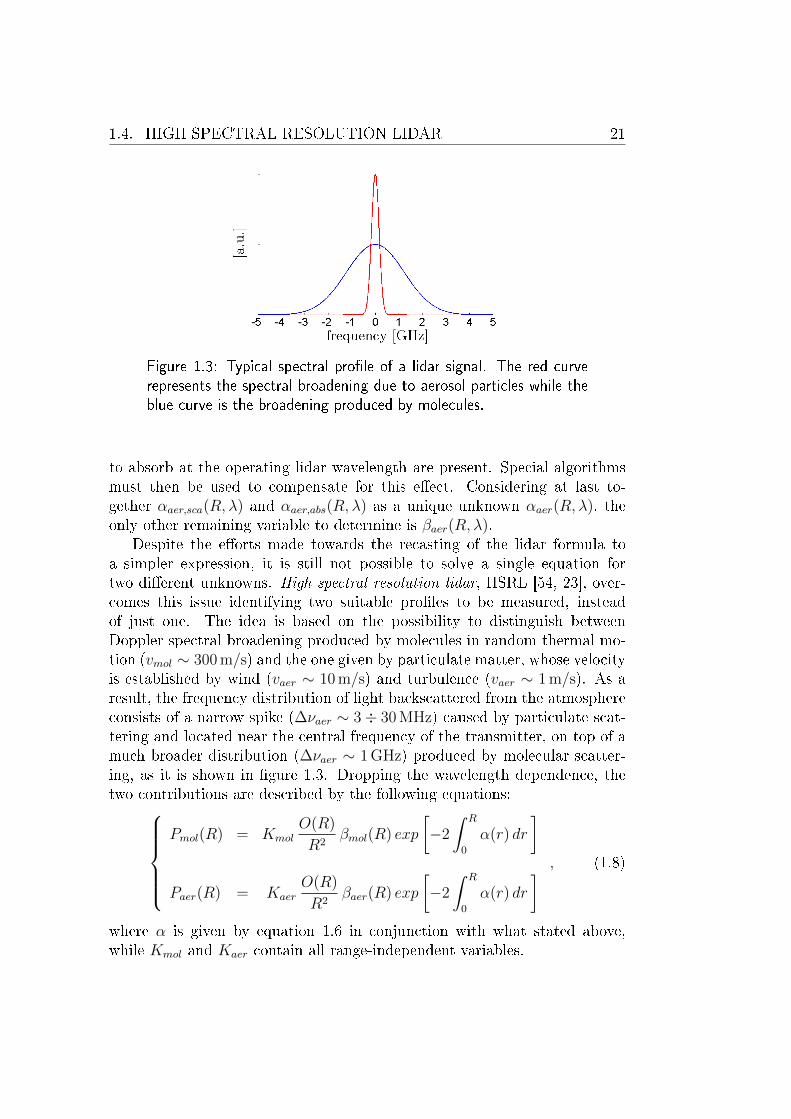
Figure 1.3: Typical spectral prole of a lidar signal. The red curverepresents the spectral broadening due to aerosol particles while theblue curve is the broadening produced by molecules.
to absorb at the operating lidar wavelength are present. Special algorithmsmust then be used to compensate for this eect. Considering at last to-gether αaer,sca(R, λ) and αaer,abs(R, λ) as a unique unknown αaer(R, λ), theonly other remaining variable to determine is βaer(R, λ).
Despite the eorts made towards the recasting of the lidar formula toa simpler expression, it is still not possible to solve a single equation fortwo dierent unknowns. High spectral resolution lidar, HSRL [54, 23], over-comes this issue identifying two suitable proles to be measured, insteadof just one. The idea is based on the possibility to distinguish betweenDoppler spectral broadening produced by molecules in random thermal mo-tion (vmol ∼ 300 m/s) and the one given by particulate matter, whose velocityis established by wind (vaer ∼ 10 m/s) and turbulence (vaer ∼ 1 m/s). As aresult, the frequency distribution of light backscattered from the atmosphereconsists of a narrow spike (∆νaer ∼ 3÷ 30 MHz) caused by particulate scat-tering and located near the central frequency of the transmitter, on top of amuch broader distribution (∆νaer ∼ 1 GHz) produced by molecular scatter-ing, as it is shown in gure 1.3. Dropping the wavelength dependence, thetwo contributions are described by the following equations:
Pmol(R) = KmolO(R)
R2βmol(R) exp
[−2
∫ R
0
α(r) dr
]
Paer(R) = KaerO(R)
R2βaer(R) exp
[−2
∫ R
0
α(r) dr
] , (1.8)
where α is given by equation 1.6 in conjunction with what stated above,while Kmol and Kaer contain all range-independent variables.

22 CHAPTER 1. LIDAR
The implementation of the HSRL technique requires very narrow band-width lters to discriminate between signals, with the best options fallingupon Fabry-Perot interferometers and atomic and molecular absorption l-ters. Scanning and xed Fabry-Perot interferometers, whose transmissionbandwidth is typically much narrower than the molecular spectrum, letmost of the particulate scattering pass through, while reecting the Doppler-broadened molecular signal. Two detectors located respectively in the trans-mitted and reected channels thus measure the two proles requested by theHSRL technique. The nonscanning etalon approach exhibits several advan-tages compared to its counterpart, including the removal of all errors comingfrom temporal variations in the scattering medium, an improved system e-ciency and the possibility to tune the etalon to any wavelength. The majordrawback of Fabry-Perot lters lies however in the device sensitivity to ther-mal and mechanical perturbations. Moreover the eective spectral resolutionof the instrument is determined by the combination of the etalon angular ac-ceptance and its diameter: since the smallest telescope eld-of-view is limitedby practical constraints, the only way to further increase resolution is to uselarger, expensive etalons. Atomic and molecular absorption lters oer anattractive alternative to Fabry-Perot based systems. These devices allowonly the spectral wings of the molecular scattering to pass through, whilethe central peak of the molecular spectrum and the whole particulate scat-tering is absorbed. In this case HSRL is performed with two detectors locatedbefore and after the atomic/molecular cell, the former measuring part of thelight directly coming from the receiving telescope, the latter measuring thesignal ltered by the cell. Atomic vapor barium (Ba) based cells were rstemployed in the past, proving to be robust and stable against noise, alsoavoiding acceptance angle limitations posed by etalons. Their major disad-vantages involve high operating temperatures (700 ÷ 800 C) and the lackof conventional laser sources emitting at the barium absorption wavelength(553.7 nm). Nowadays Ba cells are replaced with molecular iodine (I2) l-ters, sharing the robust spectral stability and wide acceptance angle of theatomic vapor cells, while allowing operations at much lower temperatures(25÷ 100 C). In addition I2 exhibits several suitable absorption lines withinthe thermal tuning range of frequency doubled Nd:YAG lasers.
In addition to lters bandwidth, other technical complexities concerningHSRL are related to laser linewidth (which must be narrower than the lterwidth, i.e. ≤ 100 MHz) and frequency-locking of the lter to the laser pulses.Such issues severely limited the implementation of this technique during thelast decade. However the unique advantages granted by HSRL, together withadvancing technology, are likely to foster its deployment in nearly future andto make high spectral resolution lidar a routine observational instrument.
Chapter 2
The Laser Oscillator
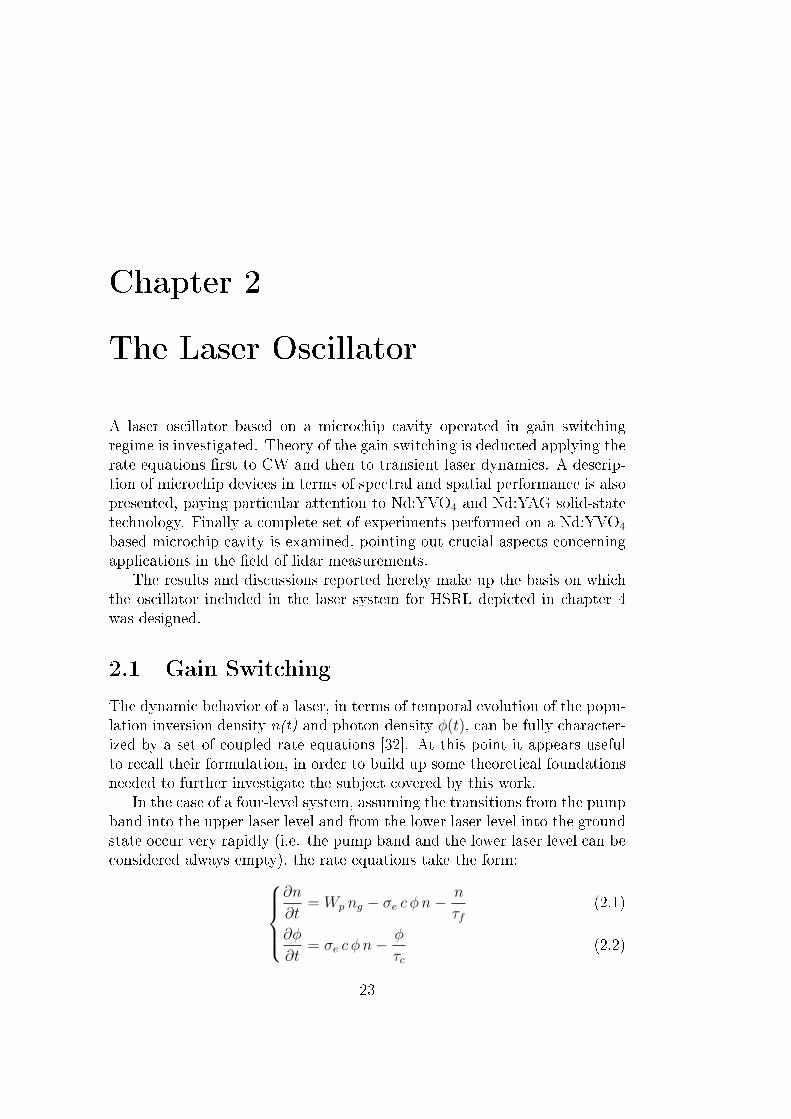
A laser oscillator based on a microchip cavity operated in gain switchingregime is investigated. Theory of the gain switching is deducted applying therate equations rst to CW and then to transient laser dynamics. A descrip-tion of microchip devices in terms of spectral and spatial performance is alsopresented, paying particular attention to Nd:YVO4 and Nd:YAG solid-statetechnology. Finally a complete set of experiments performed on a Nd:YVO4
based microchip cavity is examined, pointing out crucial aspects concerningapplications in the eld of lidar measurements.
The results and discussions reported hereby make up the basis on whichthe oscillator included in the laser system for HSRL depicted in chapter 4was designed.
2.1 Gain Switching
The dynamic behavior of a laser, in terms of temporal evolution of the popu-lation inversion density n(t) and photon density φ(t), can be fully character-ized by a set of coupled rate equations [32]. At this point it appears usefulto recall their formulation, in order to build up some theoretical foundationsneeded to further investigate the subject covered by this work.
In the case of a four-level system, assuming the transitions from the pumpband into the upper laser level and from the lower laser level into the groundstate occur very rapidly (i.e. the pump band and the lower laser level can beconsidered always empty), the rate equations take the form:
∂n
∂t= Wp ng − σe c φ n−
n
τf∂φ
∂t= σe c φ n−
φ
τc
(2.1)
(2.2)
23
24 CHAPTER 2. THE LASER OSCILLATOR
where also the rate at which spontaneous emission is added to the laseremission has been neglected. Equation 2.1 states that population inversionincreases due to pumping process, being Wp the pumping rate and ng theground state population density, whereas it is pulled down by stimulatedand spontaneous emissions. Knowing that σe represents the emission crosssection for the laser transition and c is the speed of light in vacuum, the stim-ulated emission term can be expressed in the more intuitive form We n, withthe stimulated emission rate We = σe I/(h ν0) and the intracavity intensityI = c φ h ν0 for the particular frequency ν0 associated to the laser transition.On the other hand, spontaneous decay rate is described by the inverse of theuorescence lifetime τf , i.e. the lifetime of the upper laser level for radiativetransition to the lower laser level. Similarly equation 2.2 states that stimu-
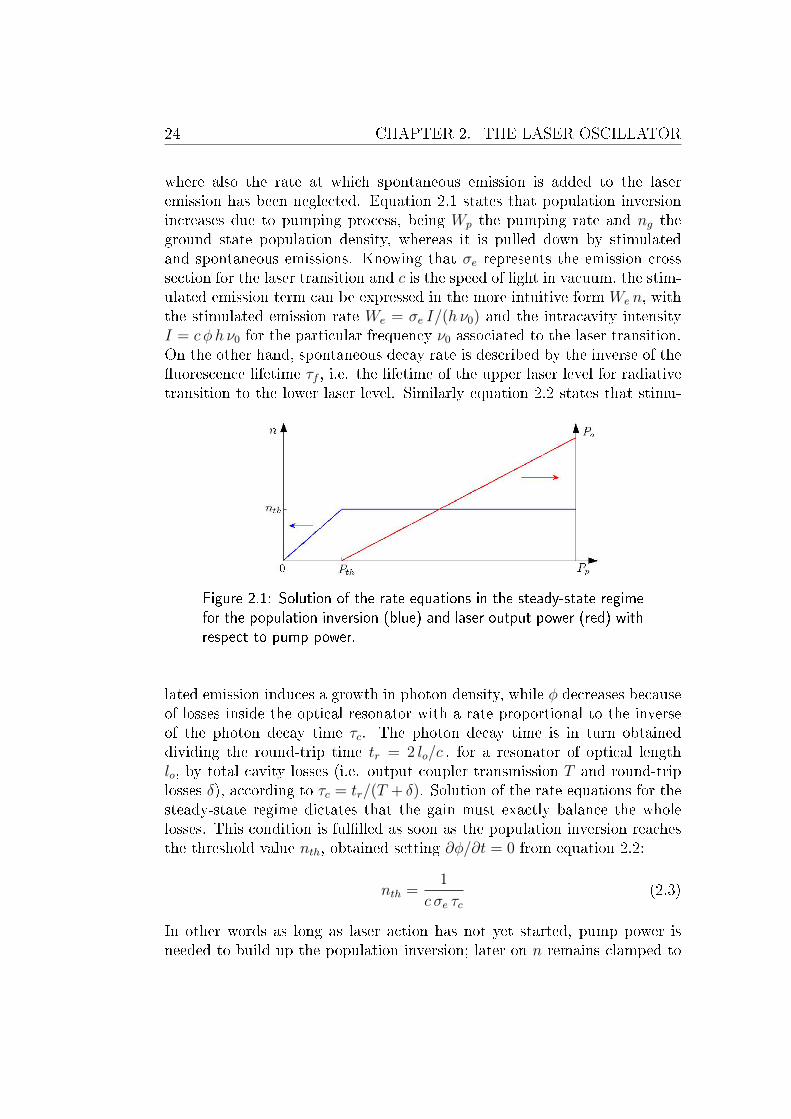
Figure 2.1: Solution of the rate equations in the steady-state regimefor the population inversion (blue) and laser output power (red) withrespect to pump power.
lated emission induces a growth in photon density, while φ decreases becauseof losses inside the optical resonator with a rate proportional to the inverseof the photon decay time τc. The photon decay time is in turn obtaineddividing the round-trip time tr = 2 lo/c , for a resonator of optical lengthlo, by total cavity losses (i.e. output coupler transmission T and round-triplosses δ), according to τc = tr/(T + δ). Solution of the rate equations for thesteady-state regime dictates that the gain must exactly balance the wholelosses. This condition is fullled as soon as the population inversion reachesthe threshold value nth, obtained setting ∂φ/∂t = 0 from equation 2.2:
nth =1
c σe τc(2.3)
In other words as long as laser action has not yet started, pump power isneeded to build up the population inversion; later on n remains clamped to

2.1. GAIN SWITCHING 25
nth, while the energy stored in excess of the laser threshold is emitted as laserradiation at a rate proportional to the pump power, in agreement with whatdepicted in gure 2.1.
Although in steady-state regime population inversion can never exceedsnth, under transient conditions [32, 45] the pump can rise n above the thresh-old level, when no radiation yet exists in the cavity to pull n back down bymeans of stimulated emission. Turning to the rate equations, the situationcan be described by:
∂n
∂t= Wp ng (2.4)
which is obtained by equation 2.1 neglecting both the stimulated emissionand spontaneous decay terms. The latter assumption will be validated laterin the section. The population inversion therefore increases linearly withtime and only when n > nth (i.e. gain exceeds losses) laser oscillation beginsto build up, with φ reaching the steady-state oscillation level φss as soon asn reaches a maximum. The cumulative time for the cavity photon number
Figure 2.2: Solution of the rate equations under transient conditions.The photon density (red) forms a spike while the population inversion(blue) is allowed to exceed nth.
to build up from noise to a detectable level, in practice corresponding to108 ÷ 1010 photons, is on the order of a few tens the cavity decay time. Atthis point the photon density grows very rapidly, until the contribution ofstimulated emission to the depletion of the upper laser level becomes largerthan the eort of the pumping process to replenish it. In this case the rateequations reduce to:
∂n
∂t= −σe c φ n
∂φ
∂t= σe c φ n
(2.5)

26 CHAPTER 2. THE LASER OSCILLATOR
The photon density then reaches a peak, as soon as the population inversionvalue drops down to nth. Finally φ begins to die out, since the net round-trip gain is less then unity, and n reaches a minimum as the photon densitycrosses φss.
Complete solutions of the rate equations predict a train of regular anddamped spikes at the output of the laser, called relaxation oscillations. Thespiking behavior eventually damps down because neither the photon densitynor especially the population inversion return to their original value after eachspike, with the following one starting from initial conditions closer and closerto the steady-state behavior of the laser. More quantitative information caneasily be inferred applying a perturbative approach to the problem at hand,according to:
n′ = nth + ∆nφ′ = φss + ∆φ
(2.6)
where a small perturbation term has been added respectively to the steady-state values of population inversion and photon density. The calculationproceeds dierentiating equation 2.2 and then substituting ∂n/∂t from 2.1.The result is nally linearized introducing n′ and φ′ from 2.6 and neglectingall the terms containing the products ∆n∆φ:
∂2(∆φ)
∂t2+ c σe φss
∂(∆φ)
∂t+ (σe c)
2 φss nth (∆φ) = 0 (2.7)
whose solution gives the time variation of the photon density ∆φ in therelaxation oscillation regime.
∆φ ' exp
[(−σe c φss
2
)t
]sin[σe c (φss nth)1/2 t
](2.8)
The spiking frequency ωro = σe c (φss nth)1/2 and the decay time constantτro = 2/σe c φss can be expressed in a more intuitive form as a function ofthe intracavity intensity I and the photon decay time τc. The formulationcan be further simplied introducing the denition of saturation intensityIs = h ν0/(σe τf ):
ωro =
√I
Is τf τc
τro = 2 τf
(IsI
) (2.9)
(2.10)
Thus the oscillation frequency increases with I (and therefore the outputpower), conversely τro decreases for higher output power values. It is worth

2.1. GAIN SWITCHING 27
noting here that the duration of each spike is denitely shorter than theuorescence lifetime (which is in turn comparable to the full relaxation dy-namic), being the rates of rise and fall of the photon number inside the cavityrelated instead to the photon decay time τc. This conrms the possibilityto neglect the spontaneous decay term in equations 2.4 and 2.5, when eval-uating the behavior of a single spike. On the other hand, it can be inferredfrom the time scale of τro (comparable to that of the uorescence lifetime)that relaxation oscillations can be observed only in the case of active ma-terials exhibiting a recovery time of the population inversion substantiallylonger than the photon decay time. This condition is easily satised by mostsolid-state and semiconductor lasers, while it is hardly fullled by many gaslasers.
Figure 2.3: Example of full relaxation oscillations dynamic.
The phenomenon of spiking can be exploited to produce a high peakpower pulse. A fast pumping mechanism applied to a solid-state laser canindeed bring the population inversion (and gain) to a level considerably abovethreshold before the laser oscillation has time to build up in the resonator.From the discussion above, it follows that the response of a laser to a fastpump pulse is in the form of a relaxation oscillation. Eventually, if thepump pulse is short enough, a single oscillation cycle can be selected. Thistechnique is referred to with the name of gain switching. In comparison toQ-switching, still allowing the generation of short laser pulses, gain switchingis based on a completely dierent principle. In fact Q-switched pulses aregenerated by storing energy in the upper state of the active medium witha pump pulse having a duration on the order of the upper state lifetime.On the other hand in gain switching energy is deposited very rapidly in theupper state and a net gain is triggered before the radiation in the resonatorhas time to build up from noise. In other words Q-switching permits thetransformation of a relatively low power and long duration pulse into the

28 CHAPTER 2. THE LASER OSCILLATOR
emission of a short, high peak power pulse. In gain switching, peak powerand pulse width of the pump pulse and laser output are on the same order.
From a mathematical point of view, another way to select a single relax-ation oscillation cycle can be directly derived from equations 2.9 and 2.10. Infact, forcing the decay time constant τro to be smaller than the oscillationsperiod, it is likewise possible to ensure single pulse laser output. Analyti-cally, the condition to be fullled is represented by τro < 1 / ωro, which canbe rewritten as:
I
Is> 4
τfτc
(2.11)
In practical cases, being τf and τc on completely dierent timescales, it isnot feasible to satisfy condition 2.11. Considering for example the Nd:YVO4
microchip cavity described in section 2.3, the combination of τc ∼ 475 ps,τf = 100µs and Is ∼ 1.6 103 W/cm2 leads to the unrealistic requirementon the oscillator intensity I > 1.4 GW/cm2 (in the case at hand, an actualvalue of I on the order of 1.3 10−4 GW/cm2 can be predicted, on the basisof 100 nJ pulse energy, 10 ns temporal duration and a spot-size w ∼ 50µm).
2.2 Microchip Lasers
Microchip lasers [55] represent a particularly attractive alternative for pro-ducing high spatial and spectral quality laser radiation. They are typicallyfabricated by polishing a wafer of solid-state gain medium (with thicknesson the order of 1 mm or less), so that the opposite surfaces of the wafer areat and parallel. These same surfaces are then dielectrically coated to serveas mirrors of a plane-parallel cavity (gure 2.4). The possibility to realizeconcave cavities (i.e. cavities with one plane mirror and one concave mirror)has also been demonstrated [56]. The wafer is nally cut into small pieces,each resulting in a usable device. The simplicity of the fabrication processand the small amount of material needed for a single device make microchiplasers suitable for low-cost mass production.
Single-frequency operation of microchips is achieved by making the lasercavity suciently short, so that the spacing ∆ν between two adjacent res-onator modes is larger than the gain bandwidth. In fact ∆ν is inverselyproportional to the cavity length, according to:
∆ν =c
2n0L(2.12)
being n0 the refractive index of the gain medium and L the microchip length.A practical limit on how short the cavity can be is given by the absorp-tion length of the active medium: too little pump would be absorbed in
2.2. MICROCHIP LASERS 29
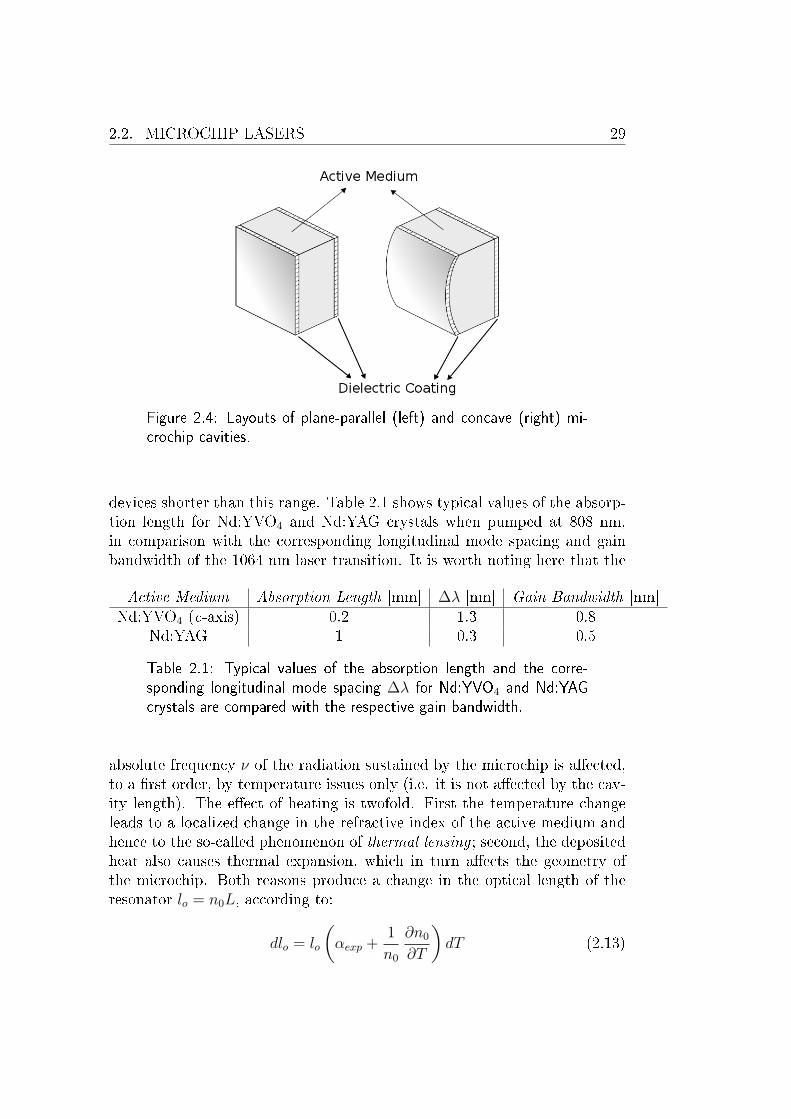
Figure 2.4: Layouts of plane-parallel (left) and concave (right) mi-crochip cavities.
devices shorter than this range. Table 2.1 shows typical values of the absorp-tion length for Nd:YVO4 and Nd:YAG crystals when pumped at 808 nm,in comparison with the corresponding longitudinal mode spacing and gainbandwidth of the 1064 nm laser transition. It is worth noting here that the
Active Medium Absorption Length [mm] ∆λ [nm] Gain Bandwidth [nm]Nd:YVO4 (c-axis) 0.2 1.3 0.8
Nd:YAG 1 0.3 0.5
Table 2.1: Typical values of the absorption length and the corre-sponding longitudinal mode spacing ∆λ for Nd:YVO4 and Nd:YAGcrystals are compared with the respective gain bandwidth.
absolute frequency ν of the radiation sustained by the microchip is aected,to a rst order, by temperature issues only (i.e. it is not aected by the cav-ity length). The eect of heating is twofold. First the temperature changeleads to a localized change in the refractive index of the active medium andhence to the so-called phenomenon of thermal lensing ; second, the depositedheat also causes thermal expansion, which in turn aects the geometry ofthe microchip. Both reasons produce a change in the optical length of theresonator lo = n0L, according to:
dlo = lo
(αexp +
1
n0
∂n0
∂T
)dT (2.13)

30 CHAPTER 2. THE LASER OSCILLATOR
being αexp the thermal expansion coecient and ∂n0/(n0 ∂T ) the thermalcoecient for refractive index. Recalling now that the electric eld inside aplane-parallel resonator must satisfy the condition to be zero on the cavitymirrors, it follows that the allowed resonant frequencies are given by:
ν = qc
2lo, q integer (2.14)
Dierentiating equation 2.14 and substituting dlo with the result of equation2.13 leads to:
∂ν
∂T= −
(αexp +
1
n0
∂n0
∂T
)ν (2.15)
conrming that the absolute frequency varies with temperature while beingindependent of the microchip length. Some examples of calculation based onequation 2.15, in the case of Nd:YVO4 and Nd:YAG crystals, are summarizedin table 2.2.
Figure 2.5: Single-longitudinal-mode selection in the microchip cav-ity.
Selection of the transverse mode can instead be ascribed to the pump-ing process [31]. For four-level systems, such as Nd:YVO4 and Nd:YAGoperating at 1064 nm, literature describes two stabilizing mechanisms of aplane-parallel resonator, each applying to a distinct operating regime. Forpump powers close to threshold guiding is attributed to gain-related eects,while for power well above threshold thermally induced changes in the cavitygeometry are considered the primary mechanism aecting transverse modeselection. The eect of heating has already been considered in the treatmentof the absolute frequency, with both thermal lensing and thermal expansionacting to conne the mode inside the resonator. Recognition of the factthat the laser mode is not only resonant with the cavity, but also with theavailable gain, leads to the consideration of two gain-related guiding eects,

2.2. MICROCHIP LASERS 31
Nd:YAG Nd:YVO4 (c-axis)αexp [
C−1] 7.5 10−6 11 10−6
n0 [@ 1064 nm] 1.82 2.17
∂n0
∂T[C−1] 7.3 10−6 3 10−6
∂ν
∂T[GHz C−1] -3.25 -3.5
∂λ
∂T[pm C−1] 12.26 13.21
Table 2.2: List of thermal expansion coecients and thermal co-ecients for refractive index in the case of Nd:YAG and Nd:YVO4
crystals. Examples of the absolute frequency (wavelength) drift withtemperature are calculated at ν0 = 282 THz (λ0 = 1064 nm).
namely gain guiding and gain-related index guiding. Gain guiding occurswhen a spatially varying population inversion prole leads to preferentialgain for dierent parts of the beam (e.g. a high inversion on axis falling otowards the edges of the laser active medium would provide more gain forthe center of the beam with respect to its wings). Gain-related index guidingis also controlled by the gain, in this case both spatially and spectrally, sincethe gain provides dispersion. Laser modes detuned from the line center willtherefore experience dierent refractive indices as a function of their detun-ing. Since the gain prole is varying spatially too, the refractive index willalso have a spatial variation. The change in refractive index can be expressedanalytically in the form: ∆n0(r, z, λ) =
λ0 (λ− λ0)
2π∆λfwhm
g(r, z, λ)
g(r, z, λ) ∝ − n(r, z, λ)
(2.16)
where r and z are respectively the radial and longitudinal (i.e. parallel to thelaser beam propagation direction) coordinates, λ0 is the central wavelength(corresponding to ν0), g is the gain and ∆λfwhm represents the full width athalf maximum of the gain bandwidth. Thus, if for example the populationinversion has a local minimum on axis, the laser mode will experience whatamounts to a negative lens if it is detuned to the lower wavelength side of theline center. Conversely it will be aected by a positive lens if it is detunedto higher wavelengths. Hence, depending on the sign of the detuning and

32 CHAPTER 2. THE LASER OSCILLATOR
the shape of the spatial variation of the gain, both guiding and anti-guidingcongurations can result.
Figure 2.6: Change in the refractive index of the active mediuminduced by gain-related index guiding, in the case of a laser modedetuned to lower (red) and higher (blue) wavelengths with respect tothe center of a gain line exhibiting a local minimum on axis.
Single-frequency gain switched Nd:YVO4 and Nd:YAG microchip lasersdelivering pulses with duration spanning from sub-nanosecond to about 200 ns,alongside a repetition rate tunable between 100 Hz and 1 MHz, have alreadybeen demonstrated [39, 53]. Possible applications of such devices includesingle-longitudinal-mode injection seeding of high energy Nd:YAG laser sys-tems, free space optical communication, micromachining with very compactsetups and operation on board of lidar systems.
2.3 Experimental Results
Figure 2.7: Experimental setup used to study the microchip behaviorin gain switching regime.

2.3. EXPERIMENTAL RESULTS 33
A Nd:YVO4 based microchip crystal operated in gain switching regimeis fully characterized, in terms of output power, spatial laser beam quality,pulse duration and spectral behavior, according to the setup depicted ingure 2.7. The pump source is a BFP1 laser diode from Bright Solutions,tuned towards the absorption peak of the gain medium (∼ 808 nm). Thepump module is operated in pulse regime, with a duty cycle spanning from0.05% to 2.5%, corresponding to the emission of few mW up to a few tensof mW. The pump beam is coupled to a 100µm core diameter optical berand then focused inside the crystal by means of a telescope. The microchipconsists of a 1% doped a-cut Nd:YVO4 slab, 1 mm long and with a cross
Figure 2.8: Output power (at 1064 nm) against the pump powerabsorbed by the active medium. Pump pulses having 500 ns durationand respectively 1 kHz, 10 kHz and 50 kHz repetition rates are em-ployed. The linearity of the curve is guaranteed as long as the outputradiation comprises a single relaxation oscillation cycle.

34 CHAPTER 2. THE LASER OSCILLATOR
section of [2x2] mm2. The input facet is HR coated at the laser wavelength(i.e. 1064 nm) and AR coated at the pump wavelength. The output coupleris coated to provide 97% reection at 1064 nm.
The output power is measured as a function of the pump power absorbedby the crystal for dierent repetition rates. The temporal behavior of thelaser pulses is also observed by means of a photodiode and the spatial beamquality is measured with the knife-edge technique. The results shown in g-ures 2.8, 2.9 and 2.10 prove the possibility to generate pulses with energy upto ∼ 100 nJ and a temporal duration < 10 ns, for low repetition rates. Sim-ilarly to what happen with the Q-switching technique, as the repetition rateincreases, the pulse duration gets longer and the energy shows a tendency todecrease. The capability to produce TEM00 transverse mode at any repeti-
Figure 2.9: Microchip pulse duration observed by means of a pho-todiode, for 500 ns long pump pulses at 1 kHz, 10 kHz and 50 kHzrepetition rates respectively.

2.3. EXPERIMENTAL RESULTS 35
tion rate is conrmed by the estimated values of the M2 parameter (M2 ∼ 1in both axes). Short term stability of the emitted power is also monitoredby means of a power meter. Figure 2.11 compares the data logged by theinstrument with (potential) synchronous uctuations of the microchip pulsebuild-up time and the temperature of the pump source (recorded by meansof a NTC thermistor): it is apparent from the gure that variations of thepump module temperature produce a change in the power absorbed by thecrystal, which in turn triggers an early/delayed start of the laser radiationcompatible with the uctuation of the output power. A Fourier analysisof such uctuations yields a value of the oscillation period on the order of∼ 20 s, thus matching a time typical to thermal phenomena.
Figure 2.10: Microchip spatial beam quality measured according tothe knife-edge technique, for 500 ns long pump pulses at 1 kHz,10 kHz and 50 kHz repetition rates respectively.

36 CHAPTER 2. THE LASER OSCILLATOR
Figure 2.11: Fluctuations of the microchip output power (blue),build-up time (orange) and pump module temperature (green) at 10kHz repetition rate. Peak-to-peak uctuation of the NTC value onthe order of 0.03 V corresponds to a temperature excursion < 1 C.Fourier analysis of the traces recorded reveals an oscillation period of∼ 20 s.
Figure 2.12: Microchip performance versus pump pulse duration. Theoutput power values reported in this gure are measured when pump-ing the system with a dierent module, slightly tuned to wavelengthslower than 808 nm. In the analysis of the short term stability ofthe device, the output powers are normalized to the average valueassociated with the whole time span (i.e. 300 s).

2.3. EXPERIMENTAL RESULTS 37
The impact of the pump pulse duration on microchip performance is thenconsidered. Measurements of the output power against the pump power ab-sorbed by the crystal, at the constant 10 kHz repetition rate and for dierentpump pulse durations, are shown in gure 2.12: an increase in the slope ef-ciency and laser threshold is detected upon shortening the pump radiation.In the same gure, a comparison between the output power (short term) os-cillation patterns recorded in the various pumping regimes is also presented:an improvement in the microchip stability can be observed in the case ofshorter pump pulses.
Laser spectra are monitored by means of AQ6317B optical spectrum an-alyzer (by Ando Electric Co. Ltd), with a maximum resolution on the orderof ∼ 20 pm. The instrument is consequently capable to resolve the longitudi-
Figure 2.13: Microchip spectra collected at 10 kHz repetition rate inthe case of a pump spot size wp = 25µm (blue) and wp = 50µm(red). Because of the gain-related index guiding eect the spectraappear shifted with respect to each other. The microchip uorescencespectrum is also shown in comparison with the previous traces.
nal modes actually oscillating (being the frequency spacing between adjacentmodes ∆ν ∼ 260 pm, for a 1 mm long Nd:YVO4 based microchip), even ifit cannot provide accurate information on the linewidth of each mode. Fora detailed discussion on the mode linewidth, the reader should refer to sec-tion 3.3.3. Figure 2.13 shows a comparison between the spectra collectedat 10 kHz repetition rate in the case of dierent pump spot sizes inside thecrystal. Each spectrum is consistent with single-longitudinal-mode operation

38 CHAPTER 2. THE LASER OSCILLATOR
regime, as can be inferred from the spectral range of observation (∼ 4 ∆ν).The possibility to tune the microchip spectrum changing the pump geome-try is in agreement with the prediction of gain-related index guiding theory,discussed earlier in this chapter. Further tuning can be obtained heatingthe cavity, in order to move the emission cross section towards longer wave-lengths [37, 13]. Figure 2.14 reveals a spectral shift rate on the order of∼ 5 pm/C, which is compatible with the values recorded in literature, asthe microchip temperature increases. It is worth noting that a temperaturevariation not only aects the emission cross section, but also the absolutefrequency of the modes sustained by the cavity, in agreement with equation2.15. Since this kind of spectral shift does not share the same rate withthe emission cross-section, at some point (for higher temperature excursions)single-longitudinal-mode operation is no more guaranteed, as soon as a sec-ond mode experiences enough gain to oscillate (red and black curves in gure2.14).
Figure 2.14: Microchip spectral shift as a function of the dierence∆T between device temperature and room temperature (∼ 24 C).For higher ∆T values (red and black curves) a second mode startsto oscillate.
2.4. LESSONS LEARNED 39
2.4 Lessons Learned
From an accurate investigation of the results presented in the previous sec-tion, it is possible to point out crucial aspects aecting the application of themicrochip device to larger systems and, in particular, to lidar instruments.Some of these issues are considered below.
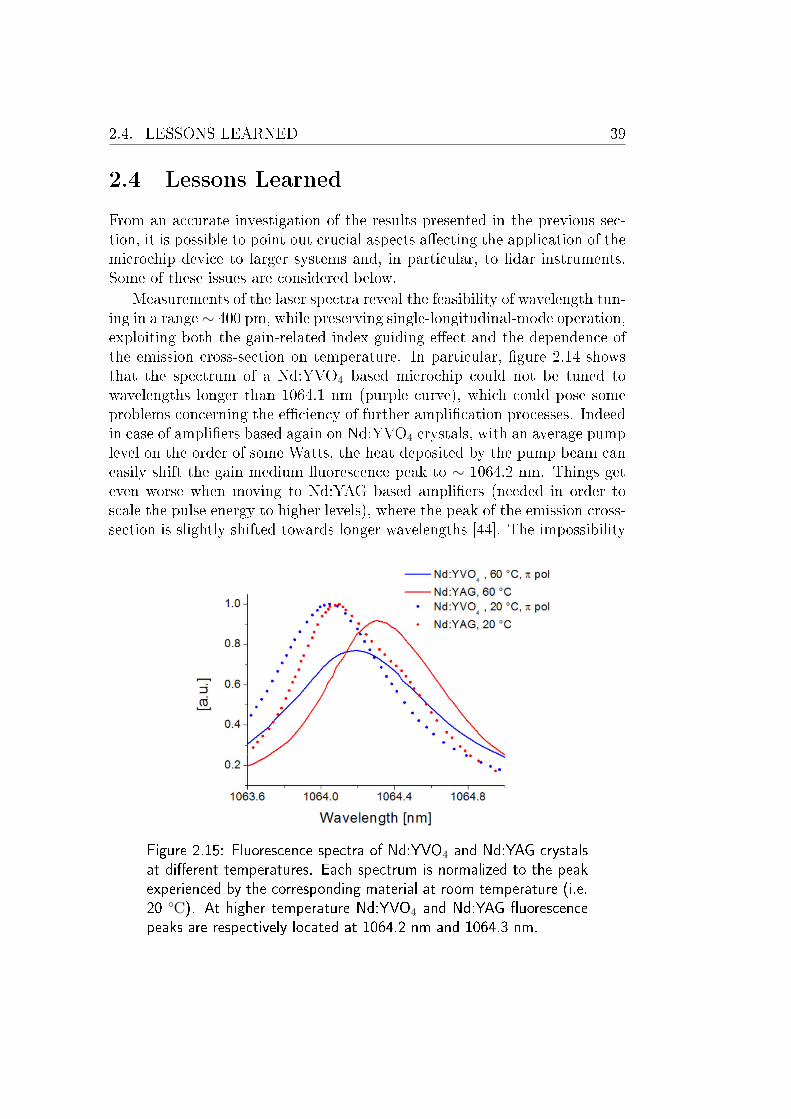
Measurements of the laser spectra reveal the feasibility of wavelength tun-ing in a range∼ 400 pm, while preserving single-longitudinal-mode operation,exploiting both the gain-related index guiding eect and the dependence ofthe emission cross-section on temperature. In particular, gure 2.14 showsthat the spectrum of a Nd:YVO4 based microchip could not be tuned towavelengths longer than 1064.1 nm (purple curve), which could pose someproblems concerning the eciency of further amplication processes. Indeedin case of ampliers based again on Nd:YVO4 crystals, with an average pumplevel on the order of some Watts, the heat deposited by the pump beam caneasily shift the gain medium uorescence peak to ∼ 1064.2 nm. Things geteven worse when moving to Nd:YAG based ampliers (needed in order toscale the pulse energy to higher levels), where the peak of the emission cross-section is slightly shifted towards longer wavelengths [44]. The impossibility
Figure 2.15: Fluorescence spectra of Nd:YVO4 and Nd:YAG crystalsat dierent temperatures. Each spectrum is normalized to the peakexperienced by the corresponding material at room temperature (i.e.20 C). At higher temperature Nd:YVO4 and Nd:YAG uorescencepeaks are respectively located at 1064.2 nm and 1064.3 nm.
40 CHAPTER 2. THE LASER OSCILLATOR
to select a specic wavelength threaten also application of the device to lidarsystems based on atomic/molecular absorption lters, where it is importantto match the absorption line of the lter element with an accuracy on theorder of the linewidth (∼ 1 GHz). In these regards, another option would bethe injection-locking of a cavity with a source emitting at the desired wave-length, with the disadvantage of a more complicated architecture because ofthe locking mechanism. Otherwise, the possibility to stick from the begin-ning to Nd:YAG gain medium, producing a microchip based on this material,should also be considered. The main drawback in this case is represented byan intrinsic unpolarized laser output, due to the lack of natural birefringenceof the material (in contrast to what happens with Nd:YVO4).
Analysis of the output power levels achieved during the experiments re-veals the feasibility to generate pulses with energy up to 100 nJ and maximumpeak power ∼ 10 W. These results proved to demand a lot of eort in or-der to scale the energy to higher values (the reader should refer to the lasersystem depicted in section 4.4), compromising the simplicity of the ampli-cation chain. The amplier architecture would benet remarkably from anoscillator producing pulses with energy on the order of 10 µJ. Such energiescan easily be obtained when operating the microchip in Q-switching regime.In fact Q-switching theory predicts a pulse energy E ∼ hν0AG/σe in the lowfrequency limit, being g the gain provided by the pump module and A thebeam spot size. Substituting the values reported in literature for Nd:YVO4,while assuming A = πw2
p with wp = 50 µm and G = 3 (higher gain values areeventually limited by ASE), it follows that the estimated energy is E ∼ 40 µJ.Unfortunately such short cavities pose problems in regards to the pulse du-ration attainable in Q-switching regime. Theory predicts in this case a pulseduration on the order of the photon decay time τc. For a Nd:YVO4 basedmicrochip with 1 mm length, having an output coupler transmission value of3%, τc ∼ 500 ps, corresponding to a transform limit bandwidth approaching1 GHz and hence inconsistent with the requirements of HSRL.
The laser pulse duration is indeed of great concern in the eld of li-dar measurements, since it is directly connected to the minimum accessiblespectral bandwidth via the Fourier theorem. During the discussion of theexperimental results it was pointed out the possibility to increase the pulseduration, thus narrowing the spectrum, increasing the repetition rate. Thisoption is somehow not practical with respect to lidar instruments, operatingnormally at low repetition rates on the order of tens of Hz. In fact startingfrom frequencies higher than the gain medium τ−1
f calls for the introductionof an active pulse pick-up mechanism, when scaling down to ∼ 10 Hz. On theother hand, if the seeder frequency is lower than τ−1
f , further amplication ofthe seeder pulses at the desired lidar repetition rate (e.g. 10 Hz) is sucient

2.4. LESSONS LEARNED 41
to passively select only the pulses at the same frequency, without the risk toamplify also adjacent ones. This condition limits operations to frequencies ≤1 kHz in the case of Nd:YVO4 active medium (τ−1
f ∼ 10 kHz), where pulseduration is shorter. In these regards literature suggests a dierent pump-ing scheme, yielding much longer pulses in gain switching regime [39]. Thisscheme consists in pumping the oscillator close to its threshold with a longpump pedestal (i.e. ∼ 1 ms), on top of which a rapid pulse is needed totrigger gain switching of the cavity. Further investigation of this procedureis yet to be done. Another option directly deducted from relaxation oscilla-tions theory is to increase the photon decay time τc, which is connected tothe rate of variation of the photon number inside the cavity, hence the pulsewidth.

42 CHAPTER 2. THE LASER OSCILLATOR

Chapter 3
The Pre-Amplier System
An amplication system seeded by the microchip laser described in chapter2 is investigated in every stage it is composed of. Theory of amplication inboth CW and pulse regimes is presented, pointing out the eect of saturationon the gain experienced by the input beam. Complete characterization ofthe amplication chain is then reported with the aid of experimental results,later applied to the design of the laser system intended for HSRL depictedin chapter 4. Measurements of the microchip laser bandwidth and spectralstability are also discussed, in relation to the requirements of the HSRLtechnique.
3.1 CW Amplication
The power/energy from an oscillator can be increased adding one or moreamplication stages to the laser system [32, 45]. If the pump driving theamplier is long compared to its uorescence lifetime, a steady-state is even-tually reached, in which the population inversion can be expressed in theform:
n =Wp ng τf1 +We τf
(3.1)
obtained setting ∂n/∂t = 0 from equation 2.1 and recalling that the stimu-lated emission term can be written as σe c φ n = We n. Equation 3.1 statesthat, for larger intensity I, the amplier population inversion and hence itsgain start to saturate, according to:
g =g0
1 + I/Is(3.2)
being g = σe n, g0 = σeWp ng τf the so called small-signal-gain per unitlength and Is = h ν0/(σe τf ) the saturation intensity. It is apparent from
43

44 CHAPTER 3. THE PRE-AMPLIFIER SYSTEM
equation 3.2 that Is has the meaning of the laser intensity by which theamplier small-signal-gain (i.e. the gain exhibited by the amplier in thecase of low-input-intensities) is reduced by one half. Assuming the beam ispropagating along coordinate z and the gain does not change much over thetransit time through the amplier, amplication of I is described by:
∂I
∂z= g(z) I(z) (3.3)
Solutions of equation 3.3 are easily found in the limit of I Is and I Is,yielding respectively:
Iout = Iin exp (g0 L)
Iout = Iin + Is g0 L
(3.4)
(3.5)
being L the amplier length. These results show that I grows exponen-tially with the amplier length in the low-input-intensity limit, otherwise itincreases linearly with L.
In order to go deeper into the amplication process, issues concerningpower extraction eciency must also be considered. First of all a more gen-eral relationship between small-signal-gain and saturated gain for a steady-state amplier can be found introducing g from 3.2 inside 3.3, then integrat-ing over the length of the amplifying medium:
IinIs
=ln (G0 /G)
G− 1(3.6)
being G0 = exp (g0 L) and G = Iout/Iin respectively the single-pass small-signal-gain and saturated gain, integrated over L. A closer investigation ofequation 3.6 reveals that as the input intensity increases, the gain G ap-proaches unity. This in turn means that for very high input intensities, thetotal power extracted from the amplier gets stuck to a maximum value andIout ∼ Iin. The power per unit area Iext really supplied by the amplier canbe calculated as:
Iext = Iout − Iin = Is ln
(G0
G
)(3.7)
The expression of Iext indicates that in order to maximize extraction, thecondition G→ 1 must be fullled:
Imaxext = lim
G→1Iext = Is g0 L (3.8)
On the other hand, when the input intensity is very small, the gain G ap-proaches its maximum value G0 to the detriment of a correspondingly lowpower extracted from the amplier. This situation is described by Iext ∼ Iout,

3.1. CW AMPLIFICATION 45
Figure 3.1: (Left) Gain saturation versus input intensity normalized tosaturation intensity. G rapidly drops down from its starting value G0,as Iin approaches Is. (Right) Extraction eciency η = Iext / I
maxext
versus gain. Maximum eciency corresponds to the theoretical limitG = 1. As the gain increases, the extraction from the amplierdeteriorate.
as Iin is too small compared to the intensity measured at the output of theamplier. There is thus a trade-o between high gain, which can be obtainedin the limit of low-input-intensity, and high power extraction, achieved forlarger values of Iin. The results of the preceding discussion are summarizedin gure 3.1.
A practical limit to the maximum attainable value of G0 is determinedby depopulation losses caused by amplied spontaneous emission (ASE). Infact, situations in which a high gain is combined to a relatively long activemedium foster the amplication of spontaneous emission, occurring at oneof its end, to a signicant level before leaving the amplier. The poweremitted as uorescence increases rapidly with gain, resulting in a strongemission within a solid angle Ωase around the optical axis of the crystal,being Ωase = A/L2 and A the transverse area of the amplier active volume.An analytical expression of the intensity emitted in the form of ASE is givenby:
IaseIs
=Ωase
4
G0√ln (G0)
(3.9)
whose eects are depicted in gure 3.2.Another process severely limiting the actual gain that can be exploited
during amplication results from the residual feedback of the various inter-faces in the optical path. The amplier active medium can indeed act asa resonator if the loop gain, given by the product between the reectivityof each crystal end, R1 and R2, and the saturated gain G, reaches at least

46 CHAPTER 3. THE PRE-AMPLIFIER SYSTEM
Figure 3.2: ASE evolution versus small-signal-gain. A sectionA = (100µm)2 for the inverted volume is assumed as a reference.
unity. Oscillations are then allowed to build up, depleting the energy storedinside the amplier. The requirement necessary to avoid prelasing eects istherefore:
R1R2G < 1 (3.10)
Assuming for example an active medium with HR coating at one end, grant-ing R1 > 99.5%, and AR coating at the other interface, with R2 < 0.2%, itfollows from 3.10 that the maximum value of G eluding prelasing is G ∼ 500.
3.2 Pulsed Amplication
When the signal at the input of the amplier is in the form of a train ofshort pulses, analytical treatment of the amplication process must be carriedout in a dierent way. Assuming the pulse duration to be much shorterthan the amplier uorescence lifetime and the inverse of the pump rate,both spontaneous decay and pumping can be neglected inside rate equation2.1, describing the dynamics of the population inversion. The growth inphoton density, for a traveling-wave amplier, is instead governed by thephoton-transport equation, taking into account the generation of photons bystimulated emission and the loss of energy owing out the amplier region.The rate equations thus reduce to:
∂n
∂t= −σe c φ n
∂φ
∂t= σe c φ n−
∂φ
∂xc
(3.11)
3.2. PULSED AMPLIFICATION 47
Solution to the coupled equations 3.11 was found by Frantz and Nodvik forvarious types of input pulse shapes [21]. Expression of the amplier saturatedgain, in the case of a square input pulse, complies with:
G =Fs
Fin
ln
1 +G0
[exp
(Fin
Fs
)− 1
](3.12)
being Fin the input uence and Fs a saturation uence dened as Fs = h ν/σe.Equation 3.12 describes the whole amplier dynamics, including the extremecases of small-signal-gain and saturation regimes, where it can be directlycompared to CW results:
G ∼ G0 = exp (g0 L)
G ∼ 1 +Fs
Fin
g0 L
(3.13)
(3.14)
Equation 3.13 holds when G0 Fin/Fs 1 and dictates that no saturation isexpected in the limit of low-input-uence, in perfect analogy to the resultof 3.4. On the other hand, the form of G outlined in 3.14 applies to theregime of high-input-uence, i.e. Fin Fs, where gain saturation occurs ina fashion similar to what depicted in 3.5, if the beam power per unit area isreplaced with the pulse energy per unit area.
The extraction eciency η can again be dened as the ratio between theenergy supplied by the amplier and the energy stored in the upper laserlevel at the time of pulse arrival. Being Jst = h ν n the total energy storedper unit volume, it follows that Jst = g0 Fs. Thus the eciency:
η =Fout − Fin
LJst(3.15)
conrming the trade-o between gain and extraction (η → 100% when thegain is strongly saturated). In order to increase energy extraction from theamplier, multiple-pass congurations are sometimes adopted. Analyticaltreatment of such systems is carried out applying in succession the equations3.12 and 3.15 to all stages, considering Fout from one step as the input to thefollowing.
It is worth noting that the examined Frantz-Nodvik solution also predictsa reshaping eect of the input pulse temporal prole, in the limit of strongsaturation. In order to investigate the problem at hand, it is useful to recast3.12 in a dierent form. Knowing that the uence is by denition the integralof intensity over time, deriving equation 3.12 would lead to:
Iout(t) =Iin(t)
1 +
(1
G0
− 1
)exp
(−Fin(t)
Fs
) (3.16)
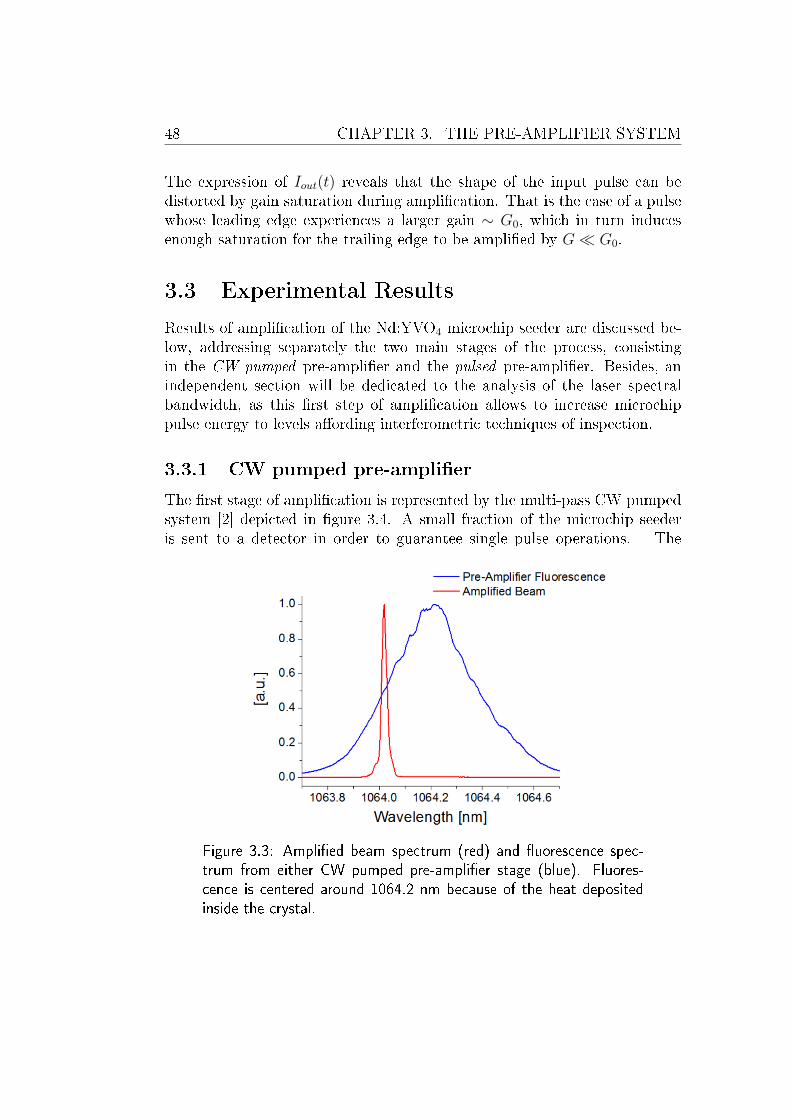
48 CHAPTER 3. THE PRE-AMPLIFIER SYSTEM
The expression of Iout(t) reveals that the shape of the input pulse can bedistorted by gain saturation during amplication. That is the case of a pulsewhose leading edge experiences a larger gain ∼ G0, which in turn inducesenough saturation for the trailing edge to be amplied by G G0.
3.3 Experimental Results
Results of amplication of the Nd:YVO4 microchip seeder are discussed be-low, addressing separately the two main stages of the process, consistingin the CW pumped pre-amplier and the pulsed pre-amplier. Besides, anindependent section will be dedicated to the analysis of the laser spectralbandwidth, as this rst step of amplication allows to increase microchippulse energy to levels aording interferometric techniques of inspection.
3.3.1 CW pumped pre-amplier
The rst stage of amplication is represented by the multi-pass CW pumpedsystem [2] depicted in gure 3.4. A small fraction of the microchip seederis sent to a detector in order to guarantee single pulse operations. The
Figure 3.3: Amplied beam spectrum (red) and uorescence spec-trum from either CW pumped pre-amplier stage (blue). Fluores-cence is centered around 1064.2 nm because of the heat depositedinside the crystal.

3.3. EXPERIMENTAL RESULTS 49
Figure
3.4:
CW
pumped
pre-am
plier
setup.(Blue)
Microchipseeder
plusdetection
branch.(Red)Multi-pass
amplier.(Green)Secondharmonicgenerationstage.
Listof
abbreviations:
L,lens;
HWP,half-waveplate;
BS,beam
splitter;
DET,detector;
ISO,opticalisolator;
C,crystal;TELE,telescope;LD,laserdiode,
DCH,
dichroic
mirror.
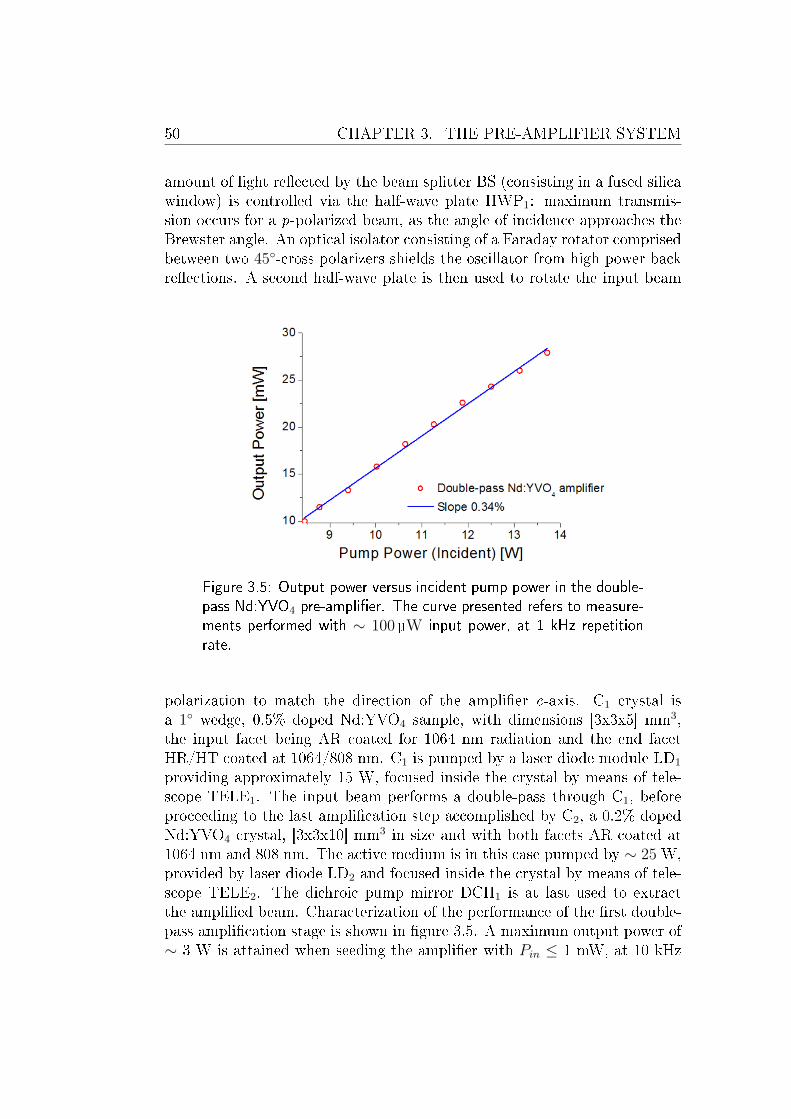
50 CHAPTER 3. THE PRE-AMPLIFIER SYSTEM
amount of light reected by the beam splitter BS (consisting in a fused silicawindow) is controlled via the half-wave plate HWP1: maximum transmis-sion occurs for a p-polarized beam, as the angle of incidence approaches theBrewster angle. An optical isolator consisting of a Faraday rotator comprisedbetween two 45-cross polarizers shields the oscillator from high power backreections. A second half-wave plate is then used to rotate the input beam
Figure 3.5: Output power versus incident pump power in the double-pass Nd:YVO4 pre-amplier. The curve presented refers to measure-ments performed with ∼ 100µW input power, at 1 kHz repetitionrate.
polarization to match the direction of the amplier c-axis. C1 crystal isa 1 wedge, 0.5% doped Nd:YVO4 sample, with dimensions [3x3x5] mm3,the input facet being AR coated for 1064 nm radiation and the end facetHR/HT coated at 1064/808 nm. C1 is pumped by a laser diode module LD1
providing approximately 15 W, focused inside the crystal by means of tele-scope TELE1. The input beam performs a double-pass through C1, beforeproceeding to the last amplication step accomplished by C2, a 0.2% dopedNd:YVO4 crystal, [3x3x10] mm3 in size and with both facets AR coated at1064 nm and 808 nm. The active medium is in this case pumped by ∼ 25 W,provided by laser diode LD2 and focused inside the crystal by means of tele-scope TELE2. The dichroic pump mirror DCH1 is at last used to extractthe amplied beam. Characterization of the performance of the rst double-pass amplication stage is shown in gure 3.5. A maximum output power of∼ 3 W is attained when seeding the amplier with Pin ≤ 1 mW, at 10 kHz

3.3. EXPERIMENTAL RESULTS 51
repetition rate. Analysis of the spectral traces of the amplied beam and theuorescence collected from either C1 or C2 conrms the predictions of section2.4, suggesting that tuning of the microchip laser towards longer wavelengthscould further improve amplication performance. The amplied pulse trainretains almost diraction-limit beam quality, with M2 < 1.4 in both axes(gure 3.6). In order to evaluate the extent of ASE contribution to the am-
Figure 3.6: M2 measurement of the amplied beam by means of theknife-edge technique.
plied beam, second harmonic generation is then triggered inside C3. TwoKTP crystals of dierent length are employed, respectively 5 mm and 8 mmlong, and the conversion eciency is measured against input intensity. BeingKTP a biaxial medium, a half-wave plate is needed to rotate the incomingbeam polarization so that type-II phase-matching condition can be fullled.Light is then focused inside the crystal and a nal dichroic mirror is used toseparate the fundamental beam from its second harmonic. The curves repre-sented in gure 3.7 reveal conversion eciencies on the same order of thosetypical to Q-switched pulses having analogous durations (i.e. few nanosec-onds) and peak intensities. Knowing that the optical power associated withASE is rather distributed on timescales considerably longer than the laserpulse duration, eventually producing a substantial eciency drop, it seemslegitimate to conclude that ASE contribution to the total output power isnegligible.

52 CHAPTER 3. THE PRE-AMPLIFIER SYSTEM
Figure 3.7: Second harmonic conversion eciency after the CWpumped pre-amplier system.
3.3.2 Pulsed pre-amplier
A second pulsed amplication stage is used to scale the repetition rate downto 20 Hz [1]. The setup is depicted in gure 3.8. The beam travels throughtwo consecutive 1% doped Nd:YVO4 slabs S1 and S2, 15 mm long and withboth input and output facets cut at a wedge-angle δ = 5. Each slab is side-pumped by a laser diode array delivering pulses with duration comparable tothe active medium uorescence lifetime and maximum peak power ∼ 200 W.The last step of amplication is instead performed inside another Nd:YVO4
slab, side-pumped by a laser diode stack providing Ppeak ∼ 1.8 kW whendriven at the maximum peak current, 180 A. In order to match beam dimen-sions with the stack pump spot-size inside the slab, a cylindrical telescopeTELE2 oriented along the vertical axis is placed before entering S3.
Careful design of the beam spot-size and the optical path geometry isneeded in order to maximize extraction from each slab, as well as to satisfy thegrazing incidence condition without clipping at the input and output crystalfacets. Looking more closely at the layout shown in gure 3.9, it appears thatthe input beam must fulll the condition of total internal reection on thepump surface, where it executes one bounce. Being n
(e)0 = 2.17 the refractive
index of Nd:YVO4 along the c-axis, a beam is totally reected by the internal

3.3. EXPERIMENTAL RESULTS 53
crystal surface if the angle γ (as indicated in gure) satises:
γ < arccos
(1
n(e)0
)∼ 62.6 (3.17)
Recognition of the fact that amplication takes place only in the regionwhere pump is absorbed leads to another constraint on the value of theinput angle of incidence φ. In the case of a 1% doped Nd:YVO4 crystal, theaverage absorption coecient at the pump wavelength (centered at 808 nm)is αp ∼ 20 cm−1, corresponding to an absorption length ∼ 500µm. This in
Figure 3.8: Pulsed pre-amplier setup. List of abbreviations: BS,beam splitter ; BAR, laser diode array ; STACK, laser diode stack ;ISO, optical isolator ; TELE, telescope; S, crystal slab.
turn means that the maximum distance of the beam from the pump surface(inside the slab) must be h ≤ 500 µm, which is always true for:
γ . arctan
(2h
L
)∼ 3.8
φ = arcsin[n
(e)0 sin (γ + δ)
]− δ . 14.4
(3.18)
assuming the refractive index of air to be one. The actual spot-size inside eachslab is then selected in order to maximize extraction from the ampliers (i.e.to work in saturation regime), with telescope TELE1 properly reshaping thebeam after the energy increase supplied by S1. Knowing that the saturationuence for vanadate crystals is Fs ∼ 0.16 J/cm2, a plot of the minimum spot-size w, needed to saturate the ampliers, versus input energy is presented ingure 3.10.

54 CHAPTER 3. THE PRE-AMPLIFIER SYSTEM
Figure 3.9: Grazing incidence geometry inside the active mediumslab.
Figure 3.10: (Left) Input angle φ into the slab versus grazing inci-dence angle γ. The red line limits the range of angles φ for whichthe beam successfully crosses the pump region. (Right) Minimumspot-size w saturating the amplier versus input pulse energy.
S1 S2 S3
Input pulse energy [mJ] 0.035 1 1.9
Output pulse energy [mJ] 1.35 2.4 10
Table 3.1: Pulsed pre-amplier performance, referring to the maxi-mum input energy level available at each sage.

3.3. EXPERIMENTAL RESULTS 55
Measurements of the pulse energy after each stage of amplication aresummarized in table 3.1. A fraction of the input beam energy (∼ 5 µJ) ispicked up before entering S1 for monitoring purposes, reducing the energylevel eectively seeding S2 to 1 mJ. An optical isolator is then introduced be-tween BAR2 and STACK, in order to shield the upstream stages from backreections. As a consequence, a transmission factor ∼ 80% for ISO mustbe taken into account to evaluate the actual pulse energy at the input of S3.When seeded with 1 kHz input pulse train, the amplier correctly guaranteespassive selection of only one pulse over 50 ms (corresponding to the pumprepetition rate): in fact adjacent replica (occurring 1 ms earlier/later) can-not benet anymore from an eective population inversion, depleted in themeantime by the rapid spontaneous emission (τf (1 kHz)−1).
3.3.3 Laser linewidth measurements
The pulse energy levels reached after amplication are compatible with thepossibility to investigate the laser linewidth by means of interferometric tech-niques. A rst measurement is performed using a xed etalon, or Fabry-Perotinterferometer [47], according to the scheme represented in gure 3.11. The
Figure 3.11: Setup used to perform the measurement of laserlinewidth. The beam crosses an etalon (FP) and is imaged into acamera (CCD) by means of a lens (L).
interference coming from multiple reections of a diverging beam crossingan etalon (having free spectral range ∼ 0.25 cm−1) is recorded with a CCDcamera. In order to take advantage of the higher sensitivity oered by thesilicon CCD detector in the visible, the measurement is carried out using thesecond harmonic of the amplied beam. The interference pattern collectedon plane B reveals a series of concentric ring-shaped fringes, which can beviewed as a set of parallel stripes applying a transformation from cartesianinto polar coordinates (gure 3.12). Quantitative analysis of the phase dif-ference ∆φ acquired by two consecutive reections coming from the etalon

56 CHAPTER 3. THE PRE-AMPLIFIER SYSTEM
Figure 3.12: Interference fringes developed after an etalon and im-aged into a CCD camera. The fringes are represented in cartesian(left) and polar (right) coordinates.
results in:
∆φ =4 π ν0
cneta
0 d eta cos θint (3.19)
being neta0 and d eta respectively the refractive index and the thickness of
the interferometer, with θint the internal reection angle. Investigation ofequation 3.19 reveals a proportionality between the angular coordinate θintand the laser frequency ν0, from which a relation between the angular spreadof each ring and the beam spectral linewidth can be deduced. For the samereason it is apparent that considerations on the spectral stability of the beamcan be inferred from uctuations of the rings with respect to the angulardisplacement. Accuracy in the measurement of such physical quantities islimited by a resolution that can be calculated from the ratio between thevalue of ∆φ and the phase dierence obtained from 3.19 replacing variablesν and θint with slightly shifted versions ν + ∆ν and θint + ∆θint. Neglectingthe cross-products ∆ν∆φ and transforming θint into the external angle ofincidence θext ∼ neta
0 θint, it follows:
∆νres ∼ν0 θext ∆θext
(neta0 )2
(3.20)
Values of θext and ∆θext can be estimated from the analysis of the fringespattern, as indicated in gure 3.13. Information regarding the imaging mag-nitude ratio M = CD /BC set by the relative distances of plane B, lens Land the CCD camera, in addition to the pixel size [3.75 x 3.75] µm2 and thedistance AB = 57.2 cm from the etalon to the image plane B are also needed
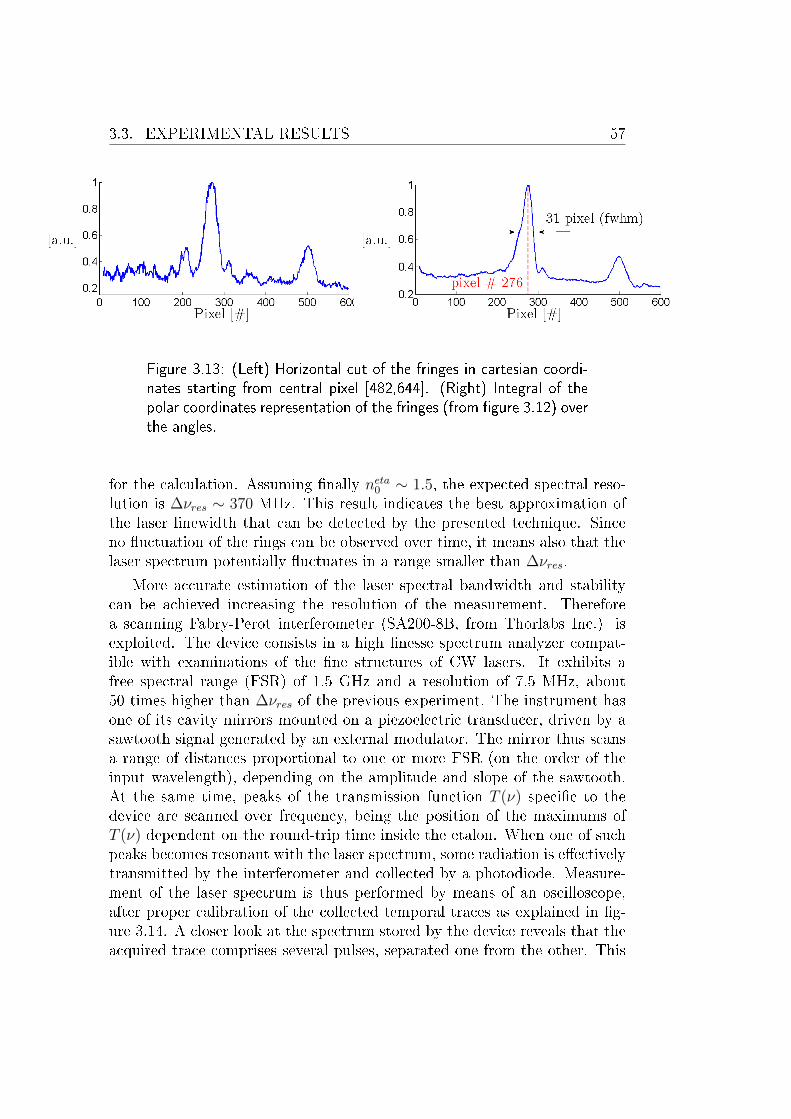
3.3. EXPERIMENTAL RESULTS 57
Figure 3.13: (Left) Horizontal cut of the fringes in cartesian coordi-nates starting from central pixel [482,644]. (Right) Integral of thepolar coordinates representation of the fringes (from gure 3.12) overthe angles.
for the calculation. Assuming nally neta0 ∼ 1.5, the expected spectral reso-
lution is ∆νres ∼ 370 MHz. This result indicates the best approximation ofthe laser linewidth that can be detected by the presented technique. Sinceno uctuation of the rings can be observed over time, it means also that thelaser spectrum potentially uctuates in a range smaller than ∆νres.
More accurate estimation of the laser spectral bandwidth and stabilitycan be achieved increasing the resolution of the measurement. Thereforea scanning Fabry-Perot interferometer (SA200-8B, from Thorlabs Inc.) isexploited. The device consists in a high nesse spectrum analyzer compat-ible with examinations of the ne structures of CW lasers. It exhibits afree spectral range (FSR) of 1.5 GHz and a resolution of 7.5 MHz, about50 times higher than ∆νres of the previous experiment. The instrument hasone of its cavity mirrors mounted on a piezoelectric transducer, driven by asawtooth signal generated by an external modulator. The mirror thus scansa range of distances proportional to one or more FSR (on the order of theinput wavelength), depending on the amplitude and slope of the sawtooth.At the same time, peaks of the transmission function T (ν) specic to thedevice are scanned over frequency, being the position of the maximums ofT (ν) dependent on the round-trip time inside the etalon. When one of suchpeaks becomes resonant with the laser spectrum, some radiation is eectivelytransmitted by the interferometer and collected by a photodiode. Measure-ment of the laser spectrum is thus performed by means of an oscilloscope,after proper calibration of the collected temporal traces as explained in g-ure 3.14. A closer look at the spectrum stored by the device reveals that theacquired trace comprises several pulses, separated one from the other. This

58 CHAPTER 3. THE PRE-AMPLIFIER SYSTEM
Figure 3.14: Calibration of the scanning Fabry-Perot interferometer.In order to transform the temporal axis acquired by the oscilloscopeinto frequencies, the time distance between the occurrence of twosuccessive replica of the laser spectrum must be compared to theFSR of the instrument.
happens whenever the input beam consists in a train of pulses, with durationshorter than the etalon photon decay time τ fpc and a repetition rate smallerthan (τ fpc )−1. That is the case of the example shown in gure 3.15. In order
Figure 3.15: Example of spectrum acquired by the scanning Fabry-Perot interferometer. The instrument is seeded with the ampliedmicrochip train of pulses at 10 kHz repetition rate. Note that thecalibration procedure does not allow to retrieve any quantitative in-formation on the absolute frequency of the laser.
to extract any useful information from the recorded spectra, a gaussian tof each trace is performed. The laser linewidth can therefore be deducedfrom the width of the gaussian t, while the spectral stability can be eval-uated from uctuations of the gaussian peak position. A comparison of thespectral bandwidth sustained by two microchips with dierent crystal length

3.3. EXPERIMENTAL RESULTS 59
is presented in gure 3.16, proving the possibility to narrow the linewidthapplying longer cavities. The best measured value of the bandwidth corre-sponds to < 50 MHz in the case of a 1.5 mm long cavity. The stability of the
Figure 3.16: (Left) Measurement of the linewidth of 1 mm long, 1%doped Nd:YVO4 microchip working at 10 kHz repetition rate. (Right)Measurement of the linewidth of 1.5 mm long, 1% doped Nd:YVO4
microchip working at 1 kHz repetition rate.
microchip spectrum is instead investigated in gure 3.17. The measurementis taken in the case of a sample not contacted to an external thermostat,therefore experiencing the same temperature of the surroundings. In theseregards it is worth noting that the picture reveals some spectral uctuationsoverlaid to a linear drift, which is compatible with a change of the room tem-perature: recalling in fact that the emission cross section of the microchipdrifts with temperature with a rate ∼ 4.7 pm/C [37], the measured drift of∼ 500 MHz over one hour corresponds to a temperature change of < 1 C.Analysis of the spectral stability shows slightly dierent features when a
heater is contacted to the microchip. No linear drift can now be observed,as the microchip temperature is xed by the thermostat. Besides the largeructuations represented in gure 3.18 can be explained with the sensitiv-ity of the PID controller driving the heater itself. In order to validate suchinterpretation, an upgrade of the electronic system regulating the heater isimplemented, exploiting a feedback signal based on the actual value of the mi-crochip temperature. The results are summarized in gure 3.19, in which twomeasurements taken with WS7 Wavelength Meter (from HighFinesse Laserand Electronic Systems GmbH) before and after the upgrade are comparedwith each other.

60 CHAPTER 3. THE PRE-AMPLIFIER SYSTEM
Figure 3.17: (Left) Measurement of the spectral stability of 1 mmlong, 1% doped Nd:YVO4 microchip working at 10 kHz repetitionrate. (Right) Plot of the residuals belonging to the linear t of theleft panel.
Figure 3.18: Measurement of the spectral stability of 1.5 mm long,1% doped Nd:YVO4 microchip thermally contacted to a thermostat.The device is operated at 1 kHz repetition rate.
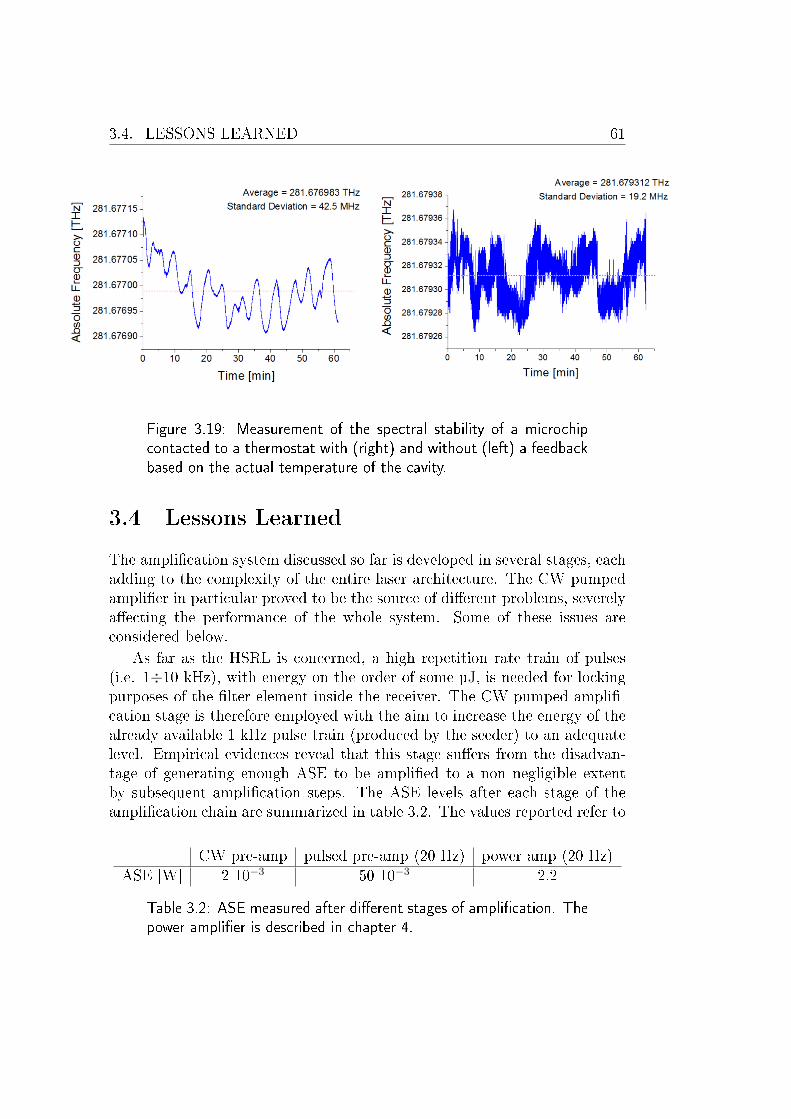
3.4. LESSONS LEARNED 61
Figure 3.19: Measurement of the spectral stability of a microchipcontacted to a thermostat with (right) and without (left) a feedbackbased on the actual temperature of the cavity.
3.4 Lessons Learned
The amplication system discussed so far is developed in several stages, eachadding to the complexity of the entire laser architecture. The CW pumpedamplier in particular proved to be the source of dierent problems, severelyaecting the performance of the whole system. Some of these issues areconsidered below.
As far as the HSRL is concerned, a high repetition rate train of pulses(i.e. 1÷10 kHz), with energy on the order of some µJ, is needed for lockingpurposes of the lter element inside the receiver. The CW pumped ampli-cation stage is therefore employed with the aim to increase the energy of thealready available 1 kHz pulse train (produced by the seeder) to an adequatelevel. Empirical evidences reveal that this stage suers from the disadvan-tage of generating enough ASE to be amplied to a non negligible extentby subsequent amplication steps. The ASE levels after each stage of theamplication chain are summarized in table 3.2. The values reported refer to
CW pre-amp pulsed pre-amp (20 Hz) power amp (20 Hz)ASE [W] 2 10−3 50 10−3 2.2
Table 3.2: ASE measured after dierent stages of amplication. Thepower amplier is described in chapter 4.

62 CHAPTER 3. THE PRE-AMPLIFIER SYSTEM
measurements carried out with no radiation (from the microchip oscillator)seeding the ampliers. As soon as the seeder is turned on, the amplier gainat each stage is depleted by the input signal, thus decreasing the eectiveamount of ASE. A proper estimate of the level of ASE superimposed to thelaser power during normal laser operations can be inferred with the help ofnon-linear techniques (e.g. second harmonic generation). In order to furtherreduce the extent of ASE, a couple of options can be considered. First, atemporal gating (e.g. from an electrooptic modulator EOM) can be intro-duced right after the CW stage, with the aim to block radiation between twoconsecutive laser pulses. In this case, only the fraction of ASE correspondingto τp / τf would eectively be amplied in the so called pulsed pre-amplier,being τp ∼ 10 ns the gate window and τf ∼ 100 µs the amplier window.Assuming the gain experienced by ASE in both 20 Hz stages to be the same,a nal output of ∼ 220µW is expected (with the seeder turned o). The ex-cellent performance of the temporal gating technique comes at the expense ofa substantial complication of the system layout, caused by the introductionof EOM. The second option deals with the possibility to reduce the gain ofthe CW pre-amplier. In these regards, assuming to keep the output powerunchanged (i.e. ∼ 30 mW according to gure 3.5), while starting with animproved seeder providing ∼ 1 µJ pulse energy (at 1 kHz), a gain reductionof ∼ 10 is applicable. In this case, the ASE produced by the CW stage wouldalso drop to 0.2 mW, which leads to an overall output power of ∼ 220 mW(with the seeder turned o), if the gain is assumed not to vary in the followingstages of amplication.
Recognition of the fact that the signal at the input of the CW pumped pre-amplier consists in a train of pulses, at 1 kHz repetition rate, suggests thatfurther advantages could be obtained driving the amplier pump with pulsesat the same frequency. This condition would indeed reduce the average powerdeposited by the pump module inside the active medium, as a consequencerelaxing the thermal eects produced by the established heat distribution.Referring for example to gure 2.15, a lower pump power leads to a lowercrystal temperature, which is compatible with higher values of the emissioncross-section and uorescence spectra tuned towards shorter wavelengths,therefore closer to the oscillator peak of emission. Additionally, a smoothertemperature prole is responsible for the development of a milder thermallens, contributing to improve the spatial quality of the amplied beam.

Chapter 4
The Power Amplier
A Nd:YAG pulse amplier arranged according to a zigzag conguration isemployed as a means to increase the energy of the low repetition rate trainof pulses considered in chapter 3. Thermal management issues are investi-gated, in order to appreciate the main advantages granted by the slab geom-etry. Theoretical formulation of the second harmonic generation is providedand second harmonic conversion tests of the amplied beam are reported,pointing out the maximum energy level available for lidar measurements.An overview of the prototype laser intended for the HSRL instrument iseventually presented, as the main challenges posed by spaceborne devicesare discussed.
4.1 Introduction to zigzag slab geometry
The zigzag slab laser geometry, also known as the total internal reectionface pumped laser geometry, was rst proposed by Martin and Chernoch atGeneral Electric [35], with the aim to reduce thermally induced optical distor-tions of the beam propagating through the slab, thus avoiding the limitationsimposed by rods.
Analysis of the temperature prole arising from the deposition of heat in-side a crystal rod, with cylindrical geometry, leads to recognition of a refrac-tive index change along the radial coordinate r, causing thermal lensing of abeam traveling parallel to the rod axis. Besides, the established temperaturegradient is responsible for the generation of mechanical stresses in the crystal,oriented along the radial r and tangential t coordinates, as the hotter core isconstrained from expansion by the cooler outer zone. These stresses producea modulation of the refractive index ∆n
(r)0 and ∆n
(t)0 , with ∆n
(r)0 6= ∆n
(t)0 , via
the photoelastic eect. The resulting birefringence ∆n(r)0 − ∆n
(t)0 increases
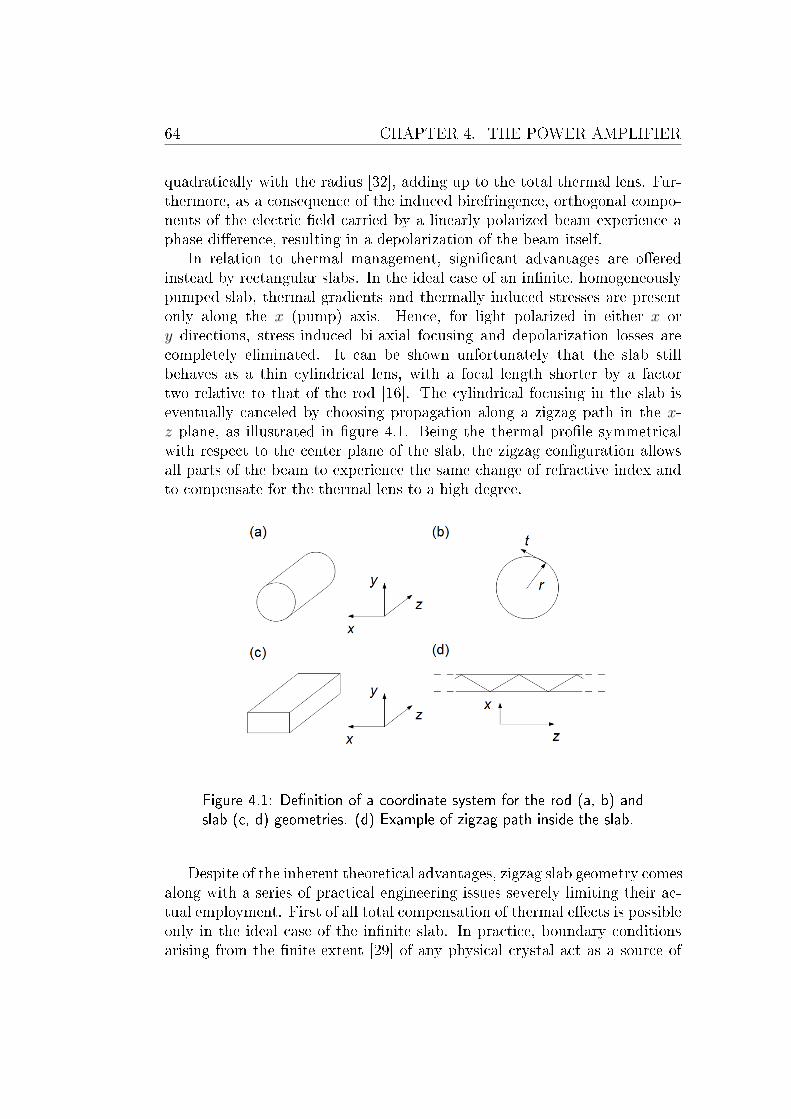
64 CHAPTER 4. THE POWER AMPLIFIER
quadratically with the radius [32], adding up to the total thermal lens. Fur-thermore, as a consequence of the induced birefringence, orthogonal compo-nents of the electric eld carried by a linearly polarized beam experience aphase dierence, resulting in a depolarization of the beam itself.
In relation to thermal management, signicant advantages are oeredinstead by rectangular slabs. In the ideal case of an innite, homogeneouslypumped slab, thermal gradients and thermally induced stresses are presentonly along the x (pump) axis. Hence, for light polarized in either x ory directions, stress-induced bi-axial focusing and depolarization losses arecompletely eliminated. It can be shown unfortunately that the slab stillbehaves as a thin cylindrical lens, with a focal length shorter by a factortwo relative to that of the rod [16]. The cylindrical focusing in the slab iseventually canceled by choosing propagation along a zigzag path in the x-z plane, as illustrated in gure 4.1. Being the thermal prole symmetricalwith respect to the center plane of the slab, the zigzag conguration allowsall parts of the beam to experience the same change of refractive index andto compensate for the thermal lens to a high degree.
Figure 4.1: Denition of a coordinate system for the rod (a, b) andslab (c, d) geometries. (d) Example of zigzag path inside the slab.
Despite of the inherent theoretical advantages, zigzag slab geometry comesalong with a series of practical engineering issues severely limiting their ac-tual employment. First of all total compensation of thermal eects is possibleonly in the ideal case of the innite slab. In practice, boundary conditionsarising from the nite extent [29] of any physical crystal act as a source of
4.2. SECOND HARMONIC GENERATION 65
residual optical distortions, which still need to be dealt with. Very stringentrequirements apply also to pumping and cooling mechanisms, in relation tothe attainment of a uniform temperature distribution inside the slab. Be-sides, polishing of the opposing crystal facets to a high degree of parallelismmust be ensured, in order to maintain total internal reection for the desiredpath length.
Improvements in the growth technology of crystal boules, in combina-tion with the adoption of laser diode pump sources and conduction-cooling(replacing water-based cooling systems), fostered the employment of zigzagslabs [46, 12], which are now largely employed in military and space-bornedevices.
4.2 Second harmonic generation
Second harmonic generation is a second-order non-linear eect triggered bythe interaction of light with a suitable dielectric material. As a result of suchinteraction, a polarization vector P is induced inside the medium, which canbe expanded in a series of powers of the electric eld E , in the frequencydomain, according to:
P (ω) = ε0
[χ(1)(ω) E(ω) + χ(2)(ω) E
2(ω) + χ(3)(ω) E
3(ω) + ...
](4.1)
being χ the electric susceptibility. Depending on the nature of the material,the polarization can comprise only odd powers of the electric eld, which isthe case of centrosymmetric crystals. As far as second harmonic is concerned,non-centrosymmetric media are needed, exhibiting dependence on the squareof the electric eld. In order to go deeper in the physics of second harmonic,investigation of the electric eld propagation equation through non-linearmedia is required:
∂2E
∂z2− 1
c2
∂2E
∂t2= µ0
∂2P
∂t2(4.2)
applying to a plane wave traveling along the z axis, with both E and Playing in the same (e.g. x) direction, being c the speed of light and µ0 thepermeability in vacuum. For the sake of a more general discussion, E andP can be thought of as two pulses, in which a phase factor can be separatedfrom a slowly varying envelope, resulting in:
E(z, t) = A(z, t) exp [ i (ω0 t− k0 z) ]
P (z, t) = p(z, t) exp [ i (ω0 t− kp z) ](4.3)

66 CHAPTER 4. THE POWER AMPLIFIER
with ω0 central frequency, k0 and kp respectively the wave vectors of theelectric eld and polarization. Investigation of equation 4.2 via the Fouriertheorem thus leads to the following result:
∂A
∂z+
(∂ω
∂k
∣∣∣∣k0
)−1∂A
∂t− i
2
∂2k
∂ω2
∣∣∣∣ω0
∂2A
∂t2= − i µ0 ω0 c
2n0
p e−i∆k z (4.4)
Equation 4.4 describes the evolution in space and time of the electric eldenvelope through a non-linear medium, in terms of group velocity vg =∂ω/∂k|k0 , group velocity dispersion (GVD) ∂2k/∂ω2|ω0 and wave vector mis-match ∆k = kp − k0, being n0 the refractive index of the material at ω0. Inparticular, the term proportional to ∂2A/∂t2 takes into account the lineardispersion only, hence can be neglected when referring to non-linear eects.In order to comprehend the whole second-order phenomena, E must be in-terpreted as the result of interaction of three dierent elds A1, A2 and A3
satisfying the condition ω3 = ω1 +ω2, generating likewise p1, p2 and p3 polar-izations. Introduction of the new terms inside equation 4.4, after removingfactor ∂2A/∂t2, leads to a set of coupled equations according to:
∂A1
∂z+
1
vg1
∂A1
∂t= − i ω1 deff
c n01
e−i∆k z A∗2A3
∂A2
∂z+
1
vg2
∂A2
∂t= − i ω2 deff
c n02
e−i∆k z A∗1A3
∂A3
∂z+
1
vg3
∂A3
∂t= − i ω3 deff
c n03
e−i∆k z A1A2
(4.5)
where deff = χ(2)/2 and ∆k = k3 − k2 − k1.
Second harmonic generation deals with the degenerate case in which theinteraction of two input beams sharing the same frequency ω1 = ω2 = ω(referred to as fundamental) produces a third beam at the double frequencyω3 = 2ω (i.e. second harmonic). In this situation the coupled equations from4.5 reduce to:
∂Aff
∂z+
1
vg,ff
∂Aff
∂t= − i ω deff
c n0,ff
e−i∆k z A∗ff Ash
∂Ash
∂z+
1
vg,sh
∂Ash
∂t= − i ω2 deff
c n0,sh
e+i∆k z A2ff
(4.6)
Analytical solution of the problem can be found in the regime of low con-version eciency, occurring when the fundamental beam is not depleted. In

4.3. EXPERIMENTAL RESULTS 67
Figure 4.2: Second harmonic evolution versus crystal length, in thecase of low conversion eciency. The behavior of I2ω for dierentvalues of the wave vector mismatch is reported.
this case the second harmonic intensity can be expressed in the form:I2ω = C2 L2 I2
ω
sin2 (∆k L / 2)
(∆k L / 2)2
C2 =8π2 d2
eff
ε0 c λ2ff n
30,ff
(4.7)
(4.8)
being L the non-liner crystal length. Inspection of equation 4.7 reveals thatI2ω grows quadratically with L only in the case of perfect phase-matching(i.e. ∆k = 0), otherwise it oscillates according to what depicted in gure4.2. Numerical calculations are instead necessary to adequately describe thesecond harmonic behavior in the case of high conversion eciency, as soonas depletion of the fundamental beam can no more be neglected [32].
4.3 Experimental results
A sample of 1% doped Nd:YAG slab having dimensions [0.8x0.8x13] cm3,is tested with the purpose of increasing the energy of an IR input beam(centered at 1064 nm) from 10 mJ to about 200 mJ. The amplier is side-pumped by nine laser diode stack modules, arranged according to the zigzagpath depicted in gure 4.3. Each module consists of ve diode arrays andsupplies ∼ 100 mJ energy at the maximum peak current of 140 A.
Mode-matching of the pump and input beams must be carefully designedin order to maximize energy extraction from the amplier. Since no reshap-

68 CHAPTER 4. THE POWER AMPLIFIER
Figure 4.3: (a) Schematic of the zigzag path inside the Nd:YAG slab.(b) Frontal view of the amplier.
ing optics are used between the stacks and the crystal, the pump spot-sizecorresponding to the slab facets can be deduced following geometrical con-siderations only. In the direction matching the diodes fast axis, each pump-ing unit produces a beam with diameter dy ∼ 5 mm, while a diameter ofdx ∼ 11.5 mm can be measured along the orthogonal axis. When devisingthe optimum dimensions of the input beam, a criterion based on enhance-ment of the overlap between its area and the pump spot can be taken intoaccount. In these regards it is important to comprehend the increase of thebeam radius in the direction laying in the zigzag plane. Referring to gure4.4, it is apparent that the beam radius win inside the crystal is larger than
Figure 4.4: (a) Increase of the beam radius due to refraction fromthe wedge input facet of the slab. (b) win is designed in order to llthe pump beam spot-size.

4.3. EXPERIMENTAL RESULTS 69
wout by a factor:win
wout
=cos (θin)
sin (α)∼ n0 (4.9)
being n0 the refractive index of the slab (in the case of Nd:YAG, n0 = 1.82 at1064 nm). The increase of win arises from refraction through the wedge facetof the crystal. Both the input and output facets of the active medium areindeed cut at an angle α granting θout to satisfy the Brewster condition, inorder to cancel any reection loss for an incident horizontally polarized beam(i.e. polarized in the plane of the zigzag path). Being α complementary toθout, it follows:
α = 90 − arctan (n0) ∼ 28.8 (4.10)
assuming the refractive index of air to be one. Further inspection of gure4.4 reveals that the beam traveling along the zigzag path perfectly matchesthe pump dimension dx when its radius reaches the critical value wx:
wx =dx2
sin (90− θr) ∼ 3.1mm (4.11)
where θr = α + θin ∼ 57.6, according to geometrical considerations. Theabove mode-matching analysis leads to denition of an elliptical input beam,having wy = dy/2 and wx = wx/n0.
Conduction cooling of the crystal is achieved contacting bottom and topsurfaces of the slab with a copper frame. Two thin layers of indium are usedto improve thermal management, favoring heat removal from the crystal
Figure 4.5: Pump emission spectrum. Light from the pumping unitsis imaged into the wavelength analyzer after absorption through theslab.

70 CHAPTER 4. THE POWER AMPLIFIER
through the mount. Pump absorption is optimized by means of temperaturetuning of the stacks, as reported in gure 4.5.
A characterization of the amplier performance is shown in gure 4.6 as afunction of the pump energy. A pump pulse duration approaching Nd:YAGuorescence lifetime (τf = 230 µs) is exploited, taking thus advantage of thematerial long time of storage. An amplication factor ∼ 18 is reached when
Figure 4.6: Amplied pulse energy versus pump energy. The amplieris seeded with ∼ 10 mJ input at 20 Hz repetition rate.
seeding the slab with an input pulse train at 20 Hz repetition rate, having∼ 10 mJ energy per pulse. The corresponding optical-to-optical conversioneciency of ∼ 20% is compatible with typical values reported in literature[30].
Second harmonic conversion of the amplied beam is nally triggeredinside a KTP non-linear crystal having volume [8x8x8] mm3, with both inputand output facets AR coated at 1064 nm and 532 nm. A beam radius ∼ 2 mmis chosen in order to reduce the peak intensity Ip to a value below the coatingdamage threshold (∼ 500 MW/cm2 for ∼ 10 ns input pulses), at the sametime granting a suciently high conversion eciency (proportional to Ip).Pulse energy values as high as ∼ 80 mJ, at 532 nm, are measured after acouple of dichroic mirrors used to separate the second harmonic from thefundamental beam.

4.4. THE LASER FOR HSRL 71
Figure 4.7: Second harmonic conversion of the amplied beamthrough a KTP non-linear crystal.
4.4 The laser for HSRL
Results of the experiments on the microchip oscillator and the subsequentamplication chain were exploited to build a prototype of laser intended fora spaceborne high spectral resolution lidar, with the specications listed intable 4.1.
Operating Wavelength 532 nm and 1064 nm
Repetition Rate 20 Hz
Pulse Energy (at 532 nm and 1064 nm) 110 mJ
Divergence (after beam expander) 100µrad
Linear Polarization Extinction Ratio 1000:1
Spectral Width ≤ 50 MHz
6% Energy Performance Fall-O after 109 pulses
Table 4.1: Specications for the spaceborne HSRL laser.
A picture of the device is represented in gure 4.8. The laser is providedwith two output ports: the rst one delivers low energy (∼ 5 µW) and highrepetition rate (1 kHz) pulses; the second port makes instead available atrain of pulses at 20 Hz with an energy per pulse on the order of ∼ 100 mJ,both in the IR (1064 nm) and visible (532 nm) spectral regions. The 1 kHzmonitor port serves the purpose to lock the receiver of the lidar system(for more details on lidar architecture the reader should refer to chapter1). On the other hand the 20 Hz main port provides enough energy toprobe the atmosphere from satellite platforms, making the device suitablefor spaceborne applications. Conductive cooling is demonstrated throughcontact of multiple cold plates on the bottom layer of the laser structure. Anexternal beam expander is applied to enlarge the beam size with the aim to

72 CHAPTER 4. THE POWER AMPLIFIER
satisfy the constraint on divergence.
Figure 4.8: (Top) Picture of the laser prototype. (Bottom) Schematicof the laser layout, displaying the device output ports and theconductive-cooling system.
In order for the device to successfully face the challenges posed by spaceenvironments, several issues must be dealt with [49]. Space-qualied hard-ware must be adopted, sustaining dedicated tests with the purpose to proveoperation in troublesome conditions. The likelihood of system failure fromthe mechanical point of view is particularly critical during launch, as the laserundergoes harsh vibrations. Once in orbit, the system is exposed to largevariations of temperature of the spacecraft, calling for a reliable temperaturecontrol mechanism. In these regards water cooling is not feasible and othercooling strategies (e.g. conductive cooling) must be devised. Operating in

4.4. THE LASER FOR HSRL 73
a vacuum poses additional diculties. To prevent contamination of criticaloptical surfaces, material usage must be limited to those exhibiting a verylow tendency to outgas. Furthermore, redundancy as a means to ensure con-tinuous long-time utilization can be applied only moderately, because weightand power represent an issue on the spacecraft.
The laser prototype has been designed and assembled in Bright SolutionsSrl with the help of the Laser Source Laboratory (LSL) of Università degliStudi di Pavia, in the framework of an international project also involvingConsorzio Nazionale Interuniversitario per le Scienze siche della Materia(CNISM), Università degli Studi di Napoli Federico II, Università degli Studidell'Aquila, Advanced Lidar Applications Srl (ALA) and Beijing ResearchInstitute of Telemetry (BRIT).

74 CHAPTER 4. THE POWER AMPLIFIER

Chapter 5
Solid-State Raman Lasers
The behavior of a strontium tungstate SrWO4 crystal is investigated in theframework of stimulated Raman scattering experiments, when pumped withpulses of dierent durations and wavelengths. In order to understand thecharacteristics of the newly generated radiation, theoretical description ofthe stimulated Raman scattering process is presented, addressing to dier-ent temporal regimes as well as to spatial properties issues. The class ofcrystalline Raman media is discussed in details, pointing out the dierencesbetween spectral and thermo-mechanical features oered by dierent sam-ples, including the case of study (SrWO4). Analysis of the experimentalresults is nally carried out, along with the introduction of two dierentpump laser sources used to probe the material response on dierent timescales.
5.1 Stimulated Raman Scattering
Solid-state Raman lasers [40] represent a class of devices exploiting the non-linear optical process of stimulated Raman scattering (SRS), in order toaccess spectral regions not covered by available solid-state laser crystals. Thephenomenon of SRS was rst observed by Eckhardt [15] in 1963, as soon aslasers were able to provide high enough peak powers to trigger non-linearresponses from a suitable material.
SRS is an inelastic scattering process involving the interaction of an in-cident photon (associated to the so called fundamental or pump beam) witha molecule. Depending on initial conditions (i.e. whether the molecule isin its ground or excited state), the pump can transfer energy to the Ra-man medium, which in turn releases a lower frequency beam (referred to asStokes line), or extract energy from the already excited molecules, resulting

76 CHAPTER 5. SOLID-STATE RAMAN LASERS
Figure 5.1: SRS energy level diagram in the case of Stokes (left) andanti-Stokes (right) generation.
in a scattered light at higher frequency (called the anti-Stokes line). Thesituation is summarized in gure 5.1 and can be expressed analytically asfollows:
ωS = ωp − ΩR
ωAS = ωp + ΩR(5.1)
where the various terms represent, in order of appearance, the angular fre-quency of the Stokes and the pump beams, the angular frequency of the Ra-man transition and that of the anti-Stokes radiation. It is worth noting thatthe anti-Stokes lines are typically much weaker than Stokes counterparts,since they rely on starting population in the excited state, whose value ispredicted by the Boltzmann distribution at thermal equilibrium.
Referring to the light-matter interaction theory presented in section 4.2,SRS is fully ascribed to the term proportional to χ(3) in the Taylor polyno-mial of the induced polarization P , in agreement with its nature of third-ordernon-linear eect. In these regards, the need for pump pulses with durationon the order of the nanoseconds timescale (or even less) is apparent, in orderto achieve peak intensities suitable for SRS to be triggered inside Ramanmedia. From a physical point of view, several types of SRS can be distin-guished from each other, as the interaction between the pump and activemedium can involve dierent phenomena, including molecular vibrations (ofparticular interest in crystalline media), lattice waves and spin-ip eects.At any rate it is possible to identify a characteristic material response timeT2, after which it is legitimate to assume the interaction to be over. T2
is referred to as dephasing time and it is found to be proportional to theinverse of the linewidth associated with the Raman transition, accordingto T2 = (π c∆ΩR)−1 (valid in the limit of homogeneous broadening of thelinewidth, resulting in a Lorentzian prole). Depending on the eective dura-

5.1. STIMULATED RAMAN SCATTERING 77
tion τp of the pump pulses with respect to T2, two dierent operating regimesare recognized: a steady-state is reached in the limit τp T2; on the otherhand, a transient regime is established as soon as τp becomes comparable toor shorter than T2 (typical values of T2 in the case of crystalline Raman mediaare on the order of 10 ps). Investigation of these regimes leads to dierencesin the formulation of critical parameters involved by Raman scattering, asexplained below.
5.1.1 Steady-state and transient SRS
Limiting the discussion of SRS to the situation in which a single Raman tran-sition (i.e. rst Stokes) experiences enough gain to be observed, at the sametime applying a plane-wave approximation and neglecting pump depletion,the growth of the Stokes beam can be written as:
IS(L) = IS(0) exp (gR Ip L) (5.2)
being gR tha Raman gain, in units [cm/GW], Ip and IS the pump and Stokesintensities respectively and L the length of the Raman medium. Accordingto equation 5.2, an integral gain GR can be dened, satisfying GR = gR Ip L.Accurate analysis of the Raman behavior in dierent regimes reveals thatthe expression of gR changes considerably according to the duration of thepump pulses, with implications on the performance of the SRS process aswell as on a priori considerations regarding the choice of the Raman activematerial. Mathematical formulation of GR in the steady-state and transientregimes is consistent with [8]:
G(ss)R ∝ σR
∆ΩR
G(tr)R =
√4G
(ss)R
τpT2
(5.3)
(5.4)
having introduced the Raman scattering cross-section σR. Some importantconclusions can be derived from equations 5.3 and 5.4: the Raman gain intransient regime decreases proportionally to the duration τp of the pumppulses; while in the steady-state the gain is proportional to the ratio betweenthe scattering cross-section and ∆ΩR, in transient regime G
(tr)R does not de-
pend anymore on the Raman linewidth, thanks to the introduction of factorT2 ∝ ∆Ω−1
R . Values of σR /∆ΩR and σR itself can be characterized respec-tively as a peak intensity and an integral value of the measured spontaneousRaman scattering spectrum. For the sake of simplicity, it is therefore useful

78 CHAPTER 5. SOLID-STATE RAMAN LASERS
to denote the two factors as:G
(ss)R ∝ σR /∆ΩR ∼ Σpeak
G(tr)R ∝ σR ∼ Σint
Theoretical results concerning stimulated Raman scattering in both steady-state and transient regimes agree in the prediction of a decrease in the thresh-old value, as shorter pump wavelengths are employed. This prediction issupported by empirical evidence, even if experimental measurements revealchanges of the gain versus frequency larger than the one inferred from theory[40].
In addition to gain behavior, other issues concerning temporal character-istics of the Stokes pulses must be considered. Carman et al. [11] showedthat transient SRS leads to some sharpening of the Stokes signal in the timedomain (self-steepening), with a consequent spectral broadening. In factthe Stokes beam increases rapidly as soon as gain is established inside themedium by the leading edge of the pump pulse, whereas it closely followsthe pump pulse shape in the tail. This attitude is in contrast to SRS per-formance in the steady-state regime (i.e. with a pump spectrum narrowerthan the Raman linewidth ∆ΩR), when spectral narrowing [42] is expectedto occur because of the higher Raman gain experienced at the line centerwith respect to its wings. The reduction of the spectral bandwidth ∆Ω
(GN)R
predicted by gain narrowing can be evaluated according to [18]:
∆Ω(GN)R = ∆ΩR
√ln 2
ln (ES / ~ωS)(5.5)
certifying that ∆Ω(GN)R decreases proportionally to the ratio between the
output Stokes pulse energy ES and that of the spontaneously emitted singleStokes photon.
5.1.2 Spatial characteristics
Due to the inelastic nature of SRS, energy is deposited as heat in the Ramanmedium during the process. Thermal loading must therefore be taken intoaccount, especially when scaling devices to higher average powers. Referringin particular to solid-state Raman media, various issues ought to be con-sidered in order to accurately model the eects arising from the establishedtemperature prole inside the material. For instance in Raman crystals heatis deposited where Stokes photons are generated, which is assumed to beuniformly along the whole length of the medium. Depending on the pump

5.1. STIMULATED RAMAN SCATTERING 79
beam repetition rate and crystal properties, the temperature prole may ormay not completely relax between two consecutive pulses. In crystalline Ra-man media the thermal time constant τT is typically on the order of 1÷10 s,meaning that a steady-state condition is always reached, except for the verylower repetition rates. The main drawback arising from the developed heatdistribution is associated with the installment of a thermal lens. Consideringonly the dominant thermo-optic contribution, the thermal focal length fTL
[40] can be expressed as:
1
fTL
=∂n0
∂T
1
kC
PS
π ω2S
(λSλp− 1
)(5.6)
being λS and λp the Stokes and pump wavelengths respectively. Analysisof equation 5.6 reveals that the lens power is proportional to the productbetween the power PS of the generated Stokes beam and the thermo-opticcoecient ∂n0/∂T , as well as to the inverse of the thermal conductivity kCof the medium.
Several studies performed on stimulated Raman scattering conrmed itoccurs very often in combination with other non-linear processes, includingself-focusing. In this case, a modulation of the refractive index experienced bythe pump pulse propagating through the medium is induced by its intensitydistribution, according to:
n0 = n(0)0 + n
(2)0 I (5.7)
Assuming a Gaussian intensity prole, the refractive index described by equa-tion 5.7 acts once more as a source of a lens, whose radius of curvature de-pends on the value of coecient n
(2)0 , which is related to the real part of
the third-order susceptibility χ(3). The whole process is characterized by athreshold power level P
(th)SF , above which focusing of the beam occurs within
a nite distance. Competition between self-focusing and SRS can serve tolower the incident power required to reach the threshold P
(th)SRS for Raman
scattering (in case P(th)SF < P
(th)SRS), or mitigate the refractive index modula-
tion by limiting the available pump power (in case P(th)SF > P
(th)SRS).
The Stokes beam is often reported to have much better spatial qualitythan the fundamental, in diverse Raman media. The basics of Raman beamcleanup [38] can be intuitively understood recalling that Stokes radiationevolves from noise, being accordingly amplied by the SRS process. Thusthe intensity distribution of the pump acts as a spatial lter, inducing rapidlyincreasing losses the farther one moves from its peak, allowing the Ramanshifted beam to develop in the lowest-order propagation mode, regardless ofthe actual spatial quality of the fundamental beam itself.

80 CHAPTER 5. SOLID-STATE RAMAN LASERS
5.2 Crystalline media for SRS
Raman active media include solids, liquids and gases as well. As far as lowrepetition rates are involved (i.e. on the order of tens of Hz), gases oer somebenets related to their intrinsic higher threshold for self-focusing and lowscattering losses. However, because of their poor thermal properties, appli-cations at higher repetition rates are severely limited by thermal lensing, inagreement with the results of equation 5.6. Liquid media for SRS did not ndfertile ground on which to develop, mainly due to the toxicity/volatility of thematerials and the high incidence of absorption at the Stokes wavelengths ofinterest (e.g. in the visible and near infrared). Crystals, in contrast, oer highgain and good thermo-mechanical properties, being at the same time com-patible with the development of an all-solid-state based technology. Ramanlasers based on Nd doped materials increased access to the infrared spectralregion covering wavelengths longer than 1.4 µm, fostering eyesafe applica-tions (e.g. for lidar instruments). Possibly the most useful role of solid-stateRaman lasers concerns the opportunity to access the yellow-orange spectralregion, either through second harmonic generation triggered by infrared SRSbeams or pumping Raman lasers with visible light, as it is required by diverseapplications, including medicine, coastal bathymetry and laser guidestars.
Dierent families of crystals [7] available for SRS can be identied, de-pending on their structure. A rst classication comprises crystals com-
posed of one or two elements, having its best representative in diamond(C). Diamond is also one of the materials in which stimulated Raman scatter-ing was rst observed, in the early 1960s. It exhibits a very large frequencyshift ΩR as well as one of the highest Raman gain, having at the same timeexcellent thermal properties. Unfortunately, due to its small dimensionsand high cost, it did not nd many practical applications as a Raman ma-terial. Molecular ionic crystals are another type of SRS active media.They are composed of a cation atom and an anion complex, bound to eachother with ionic bonds, while covalent bonds dominate inside the molecu-lar complexes. In these crystals, intense Raman modes correspond to thesymmetrical internal valent vibrations inside the molecular group. Exam-ples of materials belonging to this family include nitrates and tungstates.Being rst introduced in the early 1980s, nitrates [NO3] have been largelyemployed in conjunction with nanoseconds pump pulses, by means of whichthey allow to achieve remarkably high conversion eciencies (> 70%). Infact, thanks to their narrow Raman linewidth ∆ΩR, substantial enhance-ment of the steady-state Raman gain is expected. However, the quite lowvalues of their integral cross-section Σint make them unsuitable for SRS assoon as shorter pump pulses are involved, as the Raman threshold drastically

5.2. CRYSTALLINE MEDIA FOR SRS 81
CRYSTAL
ΩR
∆Ω
RT
2§
g SS∗
Σpea
kΣ
int
α†
HARDNESS
kC‡
[cm−
1]
[cm−
1]
[ps]
[cm/G
W]
[%]
[%]
[10−
6K−
1]
[Mohs]
[Wm−
1K−
1]
Diamond(C)
1332.9
(a)
2.7
(a)
3.9
12(b
)100(
a)
100(
a)
1.1(
c)10
2200
(b)
CaC
O3
1086.5
(d)
1.3(
d)
8.2
4.3(
d)
10.6
(a)
6(a)
25.6
(d)
35.4(
d)
Ba(NO
3) 2
1048.6
(a)
0.4(
a)
26.5
11(e
)63
(a)
21(a
)13
(f)
2.5-3
1.17
(f)
BaW
O4
926.5(
a)
2.2(
a)
4.8
8(g)(c-axis)
64(h
)52
(h)
35(i
)(c-axis)
4-5
2.3(
i)(c-axis)
11(i
)(a-axis)
2.3(
i)(a-axis)
KGd(W
O4) 2
901(
a)
5.4(
a)
23.3(
e)(c-axis)
25(a
)54
(a)
8.5(
l)(c-axis)
4-5
3.4(
l)(c-axis)
4(l)(a-axis)
2.6(
l)(a-axis)
768(
a)
6.4(
a)
1.7
4.4(
e)(c-axis)
29(a
)65
(a)
8.5(
l)(c-axis)
4-5
3.4(
l)(c-axis)
4(l)(a-axis)
2.6(
l)(a-axis)
PbWO
4904.7(
m)
4.1(
m)
2.6
10.9
(m),♣(c-axis)
97(m
)171(
m)
29.5
(n)(c-axis)
4-5
2.4(
o)(c-axis)
12.8
(n)(a-axis)
2(o)(a-axis)
SrW
O4
921(
m)
2.7(
m)
3.9
5(c-axis)(p)
41(m
)50
(m)
18.8
(l)(c-axis)
42.9(
l)(c-axis)
4(a-axis)(p)
8.6(
l)(a-axis)
3.1(
l)(a-axis)
SrM
oO4
887.7(
a)
2.8(
a)
3.8
5.6♣
(c-axis)
51(a
)55
(a)
17(q
)(c-axis)
45.9(
q)(a-axis)
4.2(
r)(a-axis)
LiNbO
3632(
a)
27(a
)0.4
12(s
)(c-axis)
18(a
)166(
a)
4.1(
t)(c-axis)
54.6(
u)(c-axis)
14.8
(t)(a-axis)
Ca 5(PO
4) 3F
964.7(
a)
2.8(
a)
3.8
0.4(
v),♠
3.8(
a)
3.4(
a)
11.5
(v)(c-axis)
51.9(
v)(c-axis)
9.6(
v)(a-axis)
2.1(
v)(a-axis)
§calculatedaccordingto
reference
[8]
†thermalexpansion
at∼300K
‡thermalconductivityat∼300K
∗steady-state
Ram
angain
at1064
nm
♣at
1047
nm
♠seereference
[28]forfurther
details
(a)reference
[7]
(b)reference
[19]
(c)reference
[43]
(d)reference
[27]
(e)reference
[40]
(f)reference
[59]
(g)reference
[33]
(h)reference
[6]
(i)reference
[22]
(l)reference
[17]
(m)reference
[8]
(n)reference
[25]
(o)reference
[10]
(p)reference
[18]
(q)reference
[34]
(r)reference
[41]
(s)reference
[26]
(t)reference
[9]
(u)reference
[58]
(v)reference
[28]
Table5.1:
Listof
SRSactive
crystals.

82 CHAPTER 5. SOLID-STATE RAMAN LASERS
increases. In the second half of the '80s, tungstate crystals were introducedwhich overcome this limitation. Tungstates can in turn be divided into twogroups. Crystals with scheelite structure have one intense Raman line corre-sponding to the internal symmetrical valent vibration in [WO4] tetrahedrongroup. This kind of crystals exhibits an increasing frequency shift ΩR withincreasing radius of the cation bound to the [WO4] complex, along with areduction of the linewidth. Tungstates with monoclinic structure are char-acterized by edge shared [WO6] octahedrons forming molecular groups withRaman spectra considerably dierent from those of scheelite counterparts:two strong Raman lines specically originate from vibrations of the [WO6]complex. Overall, tungstate crystals feature high integral Raman scatter-ing cross-section Σint, making them suitable for transient SRS experiments.Monoclinic-type tungstates in particular exhibit larger spectral broadening,resulting in values of Σpeak lower than the ones oered by samples belongingto the scheelite family. Molybdate [MoO4] crystals are shown to reveal prop-erties very similar to tungstates, except for a tendency towards higher valuesof Σpeak. Among the niobate family, lithium niobate (LiNbO3) deserves spe-cial attention: because of its extremely large Raman linewidth, it exhibitsan integral cross-section value even larger than diamond Σint. Applicationsin this case are limited by the very low value of Σpeak and the quite shortfrequency shift oered by the material. Phosphates [PO4] are also good can-didates for SRS in transient regime, thanks to their large Raman frequencyshift and broad linewidth ∆ΩR.
A list of properties of crystals commonly employed as active media forstimulated Raman scattering is presented in table 5.1. Complete charac-terization of the whole crystals reported is beyond the scope of this work(the reader should reference to the sources indicated in the table for furtherdetails on specic media). In the following, the behavior of SrWO4 is thor-oughly discussed, paying particular attention to its employment in actualSRS experiments. Thanks to the combination of good thermo-mechanicaland spectral properties, the material poses itself as a promising low-cost al-ternative for laser sources based on Raman scattering, operating in dierenttemporal regimes.
5.3 Experimental results
Stimulated Raman scattering inside a SrWO4 crystal, arranged in single-pass,traveling-wave conguration, is investigated. Two dierent pump sourcesare employed, providing pulses with durations on dierent time scales (i.e.nanoseconds and picoseconds), in order to explore the material behavior in

5.3. EXPERIMENTAL RESULTS 83
both steady-state and transient SRS regimes. Dual-wavelengths analysis ofthe Raman process is also carried out, in the case of the steady-state regime,covering near-infrared and visible spectral regions.
5.3.1 SrWO4 crystal
Strontium tungstate, SrWO4 [17, 52, 5, 60], exhibits crystallographic (scheel-ite) tetrahedral structure, belonging to C6
4h (I41/a) space symmetry group.It is an indirect band gap material, with Eg = 4.56 eV. Main crystal proper-ties are listed in table 5.1. SrWO4 expands when heated, with an expansionratio almost linear in the temperature range 300 ÷ 800 K. The thermal ex-pansion coecient α along the c-axis is about two times larger than thatin the a,b-axes, denoting an anisotropy level comparable to or less than theone typical of other tungstate crystals of interest. Large values of thermalexpansion anisotropy increase the risk of cracking during crystal growth andcrystal processing, when the temperature gradient is excessive, thus limit-ing production to samples with small dimensions. The thermal conductivitycomponents of SrWO4 decrease with increasing temperature, while main-taining values higher than or comparable to those of other crystals of thesame family. During operation of a Raman laser the active medium absorbsenergy from the pump source, which is deposited as heat inside the crystal.Materials possessing high thermal conductivity can easily transfer this heat
Figure 5.2: Ordinary (blue) and extraordinary (red) refractive indexesof SrWO4, extending the Sellmeier equations measured in [52] to thespectral region between 400 nm and 1.1 µm. The predicted value ofrefractive index at 1064 nm is substantially lower than n0 = 2.13,reported in [14].

84 CHAPTER 5. SOLID-STATE RAMAN LASERS
to the environment, hence decreasing thermal loading eects and openingup the possibility of pumping at higher repetition rates. Another importantfactor, aecting the damage threshold of the material, is specic heat. Inthe case of SrWO4 in particular, specic heat is almost linear and has lit-tle variations over the temperature range 325 ÷ 1000 K, with an averagevalue ∼ 107.4 J/(K mol). When compared to other available Raman activecrystals, SrWO4 stands out for the possibility to be grown in large dimen-sions (i.e. several centimeters long) thanks to the Czochralski method [50]combined with an intrinsic low melting point. For example, KGd(WO4)2(KGW) has good properties too for SRS applications, but it is grown by theux method, which may limit crystal dimensions since the the crystal growthcan take long times. Vanadate crystals also give rise to very weak thermallensing eects, but they have high melting point and crystal growth of largedimension boules is very dicult.
From an optical point of view, SrWO4 behaves as a birefringent negativeuniaxial crystal, with a transparency region spanning from 264 nm to 5.3 µm.A plot of the material refractive indexes is represented in gure 5.2.
5.3.2 The pump sources
The pump source suitable for the steady-state experiments is a passively Q-switched (PQS) master oscillator power amplier (MOPA) delivering∼ 550 pslong, single-longitudinal-mode pulses at 1064 nm, at a repetition rate ad-justable between 2 kHz and 7 kHz [4]. The maximum available pulse energyis 325µJ at 2 kHz, with a slightly lower value ∼ 275µJ at 7 kHz (correspond-ing to ∼ 1.92 W average power), because of the reduction of the ampliergain for repetition rates approaching the inverse of the active medium uores-cence lifetime (τf ∼ 100µs for Nd:YVO4). The beam preserves the excellentspatial quality of the master oscillator, resulting in a M2 = 1.2 at maximumpower. Second harmonic generation (SHG) is optionally triggered inside aKTP crystal. Frequency doubling conversion eciencies close to 60% areeasily obtained, producing a maximum pulse energy ∼ 200µJ at 532 nm.
A schematic of the pump source setup is depicted in gure 5.3. The PQSCr4+:YAG/Nd:YAG laser provides a train of pulses with ∼ 50µJ energy,which is then amplied through a double-pass power amplier. C1 is a 0.3%doped Nd:YVO4 crystal, with size [3x3x10] mm3, pumped by a CW laserdiode (LD) coupled to a 200µm core optical ber and delivering 20 W averagepower at 808 nm. An achromatic telescope, TELE1, serves the purpose offocusing the pump radiation inside C1. Mirror M1, HR coated at 1.064µmwhile transmitting the pump wavelength, is used to perform the second passin the amplier. Optionally, mirror M2 can divert the MOPA output beam

5.3. EXPERIMENTAL RESULTS 85
Figure 5.3: Pump setup for steady-state SRS experiments, comprisinga master oscillator (orange), a power amplier (blue) and the SHGstage (green). List of abbreviations: PQS, passively Q-switched ;MOPA, master oscillator power amplier ; SHG, second harmonic
generation; LD, laser diode; TELE, telescope; L, lens; M, mirror ; C,crystal ; HWP, half-wave plate.
into the SHG stage. Here, a half-wave plate rotates the beam polarizationin order to perform type II phase-matching inside a sample (C2) of KTP,8 mm long and cut at the angles θ = 90 and φ = 23.5. Focusing of thebeam through lens L3 is necessary in order to reach intensity levels (on theorder of 100 MW/cm2) suitable to ensure substantial conversion eciencies.Recollimation and consecutive extraction of the green light is performed bymeans of lens L4 and dichroic mirror M3 (HR at 532 nm and HT at 1064 nm)respectively.
Transient stimulated Raman scattering regime is accessed through ahybrid ber/bulk MOPA laser source [3, 2]. The master oscillator consists inthis case in a mode-locked picoseconds ytterbium doped ber laser, producing16 ps long pulses with 0.1 nm (FWHM) broad spectrum centered at 1064 nm.The output power from the oscillator is increased up to 20 mW thanks to aYb-ber preamplier, after which an acousto-optical modulator reduces therepetition rate from 20 MHz to 250 kHz. A nal average power of 3.75 W(corresponding to 15µJ pulse energy and 1 MW peak power) is reached after

86 CHAPTER 5. SOLID-STATE RAMAN LASERS
a double-stage Nd:YVO4 power amplier. Pulse duration, spectral widthand spatial beam quality (M2 < 1.5) are well preserved after amplication.
Figure 5.4: Solid-state power amplier of the pump source used fortransient SRS experiments. List of abbreviations: ISO, optical isola-tor ; L, lens; C, crystal ; M, mirror ; LD, laser diode; TELE, telescope.
An overview of the solid-state power amplier is represented in gure 5.4.The rst high gain module is pumped by a 15 W ber-coupled laser diode(LD1), which is focused inside the crystal by means of telescope TELE1 intoa pump spot diameter of 2wp1 = 120 µm. The amplier active medium C1
is a 1 wedge, [3x3x5] mm3, 0.5% doped Nd:YVO4 crystal. The HR/ARcoating at 1064/808 nm on the pump facet grants the possibility to exploit adouble-pass conguration, while the AR coating at 1064 nm on the oppositefacet helps in minimizing reection losses. Extraction from the amplier isaccomplished by the same lens L1 focusing the pulse train provided by themaster oscillator inside C1. The second stage of the amplier employs a0.2% doped Nd:YVO4 crystal C2, [3x3x10] mm
3, AR coated at 1064 nm and808 nm on both facets. The pump source LD2 supplies 25 W average power,focused into a spot diameter 2wp2 = 280 µm. A dichroic mirror M is usedto extract the output beam from the amplier, at the same time allowingend-pumping of C2 through telescope TELE2.
5.3.3 Results and discussion
An a-cut sample of SrWO4, grown by the Czochralski technique to size[4x4x30] mm3 and with uncoated facets, is rst employed for stimulatedRaman scattering conversion experiments [57]. The crystal is simply housed

5.3. EXPERIMENTAL RESULTS 87
in a kinematic mirror mount, without taking extra care for heat dissipa-tion issues. The crystal orientation is adjusted to match its c-axis withthe pump beam polarization, in order to take advantage of the higher Ra-man gain the material can aord (as explained in table 5.1). Thanks to thehigh pulse energy provided by the pump sources, an extremely simple andcompact single-pass traveling-wave setup can be adopted. The experimentallayout consists of an input lens, focusing into the Raman active medium,an output lens, used to collimate the Raman shifted beam, and a prism,capable to separate the fundamental from the Stokes radiation. In these re-
Figure 5.5: Steady-state SRS conversion eciency at 2 kHz repetitionrate with the 30 mm crystal sample, pumped by 1064 nm (left) and532 nm (right) radiation.
gards, the pump can be focused inside the SrWO4 sample up to the limitspot size granting at least a confocal parameter equal to the crystal length,L = 2 zr,min = 2n
(e)0 π w2
p,min / λp, in order to maximize the pump-mediuminteraction. At the beginning, the dual wavelengths (infrared and green)sub-nanosecond pulses generated by the PQS MOPA are used to stimulatesteady-state SRS response from the crystal. Figure 5.5 illustrates the con-version curves at 2 kHz repetition rate. First and second Stokes beams aredetected, at the wavelengths λIRS,1 = 1180 nm, λIRS,2 = 1324 nm, λV IS
S,1 = 559 nmand λV IS
S,2 = 590 nm, complying with:λS,1 =
λp1− λp ΩR[m−1]
λS,2 =λS,1
1− λS,1 ΩR[m−1]
(5.8)

88 CHAPTER 5. SOLID-STATE RAMAN LASERS
First Stokes Raman thresholds at 1180 nm and 559 nm occur respectivelyat about Ep = 100 µJ and Ep = 50 µJ, in agreement with the predictionof higher gain with decreasing pump wavelength [40]. Rollover of the rstStokes energy curves, at both pump wavelengths, develops in conjunctionwith the threshold for higher order Raman generation: in fact, depletion ofthe rst Stokes beam occurs as it begins to pump the second order Stokesradiation. Conversion eciencies larger than 60% are demonstrated at therst Stokes output, conrming high material performance in the regime oflong pump pulses. Total external energy conversion (1st + 2nd Stokes) ismeasured to be ∼ 25%.
The full material potential is investigated replacing the 30 mm, uncoatedsample with a 50 mm long SrWO4 crystal [18], with both facets AR coatedat 1064 nm and 1180 nm. Thanks to the increase in crystal length and theanti-reection coatings, canceling Fresnel losses at the material interface (be-tween 9% and 13% for normal incidence at 1064 nm, depending on the valueof refractive index adopted [14, 52]), an improvement of the Raman shiftedbeam versus pump energy is measured. Figure 5.6 reports a new value ofthe conversion eciency at 1064 nm pump wavelength, 2 kHz repetition rateand steady-state regime, on the order of 80%, approaching the limit set bythe ratio between the pump and Stokes photon energy (λp / λS ∼ 0.9). Themaximum on-axis pump peak intensity IMAX
p ∼ 7.5 GW/cm2 is close to thethreshold for generation of the second Stokes beam (as can be inferred fromthe hint of rollover in the proximity of IMAX
p ). The measured pump threshold
Figure 5.6: (Left) Steady-state SRS conversion eciency at 2 kHzwith the 50 mm crystal sample, pumped by 1064 nm radiation.(Right) First Stokes beam quality at 7 kHz repetition rate.

5.3. EXPERIMENTAL RESULTS 89
for 1st Stokes conversion is in fairly good agreement with theoretical consid-erations, recognizing that a gain G
(ss)R on the order of 25-30 is needed for
SRS to reach detectable levels, starting from spontaneous emission noise. Inthese regards, if the actual radial dependence of the pump intensity distri-bution and pump beam diraction inside the active medium are also takeninto account, it follows that:
G(ss)R = gss Ip Leff
Leff = 2 zR atan [L/ (2 zR)]
Ip = Ip / 2
(5.9)
leading to a threshold value E(theory)p ∼ 150µJ. To sum up, rst Stokes
Raman generation in the range ∼ 2 I thp (being I thp ∼ 3.6 GW/cm2) isdemonstrated, without the occurrence of higher order Stokes beams, corre-sponding to an optical-to-optical conversion eciency ∼ 28%. Measurementof the spatial beam quality of the Raman shifted beam is carried out at themaximum repetition rate available, corresponding to an average pump power∼ 1.92 W, representing the most critical condition from a thermal point ofview. The results shown in gure 5.6, with M2 ≤ 1.8 in both horizontaland vertical directions, conrm the good thermo-mechanical properties ofSrWO4.
The autocorrelation trace and optical spectrum of the rst Stokes radi-
Figure 5.7: (Left) Autocorrelation trace of the rst Stokes pulses.Depletion of the pump pulses at the maximum incident pump energyis shown in the inset. (Right) Optical spectra of the Raman shiftedbeam and of the pump radiation (in the inset).

90 CHAPTER 5. SOLID-STATE RAMAN LASERS
ation are portrayed in gure 5.7. Assuming a Gaussian shape, a temporalduration of 245 ps is measured for the Stokes pulses, in agreement with the os-cilloscope traces displaying pump depletion at the maximum incident energy.The measured 62 pm spectral full-width at half-maximum is signicantlylower than the spontaneous Raman linewidth of SrWO4 (∆ΩR ∼ 2.7 cm−1,as reported in table 5.1, corresponding to ∼ 376 pm at 1180 nm), because ofgain narrowing. Considering a maximum Stokes energy level ES = 90µJ, theestimated real linewidth, according to equation 5.5, is ∆Ω
(GN)R ∼ 0.43 cm−1
corresponding to ∼ 60 pm at 1180 nm, in excellent agreement with the ex-perimental result.
In order to approach transient SRS regime, the hybrid ber/bulk MOPAsource delivering 16 ps long pulses is instead employed. The experimentalsetup is equivalent to the one used in the former experiments. A conver-
Figure 5.8: Transient SRS conversion eciency at 250 kHz repetitionrate with the 50 mm crystal sample, pumped by 1064 nm radiation.
sion slope eciency as high as 70% (gure 5.8) is measured for both pumppolarizations (i.e. parallel and orthogonal to the crystal c-axis). The lowerSRS threshold observed in the case of pump beam polarization matchingthe crystal c-axis, I thp = 7.7 GW/cm2, complies with the higher Ramangain oered by SrWO4 along this direction (as reported in table 5.1). Ac-cording to the Raman gain reduction predicted by equation 5.4, I thp in thetransient regime is larger (of almost a factor 2) than the threshold valuededuced from the experiments involving longer pump pulses. A maximum

5.3. EXPERIMENTAL RESULTS 91
rst Stokes power of 1.4 W is obtained when pumping with 3.75 W, corre-sponding to 37% optical-to-optical conversion eciency. No evidence of bulkdamage inside the SrWO4 crystal is observed at the maximum incident pumpintensity IMAX
p ∼ 17 GW/cm2, as well as no hint of second Stokes onset isapparent for pump powers up to ∼ 2.2 times the threshold for the 1st Stokesgeneration. The latter consideration also explains the improvement of theoptical-to-optical conversion eciency achieved in the transient regime (37%versus 28%), despite the slightly lower slope measured (70% versus 80%).A comparison between the autocorrelation traces of the pump and Stokes
Figure 5.9: (Left) Autocorrelation trace of the rst Stokes pulses.Autocorrelation of the pump pulses is shown in the inset. (Right)Optical spectra of the Raman shifted beam and of the pump (inset)radiation.
beams is depicted in gure 5.9, revealing a Raman shifted pulse duration of14.7 ps. The measured pulse spectrum at 1180 nm is about twice as large asthe pump spectrum, leading to a time-bandwidth product of 0.66, approxi-mately two times the Fourier transform limit (set by 0.315, in the case of asech2-shaped mode-locked pulse). The much broader rst Stokes spectrummay explain the increased threshold for second Stokes generation with re-spect to that measured in the steady-state experiments. At the maximumincident pump power, a Raman shifted propagation factor M2 ∼ 2.2 in bothhorizontal and vertical axes is measured according to the knife-edge tech-nique, conrming the good thermo-mechanical capabilities of SrWO4, evenwithout the employment of a cooling system.

92 CHAPTER 5. SOLID-STATE RAMAN LASERS

Conclusions
This thesis covers the work carried out on a solid-sate laser device intendedfor HSRL applications, from system design to the realization of a rst pro-totype, as reported in section 4.4. A novel oscillator based on gain switchingoperation of a microchip cavity is demonstrated, which satises the mostcrucial requirement posed by HSRL (i.e. narrow spectral bandwidth) andreplaces the injection-locked seeder typically employed for instruments of thekind [24]. Each stage of the amplication chain was devised and optimizedaccording to the pump source adopted and the available power level of boththe pump and signal to be amplied. The achieved output power value isslightly below the specications presented in table 4.1, indicating little vari-ations of the power amplier are needed to meet the desired requirements.Some fundamental issues associated with spaceborne activities have alreadybeen addressed. In these regards, conduction cooling was demonstrated asa valid alternative to water-based coolers, thus making a vital step towardsa space-qualied system. The limitations on spectral tunability describedin section 2.3 suggest a particular implementation of the lter element in-side the lidar transmitter, which must not rely on accurate matching of thelaser wavelength to any specic absorption line: Fabry-Perot interferome-ters are thus preferable for this purpose. Preliminary on-ground experimentsemploying the laser prototype in combination with the Fabry-Perot basedtransmitter have already been scheduled and are on the verge of being ac-complished, in order to test the performance of the lidar and to complete therst phase of the project. Depending on the quality of the results, anotherphase will be discussed, aiming either to the production of a more matureand robust device, addressing more specically the whole challenges posedby space environments (e.g. harsh vibrations, radiation-hazard, large ther-mal excursions), or to consider rst the introduction of some changes in thetechnology adopted.
Application of single-frequency, high brightness solid-state lasers to SRS isconsidered in the second half of this work. The short pulse durations grantedby Q-switched sources are in this case favored rather than a narrow spectral

94 CHAPTER 5. SOLID-STATE RAMAN LASERS
bandwidth, in order to achieve intensities high enough to trigger the desirednon-linear phenomena. The research of new crystals for stimulated Ramanscattering serves the purpose of extending the spectral coverage oered bytraditional sources, therefore concerning the whole of scientic branches mak-ing use of laser devices (including lidars). In this framework the behavior of astrontium tungstate (SrWO4) sample was examined and fully characterized inboth steady-state and transient regimes. In the best case (i.e. steady-state),a conversion eciency on the order of 80% could be measured, which is veryclose to the quantum limit (∼ 90%) set by the material and only slightlyhigher than the value measured in the dual regime (∼ 70%), conrming theversatility typical to crystals belonging to the tungstate family. SrWO4 goodthermo-mechanical properties were tested in the worst condition set by themaximum available pump power and without taking particular precautionsfor heat dissipation through the crystal mount: in both regimes the mea-sured M2 values are only slightly degraded with respect to those of the pumpbeam, proving SrWO4 potential to perform well even at higher repetitionrates. In combination with the possibility to grow large dimension crystals[17] by means of the Czochralski method, the presented results indicate thatstrontium tungstate poses itself as a valid low-cost alternative to be used forthe purpose of stimulated Raman scattering.

Acknowledgements
It is my intention to thank all the people who helped me during my PhD,starting from Antonio, Giuliano and Federico, always inclined to share wiseadvises and oer their support when I was in need.
I also want to thank my fellow PhD students as well as master's students,who worked with me in the Laser Source Laboratory: I was lucky to sharemy last three years with such good friends.
I need to thank all my friends and colleagues from Bright Solutions, whohelped me a lot to face a totally new experience, sometimes turning out tobe really tough for me.
Last but not least, I want to remember my family for their supportthrough the years: dad, mum and brother, thank you so much.

96

List of Publications
First Year:
1. Amplication of nsec pulses for Laser Resonant Ionization applicationin SPES project, LNL Annual Report 2013.
2. P. Farinello, F. Pirzio, Y. Zhang, A. Agnesi and V. Petrov, EcientSub-Nanosecond Pulse Generation at 1180 nm and 559 nm with SrWO4
Raman Crystal Pumped by a Multi-kHz MOPA Laser System, Proceed-ings of Europhoton Conference, Neuchatel (Switzerland), 24th - 29th
August 2014.
Second Year:
3. M. Beutler, I. Rimke, E. Büttner, P. Farinello, A. Agnesi, V. Badikov,D. Badikov and V. Petrov, Dierence-Frequency Generation of Pi-cosecond Pulses in the mid-IR using an Yb-Fiber Pump System andAgGaSe2, Opt. Express 23 (3), 2730 - 2736 (2015).
4. P. Farinello, F. Pirzio, X.-Y. Zhang, V. Petrov and A. Agnesi, E-cient Picosecond Raman Converter Based on a SrWO4 Crystal Pumpedby a Multi-Watt MOPA Laser at 1064 nm, proceedings of CLEO/Europe- EQEC 2015, Munich (Germany), 21st - 25th June 2015.
5. P. Farinello, F. Pirzio, X. Zhang, V. Petrov and A. Agnesi, EcientPicosecond Travelling-Wave Raman Conversion in a SrWO4 CrystalPumped by Multi-Watt MOPA Lasers at 1064 nm, Appl. Phys. B 120,731 - 735 (2015).
Third Year:
6. P. Farinello, L. Fregnani, F. Pirzio, S. Dell'Acqua, G. Piccinno andA. Agnesi, High-energy single longitudinal mode MOPA laser systemsat 1064 nm, Proceedings of Europhoton Conference, Vienna (Austria),21st - 26th August 2016.

98
7. L. Fregnani, P. Farinello, F. Pirzio, X.-Y. Zhang, V. Petrov and A.Agnesi, Threshold reduction and mode selection with uncoated Ramancrystal acting as a low-nesse cavity, submitted to JOSA B.

Bibliography
[1] A. Agnesi, L. Carrà, P. Dallocchio, F. Pirzio, G. Reali, S. Lodo, andG. Piccinno. 50-mJ macro-pulses at 1064 nm from a diode-pumpedpicosecond laser system. Optics Express, 19(21):2031620321, October2011.
[2] A. Agnesi, L. Carrà, R. Piccoli, F. Pirzio, and G. Reali. Nd:YVO4
amplier for ultrafast low-power lasers. Optics Letters, 37(17):36123614, September 2012.
[3] A. Agnesi, L. Carrà, F. Pirzio, R. Piccoli, and G. Reali. Low repeti-tion rate, hybrid ber/solid-state, 1064 nm picosecond master oscillatorpower amplier laser system. Journal of the Optical Society of AmericaB, 30(11):29602965, November 2013.
[4] A. Agnesi, P. Dallocchio, F. Pirzio, and G. Reali. Sub-nanosecondsingle-frequency 10-khz diode-pumped MOPA laser. Applied PhysicsB, 98(4):737741, March 2010.
[5] S. K. Arora and B. Chudasama. Crystallization and optical propertiesof CaWO4 and SrWO4. Crystal Research and Technology, 41(11):10891095, October 2006.
[6] T. T. Basiev, A. A. Sobol', Y. K. Voronko, and P. G. Zverev. Spon-taneous Raman spectroscopy of tungstate and molybdate crystals forRaman lasers. Optical Materials, 15(3):205216, December 2000.
[7] T. T. Basiev, A. A. Sobol', P. G. Zverev, L. I. Ivleva, V. V. Osiko, andR. C. Powell. Raman spectroscopy of crystals for stimulated Ramanscattering. Optical Materials, 11:307314, March 1999.
[8] T. T. Basiev, P. G. Zverev, A. Ya. Karasik, V. V. Osiko, A. A. Sobol',and D. S. Chunaev. Picosecond stimulated Raman scattering in crystals.Journal of Experimental and Theoretical Physics, 99(5):934941, 2004.
99

100
[9] J. S. Browder and S. S. Ballard. Thermal expansion data for eightoptical materials from 60 K to 300 K. Applied Optics, 16(12):32143217,December 1977.
[10] A. Cai, L.-P. Yang, G.-H. Ren, J.-P. Chen, T.-G. Xi, and Z.-J. Xu.Specic heat and thermal diusivity and conductivity of PbWO4 singlecrystal related to its crystal orientation at (300 to 673) k. Journal ofChemical and Engineering Data, 56:22022204, 2011.
[11] R. L. Carman, F. Shimizu, C. S. Wang, and N. Bloembergen. Theory ofStokes pulse shapes in transient stimulated Raman scattering. PhysicalReview A, 2(1):6072, July 1970.
[12] Y. Chen, W. Liu, Y. Bo, B. Jiang, J. Xu, J. Li, Y. Xu, Y. Pan, J. L. Xu,X. Feng, Y. Guo, Y. Shen, F. Yang, L. Yuan, H. Yuan, Q. Peng, D. Cui,and Z. Xu. High-eciency high-power QCW diode-side-pumped zigzagNd:YAG ceramic slab laser. Applied Physics B, pages 111111111116,February 2013.
[13] X. Délen, F. Balembois, and P. Georges. Temperature dependence of theemission cross section of Nd:YVO4 around 1064 nm and consequences onlaser operation. Journal of the Optical Society of America B, 28(5):972976, May 2011.
[14] S. Ding, X. Zhang, Q. Wang, F. Su, S. Li, S. Fan, Z. Liu, J. Chang,S. Zhang, S. Wang, and Y. Liu. Highly ecient Raman frequency con-verter with strontium tungstate crystal. Journal of Quantum Electron-ics, 42(1):7884, January 2006.
[15] G. Eckhardt, D. P. Bortfeld, and M. Geller. Stimulated emission ofStokes and anti-Stokes Raman lines from diamond, calcite and α-sulfursingle crystals. Applied Physics Letters, 3:137138, 1963.
[16] J. M. Eggleston, T. J. Kane, K. Kuhn, J. Unternahrer, and R. L. Byer.The Slab Geometry Laser - Part I: Theory. IEEE Journal of QuantumElectronics, 20(3):289301, March 1984.
[17] J. D. Fan, H. J. Zhang, J. Y. Wang, M. H. Jiang, R. I. Boughton, D. G.Ran, S. Q. Sun, and H. R. Xia. Growth and thermal properties of SrWO4
single crystal. Journal of Applied Physics, 100(063513):16, 2006.
[18] P. Farinello, F. Pirzio, X. Zhang, V. Petrov, and A. Agnesi. Ecient pi-cosecond traveling-wave Raman conversion in a SrWO4 crystal pumped

by multi-Watt MOPA lasers at 1064 nm. Applied Physics B, 120:731735, 2015.
[19] J.-P. M. Feve, K. E. Shorto, M. J. Bohn, and J. K. Brasseur. Highaverage power diamond Raman laser. Optics Express, 19(2):913922,January 2011.
[20] G. Fiocco and L. D. Smullin. Detection of scattering layers in the upperatmosphere (60-140 km) by optical radar. Nature, 199:12751276, 1963.
[21] L. M. Frantz and J. S. Nodvik. Theory of pulse propagation in a laseramplier. Journal of Applied Physics, 34(8):23462349, August 1963.
[22] W. W. Ge, H. J. Zhang, J. Y. Wang, J. H. Liu, X. G. Xu, X. B. Hu, M. H.Jiang, D. G. Ran, S. Q. Sun, H. R. Xia, and R. I. Boughton. Thermal andmechanical properties of BaWO4 crystal. Journal of Applied Physics,98(013542):16, 2005.
[23] J. W. Hair, C. A. Hostetler, A. L. Cook, D. B. Harper, R. A. Ferrare,T. L. Mack, W. Welch, L. R. Izquierdo, and F. E. Hovis. Airborne highspectral resolution lidar for proling aerosol optical properties. AppliedOptics, 47(36):67346753, December 2008.
[24] J. W. Hair, C. A. Hostetler, A. L. Cook, D. B. Harper, R. A. Ferrare,T. L. Mack, W. Welch, L. R. Izquierdo, and F. E. Hovis. Airborne highspectral resolution lidar for proling aerosol optical properties. AppliedOptics, 47(36):67346753, December 2008.
[25] M. Ishii, K. Harada, M. Kobayashi, Y. Usuki, and T. Yazawa. Mechani-cal properties of PbWO4 scintillating crystals. Nuclear Instruments andMethods in Physics Research Section A: Accelerators, Spectrometers,Detectors and Associated Equipment, 376(2):203207, July 1996.
[26] W. D. Johnston, I. P. Kaminow, and J. G. Bergman. Stimulated Ra-man gain coecients for Li6NbO3, Ba2NaNb5O15, and other materials.Applied Physics Letters, 13(5):190193, September 1968.
[27] A. A. Kaminskii, L. Bohaty, P. Becker, H. J. Eichler, and H. Rhee. Man-ifestations of new χ(3)-nonlinear laser interactions in calcite (CaCO3)single crystals under one-micron picosecond pumping: more than two-octave spanned Stokes and nti-Stokes multi-wavelength comb and thirdharmonic generation via cascaded parametric lasing. Laser Physics Let-ters, 7(2):142152, January 2010.

102
[28] A. A. Kaminskii, L. Bohaty, O. Lux, H. Rhee, H. J. Eichler, E. Libow-itzky, R. Kleinschrodt, H. Yoneda, A. Shirakawa, and P. Becker. Stimu-lated Raman scattering in natural crystals of uorapatite, Ca5(PO4)3F.Laser and Photonics Reviews, 10(5):814825, September 2016.
[29] T. J. Kane, J. M. Eggleston, and R. L. Byer. The slab geometry laser- Part II: Thermal eects in a nite slab. IEEE Journal of QuantumElectronics, 21(8):11951210, August 1985.
[30] T. Kawashima, T. Kanabe, H. Matsui, T. Eguchi, M. Yamanaka,Y. Kato, M. Nakatsuka, Y. Izawa, S. Nakai, T. Kanzaki, and H. Kan.Design and performance of a diode-pumped Nd:silica-phosphate glasszig-zag slab laser amplier for inertial fusion energy. Japanese Journalof Applied Physics, 40:64156425, 2001.
[31] Alan J. Kemp, Richard S. Conroy, Graham J. Friel, and Bruce D. Sin-clair. Guiding eects in Nd:YVO4 microchip lasers operating well abovethreshold. IEEE Journal of Quantum Electronics, 35(4):675681, April1999.
[32] W. Koechner. Solid-State Laser Engineering. Optical Sciences. Springer,6 edition, 2006.
[33] V. A. Lisinetskii, S. V. Rozhok, D. N. Bus'ko, R. V. Chulkov, A. S.Grabtchikov, V. A. Orlovich, T. T. Basiev, and P. G. Zverev. Mea-surement of Raman gain coecient for barium tungstate crystal. LaserPhysics Letters, 2(8):396400, February 2005.
[34] X. Ma, Z. You, Z. Zhu, J. Li, B. Wu, Y. Wang, and C. Tu. Thermaland optical properties of Tm3+:SrMoO4 crystal. Journal of Alloys andCompounds, 465(1-2):406411, October 2008.
[35] W. S. Martin and J. P. Chernoch. Multiple Internal Reection Face-pumped Laser. Patent US 3633126 A, January 1972. https://www.
lens.org/lens/patent/US_3633126_A.
[36] W. E. K. Middleton and A. F. Spilhaus. Meteorological instruments.Quarterly Journal of the Royal Meteorological Society, 80(345):484,1954.
[37] Q. Mingxin, D. J. Booth, G. W. Baxter, and G. C. Bowkett. Perfor-mance of a Nd:YVO4 microchip laser with continuous-wave pumping atwavelengths between 741 and 825 nm. Applied Optics, 32(12):20852086,April 1993.

[38] J. T. Murray, W. L. Austin, and R. C. Powell. Intracavity Ramanconversion and Raman beam cleanup. Optical Materials, 11(4):353371,March 1999.
[39] Adelbert Owyoung, G. R. Hadley, and Peter Esherick. Gain switching ofa monolithic single-frequency laser-diode-excited Nd:YAG laser. OpticsLetters, 10(10):484486, October 1985.
[40] H. M. Pask. The design and operation of solid-state Raman lasers.Progress in Quantum Electronics, 27:356, 2003.
[41] P. A. Popov, S. A. Skrobov, A. V. Matovnikov, L. I. Ivleva, E. E.Dunaeva, A. N. Shekhovtsov, and M. B. Kosmyna. Investigation ofthermophysical characteristics of SrMoO4 crystals, nominally pure anddoped with rare earth ions. Crystallography Reports, 60(6):915920,2015.
[42] M. G. Raymer and J. Mostowski. Stimulated Raman scattering: Uniedtreatment of spontaneous initiation and spatial propagation. PhysicalReview A, 24(4):19801993, October 1981.
[43] R. R. Reeber and K. Wang. Thermal expansion, molar volume and spe-cic heat of diamond from 0 to 3000k. Journal of Electronic Materials,25(1):6367, 1996.
[44] Y. Sato and T. Taira. Temperature dependencies of stimulated emissioncross section for Nd-doped solid-state laser materials. Optical MaterialsExpress, 2(8):10761087, July 2012.
[45] Anthony E. Siegman. Lasers. University Science Books, 1986.
[46] A. K. Sridharan, S. Saraf, S. Sinha, and R. L. Byer. Zigzag slabs forsolid-state laser ampliers: batch fabrication and parasitic oscillationsuppression. Applied Optics, 45(14):33403351, May 2006.
[47] Orazio Svelto. Principles of Lasers. Plenum Press, New York and Lon-don, fourth edition, 1998.
[48] E. H. Synge. A method of investigating the higher atmosphere. TheLondon, Edinburgh, and Dublin Philosophical Magazine and Journal ofScience: Series 7, 9(60), 1930.
[49] J. A. Taylor, A. D. Pillsbury, and D. M. Boroson. Space qualica-tion for an intersatellite laser communications system. Technical report,

104
Lincoln Laboratory, Massachusetts Institute of Technology, Lexington,Massachusetts, March 1993.
[50] P. E. Tomaszewski. Jan Czochralski-father of the Czochralski method.Journal of Crystal Growth, 236(1-3):14, March 2002.
[51] E. E. Uthe and W. B. Johnson. Lidar observations of the lower tro-pospheric aerosol structure during BOMEX, nal report. SRI project7929, Division of Biology and Medicine, U. S. Atomic Energy Commis-sion, Washington D. C. 20545, January 1971.
[52] A. Wang, C. Wang, and G. Jia. Recent advances in strontium tungstatescheelite material. Frontiers of Chemistry in China, 5(1):6170, 2010.
[53] Y. Wang, L. Huang, M. Gong, H. Zhang, M. Lei, and F. He. 1 MHzrepetition rate single-frequency gain-switched Nd:YAG microchip laser.Laser Physics Letters, 4(8):580583, April 2007.
[54] Claus Weitkamp. Lidar: Range-Resolved Optical Remote Sensing of theAtmosphere. Optical Sciences. Springer, 2005.
[55] J. J. Zayhowski. Microchip lasers. The Lincoln Laboratory Journal,3(3):427446, 1990.
[56] J. J. Zayhowski and J. L. Daneu. Technique for mass producingtwo-dimensional arrays of monolithic solid state laser cavities withcurved mirrors. Solid State Research Report, Lincoln Laboratory, Mas-sachusetts Institute of Technology, Lexington, Massachusetts, 1990.
[57] Y. Zhang, F. Pirzio, A. Agnesi, X. Zhang, and V. Petrov. 200 ps pulsegeneration at 1180 nm with a SrWO4 Raman crystal pumped by a sub-nanosecond MOPA laser system. Laser Physics Letters, 11(11), Septem-ber 2014.
[58] V. V. Zhdanova, V. P. Klyuev, V. V. Lemanov, I. A. Smirnov, andV. V. Tikhonov. Thermal properties of lithium niobate crystals. SovietPhysics-Solid State (USA), 10:1360, 1968.
[59] P. G. Zverev, T. T. Basiev, V. V. Osiko, A. M. Kulkov, V. N. Voit-sekhovskii, and V. E. Yakobson. Physical, chemical and optical proper-ties of barium nitrate Raman crystal. Optical Materials, 11(4):315334,March 1999.

[60] P. G. Zverev and L. I. Ivleva. Optical properties of barium and strontiumtungstate Raman crystals. In 1st International Workshop on NonlinearPhotonics, Moscow, Russia, September 2011.