
Understanding the Carbon Footprint of Your Water Use · Chapter 2 ~ More Water-Energy Tools ......
28
Water~Energy Toolkit: Understanding the Carbon Footprint of Your Water Use A River Network Report July 2010 Water & Energy Program
Transcript of Understanding the Carbon Footprint of Your Water Use · Chapter 2 ~ More Water-Energy Tools ......

Water~Energy Toolkit:Understanding the Carbon Footprint of Your Water Use
A River Network Report July 2010
Water & Energy Program

Water~Energy Toolkit: Understanding the Carbon Footprint of Your Water Use River Network Water & Energy Program http://www.rivernetwork.org/
Water~Energy Toolkit: Understanding the Carbon Footprint of Your Water Use
A River Network Toolkit
by Bevan Griffiths-Sattenspiel, Water & Energy Program
July 2010
This toolkit was made possible thanks
to the generous support of the
Alliance for Water Efficiency
& the Turner Foundation, Inc.

Water~Energy Toolkit: Understanding the Carbon Footprint of Your Water UseRiver Network Water & Energy Program http://www.rivernetwork.org/
TABLE OF CONTENTS
Introduction ……………………………………………………………......……XX
Chapter 1 ~ River Network’s ‘Simple’ Calculators ……………………..........XX Showerhead Comparison Calculator/ ………………….....……..XX Community Water-Energy Savings Calculator ……………...…..XX Toilet Comparison Calculator ……………………………...….…XX Water Heating Calculator …………………………………...…...XX New Source Impact Tool …………………………………...….....XX
Chapter 2 ~ More Water-Energy Tools ………………………………..........…XX Water to Air Models …………………………………………....…XX Water-Energy-Climate Calculator ............................................ WaterSmart Scenario Builder Soft Path Water Analysis Tool …...XX Water Savings and Energy Calculator …………………….….…..XX Water-Energy Sustainability Tool ……………………………..…..XX Water Conservation Tracking Tool ………………………….…....XX
Chapter 3 ~ Estimating the Energy Intensity of Your Water: The ‘Simple’ Method ……………………………………….…….XX Water Supply ......................................................................... Water Supply Worksheet ........................................................ Wastewater Treatment ............................................................ Wastewater Treatment Worksheet ........................................... Conclusion .............................................................................
Appendix A ~ Electric Supply Mix and Carbon Intensity by State ……......….XX
Appendix B ~ Water-Energy Op-Ed Example ………………………….........…XX
Notes ~ ......................................................................................................
Photo Credits ~ ..........................................................................................
iii
iii
123456
77889910
111214151718
19
20
21
21

Water~Energy Toolkit: Understanding the Carbon Footprint of Your Water Use River Network Water & Energy Program http://www.rivernetwork.org/
INTRODUCTIONWater use in the United States requires vast amounts of energy, resulting in considerable greenhouse gas emissions that contribute to global warming. Energy is required whenever water is moved uphill, treated, heated, cooled or pressurized. In many communities, the energy required for supplying and treating water and wastewater constitutes the largest energy cost for local municipalities, while on the customer side, water heating is typically the second or third largest energy expenditure in the home.1
By using this toolkit, we hope you gain a better understanding of the energy that can be saved by saving water, and that the tools help you communicate the potential to fight global warming through water conservation, efficiency, reuse and low impact development in your community.
The Carbon Footprint of WaterA recent assessment conducted by River Network concluded that water-related energy use in the United States is at least 521 million megawatt hours (MWh) per year— equivalent to 13% of the nation’s electricity production. Although 521 million MWh per year represents a very conservative, baseline estimate of water-related energy use, it is nonetheless comparable to the electricity output of 150 typical coal-fired power plants.
The carbon emissions resulting from the energy required to move, treat and heat water in the U.S. is approximately 290 million metric tons a year. This is roughly equal to the combined greenhouse gas emissions of 11 states: Alaska, Delaware, Hawaii, Idaho, Maine, Nebraska, Nevada, New Hampshire, Oregon, Rhode Island and Vermont.2 For a more in-depth review of the energy and greenhouse gas emissions embedded in water, see The Carbon Footprint of Water (2009), which can be downloaded at: http://rivernetwork.org/resource-library/carbon-footprint-water.
Understanding the energy and carbon implications of water use can inform resource management and policy decisions in important ways. As Dr. Peter Gleick, a MacArthur Fellow and president of the Pacific Institute, explains, “Some of the cheapest greenhouse gas emission reductions available seem to be not energy-efficiency programs, but water-efficiency programs.”3 Dr. Gleick’s statements are supported by the California Energy Commission, which in 2006 found that investments in water conservation and efficiency improvements could yield 95% of the energy savings as traditional energy-efficiency programs at 58% of the cost.4
WATER CONSERVATION & EFFICIENCY Saves EnergyAs communities set carbon reduction goals in response to human-caused global warming, water conservation and efficiency are valuable, cost-effective ways to reduce greenhouse gas emissions and prepare for the water supply challenges brought on by climate change. In August 2009, the Sonoma County Water District in drought-striken California announced that its new water conservation program would be used to,
iv
Water~Energy Toolkit: Understanding the Carbon Footprint of Your Water UseRiver Network Water & Energy Program http://www.rivernetwork.org/
v
“quantify and acquire carbon reduction credits that will be used to help achieve a goal of reducing greenhouse gases by 25 % by 2015 through the Sonoma County Community Climate Action Plan.”5 In a report called From Watts to Water, published in 2007, the Santa Clara Valley Water District quantified the energy savings resulting from their conservation efforts and found that from 1992 to 2006, “the District saved 1.42 billion kilowatt hours (kWh) of energy (worth $183 million assuming average residential electricity rates) and eliminated 335 million kg of carbon dioxide emissions; the latter is equivalent to removing 72,000 passenger cars from the roads for one year.”6
WATER REUSE Saves EnergyIn addition to water conservation and efficiency, there exists a multitude of other ways to save energy through water-oriented approaches, such as water reuse. Water reuse, or water recycling, is defined by the U.S. Environmental Protection Agency (EPA) as “reusing treated wastewater for beneficial purposes such as agricultural and landscape irrigation, industrial processes, toilet flushing and replenishing a groundwater basin.” The potential to reduce water-related energy consumption through wastewater reuse is highly dependent on the energy intensity of the water being replaced through reuse and the level of treatment required for an intended use.
While Wastewater reuse is typically implemented by water utilities or large industrial users, there are many opportunities for individuals to reuse wastewater. The California Department of Housing and Community Development estimates that a family of four could save up to 22,000 gallons of water per year through a simple greywater system that recycles laundry water by diverting it for outdoor irrigation.7 Based on national averages and a direct energy savings from avoided wastewater treatment, a typical household using 22,000 gallons of greywater per year to offset their potable outdoor water demand would save about 73 kWh of electricity annually, which is comparable to the electricity use of a laptop computer.8 Recycling municipal wastewater can save even more electricity if it is utilized to avoid developing new energy-intensive water supplies, such as imported or desalinated water.
LOW IMPACT DEVELOPMENT Saves EnergyLow Impact Development (LID) can also save energy. LID refers to a comprehensive engineering and design approach that seeks to mimic the predevelopment natural hydrology of urban and developing watersheds. In other words, LID is a series of techniques that retain stormwater where it falls, thus allowing the water to naturally absorb back into the ground while avoiding the surface water pollution and sewer system loads associated with traditional stormwater management approaches.
LID strategies can reduce the energy required for stormwater treatment, avoid the carbon emissions associated with traditional infrastructure, reduce aquifer drawdown and provide a “new” low-energy water supply through aquifer recharge and rainwater harvesting.

Water~Energy Toolkit: Understanding the Carbon Footprint of Your Water Use River Network Water & Energy Program http://www.rivernetwork.org/
vi
A study conducted by the Natural Resources Defense Council and University of California Santa Barbara’s Bren School of Environmental Science and Management found that LID practices—such as bioswales, green roofs, rainwater harvesting, rain gardens and green streets—can save up to 1.2 million megawatt hours per year by creating low-energy local water supplies and obviating the need for imported or desalinated water. These energy savings represent enough energy to power more than 102,000 single-family homes, with corresponding carbon emissions reductions of 535,500 metric tons per year—equivalent to taking nearly 100,000 cars off the road.9
YOUR COMMUNITY Can Save Water and EnergyAs you can see, the possibilities to save energy and reduce greenhouse gas emissions through water conservation, efficiency, reuse and low impact development are enormous. But first, you need to learn about the carbon footprint of water use in your home and your community. The tools described in this guidebook are designed to help you understand the energy intensity of your community’s water system and which types of water-oriented strategies you should employ so that you can begin saving energy by saving water!

Water~Energy Toolkit: Understanding the Carbon Footprint of Your Water UseRiver Network Water & Energy Program http://www.rivernetwork.org/
1
Saving water saves energy. But how much? While businesses and homes that use water will ultimately pay for the energy needed to pump and treat water through their water and sewer bills, few realize that these energy costs are typically on the order of 30%-60% of a city’s entire energy bill.10 Even more energy is used inside our homes and businesses to heat and cool water, but again, few people realize just how much energy is associated with their water use. For instance, did you know that water heating alone is typically the second or third largest energy expenditure in American homes?11
River Network has developed a series of “simple” calculators and tools to help you find out how—and how much—we can reduce our carbon footprint through water efficiency. These tools were produced to explore assorted aspects of the energy and carbon emissions embedded in different types of water supplies. The five interactive, Microsoft Excel-based tools developed by River Network are:
• Showerhead Comparison Calculator• Community Water-Energy Savings Calculator• Toilet Comparison Calculator• Water Heating Calculator• New Water Source Impact Tool
A few of the questions these tools are designed to answer include:• How much money would I save on my water bill, if I installed a low-flow
showerhead?
• How much energy is used in my public water supply system?
• How much could my city reduce its carbon footprint by adopting water conservation programs?
• What will the energy demands for my city’s new water supply project be?
The subsequent section provides a description of each tool, including links to download the tools over the internet. For each tool, users input data on the left-hand of the screen, and the results display to the right. The data and assumptions behind each model can be viewed by clicking on the “Assumptions” tab in the bottom left corner of each workbook. Please note that these models are designed for educational purposes and are not intended to provide a comprehensive analysis of a given scenario.
River Network’s ‘Simple’ Calculators
Chapter 1

Water~Energy Toolkit: Understanding the Carbon Footprint of Your Water Use River Network Water & Energy Program http://www.rivernetwork.org/
Showerhead Comparison CalculatorAvailable at: http://rivernetwork.org/resource-library/showerhead-comparison-calculator
The Showerhead Comparison Calculator is designed to compare the water, energy and carbon costs of showerheads with different water efficiency ratings. The calculator is targeted toward residential water users. Since showering is among the most energy-intensive end uses of water, this calculator is an effective tool for educating the public on the energy and greenhouse gas emissions associated with their individual or household water use.
Users begin by selecting the appropriate state to determine the carbon intensity of their electric grid. Because states get their electricity from a mix of fuel sources that contain varying levels of greenhouse gas emissions, it is important to select the correct state. If using a natural gas water heater, click on the “Natural Gas” tab at the bottom of the page to open the natural gas worksheet. After selecting the flow rate of their current showerhead, users then fill in the number of people in their household, the number of showers each person takes per week and the duration of each shower. The user then selects the flow rate of a more efficient showerhead to determine the water, energy and greenhouse gas emissions their household could save by replacing their old showerhead.
In addition to showing the benefits of using a more efficient showerhead, this tool can also describe the savings that can result from simple behavioral changes. Users are encouraged to adjust the frequency and length of their showers to compare how showering habits, such as shorter showers, can slash their water use and carbon footprint.
2

Water~Energy Toolkit: Understanding the Carbon Footprint of Your Water UseRiver Network Water & Energy Program http://www.rivernetwork.org/
3
Community Water-Energy Savings CalculatorAvailable at: http://www.rivernetwork.org/resource-library/community-water-energy-savings-calculator
The Community Water-Energy Savings Calculator provides an estimate of the amount of water, energy, carbon dioxide emissions and money that can be saved by community-wide residential indoor water efficiency improvements. The tool relies on simple assumptions for product penetration and per capita savings from more efficient water using devices.
After selecting the appropriate state, users then select from five different residential indoor end-uses of water—toilets, showerheads, dishwashers, clothes washers and faucet aerators—to assess the relative savings of conservation programs aimed at improving the efficiency of each type of water use.
The amount of energy “embedded” in a given water supply is called the “energy intensity value” or energy factor, and it varies from city to city. For the purposes of this tool, River Network has provided values based on national averages, but if you want more accurate estimates, contact your local water and wastewater utility to determine the actual energy intensity of their water systems and use those values for running these tools. For instructions on estimating the energy intensity of a water system, see Chapter 3.
After filling in water system energy intensity values, the user then selects the size of their community or program target group and the anticipated market saturation of the product, or the percentage of households in the target community that are expected to install the device. This allows users to compare the savings that would result from varying levels of program participation, as well as the relative savings achieved from different water efficient devices.

Water~Energy Toolkit: Understanding the Carbon Footprint of Your Water Use River Network Water & Energy Program http://www.rivernetwork.org/
4
Toilet Comparison CalculatorAvailable at: http://rivernetwork.org/resource-library/toilet-comparison-calculator
The Toilet Comparison Calculator is designed to compare the water, energy and carbon costs of toilets with different water efficiency ratings.
After selecting the appropriate state, users then select the gallons per flush of their toilet based on the year the toilet was installed or manufactured. Users then provide information on the number of people in their household and the number of times each person flushes the toilet in a typical day. The final two inputs are the energy intensity of the local water supply system and wastewater treatment system, respectively. Although national averages are provided, users are encouraged to contact their local water and wastewater utilities to determine the energy intensity of their water systems, since these are the primary factors influencing the energy and greenhouse gas emissions embedded in the water used for toilet flushing. For instructions on estimating the energy intensity of a water system, see Chapter 3.
Because toilets use only cold water, this tool is particularly useful for helping people understand the indirect energy and greenhouse gas emissions embedded in their water use. Indirect—or “upstream” and “downstream”—energy refers to the energy required to pump and treat water prior to use, as well as the energy needed to pump and treat the resulting wastewater. Consider using this calculator as part of outreach efforts for a toilet rebate program to educate the public on the benefits of upgrading old, inefficient toilets.

Water~Energy Toolkit: Understanding the Carbon Footprint of Your Water UseRiver Network Water & Energy Program http://www.rivernetwork.org/
5
Water Heating CalculatorAvailable at: http://rivernetwork.org/resource-library/water-heating-calculator
The Water Heating Calculator allows users to determine the energy and greenhouse gas emissions embedded in a gallon of hot water for a specific location in the United States. Because the temperature of water entering a home can vary significantly depending on local conditions, the amount of energy required to heat a unit of water can differ from city to city. All other factors being equal, the cooler the inlet water, the more energy required to heat the water to a desired temperature. This calculator is designed for organizations or utilities interested in determining the end-use energy savings that can be achieved in their community by reducing demand for hot water. The tool includes values for the percentage of hot water used during typical residential end uses, which can be applied along with the estimated or actual volume of water saved by end-use resulting from water conservation efforts.
Only two pieces of information are needed to run the Water Heating Calculator: a zip code and water heater temperature settings of the study area or individual household or business. For water heater temperature settings, a default value of 140° F is provided, although actual temperature settings may vary. A typical range for residential water heating settings is between 120° F and 140° F.
River Network would like to thank the Pacific Institute for providing the data on inlet water temperature by zip code.

Water~Energy Toolkit: Understanding the Carbon Footprint of Your Water Use River Network Water & Energy Program http://www.rivernetwork.org/
New Water Source Impact ToolAvailable at: http://rivernetwork.org/resource-library/new-water-source-impact-tool
The New Water Source Impact Tool is designed to provide a reasonable estimate of the energy and carbon emissions costs of developing a new water supply when detailed information on the project is unavailable. The tool relies on very basic assumptions and data inputs to help communities assess the magnitude of energy required for water supply projects. This tool can be useful for water managers, concerned citizens or environmental groups interested in estimating the costs of developing new water supplies. Coupled with information on alternative approaches, such as water conservation and efficiency, this tool can help compare the cost-effectiveness of demand-side management to the costs of developing a new water supply.
After selecting the appropriate state, the user then selects the type of water source being developed (surface, groundwater, seawater, etc.) and the volume of water expected to be supplied through this source. Users then enter the elevation lift from source water to the distribution area. This information can typically be obtained by contacting your utility or by using GIS software such as GoogleMaps. Next, users submit a value for the energy intensity of their distribution system, that is, the infrastructure that connects a major water supply or water treatment facility to the homes and businesses that use the water. If your utility does not have this information, a proxy value is provided.
Because many water distribution systems lose substantial amounts of water from leaks—water that already contains embedded energy from pumping and treating it— users can enter a value for water loss in the system. Contact your water provider for information on leaked, or unaccounted water.
In the final step, users enter the average pumping efficiency in the water system. Many water pumps operate at suboptimal efficiencies, which can result in greater energy demands and greenhouse gas emissions. Improving pumping efficiency can result in significant energy savings.
6
Water~Energy Toolkit: Understanding the Carbon Footprint of Your Water UseRiver Network Water & Energy Program http://www.rivernetwork.org/
Over the past few years, a number of useful tools have been developed by other organizations seeking to increase awareness of the energy and greenhouse gas emissions associated with water use and the benefits of using water more efficiently. In this chapter, we describe six additional tools that can be used by water utilities, planners or the general public to gain a better understanding of the water-energy connections in their communities.
Water to Air Models ~PacificInstituteAvailable at: http://www.pacinst.org/resources/water_to_air_models/index.htm
Pacific Institute’s Water to Air Models consist of two similar but distinct Microsoft Excel-basics that allow users to quantify the energy and air emissions that result from urban or agricultural water use. The Water to Air Models provide water managers or other interested parties a better understanding of the relationship between water management decisions, energy consumption, greenhouse gas emissions and air quality. One model is for urban water districts and the other for agricultural districts.
The models provide a flexible but consistent framework for quantifying the energy and air quality dimensions of water management decisions. The tools may appear a bit daunting at first look, but the Pacific Insitute has produced a users manual that provides straightforward, detailed instructions on how to use the Water to Air Models (the users manual is available through the link above).
For an example of how a water utility, the Santa Clara Valley Water District, used the Urban Water to Air Model to quantify the energy savings and greenhouse gas emissions reductions that resulted from their water conservation efforts, see their report “From Watts to Water,” which can be downloaded at: http://www.valleywater.org/Programs/Water_Conservation/From_Watts_to_Water.aspx.
Chapter 2 More Water-Energy Tools
7
Water~Energy Toolkit: Understanding the Carbon Footprint of Your Water Use River Network Water & Energy Program http://www.rivernetwork.org/
Water-Energy-Climate Calculator (WECalc) ~PacificInstituteAvailable at: http://www.wecalc.org/
The Pacific Institute has developed an interactive online public education tool called WECalc, the Water-Energy-Climate Calculator. The tool, which was released to the public in July 2010, enables individuals and households to quantify their water use and its associated energy and greenhouse gas emissions through an interactive, user-friendly interface. The tool is designed to provide users with a detailed assessment of their water use, but is equipped with default values and helpful tips that enable people with varying levels of knowledge to utilize the tool. After water use information has been collected, the tool generates customized suggestions for ways in which consumers can save water, energy and money. This tool is an excellent way to inform students and the general public about the water-energy connections while providing users with specific actions they can take to begin saving energy by saving water.
WaterSmart Scenario Builder Soft Path Water Analysis Tool~ POLIS Project for Ecological GovernanceAvailable at: http://www.poliswaterproject.org/toolkit#calculator
The WaterSmart Scenario Builder is a Microsoft Excel-based calculator that allows users to explore the potential for water and greenhouse gas emissions savings through water efficiency and conservation programs. The Scenario Builder was developed by researchers from the POLIS Project for Ecological Governance, an interdisciplinary research center located at the University of Victoria in Victoria, BC.
The Scenario Builder is designed to develop and test various future water scenarios using a “backcasting framework,” a planning approach that envisions a desired future scenario, then works backwards to determine the steps required to connect the present with future goals. This calculator is not intended to replace a detailed conservation audit or water efficiency plan, but assists communities with a preliminary evaluation of various demand-side management scenarios.
The Scenario Builder can be useful for water planners or watershed groups interested in comparing the water and energy costs of developing new supplies to water conservation or efficiency approaches. It is important to keep in mind that the tool uses metric units of measurement instead of gallons and acre feet, which are more commonly used in the United States water sector. When using this tool units may need to be converted.
8

Water~Energy Toolkit: Understanding the Carbon Footprint of Your Water UseRiver Network Water & Energy Program http://www.rivernetwork.org/
Water Savings and Energy Calculator~ U.S. Environmental Protection AgencyAvailable at: http://www.epa.gov/watersense/calculate_your_water_savings.html
This simple web-based calculator was developed by the EPA’s WaterSense program. It is designed for individuals to calculate the water and energy savings that their household could achieve by switching to WaterSense certified faucets or toilets, which are at least 20% more efficient than current standards. The calculator was released in Fall 2008 and requires only basic inputs to run. This calculator is a good tool for educating the public on the potential to save energy through water efficiency and can help raise awareness of the multiple benefits of water efficiency and the EPA’s WaterSense program.
Water-Energy Sustainability Tool (WEST Model) ~ Arpad Horvath and Jennifer Stokes, UC BerkeleyIn development. For more information, go to: http://www.ce.berkeley.edu/~horvath/west.html
The Water-Energy Sustainability Tool, or WEST Model, is being developed by Professor Arpad Horvath and Dr. Jennifer Stokes at the University of California Berkeley. The WEST Model is a Microsoft Excel-based tool that uses a life-cycle assessment (LCA) to determine the complete environmental effects of water system infrastructure and their operation. LCA is a proven methodology for systematically quantifying what is commonly referred to as the “cradle-to-grave” material and energy inputs and environmental impacts of a given project.
According to the developers of WEST, the intended users of the tool are water system designers, utility operators, civil engineers and researchers. Users should have a working knowledge of water supply, access to data related to a real or hypothetical water system, and a desire to learn more about the environmental and economic implications of their decisions.
River and watershed groups should encourage their water utility or respective environmental agencies to utilize the WEST Model in order to properly analyze the costs associated with new and existing water supply projects. Detailed data inputs are required, so river and watershed groups should work with their utilities to properly run the tool and use it to inform their decision making process. According to its developers, WEST can inform decisions regarding:
• Water Source Selection: To provide additional water, is it preferable to build a new pipeline, construct a new reservoir, desalinate water from a new source or implement a recycled water program?
• Material Selection: For a particular pipeline installation, is steel or plastic pipe better for the environment?
• Process Selection: Is it preferable to implement membrane or traditional filtration?
9

Water~Energy Toolkit: Understanding the Carbon Footprint of Your Water Use River Network Water & Energy Program http://www.rivernetwork.org/
Which disinfection method is more environmentally detrimental: chlorine, ozone or ultraviolet light?
• Energy Source Selection: What percentage of the environmental effects associated with a water system is associated with material production? Electricity use? What if all our electricity came from solar power, how much would that reduce emissions?
• Supplier Selection: How much can we reduce our environmental effects by purchasing from local suppliers?
The WEST Model is currently being developed with a companion tool, the Wastewater-Energy Sustainability Tool (WWEST), which will allow users to conduct a life-cycle assessment of wastewater projects in addition to water supply projects. Both tools are expected to be available to the public at the end of 2010.
Water Conservation Tracking Tool 2.0~AllianceforWaterEfficiency(AWE)Available at: http://www.allianceforwaterefficiency.org/Tracking-Tool.aspx(forAWEmembersonly)
The Water Conservation Tracking Tool is a Microsoft Excel-based model that can evaluate the water savings, costs and benefits of conservation programs for a specific water utility. This tool provides a standardized methodology for water savings and cost-benefit accounting. It requires data on the utility’s water system and operations, and includes a library of pre-defined conservation activities from which users can construct conservation programs.
Water utility managers can use the Tool in a variety of ways to aid their water resource planning and operations. According to the Alliance for Water Efficiency, the Water Conservation Tracking Tool can:
• Develop long-range conservation plans. Construct conservation portfolios containing up to 50 separate conservation program activities.
• Quickly compare alternative conservation measures in terms of their water savings potential, impact on system costs and potential benefits to utility customers.
• Track the implementation, water savings, costs and benefits of actual conservation activities over time.
• Evaluate a utility’s changing revenue requirement with conservation.
• Estimate the reduction in GHG emissions resulting from plumbing/energy codes and conservation progam activity.
Due to differing pluming code and appliance standards among states, there are three editions of the tool: the Standard, California/Texas, and Georgia. The Standard Edition applies to all states other than California, Georgia and Texas. The California/Texas Edition takes into account ULFT requirements that were implemented in California and Texas two years earlier than the rest of the U.S. as well as the transition to HET toilets beginning in 2014. The Georgia Edition reflects recent changes in the state’s efficiency codes for toilets and urinals.
10

Water~Energy Toolkit: Understanding the Carbon Footprint of Your Water UseRiver Network Water & Energy Program http://www.rivernetwork.org/
Knowing the energy intensity (kWh/unit of water) of your community’s water system is one of the first steps to designing a water management program that optimizes freshwater protection in conjunction with energy and carbon emission reductions. The energy embedded in water systems is highly variable and should therefore be determined on a community-by-community basis. Water systems that rely on more than one water supply often have different embedded energy values throughout the year, depending on which source is being utilized at the time of use.
Once the energy embedded in your local water system is determined, you can begin educating policy makers and the public on how much energy can be saved through sustainable water-oriented approaches in your community, including water conservation, efficiency, reuse and low impact development programs. Not all communities require large amounts of energy to supply and treat their water, however, significant energy and carbon emissions savings can still be achieved in communities with relatively low energy intensities due to the energy embedded at end-use (such as heating, cooling or pressurization).
The following are step-by-step instructions on how to estimate the energy required for pumping and treating your community’s water and wastewater. It may be a challenge to find the detailed information you are looking for, so gather what you can. A recent survey in California found that only about one-third of the state’s water utilities have decent data on their energy use. The process described below can help you identify data gaps and encourage your utility to keep track of its energy use. Tables are provided for you to fill in, as well as tips for filling them in. This is an imperfect approach that will nonetheless yield a reasonable energy intensity estimate and place the responsibilty on your water and wastewater utilities to record better energy-use data and provide a more comprehensive analysis to the public. For a standard, more detailed methodology to determine the energy intensity of water systems see:
Wilkinson, Robert C., 2000. Methodology For Analysis of The Energy Intensity of California’s Water Systems, and an Assessment of Multiple Potential Benefits Through Integrated Water-Energy Efficiency Measures, Exploratory Research Project, Ernest Orlando Lawrence Berkeley Laboratory, California Institute for Energy Efficiency. http://www.es.ucsb.edu/faculty/wilkinson.pdfs/Wilkinson_EWRPT01%20DOC.pdf
Chapter 3Estimating the Energy Intensity of Your Water: The ‘Simple’ Method
11

Water~Energy Toolkit: Understanding the Carbon Footprint of Your Water Use River Network Water & Energy Program http://www.rivernetwork.org/
-or-
Maas, C., 2009. Greenhouse Gas and Energy Co-Benefits of Water Conservation. Water Sustainability Project. University of Victoria (pg. 6-10). http://poliswaterproject.org/sites/default/files/maas_ghg_.pdf
Water and wastewater systems are typically operated by separate entities; as such we have provided instructions for determining the energy intensity of both. All of the information that you will be requesting is supposed to be in the public domain and should be provided voluntarily by your water or wastewater utilities. Encourage your local utilities to conduct a more thorough assessment on their own or by using the Pacific Institute’s “Water-to-Air Model,” which can be downloaded at: http://www.pacinst.org/resources/water_to_air_models/index.htm.
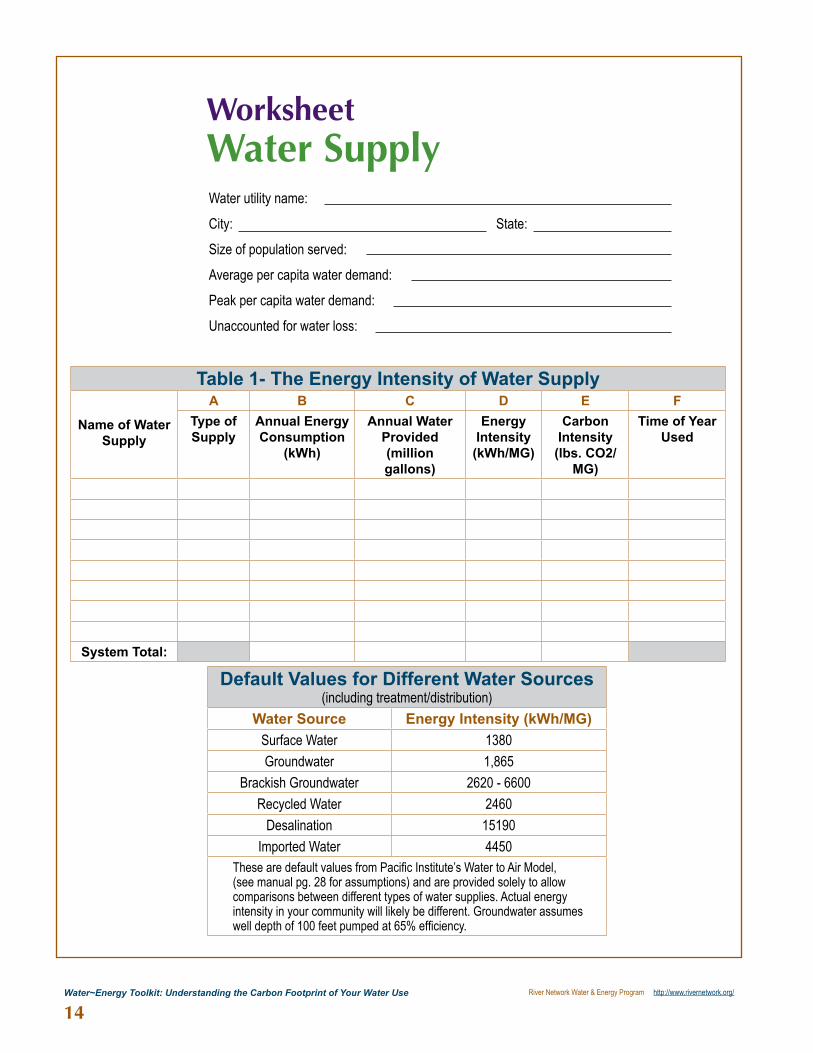
Water SupplyFollow the instructions below to estimate the energy intensity of your water system. Record the information you collect in the “Water Supply Worksheet” found on page 14.
Instructions:1. Priortocontactingyourwaterutility,beginbytryingtofindoutas
much information about your water system as possible. Look at the “water supply worksheet” on page 14 to get a sense of the information you are looking for—the more information you can collect, the better. Poke around the internet and look for local or regional water management plans, annual reports or water quality reports that might provide information on water use and water system characteristics in your community.
2. Contact your local water utility and be very nice to the person on the phone while you describe what you are attempting to find out—they hold the keys to your success!
3. Ifyoudon’talreadyknow,findoutthenumberandtypeofwatersupplies your water system relies on. Some community systems might rely on only one supply, while others use many. For each water supply, fill out Table 1 by finding the following information:
• (Column A) The Type and Location of Supply ~ The type of source water (surface water, brackish groundwater, recycled water, etc.) and it’s proximity to your community are typically the largest factors influencing the energy intensity of a given water supply. While it is still possible to establish the energy intensity of your water system without knowing the type and location of a water source, knowing this will help you gain a better understanding of how energy use relates to the water supply options in your community. If you are unable to get any information other than the type of source, you can at least begin to use the default values provided in the “Default Values for Different Water Sources” Table to begin the dialogue around the energy embedded in your community’s water system.
• (Column B) Annual Energy Consumption ~ Most utilities rely on electricity to provide the energy necessary for pumping and treating drinking water. For each water supply in your community, gather information on the annual electricity consumption
12

Water~Energy Toolkit: Understanding the Carbon Footprint of Your Water UseRiver Network Water & Energy Program http://www.rivernetwork.org/
associated with a specific supply and record it in the table on page 14. If you are able to obtain historical data covering more than one year, find the average annual energy consumption and record the average in the table. Record the total amount of electricity consumed by your water utility by logging the sum of each water supply in the bottom row of the table (System Total).
Some utilities do not disaggregate electricity use data for specific water supplies. If this is the case, you will only be able to estimate the average energy intensity of your water system as a whole, which will still provide you with useful information. Often, the electricity use data you receive will include the energy consumed for lighting and other operational uses not directly related to the provision of water. Even if this is the case, you can still get a reasonable estimate by including these costs, since they typically represent a small portion of total energy use, although it would be preferable if the utility can isolate direct and indirect electricity consumption.
• (Column C) Annual Water Provided ~ Find out the volume of water that is delivered to consumers annually by each supply. Often, this data comes in the form of million gallons daily (MGD) and will have to be converted to an annual total by multiplying the MGD x 365 days. If you are able to obtain historical data covering more than one year, find the average annual water deliveries for each source and record the average in the table. Record the total volume of water deliveries in your system by recording the sum of each source in the bottom row of the table (System Total).
If water deliveries are recorded in acre feet instead of million gallons, convert to million gallons using the following conversion factor: 1 million gallons = 3.069 acre feet.
Also ask about unaccounted for water, or water that is lost due to leaks in the distribution system. If unaccounted for water losses are high, significant amounts of energy can be saved by repairing leaks since the water lost in distribution systems has already been embedded with energy through pumping and treatment.
• (Column D) Energy Intensity ~ To find the energy intensity of your water supplies, simply divide the annual electricity used for each water supply by the volume of water delivered by that supply (Column D / Column C). After determining the energy intensity of individual water sources, find the energy intensity of your system as a whole by dividing total electricity consumed by total water delivered.
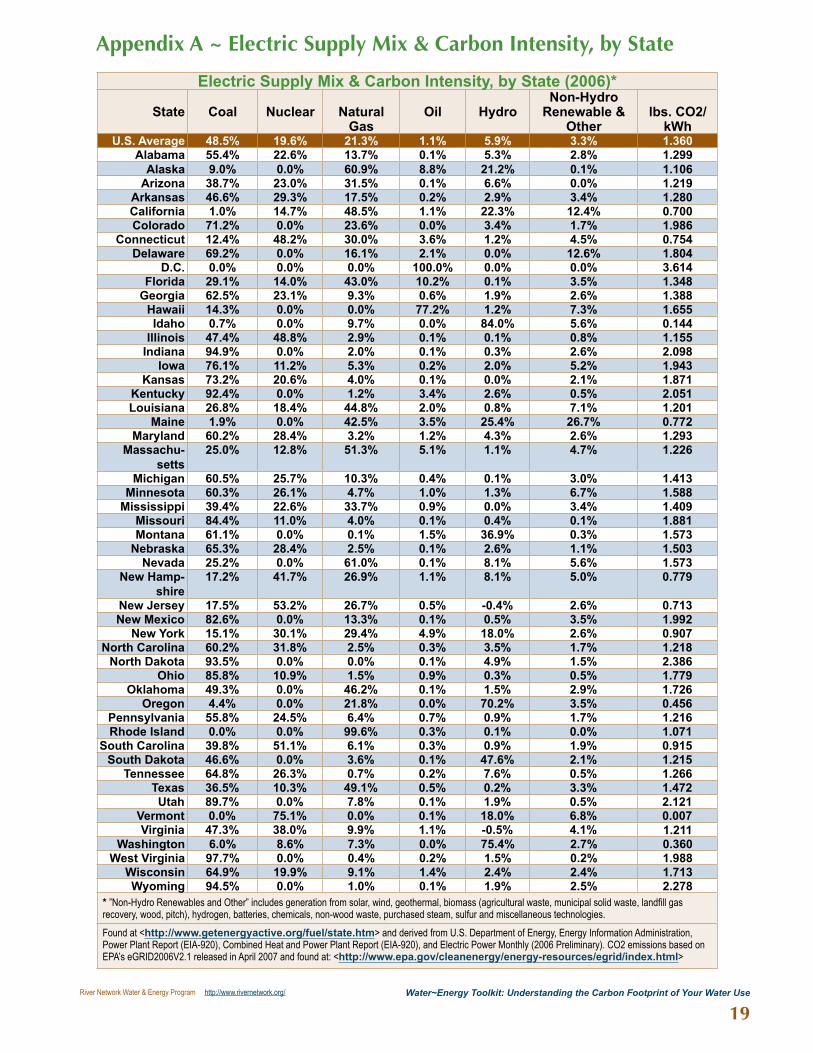
• (Column E) Carbon Intensity ~ The amount of carbon emitted when consuming electricity varies by state. See “Electric Supply Mix and Carbon Intensity, by State” to find the carbon intensity factor of your state (lbs. CO2e/kWh), then multiply this number by the energy intensity of each source to get the carbon intensity of your water supplies. If you or your utility is running the Water to Air Model, use the electric grid mix provided in the table to determine greenhouse gas emissions in your state.
• (Column F) Time of Year ~ If possible, gather information on the time of year that each source is utilized, and which scenarios require the use of a given source (i.e., backup source use when primary source quality is degraded). This will help you better assess how to design programs that avoid using the most energy intensive water supplies.
13
Water~Energy Toolkit: Understanding the Carbon Footprint of Your Water Use River Network Water & Energy Program http://www.rivernetwork.org/
14
WorksheetWater SupplyWater utility name:
City: State:
Size of population served:
Average per capita water demand:
Peak per capita water demand:
Unaccounted for water loss:
Table 1- The Energy Intensity of Water Supply
Name of Water Supply
A B C D E FType of Supply
Annual Energy Consumption
(kWh)
Annual Water Provided(milliongallons)
Energy Intensity (kWh/MG)
Carbon Intensity(lbs.CO2/
MG)
Time of Year Used
System Total:
Default Values for Different Water Sources (including treatment/distribution)
Water Source EnergyIntensity(kWh/MG)Surface Water 1380Groundwater 1,865
Brackish Groundwater 2620 - 6600Recycled Water 2460
Desalination 15190Imported Water 4450
These are default values from Pacific Institute’s Water to Air Model, (see manual pg. 28 for assumptions) and are provided solely to allow comparisons between different types of water supplies. Actual energy intensity in your community will likely be different. Groundwater assumes well depth of 100 feet pumped at 65% efficiency.

Water~Energy Toolkit: Understanding the Carbon Footprint of Your Water UseRiver Network Water & Energy Program http://www.rivernetwork.org/
15
Wastewater TreatmentDetermining the energy intensity of wastewater treatment in your community is essentially the same process as the one used for water supply. For each wastewater treatment plant you need to gather information on the annual energy consumption at each facility and the volume of water that is treated.
Follow the instructions below to estimate the energy intensity of your wastewater system. Record the information you collect in the “Wastewater Treatment Worksheet” found on page 17.
Instructions:1. Begin with some preliminary research on wastewater treatment in your
community. Before you start making phone calls, try to learn as much as possible about your wastewater treatment system so that you are more informed when actually talking to you wastewater service provider.
2. Ifyoudon’talreadyknow,trytofindoutthenumberofwastewatertreatment plants in your community. Some community systems might rely on only one treatment plant, while others use many. For each wastewater treatment plant, fill out Table 3 by finding the following information:
• Column A) Type of Wastewater Treatment ~ Some communities treat wastewater to higher standards than others, and as a general rule, the higher the level of treatment, the higher the energy intensity. The four main types or levels of wastewater treatment are trickling filter, activated sludge, advanced wastewater treatment and advanced wastewater treatment with nitrification.
While you can still determine the energy intensity of your wastewater treatment without knowing the level of treatment, knowing this will allow you to get a good energy intensity estimate if you are unable to get any information on energy use from your wastewater utility. See the “Energy Intensity of Wastewater Treatment by Size and Level of Treatment” for generic wastewater treatment energy intensities to estimate the energy intensity of your wastewater treatment.
• Column B) Annual Energy Consumption ~ Most wastewater utilities rely on electricity to provide the energy necessary for pumping and treating wastewater. For each wastewater treatment plant in your community, gather information on the annual electricity consumption and record it in Table 1. If you are able to obtain historical data covering more than one year, find the average annual energy consumption and record the average in the table. Record the total amount of electricity consumed by your water utility by logging the sum of each source in the bottom row of the table (System Total).
Be sure to ask if the electricity consumption data you receive includes any additional pumping that might be required to convey wastewater to the wastewater treatment plant. If your wastewater treatment plant produces bioelectricity from effluent or combined heat and power, note this and only record the net energy consumption after subtracting for the energy generated at the plant.

Water~Energy Toolkit: Understanding the Carbon Footprint of Your Water Use River Network Water & Energy Program http://www.rivernetwork.org/
16
• Column C) Annual Volume of Water Treated ~ Find out the volume of water that is treated annually at each wastewater treatment plant. Often, this data comes in the form of million gallons daily (MGD) and will have to be converted to an annual total by multiplying the MGD x 365 days. If you are able to obtain historical data covering more than one year, find the average annual volume of water treated at each plant and record the average in the table. Record the total volume of wastewater treated in your community by recording the sum of each source in the bottom row of the table (System Total).
If the volume of wastewater treated is recorded in acre feet instead of million gallons, convert to million gallons using the following conversion factor: 1 million gallons = 3.069 acre feet.
• Column D) Energy Intensity ~ To find the energy intensity of wastewater treatment, simply divide the annual electricity used for each wastewater treatment plant by the volume of water delivered by that supply (Column D / Column C). After determining the energy intensity of individual wastewater treatment plants, find the energy intensity of your system as a whole by dividing total electricity consumed by total wastewater treated.
• Column E) Carbon Intensity ~ The amount of carbon emitted when consuming electricity varies by state. See “Electric Supply Mix and Carbon Intensity, by State” on page 19 to find the carbon intensity factor of your state (lbs. CO2e/kWh), then multiply this number by the energy intensity of each wastewater treatment plant to get the carbon intensity of your wastewater treatment. If you or your utility is running the Water to Air Model, use the electric grid mix provided in the table to determine greenhouse gas emissions in your state.

Water~Energy Toolkit: Understanding the Carbon Footprint of Your Water UseRiver Network Water & Energy Program http://www.rivernetwork.org/
17
Energy Intensity of Wastewater Treatment by Size & Level of Treatment
Treatment Plant Size
(milliongallons/day)
UnitElectricityConsumption(kWh/milliongallons)Trickling
FilterActivated
SludgeAdvanced
Wastewater Treatment
Advanced Wastewater Treatment w/ Nitrification
1 MGD 1,811 2,236 2,596 2,9515MGD 978 1,369 1,573 1,926
10 MGD 852 1,203 1,408 1,79120 MGD 750 1,114 1,303 1,67650 MGD 687 1,051 1,216 1,588
100 MGD 673 1,028 1,188 1,558From: Electric Power Research Institute. Water and Sustainability: U.S. Electricity Consumption for Water Supply & Treatment—The Next Half Century, Electric Power Research Institute, Palo Alto, CA: 2000. 1007687. (Pg. 3-5)
Table 2 ~ The Energy Intensity of Wastewater Treatment
Name of Water Supply
A B C D EType of
TreatmentAnnual Energy Consumption
(kWh)
Annual Volumeof Water(milliongallons)
Energy Intensity (kWh/MG)
Carbon Intensity(lbs.CO2/
MG)
System Total:
WorksheetWastewater TreatmentWater utility name:
City: State:
Size of population served:
Combined sewer system: yes / no
Bioelectricity generation: yes / no

Water~Energy Toolkit: Understanding the Carbon Footprint of Your Water Use River Network Water & Energy Program http://www.rivernetwork.org/
18
ConclusionOnce you have determined the energy intensity of your water supply and wastewater treatment systems you can begin communicating the energy and carbon reduction potential through water-oriented strategies in your community. Depending on the energy intensity factors you found for your system, certain strategies will yield greater energy benefits. Some communities might find that it is preferable to target outdoor uses to reduce the energy demands of a marginal water supply used only in the summer, when outdoor use drives peak demand. Other communities might discover that their water and wastewater systems require relatively little energy, so targeting indoor uses that save hot water might offer the only viable strategy for reducing energy demand and greenhouse gas emissions. In communities with combined sewer systems or declining groundwater levels, low impact development strategies that recharge aquifers or keep water out of the wastewater treatment system might prove to be the most effective water-oriented approach to saving energy.
In Portland, Oregon, for instance, the Water Bureau relies on two different sources of water to meet their needs. The primary source, the Bull Run, consists of gravity fed surface water from a protected watershed and requires just 570 kWh per million gallons of water delivered. The secondary, or marginal, source consists of groundwater withdrawn at the bureau’s Columbia South Shore Well Field, which has to be pumped 4.5 miles south and 750 feet up for storage. Due primarily to these pumping demands, well field water has an energy intensity of approximately 3,675 kWh per million gallons—about 6.5 times greater than the Bull Run supply. In 2006, the groundwater supply represented 43% of total electricity requirements despite providing only 14% of that year’s water supply. Therefore, reducing the demand for water from the well field will have a greater energy benefit than a similar reduction of Bull Run water. This implies that the bureau could optimize energy savings by aggressively targeting summer and late fall water use in its conservation programs.
Portland also relies on a combined sewer system and the city has aggressively implemented low impact development, or green infrastructure, approaches to reduce the stormwater burden on their aging system. While the energy benefits of Portland’s green infrastructure strategies have yet to be quantified, there is nonetheless a significant energy and carbon reduction benefit from these efforts.
For an illustrative example of how information on the energy intensity of a community’s water system—in this case Portland, OR—can be used to advocate for saving water, see the op-ed in Appendix B.
Water~Energy Toolkit: Understanding the Carbon Footprint of Your Water UseRiver Network Water & Energy Program http://www.rivernetwork.org/
19
ElectricSupplyMix&CarbonIntensity,byState(2006)*
State Coal Nuclear Natural Gas
Oil HydroNon-Hydro
Renewable & Other
lbs. CO2/kWh
U.S. Average 48.5% 19.6% 21.3% 1.1% 5.9% 3.3% 1.360Alabama 55.4% 22.6% 13.7% 0.1% 5.3% 2.8% 1.299
Alaska 9.0% 0.0% 60.9% 8.8% 21.2% 0.1% 1.106Arizona 38.7% 23.0% 31.5% 0.1% 6.6% 0.0% 1.219
Arkansas 46.6% 29.3% 17.5% 0.2% 2.9% 3.4% 1.280California 1.0% 14.7% 48.5% 1.1% 22.3% 12.4% 0.700Colorado 71.2% 0.0% 23.6% 0.0% 3.4% 1.7% 1.986
Connecticut 12.4% 48.2% 30.0% 3.6% 1.2% 4.5% 0.754Delaware 69.2% 0.0% 16.1% 2.1% 0.0% 12.6% 1.804
D.C. 0.0% 0.0% 0.0% 100.0% 0.0% 0.0% 3.614Florida 29.1% 14.0% 43.0% 10.2% 0.1% 3.5% 1.348
Georgia 62.5% 23.1% 9.3% 0.6% 1.9% 2.6% 1.388Hawaii 14.3% 0.0% 0.0% 77.2% 1.2% 7.3% 1.655Idaho 0.7% 0.0% 9.7% 0.0% 84.0% 5.6% 0.144
Illinois 47.4% 48.8% 2.9% 0.1% 0.1% 0.8% 1.155Indiana 94.9% 0.0% 2.0% 0.1% 0.3% 2.6% 2.098
Iowa 76.1% 11.2% 5.3% 0.2% 2.0% 5.2% 1.943Kansas 73.2% 20.6% 4.0% 0.1% 0.0% 2.1% 1.871
Kentucky 92.4% 0.0% 1.2% 3.4% 2.6% 0.5% 2.051Louisiana 26.8% 18.4% 44.8% 2.0% 0.8% 7.1% 1.201
Maine 1.9% 0.0% 42.5% 3.5% 25.4% 26.7% 0.772Maryland 60.2% 28.4% 3.2% 1.2% 4.3% 2.6% 1.293
Massachu-setts
25.0% 12.8% 51.3% 5.1% 1.1% 4.7% 1.226
Michigan 60.5% 25.7% 10.3% 0.4% 0.1% 3.0% 1.413Minnesota 60.3% 26.1% 4.7% 1.0% 1.3% 6.7% 1.588
Mississippi 39.4% 22.6% 33.7% 0.9% 0.0% 3.4% 1.409Missouri 84.4% 11.0% 4.0% 0.1% 0.4% 0.1% 1.881Montana 61.1% 0.0% 0.1% 1.5% 36.9% 0.3% 1.573
Nebraska 65.3% 28.4% 2.5% 0.1% 2.6% 1.1% 1.503Nevada 25.2% 0.0% 61.0% 0.1% 8.1% 5.6% 1.573
New Hamp-shire
17.2% 41.7% 26.9% 1.1% 8.1% 5.0% 0.779
New Jersey 17.5% 53.2% 26.7% 0.5% -0.4% 2.6% 0.713New Mexico 82.6% 0.0% 13.3% 0.1% 0.5% 3.5% 1.992
New York 15.1% 30.1% 29.4% 4.9% 18.0% 2.6% 0.907North Carolina 60.2% 31.8% 2.5% 0.3% 3.5% 1.7% 1.218
North Dakota 93.5% 0.0% 0.0% 0.1% 4.9% 1.5% 2.386Ohio 85.8% 10.9% 1.5% 0.9% 0.3% 0.5% 1.779
Oklahoma 49.3% 0.0% 46.2% 0.1% 1.5% 2.9% 1.726Oregon 4.4% 0.0% 21.8% 0.0% 70.2% 3.5% 0.456
Pennsylvania 55.8% 24.5% 6.4% 0.7% 0.9% 1.7% 1.216Rhode Island 0.0% 0.0% 99.6% 0.3% 0.1% 0.0% 1.071
South Carolina 39.8% 51.1% 6.1% 0.3% 0.9% 1.9% 0.915South Dakota 46.6% 0.0% 3.6% 0.1% 47.6% 2.1% 1.215
Tennessee 64.8% 26.3% 0.7% 0.2% 7.6% 0.5% 1.266Texas 36.5% 10.3% 49.1% 0.5% 0.2% 3.3% 1.472Utah 89.7% 0.0% 7.8% 0.1% 1.9% 0.5% 2.121
Vermont 0.0% 75.1% 0.0% 0.1% 18.0% 6.8% 0.007Virginia 47.3% 38.0% 9.9% 1.1% -0.5% 4.1% 1.211
Washington 6.0% 8.6% 7.3% 0.0% 75.4% 2.7% 0.360West Virginia 97.7% 0.0% 0.4% 0.2% 1.5% 0.2% 1.988
Wisconsin 64.9% 19.9% 9.1% 1.4% 2.4% 2.4% 1.713Wyoming 94.5% 0.0% 1.0% 0.1% 1.9% 2.5% 2.278
* ”Non-Hydro Renewables and Other” includes generation from solar, wind, geothermal, biomass (agricultural waste, municipal solid waste, landfill gas recovery, wood, pitch), hydrogen, batteries, chemicals, non-wood waste, purchased steam, sulfur and miscellaneous technologies.Found at <http://www.getenergyactive.org/fuel/state.htm> and derived from U.S. Department of Energy, Energy Information Administration, Power Plant Report (EIA-920), Combined Heat and Power Plant Report (EIA-920), and Electric Power Monthly (2006 Preliminary). CO2 emissions based on EPA’s eGRID2006V2.1 released in April 2007 and found at: <http://www.epa.gov/cleanenergy/energy-resources/egrid/index.html>
Appendix A ~ Electric Supply Mix & Carbon Intensity, by State

Water~Energy Toolkit: Understanding the Carbon Footprint of Your Water Use River Network Water & Energy Program http://www.rivernetwork.org/
20
Appendix B ~ Water-Energy Op-Ed Example
“Water: Portland should conserve water and keep purer Bull Run water in its taps,” or “Energy strategies could help ensure water supply.” Published in the Oregonian Newspaper, October 18, 2009
For most of the year, Bull Run provides Portland’s water. But when Bull Run is unable to meet “peak” demands - or when permit restrictions limit withdrawals to ensure adequate water is available to support fish habitat - the Water Bureau pumps water from its Columbia Well Fields, located on the banks of the Columbia River between the Troutdale Airport and Blue Lake Park.
In late September, the Portland Water Bureau began pumping 36 million gallons of water each day from these well fields, supplying 35- 40% of what currently comes out of your tap. This will continue until Bull Run is recharged. Higher mineral content in the groundwater supply means that many of us can taste the difference between these two water sources. What we can’t taste is the significantly greater energy cost and greenhouse gas emissions embedded in this back-up supply.
The Bull Run supply system is gravity-fed and requires almost no pumping at all, while well water is drawn from the ground, then pumped 4.5 miles south and approximately 750 feet uphill to Powell Butte Reservoir. Consequently, well water requires 6.5 times more energy to reach your tap.
Now factor in climate change. A study commissioned by the Portland Water Bureau in 2002 found that global warming will likely cause the Bull Run watershed to experience warmer and drier summers, decreasing the Bull Run water supply when demand is at its highest. Along with population growth, this creates a vicious cycle where the energy required to pump well water to meet growing water demands contributes to climate change, while climate change continues to reduce our water supply.
Nationally, nearly 4% of the country’s annual electricity consumption is used to pump and treat our water and wastewater—more than the annual electricity consumption of all the microwaves, color TV’s, and computers found in our homes.
As high as this figure is, it does not include the energy needed to heat, cool or pressurize water in our homes, businesses or schools. A recent assessment by River Network found that adding in energy needs for water heating alone pushes water-related energy consumption in the U.S. to the equivalent of 13% of our annual electricity use—the power output of approximately 150 coal-fired power plants.
With so much energy embedded in our water, we need to be looking at water conservation and efficiency as strategies that save energy and reduce our carbon footprint. A study conducted in California found that urban water conservation and efficiency programs could achieve comparable energy savings at 58% of the cost of traditional energy efficiency programs.
Even though we’re starting to enter our traditional rainy season, the time to prepare for less reliable water supplies is now. Smart investments in water conservation, efficiency, reuse and low impact development will help us cut down on our use of high energy water, keeping purer Bull Run water in our taps while lowering our energy costs and Portland’s carbon footprint.

Water~Energy Toolkit: Understanding the Carbon Footprint of Your Water UseRiver Network Water & Energy Program http://www.rivernetwork.org/
21
1 ICF International. Water and Energy: Leveraging Voluntary Programs to Save Both Water and Energy.Mar. 2008. U.S. Environmental Protection Agency. Available at: <http://www.energystar.gov/ia/partners/publications/pubdocs/Final%20 Report%20Mar%202008.pdf>. (Pg. 3-1)2 EPA 2009. Inventory of U.S. Greenhouse Gas Emissions and Sinks 1990-2007. U.S. Environmental Protection Agency, Washington, D.C. April 15, 2009. EPA 430-R-09-0043 Ben Block “Water Efficiency is Key to Saving Energy: Expert” <http://www.greenbiz.com/news/2009/02/26/water-efficiency-key-saving-energy-expert>4 Klein, Gary, Ricardo Amon, Shahid Chaudhry, Loraine White, et al. California’s Water-Energy Relationship: Final Staff Report. Publication. Nov. 2005. California Energy Commission. <http://www.energy.ca.gov/2005publications/CEC-700-2005-011/CEC-700-2005-011-SF.PDF> (Pg. 128)5 Sonoma County Water Agency Press Release <http://www.scwa.ca.gov/documents/8-18-09DirectInstall.pdf>6 From Watts to Water: http://www.valleywater.org/Programs/Water_Conservation/From_Watts_to_Water.aspx7 http://www.sfgate.com/cgi-bin/article.cgi?f=/c/a/2009/09/17/MN5P19DG5U.DTL8 Assumes 1,500 kWh/MG for water supply and 1,800 kWh/MG for wastewater treatment based on EPRI 2002. Laptop electricity usage from EIA <http://www.eia.doe.gov/emeu/recs/recs2001/enduse2001/enduse2001.html>9 NRDC “A Clear Blue Future: How Greening California Cities Can Address Water Resources and Climate Challenges in the 21st Century” page 5 < http://www.nrdc.org/water/lid/>.10 U.S. EPA: Energy Management Guidebook for Water Utilities11 ICF International. Water and Energy: Leveraging Voluntary Programs to Save Both Water and Energy.Mar. 2008. U.S. Environmental Protection Agency. Available at: <http://www.energystar.gov/ia/partners/publications/pubdocs/Final%20 Report%20Mar%202008.pdf>. (Pg. 3-1)
Notes ~
Photo Credit ~Front cover photos left to right: Factory stacks © Roger Smith; Outdoor faucet ©Tongro Lee; Calculator, Courtesy of Cooby; Boy in sprinkler © Creative Commons-foreversouls; Shower faucet © iStockphoto; Water tower © mmahaffie.

Water~Energy Toolkit: Understanding the Carbon Footprint of Your Water Use River Network Water & Energy Program http://www.rivernetwork.org/
Vision for the FutureRiver Network envisions a future when every person knows their watershed and is an active caretaker of their local river, lake, stream or bay. We work for a day when all people, fish
and wildlife have access to clean plentiful water.
MissionRiver Network empowers and unites people and communities
to protect and restore rivers and other waters that sustain the health of our country.
www.rivernetwork.org
Design: Jean A. Hamilla, River NetworkGraphic Assistance: Travis Leipzig
Hard copies printed on Mohawk, 100% PC White, FSC