Sector-Wise Assessment of Carbon Footprint Across...
61
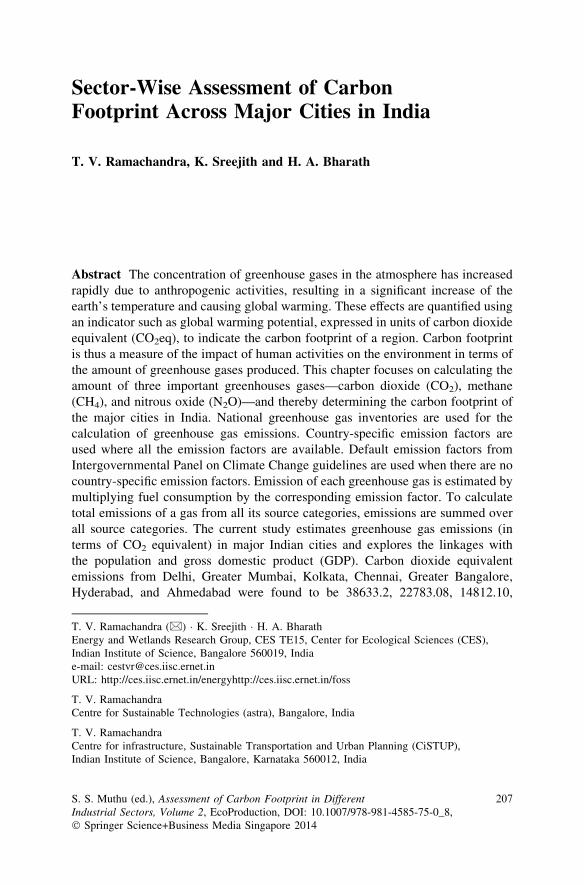
Sector-Wise Assessment of Carbon Footprint Across Major Cities in India T. V. Ramachandra, K. Sreejith and H. A. Bharath Abstract The concentration of greenhouse gases in the atmosphere has increased rapidly due to anthropogenic activities, resulting in a significant increase of the earth’s temperature and causing global warming. These effects are quantified using an indicator such as global warming potential, expressed in units of carbon dioxide equivalent (CO 2 eq), to indicate the carbon footprint of a region. Carbon footprint is thus a measure of the impact of human activities on the environment in terms of the amount of greenhouse gases produced. This chapter focuses on calculating the amount of three important greenhouses gases—carbon dioxide (CO 2 ), methane (CH 4 ), and nitrous oxide (N 2 O)—and thereby determining the carbon footprint of the major cities in India. National greenhouse gas inventories are used for the calculation of greenhouse gas emissions. Country-specific emission factors are used where all the emission factors are available. Default emission factors from Intergovernmental Panel on Climate Change guidelines are used when there are no country-specific emission factors. Emission of each greenhouse gas is estimated by multiplying fuel consumption by the corresponding emission factor. To calculate total emissions of a gas from all its source categories, emissions are summed over all source categories. The current study estimates greenhouse gas emissions (in terms of CO 2 equivalent) in major Indian cities and explores the linkages with the population and gross domestic product (GDP). Carbon dioxide equivalent emissions from Delhi, Greater Mumbai, Kolkata, Chennai, Greater Bangalore, Hyderabad, and Ahmedabad were found to be 38633.2, 22783.08, 14812.10, T. V. Ramachandra (&) K. Sreejith H. A. Bharath Energy and Wetlands Research Group, CES TE15, Center for Ecological Sciences (CES), Indian Institute of Science, Bangalore 560019, India e-mail: [email protected] URL: http://ces.iisc.ernet.in/energyhttp://ces.iisc.ernet.in/foss T. V. Ramachandra Centre for Sustainable Technologies (astra), Bangalore, India T. V. Ramachandra Centre for infrastructure, Sustainable Transportation and Urban Planning (CiSTUP), Indian Institute of Science, Bangalore, Karnataka 560012, India S. S. Muthu (ed.), Assessment of Carbon Footprint in Different Industrial Sectors, Volume 2, EcoProduction, DOI: 10.1007/978-981-4585-75-0_8, ȑ Springer Science+Business Media Singapore 2014 207
Transcript of Sector-Wise Assessment of Carbon Footprint Across...
Sector-Wise Assessment of CarbonFootprint Across Major Cities in India
T. V. Ramachandra, K. Sreejith and H. A. Bharath
Abstract The concentration of greenhouse gases in the atmosphere has increasedrapidly due to anthropogenic activities, resulting in a significant increase of theearth’s temperature and causing global warming. These effects are quantified usingan indicator such as global warming potential, expressed in units of carbon dioxideequivalent (CO2eq), to indicate the carbon footprint of a region. Carbon footprintis thus a measure of the impact of human activities on the environment in terms ofthe amount of greenhouse gases produced. This chapter focuses on calculating theamount of three important greenhouses gases—carbon dioxide (CO2), methane(CH4), and nitrous oxide (N2O)—and thereby determining the carbon footprint ofthe major cities in India. National greenhouse gas inventories are used for thecalculation of greenhouse gas emissions. Country-specific emission factors areused where all the emission factors are available. Default emission factors fromIntergovernmental Panel on Climate Change guidelines are used when there are nocountry-specific emission factors. Emission of each greenhouse gas is estimated bymultiplying fuel consumption by the corresponding emission factor. To calculatetotal emissions of a gas from all its source categories, emissions are summed overall source categories. The current study estimates greenhouse gas emissions (interms of CO2 equivalent) in major Indian cities and explores the linkages withthe population and gross domestic product (GDP). Carbon dioxide equivalentemissions from Delhi, Greater Mumbai, Kolkata, Chennai, Greater Bangalore,Hyderabad, and Ahmedabad were found to be 38633.2, 22783.08, 14812.10,
T. V. Ramachandra (&) � K. Sreejith � H. A. BharathEnergy and Wetlands Research Group, CES TE15, Center for Ecological Sciences (CES),Indian Institute of Science, Bangalore 560019, Indiae-mail: [email protected]: http://ces.iisc.ernet.in/energyhttp://ces.iisc.ernet.in/foss
T. V. RamachandraCentre for Sustainable Technologies (astra), Bangalore, India
T. V. RamachandraCentre for infrastructure, Sustainable Transportation and Urban Planning (CiSTUP),Indian Institute of Science, Bangalore, Karnataka 560012, India
S. S. Muthu (ed.), Assessment of Carbon Footprint in DifferentIndustrial Sectors, Volume 2, EcoProduction, DOI: 10.1007/978-981-4585-75-0_8,� Springer Science+Business Media Singapore 2014
207
22090.55, 19796.5, 13734.59, and 9124.45 Gg CO2eq, respectively. The majorsector-wise contributors to the total emissions in Delhi, Greater Mumbai, Kolkata,Chennai, Greater Bangalore, Hyderabad, and Ahmedabad are the transportationsector (32, 17.4, 13.3, 19.5, 43.5, 56.86 and 25 %, respectively), the domesticsector (30.26, 37.2, 42.78, 39, 21.6, 17.05 and 27.9 %, respectively), and theindustrial sector (7.9, 7.9, 17.66, 20.25, 12.31, 11.38 and 22.41 %, respectively).Chennai emits 4.79 tons of CO2 equivalent emissions per capita, the highestamong all the cities, followed by Kolkata, which emits 3.29 tons of CO2 equiv-alent emissions per capita. Chennai also emits the highest CO2 equivalent emis-sions per GDP (2.55 tons CO2 eq/lakh Rs.), followed by Greater Bangalore, whichemits 2.18 tons CO2 eq/lakh Rs.
Keywords Carbon footprint � Domestic sector � Global warming potential �Gross domestic product � India � Industries � Major cities � Transportation
1 Introduction
Greenhouse gases are the gaseous constituents of the atmosphere, both natural andanthropogenic, that absorb and emit radiation at specific wavelengths within thespectrum of thermal infrared radiation emitted by the Earth’s surface, the atmo-sphere itself, and clouds (Intergovernmental Panel on Climate Change (IPCC)2007a, b). The concentration of greenhouse gases (GHGs) in the atmosphere hasincreased rapidly due to anthropogenic activities, resulting in a significant increasein the temperature of the earth. The energy radiated from the sun is absorbed bythese gases, making the lower part of the atmosphere warmer. This phenomenon isknown as the natural greenhouse gas effect, whereas the enhanced greenhouseeffect is an added effect caused by human activities. Increases in the concentrationof these greenhouse gases result in global warming. The atmospheric concentra-tions of GHGs have increased due to increasing emissions in the industrializationera. Carbon dioxide (CO2), methane (CH4), and nitrous oxide (N2O) are the majorgreenhouse gases. Among the GHGs, carbon dioxide is the major contributor toglobal warming, accounting for nearly 77 % of the global total CO2 equivalentGHG emissions (IPCC 2007b).
In 1958, attempts were made towards high-accuracy measurements of atmo-spheric CO2 concentration to document the changing composition of the atmo-sphere with time series data (Keeling 1961, 1998). The increasing abundance of twoother major greenhouse gases, methane (CH4) and nitrous oxide (N2O), in theatmosphere have been reported (Steele 1996). Methane levels were found toincrease at a rate of approximately 1 % per year in the 1980s (Graedel and McRae1980; Fraser et al. 1981; Blake et al. 1982); however, during 1990s, its rate retardedto an average increase of 0.4 % per year (Dlugokencky et al. 1998). The increase inthe concentration of N2O is smaller, at approximately 0.25 % per year (Weiss 1981;Khalil and Rasmussen 1988). A second class of greenhouse gases—the synthetic
208 T. V. Ramachandra et al.
HFCs, PFCs, SF6, CFCs, and halons—did not exist in the atmosphere before thetwentieth century (Butler et al. 1999). CF4, a PFC, is detected in ice cores andappears to have an extremely small natural source (Harnisch and Eisenhauer 1998).
The climate system is a complicated, inter-related system consisting of theatmosphere, land surface, snow and ice, oceans and other bodies of water andliving things (Le Treut et al. 2007; Bouwman 1990; Bronson et al. 1997). Climatechange is a serious threat to the global community. Rising global temperatures willaffect the local climatic conditions and also melt the fresh water ice glaciers,causing the sea levels to rise. There is universal scientific understanding that theearth’s climate is changed by GHG emissions generated by human activity(Anthony et al. 2006). Surface air temperature is the parameter generally takeninto account for climate change. Extensive studies have been carried out to studythe patterns of global and regional mean temperatures with respect to time(Hasselmann 1993; Schlesinger and Ramankutty 1994; North and Kim 1995).
The atmospheric concentrations of carbon dioxide equivalents with the possi-bility of increases in global temperatures beyond certain levels have been reported(Stern et al. 1996). The recent (globally averaged) warming by 0.5 �C is partlyattributable to such anthropogenic emissions (Anthony et al. 2006). Changes inclimate also result in extreme weather events, such as very high temperatures,droughts and storms, thermal stress, flooding, and infectious diseases. In the last100 years, the mean annual surface air temperature has increased by 0.4–0.6 �C inIndia (Hingane et al. 1985; Kumar et al. 2000). This necessitates understanding thesources of global GHG emissions to implement appropriate mitigation measures.
Carbon Dioxide (CO2) Emissions. CO2 abundance was found to be significantlylower during the last ice age than over the last 10000 years of the Holocene perinitial measurements (Delmas et al. 1980; Berner et al. 1980; Neftel 1982). CO2
abundances ranged between 280 ± 20 ppm in the past 10000 years up to the year1750 (Indermuhle 1999). There was an exponential increase of CO2 abundanceduring the industrial era, to 367 ppm in 1999 (Neftel et al. 1985; Etheridge 1996;Houghton et al. 1992; IPCC 1996, 1998, 2000, 2001a, b) and to 379 ppm in 2005.
Methane (CH4) Emissions. Anthropogenic activities such as fossil fuel pro-duction, enteric fermentation in livestock, manure management, cultivation of rice,biomass burning, and waste management release methane to the atmosphere to asignificant extent. Estimates indicate that human-related activities release morethan 50 % of global methane emissions (EPA 2010). Natural sources of methaneinclude wetlands, permafrost, oceans, freshwater bodies, non-wetland soils, andother sources such as wildfires. Accelerating increases in methane and nitrousoxide concentrations were reported during the twentieth century (Machida 1995;Battle 1996). There was a constant abundance of 700 ppb until the nineteenthcentury. A steady increase brought methane abundances to 1745 ppb in 1998(IPCC 2001b, 2003) and 1774 ppb in 2005 (IPCC 2006).
Nitrous Oxide (N2O) Emissions. Nitrous oxide (N2O) is produced by bothnatural sources and human-related activities. Agricultural soil management, ani-mal manure management, sewage treatment, mobile and stationary combustion offossil fuel, and nitric acid production are the major anthropogenic sources. Nitrous
Sector-Wise Assessment of Carbon Footprint 209
oxide is also produced naturally from a wide variety of biological sources in soiland water, particularly from microbial action (EPA 2010). From the measurementsfor N2O, it is found that the relative increase during the industrial period is smallerthan for other GHGs (15 %). The analysis showed a concentration of 314 ppb in1998 (IPCC 2001b), rising to 319 ppb in 2005.
1.1 Carbon Emissions and Economic Growth
The transition to a very-low-carbon economy needs elementary changes in tech-nology, regulatory frameworks, infrastructure, business practices, consumptionpatterns, and lifestyles (McKinnon and Piecyk 2010; Benjamin 2009). Theemission of greenhouse gases into the atmosphere has caused concern about globalwarming, with efforts focusing on minimizing the emissions. Heavy industries aretransferred to knowledge-based and service industries, which are relatively clea-ner, as economic development continues (Shafik and Bandyopadhyaya 1992). Atadvanced levels of growth, there was a gradual decrease of environmental deg-radation because of increased environmental awareness and enforcement ofenvironmental regulation (Stern et al. 1996). There is a need for a target that aidslocal and national governments in framing climate change policies and regulations.
Carbon dioxide emissions and energy consumption are closely correlated withthe size of a country’s economy (Cook 1971; Humphrey et al. 1984; Goldemberg1995; Benjamin 2009). Carbon intensity is one of the most important indicators tohelp in measuring a country’s CO2 emission with respect to its economic growth.Carbon intensity refers to the ratio of carbon dioxide emissions per unit of eco-nomic activity, usually measured as GDP. It presents a clear understanding of theimpact of the factors that are responsible for emissions and also helps policymakers to formulate future energy strategies and emission reduction policies (Yinget al. 2007). The analysis of changes in carbon intensity in developing countrieshelps to optimize fuel-mix and economic structure; meanwhile, it also providesdetailed information on mitigation in the growth of energy consumption andrelated CO2 emissions.
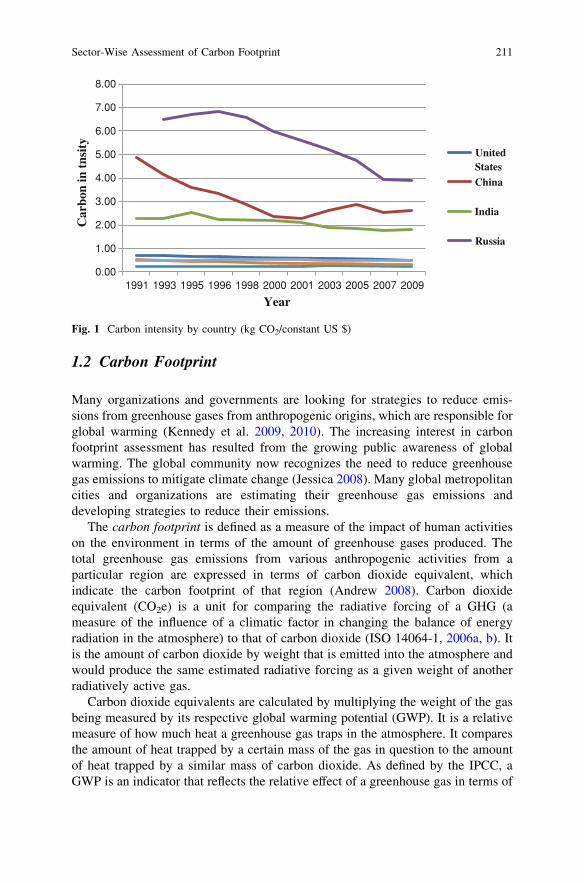
Carbon intensity value drops if there is a decrease in emissions or sharp rise inthe economic growth of a country. Carbon dioxide emissions resulting from theconsumption of energy in certain countries were compiled from published litera-ture (International Energy Statistics, United States Energy Information Adminis-tration, EIA). Economic growth data were obtained from the World Bank (http://worldbank.org). GDP in domestic currencies were converted using officialexchange rates from 2,000. Figure 1 illustrates the carbon intensity trend acrossmajor carbon players. India’s overall carbon intensity of energy use has marginallydecreased in recent years, despite coal’s dominance. Strong growth in windcapacity and efficiency improvements in coal-based electricity production aresome factors that are responsible for the decline of carbon intensity (Rao andReddy 2007; Rao et al. 2009).
210 T. V. Ramachandra et al.
1.2 Carbon Footprint
Many organizations and governments are looking for strategies to reduce emis-sions from greenhouse gases from anthropogenic origins, which are responsible forglobal warming (Kennedy et al. 2009, 2010). The increasing interest in carbonfootprint assessment has resulted from the growing public awareness of globalwarming. The global community now recognizes the need to reduce greenhousegas emissions to mitigate climate change (Jessica 2008). Many global metropolitancities and organizations are estimating their greenhouse gas emissions anddeveloping strategies to reduce their emissions.
The carbon footprint is defined as a measure of the impact of human activitieson the environment in terms of the amount of greenhouse gases produced. Thetotal greenhouse gas emissions from various anthropogenic activities from aparticular region are expressed in terms of carbon dioxide equivalent, whichindicate the carbon footprint of that region (Andrew 2008). Carbon dioxideequivalent (CO2e) is a unit for comparing the radiative forcing of a GHG (ameasure of the influence of a climatic factor in changing the balance of energyradiation in the atmosphere) to that of carbon dioxide (ISO 14064-1, 2006a, b). Itis the amount of carbon dioxide by weight that is emitted into the atmosphere andwould produce the same estimated radiative forcing as a given weight of anotherradiatively active gas.
Carbon dioxide equivalents are calculated by multiplying the weight of the gasbeing measured by its respective global warming potential (GWP). It is a relativemeasure of how much heat a greenhouse gas traps in the atmosphere. It comparesthe amount of heat trapped by a certain mass of the gas in question to the amountof heat trapped by a similar mass of carbon dioxide. As defined by the IPCC, aGWP is an indicator that reflects the relative effect of a greenhouse gas in terms of
0.00
1.00
2.00
3.00
4.00
5.00
6.00
7.00
8.00
1991 1993 1995 1996 1998 2000 2001 2003 2005 2007 2009
Car
bon
in t
nsit
y
Year
United StatesChina
India
Russia
Fig. 1 Carbon intensity by country (kg CO2/constant US $)
Sector-Wise Assessment of Carbon Footprint 211
climate change over a fixed time period, such as 100 years (GWP100). GWP isexpressed as a factor of carbon dioxide (whose GWP is standardized to 1). GWPdepends on factors such as absorption of infrared radiation by a given species,spectral location of its absorbing wavelengths, and the atmospheric lifetime of thespecies (Matthew 1999). The GWP of major greenhouse gases over the next20 years are 1 for CO2, 25 for CH4, and 298 for nitrous oxide (IPCC 2007a, b).
Need for Estimation of Carbon Footprint. Carbon footprint calculations havethe potential to reduce the impact on climate change by increasing consumerawareness and fostering discussions about the environmental impacts of products.They offer valuable information for sustainable urban planning for policy makersand local municipalities (Bhatia 2008; Carbon Trust 2007a, b; Courchene andAllan 2008; Hammond 2007; Hoornweg et al. 2011; Laurence et al. 2011).
1.3 Carbon Footprint Studies in Cities
Emissions of GHG emissions at city levels with a detailed analysis of per capitaGHG emissions for several large cities helps in evolving appropriate mitigationmeasures and resource efficiency (Hoornweg et al. 2011). Kennedy et al. (2009,2010) developed a method for comparing emissions resulting from electricityconsumption, heating and industrial fuel use, transportation, and waste sectorsacross 10 global cities. Similar studies by Sovacool and Brown (2009) provided acomparative account of carbon footprints in metropolitan areas, with suggestionsfor policymakers and planners regarding policy implications. The assessment ofcarbon footprint is being used for the management of climate change and tomitigate changes in climate at local levels. Studies on the carbon footprint ofNorwegian municipalities were calculated to be related to the factors of size andwealth (Hogne et al. 2010).
1.4 Sector-Wise Assessment of GHG Emissionsin India: Review
GHG Emissions in Electricity Generation Sector in India. GHG emissions fromelectricity use occur during the generation of electricity. Earlier studies haveestimated the emission of gases due to power generation (Gurjar et al. 2004;Raghuvanshi et al. 2006; Chakraborty et al. 2007; Weisser 2007; Kennedy et al.2009; Shobhakar 2009; Kennedy et al. 2010; Chun Ma et al. 2011; Qader 2009;POST 2006). India’s reliance on fossil-fuel based electricity generation hasaggravated the problem of high carbon dioxide (CO2) emissions from combustionof fossil fuels, primarily coal, in the country’s energy sector. Combustion of coal atthermal power plants emits mainly carbon dioxide (CO2), sulfur oxides (SOx),
212 T. V. Ramachandra et al.
nitrogen oxides (NOx), other trace gases, and airborne inorganic particulates, suchas fly ash and suspended particulate matter. Inventory of carbon dioxide emissionsfrom coal-based power generation in India were carried out for the present energygeneration, with projections for next two decades (Raghuvanshi et al. 2006). Acomprehensive emission inventory for megacity Delhi, India for the period1990–2000 was developed, in which major CO2 emissions were found from thepower plants. Electricity generation, transport, domestic, industrial processes,agriculture emissions, and waste treatment were the major sectors for which theemission inventories were reported (Gurjar et al. 2004, 2010).
Measurements of CO2 and other gases from coal-based thermal power plants inIndia have been reported. The emission rates of the GHGs were found to bedependent on factors such as the quality of coal mixture/oil, quantity used for perunit generation, age of the plant, and amount of excess air fed into the furnace(Chakraborty et al. 2007). A study of large point source emissions from India wascarried out (Garg et al. 2001) for 1990 and 1995 using the IPCC (1996) method,indicating that CO2 and SO2 emissions were the major gases emitted from powerplants.
GHG Emissions in Domestic and Commercial Sectors. Emissions fromhouseholds and commercial establishments occur due to energy consumption forcooking, lighting, heating, and household appliances. Studies have been carriedout using input-output analysis and aggregated household expenditure survey datato calculate the CO2 emissions from energy consumption for different groups ofhouseholds (BSI 2008; Murthy et al. 1997a, b; Pachauri and Spreng 2002; Pach-auri 2004; Parikh et al. 1997; INCCA 2010; Garg et al. 2004, 2006, 2011). In 2007,at the national level, the residential sector emitted 137.84 million tons of CO2
equivalents and the commercial sector emitted 1.67 million tons of CO2 equivalent(INCCA 2010). A city-level emission inventory for key sectors found that thehousehold sector was responsible for a major portion of emissions. Therefore, it isa target sector for emission reduction in both existing and new housing, in whichenergy efficiency is increased (Gupta et al. 2006; Reddy and Srinivas 2009).
GHG Emissions in the Transportation Sector. Emissions from the road trans-portation sector are directly related to gasoline and diesel consumption. Increasesin emissions have been due to increases in the number of motor vehicles on theroad and the distance these vehicles travel (Anil Singh et al. 2008). The trafficcomposition of six megacities of India (Delhi, Mumbai, Kolkata, Chennai, Ban-galore, and Hyderabad) shows that there has been a significant shift from the shareof slow-moving vehicles to fast-moving vehicles and public transport to privatetransport (Jalihal et al. 2005; Jalihal and Reddy 2006). Various studies have beencarried out in India with regard to the emissions resulting from the transportationsector (Bhattacharya and Mitra 1998; Ramanathan 1975; Ramanathan and Parikh1999; MiEF 2004). The trends of energy consumption and consequent emissionsof greenhouse gases such as CO2, CH4, and N2O and ozone precursor gases such asCO, NOx, and NMVOC in the road transport sector in India for the period from1980 to 2000 have been studied. Efforts are being made to apportion the fuels, bothdiesel and gasoline, across different categories of vehicles operating on the Indian
Sector-Wise Assessment of Carbon Footprint 213
roads (Anil Singh et al. 2008; Ramachandra and Shwetmala 2009) and determinethe major sources of air pollutants in urban areas (Gurjar et al. 2004; Das et al.2004; Gurjar et al. 2010).
Emissions from vehicles have been estimated using various model calculations(Goyal and Ramakrishna 1998). Studies have calculated emissions on the basis ofactivity data, vehicle kilometers travelled, vehicle category, and subcategories(Ramanathan and Parikh 1999; CPCB 2007; Mittal and Sharma 2003; ALGAS1998; ADB 2006; Baidya and Borken Kleefeld 2009). Emission factors for Indianvehicles have been developed by the Automotive Research Association of India inco-ordination with MoEF, CPCB and State Pollution Control Boards (ARAI2007). Inventory estimates for the emissions of greenhouse gases and other pol-lutants and effects of vehicular emission on urban air quality and human healthhave been studied in major urbanized cities in India (Sharma et al. 1995; Sharmaand Pundir 2008; Gurjar et al. 2004; Ghose et al. 2004; Ravindra et al. 2006;Jalihal and Reddy 2006).
GHG Emissions in the Industrial Sector. Industry is a major source of globalGHG emissions. The industrial sector is responsible for approximately one-third ofglobal carbon dioxide emissions through energy use (William 1996). In India,emission estimates from large point sources, such as thermal power, steel industry,cement plants, chemical production and other industries, have been carried out byvarious researchers (Mitra 1992; Mitra et al. 1999a, b; Garg et al. 2001, 2004;Mitra and Bhattacharya 2002; Gurjar et al. 2004; Garg et al. 2006). CO2 emissionsfrom iron and steel, cement, fertilizer, and other industries such as lime produc-tion, ferroalloy production, and aluminum production have been estimated (Garget al. 2006, 2011).
Six industries in India have been identified as energy-intensive industries:aluminum, cement, fertilizer, iron and steel, glass, and paper manufacturing. Thecement sector holds a considerable share within these energy-intensive industries(Schumacher and Sathaye 1999; Bernstein et al. 2007). At the country level, trendsof GHG emissions from industrial processes indicated 24,510 CO2 equivalentemissions in the year 1990, 102,710 CO2 equivalent emissions in 1994, 168,378CO2 equivalent emissions in 2000 and 189,987.86 CO2 equivalent emissions in2007 (Sharma et al. 2009, 2011; Kumar 2003). Under the aegis of INCCA, anational-level GHG inventory for CO2, CH4, and N2O inventory was published in2010 for the base year 2007, which showed from industrial processes and productuse (Sharma et al. 2011).
GHG Emissions in Agriculture Sector. Agricultural activities contribute directlyto emissions of GHGs through a variety of processes. The major agriculturalsources of GHGs are methane emissions from irrigated rice production, nitrousoxide emissions from the use of nitrogenous fertilizers, and the release of carbondioxide from energy sources used to pump groundwater for irrigation (Nelson et al.2009). Where there is open burning associated with agricultural practices, anumber of greenhouse gases are emitted from combustion. All burning of biomassproduces substantial CO2 emissions. In India, the crop waste generated in the fieldsis used as feed for cattle and domestic biofuel; the remainder is burnt in the field
214 T. V. Ramachandra et al.
(Reddy et al. 2002). Rice paddy soils contain organic substrates, nutrients, andwater; therefore, they are an increasing source of methane resulting from theanaerobic decomposition of carbonaceous substances (Alexander 1961). Theanaerobic bacterial processes in the irrigated rice cultivated fields are considered tobe among the largest sources of methane emission (Sass and Fisher 1998); theannual global contribution of methane is estimated to be *190 Tgy-1 (Koyama1963; Yanyu et al. 2006).
Studies on CH4 emission from Indian rice fields have been carried out bydifferent researchers to study the effects of soil type, season, water regime, organicand inorganic amendments, and cultivars (Parashar et al. 1991; Mitra 1992;Parashar et al. 1993, 1994; Adhya et al. 1994; Sinha 1995; Mitra et al. 1999a, b;Chakraborty et al. 2000, 2007; Jain et al. 2000; Khosa et al. 2010). Averagemethane flux varied significantly with different cultivars, ranging between 0.65and 1.12 mg m-2 h-1 (Mitra et al. 1999a, b). CH4 emissions from Indian ricepaddies, therefore, is estimated to be 3.6 ± 1.4 Tg y-1, which is lower than thevalue of 4.2 (1.3 to 5.1) Tg y-1 obtained using the IPCC 1996 default emissionfactors (Gupta et al. 2009). India emitted 3.3 million tons of CH4 in 2007 from43.62 million ha cultivated (Gupta 2005; MoA 2008; INCCA 2010). The appli-cation of nitrogen fertilizer in upland irrigated rice has led to increased N2Oemissions (Kumar et al. 2000; Majumdar et al. 2000; Ghosh et al. 2003; Garg et al.2004, 2006). Total seasonal N2O emission from different treatments ranged from0.037 to 0.186 kg ha-1 (Ghosh et al. 2003; Aggarwal et al. 2003; Bhatia et al.2008; Bhatia 2008; INCCA 2010).
GHG Emissions in the Livestock Sector. There are two major sources ofmethane emission from livestock: enteric fermentation resulting from digestiveprocess of ruminants and animal waste management (IPCC 2006; Bandyopadhyayet al. 1996). Animal husbandry accounts for 18 % of GHG emissions that causeglobal warming (Naqvi and Sejian 2011). Methane emission from enteric fer-mentation from Indian livestock ranged from 7.26 to 10.4 MT/year (Garg andShukla 2002). In India, more than 90 % of the total methane emission from entericfermentation is contributed by large ruminants (cattle and buffalo), with the restfrom small ruminants and other animals (Swamy and Bhattacharya 2006). Theproduction and emission of CH4 and N2O from manure depends on digestibilityand composition of feed, species of animals and their physiology, manure man-agement practices, and meteorological conditions such as sunlight, temperature,precipitation, wind, etc. (Gaur et al. 1984; Yamulki et al. 1999).
In India, studies have been carried out in which the emission inventories forenteric fermentation and manure management were done at the national level (Garget al. 2001; Naqvi and Sejian 2011; Gurjar et al. 2004, 2009; Garg et al. 2011). Thetotal emission of methane from Indian livestock was estimated to be 10.08 MT,considering different categories of ruminants and type of feed resources available indifferent zones of the country (Singhal et al. 2005). CH4 and N2O country-specificemission factors for bovines were found to be lower than IPCC (1996) defaultvalues. Inventory estimates were found to be approximately 698 ± 27 Gg CH4
from all manure management systems and 2.3 ± 0.46 tons of N2O from solid
Sector-Wise Assessment of Carbon Footprint 215
storage of manure for the year 2000 (Gupta et al. 2009). Using the emission factorsprovided in the report (NATCOM 2004), it is estimated that the Indian livestockemitted 9.65 million tons in 2007. Buffalo are the single largest emitter of CH4,constituting 60 % of the total CH4 emission from this category, simply because oftheir large numbers compared to any other livestock species and also because of thelarge CH4 emission factor with respect to others (INCCA 2010). By using the IPCCguidelines, the total CH4 emitted from enteric fermentation in livestock was found tobe 10.09 million tons; emissions from manure management were estimated to beapproximately 0.115 million tons of CH4 and 0.07 thousand tons of N2O (INCCA2010).
GHG Emissions Inventory in the Waste Sector. The main GHG emitted fromwaste management is CH4. It is produced and released into the atmosphere as abyproduct of the anaerobic decomposition of solid waste, whereby methanogenicbacteria break down organic matter in the waste. Similarly, wastewater becomes asource of CH4 when treated or disposed anaerobically. It can also be a source ofN2O emissions due to the protein content in domestically generated wastewater(INCCA 2010; Hogne et al. 2010; Marlies et al. 2009). Industrial wastewater withsignificant carbon loading that is treated under intended or unintended anaerobicconditions will produce CH4 (IPCC 2006).
Waste landfills are considered to be the largest source of anthropogenic emis-sions. Methane emissions from landfills are estimated to account for 3–19 % of theanthropogenic sources in the world (IPCC 1996). Landfill gas, primarily a mix ofCO2 and CH4, is emitted as a result of the restricted availability of oxygen duringthe decomposition of the organic fraction of waste in landfills (Talyan et al. 2007).Methane emissions have been estimated for specific particular landfill sites andregions in India (Kumar et al. 2000, 2004, 2009; Gurjar et al. 2004; Ramachandraand Bachamanda 2007; Subhasish et al. 2009; Rawat and Ramanathan 2011).
CH4 emission estimates were found to be approximately 0.12 Gg in Chennaifrom municipal solid waste management for the year 2000, which is lower than theIPCC (1996) values.
Municipal solid waste (MSW) management in major cities in India has beenassessed; parameters such as waste quantity generated, waste generation rate,physical composition, and characterization of MSW in each of the cities arecarried out (Kumar et al. 2009). Solid waste generated in Indian cities increasedfrom 6 Tg in 1947 to 48 Tg in 1997 (Pachauri and Sridharan 1998), with a percapita increase of 1–1.33 % per year (Rao and Shantaram 2003). Per INCCA(2010), 604.51 Gg of CH4 was emitted from solid waste disposal sites in India.
Methane is generated from domestic and industrial wastewater. The main factorin determining the extent of CH4 production is the amount of degradable organicfraction in the wastewater (Fadel and Massoud 2001), which is commonlyexpressed in terms of biochemical oxygen demand (BOD) or chemical oxygendemand (COD). The disposal and treatment of industrial waste and MSW are not aprominent source of methane emissions in India, except in large urban centers. InIndia, methane emissions from domestic/commercial and industrial wastewaterwere found to be 861 and 1050 Gg, respectively, for the year 2007. Approximately
216 T. V. Ramachandra et al.
15.81 Gg of nitrous oxide is emitted from the domestic/commercial wastewatersector (Garg et al. 2001; Sharma et al. 2011).
A sector-wise review highlights the fragmented efforts of assessing the carbonfootprint in India. There are no comprehensive efforts to assess the carbon foot-print among all sectors in rapidly urbanizing cities, which is vital for evolvingappropriate city-specific mitigation measures. The objectives of this chapter are toquantify and analyze sector-wise greenhouse gas emissions in terms of carbondioxide equivalent (CO2 eq) across major cities in India.
Section 2 presents methods for quantifying the carbon footprint for electricity,domestic, industry, transportation, agriculture, livestock, and waste sectors; it alsoprovides a brief account of cities chosen for the current study. Section 3 provides adetailed account of sector-wise carbon footprints for major cities in India, with asynthesis of intercity variations. This is followed by conclusions and gaps in thecurrent study in Sects. 4 and 5, respectively. Annex 1 provides the sector-wisecarbon footprints for major cities in India.
2 Method
2.1 Study Area
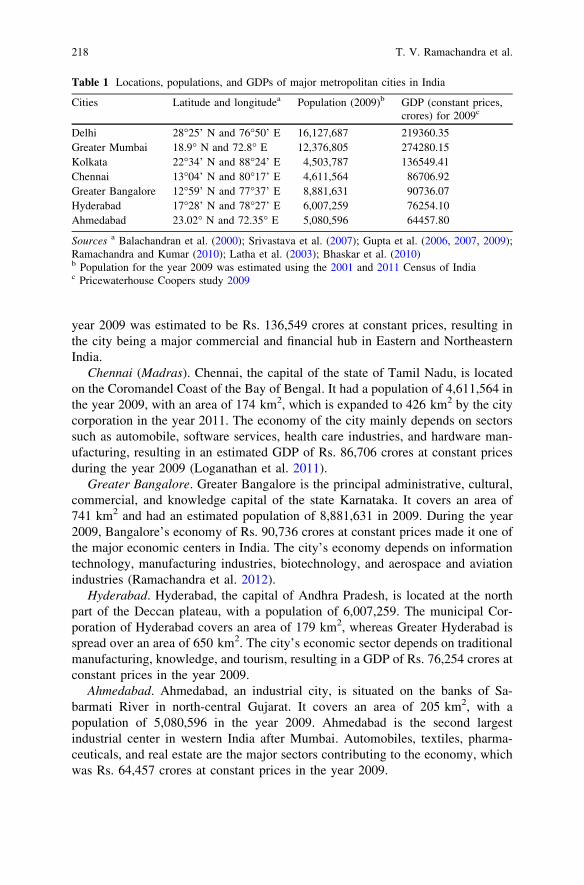
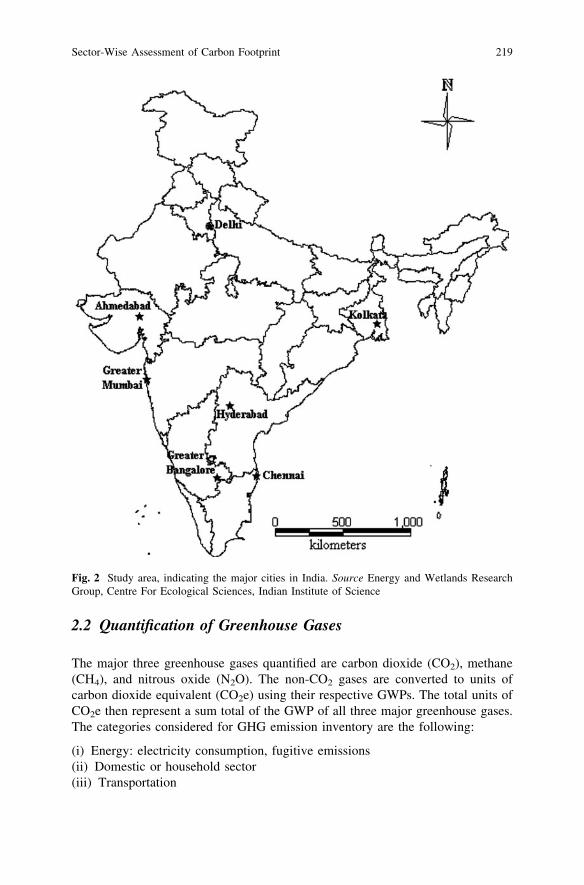
Carbon footprint has been assessed for eight major metropolitan cities (populationsof [4 million per 2011 census) in India: Delhi, Greater Mumbai, Kolkata,Chennai, Greater Bangalore, Hyderabad, and Ahmedabad. Except for Ahmedabad,all of these cities are class X (formerly class A1) cities as per the classification ofMinistry of Finance (HRA 2008). Table 1 lists the location, population, and GDPfor all chosen cities. Geographic locations of the cities are depicted in Fig. 2.
Delhi. Delhi is the capital of India with long history, covering an area of1483 km2 with a population of 16,127,687 (in 2009). This city borders UttarPradesh state to the east and Haryana on the north, west, and south. In 2009, Delhihad a GDP of Rs. 219,360 crores at constant prices, which primarily relies on theintegral sectors such as power, telecommunications, health services, construction,and real estate (SOE 2010).
Greater Mumbai (Bombay). Greater Mumbai, the capital of Maharashtra, is oneof the major port cities located at the Coast of Arabic Sea in the west coast inIndia. The Greater Mumbai region consists of the Mumbai city district andMumbai suburban district. It covers a total area of 603.4 km2, with a population of12,376,805 (in 2009). It is also the commercial and entertainment capital of India,generating a GDP of Rs. 274,280 crores at constant prices and contributing to 5 %of India’s GDP (MoUD 2009; MMRDA 2008).
Kolkata (Calcutta). Kolkata, the capital of West Bengal, is located on the eastbank of the Hooghly River. The Municipal Corporation of Kolkata covers an areaof 187 km2, with a population of 4,503,787 (in 2009). The GDP of Kolkata in the
Sector-Wise Assessment of Carbon Footprint 217
year 2009 was estimated to be Rs. 136,549 crores at constant prices, resulting inthe city being a major commercial and financial hub in Eastern and NortheasternIndia.
Chennai (Madras). Chennai, the capital of the state of Tamil Nadu, is locatedon the Coromandel Coast of the Bay of Bengal. It had a population of 4,611,564 inthe year 2009, with an area of 174 km2, which is expanded to 426 km2 by the citycorporation in the year 2011. The economy of the city mainly depends on sectorssuch as automobile, software services, health care industries, and hardware man-ufacturing, resulting in an estimated GDP of Rs. 86,706 crores at constant pricesduring the year 2009 (Loganathan et al. 2011).
Greater Bangalore. Greater Bangalore is the principal administrative, cultural,commercial, and knowledge capital of the state Karnataka. It covers an area of741 km2 and had an estimated population of 8,881,631 in 2009. During the year2009, Bangalore’s economy of Rs. 90,736 crores at constant prices made it one ofthe major economic centers in India. The city’s economy depends on informationtechnology, manufacturing industries, biotechnology, and aerospace and aviationindustries (Ramachandra et al. 2012).
Hyderabad. Hyderabad, the capital of Andhra Pradesh, is located at the northpart of the Deccan plateau, with a population of 6,007,259. The municipal Cor-poration of Hyderabad covers an area of 179 km2, whereas Greater Hyderabad isspread over an area of 650 km2. The city’s economic sector depends on traditionalmanufacturing, knowledge, and tourism, resulting in a GDP of Rs. 76,254 crores atconstant prices in the year 2009.
Ahmedabad. Ahmedabad, an industrial city, is situated on the banks of Sa-barmati River in north-central Gujarat. It covers an area of 205 km2, with apopulation of 5,080,596 in the year 2009. Ahmedabad is the second largestindustrial center in western India after Mumbai. Automobiles, textiles, pharma-ceuticals, and real estate are the major sectors contributing to the economy, whichwas Rs. 64,457 crores at constant prices in the year 2009.
Table 1 Locations, populations, and GDPs of major metropolitan cities in India
Cities Latitude and longitudea Population (2009)b GDP (constant prices,crores) for 2009c
Delhi 28�25’ N and 76�50’ E 16,127,687 219360.35Greater Mumbai 18.9� N and 72.8� E 12,376,805 274280.15Kolkata 22�34’ N and 88�24’ E 4,503,787 136549.41Chennai 13�04’ N and 80�17’ E 4,611,564 86706.92Greater Bangalore 12�59’ N and 77�37’ E 8,881,631 90736.07Hyderabad 17�28’ N and 78�27’ E 6,007,259 76254.10Ahmedabad 23.02� N and 72.35� E 5,080,596 64457.80
Sources a Balachandran et al. (2000); Srivastava et al. (2007); Gupta et al. (2006, 2007, 2009);Ramachandra and Kumar (2010); Latha et al. (2003); Bhaskar et al. (2010)b Population for the year 2009 was estimated using the 2001 and 2011 Census of Indiac Pricewaterhouse Coopers study 2009
218 T. V. Ramachandra et al.
2.2 Quantification of Greenhouse Gases
The major three greenhouse gases quantified are carbon dioxide (CO2), methane(CH4), and nitrous oxide (N2O). The non-CO2 gases are converted to units ofcarbon dioxide equivalent (CO2e) using their respective GWPs. The total units ofCO2e then represent a sum total of the GWP of all three major greenhouse gases.The categories considered for GHG emission inventory are the following:
(i) Energy: electricity consumption, fugitive emissions(ii) Domestic or household sector(iii) Transportation
Fig. 2 Study area, indicating the major cities in India. Source Energy and Wetlands ResearchGroup, Centre For Ecological Sciences, Indian Institute of Science
Sector-Wise Assessment of Carbon Footprint 219
(iv) Industrial sector(v) Agriculture-related activities(vi) Livestock management(vii) Waste sector.
National GHG inventories compiled from various sources were used for thecalculation of GHG emissions. Country-specific emission factors were compiledfrom the published literature. In the absence of country-specific emission factors,the default emission factors from the IPCC were used. The emission of each GHGwas estimated by multiplying fuel consumption by the corresponding emissionfactor. The total emissions of a gas from all its source categories (Ramachandraand Shwetmala 2012; Pandey et al. 2011; Global Footprint Network 2007) aresummed as given in Eq. 1:
EmissionsGas¼X
CategoryA� EF ð1Þ
whereEmissionsGas emissions of a given gas from all its source categoriesA amount of an individual source category utilized that generates
emissions of the gas under considerationEF emission factor of a given gas type by type of source category
GHG Emissions from Electricity Consumption. The combustion of fossil fuelsin thermal power plants during electricity generation results in the emission ofGHG into the atmosphere. CO2, oxides of sulfur (SOx), nitrogen oxides (NOx),other trace gases, and airborne inorganic particulates, such as fly ash and sus-pended particulate matter, are the most important constituents emitted from theburning of fossil fuels from thermal power plants (Raghuvanshi et al. 2006;Ramachandra and Shwetmala 2012; TEDDY 2006, 2011). The emissions werecomputed based on consumption in the following categories: domestic, commer-cial, industrial, and others (which includes consumption in railways, street lights,municipal water supply, sewage treatment, etc.) based on the amount of electricityconsumed by these sectors. The total GHG emissions were calculated on the basisof fuel consumption required for the generation of electricity using Eq. 2:
Emissions tð Þ ¼ Fuel consumption ktð Þ � Net calorific value of fuel TJ=ktð Þ� Emission factor t=TJð Þ
ð2Þ
Electricity is generated from various sources (coal, hydro, nuclear, gas, etc.).The proportion of electricity generated from each source for each study region wascompiled from secondary sources (state electricity board, central electricalauthority, etc.). The quantity of respective fuel is computed with the knowledge ofthe relative share of fuel and the quantity of fuel required for generating one unit of
220 T. V. Ramachandra et al.
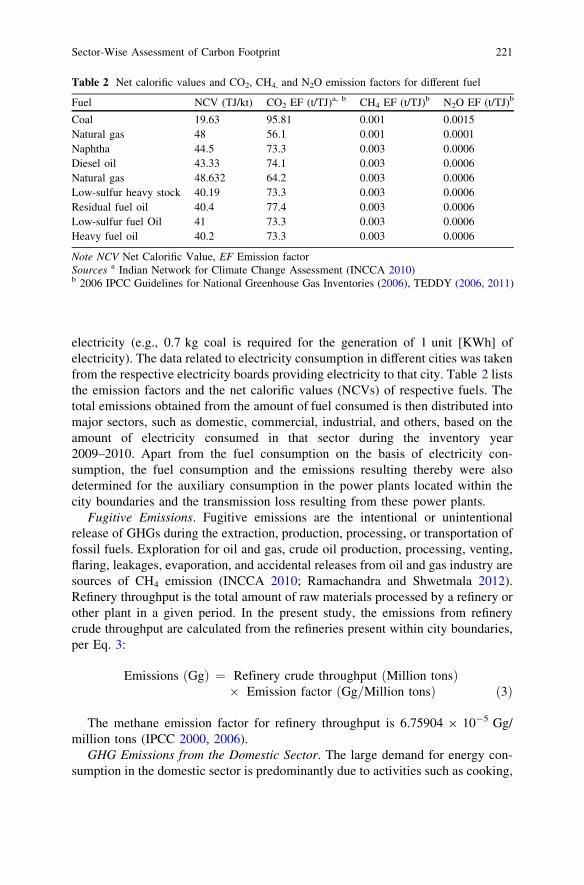
electricity (e.g., 0.7 kg coal is required for the generation of 1 unit [KWh] ofelectricity). The data related to electricity consumption in different cities was takenfrom the respective electricity boards providing electricity to that city. Table 2 liststhe emission factors and the net calorific values (NCVs) of respective fuels. Thetotal emissions obtained from the amount of fuel consumed is then distributed intomajor sectors, such as domestic, commercial, industrial, and others, based on theamount of electricity consumed in that sector during the inventory year2009–2010. Apart from the fuel consumption on the basis of electricity con-sumption, the fuel consumption and the emissions resulting thereby were alsodetermined for the auxiliary consumption in the power plants located within thecity boundaries and the transmission loss resulting from these power plants.
Fugitive Emissions. Fugitive emissions are the intentional or unintentionalrelease of GHGs during the extraction, production, processing, or transportation offossil fuels. Exploration for oil and gas, crude oil production, processing, venting,flaring, leakages, evaporation, and accidental releases from oil and gas industry aresources of CH4 emission (INCCA 2010; Ramachandra and Shwetmala 2012).Refinery throughput is the total amount of raw materials processed by a refinery orother plant in a given period. In the present study, the emissions from refinerycrude throughput are calculated from the refineries present within city boundaries,per Eq. 3:
Emissions Ggð Þ ¼ Refinery crude throughput Million tonsð Þ� Emission factor Gg=Million tonsð Þ ð3Þ
The methane emission factor for refinery throughput is 6.75904 9 10-5 Gg/million tons (IPCC 2000, 2006).
GHG Emissions from the Domestic Sector. The large demand for energy con-sumption in the domestic sector is predominantly due to activities such as cooking,
Table 2 Net calorific values and CO2, CH4, and N2O emission factors for different fuel
Fuel NCV (TJ/kt) CO2 EF (t/TJ)a, b CH4 EF (t/TJ)b N2O EF (t/TJ)b
Coal 19.63 95.81 0.001 0.0015Natural gas 48 56.1 0.001 0.0001Naphtha 44.5 73.3 0.003 0.0006Diesel oil 43.33 74.1 0.003 0.0006Natural gas 48.632 64.2 0.003 0.0006Low-sulfur heavy stock 40.19 73.3 0.003 0.0006Residual fuel oil 40.4 77.4 0.003 0.0006Low-sulfur fuel Oil 41 73.3 0.003 0.0006Heavy fuel oil 40.2 73.3 0.003 0.0006
Note NCV Net Calorific Value, EF Emission factorSources a Indian Network for Climate Change Assessment (INCCA 2010)b 2006 IPCC Guidelines for National Greenhouse Gas Inventories (2006), TEDDY (2006, 2011)
Sector-Wise Assessment of Carbon Footprint 221
lighting, heating, and household appliances. Per the Census of India (2001), inurban areas, the most commonly used fuel is liquefied petroleum gas (LPG;47.96 %), followed by firewood (22.74 %) and kerosene (19.16 %). Electricityconsumption is another major source of energy utilization in urban households.The pollution caused by domestic fuel use is a major source of emissions in cities,which causes indoor air pollution that contributes to overall pollution. The type offuels used in households also affects air pollution.
The emissions resulting from electricity consumption in the domestic sector areattributed to this sector. GHG emissions from fuel consumption in the domesticsector can be calculated by Eq. 4 (Ramachandra and Shwetmala 2012).
Emissions tð Þ ¼ Fuel consumption ktð Þ � Net calorific value of fuel TJ=ktð Þ� Emission factor t=TJð Þ
ð4Þ
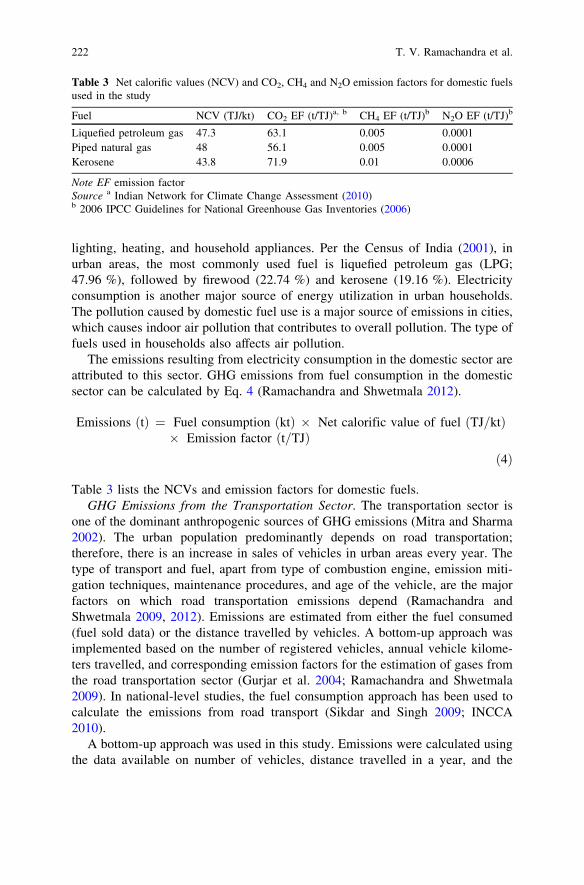
Table 3 lists the NCVs and emission factors for domestic fuels.GHG Emissions from the Transportation Sector. The transportation sector is
one of the dominant anthropogenic sources of GHG emissions (Mitra and Sharma2002). The urban population predominantly depends on road transportation;therefore, there is an increase in sales of vehicles in urban areas every year. Thetype of transport and fuel, apart from type of combustion engine, emission miti-gation techniques, maintenance procedures, and age of the vehicle, are the majorfactors on which road transportation emissions depend (Ramachandra andShwetmala 2009, 2012). Emissions are estimated from either the fuel consumed(fuel sold data) or the distance travelled by vehicles. A bottom-up approach wasimplemented based on the number of registered vehicles, annual vehicle kilome-ters travelled, and corresponding emission factors for the estimation of gases fromthe road transportation sector (Gurjar et al. 2004; Ramachandra and Shwetmala2009). In national-level studies, the fuel consumption approach has been used tocalculate the emissions from road transport (Sikdar and Singh 2009; INCCA2010).
A bottom-up approach was used in this study. Emissions were calculated usingthe data available on number of vehicles, distance travelled in a year, and the
Table 3 Net calorific values (NCV) and CO2, CH4 and N2O emission factors for domestic fuelsused in the study
Fuel NCV (TJ/kt) CO2 EF (t/TJ)a, b CH4 EF (t/TJ)b N2O EF (t/TJ)b
Liquefied petroleum gas 47.3 63.1 0.005 0.0001Piped natural gas 48 56.1 0.005 0.0001Kerosene 43.8 71.9 0.01 0.0006
Note EF emission factorSource a Indian Network for Climate Change Assessment (2010)b 2006 IPCC Guidelines for National Greenhouse Gas Inventories (2006)
222 T. V. Ramachandra et al.
respective emission factor for different vehicles. Emissions from road transpor-tation were calculated per Eq. 5:
Ei ¼X
Vehj � Dj
� �� Ei;j;km ð5Þ
whereEi Emission of the compound (i)Vehj Number of vehicles per type (j)Dj Distance travelled in a year per different vehicle type (j)E i,j,km Emission of compound (i) for vehicle type (j) per driven kilometer
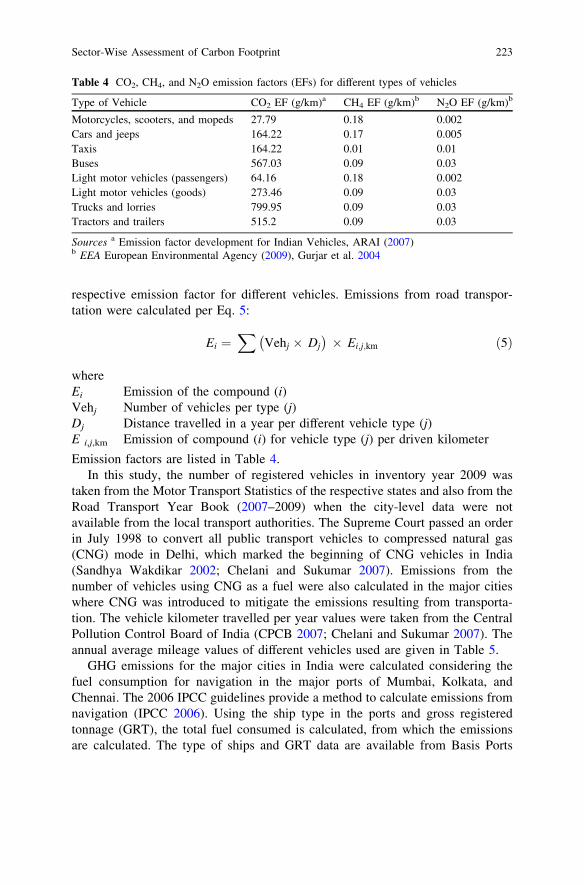
Emission factors are listed in Table 4.In this study, the number of registered vehicles in inventory year 2009 was
taken from the Motor Transport Statistics of the respective states and also from theRoad Transport Year Book (2007–2009) when the city-level data were notavailable from the local transport authorities. The Supreme Court passed an orderin July 1998 to convert all public transport vehicles to compressed natural gas(CNG) mode in Delhi, which marked the beginning of CNG vehicles in India(Sandhya Wakdikar 2002; Chelani and Sukumar 2007). Emissions from thenumber of vehicles using CNG as a fuel were also calculated in the major citieswhere CNG was introduced to mitigate the emissions resulting from transporta-tion. The vehicle kilometer travelled per year values were taken from the CentralPollution Control Board of India (CPCB 2007; Chelani and Sukumar 2007). Theannual average mileage values of different vehicles used are given in Table 5.
GHG emissions for the major cities in India were calculated considering thefuel consumption for navigation in the major ports of Mumbai, Kolkata, andChennai. The 2006 IPCC guidelines provide a method to calculate emissions fromnavigation (IPCC 2006). Using the ship type in the ports and gross registeredtonnage (GRT), the total fuel consumed is calculated, from which the emissionsare calculated. The type of ships and GRT data are available from Basis Ports
Table 4 CO2, CH4, and N2O emission factors (EFs) for different types of vehicles
Type of Vehicle CO2 EF (g/km)a CH4 EF (g/km)b N2O EF (g/km)b
Motorcycles, scooters, and mopeds 27.79 0.18 0.002Cars and jeeps 164.22 0.17 0.005Taxis 164.22 0.01 0.01Buses 567.03 0.09 0.03Light motor vehicles (passengers) 64.16 0.18 0.002Light motor vehicles (goods) 273.46 0.09 0.03Trucks and lorries 799.95 0.09 0.03Tractors and trailers 515.2 0.09 0.03
Sources a Emission factor development for Indian Vehicles, ARAI (2007)b EEA European Environmental Agency (2009), Gurjar et al. 2004
Sector-Wise Assessment of Carbon Footprint 223
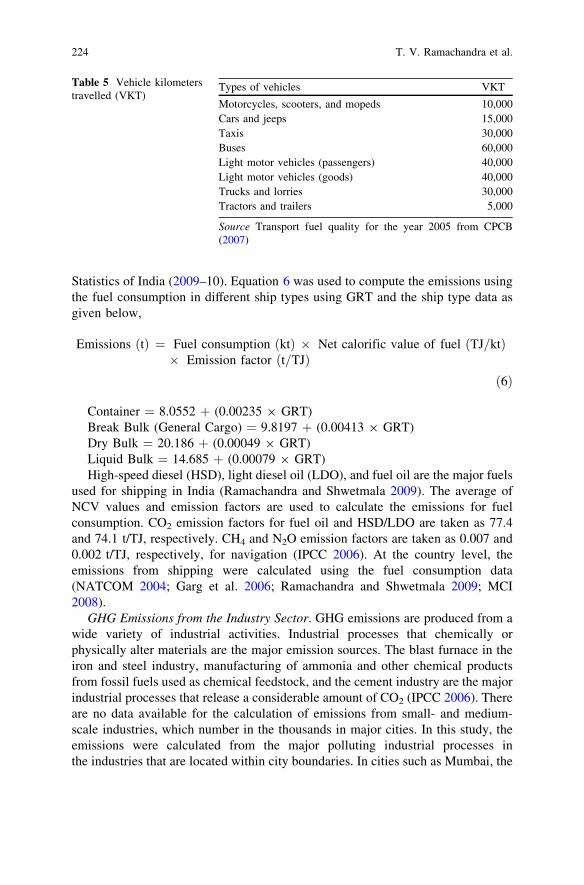
Statistics of India (2009–10). Equation 6 was used to compute the emissions usingthe fuel consumption in different ship types using GRT and the ship type data asgiven below,
Emissions tð Þ ¼ Fuel consumption ktð Þ � Net calorific value of fuel TJ=ktð Þ� Emission factor t=TJð Þ
ð6Þ
Container = 8.0552 + (0.00235 9 GRT)Break Bulk (General Cargo) = 9.8197 + (0.00413 9 GRT)Dry Bulk = 20.186 + (0.00049 9 GRT)Liquid Bulk = 14.685 + (0.00079 9 GRT)High-speed diesel (HSD), light diesel oil (LDO), and fuel oil are the major fuels
used for shipping in India (Ramachandra and Shwetmala 2009). The average ofNCV values and emission factors are used to calculate the emissions for fuelconsumption. CO2 emission factors for fuel oil and HSD/LDO are taken as 77.4and 74.1 t/TJ, respectively. CH4 and N2O emission factors are taken as 0.007 and0.002 t/TJ, respectively, for navigation (IPCC 2006). At the country level, theemissions from shipping were calculated using the fuel consumption data(NATCOM 2004; Garg et al. 2006; Ramachandra and Shwetmala 2009; MCI2008).
GHG Emissions from the Industry Sector. GHG emissions are produced from awide variety of industrial activities. Industrial processes that chemically orphysically alter materials are the major emission sources. The blast furnace in theiron and steel industry, manufacturing of ammonia and other chemical productsfrom fossil fuels used as chemical feedstock, and the cement industry are the majorindustrial processes that release a considerable amount of CO2 (IPCC 2006). Thereare no data available for the calculation of emissions from small- and medium-scale industries, which number in the thousands in major cities. In this study, theemissions were calculated from the major polluting industrial processes inthe industries that are located within city boundaries. In cities such as Mumbai, the
Table 5 Vehicle kilometerstravelled (VKT)
Types of vehicles VKT
Motorcycles, scooters, and mopeds 10,000Cars and jeeps 15,000Taxis 30,000Buses 60,000Light motor vehicles (passengers) 40,000Light motor vehicles (goods) 40,000Trucks and lorries 30,000Tractors and trailers 5,000
Source Transport fuel quality for the year 2005 from CPCB(2007)
224 T. V. Ramachandra et al.
presence of large petrochemical plants, fertilizer plants, and power plants leads toemissions (Kulkarni et al. 2000).
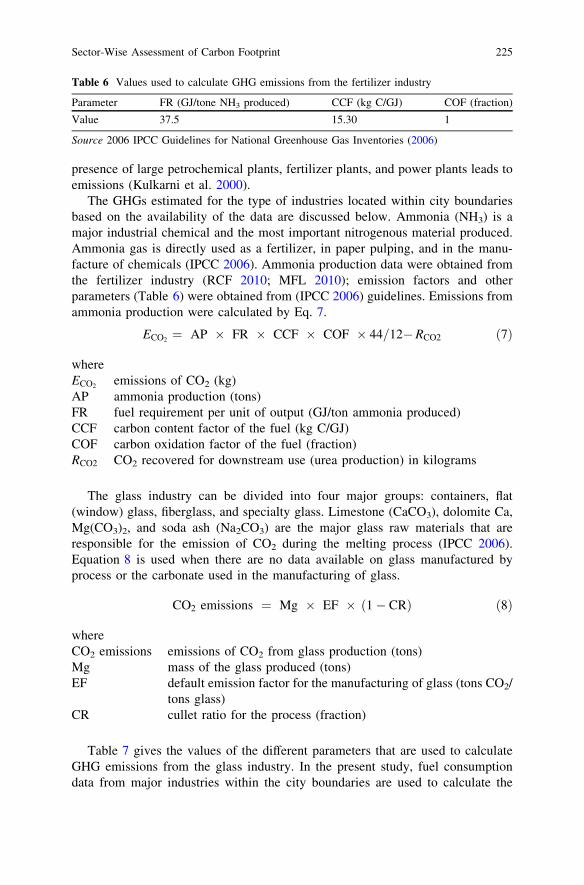
The GHGs estimated for the type of industries located within city boundariesbased on the availability of the data are discussed below. Ammonia (NH3) is amajor industrial chemical and the most important nitrogenous material produced.Ammonia gas is directly used as a fertilizer, in paper pulping, and in the manu-facture of chemicals (IPCC 2006). Ammonia production data were obtained fromthe fertilizer industry (RCF 2010; MFL 2010); emission factors and otherparameters (Table 6) were obtained from (IPCC 2006) guidelines. Emissions fromammonia production were calculated by Eq. 7.
ECO2 ¼ AP � FR � CCF � COF � 44=12�RCO2 ð7Þ
whereECO2 emissions of CO2 (kg)AP ammonia production (tons)FR fuel requirement per unit of output (GJ/ton ammonia produced)CCF carbon content factor of the fuel (kg C/GJ)COF carbon oxidation factor of the fuel (fraction)RCO2 CO2 recovered for downstream use (urea production) in kilograms
The glass industry can be divided into four major groups: containers, flat(window) glass, fiberglass, and specialty glass. Limestone (CaCO3), dolomite Ca,Mg(CO3)2, and soda ash (Na2CO3) are the major glass raw materials that areresponsible for the emission of CO2 during the melting process (IPCC 2006).Equation 8 is used when there are no data available on glass manufactured byprocess or the carbonate used in the manufacturing of glass.
CO2 emissions ¼ Mg � EF � 1� CRð Þ ð8Þ
whereCO2 emissions emissions of CO2 from glass production (tons)Mg mass of the glass produced (tons)EF default emission factor for the manufacturing of glass (tons CO2/
tons glass)CR cullet ratio for the process (fraction)
Table 7 gives the values of the different parameters that are used to calculateGHG emissions from the glass industry. In the present study, fuel consumptiondata from major industries within the city boundaries are used to calculate the
Table 6 Values used to calculate GHG emissions from the fertilizer industry
Parameter FR (GJ/tone NH3 produced) CCF (kg C/GJ) COF (fraction)
Value 37.5 15.30 1
Source 2006 IPCC Guidelines for National Greenhouse Gas Inventories (2006)
Sector-Wise Assessment of Carbon Footprint 225
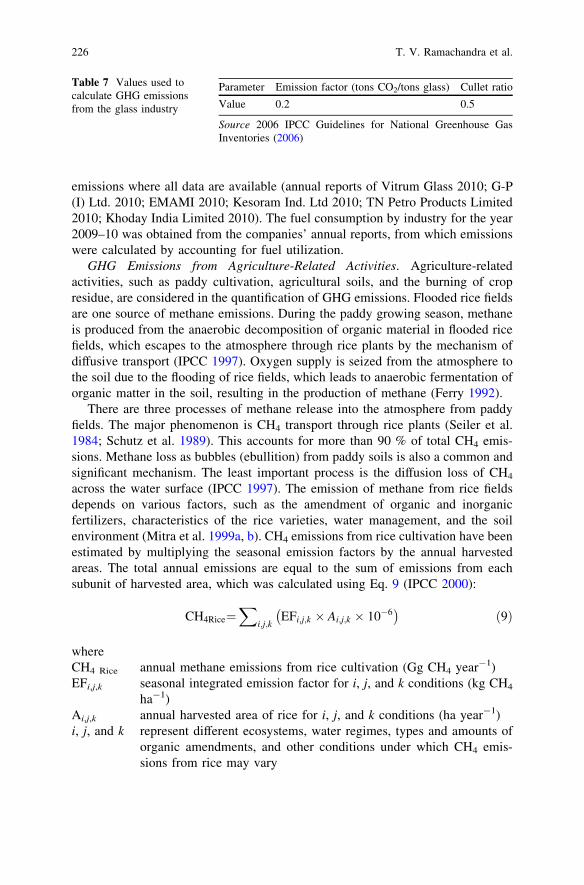
emissions where all data are available (annual reports of Vitrum Glass 2010; G-P(I) Ltd. 2010; EMAMI 2010; Kesoram Ind. Ltd 2010; TN Petro Products Limited2010; Khoday India Limited 2010). The fuel consumption by industry for the year2009–10 was obtained from the companies’ annual reports, from which emissionswere calculated by accounting for fuel utilization.
GHG Emissions from Agriculture-Related Activities. Agriculture-relatedactivities, such as paddy cultivation, agricultural soils, and the burning of cropresidue, are considered in the quantification of GHG emissions. Flooded rice fieldsare one source of methane emissions. During the paddy growing season, methaneis produced from the anaerobic decomposition of organic material in flooded ricefields, which escapes to the atmosphere through rice plants by the mechanism ofdiffusive transport (IPCC 1997). Oxygen supply is seized from the atmosphere tothe soil due to the flooding of rice fields, which leads to anaerobic fermentation oforganic matter in the soil, resulting in the production of methane (Ferry 1992).
There are three processes of methane release into the atmosphere from paddyfields. The major phenomenon is CH4 transport through rice plants (Seiler et al.1984; Schutz et al. 1989). This accounts for more than 90 % of total CH4 emis-sions. Methane loss as bubbles (ebullition) from paddy soils is also a common andsignificant mechanism. The least important process is the diffusion loss of CH4
across the water surface (IPCC 1997). The emission of methane from rice fieldsdepends on various factors, such as the amendment of organic and inorganicfertilizers, characteristics of the rice varieties, water management, and the soilenvironment (Mitra et al. 1999a, b). CH4 emissions from rice cultivation have beenestimated by multiplying the seasonal emission factors by the annual harvestedareas. The total annual emissions are equal to the sum of emissions from eachsubunit of harvested area, which was calculated using Eq. 9 (IPCC 2000):
CH4Rice¼X
i;j;kEFi;j;k � Ai;j;k � 10�6� �
ð9Þ
whereCH4 Rice annual methane emissions from rice cultivation (Gg CH4 year-1)EFi,j,k seasonal integrated emission factor for i, j, and k conditions (kg CH4
ha-1)Ai,j,k annual harvested area of rice for i, j, and k conditions (ha year-1)i, j, and k represent different ecosystems, water regimes, types and amounts of
organic amendments, and other conditions under which CH4 emis-sions from rice may vary
Table 7 Values used tocalculate GHG emissionsfrom the glass industry
Parameter Emission factor (tons CO2/tons glass) Cullet ratio
Value 0.2 0.5
Source 2006 IPCC Guidelines for National Greenhouse GasInventories (2006)
226 T. V. Ramachandra et al.
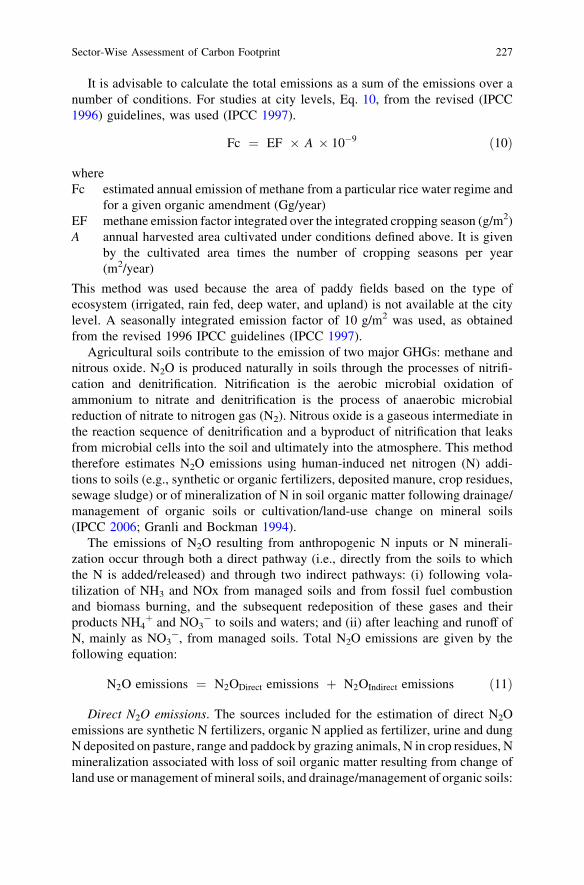
It is advisable to calculate the total emissions as a sum of the emissions over anumber of conditions. For studies at city levels, Eq. 10, from the revised (IPCC1996) guidelines, was used (IPCC 1997).
Fc ¼ EF � A � 10�9 ð10Þ
whereFc estimated annual emission of methane from a particular rice water regime and
for a given organic amendment (Gg/year)EF methane emission factor integrated over the integrated cropping season (g/m2)A annual harvested area cultivated under conditions defined above. It is given
by the cultivated area times the number of cropping seasons per year(m2/year)
This method was used because the area of paddy fields based on the type ofecosystem (irrigated, rain fed, deep water, and upland) is not available at the citylevel. A seasonally integrated emission factor of 10 g/m2 was used, as obtainedfrom the revised 1996 IPCC guidelines (IPCC 1997).
Agricultural soils contribute to the emission of two major GHGs: methane andnitrous oxide. N2O is produced naturally in soils through the processes of nitrifi-cation and denitrification. Nitrification is the aerobic microbial oxidation ofammonium to nitrate and denitrification is the process of anaerobic microbialreduction of nitrate to nitrogen gas (N2). Nitrous oxide is a gaseous intermediate inthe reaction sequence of denitrification and a byproduct of nitrification that leaksfrom microbial cells into the soil and ultimately into the atmosphere. This methodtherefore estimates N2O emissions using human-induced net nitrogen (N) addi-tions to soils (e.g., synthetic or organic fertilizers, deposited manure, crop residues,sewage sludge) or of mineralization of N in soil organic matter following drainage/management of organic soils or cultivation/land-use change on mineral soils(IPCC 2006; Granli and Bockman 1994).
The emissions of N2O resulting from anthropogenic N inputs or N minerali-zation occur through both a direct pathway (i.e., directly from the soils to whichthe N is added/released) and through two indirect pathways: (i) following vola-tilization of NH3 and NOx from managed soils and from fossil fuel combustionand biomass burning, and the subsequent redeposition of these gases and theirproducts NH4
+ and NO3- to soils and waters; and (ii) after leaching and runoff of
N, mainly as NO3-, from managed soils. Total N2O emissions are given by the
following equation:
N2O emissions ¼ N2ODirect emissions þ N2OIndirect emissions ð11Þ
Direct N2O emissions. The sources included for the estimation of direct N2Oemissions are synthetic N fertilizers, organic N applied as fertilizer, urine and dungN deposited on pasture, range and paddock by grazing animals, N in crop residues, Nmineralization associated with loss of soil organic matter resulting from change ofland use or management of mineral soils, and drainage/management of organic soils:
Sector-Wise Assessment of Carbon Footprint 227
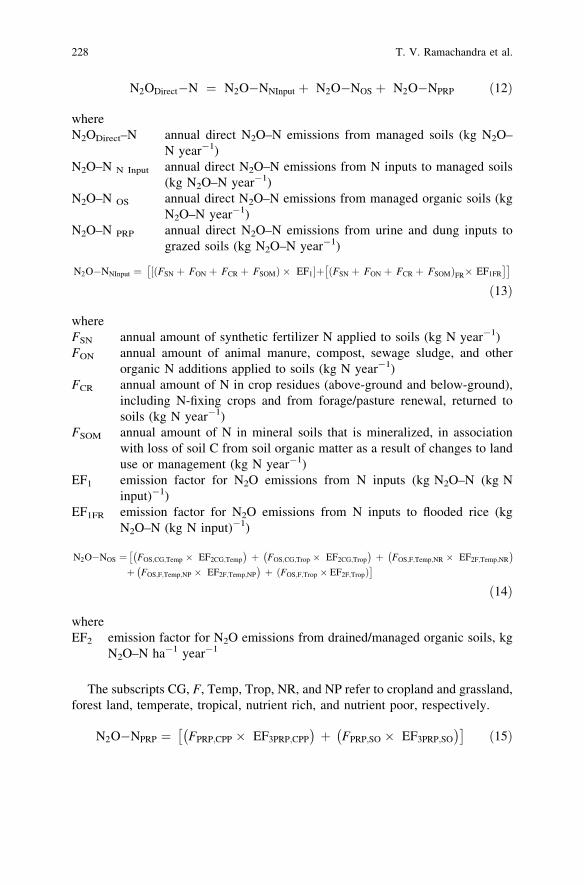
N2ODirect�N ¼ N2O�NNInput þ N2O�NOS þ N2O�NPRP ð12Þ
whereN2ODirect–N annual direct N2O–N emissions from managed soils (kg N2O–
N year-1)N2O–N N Input annual direct N2O–N emissions from N inputs to managed soils
(kg N2O–N year-1)N2O–N OS annual direct N2O–N emissions from managed organic soils (kg
N2O–N year-1)N2O–N PRP annual direct N2O–N emissions from urine and dung inputs to
grazed soils (kg N2O–N year-1)
N2O�NNInput ¼ FSN þ FON þ FCR þ FSOMð Þ � EF1½ �þ FSN þ FON þ FCR þ FSOMð ÞFR� EF1FR
� �� �
ð13Þ
whereFSN annual amount of synthetic fertilizer N applied to soils (kg N year-1)FON annual amount of animal manure, compost, sewage sludge, and other
organic N additions applied to soils (kg N year-1)FCR annual amount of N in crop residues (above-ground and below-ground),
including N-fixing crops and from forage/pasture renewal, returned tosoils (kg N year-1)
FSOM annual amount of N in mineral soils that is mineralized, in associationwith loss of soil C from soil organic matter as a result of changes to landuse or management (kg N year-1)
EF1 emission factor for N2O emissions from N inputs (kg N2O–N (kg Ninput)-1)
EF1FR emission factor for N2O emissions from N inputs to flooded rice (kgN2O–N (kg N input)-1)
N2O�NOS ¼ FOS;CG;Temp � EF2CG;Temp
� �þ FOS;CG;Trop � EF2CG;Trop
� �þ FOS;F;Temp;NR � EF2F;Temp;NR
� ��
þ FOS;F;Temp;NP � EF2F;Temp;NP
� �þ ðFOS;F;Trop � EF2F;TropÞ
�
ð14Þ
whereEF2 emission factor for N2O emissions from drained/managed organic soils, kg
N2O–N ha-1 year-1
The subscripts CG, F, Temp, Trop, NR, and NP refer to cropland and grassland,forest land, temperate, tropical, nutrient rich, and nutrient poor, respectively.
N2O�NPRP ¼ FPRP;CPP � EF3PRP;CPP
� �þ FPRP;SO � EF3PRP;SO
� �� �ð15Þ
228 T. V. Ramachandra et al.
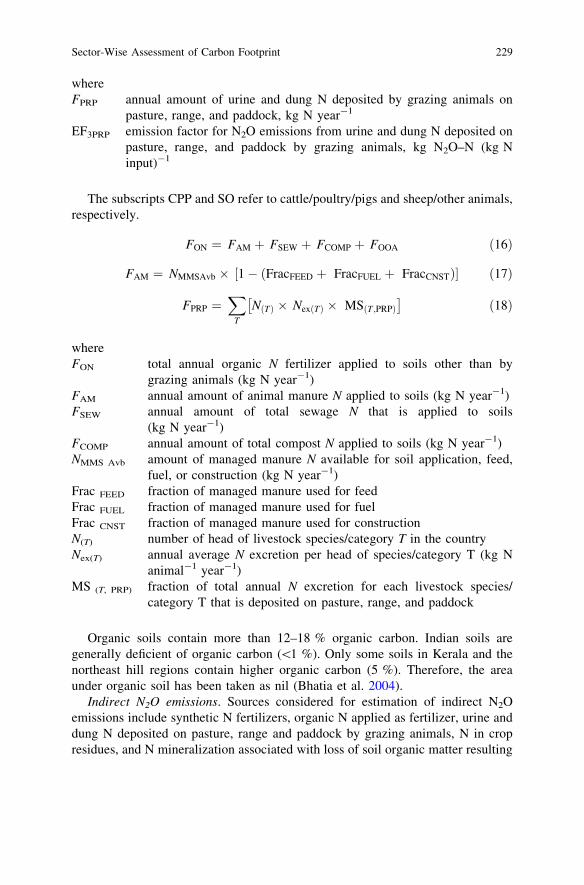
whereFPRP annual amount of urine and dung N deposited by grazing animals on
pasture, range, and paddock, kg N year-1
EF3PRP emission factor for N2O emissions from urine and dung N deposited onpasture, range, and paddock by grazing animals, kg N2O–N (kg Ninput)-1
The subscripts CPP and SO refer to cattle/poultry/pigs and sheep/other animals,respectively.
FON ¼ FAM þ FSEW þ FCOMP þ FOOA ð16Þ
FAM ¼ NMMSAvb � 1� FracFEED þ FracFUEL þ FracCNSTð Þ½ � ð17Þ
FPRP ¼X
T
NðTÞ � NexðTÞ � MSðT ;PRPÞ� �
ð18Þ
whereFON total annual organic N fertilizer applied to soils other than by
grazing animals (kg N year-1)FAM annual amount of animal manure N applied to soils (kg N year-1)FSEW annual amount of total sewage N that is applied to soils
(kg N year-1)FCOMP annual amount of total compost N applied to soils (kg N year-1)NMMS Avb amount of managed manure N available for soil application, feed,
fuel, or construction (kg N year-1)Frac FEED fraction of managed manure used for feedFrac FUEL fraction of managed manure used for fuelFrac CNST fraction of managed manure used for constructionN(T) number of head of livestock species/category T in the countryNex(T) annual average N excretion per head of species/category T (kg N
animal-1 year-1)MS (T, PRP) fraction of total annual N excretion for each livestock species/
category T that is deposited on pasture, range, and paddock
Organic soils contain more than 12–18 % organic carbon. Indian soils aregenerally deficient of organic carbon (\1 %). Only some soils in Kerala and thenortheast hill regions contain higher organic carbon (5 %). Therefore, the areaunder organic soil has been taken as nil (Bhatia et al. 2004).
Indirect N2O emissions. Sources considered for estimation of indirect N2Oemissions include synthetic N fertilizers, organic N applied as fertilizer, urine anddung N deposited on pasture, range and paddock by grazing animals, N in cropresidues, and N mineralization associated with loss of soil organic matter resulting
Sector-Wise Assessment of Carbon Footprint 229
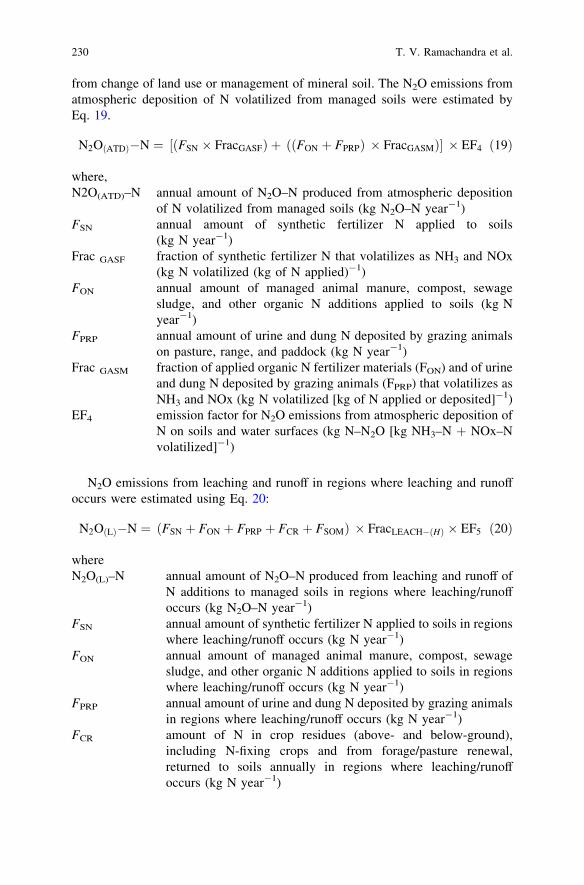
from change of land use or management of mineral soil. The N2O emissions fromatmospheric deposition of N volatilized from managed soils were estimated byEq. 19.
N2O ATDð Þ�N ¼ FSN � FracGASFð Þ þ FON þ FPRPð Þ � FracGASMð Þ½ � � EF4 ð19Þ
where,N2O(ATD)–N annual amount of N2O–N produced from atmospheric deposition
of N volatilized from managed soils (kg N2O–N year-1)FSN annual amount of synthetic fertilizer N applied to soils
(kg N year-1)Frac GASF fraction of synthetic fertilizer N that volatilizes as NH3 and NOx
(kg N volatilized (kg of N applied)-1)FON annual amount of managed animal manure, compost, sewage
sludge, and other organic N additions applied to soils (kg Nyear-1)
FPRP annual amount of urine and dung N deposited by grazing animalson pasture, range, and paddock (kg N year-1)
Frac GASM fraction of applied organic N fertilizer materials (FON) and of urineand dung N deposited by grazing animals (FPRP) that volatilizes asNH3 and NOx (kg N volatilized [kg of N applied or deposited]-1)
EF4 emission factor for N2O emissions from atmospheric deposition ofN on soils and water surfaces (kg N–N2O [kg NH3–N + NOx–Nvolatilized]-1)
N2O emissions from leaching and runoff in regions where leaching and runoffoccurs were estimated using Eq. 20:
N2O Lð Þ�N ¼ FSN þ FON þ FPRP þ FCR þ FSOMð Þ � FracLEACH� Hð Þ � EF5 ð20Þ
whereN2O(L)–N annual amount of N2O–N produced from leaching and runoff of
N additions to managed soils in regions where leaching/runoffoccurs (kg N2O–N year-1)
FSN annual amount of synthetic fertilizer N applied to soils in regionswhere leaching/runoff occurs (kg N year-1)
FON annual amount of managed animal manure, compost, sewagesludge, and other organic N additions applied to soils in regionswhere leaching/runoff occurs (kg N year-1)
FPRP annual amount of urine and dung N deposited by grazing animalsin regions where leaching/runoff occurs (kg N year-1)
FCR amount of N in crop residues (above- and below-ground),including N-fixing crops and from forage/pasture renewal,returned to soils annually in regions where leaching/runoffoccurs (kg N year-1)
230 T. V. Ramachandra et al.
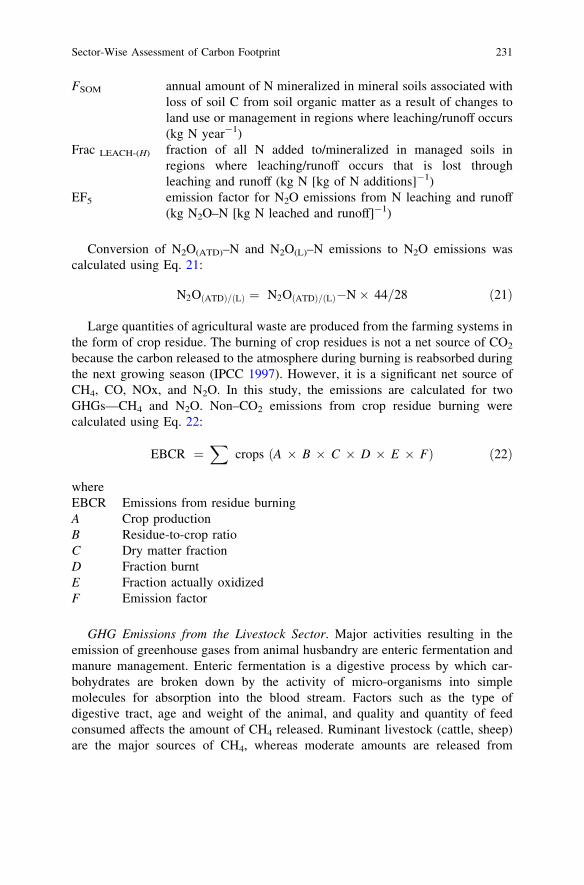
FSOM annual amount of N mineralized in mineral soils associated withloss of soil C from soil organic matter as a result of changes toland use or management in regions where leaching/runoff occurs(kg N year-1)
Frac LEACH-(H) fraction of all N added to/mineralized in managed soils inregions where leaching/runoff occurs that is lost throughleaching and runoff (kg N [kg of N additions]-1)
EF5 emission factor for N2O emissions from N leaching and runoff(kg N2O–N [kg N leached and runoff]-1)
Conversion of N2O(ATD)–N and N2O(L)–N emissions to N2O emissions wascalculated using Eq. 21:
N2O ATDð Þ= Lð Þ ¼ N2O ATDð Þ= Lð Þ�N� 44=28 ð21Þ
Large quantities of agricultural waste are produced from the farming systems inthe form of crop residue. The burning of crop residues is not a net source of CO2
because the carbon released to the atmosphere during burning is reabsorbed duringthe next growing season (IPCC 1997). However, it is a significant net source ofCH4, CO, NOx, and N2O. In this study, the emissions are calculated for twoGHGs—CH4 and N2O. Non–CO2 emissions from crop residue burning werecalculated using Eq. 22:
EBCR ¼X
crops A � B � C � D � E � Fð Þ ð22Þ
whereEBCR Emissions from residue burningA Crop productionB Residue-to-crop ratioC Dry matter fractionD Fraction burntE Fraction actually oxidizedF Emission factor
GHG Emissions from the Livestock Sector. Major activities resulting in theemission of greenhouse gases from animal husbandry are enteric fermentation andmanure management. Enteric fermentation is a digestive process by which car-bohydrates are broken down by the activity of micro-organisms into simplemolecules for absorption into the blood stream. Factors such as the type ofdigestive tract, age and weight of the animal, and quality and quantity of feedconsumed affects the amount of CH4 released. Ruminant livestock (cattle, sheep)are the major sources of CH4, whereas moderate amounts are released from
Sector-Wise Assessment of Carbon Footprint 231
nonruminant livestock (pigs, horses). CH4 emissions from enteric fermentationwere calculated using Eq. 23:
Emissions ¼ EF Tð Þ � N Tð Þ � 10�6 ð23Þ
whereEmissions methane emissions from enteric fermentation (Gg CH4 year-1)EF(T) emission factor for the defined livestock population (kg CH4 head-1
year-1)N(T) the number of heads of livestock species/category TT species/category of livestock
To estimate the total emissions from enteric fermentation, the emissions fromdifferent categories and subcategories were summed together.
Methane emissions from manure management were calculated using Eq. 24:
Emissions ¼ EF Tð Þ � N Tð Þ � 10�6 ð24Þ
whereEmissions methane emissions from manure management (Gg CH4 year-1)EF(T) emission factor for the defined livestock population (kg CH4 head-1
year-1)N(T) the number of head of livestock species/category TT species/category of livestock
Nitrous oxide emissions from manure management were calculated by Eq. 25:
Emissions ¼ EF Tð Þ � N Tð Þ � N�excretion � 10�6 ð25Þ
whereEmissions nitrous oxide emissions from manure management (Gg CH4
year-1)EF(T) emission factor for the defined livestock population (kg N head-1
year-1)N(T) the number of heads of livestock species/category TT species/category of livestockN–excretion nitrogen excretion value for the livestock (kg head-1 year-1)
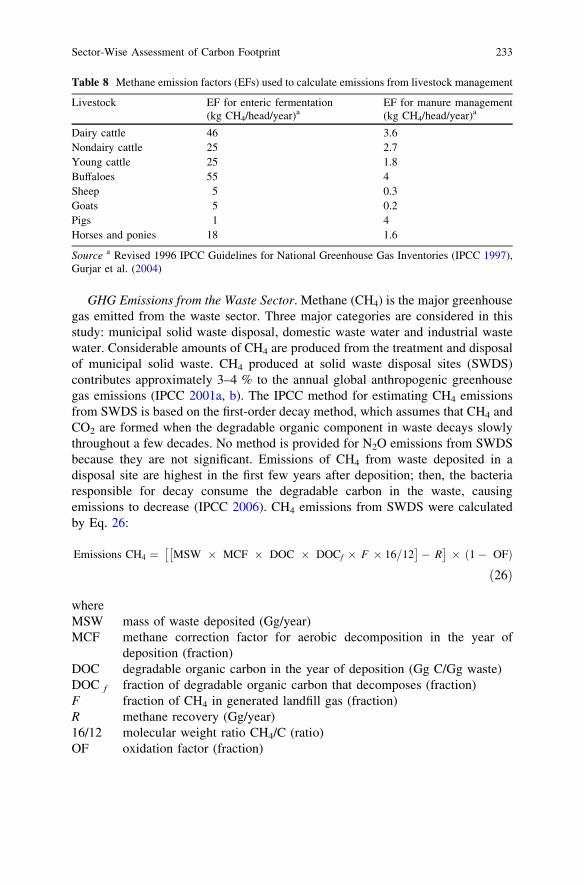
CH4 and N2O emission factors used in this study are shown in Table 8. N2Oemissions from manure management for livestock species of dairy cattle, nondairycattle, young cattle, and buffaloes were taken as 60, 40, 25, and 46.5 kg/head/yr,respectively.
232 T. V. Ramachandra et al.
GHG Emissions from the Waste Sector. Methane (CH4) is the major greenhousegas emitted from the waste sector. Three major categories are considered in thisstudy: municipal solid waste disposal, domestic waste water and industrial wastewater. Considerable amounts of CH4 are produced from the treatment and disposalof municipal solid waste. CH4 produced at solid waste disposal sites (SWDS)contributes approximately 3–4 % to the annual global anthropogenic greenhousegas emissions (IPCC 2001a, b). The IPCC method for estimating CH4 emissionsfrom SWDS is based on the first-order decay method, which assumes that CH4 andCO2 are formed when the degradable organic component in waste decays slowlythroughout a few decades. No method is provided for N2O emissions from SWDSbecause they are not significant. Emissions of CH4 from waste deposited in adisposal site are highest in the first few years after deposition; then, the bacteriaresponsible for decay consume the degradable carbon in the waste, causingemissions to decrease (IPCC 2006). CH4 emissions from SWDS were calculatedby Eq. 26:
Emissions CH4 ¼ MSW � MCF � DOC � DOCf � F � 16=12� �
� R� �
� 1� OFð Þ
ð26Þ
whereMSW mass of waste deposited (Gg/year)MCF methane correction factor for aerobic decomposition in the year of
deposition (fraction)DOC degradable organic carbon in the year of deposition (Gg C/Gg waste)DOC f fraction of degradable organic carbon that decomposes (fraction)F fraction of CH4 in generated landfill gas (fraction)R methane recovery (Gg/year)16/12 molecular weight ratio CH4/C (ratio)OF oxidation factor (fraction)
Table 8 Methane emission factors (EFs) used to calculate emissions from livestock management
Livestock EF for enteric fermentation(kg CH4/head/year)a
EF for manure management(kg CH4/head/year)a
Dairy cattle 46 3.6Nondairy cattle 25 2.7Young cattle 25 1.8Buffaloes 55 4Sheep 5 0.3Goats 5 0.2Pigs 1 4Horses and ponies 18 1.6
Source a Revised 1996 IPCC Guidelines for National Greenhouse Gas Inventories (IPCC 1997),Gurjar et al. (2004)
Sector-Wise Assessment of Carbon Footprint 233
The methane (CH4) correction factor (MCF) accounts for the fact thatunmanaged SWDS produce less CH4 from a given amount of waste than anaerobicmanaged SWDS. An MCF of 0.4 was used in this study for unmanaged andshallow landfills (IPCC 2006). A degradable organic carbon value of 0.11 wasobtained from NEERI (2005). The fraction of degradable organic carbon thatdecomposes (DOC f) was taken as 0.5 (IPCC 2006) the fraction of CH4 (F) ingenerated landfill gas was taken as 0.5 (IPCC 2006). It was considered that thethere is no CH4 recovery in the disposal sites in the major cities, and the oxidationfactor was taken as zero for unmanaged and uncategorized solid waste disposalsystems.
When treated or disposed anaerobically, wastewater can be a source of CH4 andalso N2O emissions. Domestic, commercial, and industrial sectors are the sourcesof wastewater. The wastewater generated may be treated onsite or in a centralizedplant, or disposed untreated to nearby bodies of water. Wastewater in closedunderground sewers is not believed to be a significant source of CH4. Thewastewater in open sewers will be subjected to heating from the sun and the sewerconditions may be stagnant, causing anaerobic conditions to emit CH4 (Nicholas2006). There is a variation in the degree of wastewater treatment in most devel-oping countries. Domestic wastewater is treated in centralized plants, septic sys-tems, or may be disposed of in unmanaged lagoons or waterways, via open orclosed sewers. Though the major industrial facilities may have comprehensiveonsite treatment, in a few cases industrial wastewater is discharged directly intothe water bodies (IPCC 2006).
The extent of CH4 production depends primarily on the quantity of degradableorganic material in the wastewater, the temperature, and the type of treatmentsystem. More CH4 is yielded from wastewater with higher COD or BOD con-centrations when compared to wastewater with lower COD or BOD concentra-tions. An increase in temperature will also increase the rate of CH4 production.N2O is associated with the degradation of nitrogen components (urea, nitrate, andprotein) in the wastewater. Domestic wastewater mainly includes human sewagemixed with other household wastewater, from sources such as effluent fromshower drains, sink drains, and washing machines (IPCC 2006). Equation 27 wasused to estimate CH4 emissions from domestic wastewater:
CH4emissions ¼X
i;j
ðUi � Ti;j � EFjÞ" #
TOW � Sð Þ�R ð27Þ
whereCH4 Emissions CH4 emissions in inventory year (kg CH4/year)TOW total organics in wastewater in inventory year (kg BOD/year)S organic component removed as sludge in inventory year (kg
BOD/year)
234 T. V. Ramachandra et al.
Ui fraction of population in income group i in inventory yearTi,j degree of utilization of treatment/discharge pathway or system,
j, for each income group fraction i in inventory yeari income group: rural, urban high income, and urban low incomej each treatment/discharge pathway or systemEFj emission factor (kg CH4/kg BOD)R amount of CH4 recovered in inventory year (kg CH4/year)
The emission factor (EFj) was calculated using Eq. 28:
EFj ¼ Bo� MCFj ð28Þ
whereEFj emission factor (kg CH4/kg BOD)j each treatment/discharge pathway or systemBo maximum CH4 producing capacity (kg CH4/kg BOD)MCFj methane correction factor (fraction)
The total amount of organically degradable material in the wastewater (TOW)is a function of human population and BOD generation per person. It is expressedin terms of biochemical oxygen demand (kg BOD/year), as given by Eq. 29:
TOW ¼ P � BOD � 0:001� I � 365 ð29Þ
whereTOW total organics in wastewater in inventory year (kg BOD/year)P country population in inventory year (person)BOD country-specific per capita BOD in inventory year (g/person/day)0.001 conversion from grams BOD to kg BODI correction factor for additional industrial BOD discharged into sewers
(the collected default is 1.25 and uncollected default is 1.00)
N2O emissions can occur as both direct and indirect emissions. Direct emis-sions are from the treatment plants, whereas indirect emissions are from waste-water after disposal of effluent into waterways, lakes, or the sea. Direct emissionsof N2O may be generated during both nitrification and denitrification of thenitrogen present (IPCC 2006). Equation 30 was used to estimate N2O emissionsfrom wastewater effluent:
N2O emissions ¼ Neffluent � EFeffluent � 44=28 ð30Þ
Sector-Wise Assessment of Carbon Footprint 235
whereN2O emissions N2O emissions in inventory year (kg N2O/year)N effluent nitrogen in the effluent discharged to aquatic environments (kg
N/year)EF effluent emission factor for N2O emissions from discharged to waste-
water (kg N2O–N/kg N)44/28 conversion of kg N2O–N into kg N2O
EF effluent of 0.005 kg N2O–N/kg N is used in this study (default value: IPCC2006).
Total nitrogen in the effluent was calculated by Eq. 31:
N effluent ¼ ðP� Protein� FNPR � FNON�CON � FIND�COMÞ�Nsludge ð31Þ
whereN effluent total annual amount of nitrogen in the wastewater effluent (kg N/
year)P human populationProtein annual per capita protein consumption (kg/person/year)F NPR fraction of nitrogen in protein (kg N/kg protein)F NON–CON factor for nonconsumed protein added to the wastewaterF IND–COM factor for industrial and commercial co-discharged protein into the
sewer systemN sludge nitrogen removed with sludge (kg N/year)
Per capita protein consumption (Pr) value is taken as 21.462 (Nutritional Intakein India 2009–2010). The fraction of nitrogen in protein (FNPR), fraction of non-consumption protein (FNON–CON), and fraction of industrial and commercial co-discharged protein (FIND–COM) values were taken as 0.16, 1.4 (fraction), and 1.25(fraction) kg N/kg protein, respectively (IPCC 2006).
Industrial wastewater may be treated onsite by the industries or can be dis-charged into domestic sewer systems. The emissions are included in domesticwastewater emissions if released into the sewer system. Methane is produced onlyfrom industrial wastewater with significant carbon loading that is treated underintended or unintended anaerobic conditions (IPCC 2006). Major industrialwastewater sources having high CH4 production potential are pulp and papermanufacture, meat and poultry industry, alcohol, beer and starch production,organic chemical production, and food and drink processing industries. In thisstudy, industrial wastewater emissions were calculated based on the data avail-ability from the industries located within the city limits. The method for estimationof CH4 emissions from onsite industrial wastewater treatment is given in Eq. 32:
236 T. V. Ramachandra et al.
CH4 emissions ¼X
i
TOWi� Sið Þ EFi�Ri ð32Þ
whereCH4 Emissions CH4 emissions in inventory year (kg CH4/year)TOWi total organically degradable material in wastewater from
industry i in inventory year (kg COD/year)i industrial sectorSi organic component removed as sludge in inventory year (kg
COD/year)EFi emission factor for industry i, kg CH4/kg COD for treatment/
discharge pathway or system(s) used in inventory year
If more than one treatment practice is used in an industry, then a weightedaverage is taken for this factor:Ri amount of CH4 recovered in inventory year, kg CH4/year
The emission factor (EFj) for each treatment/discharge pathway or system wascalculated using Eq. 33:
EFj ¼ Bo� MCFj ð33Þ
whereEFj emission factor for each treatment/discharge pathway or system (kg CH4/
kg COD)j each treatment/discharge pathway or systemBo maximum CH4 producing capacity (kg CH4/kg COD)MCFj methane correction factor (fraction)
The TOW is a function of industrial output (product) P (tons/year), wastewatergeneration W (m3/ton of product), and degradable organics concentration in thewastewater COD (kg COD/m3):
TOW ¼ P � BOD � 0:001� I � 365 ð34Þ
whereTOW total organically degradable material in wastewater for industry ‘i’ (kg
COD/year)i industrial sectorPi total industrial product for industrial sector i (t/year)Wi wastewater generated (m3/tproduct)CODi chemical oxygen demand (kg COD/m3)
Sector-Wise Assessment of Carbon Footprint 237
3 Results and Discussion
3.1 GHG Emissions from the Energy Sector
The major energy-related emissions considered under this sector are emissionsfrom electricity consumption and fugitive emissions. Emissions resulting fromconsumption of fossil fuels and electricity in domestic and industrial sections arerepresented independently under their respective sectors.
Electricity Consumption. The major sectors for which greenhouse gases areassessed under electricity consumption are consumption in domestic sector,commercial sector, industrial sector, and others (public lighting, advertisementhoardings, railways, public water works and sewerage systems, irrigation, andagriculture). Emissions resulting from electricity consumption in the domestic andindustrial sectors are attributed to the respective sector, along with the emissionsfrom fuel consumption and industrial processes. GHG emissions from electricityconsumption in the commercial sector and other sectors are represented in isola-tion for comparative analysis among the cities. Emissions resulting from auxiliarypower consumption in plants located within the city boundaries and from thesupply loss were also calculated in this study.
Figure 3 illustrates the emissions resulting from electricity consumption incommercial and other sectors, along with auxiliary consumption in power plantsand supply losses. During the year 2009–10, the commercial sector in Delhiconsumed 5339.63 MU of electricity, resulting in the release of 5428.55 Gg ofCO2 equivalent emissions. The emissions hold a share of 29.66 % of emissionswhen compared with emissions from commercial sector in other cities. Electricityconsumption in other subcategories (which includes Delhi International AirportLimited, Delhi Jal Board, Delhi Metro Rail Corporation, public lighting, railwaytraction, agriculture and mushroom cultivation, and worship/hospital) consumed2064.73 MU, resulting in the emission of 2099.11 Gg of CO2 equivalents, whichis responsible for 36.51 % of total emissions when compared with other cities.Auxiliary fuel consumption and supply losses resulted in 857.69 Gg of CO2
equivalent emissions, accounting for 27.07 % of total emissions from this sector.CO2 equivalent emissions from commercial, others, and auxiliary consumptionand supply losses along with their shares are summarized for all cities in Table 9.
Fugitive Emissions. The intentional or unintentional release of greenhousegases that occurs during the extraction, production, processing or transportation offossil fuels is known as fugitive emissions (IPCC 2006). In the present study,fugitive emissions occurring from refinery crude throughput activity were esti-mated for Greater Mumbai city. The CH4 emissions were found to be 0.0013 Ggfor the year 2009–10, which gives a converted value of 0.033 Gg of CO2
equivalents.
238 T. V. Ramachandra et al.
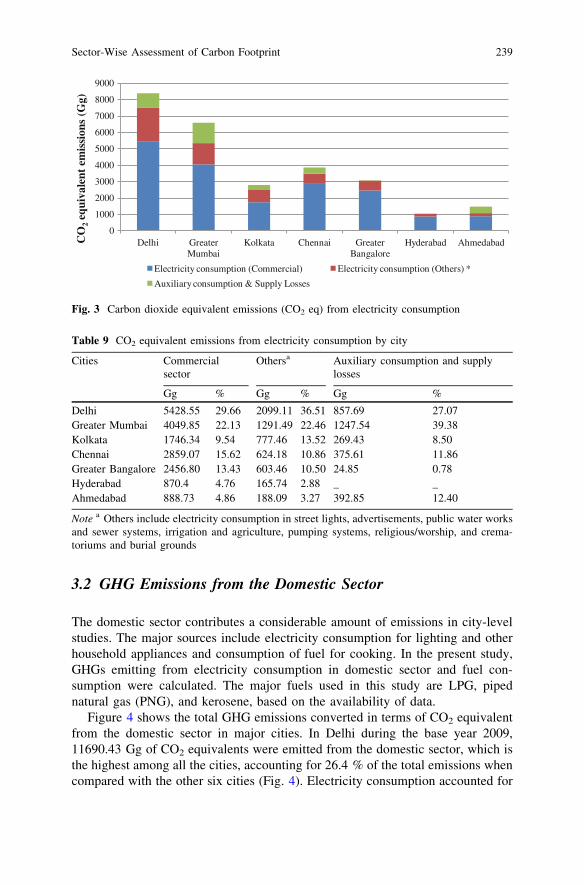
3.2 GHG Emissions from the Domestic Sector
The domestic sector contributes a considerable amount of emissions in city-levelstudies. The major sources include electricity consumption for lighting and otherhousehold appliances and consumption of fuel for cooking. In the present study,GHGs emitting from electricity consumption in domestic sector and fuel con-sumption were calculated. The major fuels used in this study are LPG, pipednatural gas (PNG), and kerosene, based on the availability of data.
Figure 4 shows the total GHG emissions converted in terms of CO2 equivalentfrom the domestic sector in major cities. In Delhi during the base year 2009,11690.43 Gg of CO2 equivalents were emitted from the domestic sector, which isthe highest among all the cities, accounting for 26.4 % of the total emissions whencompared with the other six cities (Fig. 4). Electricity consumption accounted for
0
1000
2000
3000
4000
5000
6000
7000
8000
9000
Delhi Greater Mumbai
Kolkata Chennai Greater Bangalore
Hyderabad AhmedabadCO
2eq
uiva
lent
em
issi
ons
(Gg)
Electricity consumption (Commercial) Electricity consumption (Others) *
Auxiliary consumption & Supply Losses
Fig. 3 Carbon dioxide equivalent emissions (CO2 eq) from electricity consumption
Table 9 CO2 equivalent emissions from electricity consumption by city
Cities Commercialsector
Othersa Auxiliary consumption and supplylosses
Gg % Gg % Gg %
Delhi 5428.55 29.66 2099.11 36.51 857.69 27.07Greater Mumbai 4049.85 22.13 1291.49 22.46 1247.54 39.38Kolkata 1746.34 9.54 777.46 13.52 269.43 8.50Chennai 2859.07 15.62 624.18 10.86 375.61 11.86Greater Bangalore 2456.80 13.43 603.46 10.50 24.85 0.78Hyderabad 870.4 4.76 165.74 2.88 _ _Ahmedabad 888.73 4.86 188.09 3.27 392.85 12.40
Note a Others include electricity consumption in street lights, advertisements, public water worksand sewer systems, irrigation and agriculture, pumping systems, religious/worship, and crema-toriums and burial grounds
Sector-Wise Assessment of Carbon Footprint 239
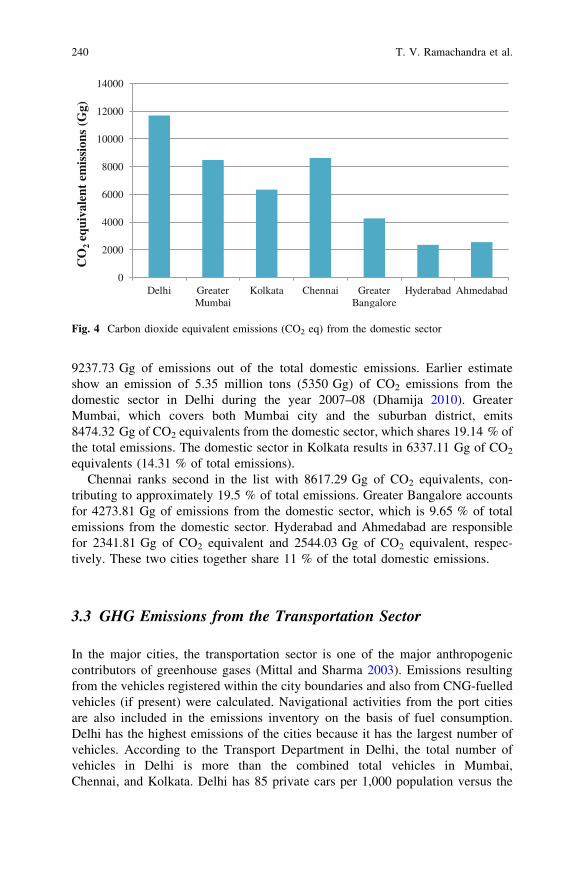
9237.73 Gg of emissions out of the total domestic emissions. Earlier estimateshow an emission of 5.35 million tons (5350 Gg) of CO2 emissions from thedomestic sector in Delhi during the year 2007–08 (Dhamija 2010). GreaterMumbai, which covers both Mumbai city and the suburban district, emits8474.32 Gg of CO2 equivalents from the domestic sector, which shares 19.14 % ofthe total emissions. The domestic sector in Kolkata results in 6337.11 Gg of CO2
equivalents (14.31 % of total emissions).Chennai ranks second in the list with 8617.29 Gg of CO2 equivalents, con-
tributing to approximately 19.5 % of total emissions. Greater Bangalore accountsfor 4273.81 Gg of emissions from the domestic sector, which is 9.65 % of totalemissions from the domestic sector. Hyderabad and Ahmedabad are responsiblefor 2341.81 Gg of CO2 equivalent and 2544.03 Gg of CO2 equivalent, respec-tively. These two cities together share 11 % of the total domestic emissions.
3.3 GHG Emissions from the Transportation Sector
In the major cities, the transportation sector is one of the major anthropogeniccontributors of greenhouse gases (Mittal and Sharma 2003). Emissions resultingfrom the vehicles registered within the city boundaries and also from CNG-fuelledvehicles (if present) were calculated. Navigational activities from the port citiesare also included in the emissions inventory on the basis of fuel consumption.Delhi has the highest emissions of the cities because it has the largest number ofvehicles. According to the Transport Department in Delhi, the total number ofvehicles in Delhi is more than the combined total vehicles in Mumbai,Chennai, and Kolkata. Delhi has 85 private cars per 1,000 population versus the
0
2000
4000
6000
8000
10000
12000
14000
Delhi Greater Mumbai
Kolkata Chennai Greater Bangalore
Hyderabad Ahmedabad
CO
2eq
uiva
lent
em
issi
ons
(Gg)
Fig. 4 Carbon dioxide equivalent emissions (CO2 eq) from the domestic sector
240 T. V. Ramachandra et al.
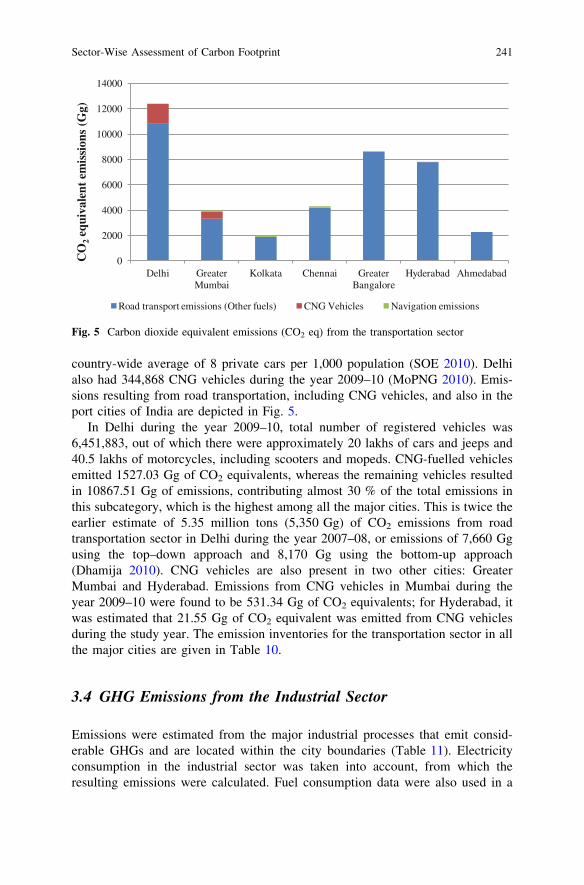
country-wide average of 8 private cars per 1,000 population (SOE 2010). Delhialso had 344,868 CNG vehicles during the year 2009–10 (MoPNG 2010). Emis-sions resulting from road transportation, including CNG vehicles, and also in theport cities of India are depicted in Fig. 5.
In Delhi during the year 2009–10, total number of registered vehicles was6,451,883, out of which there were approximately 20 lakhs of cars and jeeps and40.5 lakhs of motorcycles, including scooters and mopeds. CNG-fuelled vehiclesemitted 1527.03 Gg of CO2 equivalents, whereas the remaining vehicles resultedin 10867.51 Gg of emissions, contributing almost 30 % of the total emissions inthis subcategory, which is the highest among all the major cities. This is twice theearlier estimate of 5.35 million tons (5,350 Gg) of CO2 emissions from roadtransportation sector in Delhi during the year 2007–08, or emissions of 7,660 Ggusing the top–down approach and 8,170 Gg using the bottom-up approach(Dhamija 2010). CNG vehicles are also present in two other cities: GreaterMumbai and Hyderabad. Emissions from CNG vehicles in Mumbai during theyear 2009–10 were found to be 531.34 Gg of CO2 equivalents; for Hyderabad, itwas estimated that 21.55 Gg of CO2 equivalent was emitted from CNG vehiclesduring the study year. The emission inventories for the transportation sector in allthe major cities are given in Table 10.
3.4 GHG Emissions from the Industrial Sector
Emissions were estimated from the major industrial processes that emit consid-erable GHGs and are located within the city boundaries (Table 11). Electricityconsumption in the industrial sector was taken into account, from which theresulting emissions were calculated. Fuel consumption data were also used in a
0
2000
4000
6000
8000
10000
12000
14000
Delhi Greater Mumbai
Kolkata Chennai Greater Bangalore
Hyderabad Ahmedabad
CO
2eq
uiva
lent
em
issi
ons
(Gg)
Road transport emissions (Other fuels) CNG Vehicles Navigation emissions
Fig. 5 Carbon dioxide equivalent emissions (CO2 eq) from the transportation sector
Sector-Wise Assessment of Carbon Footprint 241
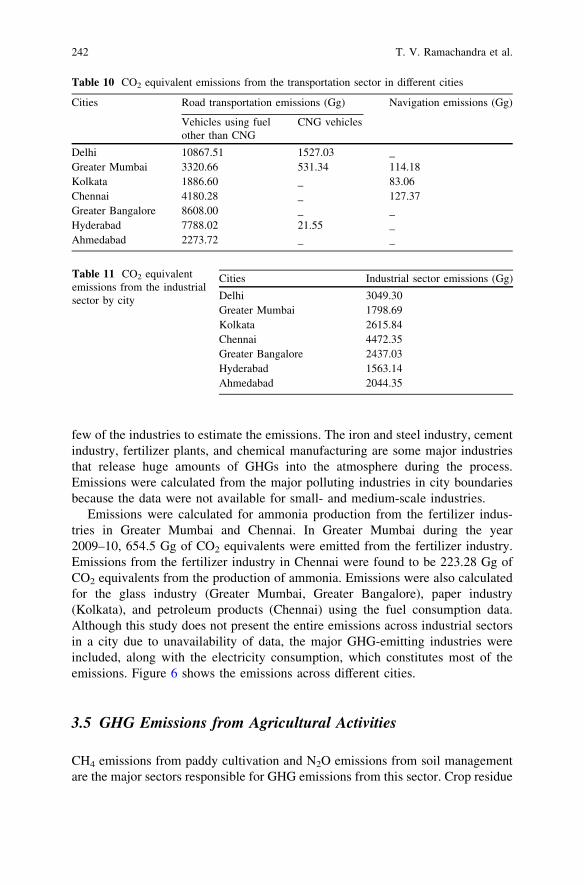
few of the industries to estimate the emissions. The iron and steel industry, cementindustry, fertilizer plants, and chemical manufacturing are some major industriesthat release huge amounts of GHGs into the atmosphere during the process.Emissions were calculated from the major polluting industries in city boundariesbecause the data were not available for small- and medium-scale industries.
Emissions were calculated for ammonia production from the fertilizer indus-tries in Greater Mumbai and Chennai. In Greater Mumbai during the year2009–10, 654.5 Gg of CO2 equivalents were emitted from the fertilizer industry.Emissions from the fertilizer industry in Chennai were found to be 223.28 Gg ofCO2 equivalents from the production of ammonia. Emissions were also calculatedfor the glass industry (Greater Mumbai, Greater Bangalore), paper industry(Kolkata), and petroleum products (Chennai) using the fuel consumption data.Although this study does not present the entire emissions across industrial sectorsin a city due to unavailability of data, the major GHG-emitting industries wereincluded, along with the electricity consumption, which constitutes most of theemissions. Figure 6 shows the emissions across different cities.
3.5 GHG Emissions from Agricultural Activities
CH4 emissions from paddy cultivation and N2O emissions from soil managementare the major sectors responsible for GHG emissions from this sector. Crop residue
Table 10 CO2 equivalent emissions from the transportation sector in different cities
Cities Road transportation emissions (Gg) Navigation emissions (Gg)
Vehicles using fuelother than CNG
CNG vehicles
Delhi 10867.51 1527.03 _Greater Mumbai 3320.66 531.34 114.18Kolkata 1886.60 _ 83.06Chennai 4180.28 _ 127.37Greater Bangalore 8608.00 _ _Hyderabad 7788.02 21.55 _Ahmedabad 2273.72 _ _
Table 11 CO2 equivalentemissions from the industrialsector by city
Cities Industrial sector emissions (Gg)
Delhi 3049.30Greater Mumbai 1798.69Kolkata 2615.84Chennai 4472.35Greater Bangalore 2437.03Hyderabad 1563.14Ahmedabad 2044.35
242 T. V. Ramachandra et al.
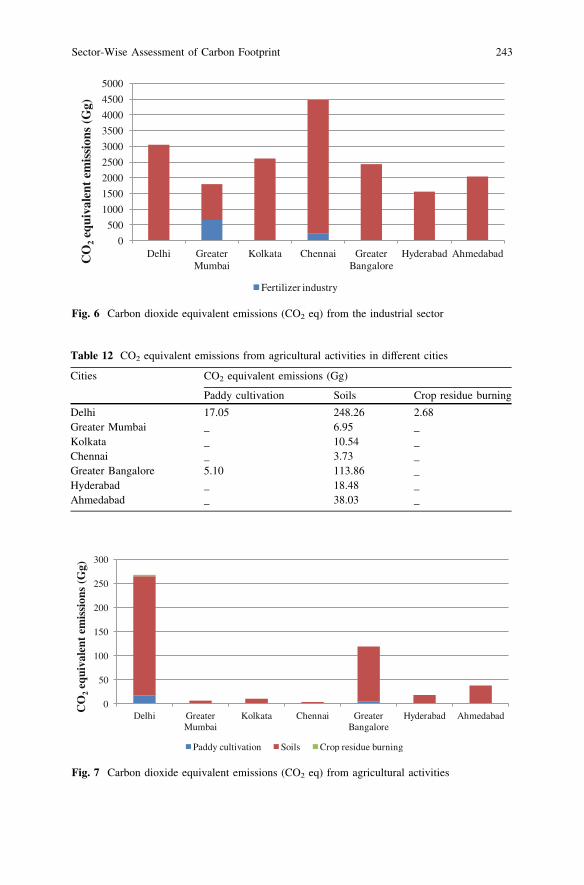
0
500
1000
1500
2000
2500
3000
3500
4000
4500
5000
Delhi Greater Mumbai
Kolkata Chennai Greater Bangalore
Hyderabad AhmedabadCO
2eq
uiva
lent
em
issi
ons
(Gg)
Fertilizer industry
Fig. 6 Carbon dioxide equivalent emissions (CO2 eq) from the industrial sector
Table 12 CO2 equivalent emissions from agricultural activities in different cities
Cities CO2 equivalent emissions (Gg)
Paddy cultivation Soils Crop residue burning
Delhi 17.05 248.26 2.68Greater Mumbai _ 6.95 _Kolkata _ 10.54 _Chennai _ 3.73 _Greater Bangalore 5.10 113.86 _Hyderabad _ 18.48 _Ahmedabad _ 38.03 _
0
50
100
150
200
250
300
Delhi Greater Mumbai
Kolkata Chennai Greater Bangalore
Hyderabad Ahmedabad
CO
2eq
uiva
lent
em
issi
ons
(Gg)
Paddy cultivation Soils Crop residue burning
Fig. 7 Carbon dioxide equivalent emissions (CO2 eq) from agricultural activities
Sector-Wise Assessment of Carbon Footprint 243
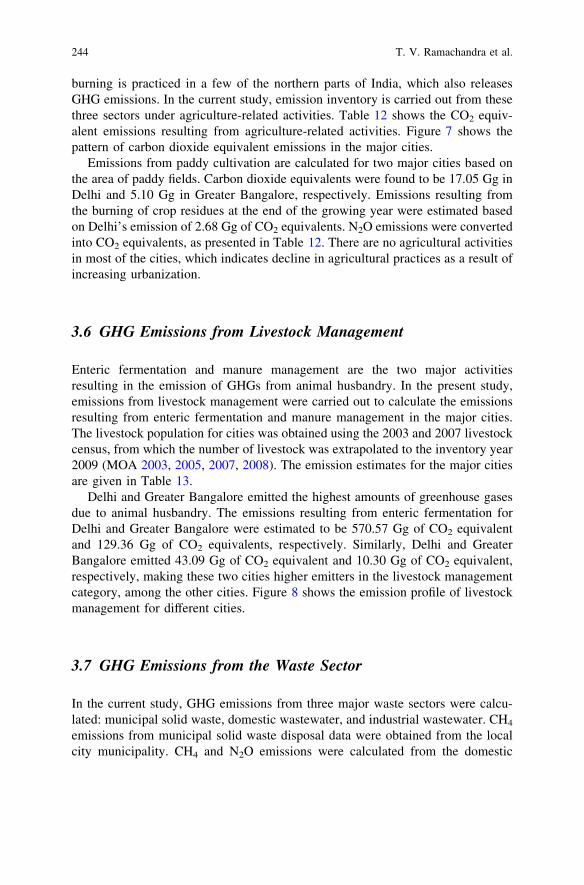
burning is practiced in a few of the northern parts of India, which also releasesGHG emissions. In the current study, emission inventory is carried out from thesethree sectors under agriculture-related activities. Table 12 shows the CO2 equiv-alent emissions resulting from agriculture-related activities. Figure 7 shows thepattern of carbon dioxide equivalent emissions in the major cities.
Emissions from paddy cultivation are calculated for two major cities based onthe area of paddy fields. Carbon dioxide equivalents were found to be 17.05 Gg inDelhi and 5.10 Gg in Greater Bangalore, respectively. Emissions resulting fromthe burning of crop residues at the end of the growing year were estimated basedon Delhi’s emission of 2.68 Gg of CO2 equivalents. N2O emissions were convertedinto CO2 equivalents, as presented in Table 12. There are no agricultural activitiesin most of the cities, which indicates decline in agricultural practices as a result ofincreasing urbanization.
3.6 GHG Emissions from Livestock Management
Enteric fermentation and manure management are the two major activitiesresulting in the emission of GHGs from animal husbandry. In the present study,emissions from livestock management were carried out to calculate the emissionsresulting from enteric fermentation and manure management in the major cities.The livestock population for cities was obtained using the 2003 and 2007 livestockcensus, from which the number of livestock was extrapolated to the inventory year2009 (MOA 2003, 2005, 2007, 2008). The emission estimates for the major citiesare given in Table 13.
Delhi and Greater Bangalore emitted the highest amounts of greenhouse gasesdue to animal husbandry. The emissions resulting from enteric fermentation forDelhi and Greater Bangalore were estimated to be 570.57 Gg of CO2 equivalentand 129.36 Gg of CO2 equivalents, respectively. Similarly, Delhi and GreaterBangalore emitted 43.09 Gg of CO2 equivalent and 10.30 Gg of CO2 equivalent,respectively, making these two cities higher emitters in the livestock managementcategory, among the other cities. Figure 8 shows the emission profile of livestockmanagement for different cities.
3.7 GHG Emissions from the Waste Sector
In the current study, GHG emissions from three major waste sectors were calcu-lated: municipal solid waste, domestic wastewater, and industrial wastewater. CH4
emissions from municipal solid waste disposal data were obtained from the localcity municipality. CH4 and N2O emissions were calculated from the domestic
244 T. V. Ramachandra et al.
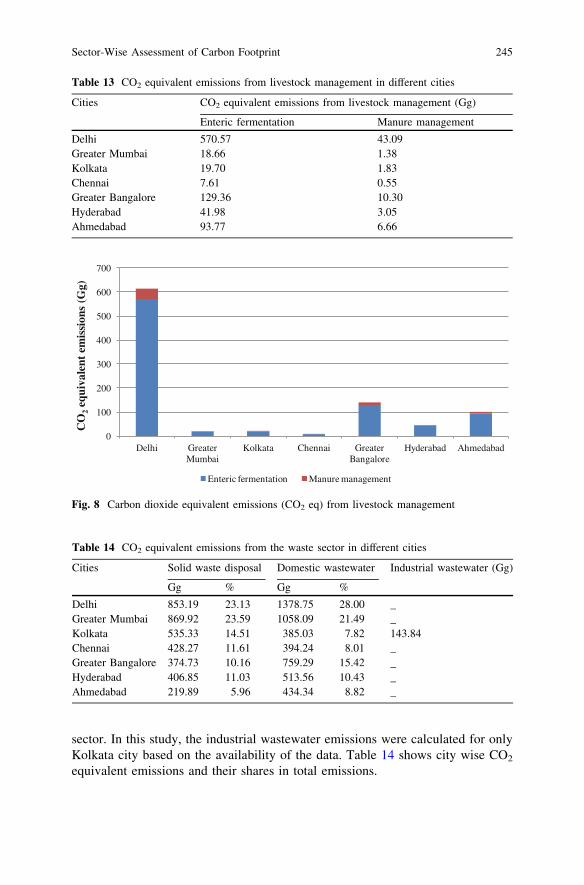
sector. In this study, the industrial wastewater emissions were calculated for onlyKolkata city based on the availability of the data. Table 14 shows city wise CO2
equivalent emissions and their shares in total emissions.
Table 13 CO2 equivalent emissions from livestock management in different cities
Cities CO2 equivalent emissions from livestock management (Gg)
Enteric fermentation Manure management
Delhi 570.57 43.09Greater Mumbai 18.66 1.38Kolkata 19.70 1.83Chennai 7.61 0.55Greater Bangalore 129.36 10.30Hyderabad 41.98 3.05Ahmedabad 93.77 6.66
0
100
200
300
400
500
600
700
Delhi Greater Mumbai
Kolkata Chennai Greater Bangalore
Hyderabad Ahmedabad
CO
2eq
uiva
lent
em
issi
ons
(Gg)
Enteric fermentation Manure management
Fig. 8 Carbon dioxide equivalent emissions (CO2 eq) from livestock management
Table 14 CO2 equivalent emissions from the waste sector in different cities
Cities Solid waste disposal Domestic wastewater Industrial wastewater (Gg)
Gg % Gg %
Delhi 853.19 23.13 1378.75 28.00 _Greater Mumbai 869.92 23.59 1058.09 21.49 _Kolkata 535.33 14.51 385.03 7.82 143.84Chennai 428.27 11.61 394.24 8.01 _Greater Bangalore 374.73 10.16 759.29 15.42 _Hyderabad 406.85 11.03 513.56 10.43 _Ahmedabad 219.89 5.96 434.34 8.82 _
Sector-Wise Assessment of Carbon Footprint 245
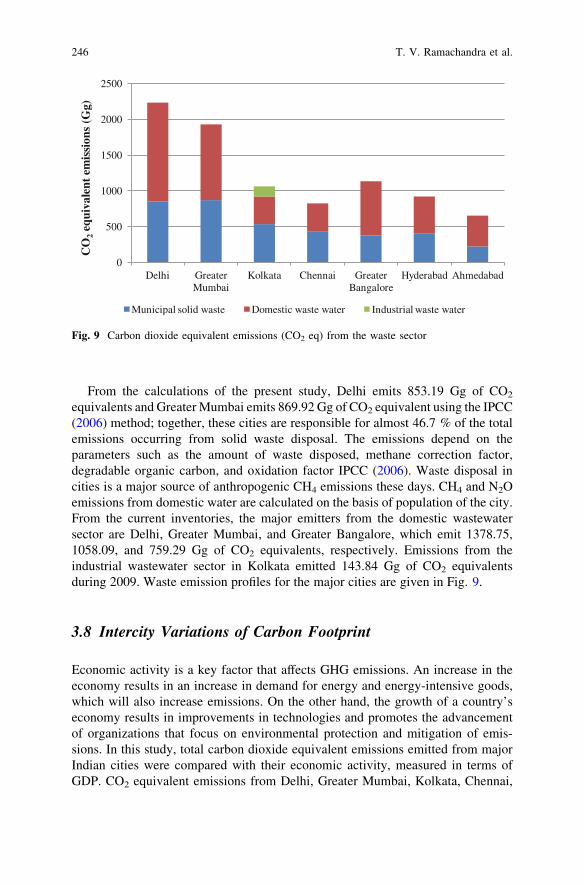
From the calculations of the present study, Delhi emits 853.19 Gg of CO2
equivalents and Greater Mumbai emits 869.92 Gg of CO2 equivalent using the IPCC(2006) method; together, these cities are responsible for almost 46.7 % of the totalemissions occurring from solid waste disposal. The emissions depend on theparameters such as the amount of waste disposed, methane correction factor,degradable organic carbon, and oxidation factor IPCC (2006). Waste disposal incities is a major source of anthropogenic CH4 emissions these days. CH4 and N2Oemissions from domestic water are calculated on the basis of population of the city.From the current inventories, the major emitters from the domestic wastewatersector are Delhi, Greater Mumbai, and Greater Bangalore, which emit 1378.75,1058.09, and 759.29 Gg of CO2 equivalents, respectively. Emissions from theindustrial wastewater sector in Kolkata emitted 143.84 Gg of CO2 equivalentsduring 2009. Waste emission profiles for the major cities are given in Fig. 9.
3.8 Intercity Variations of Carbon Footprint
Economic activity is a key factor that affects GHG emissions. An increase in theeconomy results in an increase in demand for energy and energy-intensive goods,which will also increase emissions. On the other hand, the growth of a country’seconomy results in improvements in technologies and promotes the advancementof organizations that focus on environmental protection and mitigation of emis-sions. In this study, total carbon dioxide equivalent emissions emitted from majorIndian cities were compared with their economic activity, measured in terms ofGDP. CO2 equivalent emissions from Delhi, Greater Mumbai, Kolkata, Chennai,
0
500
1000
1500
2000
2500
Delhi Greater Mumbai
Kolkata Chennai Greater Bangalore
Hyderabad Ahmedabad
CO
2eq
uiva
lent
em
issi
ons
(Gg)
Municipal solid waste Domestic waste water Industrial waste water
Fig. 9 Carbon dioxide equivalent emissions (CO2 eq) from the waste sector
246 T. V. Ramachandra et al.
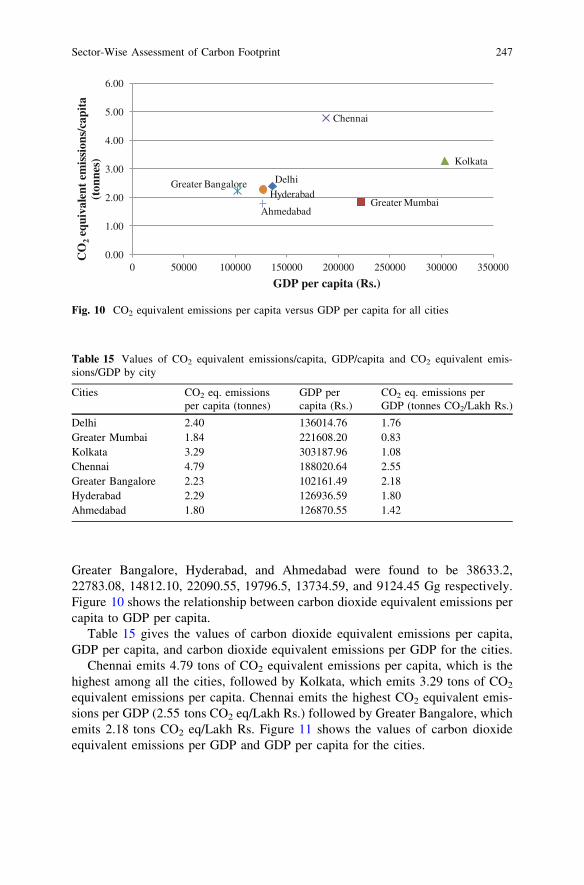
Greater Bangalore, Hyderabad, and Ahmedabad were found to be 38633.2,22783.08, 14812.10, 22090.55, 19796.5, 13734.59, and 9124.45 Gg respectively.Figure 10 shows the relationship between carbon dioxide equivalent emissions percapita to GDP per capita.
Table 15 gives the values of carbon dioxide equivalent emissions per capita,GDP per capita, and carbon dioxide equivalent emissions per GDP for the cities.
Chennai emits 4.79 tons of CO2 equivalent emissions per capita, which is thehighest among all the cities, followed by Kolkata, which emits 3.29 tons of CO2
equivalent emissions per capita. Chennai emits the highest CO2 equivalent emis-sions per GDP (2.55 tons CO2 eq/Lakh Rs.) followed by Greater Bangalore, whichemits 2.18 tons CO2 eq/Lakh Rs. Figure 11 shows the values of carbon dioxideequivalent emissions per GDP and GDP per capita for the cities.
Delhi
Greater Mumbai
Kolkata
Chennai
Greater BangaloreHyderabad
Ahmedabad
0.00
1.00
2.00
3.00
4.00
5.00
6.00
0 50000 100000 150000 200000 250000 300000 350000
CO
2eq
uiva
lent
em
issi
ons/
capi
ta
(ton
nes)
GDP per capita (Rs.)
Fig. 10 CO2 equivalent emissions per capita versus GDP per capita for all cities
Table 15 Values of CO2 equivalent emissions/capita, GDP/capita and CO2 equivalent emis-sions/GDP by city
Cities CO2 eq. emissionsper capita (tonnes)
GDP percapita (Rs.)
CO2 eq. emissions perGDP (tonnes CO2/Lakh Rs.)
Delhi 2.40 136014.76 1.76Greater Mumbai 1.84 221608.20 0.83Kolkata 3.29 303187.96 1.08Chennai 4.79 188020.64 2.55Greater Bangalore 2.23 102161.49 2.18Hyderabad 2.29 126936.59 1.80Ahmedabad 1.80 126870.55 1.42
Sector-Wise Assessment of Carbon Footprint 247
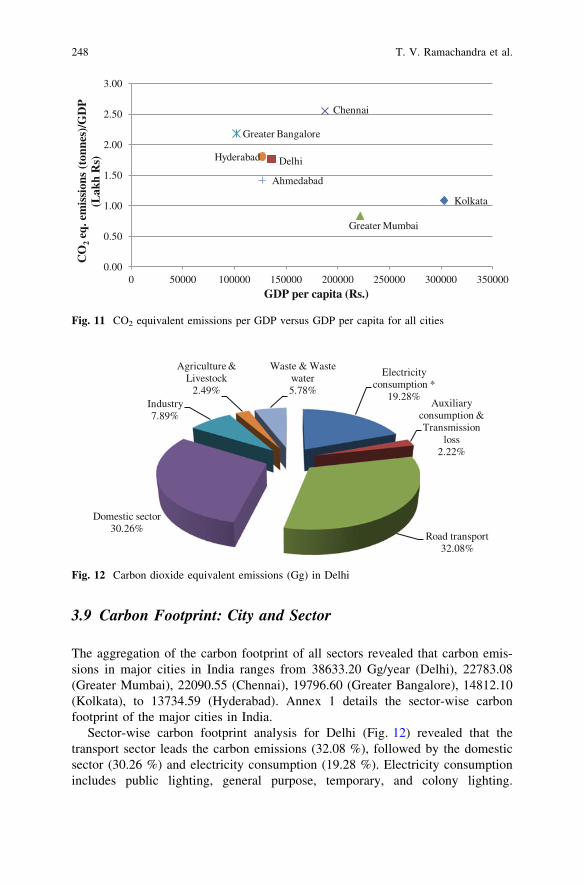
3.9 Carbon Footprint: City and Sector
The aggregation of the carbon footprint of all sectors revealed that carbon emis-sions in major cities in India ranges from 38633.20 Gg/year (Delhi), 22783.08(Greater Mumbai), 22090.55 (Chennai), 19796.60 (Greater Bangalore), 14812.10(Kolkata), to 13734.59 (Hyderabad). Annex 1 details the sector-wise carbonfootprint of the major cities in India.
Sector-wise carbon footprint analysis for Delhi (Fig. 12) revealed that thetransport sector leads the carbon emissions (32.08 %), followed by the domesticsector (30.26 %) and electricity consumption (19.28 %). Electricity consumptionincludes public lighting, general purpose, temporary, and colony lighting.
Delhi
Greater Mumbai
Kolkata
Chennai
Greater Bangalore
Hyderabad
Ahmedabad
0.00
0.50
1.00
1.50
2.00
2.50
3.00
0 50000 100000 150000 200000 250000 300000 350000
CO
2eq
. em
issi
ons
(ton
nes)
/GD
P (L
akh
Rs)
GDP per capita (Rs.)
Fig. 11 CO2 equivalent emissions per GDP versus GDP per capita for all cities
Electricity consumption *
19.28%Auxiliary
consumption & Transmission
loss2.22%
Road transport 32.08%
Domestic sector 30.26%
Industry7.89%
Agriculture & Livestock
2.49%
Waste & Waste water5.78%
Fig. 12 Carbon dioxide equivalent emissions (Gg) in Delhi
248 T. V. Ramachandra et al.
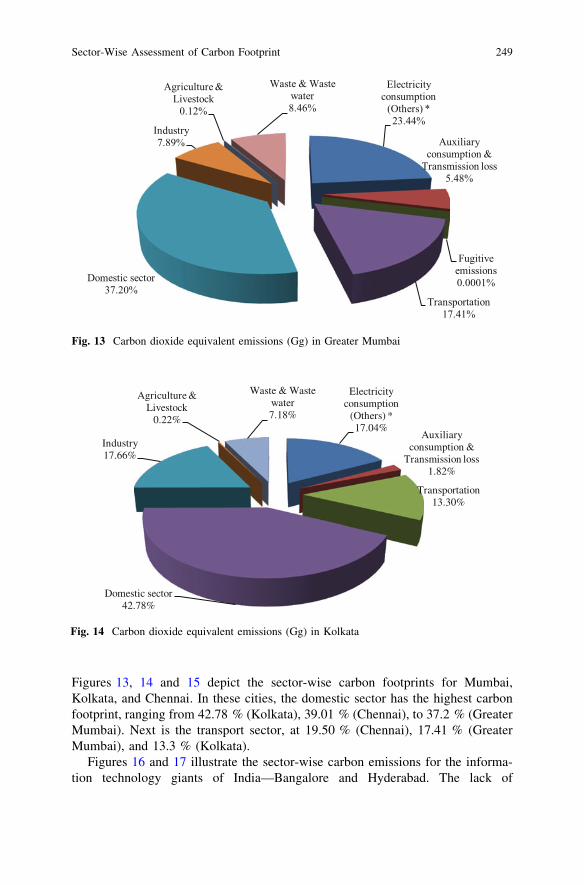
Figures 13, 14 and 15 depict the sector-wise carbon footprints for Mumbai,Kolkata, and Chennai. In these cities, the domestic sector has the highest carbonfootprint, ranging from 42.78 % (Kolkata), 39.01 % (Chennai), to 37.2 % (GreaterMumbai). Next is the transport sector, at 19.50 % (Chennai), 17.41 % (GreaterMumbai), and 13.3 % (Kolkata).
Figures 16 and 17 illustrate the sector-wise carbon emissions for the informa-tion technology giants of India—Bangalore and Hyderabad. The lack of
Electricity consumption
(Others) * 23.44%
Auxiliary consumption &
Transmission loss5.48%
Fugitive emissions0.0001%
Transportation17.41%
Domestic sector 37.20%
Industry7.89%
Agriculture & Livestock
0.12%
Waste & Waste water8.46%
Fig. 13 Carbon dioxide equivalent emissions (Gg) in Greater Mumbai
Electricity consumption
(Others) * 17.04%
Auxiliary consumption &
Transmission loss1.82%
Transportation13.30%
Domestic sector 42.78%
Industry17.66%
Agriculture & Livestock
0.22%
Waste & Waste water7.18%
Fig. 14 Carbon dioxide equivalent emissions (Gg) in Kolkata
Sector-Wise Assessment of Carbon Footprint 249
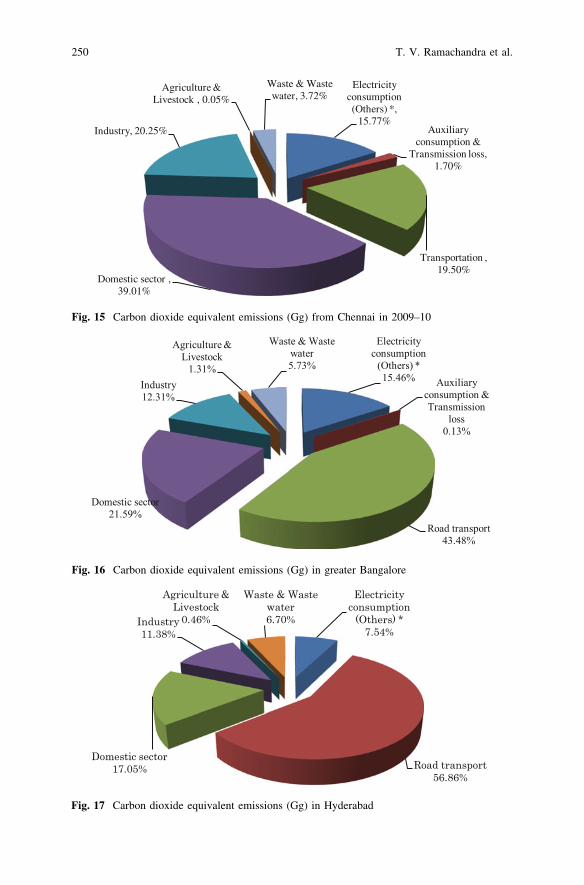
Electricity consumption
(Others) * 15.46% Auxiliary
consumption & Transmission
loss0.13%
Road transport 43.48%
Domestic sector 21.59%
Industry12.31%
Agriculture & Livestock
1.31%
Waste & Waste water5.73%
Fig. 16 Carbon dioxide equivalent emissions (Gg) in greater Bangalore
Electricity consumption (Others) *,
15.77%Auxiliary
consumption & Transmission loss,
1.70%
Transportation , 19.50%
Domestic sector , 39.01%
Industry, 20.25%
Agriculture & Livestock , 0.05%
Waste & Waste water, 3.72%
Fig. 15 Carbon dioxide equivalent emissions (Gg) from Chennai in 2009–10
Electricity consumption
(Others) * 7.54%
Road transport 56.86%
Domestic sector 17.05%
Industry 11.38%
Agriculture & Livestock
0.46%
Waste & Waste water 6.70%
Fig. 17 Carbon dioxide equivalent emissions (Gg) in Hyderabad
250 T. V. Ramachandra et al.
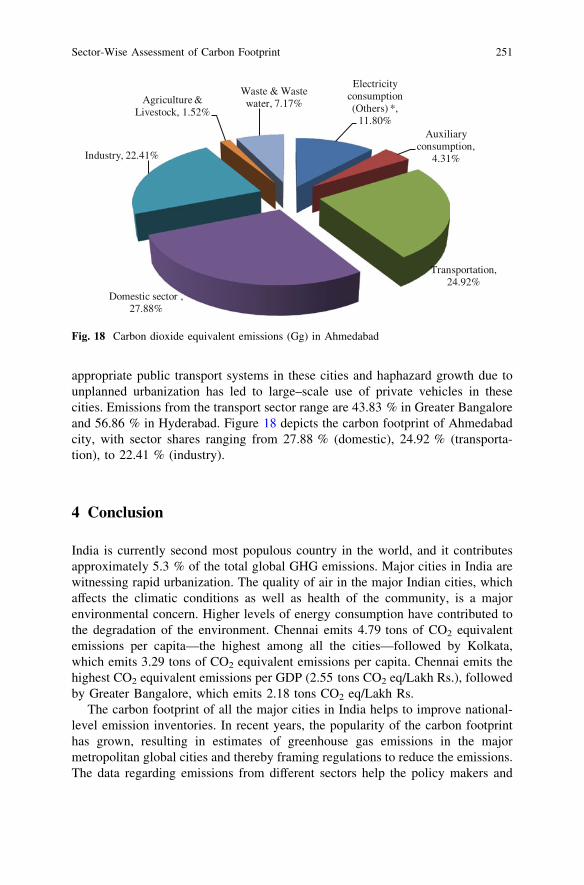
appropriate public transport systems in these cities and haphazard growth due tounplanned urbanization has led to large–scale use of private vehicles in thesecities. Emissions from the transport sector range are 43.83 % in Greater Bangaloreand 56.86 % in Hyderabad. Figure 18 depicts the carbon footprint of Ahmedabadcity, with sector shares ranging from 27.88 % (domestic), 24.92 % (transporta-tion), to 22.41 % (industry).
4 Conclusion
India is currently second most populous country in the world, and it contributesapproximately 5.3 % of the total global GHG emissions. Major cities in India arewitnessing rapid urbanization. The quality of air in the major Indian cities, whichaffects the climatic conditions as well as health of the community, is a majorenvironmental concern. Higher levels of energy consumption have contributed tothe degradation of the environment. Chennai emits 4.79 tons of CO2 equivalentemissions per capita—the highest among all the cities—followed by Kolkata,which emits 3.29 tons of CO2 equivalent emissions per capita. Chennai emits thehighest CO2 equivalent emissions per GDP (2.55 tons CO2 eq/Lakh Rs.), followedby Greater Bangalore, which emits 2.18 tons CO2 eq/Lakh Rs.
The carbon footprint of all the major cities in India helps to improve national-level emission inventories. In recent years, the popularity of the carbon footprinthas grown, resulting in estimates of greenhouse gas emissions in the majormetropolitan global cities and thereby framing regulations to reduce the emissions.The data regarding emissions from different sectors help the policy makers and
Electricity consumption (Others) *,
11.80%Auxiliary
consumption, 4.31%
Transportation, 24.92%
Domestic sector , 27.88%
Industry, 22.41%
Agriculture & Livestock, 1.52%
Waste & Waste water, 7.17%
Fig. 18 Carbon dioxide equivalent emissions (Gg) in Ahmedabad
Sector-Wise Assessment of Carbon Footprint 251
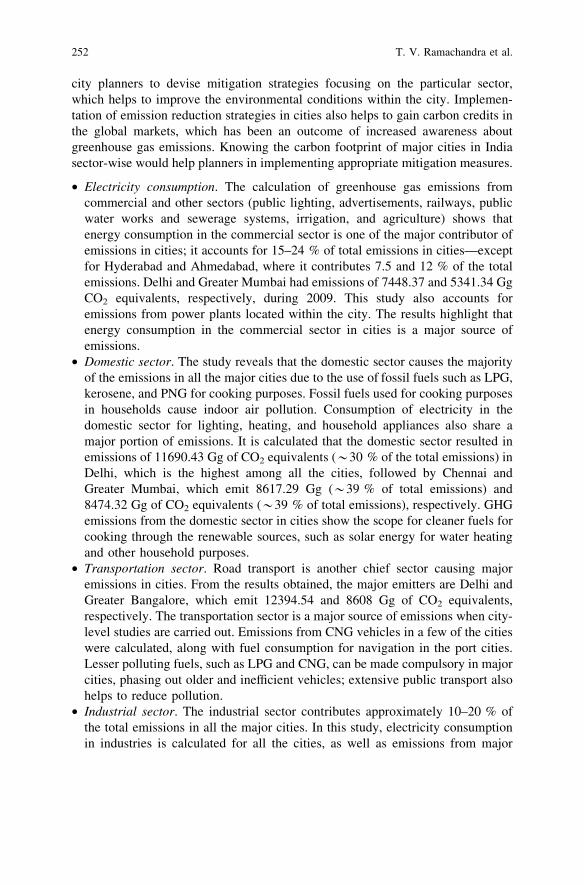
city planners to devise mitigation strategies focusing on the particular sector,which helps to improve the environmental conditions within the city. Implemen-tation of emission reduction strategies in cities also helps to gain carbon credits inthe global markets, which has been an outcome of increased awareness aboutgreenhouse gas emissions. Knowing the carbon footprint of major cities in Indiasector-wise would help planners in implementing appropriate mitigation measures.
• Electricity consumption. The calculation of greenhouse gas emissions fromcommercial and other sectors (public lighting, advertisements, railways, publicwater works and sewerage systems, irrigation, and agriculture) shows thatenergy consumption in the commercial sector is one of the major contributor ofemissions in cities; it accounts for 15–24 % of total emissions in cities—exceptfor Hyderabad and Ahmedabad, where it contributes 7.5 and 12 % of the totalemissions. Delhi and Greater Mumbai had emissions of 7448.37 and 5341.34 GgCO2 equivalents, respectively, during 2009. This study also accounts foremissions from power plants located within the city. The results highlight thatenergy consumption in the commercial sector in cities is a major source ofemissions.
• Domestic sector. The study reveals that the domestic sector causes the majorityof the emissions in all the major cities due to the use of fossil fuels such as LPG,kerosene, and PNG for cooking purposes. Fossil fuels used for cooking purposesin households cause indoor air pollution. Consumption of electricity in thedomestic sector for lighting, heating, and household appliances also share amajor portion of emissions. It is calculated that the domestic sector resulted inemissions of 11690.43 Gg of CO2 equivalents (*30 % of the total emissions) inDelhi, which is the highest among all the cities, followed by Chennai andGreater Mumbai, which emit 8617.29 Gg (*39 % of total emissions) and8474.32 Gg of CO2 equivalents (*39 % of total emissions), respectively. GHGemissions from the domestic sector in cities show the scope for cleaner fuels forcooking through the renewable sources, such as solar energy for water heatingand other household purposes.
• Transportation sector. Road transport is another chief sector causing majoremissions in cities. From the results obtained, the major emitters are Delhi andGreater Bangalore, which emit 12394.54 and 8608 Gg of CO2 equivalents,respectively. The transportation sector is a major source of emissions when city-level studies are carried out. Emissions from CNG vehicles in a few of the citieswere calculated, along with fuel consumption for navigation in the port cities.Lesser polluting fuels, such as LPG and CNG, can be made compulsory in majorcities, phasing out older and inefficient vehicles; extensive public transport alsohelps to reduce pollution.
• Industrial sector. The industrial sector contributes approximately 10–20 % ofthe total emissions in all the major cities. In this study, electricity consumptionin industries is calculated for all the cities, as well as emissions from major
252 T. V. Ramachandra et al.
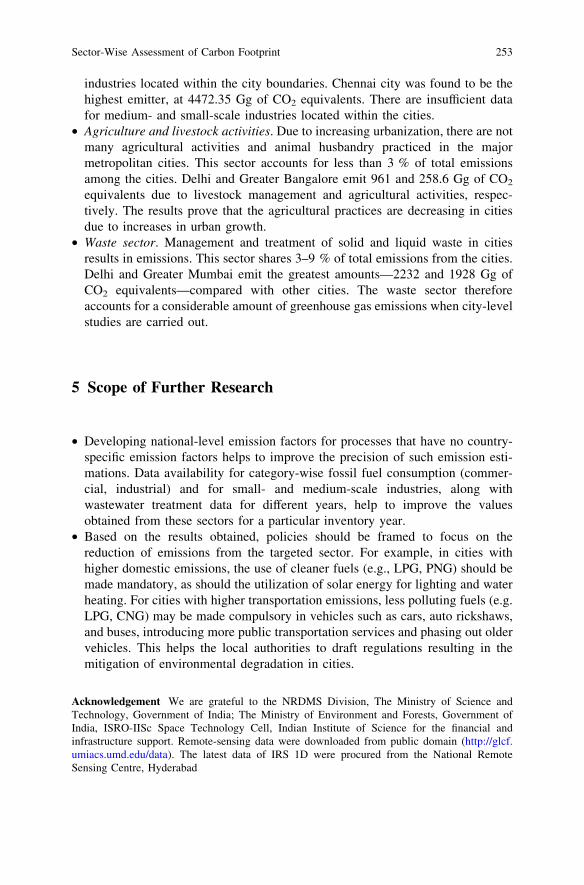
industries located within the city boundaries. Chennai city was found to be thehighest emitter, at 4472.35 Gg of CO2 equivalents. There are insufficient datafor medium- and small-scale industries located within the cities.
• Agriculture and livestock activities. Due to increasing urbanization, there are notmany agricultural activities and animal husbandry practiced in the majormetropolitan cities. This sector accounts for less than 3 % of total emissionsamong the cities. Delhi and Greater Bangalore emit 961 and 258.6 Gg of CO2
equivalents due to livestock management and agricultural activities, respec-tively. The results prove that the agricultural practices are decreasing in citiesdue to increases in urban growth.
• Waste sector. Management and treatment of solid and liquid waste in citiesresults in emissions. This sector shares 3–9 % of total emissions from the cities.Delhi and Greater Mumbai emit the greatest amounts—2232 and 1928 Gg ofCO2 equivalents—compared with other cities. The waste sector thereforeaccounts for a considerable amount of greenhouse gas emissions when city-levelstudies are carried out.
5 Scope of Further Research
• Developing national-level emission factors for processes that have no country-specific emission factors helps to improve the precision of such emission esti-mations. Data availability for category-wise fossil fuel consumption (commer-cial, industrial) and for small- and medium-scale industries, along withwastewater treatment data for different years, help to improve the valuesobtained from these sectors for a particular inventory year.
• Based on the results obtained, policies should be framed to focus on thereduction of emissions from the targeted sector. For example, in cities withhigher domestic emissions, the use of cleaner fuels (e.g., LPG, PNG) should bemade mandatory, as should the utilization of solar energy for lighting and waterheating. For cities with higher transportation emissions, less polluting fuels (e.g.LPG, CNG) may be made compulsory in vehicles such as cars, auto rickshaws,and buses, introducing more public transportation services and phasing out oldervehicles. This helps the local authorities to draft regulations resulting in themitigation of environmental degradation in cities.
Acknowledgement We are grateful to the NRDMS Division, The Ministry of Science andTechnology, Government of India; The Ministry of Environment and Forests, Government ofIndia, ISRO-IISc Space Technology Cell, Indian Institute of Science for the financial andinfrastructure support. Remote-sensing data were downloaded from public domain (http://glcf.umiacs.umd.edu/data). The latest data of IRS 1D were procured from the National RemoteSensing Centre, Hyderabad
Sector-Wise Assessment of Carbon Footprint 253
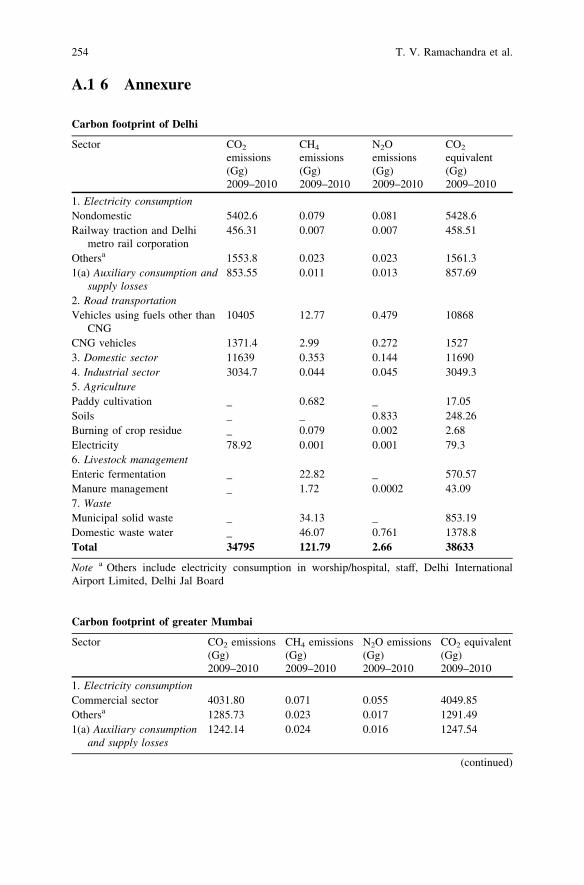
A.1 6 Annexure
Carbon footprint of Delhi
Sector CO2
emissions(Gg)
CH4
emissions(Gg)
N2Oemissions(Gg)
CO2
equivalent(Gg)
2009–2010 2009–2010 2009–2010 2009–2010
1. Electricity consumptionNondomestic 5402.6 0.079 0.081 5428.6Railway traction and Delhi
metro rail corporation456.31 0.007 0.007 458.51
Othersa 1553.8 0.023 0.023 1561.31(a) Auxiliary consumption and
supply losses853.55 0.011 0.013 857.69
2. Road transportationVehicles using fuels other than
CNG10405 12.77 0.479 10868
CNG vehicles 1371.4 2.99 0.272 15273. Domestic sector 11639 0.353 0.144 116904. Industrial sector 3034.7 0.044 0.045 3049.35. AgriculturePaddy cultivation _ 0.682 _ 17.05Soils _ _ 0.833 248.26Burning of crop residue _ 0.079 0.002 2.68Electricity 78.92 0.001 0.001 79.36. Livestock managementEnteric fermentation _ 22.82 _ 570.57Manure management _ 1.72 0.0002 43.097. WasteMunicipal solid waste _ 34.13 _ 853.19Domestic waste water _ 46.07 0.761 1378.8Total 34795 121.79 2.66 38633
Note a Others include electricity consumption in worship/hospital, staff, Delhi InternationalAirport Limited, Delhi Jal Board
Carbon footprint of greater Mumbai
Sector CO2 emissions(Gg)
CH4 emissions(Gg)
N2O emissions(Gg)
CO2 equivalent(Gg)
2009–2010 2009–2010 2009–2010 2009–2010
1. Electricity consumptionCommercial sector 4031.80 0.071 0.055 4049.85Othersa 1285.73 0.023 0.017 1291.491(a) Auxiliary consumption
and supply losses1242.14 0.024 0.016 1247.54
(continued)
254 T. V. Ramachandra et al.
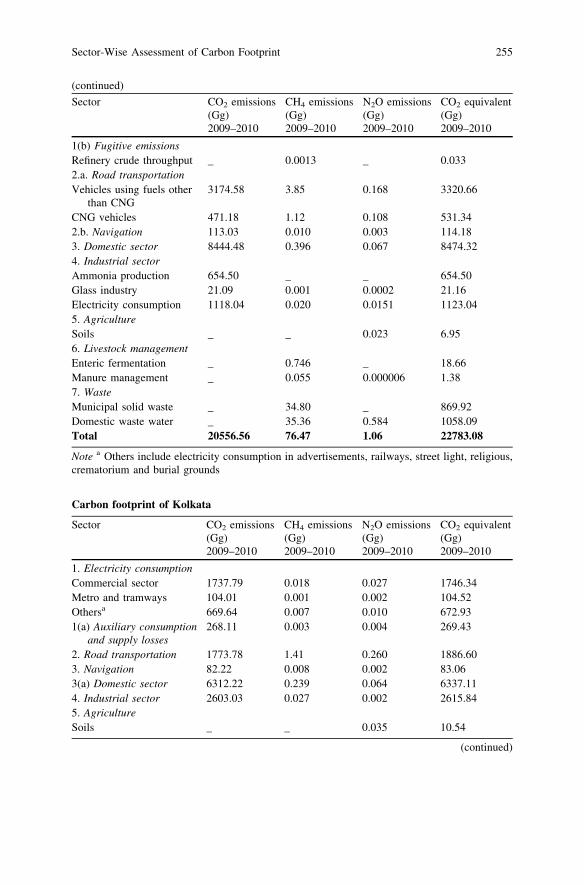
(continued)
Sector CO2 emissions(Gg)
CH4 emissions(Gg)
N2O emissions(Gg)
CO2 equivalent(Gg)
2009–2010 2009–2010 2009–2010 2009–2010
1(b) Fugitive emissionsRefinery crude throughput _ 0.0013 _ 0.0332.a. Road transportationVehicles using fuels other
than CNG3174.58 3.85 0.168 3320.66
CNG vehicles 471.18 1.12 0.108 531.342.b. Navigation 113.03 0.010 0.003 114.183. Domestic sector 8444.48 0.396 0.067 8474.324. Industrial sectorAmmonia production 654.50 _ _ 654.50Glass industry 21.09 0.001 0.0002 21.16Electricity consumption 1118.04 0.020 0.0151 1123.045. AgricultureSoils _ _ 0.023 6.956. Livestock managementEnteric fermentation _ 0.746 _ 18.66Manure management _ 0.055 0.000006 1.387. WasteMunicipal solid waste _ 34.80 _ 869.92Domestic waste water _ 35.36 0.584 1058.09Total 20556.56 76.47 1.06 22783.08
Note a Others include electricity consumption in advertisements, railways, street light, religious,crematorium and burial grounds
Carbon footprint of Kolkata
Sector CO2 emissions(Gg)
CH4 emissions(Gg)
N2O emissions(Gg)
CO2 equivalent(Gg)
2009–2010 2009–2010 2009–2010 2009–2010
1. Electricity consumptionCommercial sector 1737.79 0.018 0.027 1746.34Metro and tramways 104.01 0.001 0.002 104.52Othersa 669.64 0.007 0.010 672.931(a) Auxiliary consumption
and supply losses268.11 0.003 0.004 269.43
2. Road transportation 1773.78 1.41 0.260 1886.603. Navigation 82.22 0.008 0.002 83.063(a) Domestic sector 6312.22 0.239 0.064 6337.114. Industrial sector 2603.03 0.027 0.002 2615.845. AgricultureSoils _ _ 0.035 10.54
(continued)
Sector-Wise Assessment of Carbon Footprint 255
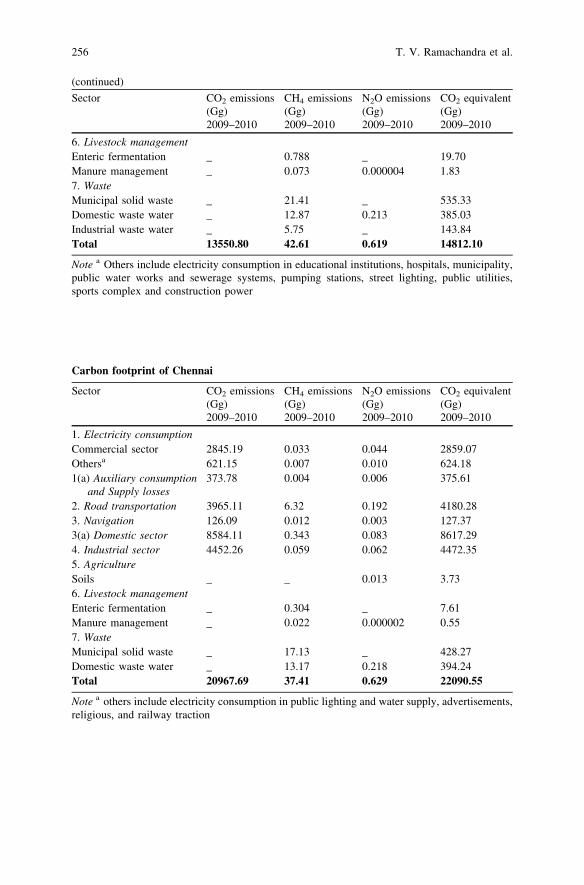
(continued)
Sector CO2 emissions(Gg)
CH4 emissions(Gg)
N2O emissions(Gg)
CO2 equivalent(Gg)
2009–2010 2009–2010 2009–2010 2009–2010
6. Livestock managementEnteric fermentation _ 0.788 _ 19.70Manure management _ 0.073 0.000004 1.837. WasteMunicipal solid waste _ 21.41 _ 535.33Domestic waste water _ 12.87 0.213 385.03Industrial waste water _ 5.75 _ 143.84Total 13550.80 42.61 0.619 14812.10
Note a Others include electricity consumption in educational institutions, hospitals, municipality,public water works and sewerage systems, pumping stations, street lighting, public utilities,sports complex and construction power
Carbon footprint of Chennai
Sector CO2 emissions(Gg)
CH4 emissions(Gg)
N2O emissions(Gg)
CO2 equivalent(Gg)
2009–2010 2009–2010 2009–2010 2009–2010
1. Electricity consumptionCommercial sector 2845.19 0.033 0.044 2859.07Othersa 621.15 0.007 0.010 624.181(a) Auxiliary consumption
and Supply losses373.78 0.004 0.006 375.61
2. Road transportation 3965.11 6.32 0.192 4180.283. Navigation 126.09 0.012 0.003 127.373(a) Domestic sector 8584.11 0.343 0.083 8617.294. Industrial sector 4452.26 0.059 0.062 4472.355. AgricultureSoils _ _ 0.013 3.736. Livestock managementEnteric fermentation _ 0.304 _ 7.61Manure management _ 0.022 0.000002 0.557. WasteMunicipal solid waste _ 17.13 _ 428.27Domestic waste water _ 13.17 0.218 394.24Total 20967.69 37.41 0.629 22090.55
Note a others include electricity consumption in public lighting and water supply, advertisements,religious, and railway traction
256 T. V. Ramachandra et al.
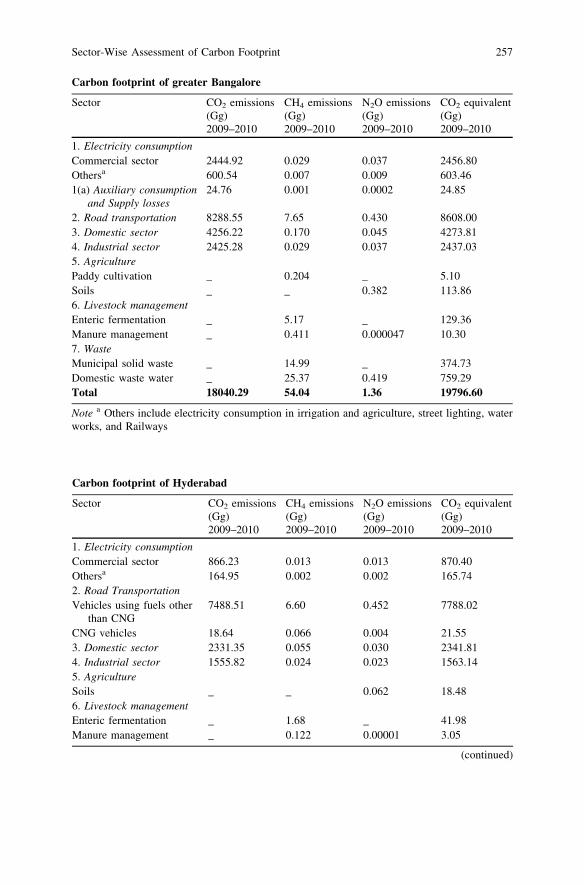
Carbon footprint of greater Bangalore
Sector CO2 emissions(Gg)
CH4 emissions(Gg)
N2O emissions(Gg)
CO2 equivalent(Gg)
2009–2010 2009–2010 2009–2010 2009–2010
1. Electricity consumptionCommercial sector 2444.92 0.029 0.037 2456.80Othersa 600.54 0.007 0.009 603.461(a) Auxiliary consumption
and Supply losses24.76 0.001 0.0002 24.85
2. Road transportation 8288.55 7.65 0.430 8608.003. Domestic sector 4256.22 0.170 0.045 4273.814. Industrial sector 2425.28 0.029 0.037 2437.035. AgriculturePaddy cultivation _ 0.204 _ 5.10Soils _ _ 0.382 113.866. Livestock managementEnteric fermentation _ 5.17 _ 129.36Manure management _ 0.411 0.000047 10.307. WasteMunicipal solid waste _ 14.99 _ 374.73Domestic waste water _ 25.37 0.419 759.29Total 18040.29 54.04 1.36 19796.60
Note a Others include electricity consumption in irrigation and agriculture, street lighting, waterworks, and Railways
Carbon footprint of Hyderabad
Sector CO2 emissions(Gg)
CH4 emissions(Gg)
N2O emissions(Gg)
CO2 equivalent(Gg)
2009–2010 2009–2010 2009–2010 2009–2010
1. Electricity consumptionCommercial sector 866.23 0.013 0.013 870.40Othersa 164.95 0.002 0.002 165.742. Road TransportationVehicles using fuels other
than CNG7488.51 6.60 0.452 7788.02
CNG vehicles 18.64 0.066 0.004 21.553. Domestic sector 2331.35 0.055 0.030 2341.814. Industrial sector 1555.82 0.024 0.023 1563.145. AgricultureSoils _ _ 0.062 18.486. Livestock managementEnteric fermentation _ 1.68 _ 41.98Manure management _ 0.122 0.00001 3.05
(continued)
Sector-Wise Assessment of Carbon Footprint 257
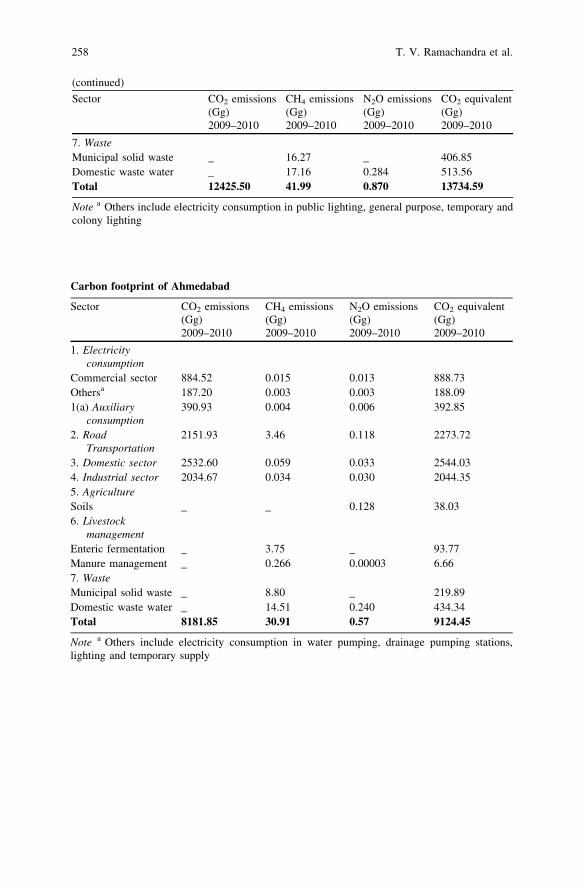
(continued)
Sector CO2 emissions(Gg)
CH4 emissions(Gg)
N2O emissions(Gg)
CO2 equivalent(Gg)
2009–2010 2009–2010 2009–2010 2009–2010
7. WasteMunicipal solid waste _ 16.27 _ 406.85Domestic waste water _ 17.16 0.284 513.56Total 12425.50 41.99 0.870 13734.59
Note a Others include electricity consumption in public lighting, general purpose, temporary andcolony lighting
Carbon footprint of Ahmedabad
Sector CO2 emissions(Gg)
CH4 emissions(Gg)
N2O emissions(Gg)
CO2 equivalent(Gg)
2009–2010 2009–2010 2009–2010 2009–2010
1. Electricityconsumption
Commercial sector 884.52 0.015 0.013 888.73Othersa 187.20 0.003 0.003 188.091(a) Auxiliary
consumption390.93 0.004 0.006 392.85
2. RoadTransportation
2151.93 3.46 0.118 2273.72
3. Domestic sector 2532.60 0.059 0.033 2544.034. Industrial sector 2034.67 0.034 0.030 2044.355. AgricultureSoils _ _ 0.128 38.036. Livestock
managementEnteric fermentation _ 3.75 _ 93.77Manure management _ 0.266 0.00003 6.667. WasteMunicipal solid waste _ 8.80 _ 219.89Domestic waste water _ 14.51 0.240 434.34Total 8181.85 30.91 0.57 9124.45
Note a Others include electricity consumption in water pumping, drainage pumping stations,lighting and temporary supply
258 T. V. Ramachandra et al.
References
ADB (2006) Energy efficiency and climate change considerations for on-road transport in Asia.Asian Development Bank, Manila
Adhya TK, Rath AK, Gupta PK, Rao VR, Das SN, Parida KM, Parashar DC, Sethunathan N(1994) Methane emission from flooded rice fields under irrigated conditions, Biol Fertil Soils18:245–248
Aggarwal PK, Pathak H, Bhatia A, Kumar S (2003) Final report on inventory of nitrous oxideemission from agricultural soils, submitted by Winrock International India on behalf ofMinistry of Environment and Forest, Government of India
Alexander M (1961) Introduction to soil microbiology. Wiley, New York, pp 227–244ALGAS (1998) Asia least cost greenhouse gas abatement strategy project, country case study
India. Asian Development Bank, ManilaAndrew JE (2008) What is carbon footprint? An overview of definitions and methodologies. In:
Vegetable Industry carbon footprint study – discussion papers and workshop, 26 Sept 2008.Horticulture Australia Limited, Sydney
Anjali S, Devotta S (2007) Indoor air quality of public places in Mumbai India in terms of volatileorganic compounds. Environ Monit Assess 133:127–138
ARAI (2007). Emission factor development for Indian vehicles—as a part of ambient air qualitymonitoring and emission source apportionment studies. Automotive Research Association ofIndia, Project No. AFL/2006-07/IOCL/EmissionFactor Project/Final Rep., Pune
Baidya S, Borken Kleefeld J (2009) Atmospheric emissions from road transportation in India.Energy Policy 37(2009):3812–3822
Balachandran S, Meena BR, Khillare PS (2000) Particle size distribution and its elementalcomposition in the ambient air of Delhi. Environ Int 26(1–2):49–54
Bandyopadhyay TK, Goyal P, Singh MP (1996) Generation of methane from paddy fields andcattle in India and its reduction at source. Atmos Environ 30(14):2569–2574
Basic Port Statistics of India (2009–10) Transport research wing, Ministry of Shipping,Government of India, 2011
Battle M (1996) Atmospheric gas concentrations over the past century measured in air from firnat South Pole. Nature 383:231–235
Benjamin KS, Marilyn AB (2009) Twelve metropolitan carbon footprints: a preliminarycomparative global assessment. Energy Policy 38:4856–4869 (2010)
Berner W, Oeschger H, Stauffer B (1980) Information on the CO2 cycle from ice core studies.Radiocarbon 22:227–235
Bernstein L, Roy J, Delhotal KC, Harnisch J, Matsuhashi R, Price L, Tanaka K, Worrell E,Yamba F, Fengqi Z (2007) Industry. In: Metz B, Davidson OR, Bosch PR, Dave R, Meyer LA(eds) Climate change 2007: mitigation. Contribution of working group III to the fourthassessment report of the intergovernmental panel on climate change. Cambridge UniversityPress, Cambridge
Bhatia A, Pathak H, Aggarwal PK (2004) Inventory of methane and nitrous oxide emissions fromagriculture soils of India and their global warming potential. Curr Sci 87(3):317–324
Bhatia P (2008) Methodologies for measuring the carbon footprint, June 2008, ICTS and climatechange, international symposium, London
Bhatia A, Pathak H, Aggarwal PK (2008) Inventory of methane and nitrous oxide emissions fromagricultural soils of India and their global warming potential. Curr Sci 87(3):317–324
Bhattacharya S, Mitra AP (1998) Greenhouse gas emissions in India for year 1990, centre onglobal change. National Physical Laboratory, New Delhi
Blake DR et al (1982) Global increase in atmospheric methane concentrations between 1978 and1980. Geophys Res Lett 9:477–480
Bouwman AF (1990) Exchange of greenhouse gases between terrestrial ecosystems and theatmosphere. In: Bouman AF (ed) Soils and the greenhouse effect. Wiley, New York,pp 61–127
Sector-Wise Assessment of Carbon Footprint 259
Bronson KF, Neue HU, Singh U, Abao EB Jr (1997) Automated chamber measurements ofmethane and nitrous oxide flux in a flooded rice soil: I. Residue, nitrogen and watermanagement. Soil Sci Soc Am J 61:981–987
BSI (2008) Publicly available specification 2050. Specification for the assessment of the lifecycle greenhouse gas emissions of goods and services, British Standards Institute
Butler JH, Battle M, Bender ML, Montzka SA, Clark AD, Saltzman ES, Sucher CM,Severinghaus JP, Elkins JW (1999) A record of atmospheric halocarbons during the twentiethcentury from polar firn air. Nature 399:749–755
Carbon Trust (2007a) Carbon footprint measurement methodology, version 1.1. The CarbonTrust, London http://www.carbontrust.co.uk. Accessed 27 Feb 2007
Carbon Trust (2007b) Carbon footprinting. An introduction for organizations. Available online athttp://www.carbontrust.co.uk/publications/publicationdetail.htm?productid=CTV033. Acces-sed 5 May 2008
Census of India (2001). Houses, household amenities and assets: India, States and UnionTerritories—2001 census, Office of the Registrar General, Census of India, Government ofIndia, New Delhi www.censusindia.net/2001housing/housing_tables_main.html
Census of India (2011) Cities having population 1 lakh and above, Census. http://censusinida.gov.in
Chakraborty N, Sarkar GM, Lahiri SC (2000) Methane emission from rice paddy soils,aerotolerance of methanogens and global thermal warming. Environmentalist 20:343–350
Chakraborty N, Mukherjee I, Santra AK, Chowdhury S, Chakraborty S, Bhattacharya S, MitraAP, Sharma C (2007) Measurement of CO2, CO, SO2 and NO emissions from coal basedthermal power plants in India. Atmos Environ 42(6):1073–1082 (February 2008)
Chattopadhyay S, Gupta A, Ray S (2009) Municipal solid waste management in Kolkata, India.Waste Manage 29(4):1449–1458
Chelani AB, Devotta Sukumar (2007) Air quality assessment in Delhi: before and after CNG asfuel. Environ Monit Assess 125:257–263
Chun M, Mei-ting J, Xiao-chun Z, Hong-yuan L (2011) Energy consumption and carbonemissions in a coastal city in China, Procedia Environ Sci 4:1–9
Cook E (1971) The flow of energy in an industrial society. Energy and power; a scientificAmerican book. W. H. Freeman and Co. San Francisco, pp 83–91
Courchene TJ, Allan JR (2008) Climate change: the case of carbon tariff/tax. Policy Options3:59–64
CPCB (2007) Transport fuel quality for year 2005. Central Pollution Control Board, Governmentof India, New Delhi
Das Anjana, Jyoti Parikh (2004) Transport scenarios in two metropolitan cities in India: Delhiand Mumbai. Energy Convers Manage 45(15–16):2603–2625
Delmas RJ, Ascencio JM, Legrand M (1980) Polar ice evidence that atmospheric CO2 20,000 yrBP was 50 % of present. Nature 284:155–157
Dhakal Shobhakar (2009) Urban energy use and carbon emissions from cities in China and policyimplications. Energy Policy 37(11):4208–4219
Dhamija (2010) Executive summary of inventorization of greenhouse gases—sources and sinksin Delhi, climate change agenda for Delhi 2009–12, Government of Delhi
Dlugokencky EJ, Masarie KA, Lang PM, Tans PP (1998) Continuing decline in the growth rate ofthe atmospheric methane burden. Nature 393:447–450
EEA (2009) EMEP/EEA Air pollutant emission inventory guidebook. European EnvironmentAgency, Copenhagen
EPA (2010) Methane and nitrous oxide emissions from natural sources. United StatesEnvironmental Protection Agency
Etheridge DM (1996) Natural and anthropogenic changes in atmospheric CO2 over the last1000 years from air in Antarctic ice and firn. J Geophys Res 101:4115–4128
Fadel MEI, Massoud M (2001) Methane emissions from wastewater management. Environ Pollut114(2):177–185
260 T. V. Ramachandra et al.
Fan Y, Liu L-C, Wu G, Tsai H-T, Wei Y-M (2007) Changes in carbon intensity in China:empirical findings from 1980–2003. Ecol Econ 62(3–4):683-691
Ferry JG (1992) Biochemistry of methanogenesis. CRC CRic Rev Biochem Mol Biol 27:473–503Fraser PJ, Khalil MAK, Rasmussen RA, Crawford AJ (1981) Trends of atmospheric methane in
the southern hemisphere. Geophys Res Lett 8:1063–1066Garg A, Shukla PR (2002) Emission inventory of India. Tata McGraw Hill, New Delhi, pp 84–89Garg A, Sumana B, Shukla PR, Dadhwal VK (2001) Regional and sectoral assessment of
greenhouse gas emissions in India. Atmos Environ 35:2679–2695Garg A, Shukla PR, Manmohan K, Deepa M (2004) Indian methane and nitrous oxide emissions
and mitigation flexibility. Atmos Environ 38:1965–1977Garg A, Shukla PR, Manmohan K (2006) The sectoral trends of multi gas emissions inventory of
India. Atmos Environ 40:4608–4620Garg A, Bhushan K, Shukla PR (2011) Methane emissions in India: Sub regional and sectoral
trends. Atmos Environ 45(28):4922–4929Gaur AC, Neelkantan S, Dargan KS (1984) Organic manures, 2nd edn. Indian Council of
Agricultural Research, New DelhiGhose Mrinal K, Paul R, Banerjee SK (2004) Assessment of the impacts of vehicular emissions
on urban air quality and its management in Indian context: the case of Kolkata. Environ SciPolicy 7(4):345–351
Ghosh S, Majumdar D, Jain MC (2003) Methane and nitrous oxide emissions from an irrigatedrice of North India. Chemosphere 51(3):181–195
Global Footprint Network (2007), Ecological footprint: overview, global footprint network,http://www.footprintnetwork.org/gfn_sub.php?content=footprint_overview
Goldemberg J (1995) Energy needs in developing countries and sustainability. Science269:1058–1059
Goyal P, Rama Krishna TV (1998) Various methods of emission estimation of vehicular traffic inDelhi. Transp Res Part D 3:309–317
Graedel TE, McRae JE (1980) On the possible increase of atmospheric methane and carbonmonoxide concentrations during the last decade. Geophys Res Lett 7:977–979
Granli T, Bockman OC (1994) Nitrous oxide from agriculture. Norw J Agric Sci 12:128Gupta R (2005) Oxford climate change action plan. Oxford city council environment scrutiny
committeeGupta AK, Subhankar N, Mukhopadhyay UK (2006) Characterisation of PM10, PM2.5 and
benzene soluble organic fraction of particulate matter in an urban area of Kolkata, India.Environ Monit Assess 115:205–222
Gupta PK, Arvind KJ, Koul S, Sharma P, Pradhan V, Vandana G, Sharma C, Nahar S (2007)Methane and nitrous oxide emission from bovine manure management practices in India,Environ Pollut 146(1):219–224
Gupta PK, Gupta V, Sharma C, Das SN, Purkait N, Adhya TK, Pathake H, Ramesh R, BaruahKK, Venkatratnam L, Gulab Singh CSP Iyer (2009) Development of methane emissionfactors for Indian paddy fields and estimation of national methane budget. Chemosphere74(4):590–598
Gurjar BR, van Aardenne JA, Lelieveld J, Mohan M (2004) Emission estimates and trends(1990–2000) for megacity Delhi and implications. Atmos Environ 38(33):5663–5681
Gurjar BR, Nagpure AS, Prashant K, Nalin S (2010) Pollutant emissions from road vehicles inmega-city Kolkata, India: past and present trends. J Air Pollut Control 10(2):18–30
Hammond G (2007) Time to give due weight to the ‘carbon footprint’ issue. Nature445(7125):256
Harnisch J, Eisenhauer A (1998) Natural CF4 and SF6 on Earth. Geophys Res Lett 25:2401–2404Hasselmann K (1993) Optimal fingerprints for the detection of time dependent climate change.
J Clim 6:1957-1971Hawksworth J Hoehn T, Tiwari A (eds) (2009) Pricewaterhouse coopers UK economic outlookHingane LS, Rupa Kumar K, Ramana Murthy BV (1985) Long-term trends of surface air
temperature in India. Int J Climatol 5:521–528
Sector-Wise Assessment of Carbon Footprint 261
Hoornweg D, Sugar L, Gomez CLT (2011) Cities and greenhouse gas emissions: movingforward. Environ Urbanization 23:207–227
Houghton JT, Callander BA, Varney SK (eds) (1992) Climate change 1992, the supplementaryreport to the ipcc scientific assessment, intergovernmental panel on climate change.Cambridge University Press, Cambridge
HRA (2008) House Rent Allowance, Sixth Central Pay Commission, Ministry of Finance,Government of India
http://unfccc.int/ghg_data/items/3825.php Global warming potentials: Climate change 1995, thescience of climate change: summary for policymakers. Technical Summary of the workinggroup I report, p 22, 1995. (http://unfccc.int/ghg_data/items/3825.php)
http://www.iso.org/iso/iso_catalogue/catalogue_tc/catalogue_detail.htm?csnumber=38382.Accessed 5 Dec 2012
http://www.iso.org/iso/catalogue_detail?csnumber=38381. Accessed 9 Dec 2012Humphrey CR, Buttel FR (1984) Environment energy and society. Wadsworth Publishers,
BelmontINCCA (2010) India: Greenhouse Gas Emissions (2007). Indian Network for Climate Change
Assessment (INCCA), The Ministry of Environment and Forests, Government of IndiaIndermuhle A (1999) Holocene carbon-cycle dynamics based on CO2 trapped in ice at Taylor
Dome Antarctica. Nature 398:121–126IPCC (1996) Report of the twelfth season of the Intergovernmental Panel on Climate Change,
Mexico City, 11–13 Sept 1996IPCC (1997) Revised 1996 IPCC guidelines for national greenhouse gas inventories. In:
Houghton JT, Meira Filho LG, Lim B, Treanton K, Mamaty I, Bonduki Y (eds)IPCC (1998) Principles governing IPCC work. Approved at the fourteenth session, Vienna (1–3
October 1998)IPCC (2000). Good practice guidance and uncertainty management in national greenhouse gas
inventories. In: Penman J, Kruger D, Galbally I, Hiraishi T, Nyenzi B, Emmanul S, BuendiaL, Hoppaus R, Martinsen T, Meijer J, Miwa K Tanabe K (eds) Published for the IPCC by theInstitute for Global Environmental Strategies, Japan. ISBN 4-88788-000-6
IPCC (2001a) Climate change 2001: the scientific basis. contribution of working group I to thethird assessment report of the intergovernmental panel on climate change. In: Houghton JT,Ding Y, Griggs DJ, Noguer M, van der Linden PJ, Dai X, Maskell K, Johnson CA (eds)Cambridge University Press, Cambridge, p 881
IPCC (2001b) Climate change 2001: the scientific basis. Contribution of working group I to thethird assessment report of the intergovernmental panel on climate change In: Houghton JTet al (eds) Cambridge University Press, Cambridge p 881
IPCC (2003) Good practice guidance for land use, land-use change and forestry. In: Jim P,Michael G, Taka H, Thelma K, Dina K, Riitta P, Leandro B, Kyoko M, Todd N, Kiyoto T,Fabian W (eds) Institute for Global Environmental Strategies (IGES) for the IPCC ISBN 4-88788-003-7
IPCC (2006) IPCC guidelines for national greenhouse gas inventories, prepared by the nationalgreenhouse gas inventories programme. In: Eggleston HS, Buendia L, Miwa K, Ngara T,Tanabe K (eds) IGES, Japan
IPCC (2007a) Climate change 2007: synthesis report. contribution of working groups I, II and IIIto the fourth assessment report of the intergovernmental panel on climate change. In: CoreWriting Team: Pachauri RK, Reisinger A (eds) IPCC, Geneva, p 104
IPCC (2007b) Contribution of working group III to the fourth assessment report of theintergovernment panel on climate change. Mertz B, Davidson OR, Bosch PR, Dave R, MeyerLA (eds) Climate change 2007: mitigation. Cambridge University Press, Cambridge
ISO (2006a) ISO 14064-1:2006. Greenhouse gases part 1: specification with guidance at theorganization level for quantification and reporting of greenhouse gas emissions and removals
ISO (2006b) ISO 14064-2:2006. Greenhouse gases part 2: specification with guidance at theproject level for quantification, monitoring and reporting of greenhouse gas emissionreductions or removal enhancements
262 T. V. Ramachandra et al.
Jain MC, Kumar S, Wassmann R, Mitra S, Singh SD, Singh RP, Singh R, Yadav AK, Gupta S(2000) Methane emissions from irrigated rice fields in Northern India (New Delhi). Nutr CyclAgroecosyst 58:75–83
Jalihal SA, Reddy TS (2006) CNG: an alternative fuel for public transport. J Sci Ind Res65:426–431
Jalihal SA, Ravinder K, Reddy TS (2005) Traffic characteristics in India. In: Proceedings of theEastern Asia society for transportation studies, volume 5, pp 1009–1024
Jessica A (2008) Report- what is carbon footprint, 19 February 2008. The Edinburg Centre forCarbon Management
Kampschreur MJ, Temmnik H, Kleerebezem R, Jetten MSM, van Loosdrecht MCM (2009)Nitrous oxide emission during wastewater treatment. Water Res 43(17):4093–4103
Keeling CD (1961) The concentration and isotopic abundances of carbon dioxide in rural andmarine air. Geochim Cosmochim Acta 24:277–298
Keeling CD (1998) Rewards and penalties of monitoring the Earth. Ann Rev Energy Environ23:25–82
Kennedy C, Steinberger J, Gasson B, Hansen Y, Hillman T, Havranek M, Pataki D, PhdungsilpA, Ramaswami A, Mendez GV (2009) Greenhouse gas emissions from global cities. EnvironSci Technol 2009(43):7297–7302
Kennedy C, Steinberger J, Gasson B, Hansen Y, Hillman T, Havranek M, Pataki D, PhdungsilpA, Ramaswami A, Mendez GV (2010) Methodology for inventorying greenhouse gasemissions from global cities. Energy Policy 38(2010):4828–4837
Khalil MAK, Rasmussen RA (1988) Nitrous oxide: trends and global mass balance over the last3000 years. Ann Glaciol 10:73–79
Khosa MK, Sidhu BS, Benbi DK (2010) Effect of organic materials and rice cultivars on methaneemission from rice field. J Environ Biol 31:281–285
Koyama T (1963) Gaseous metabolism in lake sediments and paddy soils and the production ofatmospheric methane and hydrogen. J Geophys Res 68:3971–3973
Kulkarni P, Chandra V (2000) Atmospheric polycyclic aromatic hydrocarbons in Mumbai, India.Atmos Environ 34(2000):2785–2790
Kumar S (2003) Cleaner production technology and bankable energy efficiency drives in fertilizerindustry in India to minimize greenhouse gas emissions—case study. In: Greenhouse gascontrol technologies—sixth international conference 2003, p 1031–1036
Kumar U, Jain MC, Pathak H, Kumar S, Majumdar D (2000) Nitrous oxide emissions fromdifferent fertilizers and its mitigation by nitrification inhibitors in irrigated rice. Biol FertilSoils 32(2000):474–478
Kumar S, Gaikwad SA, Shekdar AV, Kshirsagar PS, Singh RN (2004) Estimation method fornational methane emission from solid waste landfills. Atmos Environ 38:3481–3487
Kumar S, Bhattacharya JK, Vaidya AN, Chakrabarti T, Devotta S, Akolkar AB (2009)Assessment of the status of municipal solid waste management in metro cities, state capitals,class I cities and class II towns in India: An insight. Waste manage 29:883–895
Larsen HN, Hertwich EG (2010) Identifying important characteristics of municipal carbonfootprints. Ecol Econ 70:60–66
Latha K, Madhavi V, Krishna P, Badarinath KVS (2003) Aerosol characteristics and radiativeforcing over industrial areas of urban environment—a case study from Hyderabad and itsenvirons. IGU J Indian Geophys Union 7(1):25–29
Le Treut H, Somerville R, Cubasch U, Ding Y, Mauritzen C, Mokssit A, Peterson T, Prather M(2007) Historical overview of climate change. In: Solomon S, Qin D, Manning M, Chen Z,Marquis M, Averyt KB, Tignor M, Miller HL (eds) Climate change 2007: The physicalscience basis. contribution of working group I to the Fourth assessment report of theintergovernmental panel on climate change. Cambridge University Press, Cambridge
Loganathan D, Kamatchiammal S, Ramanibai R, Jayakar Santhosh D, Saroja V, Indumathi S(2011) Status of groundwater at Chennai city, India. Indian J Sci Technol 4(5):566–572
Sector-Wise Assessment of Carbon Footprint 263
Lu Y, Huang Y, Zou J, Zheng X (2006) An inventory of N2O emissions from agriculture in Chinausing precipitation-rectified emission factor and background emission. Chemosphere65(11):1915–1924
Machida T (1995) Increase in the atmospheric nitrous oxide concentration during the last250 years. Geophys Res Lett 22:2921–2924
Majumdar D, Kumar S, Pathak H, Jain MC, Kumar U (2000) Reducing nitrous oxide emissionfrom rice field with nitrification inhibitors. Agric Ecosyst Environ 81(2000):163–169
Matthew E (1999) Greenhouse warming potential model. Based J Chem Educ 76:1702–1705MCI (2008) Motor Coach Industries (MCi’s) go green glossary, viewed 15th Sept 2008. http://
www.mcicoach.com/gogreen/greenGlossary.htmMcKinnon AC, Piecyk MI (2010) Logistics 2050: moving freight by road in a very low carbon
world. Logistics Research Centre, Heriot-Watt University, EdinburghMcMichael AJ, Woodruff R, Hales S (2006) Climate change and human health: present and
future risks. The Lancet 367(9513):859–869MFL (2010), Madras Fertilizers Limited, 2009–10MiEF (2004) India’s Initial National Communication to the United Nations Framework
Convention on Climate Change. Ministry of Environment and Forests, Government of India,New Delhi, pp 38–41
Mitra AP (1992) Greenhouse gas emission in India: 1991 methane campaign, science report no. 2.Council of Scientific and Industrial Research and Ministry of Environment and Forests, NewDelhi
Mitra AP, Bhattacharya S (2002) Climate change and greenhouse gas inventories: projections,impacts and mitigation strategies. In: Shukla PR, Sharma SK, Ramana PV (eds) Climatechange and India: issues, concerns and opportunities. Tata McGraw-Hill Publishing CompanyLimited, New Delhi
Mitra S, Jain MC, Kumar S, Bandyopadhyay SK, Kalra N (1999a) Effect of rice cultivars onmethane emission. Agric Ecosyst Environ 73(3):177–183
Mitra S, Jain MC, Kumar S, Bandyopadhyay SK, Kalra N (1999b) Effect of rice cultivars onmethane emission. Agric Ecosyst Environ 73(3):177–183
Mittal ML, Sharma C (2003) Anthropogenic emissions from energy activities in India: generationand source characterization (part II: emissions from vehicular transport in India). http://www.osc.edu/research/pcrm/emissions/India_Report_1Pagelayout.pdf
Mitra AP, Sharma C (2002) Indian aerosols: present status. Chemosphere 49(9):1175–1190MMRDA (2008) Mumbai Urban Infrastructure Project—Mumbai Metropolitan Region Devel-
opment AuthorityMOA (2003) Livestock Census 1997 and 2003MOA (2005) 17th Indian Livestock Census,—All India Summary Report, Department of Animal
Husbandry and Dairing, Ministry of Agriculture, Government of IndiaMOA (2007) 18th Indian Livestock Census,—All India Summary Report. Department of Animal
Husbandry and Dairying, Ministry of Agriculture, Government of IndiaMOA (2008) Agricultural Statistics at a Glance (2008) Directorate of Economics and Statistics,
Department of Agriculture and Cooperation (DAC), Ministry of Agriculture, Government ofIndia
Moomaw WR (1996) Industrial emissions of greenhouse gases. Energy Policy24(10–11):951–968
MoPNG (2010) Statistics on Petroleum and Natural Gas, 2009–10MoUD (2009) Area, population and density of cities and towns of India—2001, area and
density—metropolitan cities, town and country planning organization. Ministry of UrbanDevelopment, Government of India
Murthy NS, Panda M et al (1997a) Economic development, poverty reduction and carbonemissions in India. Energy Econ 19(3):327–354
Murthy NS, Panda M et al (1997b) Economic growth, energy demand and carbon dioxideemissions in India: 1990–2020. Environ Dev Econ 2(2):173–193
264 T. V. Ramachandra et al.
Naqvi SMK, Sejian V (2011) Global climate change: role of livestock. Asian J Agric Sci3(1):19–25
Narasimha R, Sant G, Rajan SC (2009) An overview of Indian energy trends: low carbon growthand development challenges. Prayas Energy Group, India
NATCOM (2004) India’s Initial National Communication to the UNFCC. Ministry ofEnvironment and Forests, Government of India
NEERI (2005) Assessment of status of municipal solid waste management in metro cities, statecapitals, class—I cities and class—II towns. NEERI, Nagpur
Neftel A (1982) Ice core sample measurements give atmospheric CO2 content during the Past40,000 Yr. Nature 295:220–223
Neftel A, Moor E, Oeschger H, Stauffer B (1985) Evidence from polar ice cores for the increasein atmospheric CO2 in the past 2 centuries. Nature 315:45–47
Nelson GC, Richard R, Siwa M, Tingju Z, Xiaoli L, Puja J (2009) Greenhouse gas mitigation:issues for indian agriculture. International Food Policy Research Institute
Nicholas S (2006) Stern review on the economics of climate change. UK TreasuryNorth GR, Kim K-Y (1995) Detection of forced climate signals part II: simulation results. J Clim
6:409–417Pachauri S (2004) An analysis of cross-sectional variations in total household energy
requirements in India using micro survey data. Energy Policy 32(15):1723–1735Pachauri S, Spreng D (2002) Direct and indirect energy requirements of households in India.
Energy Policy 30(6):511–523Pachauri RK, Sridharan PV (1998) In: Pachauri RK, Batra RK (eds) Directions innovations and
strategies for harnessing action for sustainable development. TERI, New DelhiPandey D, Agarwal M, Pandey JS (2011) Carbon footprint: current methods of estimation.
Environ Monit Assess 178:135–160Parashar DC, Rai J, Gupta PK, Singh N (1991) Parameters affecting methane emission from
paddy fields. Indian J Radio Space Phys 20:12–17Parashar DC, Gupta PK, Rai J, Sharma RC, Singh N (1993) Effect of soil temperature on methane
emission from paddy fields. Chemosphere 26(1–4):247–250Parashar DC, Mitra AP, Sinha SK, Gupta PK, Rai J, Sharma RC, Singh N, Kaul S, Lal G,
Chaudhary A, Ray HS, Das SN, Parida KM, Rao SB, Kanung SP, Ramasami T, Nair BU,Swamy M, Gupta SK, Singh AR, Saikia BK, Barua AKS, Pathak MG, Iyer CPS,Gopalakrishnan M, Sane PV, Singh SN, Banerjee R, Sethunathan N, Adhya TK, Rao VR,Palit P, Saha AK, Purkait NN, Chaturvedi GS, Sen SP, Sen M, Sarkar B, Banik A, SubbarayaBH, Lal S, Venkatramani S (1994) Methane budget from Indian paddy fields. In: Minami K,Mosier A, Sass RL (eds) CH4 and N2O: global emissions and controls from rice fields andother agricultural and industrial sources. Tsukuba, Japan: NIAES Series 2. pp 27–39
Parikh KJ (2001) Poverty-environment Nexus. Int J Glob Environ Issues 1(1):2001Parikh KJ, Manoj KP, Murthy NS (1997) Consumption patterns by income groups and carbon
dioxide implications for India: 1990–2010. Int J Energy Issues 9:237–255POST (2006) Carbon footprint of electricity generation. POST note 268, October 2006,
Parliamentary Office of Science and Technology, London. http://www.parliament.uk/documents/upload/postpn268.pdf
Qader MR (2009) Electricity consumption and GHG emissions in GCC countries. Energies2009(2):1201–1213
Raghuvansi SP, Chandra A, Raghav AK (2006) Carbon dioxide emissions from coal based powergeneration in India. Energy Convers Manag 47(4):427–441
Ramachandra TV, Bachamanda S (2007) Environmental audit of municipal solid wastemanagement. Int J Environ Technol Manage 7(3/4):369–391
Ramachandra T, Shwetmala V (2009) Emissions from India’s transport sector: state wisesynthesis, atmospheric environment. doi:10.1016/j.atmosenv.2009.07.015
Ramachandra T, Shwetmala V (2012) Decentralised carbon footprint analysis for opting climatechange mitigation strategies in India. Renew Sustain Energy Rev 16(8):5820–5833
Sector-Wise Assessment of Carbon Footprint 265
Ramachandra T, Uttam Kumar V (2010) Greater Bangalore: emerging urban heat, Island. GIS Dev14(1). (http://www.gisdevelopment.net/application/urban/sprawl/Greater-Bangalore-Emerging-Urban-Heat-Island.htm)
Ramachandra TV, Aithal BH, Sanna DD (2012) Insights to urban dynamics through landscapespatial pattern analysis. Int J Appl Earth Obs Geoinf 18:329–343
Ramanathan V (1975) Greenhouse effect due to chlorofluorocarbons: Climatic implications.Science 190:50–52
Ramanathan R, Parikh JK (1999) Transport sector in India: an analysis in the context ofsustainable development. Transp Policy 6(1):35–45
Rao MN, Reddy BS (2007) Variations in energy use by Indian households: an analysis of microlevel data. Energy 32(2):143–152
Rao JK, Shantaram MV (2003) Soil and water pollution due to open landfills. In: Proceedings ofthe sustainable landfill management workshop. 3–5 Dec 2003 Anna University, Chennai,pp 27–38
Ravindra K, Eric W, Sushil KT, Suman M, van Grieken R (2006) Assessment of air quality afterthe implementation of CNG as fuel in public transport in Delhi, India. Environ Monit Assess115(1–3):405–417
Rawat Manju A, Ramanathan L (2011) Assessment of methane flux from municipal solid waste(MSW) landfill areas of Delhi, India. J Environ Prot 2:399–407
RCF (2010) 32nd Annual Report, Rashtriya Chemical and Fertilizers Limited, 2009–10Reddy BS, Srinivas T (2009) Energy use in Indian household sector-an actor oriented approach.
Energy 34(8):992–1002Reddy MS, Boucher O, Venkataraman C (2002) Seasonal carbonaceous aerosol emissions from
open biomass burning in India. Bull IASTA 14:239–243Road Transport Year Book (2007–2009) Transport Research Wing, Ministry of Road Transport
and Highways, Government of India, 2011Sass RL, Fisher FM Jr (1998) Methane from irrigated rice cultivation. In: Parashar DC, Sharma
C, Mitra AP (eds) Global environment chemistry. pp 77–94Schlesinger ME, Ramankutty N (1994) An oscillation in the global climate system of period
65–70 years. Nature 360:330–333Schumacher K, Sathaye J (1999) India’s cement industry: productivity, energy efficiency and
carbon emissions, energy analysis program. Lawrence Berkeley National Laboratory, BerkelySchutz H, Holzapfel-Pschorn A, Conrad R, Rennenberg H, Seiler W (1989) A three-year
continuous record on the influence of daytime season and fertilizer treatment on methaneemission rates from an Italian rice paddy field. J Geophys Res 94:16405–16416
Seiler W, Holzapfel-Pschorn A, Conrad R, Scharfe D (1984) Methane emission from ricepaddies. J Atmos Chem 1:241–268
Shafik N, Bandyopadhyay S (1992) Economic growth and environmental quality: time series andcross-country evidence. In: Policy research working paper series 904, The World Bank
Sharma C, Pundir R (2008) Inventory of greenhouse gases and other pollutants from the transportsector: Delhi. Iran J Environ Health Sci Eng 5(2):117–124
Sharma C, Gupta PK, Parashar DC (1995) Nitrous oxide estimates from paddy fields and forestsin India. Indian J Radio Space Phys 24:311–313
Sharma SK, Bhattacharya S, Garg A (2009) Greenhouse gas emissions from India: a perspective.Curr Sci 90:326–333
Sharma SK, Asim C, Pinaki S, Subhashis B, Anil S, Pradeep KD, Ajay KS, Suman M, Arti B,Madhu M, Rajesh K, Jha CS, Murthy MSR, Ravindranath NH, Jayant KB, Karthik M,Bhattacharya S, Chauhan R (2011) Greenhouse gas inventory estimates for India. Curr Sci101:405–415
Singh A, Gangopadhyay S, Nanda PK, Bhattacharya S, Sharma C, Bhan C (2008) Trends ofgreenhouse gas emissions from the road transport sector in India. Sci Total Environ390:124–131
Singhal KK, Mohini M, Jha AK, Gupta PK (2005) Methane emission estimates from entericfermentation in Indian livestock: Dry matter intake approach. Curr Sci 88(1):119–127
266 T. V. Ramachandra et al.
Sinha SK (1995) Global methane emission from rice paddies: excellent methodology but poorextrapolation. Curr Sci 68(6):643–646
Sikdar PK, Singh A (2009) Transportation sector: energy and GHG emissions. In: Proceedingsof the seminar on energy and GHG emissions. Seminar on energy for sustainableinfrastructure development and lifestyle. Consulting engineers india, New Delhi, 23–24February 2009
SOE—State of Environment Report for Delhi (2010) Department of Environment and Forests,Government of Delhi
Steele LP (1996) Atmospheric methane, carbon dioxide, carbon monoxide, hydrogen, and nitrousoxide from Cape Grim air samples analyzed by gas chromatography. In: Francey RJ, DickAL, Derek N (eds) Baseline atmospheric program Australia, 1994–95. Bureau of Meteorologyand CSIRO Division of Atmospheric Research, Melbourne, pp 107–110
Stern D, Common M, Barbier E (1996) Economic growth and environmental degradation: theenvironmental kuznets curve and sustainable development. World Dev 24:1151–1160
Swamy M, Bhattacharya S (2006) Budgeting anthropogenic greenhouse gas emission from Indianlivestock using country-specific emission coefficients. Curr Sci 91(10):1340–1353
Talyan V, Dahiya RP, Anand S, Sreekrishnan TR (2007) Quantification of methane emissionfrom municipal solid waste disposal in Delhi. Resour Conserv Recycl 50(3):240–259
TEDDY (2006, 2011) TERI Energy Data Directory and Yearbook. The Energy and ResourceInstitute, New Delhi
Vijay B, Mehta VM (2010) Atmospheric particulate pollutants and their relationship withmeteorology in Ahmedabad. Aerosol Air Qual Res 10:301–315
Wakdikar S (2002) Compressed natural gas: a problem or a solution? Curr Sci 82(1):25–29Weiss RF (1981) The temporal and spatial distribution of tropospheric nitrous oxide. J Geophys
Res 86:7185–7195Weisser D (2007) A guide to life-cycle greenhouse gas (GHG) emissions from electric supply
technologies. Energy 32(9):1543–1559World Bank http://worldbank.org. Accessed 20th Aug 2013Wright LA, Coello J, Kemp S, Williams I (2011) Carbon footprinting for climate change
management in cities. Carbon Manage 2(1):49–60Yamulki S, Jarvis SC, Owen P (1999) Methane emission and uptake from soils as influenced by
excreta deposition from grazing animals. J Environ Qual 28:676–682
Sector-Wise Assessment of Carbon Footprint 267