Under Peer Review - Auckland Transport · 2.1 Britomart Terminal and the Downtown Bus Interchange...
59
D R A F T Final Report City Centre Bus Reference Case Auckland Transport Prepared by: MRCagney Pty Ltd 15 March 2016 Under Peer Review D R A F T
-
Upload
phungthien -
Category
Documents
-
view
219 -
download
0
Transcript of Under Peer Review - Auckland Transport · 2.1 Britomart Terminal and the Downtown Bus Interchange...

D R A F T
Final Report
City Centre Bus Reference Case
Auckland Transport
Prepared by:
MRCagney Pty Ltd
15 March 2016
Under Peer Review
D R A F T

D R A F T
Page i
Document Information
Client Auckland Transport
Job Number NZ 2026
Title City Centre Bus Reference Case
Second Revision
Prepared by MRCagney Pty Ltd
Auckland
Date 24 November 2015
Quality Assurance Register
Issue Description Prepared by Reviewed by Authorised by Date
1 First Draft Issue R. Savedge N. ReidK. Lundberg
K. Lundberg 26 May 2015
2 Final Draft Issue R. Savedge K.LundbergR. Lees-Green
K. Lundberg 08 Jun 2015
3 Final Issue R. SavedgeL. Christensen
J. VargheseK. Baker
J. Varghese 05 Oct 2015
4 Revised Final Issue R. Lees-Green R. Savedge K. Lundberg 24 Nov 2015
5 Second Revision R. Savedge N. Reid R. Savedge 15 Mar 2016
© 2015 MRCagney Pty Ltd
This document and information contained herein is the intellectual property of MRCagney Pty Ltd and is solely for the use of MRCagney’s contracted client. This document may not be used, copied or reproduced in whole or part for any purpose other than that for which it was supplied, without the written consent of MRCagney. MRCagney accepts no responsibility to any third party who may use or rely upon this document.
www.mrcagney.com
Under Peer Review

D R A F T
Auckland Transport Bus Reference Case
Page ii
Table of Contents
Executive Summary ................................................................................................ 1
1 Introduction and Scenario Development .........................................................2
2 City Centre Bus Corridors and Termini ...........................................................4 2.1 Britomart Terminal and the Downtown Bus Interchange Concept Design .....................7 2.2 Wellesley Street and the Learning Quarter Terminal ...................................................12 2.3 Fanshawe Street and Wynyard Quarter Terminal ........................................................18 2.4 Albert Street ..................................................................................................................23 2.5 Symonds Street ............................................................................................................26 2.6 Karangahape Road.......................................................................................................28
3 Assumptions .................................................................................................30 3.1 Growth Rates ................................................................................................................30 3.2 Vehicles ........................................................................................................................32 3.3 Impacts of Infrastructure Investments on Bus Network ................................................33
4 Infrastructure Requirements..........................................................................34 4.1 Constrained Environment .............................................................................................34 4.2 Bus Stops and Lanes....................................................................................................34 4.3 Pedestrian Facilities and Access ..................................................................................36 4.4 Transfer Point/Terminal Requirements.........................................................................36 4.5 Service Grouping ..........................................................................................................38
5 Notes on Infrastructure and Service..............................................................39 5.1 Peak Spreading ............................................................................................................39 5.2 Off-Board Fare Collection and All-Door Boarding ........................................................40 5.3 Vehicle Capacity ...........................................................................................................40
6 Conclusions and Recommendations.............................................................43
Appendix A: Bus Volume Maps .............................................................................44
Appendix B: Maximum Bus Volumes by Corridor/Terminus ..................................49
Appendix C: North Shore Peak Bus Occupancy ...................................................52
Appendix D: Victoria Street Eastbound Corridor ...................................................54
Under Peer Review

D R A F T
Auckland Transport Bus Reference Case
Page iii
Note to Reader
As of March 2015, this document is under peer review. Note that some text, conclusions and/or figures may change following the review process.
These figures represent the final draft issue from 15 November 2015, with minor corrections to text.
Under Peer Review

D R A F T
Auckland Transport Bus Reference Case
Page 1 Bus Reference Case (Second Revision)
Executive Summary
MRCagney was commissioned by Auckland Transport (AT) Metro Network Management to develop the Bus Reference Case to examine the required infrastructure for operation of the New Network in the City Centre. The purpose of this project was to review and consolidate existing plans and assumptions about City Centre bus networks and operations into a single “source oftruth” or reference case. This reference case is intended to be used as a baseline scenario for public transport projects in the City Centre.
There have been public transport (PT) network design changes and infrastructure projects which have generally taken place separately, without consideration of the combined impacts of these projects on City Centre corridors and termini. This document is designed to look at the physical form that terminal facilities and major City Centre bus corridors will need to take in order to accommodate the New Network. The study utilises AT’s network and facility plans and is based on existing and projected bus volumes that were provided by AT.
Methodology
The study looked at the planned City Centre bus network for the following scenarios:
2018 after the completed rollout of the New Network; 2026 New Network with CRL; and 2036 New Network with CRL.
Key assumptions about bus service levels and frequencies for individual routes were provided by AT Metro Network Management and Bus Services. These were then compiled to develop a picture of the expected total bus volumes in the City Centre.
The Bus Reference Case considers what can be built in each corridor and at each terminal location, what the impacts are on capacity (including upper limits on certain corridors or at certain facilities), and provides some ideas on how to fit the network into the desired—or possible—infrastructure. Infrastructure assumptions were discussed and confirmed with AT Bus Services.
Under Peer Review

D R A F T
Auckland Transport Bus Reference Case
Page 2 Bus Reference Case (Second Revision)
1 Introduction and Scenario Development
By 2018, it is anticipated that Auckland’s New Network—a redesign of the city’s bus network—will have been implemented. The New Network was designed to provide a clear hierarchy of routes, with frequent, all-day services providing access to as much of the city as possible, connector services providing additional passenger links, and coverage services ensuring the maximum number of Auckland residents have access to the network. The network was designed to achieve several goals, including the following:
An easy to use, all-day frequent network; Improved network legibility; Improved service for counter peak, and suburb-to-suburb trips; Improved all-day and weekend service; and Minimal impacts on operating budget.
It is understood that currently, the network does not function well for many passengers making trips other than those for commutes during the peak period between residences in the suburbs and jobs in the City Centre. The New Network is intended to make such trips easier, by providing passengers with a network that is easier to understand and use, not only for commuting to work, but for casual and weekend trips as well.
The following report explores the spatial requirements associated with public transport services in the City Centre over the next 20 years. The New Network being rolled out across the city by 2018 fundamentally alters the way public transportation is delivered across the city and in particular in the CBD. In addition, the anticipated delivery of the City Rail Link (CRL) has impacts on planned bus service and projected patronage.
The volume of buses entering the City Centre, utilising major City Centre corridors and serving/terminating at City Centre bus transfer points and termini will greatly impact the infrastructure required to accommodate bus passengers and operations. This document seeks to provide guidance to Auckland Transport to determine what infrastructure will be required to accommodate bus service given several different scenarios.
This document assumes different scenarios regarding the implementation of the New Network andthe City Rail Link (CRL). These scenarios are broken out into three “snapshots” of service at three different times:
2018 – In 2018, it is assumed that the New Network (bus network) will have been rolled out in all areas of Auckland, and that higher-capacity vehicles (e.g., double deckers) will be used on the all-day patterns of highest volume routes, but not the additional peak frequency. Key infrastructure improvements include:
New Network;
Revised Britomart Bus Terminal configuration (reinstatement post-CRL enabling works); and
Temporary Te Atatu Bus Interchange.
Under Peer Review

D R A F T
Auckland Transport Bus Reference Case
Page 3 Bus Reference Case (Second Revision)
2026 – In 2026, the CRL is assumed to have been completed, and the rail network operating at full capacity, as well as extension of all three busways. In this scenario the bus network is adjusted to operate with CRL in place. Key infrastructure improvements include:
CRL in full operation with stations at Aotea Square and Karangahape Road;
Northern Busway expansion to Albany;
AMETI Busway expansion from Panmure to Pakuranga;
Delivery of the Northwestern Busway between Te Atatu and Westgate, with permanent interchanges constructed at both Te Atatu and Westgate; and
New bus termini at the Learning Quarter and Wynyard Quarter.
2036 – In 2036, it is assumed that rail service will be delivered to the airport, as well as further extension of the busways. Airport service could either be provided by heavy rail or light rail transit; however, the choice of mode has no difference in the impact on bus volumes in the City Centre. This scenario includes full build-out of the heavy rail network and busways.
Rail expansion to the airport;
AMETI Busway expansion from Pakuranga to Botany;
Northern Busway expansion from Albany to Silverdale; and
Northwestern Busway has NOT been completed between Pt. Chevalier and the City Centre.
Under Peer Review

D R A F T
Auckland Transport Bus Reference Case
Page 4 Bus Reference Case (Second Revision)
2 City Centre Bus Corridors and Termini
This section investigates what major City Centre corridors will look like given the proposed New Network bus volumes and examines the specific requirements of each major City Centre bus terminal and transfer points at three different times: a 2018 network, assuming implementation of the New Network for buses; a 2026 network, assuming implementation of CRL; and a long-term 2036 network.
Peak volumes are compared to all-day volumes, with the assumption that AM and PM peak service will operate at the same frequency. In all likelihood, PM peak service will be somewhat less concentrated (e.g., fewer buses per hour) than the AM peak service, but will include longer dwell times with larger passenger volumes boarding and paying their fares.
The following table summarises peak and all-day bus volumes in each corridor. For Fanshawe Street and Wellesley Street, this is broken out into AM Eastbound/PM Westbound and AM Westbound/PM Eastbound, as due to proposed service patterns, these volumes differ. It is important to note that the below table includes only “in service” buses, and does not show deadhead movements. Note the City Link is not included in Karangahape Road, as it travels only on the segment east of Pitt Street, whereas all other buses travel only on the segment west of Pitt Street.
Table 1: Peak and All-Day Bus Volumes by City Centre Corridor
Corridor Direction 2018 2026 2036
Albert StreetPeak Period 59 62 78
All-Day 17 18 26
Fanshawe Street
AM Eastbound/ PM Westbound 164 178 196
AM Westbound/ PM Eastbound 127 131 146
All-Day 83 96 112
Karangahape Road
Peak Period 53 58 72
All-Day 31 38 50
Symonds Street
Peak Period 120 112 123
All-Day 46 48 50
Wellesley Street
AM Eastbound/ PM Westbound 110 122 136
AM Westbound/ PM Eastbound 105 105 120
All-Day 55 62 66
The termini and transfer points examined include the following:
Britomart Terminal – this is currently the main City Centre terminal for most bus lines serving the City, all four rail lines, as well as ferry services in the adjacent Downtown Ferry Terminal on Queens Wharf. A proposed redesign of the bus facilities at Britomart, to be implemented with the New Network, effectively create two new termini: Britomart East, and Britomart West, each with different service groups. Britomart East will be served by routes from the east and south, while Britomart West will be served by routes from the north and west. Learning Quarter Terminal – this is a proposed terminus primarily for North Shore to University services traveling across Wellesley Street. It would be constructed either on-street or off-street at a location to be determined within the University precinct or Grafton Gully.
Under Peer Review

D R A F T
Auckland Transport Bus Reference Case
Page 5 Bus Reference Case (Second Revision)
Wynyard Quarter Terminal – this is a proposed terminus primarily for routes to/from the Isthmus and areas south and southeast of the City which travel across Wellesley Street, as well as for the Crosstown 5 and City Link. Aotea Transfer Point – this transfer point, to be located at and around the intersection of Albert and Wellesley Streets, would serve both as a destination for passengers traveling to the City and as a connection point between different routes and modes. It would include connections with the rail network at Aotea Station, bus service along Albert Street (routes to/from the west and northwest), and bus service along Wellesley Street (routes to/from the south, southeast and North Shore). Karangahape Road Transfer Point – this precinct will serve as a transfer point between bus and rail service at the proposed Karangahape Road Station on the CRL, to be located at the intersection of Pitt Street and Karangahape Road.
The following table shows the expected peak and all-day bus volumes for each terminal in 2018, 2026 and 2036, with Britomart split into “Britomart East” and “Britomart West”. As discussed in Section 2, double deckers are assumed for use on several major routes, and CRL is assumed to be completed in 2026, resulting in a few changes to the bus network.
Table 2: Anticipated Peak Period and All-Day Bus Volumes at City Centre Termini
Terminal* Time Period 2018 2026 2036
Britomart EastPeak Period 67 71 77
All-Day 21 26 29
Britomart WestPeak Period 108 116 136
All-Day 37 43 52
Learning QuarterPeak Period 72 82 92
All-Day 17 22 22
Wynyard QuarterPeak Period 88 83 96
All-Day 43 46 52*Terminating (AM peak) / originating (PM peak) trips only - does not include trips travelling through.
The highest volumes are seen at Britomart West, which includes a number of peak-only routes from the North Shore and the west/northwest, meaning that a good portion of the capacity would be required only during the busiest hours. For example, in the 2018 New Network scenario, 108 buses will terminate (AM peak) or originate (PM peak) during the peak hour at Britomart West, while only 37 will terminate/originate there per hour throughout the day.
The Learning Quarter also sees high volumes, a large proportion of which are peak-only services. Upon implementation of the New Network in 2018, there would be 72 buses per hour terminating (AM peak) or originating (PM peak) at the Learning Quarter during the peak hour; all-day, only 17trips would arrive and depart from the terminal each hour.
Wynyard Quarter sees higher volumes in the near term. Service at Wynyard Quarter is more even than at Britomart and the Learning Quarter, with 88 trips per hour terminating (AM peak) or originating (PM peak) during the peak and 43 trips per hour all-day, as most routes utilising this terminal operate all day.
The following table summarises the number of berths (or spaces) required to accommodate the bus volumes shown above at each of the termini. As with previous analyses, the table shows three scenarios: 2018, 2026 with CRL, and 2036 with CRL. All scenarios assume that the New Network has been fully-implemented by 2018. Note that this table shows the minimum number of spaces required to accommodate the expected volume of buses—this does not account for route groupings or other specific needs which would increase the total space required.
Under Peer Review
D R A F T
Auckland Transport Bus Reference Case
Page 6 Bus Reference Case (Second Revision)
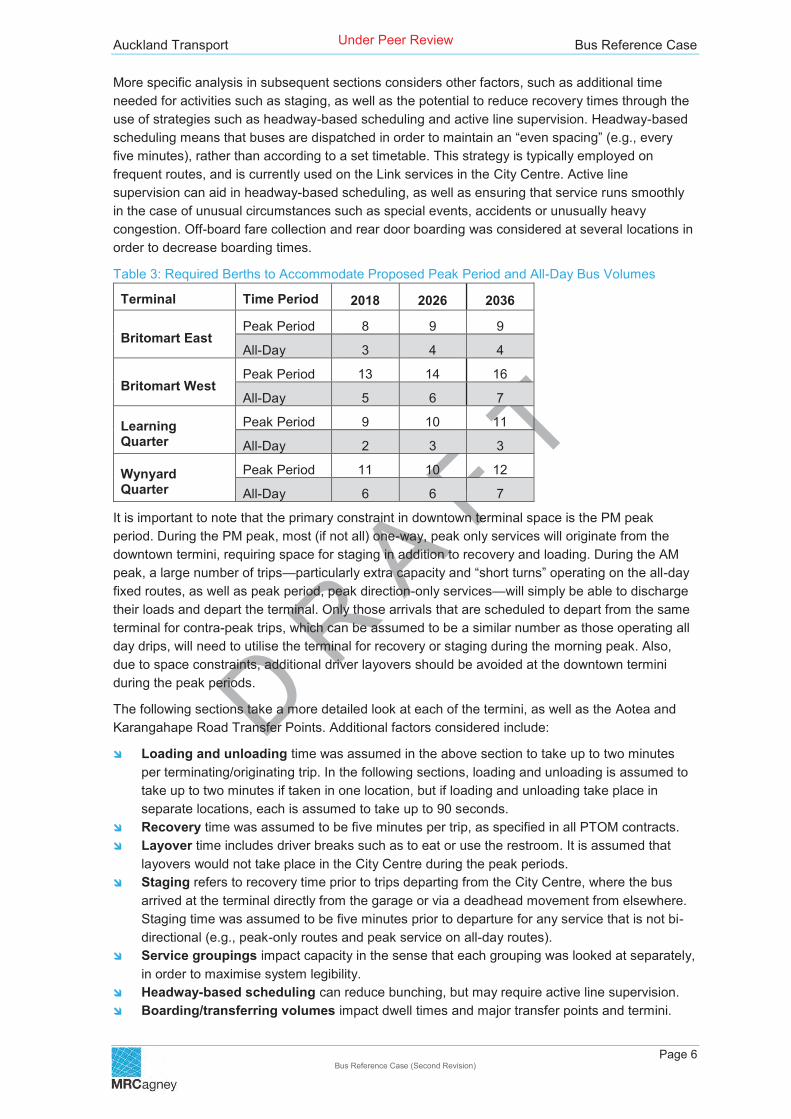
More specific analysis in subsequent sections considers other factors, such as additional time needed for activities such as staging, as well as the potential to reduce recovery times through the use of strategies such as headway-based scheduling and active line supervision. Headway-based scheduling means that buses are dispatched in order to maintain an “even spacing” (e.g., every five minutes), rather than according to a set timetable. This strategy is typically employed on frequent routes, and is currently used on the Link services in the City Centre. Active line supervision can aid in headway-based scheduling, as well as ensuring that service runs smoothly in the case of unusual circumstances such as special events, accidents or unusually heavy congestion. Off-board fare collection and rear door boarding was considered at several locations in order to decrease boarding times.
Table 3: Required Berths to Accommodate Proposed Peak Period and All-Day Bus Volumes
Terminal Time Period 2018 2026 2036
Britomart EastPeak Period 8 9 9
All-Day 3 4 4
Britomart WestPeak Period 13 14 16
All-Day 5 6 7
Learning Quarter
Peak Period 9 10 11
All-Day 2 3 3
Wynyard Quarter
Peak Period 11 10 12
All-Day 6 6 7
It is important to note that the primary constraint in downtown terminal space is the PM peak period. During the PM peak, most (if not all) one-way, peak only services will originate from the downtown termini, requiring space for staging in addition to recovery and loading. During the AM peak, a large number of trips—particularly extra capacity and “short turns” operating on the all-day fixed routes, as well as peak period, peak direction-only services—will simply be able to discharge their loads and depart the terminal. Only those arrivals that are scheduled to depart from the same terminal for contra-peak trips, which can be assumed to be a similar number as those operating all day drips, will need to utilise the terminal for recovery or staging during the morning peak. Also, due to space constraints, additional driver layovers should be avoided at the downtown termini during the peak periods.
The following sections take a more detailed look at each of the termini, as well as the Aotea and Karangahape Road Transfer Points. Additional factors considered include:
Loading and unloading time was assumed in the above section to take up to two minutes per terminating/originating trip. In the following sections, loading and unloading is assumed to take up to two minutes if taken in one location, but if loading and unloading take place in separate locations, each is assumed to take up to 90 seconds. Recovery time was assumed to be five minutes per trip, as specified in all PTOM contracts. Layover time includes driver breaks such as to eat or use the restroom. It is assumed that layovers would not take place in the City Centre during the peak periods. Staging refers to recovery time prior to trips departing from the City Centre, where the bus arrived at the terminal directly from the garage or via a deadhead movement from elsewhere. Staging time was assumed to be five minutes prior to departure for any service that is not bi-directional (e.g., peak-only routes and peak service on all-day routes). Service groupings impact capacity in the sense that each grouping was looked at separately, in order to maximise system legibility. Headway-based scheduling can reduce bunching, but may require active line supervision. Boarding/transferring volumes impact dwell times and major transfer points and termini.
Under Peer Review

D R A F T
Auckland Transport Bus Reference Case
Page 7 Bus Reference Case (Second Revision)
2.1 Britomart Terminal and the Downtown Bus Interchange Concept Design
A new terminal is proposed for Britomart, and is assumed to be constructed in a manner that is consistent with the Downtown Bus Interchange Concept Design (April 2015). This terminal will replace the existing terminal precinct, which currently encompasses 23 stops which can accommodate up to 41 buses at a time, as well as 13 additional layover spaces. The new terminal will be comprised of three sectors: Britomart East (Commerce, Gore and Tyler Streets), Britomart West (Lower Albert Street) and the “Link Zone”, where City Link, Inner Link and Airbus Express services will stop as they pass through the area.
Britomart East would have three double stops, each with a separate designated drop-off space (referred to in the plan as “set-down” spaces), and would serve the Tamaki Drive, AMETI (Ellerslie/Botany) and Mt Eden Road (and Hospitals) route groups. Buses from Tamaki Drive would access stops on Tyler Street via Commerce Street, buses from Mount Eden Road would access stops on Galway Street from Lower Queen Street, and the AMETI group would access stops on Commerce Street via Quay Street.
Britomart West would be divided into two sectors: the North Shore services (on the western side of the street) and the west/northwest services (on the eastern side of the street). The North Shore services would have two triple stops, with the rear-most spaces of each considered “set-down” spaces. One of these would be reserved for the Northern Express, and the second for other North Shore services (primarily Glenfield Road and Birkenhead). The eastern side of the street would have three single stops, which would operate in concert with two “set-down” spaces on the western side of Albert Street just south of Customs Street. Northwest Express (Northwestern Busway services, including Te Atatu, Henderson, Massey and Westgate), Great North Road (New Lynn) service, and Richmond Road services would use these stops, as well as some peak express service from Titirangi, Glen Eden, Green Bay and Blockhouse Bay prior to the opening of the CRL. Additional recovery spaces would be available on Lower Hobson Street for west/northwest services to use during the afternoon peak period between dropping off passengers on Albert Street and picking up on Lower Albert Street.
Note that the Freemans Bay route (Route 106) which was initially proposed to follow the same pattern as the Richmond Road service within the City Centre (via Albert Street) has been realigned in the most recent New Network plan as a one way loop service to leave Britomart West via the Fanshawe Street corridor. Thus it is assumed to share a turnaround loop (and stops) with the Birkenhead and Glenfield Road services.
The Link Zone refers to City Link/Airbus Express and Inner Link stops placed at the intersection of Queen Street and Customs Street. The City Link and Airbus Express would share a pair of double stops on Queen Street just south of Customs Street; the Inner Link would utilise two double stops on opposite sides of Customs Street near the intersection with Queen Street.
Figure 1 shows the proposed Britomart Terminal, as shown in the Downtown Bus Interchange Concept Design report. The diagram in Figure 2 demonstrates potential travel alignments for each route group, as developed for the Light Rail Project.
The table below summarises each of the proposed stops/locations for the new Britomart Terminal.
Note: the Airbus Express service, which currently terminates on Queens Wharf, is not included in the Britomart plans.
Under Peer Review

D R A F T
Auckland Transport Bus Reference Case
Page 8 Bus Reference Case (Second Revision)
Figure 1: Proposed Britomart Terminal
Figure 2: Potential Bus Alignments at Proposed Britomart Terminal
Table 4: Proposed Britomart Terminal Stop Locations
Stop Sector Stop Location Route Group(s) Spaces
Stop 1 Britomart East Tyler Street Tamaki Drive 2 stops, 1 set-down
Stop 2 Britomart East Commerce Street AMETI 2 stops, 1 set-down
Stop 3 Britomart East Galway Street Mt Eden Road 2 stops, 1 set-down
Stop 4 Lower Albert Street Northbound (1) North Shore 2 stops, 1 set-down
Stop 5 Lower Albert Street Northbound (2) NEX 2 stops, 1 set-down
Stop 6 Lower Albert Street Southbound (1,2,3) Northwest/West 3 stops, 2 set-down
Stop 7 Customs Street at Queen Street Inner Link 2 double stops
Stop 8 Queen Street at Customs Street City Link/Airbus Express 2 double stops
Under Peer Review

D R A F T
Auckland Transport Bus Reference Case
Page 9 Bus Reference Case (Second Revision)
2.1.1 Britomart East Britomart East is proposed to contain three double stops, each with a third “set down” space nearby. Each of these stops could comfortably accommodate 25 buses per hour (departures during the PM peak), which would nearly satisfy the requirement for the proposed levels of service through 2036. The Mt Eden Road/Hospitals group will exceed its stop capacity by 2026, and the Tamaki Drive group will exceed the capacity of the stop by 2036. Note that Papakura to City (Route 360x) service is discontinued with the implementation of CRL.
Table 5: Britomart East Peak Bus Volumes
Stop Services 2018 2026 2036Tyler Street Tamaki Drive 19 22 28Commerce Street Ellerslie/Panmure
Papakura 24 21 21
Galway Street Mt Eden RoadHospitals 24 28 28
Total 67 71 77
2.1.2 Britomart West Britomart West is divided into two sectors, each operating in opposite directions on Albert Street. Services to/from the West and Northwest will operate from the eastern side of Lower Albert Street, while services to/from the North Shore will operate from the western side of the street.
West and Northwest
The West and Northwest services will include routes operating between the City and Henderson, Te Atatu, Westgate and Massey (to be grouped into the West Express, or WEX, on the proposed Northwestern Busway); local services operating between New Lynn and the City via Great North Road; express services between the City and Blockhouse Bay, Green Bay, Glen Eden and Titirangi (to be discontinued upon the delivery of CRL); and local services between Britomart and Richmond Road. Following are volumes for those services in 2018, 2026 and 2036.
Table 6: Britomart West Peak Bus Volumes – West/Northwest Group
Stop Services 2018 2026 2036Albert Street (east side)
Northwest Motorway Services 26 44 58
Great North Road 12 12 12West Auckland Expresses 15 - -
Richmond Road 6 6 8Total 59 62 78
The West/Northwest group will share two “set-down” (drop-off) spaces on northbound Albert Street just south of Customs Street, then will turn left onto a newly two-way lower level of Customs Street West, followed by a right onto Lower Hobson Street, where staging/recovery spaces would be available. Buses would continue to turn right on Quay Street, then right onto Lower Albert Street, where they would serve three single stops to pick up passengers, returning to the south along Albert Street.
In 2018, there would be 59 buses per hour originating during the PM peak period. These could be accommodated with the proposed “set-down” spaces (2) and pick-up spaces (3), and would require five recovery/staging spaces on Lower Hobson Street. Five-minute recovery times per trip are specified in the PTOM contracts, and thus are considered mandatory for the purposes of this study.
Under Peer Review

D R A F T
Auckland Transport Bus Reference Case
Page 10 Bus Reference Case (Second Revision)
Bus groupings at the pick-up stops would be as follows:
Stop 1: Northwest Motorway services Stop 2: West Auckland Expresses (peak only) and Richmond Road services Stop 3: Great North Road service
The total number of buses per hour would grow to 62 by 2026, and 78 by 2036. The 2036 volume could be accommodated by expanding to a triple “set-down” stop on Albert Street. The triple drop-off stop was determined assuming the existing two-minute light cycles, which would mean that with evenly spaced buses, three buses would arrive at the stop nearly every light cycle. In addition, the number of layover spaces would need to be expanded to seven, in order to accommodate 5-minute recovery periods for all trips. Up to seven spaces could be accommodated on Lower HobsonStreet.
However, note that the Albert Street corridor is constrained to carry a maximum of approximately 53 buses per hour with the proposed lane configuration.
The West Auckland Expresses group would be discontinued upon delivery of CRL, which is assumed to happen before the 2026 scenario. Upon the opening of the Northwestern Busway, the Northwest Motorway services would be consolidated into the West Express (WEX). Groupings in 2026 and 2036 would be as follows:
Stops 1 and 2: West Express Stop 3: Great North Road and Richmond Road services
The expected all-day volume of 29 buses per hour maximum on Albert Street by 2036 could be accommodated with the two “set-down” spaces and three stops. However, one or two recovery/layover spaces should be retained all day to maintain flexibility in scheduling.
Note that these maximum volumes would apply to the PM peak, when the peak number of buses would be departing the terminal. During the AM peak, buses would arrive via Albert Street, drop off passengers at the “set-down” spaces, and likely turn left onto Fanshawe Street and left onto Hobson Street to access the SH-16 Motorway.
Infrastructure requirements in order to implement this circulation pattern include:
Construction of a two-way roadway (busway) on the lower level of Customs Street West. Allowance for buses to make a right turn from Customs Street West onto Lower Hobson Street. This turn could be difficult during the peak period, and would disrupt heavy bus flows to/from the North Shore. Elimination of the Lower Hobson Street Viaduct and reconfiguration of the roadway space could ameliorate the problem. Nearly the entire block face on the west side of Lower Hobson Street would need to be available for recovery/staging during the PM peak period by 2036; perhaps one or two spaces should be maintained throughout the day in order to provide scheduling flexibility due to limited space on Lower Albert Street.
Note that without the provision of recovery spaces, each of the three stops could accommodate nine buses per hour, for a total of 27 buses per hour during the PM peak period, when five minutes of recovery/staging is assumed prior to each trip. Each recovery space adds capacity for roughly nine additional buses per hour.
North Shore
The North Shore Services, including the Northern Express, Glenfield Road to City and Birkenhead to City, as well as the Freemans Bay service would utilise the western side of Lower Albert Street. Two triple stops would be provided, with the rear space of each stop assumed to be used primarily for “set-down” or drop-off purposes. Buses would continue to turn left onto Quay Street, left ontoLower Hobson Street, and return to the North Shore via Fanshawe Street.
Following are the anticipated peak service volumes for the North Shore sector of Britomart West.
Under Peer Review

D R A F T
Auckland Transport Bus Reference Case
Page 11 Bus Reference Case (Second Revision)
Table 7: Britomart West Peak Bus Volumes – North Shore Group
Stop Services 2018 2026 2036Albert Street (east side)
Northern Express 30 30 30
Glenfield Road to City 9 10 12
Birkenhead to City 8 10 12
Freemans Bay 2 4 4Total 49 54 58
It is envisioned that one stop would accommodate the Northern Express service, and one stop would accommodate the Glenfield Road and Birkenhead services. Note that in the most recent plans for the New Network, the Freemans Bay route follows the same pattern as North Shore services out of the City Centre, and would thus likely share stops with the Glenfield Road and Birkenhead services. Each stop would accommodate up to approximately 25 buses per hour without additional recovery space. The Britomart West North Shore service sector stop configuration would be as follows:
Stop 1: Northern Express Stop 2: Glenfield Road, Birkenhead and Freemans Bay
The Northern Express service will include 30 buses per hour by 2018. The triple stop provided would be more than adequate to handle up to approximately 25 buses per hour, and thus would be sufficient for all-day service through 2036 and beyond. However, during the peak periods, recovery/staging spaces would be required to operate PM peak service—up to three spaces by 2036. The Downtown Bus Interchange Concept Design report shows these recovery spaces on the north side of Customs Street West just west of Lower Albert Street; however, there are some concerns regarding geometry at this location. This could be partially alleviated by starting some Northern Express (NEX 1) services at Victoria Park for the trip to the North Shore.
The Birkenhead and Glenfield Road services are anticipated to reach a peak volume of 24 buses per hour by 2036, and thus could be accommodated through that time in the triple stop provided (which will accommodate up to 25 buses per hour). However, the addition of the Freemans Bay service will put this stop over capacity during the peak by 2036.
2.1.3 Issues and Opportunities Issue #1: Britomart East will reach capacity at the Mt Eden Road (Galway Street) stop by 2026, and the Tamaki Drive (Tyler Street) stop by 2036.
Issue #2: The large number of terminating buses at Britomart West will not improve with the implementation of CRL (as currently proposed). Britomart West serves the city’s two major non-rail corridors, the North Shore and the North West, which are also two of Auckland’s fastest growing areas. Both patronage and bus volumes can thus be expected to continue to increase.
Issue #3: The Freemans Bay route is included in the service pattern—and at the stop locations—of the North Shore services. The inclusion of this route at this stop location degrades system legibility as well as contributes to the North Shore group exceeding its terminal capacity by 2036.
Issue #4: The proposed Britomart Terminal was designed assuming some flexibility that does not exist. For example, assumptions were made that recovery times could be reduced below five minutes during the peak periods, but this is contrary to PTOM contracts. Thus additional recovery space will be needed than what is planned.
Under Peer Review

D R A F T
Auckland Transport Bus Reference Case
Page 12 Bus Reference Case (Second Revision)
Issue #5: Stop legibility for west/northwest services could be improved. In the near term, four route groups would be consolidated into three stops: Northwest Motorway services, West Auckland expresses, Great North Road service and Richmond Road services. While the West Auckland expresses will be eliminated upon delivery of CRL, the West Express will likely require two of the stops.
Issue #6: No easy siting for Northern Express recovery spaces. The Lower Hobson Street viaduct prevents the use of the west side of Lower Hobson Street, while space constraints and need to provide a westbound travel lane (for the west/northwest group) on the lower level of Customs Street West limit the ability to provide space on that street. In addition, the Copthorne Hotel prevents the use of Quay Street for layover space.
Issue #7: The proposed turnaround loop for west/northwest services is not possible with today’s street network. If a proposed two-way (bus only) roadway is constructed on the lower level of Customs Street West, this alignment will be physically possible; however, the right turn onto Lower Hobson Street will have the potential to disrupt inbound service from the North Shore.
2.2 Wellesley Street and the Learning Quarter Terminal The Wellesley Street corridor crosses the Auckland City Centre at midtown, spanning between two proposed termini at Learning Quarter and Wynyard Quarter. This section summarises the Wellesley Street corridor and Learning Quarter Terminal; a subsequent section addresses the unique concerns regarding the Fanshawe Street end of the corridor (and associated transfer point) and the Wynyard Quarter terminal.
2.2.1 Corridor Description The Wellesley Street corridor is the City Centre’s busiest bus corridor under the New Network, providing direct, frequent, high capacity service with passenger distribution spanning from the University (Learning Quarter), through Midtown and Victoria Quarter to Victoria Park and Wynyard Quarter. This corridor is projected to carry significant volumes of buses, particularly during the peak periods, with major Isthmus bus routes traveling to/from a new terminus at Wynyard Quarter, North Shore services (including the Northern Express) traveling across midtown to a new terminus at the Learning Quarter, and additional Link and crosstown service between suburbs to the east and west of the City Centre.
Bus capacities included in this document for the Wellesley Street Corridor refer to the segment of Wellesley Street between Halsey Street (at Victoria Park) and Symonds Street. Some service options or alternative terminal configurations may reduce the ‘common segment’ of the corridor to the segment between Hobson Street and Princes Street.
2.2.2 Running Way Infrastructure and Service Groups Wellesley Street will carry Buses from the North Shore and Isthmus, as well as the proposed “Crosstown 4” (Manukau Road – Jervois Road via Parnell). These groups can be broken down as follows:
North Shore: NEX 2 Northern Busway to University, East Coast Road/Takapuna to University, Takapuna/Hillcrest to University, and North Shore (Hibiscus Coast, Belmont, Birkenhead/Glenfield) peak expresses Isthmus: Central Isthmus Corridors (New North, Sandringham and Dominion Roads) and South and East (Remuera Road, Abbott’s Way, Gillies Avenue, Mangere to City) Crosstown Services: Crosstown 4 (Manukau Road – Parnell – Jervois Road), Manukau Road short runners, Pt Chevalier to University peak service
In the eastbound direction, buses would be grouped according to those terminating at the Learning Quarter (North Shore buses), those continuing to Isthmus destinations via Symonds Street (Isthmus buses), and those traveling via Parnell (Crosstown 4). In the westbound direction, buses
Under Peer Review
D R A F T
Auckland Transport Bus Reference Case
Page 13 Bus Reference Case (Second Revision)
would be grouped according to those travelling to the North Shore, those terminating at Wynyard Quarter (Isthmus buses), and those continuing up College Hill to Jervois Road (Crosstown 4). Thus the three groups cited above would hold true for both directions in this corridor.
Note that despite recent decisions to operate outbound Isthmus bus services on Victoria Street rather than Wellesley Street upon implementation of the New Network, this document continues to assume that all service will be on Wellesley Street in both directions. Appendix D outlines volumes and issues with the Victoria Street scenario. In this Victoria Street scenario, the eastbound Isthmus route group would be moved to Victoria Street, with all North Shore and Crosstown services and westbound Isthmus services remaining on Wellesley Street.
Bus stops would be designed to provide easy connections between services and to communicate common destinations, such as the University, Auckland Hospital and Wynyard Quarter. This is especially important near Albert Street where the core services of heavy rail (Aotea Station) and Albert Street bus services overlap.
Upon implementation of the New Network, Wellesley Street will carry 55 buses per hour in each direction throughout the day, with a peak volume of 105 buses per hour westbound in the morning and eastbound in the evening (primarily Isthmus services), and 110 buses eastbound in the morning and westbound in the evening (primarily North Shore services). These volumes are projected to grow to 136 and 120, respectively, by 2036.
To accommodate the projected 2018 bus volumes, Wellesley Street would require bus lanes in each direction, with two triple indented stops and one single indented stop at each stop location (e.g., Aotea and Victoria Quarter). However, while this stop configuration would accommodate the projected volumes, it does not account for the requisite route groupings (based on corridors/destinations served).
Wellesley Street is complicated by the fact that it has three distinct route groupings: North Shore services, Isthmus services and Crosstown services. Crosstown service volumes are generally consistent throughout the day, and could be accommodated in a single stop. The North Shore and Isthmus services, on the other hand, not only vary greatly in number between peak and all-day service, but also operate in opposing directions, with peak Isthmus service travelling westbound in the morning and eastbound in the afternoon, but peak North Shore service travelling eastbound in the morning and westbound in the afternoon. This results in similar volumes in each direction during both peaks, but complications regarding stop legibility.
Given the anticipated 2018 bus volumes, the Isthmus group would require a triple stop and a double stop at the outset of the New Network in order to accommodate anticipated peak service volumes. This could be most closely achieved if the Crosstown group were incorporated into the Isthmus group, and a pair of triple stops were provided to accommodate the two groups. In the off-peak direction, the Isthmus volumes could be accommodated in a triple stop (double stop in the near term), while Crosstown volumes could be accommodated in a single stop (growing to a double stop during the peak periods by 2036).
The North Shore route group, for which the peak direction is opposite that of the Isthmus Group, would require a double stop and a triple stop—the Northern Express, Takapuna and Hillcrest services could share a triple stop, with the North Shore Peak Expresses group utilising a double stop that would only need to be provided in the eastbound direction during the morning peak, and in the westbound direction during the afternoon peak.
Under Peer Review

D R A F T
Auckland Transport Bus Reference Case
Page 14 Bus Reference Case (Second Revision)
Thus, the overall bus volumes on the Wellesley Street corridor would require the following stops in each direction:
Triple stop to accommodate (most) Isthmus service; Triple stop to accommodate Crosstown service and remainder of Isthmus service (could be reduced to a double stop outside of the peak period/direction); Triple stop to accommodate the Northern Express, Takapuna and Hillcrest services (could be reduced to a double stop outside of the peak period/direction); Double stop to accommodate North Shore Peak Express services (only required during the peak period/direction).
Note that with the stop dimensions prescribed by AT, double stops are the maximum that can be provided on Wellesley Street, given the short block lengths through Midtown. Some compromise regarding these dimensions would be required in order to provide triple stops.
Table 8 below shows expected bus volumes in the Wellesley Street corridor in 2018, 2026 and 2036. It is important to note that projections show modest growth in all-day service levels, but moderate growth of peak volumes, particularly from the North Shore. Accommodation of future growth, particularly during the peak periods, will require the allocation of additional kerb space for buses—this may conflict with the need to provide convenient and legible transfers at locations such as Aotea Station, as well as may contribute to less desirable outcomes, such as bus stops along the entire kerb frontage of Wellesley Street from the University to Victoria Park.
Table 8: Wellesley Street Corridor Bus Volumes Service Grouping 2018 2026 2036AM Eastbound / PM WestboundNEX 2 30 30 30Takapuna and Hillcrest to University 14 18 18North Shore Peak Expresses 25 28 36Isthmus 32 32 34Crosstown 4 and Pt Chevalier 9 14 18TOTAL 110 122 136AM Westbound / PM EastboundNEX 2 8 10 10Takapuna and Hillcrest to University 9 12 12North Shore Peak Expresses - - -Isthmus 76 67 78Crosstown 4 and Pt Chevalier 12 16 20TOTAL 105 105 120All-DayNEX 2 8 10 10Takapuna and Hillcrest to University 9 12 12North Shore Peak Expresses - - -Isthmus 32 32 34Crosstown 4 and Pt Chevalier 6 8 10TOTAL 55 62 66
Note: New North Road is not included in the Isthmus group for 2026 or 2036, as it is assumed to be realigned to Newmarket (rather than Wynyard) following implementation of CRL.
2.2.3 Aotea Transfer Point While designing the Wellesley Street corridor, it is important to consider the intent of the New Network—to provide frequent, all day service in key corridors—and how Wellesley Street will function within that context. Wellesley Street bus services will provide a critical component of passenger circulation within the City Centre—it will not only provide distribution for passengers
Under Peer Review

D R A F T
Auckland Transport Bus Reference Case
Page 15 Bus Reference Case (Second Revision)
traveling from Isthmus and North Shore bus routes to the City, but will also provide a transfer point between those services and the Albert Street bus services to the West and Northwest, and the City Rail Link at Aotea Station.
Aotea Station will be where heavy rail passengers transfer between rail and bus to access Wynyard or the University, thus legibility is important for this transfer location. In addition, passengers entering the city via bus service on Albert Street would also transfer at Aotea for bus service on Wellesley Street. Thus the following considerations would need to be made:
University- and Wynyard-bound stops should be located right in front of the station entrance in order to facilitate transfers between rail and bus to reach City Centre destinations to the east and west. Bus to bus connections should be facilitated for similar reasons, particularly between the Albert Street corridor (Northwestern Busway) and the Wellesley Street corridor (Wynyard, University). In order to provide access and transfers between the multitude of transit services in this area pedestrian improvements including wider footpaths, shorter intersection crossings and improved signal timing will be required.
2.2.4 Learning Quarter Terminal The Learning Quarter Terminal will predominately be built for North Shore services terminating in the University precinct, including the NEX 2 (Northern Busway to University), East Coast Road/Takapuna and Hillcrest to University services, and North Shore peak express services. In addition, Crosstown 4 will travel through the Learning Quarter connecting the Wellesley Street corridor with Parnell and short runs from Pt Chevalier will terminate there. Table 9 following shows the routes terminating at or travelling through the Learning Quarter in 2018, 2026 and 2036. While connections will need to be available between Symonds Street services, this table shows only those services terminating in the precinct or travelling through on Wellesley Street, and not those routes using Symonds Street.
Table 9: Learning Quarter Terminal Bus Volumes (Lower Level)Service Grouping 2018 2026 2036(PM) PeakNEX 2 30 30 30Takapuna and Hillcrest to University 14 18 18North Shore Peak Expresses 25 28 36Pt Chevalier to University 3 6 8Isthmus and Crosstown 4 (through)* 12 16 20TOTAL (terminating) 72 82 92All dayNEX 2 8 10 10Takapuna and Hillcrest to University 9 12 12North Shore Peak Expresses - - -Pt Chevalier to University - - -Isthmus and Crosstown 4 (through) 6 8 10TOTAL (terminating) 17 22 22
*Peak direction for the Isthmus and Crosstown 4 route groups (AM westbound; PM eastbound) is opposite from the North Shore and Pt Chevalier to University route groups (AM eastbound; PM westbound). All-day volumes would operate in the counter-peak direction. These buses do not terminate at the Learning Quarter.
For this terminal, it is likely that the actual terminal (turnaround, recovery) would need to be separated from the first/last stop functions. The stops would ideally be located along Wellesley Street adjacent to the University, with pedestrian infrastructure optimised to provide transfers between Wellesley Street services and Symonds Street services.
Under Peer Review
D R A F T
Auckland Transport Bus Reference Case
Page 16 Bus Reference Case (Second Revision)
All services travelling between the Wellesley Street corridor and Parnell, and all services terminating at the Learning Quarter are assumed to travel underneath Symonds Street on Wellesley Street.
The projected volumes would require the following stop configurations:
Westbound:
A triple stop for North Shore services, growing to a quad stop or two double stops (one for NEX, one for other) services in the long-term; andA single stop for Crosstown 4 service, as well as Manukau Road and Pt Chevalier to University short runners.
Eastbound:
A double set-down space for North Shore services, for which this would be the last stop; and A single stop for Crosstown 4 service, as well as Manukau Road and Pt Chevalier to University short runners.
Due to issues regarding space, street network and steep grades, the turnaround and recovery functions may require construction of a separate facility along Wellesley Street near the SH-16Motorway (likely on a platform), or at a location TBD within Grafton Gully. In the near term, approximately six spaces would be required to accommodate recovery/staging for North Shore and Pt Chevalier-bound services during the PM peak—this requirement would grow to approximately nine spaces in the long term.
Facility size is a concern for the Learning Quarter, which does not currently have an easy space to locate such a facility. All day bus volumes are low, and could be accommodated via the first/laststop configurations cited above, with recovery taking place in the stops, given volumes projected through 2036. During the morning peak period, few buses would need to take recovery at this facility, as most would be dropping off passengers and returning to the North Shore via the Motorway, either to the depot or to bring an additional load of passengers into the City Centre.Thus the primary need for this facility is to accommodate staging for North Shore services during the PM peak period. The other 21 or so hours of the day, the facility would be underutilised or empty.
Through running of Isthmus services could potentially reduce the total number of services originating at the Learning Quarter during the PM peak, and thus somewhat reduce the required terminal facility footprint.
2.2.5 Issues and Opportunities Issue #1: Proposed peak period bus volumes exceed what can be accommodated upon implementation of the New Network in 2018, and are anticipated to continue to grow. Volumes will increase particularly on services to/from the North Shore, but also on Isthmus services. Growth in this corridor cannot be accommodated without compromising system legibility or desired urban outcomes.
Issue #2: Under the New Network, Wellesley Street will have uneven volumes between the AM and PM peak periods, which require larger stops for North Shore services and smaller stops for Isthmus services for one peak period in each direction, but larger stops for Isthmus services and smaller stops for North Shore services during the other peak period and in the other direction.
Issue #3: Peak vs. all-day volumes mean that a large terminal facility is required at the Learning Quarter for staging during the PM peak period, but a much smaller facility (e.g., three spaces) is required to accommodate all-day service. This means that if a large facility is constructed, it will not be used throughout most of the day.
Under Peer Review

D R A F T
Auckland Transport Bus Reference Case
Page 17 Bus Reference Case (Second Revision)
Issue #4: Unclear siting for the Learning Quarter terminal facility.
Issue #5: Due to the large potential of transfers to bus services on Wellesley Street following implementation of the New Network, particularly at Aotea Square and the Learning Quarter, it is important that routes are grouped in a logical manner in order to facilitate transfers and maximise access for all passengers.
Issue #6: This assumes the relocation of New North Road service in the post-CRL network to serve Newmarket instead of the City Centre. If this relocation were not to be implemented (i.e., if direct access to the City Centre were to be maintained for the New North Road route) then the bus volumes would increase along Wellesley Street.
Under Peer Review

D R A F T
Auckland Transport Bus Reference Case
Page 18 Bus Reference Case (Second Revision)
2.3 Fanshawe Street and Wynyard Quarter Terminal Fanshawe Street is the main point of entry to the City Centre from the North Shore, providing direct access to the Harbour Bridge and Northern Motorway (SH-1). As such, nearly all service from the North Shore utilises Fanshawe Street. Services between the western City Fringe and Britomart or Wynyard Quarter that use College Hill (e.g., the Inner Link and Mt Eden Crosstown service) also have the option of utilising Fanshawe Street. In addition, Isthmus bus services travelling along Wellesley Street must cross—or use a short segment of—Fanshawe Street at Victoria Park, in order to access their proposed terminal in Wynyard Quarter. This by default creates a transfer point at Victoria Park, where North Shore, Isthmus and Link/Crosstown services intersect.
2.3.1 Fanshawe Street (Victoria Park) Transfer Point As noted above, several bus service groups intersect at Fanshawe Street adjacent to Victoria Park: all service from the North Shore to Britomart and the University, as well as Isthmus services that use Wellesley Street and terminate at Wynyard Quarter, and several Link and Crosstown services (City Link, Inner Link and Crosstown 5 services). It is important to distinguish this transfer pointfrom the Wynyard Quarter terminal, as transfers between services would take place on Fanshawe Street (and potentially adjacent Streets) at Victoria Park, whereas bus layover/recovery, staging and turnaround functions would take place at the Wynyard Quarter Terminal, within the Quarter to the north.
The transfer point at Victoria Park would serve a few different functions:
Connect North Shore passengers with access farther into Wynyard Quarter via Isthmus (Wellesley corridor) services; and Connect (primarily) North Shore passengers with service to access other parts of the City—can connect to services to Britomart, Parnell, Midtown/University, Hospital/Newmarket, Ponsonby and Karangahape Road.
With the streamlining of service and elimination of many “special market” peak express routes upon implementation of the New Network, this transfer point will become more important, and should be designed to maximise the ease with which passengers can connect between services.
The Fanshawe Street transfer point at Victoria Park will require upwards of 12 bays in either direction to accommodate 2018 volumes (not accounting for growth, not including the Link services, and assuming some flexibility of use between morning and afternoon peak periods) if all of these route groups are to stop on Fanshawe Street—this is equivalent to the entire block face between Halsey and Daldy Streets. While this would potentially work on the south side of the street, adjacent to the park, the northern kerb is interrupted by numerous driveways.
The stop groups at the Fanshawe Street/Victoria Park transfer point include:
Eastbound:
Britomart-bound service (NEX 1, Glenfield Road and Birkenhead) – 47 buses per hour during the morning peak, requiring a triple stop. University-bound service (NEX 2, Hibiscus Coast, East Coast Road/Takapuna and Hillcrest, and peak only services) – 69 buses per hour during the morning peak, requiring a quadruple stop.Isthmus services (Dominion and Sandringham and New North Roads, Remuera Road, Gillies Avenue, Mangere to City) – 76 buses per hour during the afternoon peak, requiring a pentuple stop. This pentuple stop could be divided further into two stops (one double and one triple),one for services utilising Upper Symonds Street, and one for services travelling via Auckland Hospital and Newmarket. In order to maximise the use of space, these stops could be shared with the peak period, peak direction North Shore services, as the two groups would see maximum volumes during opposing peak periods.
Under Peer Review

D R A F T
Auckland Transport Bus Reference Case
Page 19 Bus Reference Case (Second Revision)
These volumes will decline upon implementation of CRL, which would see New North Road service re-routed to Newmarket. Link services (City Link, Inner Link, and Crosstown 5) – the City Link will require single stops, as will the Inner Link. Crosstown 5 is assumed to utilise the Wynyard Quarter terminal, but preliminary network maps show it crossing Fanshawe Street on Beaumont Street, so it is not factored into the required stop infrastructure here.
Westbound:
Northern Express (NEX 1 and 2) services – 60 buses per hour during the PM peak, requiring a quadruple stop. Other North Shore services – 56 buses per hour during the PM peak in 2018, requiring a quadruple stop at minimum. However, it would be most logical to divide this stop into two stops: one for services to East Coast Bays/Takapuna, and one for services to Birkenhead/Glenfield. Isthmus services to Wynyard Quarter – 76 buses during the morning peak period. As these services would be terminating at Wynyard and thus passengers would primarily be alighting, these services should be able to be accommodated with a quadruple bay. Link Services (City and Inner Links, Crosstown 5) – the Link and Crosstown services would require two stops—with the City Link terminating at Wynyard Quarter, its stop could be located away from the main transfer point if space is not available. The Inner Link and Mt Eden Crosstown (Crosstown 5) services should share a stop (particularly important in the direction toward Ponsonby).
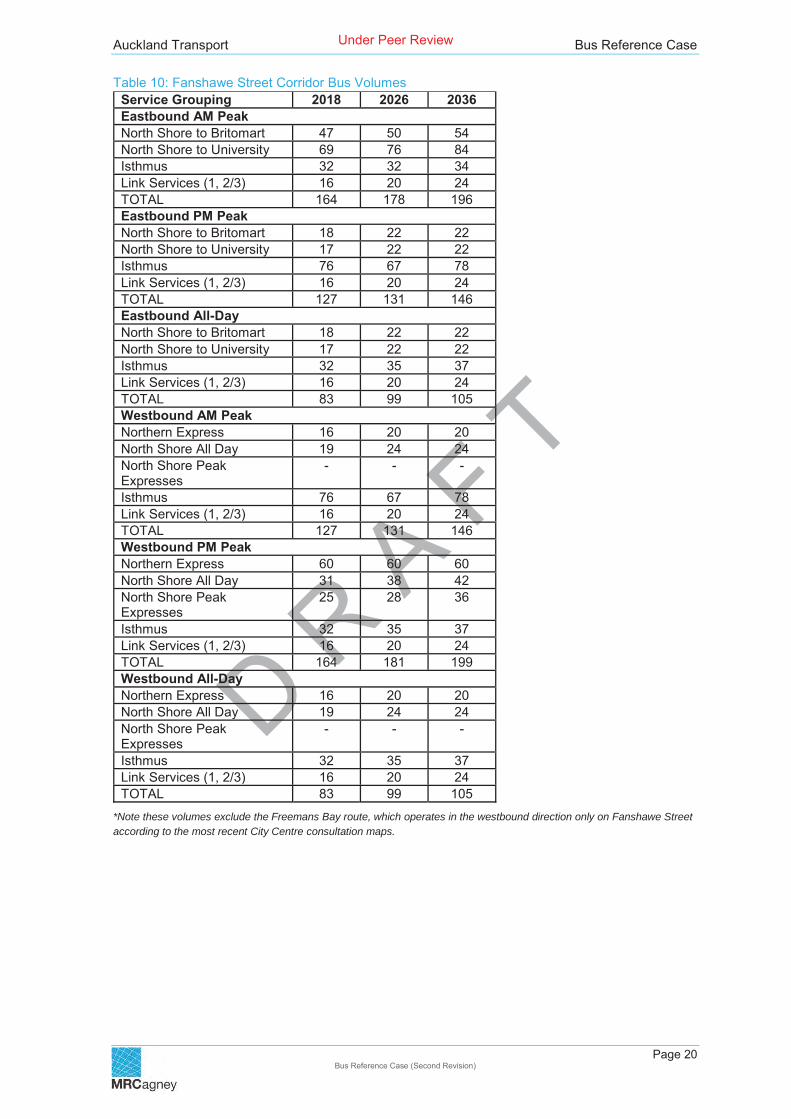
Table 10 below shows expected bus volumes on Fanshawe Street at Victoria Park in 2018, 2026 and 2036. These volumes refer to the total number of buses projected to pass through the Victoria Park Transfer Point on any corridor, with initial assumptions that most if not all would travel (and likely stop) on the block between Halsey and Daldy Streets. Precise alignments will be determined in AT’s upcoming Fanshawe Street/Wynyard Quarter Study, and will likely impact these volumes.
Under Peer Review
D R A F T
Auckland Transport Bus Reference Case
Page 20 Bus Reference Case (Second Revision)
Table 10: Fanshawe Street Corridor Bus Volumes Service Grouping 2018 2026 2036Eastbound AM PeakNorth Shore to Britomart 47 50 54North Shore to University 69 76 84Isthmus 32 32 34Link Services (1, 2/3) 16 20 24TOTAL 164 178 196Eastbound PM PeakNorth Shore to Britomart 18 22 22North Shore to University 17 22 22Isthmus 76 67 78Link Services (1, 2/3) 16 20 24TOTAL 127 131 146Eastbound All-DayNorth Shore to Britomart 18 22 22North Shore to University 17 22 22Isthmus 32 35 37Link Services (1, 2/3) 16 20 24TOTAL 83 99 105Westbound AM PeakNorthern Express 16 20 20North Shore All Day 19 24 24North Shore Peak Expresses
- - -
Isthmus 76 67 78Link Services (1, 2/3) 16 20 24TOTAL 127 131 146Westbound PM PeakNorthern Express 60 60 60North Shore All Day 31 38 42North Shore Peak Expresses
25 28 36
Isthmus 32 35 37Link Services (1, 2/3) 16 20 24TOTAL 164 181 199Westbound All-DayNorthern Express 16 20 20North Shore All Day 19 24 24North Shore PeakExpresses
- - -
Isthmus 32 35 37Link Services (1, 2/3) 16 20 24TOTAL 83 99 105
*Note these volumes exclude the Freemans Bay route, which operates in the westbound direction only on Fanshawe Street according to the most recent City Centre consultation maps.
Under Peer Review
D R A F T
Auckland Transport Bus Reference Case
Page 21 Bus Reference Case (Second Revision)
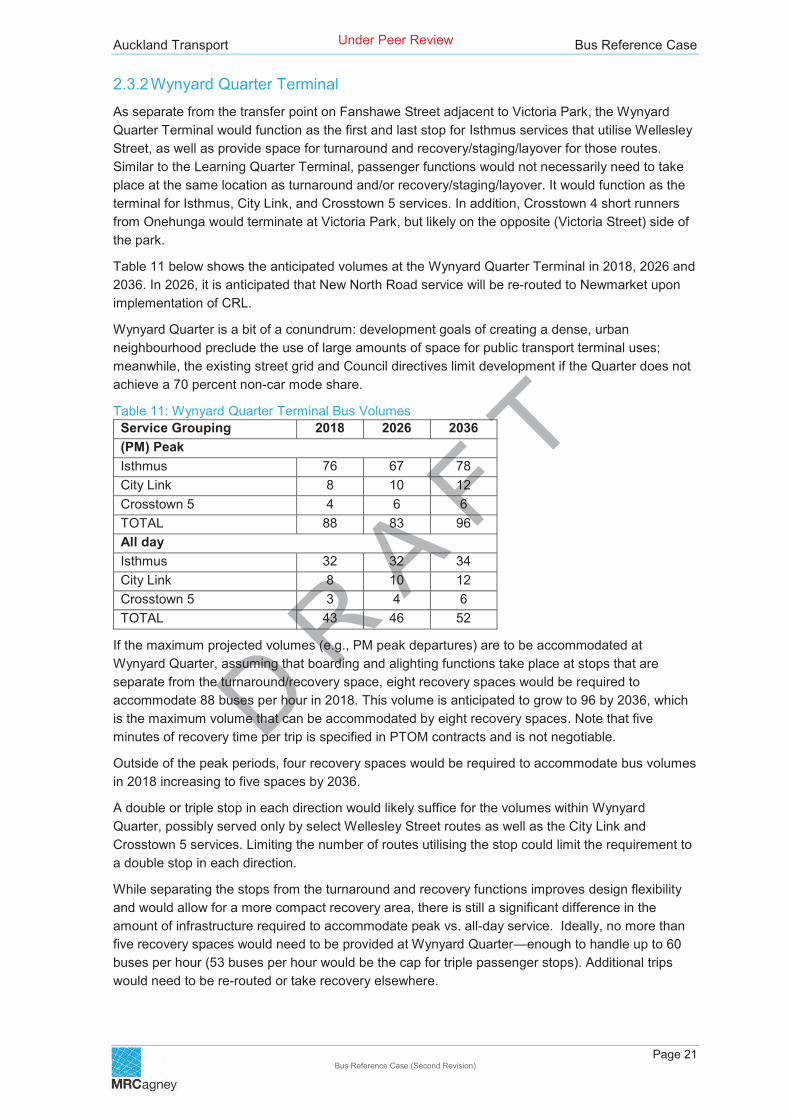
2.3.2 Wynyard Quarter Terminal As separate from the transfer point on Fanshawe Street adjacent to Victoria Park, the Wynyard Quarter Terminal would function as the first and last stop for Isthmus services that utilise Wellesley Street, as well as provide space for turnaround and recovery/staging/layover for those routes. Similar to the Learning Quarter Terminal, passenger functions would not necessarily need to take place at the same location as turnaround and/or recovery/staging/layover. It would function as the terminal for Isthmus, City Link, and Crosstown 5 services. In addition, Crosstown 4 short runners from Onehunga would terminate at Victoria Park, but likely on the opposite (Victoria Street) side of the park.
Table 11 below shows the anticipated volumes at the Wynyard Quarter Terminal in 2018, 2026 and 2036. In 2026, it is anticipated that New North Road service will be re-routed to Newmarket upon implementation of CRL.
Wynyard Quarter is a bit of a conundrum: development goals of creating a dense, urban neighbourhood preclude the use of large amounts of space for public transport terminal uses; meanwhile, the existing street grid and Council directives limit development if the Quarter does not achieve a 70 percent non-car mode share.
Table 11: Wynyard Quarter Terminal Bus VolumesService Grouping 2018 2026 2036(PM) PeakIsthmus 76 67 78City Link 8 10 12Crosstown 5 4 6 6TOTAL 88 83 96All dayIsthmus 32 32 34City Link 8 10 12Crosstown 5 3 4 6TOTAL 43 46 52
If the maximum projected volumes (e.g., PM peak departures) are to be accommodated at Wynyard Quarter, assuming that boarding and alighting functions take place at stops that are separate from the turnaround/recovery space, eight recovery spaces would be required to accommodate 88 buses per hour in 2018. This volume is anticipated to grow to 96 by 2036, which is the maximum volume that can be accommodated by eight recovery spaces. Note that five minutes of recovery time per trip is specified in PTOM contracts and is not negotiable.
Outside of the peak periods, four recovery spaces would be required to accommodate bus volumes in 2018 increasing to five spaces by 2036.
A double or triple stop in each direction would likely suffice for the volumes within WynyardQuarter, possibly served only by select Wellesley Street routes as well as the City Link and Crosstown 5 services. Limiting the number of routes utilising the stop could limit the requirement to a double stop in each direction.
While separating the stops from the turnaround and recovery functions improves design flexibility and would allow for a more compact recovery area, there is still a significant difference in the amount of infrastructure required to accommodate peak vs. all-day service. Ideally, no more than five recovery spaces would need to be provided at Wynyard Quarter—enough to handle up to 60 buses per hour (53 buses per hour would be the cap for triple passenger stops). Additional trips would need to be re-routed or take recovery elsewhere.
Under Peer Review

D R A F T
Auckland Transport Bus Reference Case
Page 22 Bus Reference Case (Second Revision)
2.3.3 Issues and Opportunities Issue #1: The volume of buses proposed to terminate and originate at Wynyard Quarter during the peak periods exceeds the amount needed to serve the internal requirements of the Quarter and may compromise urban amenity and require a large footprint facility.
Issue #2: Bus volumes exceed available space for a transfer point at Victoria Park if all stops are to be accommodated on Fanshawe Street. Stops on adjacent streets likely will require consideration.
Issue #3: North Shore bus volumes are quite high upon implementation of the New Network in 2018, and are projected to continue growing through 2036. These volumes will become increasingly difficult to accommodate in the City Centre, resulting in very long stops along Fanshawe Street that complicate passenger transfers between services at Victoria Park. Some of this may be mitigated by originating some NEX service at Victoria Park in the PM peak, reducing the number of NEX buses stopping at the park and ensuring that boarding passengers will indeed fit on the vehicle.
Issue #4: Wynyard Quarter is expected to achieve a 70 percent (minimum) non-car mode share in order for planned development to continue. Despite this requirement, developers and stakeholders generally find large volumes of buses to be “unacceptable”, and resist accommodating public transport. This may be mitigated by staging some PM peak (extra) service in Victoria Quarter and beginning some trips at Aotea Station, allowing for lower volumes to originate from Wynyard Quarter.
Issue #5: This assumes the relocation of New North Road service in the post-CRL network to serve Newmarket instead of the City Centre. If this relocation were not to be implemented (i.e., if direct access to the City Centre were to be maintained for the New North Road route) then the Wynyard Quarter Terminal would need to accommodate the additional service.
Under Peer Review
D R A F T
Auckland Transport Bus Reference Case
Page 23 Bus Reference Case (Second Revision)
2.4 Albert StreetAlbert Street is the main corridor for bus service from the west into the City Centre. With the New Network, all service on Albert Street will terminate at Britomart West. In addition, following implementation of CRL, rail service will travel under Albert Street with stations at Karangahape Road, Aotea and Britomart.
The bus volumes included in this section refer to the entirety of Albert Street, from Customs Street West to Mayoral Drive. Slightly lower volumes would exist on Vincent Street as express services are expected to access the motorway via Cook Street, though they may still run on Vincent St, albeit non-stop.
2.4.1 Running Way Infrastructure and Service Groups Plans for Albert Street preclude much flexibility in the running way for this corridor—essentially, Albert Street will be equipped with a bus lane and a general travel lane in each direction, and due to a narrow street profile, in-line bus stops. This means that all buses will use the same stops (in each direction), regardless of route group. In the inbound direction, this is not a problem—all buses terminate at Britomart West anyway. However, in the outbound direction, this could complicate the boarding process somewhat for passengers.
Table 12 shows the route groupings and expected volumes for the Albert Street corridor in 2018, 2026 and 2036. Outbound route groups include the following:
Northwest Express service (future Northwestern Busway WEX service), connecting the City Centre with Westgate, Massey, Te Atatu and Henderson. This service is expected to grow rapidly (from 26 buses per hour in 2018 to 58 buses per hour in 2036), as the area of West Auckland that it serves is anticipated to grow by 120,000 people over the next few decades. If accommodated separately, this service would require a double stop in the near term, growing to a quadruple stop in the long-term. Great North Road local service enters the City Centre via Karangahape Road and Albert Street. This major corridor will be upgraded to double decker buses in order to accommodate patronage growth, and could be accommodated by a single stop. West Auckland Expresses – currently, services from Blockhouse Bay, Green Bay, Titirangi and Glen Eden operate all the way into the City Centre. These will be discontinued with implementation of CRL, and passengers will transfer at Glen Eden, New Lynn and Avondale Stations to reach the City Centre. Richmond Road services use Albert Street, providing a connection between the City Centre and suburban fringe to the west. These services could be accommodated by a single stop, or could share a stop with the Great North Road service.
Note that the above are route groups/stop size requirements for locations where separate stops are possible. The proposed post-CRL cross-section of Albert Street is anticipated to only allow for in-line stops, meaning all routes/groups would have to stop at the same locations.
In addition, note that the West and Northwest express services utilise two different alignments to access the City Centre: routes denoted with an “x”, including 125x from Westgate, 132x from Te Atatu, 133x from Henderson, 151x from Glen Eden, 171x/172x from Titirangi and the proposed service from Red Hills utilise the Northwest Motorway to the Nelson Street exit, then access Albert Street via Cook Street. Other services between the City Centre and the West and Northwest, including Routes 110 from Westgate, 129 from Massey West, 132 from Te Atatu, 133 and 134 from Henderson, 195 from Blockhouse Bay and 209 from Green Bay utilise Great North Road, Karangahape Road, Pitt Street and Vincent Street to access Albert Street.
Under Peer Review

D R A F T
Auckland Transport Bus Reference Case
Page 24 Bus Reference Case (Second Revision)
Table 12: Albert Street Corridor Bus VolumesService Grouping 2018 2026 2036PeakNorthwest Expresses (WEX) 26 44 58Great North Road 12 12 12West Auckland Expresses 15 - -Richmond Road 6 6 8TOTAL 59 62 78All-DayNorthwest Expresses (WEX) 6 8 12Great North Road 6 6 8West Auckland Expresses 2 - -Richmond Road 3 4 6TOTAL 17 18 26
*Note these volumes exclude the Freemans Bay route, which operates in the northbound direction only according to the most recent City Centre consultation maps.
With in-line stops, it is not recommended that volumes exceed 53 buses per hour at any time, the maximum that can be accommodated with triple stops. This is because the passenger experience is degraded with longer stops serving multiple route groups, as people must determine when their bus is arriving (it might be the third or fourth bus in line), and then move to the correct bus to board. Albert Street will have already reached this volume upon implementation of the New Network in 2018. Thus effort must be undertaken to avoid increases in service in this corridor.
It is also worth noting that the Albert Street corridor extends south to Karangahape Road via Mayoral Drive, Vincent Street and Pitt Street. Bus improvements are planned for Pitt Street in order to accommodate transfers between buses and the Karangahape Road Rail Station (to be constructed as a part of CRL) at Pitt Street and Beresford Square. Triple stops would be required to accommodate the Albert Street buses, as well as an additional single southbound stop for the City Link. However, the volumes on Vincent and Pitt Streets are somewhat lower than on Albert Street, as many of the West and Northwest Express services will utilise the Northwest Motorway between West Auckland and the Nelson Street/Hobson Street exit/entrance ramps. Thus these express services (those denoted by an “x” in the route number) are assumed not to use Pitt Street, Vincent Street or Karangahape Road (today, some of these services do, and others don’t, at the discretion of the operator).
In addition, with an increasing density of residential development and businesses in the southern portion of the CBD, a set of stops would be desirable on Vincent Street, in the upper half of the street closer to Pitt Street. These stops would require some re-configuring of the street, which also include bicycle lanes and on-street parking. It may be necessary to provide clearways during the peak period. While boarding and alighting volumes will likely be lower at the Vincent Street stops than on Pitt Street, the improved legibility of the New Network will likely increase the use of the Albert Street buses for shorter trips.
2.4.2 Realignment of West Express Services with Delivery of CRL Note: the West Auckland Expresses group (Blockhouse Bay, Green Bay, Titirangi and Glen Eden) is eliminated from the City Centre and re-aligned to provide connections to the rail network following implementation of CRL for several reasons:
Prior to implementation of CRL, rail access from these areas to the City is slow and circuitous, and only provides access to the downtown portion of the City Centre. With CRL, transferring from bus to rail at New Lynn, Glen Eden or Avondale results in faster trip times than riding the bus all the way into the City, and new stations will provide direct access to the midtown and uptown areas of the City Centre as well.
Under Peer Review

D R A F T
Auckland Transport Bus Reference Case
Page 25 Bus Reference Case (Second Revision)
Operating these services between their local catchments and the nearest rail station allows for fewer resources to be used to provide more frequent service in the suburban catchment areas of these routes (e.g., frequent shuttles to the nearest rail station rather than infrequent bus service to the City). More frequent service on both the bus routes and the Western Rail Line mean connections between services will be short. Limited capacity on Albert Street coupled with high expected growth in the Northwest means that there will not be space to continue operating these services into the City Centre. Priority on Albert Street would go to high capacity buses to/from the Northwest (e.g., services on the proposed Northwestern Busway), where there is limited opportunity to connect to rail, and such connections result in longer, rather than shorter, travel times. Connections can be made at New Lynn or Avondale to Great North Road bus service.
2.4.3 Issues and OpportunitiesIssue #1: The proposed street profile on Albert Street (CRL Enabling Works – Public Realm Reference Design, April 2015) is designed for bus lanes with in-line stops, which will make it impossible to group stops (skip-stops cannot be used, as buses will not be able to pass one another). Thus, if stop lengths exceed triple stops, it becomes difficult for passengers to get to the correct bus—quadruple stops would mean some passengers would have to run 50+ metres to catch the correct bus if standing at the front of the bus stop. Triple stops can accommodate up to 53 buses per hour in each direction, which effectively becomes the ceiling on the volume of buses that can operate in this corridor.
Issue #2: The volumes at the upper (Vincent Street/Pitt Street) end of the corridor are somewhat variable, as it is up to operator discretion as to whether to use the motorway or Vincent and Pitt Streets.
Under Peer Review

D R A F T
Auckland Transport Bus Reference Case
Page 26 Bus Reference Case (Second Revision)
2.5 Symonds Street Symonds Street carries Isthmus and southeast Auckland services to both the Wellesley Street corridor and to Britomart, with stops serving the University. Currently, a large number of buses use Symonds Street during the peak period—bus volumes following implementation of the New Network are expected to be reduced from current volumes on the street presenting an opportunity for improved public realm and walking and cycling access.
Bus volumes in this section refer to Symonds Street between Wellesley Street and Grafton Bridge, the common segment for all New Network routes utilising Symonds Street.
2.5.1 Running Way Infrastructure and Service Groups Service groupings in this corridor would include the following:
Northbound:
Britomart-bound buses would include the Mt Eden Road, Howick to City (AMETI), Papakura to City and Hospitals services. Triple stops would be required to accommodate this route group. Wynyard Quarter-bound buses would include Dominion, Sandringham and Remuera Road Services, Gillies Avenue service, Mangere to City service and, prior to the opening of CRL, New North Road service. Quintuple Stops would be required to accommodate this route group.
Southbound:
South and East via Grafton Bridge and Auckland Hospital – this route group would be comprised of Remuera Road, Howick, Gillies Avenue, Hospitals (south of Grafton Road only), Papakura to City and Mangere to City services and would require triple stops. Central Isthmus via Upper Symonds Street – this route group would be comprised of bus service from New North, Sandringham, Dominion and Mt Eden Roads. New North Road service would be realigned to Newmarket upon completion of CRL. Quadruple bus stops would accommodate this route group; however, this configuration would accommodate very little growth.
Table 13 shows projected bus volumes on Symonds Street in 2018, 2026 and 2036. Transfers would need to be provided at the University between Symonds Street buses and North Shore and Crosstown 4 services on Wellesley Street below (it is assumed that Crosstown 4 would stop with the North Shore services on Wellesley Street, rather than utilising Symonds Street to Grafton Road). Pedestrian facilities and wayfinding need to be provided to facilitate transfers between services at this location. Stops should be sited so that transfers can be made as easily as possible.
At the Learning Quarter, southbound stops for all route groups would need to be located south of Wellesley Street, in order to accommodate buses turning onto/off of Wellesley Street. In the northbound direction, the Britomart-bound route group could stop north of Wellesley Street, while the Wynyard Quarter-bound route group would have to stop south of Wellesley Street.
This corridor has less “peak only” service, and is projected to remain much more stable in bus volumes over time, as most routes in this corridor serve already built-out (less rapidly growing) areas and some services are reduced due to CRL. The infrastructure needs along Symonds Street are more stable over time than in other corridors. Upon implementation of the New Network, busvolumes on Symonds Street will actually be slightly lower than they are with the current network.
Under Peer Review

D R A F T
Auckland Transport Bus Reference Case
Page 27 Bus Reference Case (Second Revision)
Table 13: Symonds Street Corridor Bus Volumes Service Grouping 2018 2026 2036Inbound PeakBritomart East 44 45 45Wynyard Quarter 76 67 78TOTAL 120 112 123Inbound All-DayBritomart East 14 16 16Wynyard Quarter 32 32 34TOTAL 46 48 50Outbound PeakVia Hospital/Newmarket 46 46 51Via Upper Symonds Street 74 66 72TOTAL 120 112 123Outbound All-DayVia Hospital/Newmarket 16 20 22Via Upper Symonds Street 30 28 28TOTAL 46 48 50
Note that the Hospitals route is assumed to utilise Grafton Road, and not Grafton Bridge. Thus it is included in the southern portion of the Symonds Street corridor, but not the northern (busier) portion, and is not included in the above table.
2.5.2 Issues and Opportunities Issue #1: Volumes on Symonds Street south of Wellesley Street exceed the capacity of the corridor at the Wynyard Quarter-bound (northbound) and Upper Symonds Street-bound (southbound) stops.
Issue #2: This assumes the relocation of New North Road service in the post-CRL network to serve Newmarket instead of the City Centre. If this relocation were not to be implemented (i.e., if direct access to the City Centre were to be maintained for the New North Road route) then the bus volumes would increase along Symonds Street.
Under Peer Review

D R A F T
Auckland Transport Bus Reference Case
Page 28 Bus Reference Case (Second Revision)
2.6 Karangahape RoadThe Karangahape Road corridor carries the highest bus volumes west of Pitt Street, where service from Great North Road and West Auckland enters the CBD and connects to Albert Street via Pitt and Vincent Streets. In addition, the Inner Link (Link 2 and 3) and North Shore to Newmarket (NEX 3 and n93) services also use Karangahape Road. This section references bus volumes on Karangahape Road between Pitt Street and Newton Road, the common segment for all services except the City Link. The primary stop location on Karangahape Road will be at the Motorway Overbridge, as the existing stops at Pitt Street will be moved around the corner onto Pitt Street itself to facilitate transfers with rail service at Beresford Square (the proposed location of the Karangahape Road Station entrance).
2.6.1 Running Way Infrastructure and Service Groups The main constraint in this corridor is the Motorway Overbridge bus facility, which has five stops in each direction. In addition, the existing stop at Pitt Street and Karangahape Road is currently at capacity (and will be moved upon the opening of CRL). However, due to constraints on Albert Street, volumes on Karangahape Road are unlikely to increase by much.
Table 14 shows expected bus volumes at the Motorway Overbridge; however, it should be noted that these volumes do not take into account constraints on Albert Street, and thus may not be achievable. This excludes the City Link service, which operates on Karangahape Road, but only between Pitt Street and Queen Street. Route groups on Karangahape Road include the following:
Eastbound:
Service to Newmarket would require a double stop. Service to Britomart West including Great North Road, West and Northwest express service (including southern West Auckland service prior to the completion of CRL) and Richmond Road would require a triple stop. While projected volumes show this requirement increasing, constraints on Albert Street will limit expansion.
Westbound:
Great North Road and Richmond Road services could share a single stop, upgraded to a double stop by 2036. West and Northwest express services would require a double stop—the Northwest express service would be upgraded to WEX (Northwestern Busway service) over time, while the West express services would be discontinued following delivery of CRL. Inner Link and North Shore services would require a double stop.
As stated previously, the West and Northwest express services utilise two different alignments to access the City Centre: routes denoted with an “x”, such as 125x from Westgate, use theNorthwest Motorway to the Nelson Street exit, then access Albert Street via Cook Street, while other services between the City Centre and the West and Northwest, including Route 110 from Westgate, utilise Great North Road, Karangahape Road, Pitt Street and Vincent Street to access Albert Street. AT notes that for the routes accessing Albert Street via the Nelson Street off-ramp, some drivers may opt to operate via Karangahape Road instead, meaning actual bus volumes could exceed those stated in the table.
The Motorway Overbridge is 60 metres long (up to five spaces), and could accommodate all the services noted above (up to about 74 buses per hour in quadruple stops). However, due to street redesign plans such as implementation of a cycleway, these buses would need to stop in line (all at the same stop). Thus it is desirable to limit the total volume of buses (and, more specifically, limit the total number of route groups) along Karangahape Road to triple stops, which can handle up to about 53 buses per hour.
Under Peer Review

D R A F T
Auckland Transport Bus Reference Case
Page 29 Bus Reference Case (Second Revision)
During the peak periods, legibility and customer service will likely be compromised somewhat in order to allow for quadruple in-line stops on the overbridge. This concern is somewhat moderated by the greater relative importance of the Pitt Street stop following the delivery of CRL.
Table 14: Karangahape Road Corridor Bus Volumes at Motorway OverbridgeService Grouping 2018 2026 2036PeakNorthwest Expresses (WEX) 10 16 22Great North Road 12 12 12West Auckland Expresses 7 - -Richmond Road 6 6 8Inner Link 8 10 12North Shore to Newmarket 10 14 18TOTAL 53 58 72All-DayNorthwest Expresses (WEX) 6 8 12Great North Road 6 6 8West Auckland Expresses 2 - -Richmond Road 3 4 6Inner Link 8 10 12North Shore to Newmarket 6 10 12TOTAL 31 38 50
*Note these volumes exclude the Freemans Bay Route, which operates in the eastbound direction only
In addition to carrying a large volume of buses, Karangahape Road will also see heavy rail service upon completion of CRL, with a new station at the intersection of Pitt Street. Bus transfers will likely take place primarily at the Motorway Overbridge between North Shore/Link services and Great North Road/Northwest Express services. Rail transfers will take place at Pitt Street—a full set of bus stops will need to be constructed on Pitt Street outside the rail station entrance. The higher provision of transport access and passenger transfers will require a re-allocation of street space as well as improved pedestrian amenities.
2.6.2 Issues and Opportunities Issue #1: The primary concern on Karangahape Road is the expected volume of buses combined with in-line stops, such as those on Albert Street. A large volume of buses from several different route groups could result in inefficient operations with buses causing delays and getting delayed at stops, poor legibility with all route groups serving a single stop, and poor customer service with customers having to scramble to get to the second or third bus in the stop at busy times. Space will be further constrained with cycle lanes proposed for this corridor.
Issue #2: The Western Express services may run via Karangahape Road, as the exact running pattern between the motorway and the Mayoral Drive stop is at the discretion of the operator. This creates a potential issue on Karanagahape Road, as bus volumes may increase by up to 31 in the peak hour in 2018. While this will should not create an issue with stop capacity (as buses should not stop), it may create issues with the interaction of the inline bus lanes.
Under Peer Review

D R A F T
Auckland Transport Bus Reference Case
Page 30 Bus Reference Case (Second Revision)
3 Assumptions This section summarises some of the key assumptions used for all calculations included in this document. Assumptions were made regarding expected rates of patronage growth throughout the system, as well as vehicle types for use on each route or service, and impacts on the bus network (e.g., route alignments) as a result of implementation of CRL.
It is important to note that the bus volumes included in this document reference only “in-service” vehicles, and do not include deadhead movements, such as buses travelling to or from the depot or repositioning between trips. All peak only volumes have been assumed to operate inbound to CBD in the morning, and outbound in the afternoon, and in the reverse direction these services will operate as repositioning movements.
3.1 Growth Rates Steady growth has occurred throughout Auckland Transport’s Public Transport (PT) network over the past several years as the region has grown in population and overall service has improved, particularly through electrification, service expansion and on-time performance improvements on the rail network, implementation of the Northern Busway, and streamlining of service in many parts of the city. It is anticipated that this growth will continue into the future as Auckland continues to expand in population, as well as in response to the delivery of major PT infrastructure projects and service improvements.
The assumed service frequencies for 2018, 2026 and 2036 for each route were provided by Auckland Transport Network Management and Bus Services. These frequencies were provided based largely on the following principles:
1) As demand for PT service grows, AT will invest in additional double-decker and other higher capacity vehicles in order to accommodate growth wherever possible. The use of higher-capacity vehicles will minimise increases in the number of buses operating to/from the City Centre, and will help to keep operating costs low.
2) The greatest amount of growth in bus patronage is anticipated along the three busway corridors (Northern, Northwestern and AMETI), in part due to anticipated development, and in part due to these areas not being served by the rail network (although much service on the AMETI Busway will terminate at the Panmure Rail Station).
3) Approximately 120,000 new residents are expected to be added to the Northwest Suburbs, resulting in an assumed demand of 4,000 passengers on the Northwestern Busway, west of Te Atatu for the peak two hours by 2026. It is expected that approximately 60 percent, or 2,400 people will need to use the Northwestern Busway service in this segment during the peak hour. This is generally consistent with modelling results for the Northwestern Busway.
Growth percentages have been calculated by keys corridor or route groupings based on the bus volumes and vehicle types provided by Auckland Transport. AT HOP data for a day in March 2015 was used to provide a comparison with the current capacity on key routes. Routes were generally allocated a vehicle capacity of 60 to account for the provision of mixed sizes of buses on many current routes, though on some routes (such as Northern Express) which used a standard bus size, then this capacity was used.
Most routes show a significant jump in capacity between 2015 and 2018, which relates to expected higher capacities in the New Network through simplification of routes and introduction of double-deckers on key routes. The exception to this rule is Sandringham Road. Currently this corridor is served by eight distinct services, several of which have low bus occupancies. This corridor is to be simplified to two key routes, which will allow passenger volumes to be handled by slightly reduced overall capacity.
Under Peer Review

D R A F T
Auckland Transport Bus Reference Case
Page 31 Bus Reference Case (Second Revision)
Table 15: Projected Growth Rates by Corridor
Route GroupCapacity Per Annum Capacity
Growth
Per Annum
Capacity Growth
2015 2018 2026 2036 2015-2018
2018-2026
2026-2036
2015-2036
City & Inner Links 770 1376 2040 2448 21.4% 5.0% 1.8% 5.7%
Manukau Road 825 1500 1860 2220 22.1% 2.7% 1.8% 4.8%
Mt Eden Road 1260 1640 2480 2640 9.2% 5.3% 0.6% 3.6%
Dominion Road 1860 2160 2640 3080 5.1% 2.5% 1.6% 2.4%
Sandringham Road 1620 1500 1980 2200 -2.5% 3.5% 1.1% 1.5%
Other Isthmus 1240 2270 2720 3140 22.3% 2.3% 1.4% 4.5%
East Isthmus 1620 2170 2590 3220 10.2% 2.2% 2.2% 3.3%
East Auckland 1090 2070 2070 2070 23.8% 0.0% 0.0% 3.1%
NEX/Hibiscus Coast 4160 5820 8180 8540 11.8% 4.3% 0.4% 3.5%
North Shore (West) 1740 2920 3880 4880 18.8% 3.6% 2.3% 5.0%
North Shore (Other) 840 1090 1260 1260 9.1% 1.8% 0.0% 1.9%
North West Auckland 1560 2060 3640 4860 9.7% 7.4% 2.9% 5.6%
Under Peer Review

D R A F T
Auckland Transport Bus Reference Case
Page 32 Bus Reference Case (Second Revision)
3.2 Vehicles In order to increase capacity without greatly increasing operating costs, and to minimise theincrease in buses in the City Centre, many major routes connecting core Isthmus neighbourhoods and some outlying suburbs (particularly routes utilising busways) will be upgraded to higher-capacity vehicles. For most such routes, double decker buses will be used, which have a carrying capacity of approximately 110 passengers, versus 55 to 70 on existing single decker buses on the same routes.
For consistency, five vehicle types were considered to be available (with categories defined by AT):
Small buses, with approximately 25 seats each and capacity for 35 passengers including standees; Standard buses (e.g., existing ADLs) with approximately 37 seats and capacity for 55 passengers including standees; Large buses (e.g., existing 3-axle, single-deckers) with approximately 51 seats and capacity for up to 70 passengers including standees; Super large buses (e.g., double-decker or articulated) with approximately 85 seats and capacity for up to 110 passengers including standees; and High-capacity, single-decker buses, with 32 seats and total capacity for up to 102 passengers including standees.
Double deckers are initially provided on the all-day volumes, but will be expanded to additional peak services as the fleet ages and additional small buses are replaced with double deckers. Itshould be noted that one side effect of using double deckers is the potential for increased dwell/loading times, or increased dwell/loading time variability, particularly at busy stops and termini.
Both City Link and Inner Link buses are assumed to use three-door, three-axle vehicles with fewer seats and enhanced internal passenger flows. These buses will be able to carry approximately 70 passengers each (up to 102 in the model shown in Section 5.3 of this report), and are preferable to double deckers on these routes, which include high ridership and frequent passenger turnover, with many passengers traveling short distances. For these passengers, navigating the stairs on a double decker can result in increased dwell times and discomfort, as the lower level would likely be overcrowded with boarding and alighting passengers.
Double decker buses will be provided on many of the busier routes in order to reduce the number of vehicles entering the City Centre, as well as overall operating costs. The Northern Express currently utilises some double deckers—these will be rolled out further as follows:
By 2018, double deckers will be in use on Great North Road (Route 18), New North Road (Route 22), Sandringham Road (Route 24), Dominion Road (Route 25 & 26), Mount Eden Road (Route 27), Manukau Road (Crosstown 4), the AMETI corridor (Route 55), Westgate to City (Route 110), all Northern Express buses on NEX 1 and NEX 2, Glenfield Road (Route n8), and Birkenhead to City (Route n9).By 2026, double deckers will be added to the Northern Express – Newmarket service (NEX 3) and the Westgate to City Express (Route 125x). Double deckers cannot be used on Tamaki Drive (Route 77) service due to low-hanging trees along the roadway. Double deckers cannot be used on Remuera Road (Route 70) due to a low underbridge at the Eastern Rail Line on Merton Road in Glen Innes. It is anticipated that in the post-CRL (2026 and 2036) scenarios, demand will be reduced along New North Road, and double deckers may no longer be needed on Route 22.
Under Peer Review

D R A F T
Auckland Transport Bus Reference Case
Page 33 Bus Reference Case (Second Revision)
3.3 Impacts of Infrastructure Investments on Bus Network This section summarises the assumptions made with regard to bus service in response to delivery of CRL.
Implementation of CRL allows for:
New North Road (Route 22) service re-directed to Newmarket; Elimination of expresses from the West, including Blockhouse Bay to City (Route 195), Green Bay to City (Route 209), Glen Eden Express (Route 151x), and Titirangi Expresses (Routes 171x and 172x)—these routes would terminate at the Avondale, New Lynn, and Glen Eden rail stations instead; Expansion of service from the Northwest, specifically Routes 110 and 125x (WEX upon completion of the busway); and Elimination of expresses from the Southeast, including Mangere to City (Route 309x) and Papakura to City (Route 360x).
Under Peer Review

D R A F T
Auckland Transport Bus Reference Case
Page 34 Bus Reference Case (Second Revision)
4 Infrastructure Requirements This section summarises the assumptions made with regard to infrastructure requirements. While the previous section cited major PT infrastructure investments that are already planned for the City Centre, this section details the way in which infrastructure requirements for running ways, transfer points and termini will be determined in order to operate anticipated levels of bus service.
4.1 Constrained Environment We believe the provision of abundant and effective transport is a key driver of vibrant and economically productive places.
The design of public transport facilities should support adjacent land uses and access to public transport services itself. Sometimes these elements are at odds requiring careful consideration of the implications of facility choices on urban outcomes. In the City Centre this is especially critical as the land available for facilities is highly constrained, expensive, and valuable for competing uses. Bus stop and layover requirements need to be scaled and located to support the best possible urban outcomes.
In most cases here the bus facility requirements are based on peak volumes. In reality, facilities should be scaled to serve volumes lower than the peak particularly when peak service loads require a next level of investment/scale. Using the peak volumes in this analysis is designed to highlight the implications of the proposed volumes while designing for "future proofing".
4.2 Bus Stops and Lanes Bus lanes will be driven by the frequency of bus service in the corridor, and the desire to minimise bus travel times and the potential for delay. Bus lanes benefit both buses and general traffic, by allowing buses to bypass congested general traffic lanes while keeping general traffic from getting delayed by buses in stops.
Bus stops will primarily be driven by the interaction of corridor service frequency and traffic signal phasing. At high frequencies buses will be metered by traffic lights and form into platoons of vehicles travelling in unison. In simple terms the number of bus bays required at a stop is equal to the number of buses we might expect to arrive at each phase of the lights. For example, if there are sixty buses an hour on a corridor at peak times, and two minute signal phases at the lights on the corridor, we would expect two buses per phase to arrive at the bus stop at each phase.
Assuming that the buses would dwell at the stop for well less than two minutes, on average two buses would pass through the stop on each two minute cycle. If the buses are randomly distributed there is a small probability that three may arrive on one cycle, and a very small probability of four, etc. We would therefore need a stop two bays long to accommodate most conditions or a stop of three bays to accommodate almost all circumstances.
Closer to the core City Centre large platoons of buses will be broken apart either by design or by the very short signals required for pedestrian crossings. There is an opportunity to regulate bus stop arrivals by signal timing, special bus signals, and bus lane allocation. For example, buses travelling west bound on Wellesley Street near Queen Street might have allocated bus lanes at the intersection corresponding to the stop destination. In conjunction with signal timing this would ensure that the desired number of buses arrives at a particular stop at once. At the very busiest times buses may miss a signal cycle and stacking would occur in the bus lane.
Under Peer Review

D R A F T
Auckland Transport Bus Reference Case
Page 35 Bus Reference Case (Second Revision)
Table 15 shows the spatial requirements for stop infrastructure in the City Centre. Auckland Transport’s Bus Services group uses the following dimensions as guidelines for bus stop design:
15 metre long bus stops; 15 metre lead-in to bus stops; 9 metre lead-out of bus stops; and 9 metres between individual positions within double, triple (or longer) stops.
Stop lengths may be shortened somewhat by locating stops adjacent to intersections and using the intersection itself as the lead-in and/or lead-out; however, it is understood that these dimensions are limited by space constraints and the need for pedestrian access and crossings within the City Centre.
In addition, it should be noted that the upper threshold of the volumes in the table below could be accommodated with a 90 percent probability of working without causing congestion. This means that 10 percent of the time, assuming the existing two-minute light cycles, more buses would arrive simultaneously than could be accommodated in the stop, causing at least one trailing bus to contribute to congestion in the general traffic lanes. This equates to congestion occurring approximately three times per hour. Auckland Transport’s Bus Services group has expressed a desire to further reduce the probability of congestion, which further reduces the number of vehicles that can be accommodated by stops.
Note that these stop capacities assume that all buses will serve the stop. At less busy stop locations, buses may pass by the stop if nobody signals the driver to exit the bus and nobody is waiting. These facilities can be sized smaller, according to the volume of buses that is actually expected to stop.
Under Peer Review

D R A F T
Auckland Transport Bus Reference Case
Page 36 Bus Reference Case (Second Revision)
Table 15: Spatial Requirements for City Centre Stop Infrastructure
Buses per hour per direction
Number of bays required per stop per direction Nominal lane and stop configuration
1 to 16 1 Bus lane not necessarily required, simple kerbside stop
17 to 33 2 Single bus lane required, buses can stop in lane
34 to 53 3 Single bus lane required, buses can stop in lane
54 to 74 4 Single bus lane required, buses can stop in lane
75 to 95 5 Single bus lane with indented bus stops required
96 to 118 6 Single bus lane with indented bus stops required, skip stop pattern required (2 x three-bay stops in each direction)
119 to 141 7Single bus lane required with indented bus stops, skip stop pattern required (1x three-bay and 1x four-bay stop in each direction)
142 to 164 8 Single bus lane required with indented bus stops, skip stop pattern required (2x four-bay stop in each direction)
165 to 188 9 Double bus lane required with stopping in lane, triple skip stop pattern required (3x three-bay stops in each direction)
189 to 212 10Double bus lane required with stopping in lane, triple skip stop pattern required (2x three-bay and 1x four-bay stop in each direction)
213 to 237 11Double bus lane required with stopping in lane, triple skip stop pattern required (1x three-bay and 2x four-bay stop in each direction)
*This table considers that buses can just go to the first available position at any stop. However, when routes are combined into groups serving different stops, the capacity of the corridor is equivalent to the sum of the capacities of the stop locations serving each individual route group.
4.3 Pedestrian Facilities and AccessAt all transfer points and in many bus stops across the City Centre a better provision of footpaths is required. At very busy transfer locations, namely Wellesley Street, Aotea Station, Symonds Street (Learning Quarter), and Fanshawe Street (Victoria Park), wide footpaths will be required to accommodate very large numbers of passengers waiting, boarding, alighting and moving between services. As a reference it is useful to consider the width of existing footpaths. On Queen Street outside of the CPO building, the footpaths are 10.8 metres wide. On Symonds Street near AUT the footpath is 4.5 metres. Currently the Symonds Street footpath does not provide enough space for comfortable pedestrian circulation. Also, the narrow space limits other street-side activity (e.g., seating) that may be desirable.
At busy bus stops and especially at transfer locations facilities must be provided for pedestrians to cross the street to access public transport services. This pedestrian trip needs to be as convenient and safe as possible. Ensuring the convenience of these trips requires consideration of crossing facilities, crossing distances, signal timing, lighting, etc.
4.4 Transfer Point/Terminal RequirementsTransfer points and termini provide specific functions which are sometimes combined in what is generically called an interchange. It is important to consider the unique requirements of both termini and transfer points as this has implications for the size, location and design of the infrastructure. In addition, transfer point and terminal functions do not need to happen in the same
Under Peer Review

D R A F T
Auckland Transport Bus Reference Case
Page 37 Bus Reference Case (Second Revision)
place—in fact, these functions can be spread over a few different locations, with passenger boarding/unloading, turnaround, and layover/recovery functions all occurring in separate places.
A terminal is a location where transit services end. For bus infrastructure a terminal consists of the following:
Bus stops and/or bays; Passenger facilities (shelters, benches, ticket kiosks, rubbish bins, posted maps/schedules, etc.); Space to accommodate last stop/unloading of all passengers (this can occur in bus stops/bays); Ability for buses to turn around; Space for buses to take recovery time between trips, layover time (e.g., restroom or meal breaks) for drivers, and staging time for buses waiting to access stops; and Driver facilities (e.g., restrooms).
A transfer point is a location where transit users transfer between transit services or between travel modes. At transfer points it is important to consider the distance, composition and magnitude of expected transfers. A transfer point consists of the following:
Bus stops and/or bays; and Passenger facilities (shelters, benches, ticket kiosks, rubbish bins, posted maps/schedules, etc.).
The Auckland City Centre will include termini at Britomart, Wynyard Quarter, and the Learning Quarter with additional major transfer points at Aotea Square and Karangahape Road.
Typically, bus termini are far more complicated than bus transfer points, as they must accommodate more types of activity. Larger bus termini go beyond the requirements cited above, and often include a staffed ticket office, public restrooms, indoor passenger waiting area, bus supervisor area or office, or even a small police station. While the Britomart facility includes many of these amenities, in part because it is collocated with the City Centre’s main train station, this document focusses more specifically on the requirements for bus operations and passenger movements.
The amount of space required for bus operations at either a transfer point or a terminal is impacted primarily by the following:
Loading and Unloading – It is typically assumed that a bus needs approximately two minutes to pull into a stop, open its doors, unload, load, close its doors, and pull back into traffic. However, this time varies greatly, dependent on volumes of boarding and alighting passengers, fare collection method (off-board fare collection being fastest), or whether boarding and alighting take place separately at different locations. Recovery – For the purpose of this analysis, “recovery time” refers to the schedule time between trips to allow each individual bus to keep to timetable, even if the previous trip arrives a few minutes late. It is understood that the PTOM contracts include a recovery period of five minutes between trips. Therefore, the calculations in this document have assumed a recovery period of five minutes for each trip. Staging and First Stop – Often additional time is required at the beginning of a route, to allow for “staging”, or queueing up at a separate location before entering the bus stop and picking up passengers. This is particularly crucial for peak-only services, as routes operating in one direction may have a greater likelihood of arriving at the terminal further ahead of their scheduled departure times than all day, bi-directional routes. This would come into play more often during the peak periods, when higher bus volumes mean stops would be more likely to be occupied when subsequent buses arrive.
Under Peer Review

D R A F T
Auckland Transport Bus Reference Case
Page 38 Bus Reference Case (Second Revision)
Driver Layovers – Layover time allows for drivers to take breaks, use the restroom, getrefreshments, etc. The amount of time provided for layovers is determined based on run cuts/driver shifts, the length of a route, as well as labour contracts. Generally, layover time would be focussed outside of the peak periods or taken at the opposite (non-City Centre) end of the route. In the case of Britomart, terminal development plans include separate “layover” locations for each service group.Service Grouping – Discussed in further detail in the following section, services are typically grouped according to destination in order to improve passengers’ ability to find the appropriate bus route to reach their destination. Service grouping is particularly important at a terminal or transfer point where there are a large number of boarding passengers going to a variety of different locations. Grouping can also be used to facilitate popular transfers by located stops close to one another. However, it should be noted that service grouping can limit the capacity of a terminal, as it may not be possible to group routes such that all stop locations are fully utilized. In order to maximise stop utilisation, “dynamic berthing” should be pursued (whereby arriving buses are assigned to a specific stop or berth upon arrival, rather than always serving the same stop). This strategy is likely to reduce system legibility, and is unlikely to be recommended for any of the Auckland termini.
Terminal capacity is generally constrained by the number of trips originating at the terminal during the peak of peak service. Thus for termini located within the City Centre, the capacity would be determined by the trips departing during the pm peak period. The reason for looking at departures, rather than arrivals, is that departures typically would include a short “recovery period” beforehand, in order to ensure that the trips operate on schedule.
While there may in fact be more arrivals during the morning peak than departures in the afternoon peak, unless the service is perfectly symmetrical (e.g., same number of trips operating in each direction on each route), many of the trips arriving during the AM peak would be returning to the depot, and thus would not include any recovery time at the terminal.
It is important to note that while terminal requirements can be adjusted by modifying the basic assumptions, such as providing less recovery time or altering the percentage of buses taking recovery and/or layover at each location, such adjustments can adversely impact on-time performance, leading to a decline in patronage. A rule of thumb is typically that recovery time should equal “10 percent of running time”, but this varies between PT networks depending on traffic variability, on-time performance KPIs, service contracts, and other factors. Another option would be to move all layovers and recovery time to the outer (non-City Centre) end of the route in order to reduce the time each bus spends at the terminal, and therefore increase capacity; however, this strategy would have impacts on the on-time performance of trips originating in the City Centre.
4.5 Service Grouping Grouping services at bus stops is required for spatial efficiency as well as legibility for users. Legibility assists users in understanding and navigating the network.
The New Network design combines similar services on common corridors to improve legibility. For example, most Isthmus services use Wellesley Street in the City Centre. This allows these services to be grouped at stops along the corridor which provides a simple, legible structure where users can take any bus from the group to access City Centre locations.
Grouping services also avoids the situation of having all services turn up at very long bus stops, where passengers are required to run up and down to find their particular service amongst many of arrivals and departures. It also allows the required number of bus stops to be located with better spatial efficiency relative to each other. Groupings where many passengers are likely to transfer between should be located in close proximity, such as alongside or on adjacent sides of a corner.
Under Peer Review

D R A F T
Auckland Transport Bus Reference Case
Page 39 Bus Reference Case (Second Revision)
5 Notes on Infrastructure and Service
5.1 Peak Spreading As a city grows, so does its workforce, and as such, so does demand for peak period travel on public transport. In Auckland, both the total number of jobs in the City Centre, and the PT mode share for City Centre commutes is growing. According to Stats NZ, City Centre employment grew from 80,000 to 100,000 over the period from 2001 to 2014. Meanwhile, according to the 2014 Screenline Survey, the PT mode share increased from 26 to 48 percent. When active modes are considered, the non-car mode share exceeds 50 percent. In fact, over that same period, the total number of commuters driving alone to work in the City Centre decreased, even though the number of jobs in the City Centre increased by 25 percent. Thus the increase in commutes to City Centre jobs has been entirely absorbed by PT and active modes.
While this rapid uptake of PT usage is in line with policy-maker objectives for the Auckland region, this places a tremendous amount of pressure on the PT network. Given the large number of “nine-to-five” type jobs in the City Centre, the demand for service is highly peaked, with large numbers ofpeople wanting to travel inbound between 7:00 and 9:00 AM, and outbound between 4:00 and 6:00 PM. The demand throughout the remainder of the day, and in the opposite (counter-peak) direction is much lower.
As discussed previously in this document, building infrastructure to accommodate these peak volumes would require a massive amount of investment for facilities that would take up a large amount of space, degrade the environment of the streets that they occupy, and would see little use outside these two peak periods. Thus it is does not make sense to construct infrastructure for such limited (temporally) use. Crowding during peak periods should be expected—just as congestion on major roadways occurs during the peak. Over time, passengers recognise that travelling during the peak period takes longer, and is less comfortable, and will adjust their travel accordingly. Many people, particularly those with flexible work schedules or making discretionary trips (e.g., shopping, visiting friends, etc.) will begin travelling on the shoulders of the peak period, or travel outside of the peak altogether. This phenomenon, known as “peak spreading”, can be seen in cities across the globe.
In this report, it is recommended that infrastructure is built with a focus on desired outcomes, rather than to accommodate an infinitely increasing volume of buses. This way, large facilities are not built to be used only four to six hours of the day. In addition, this strategy is in line with the principles of the New Network, which seek to ensure that Auckland’s public transport network functions for travel throughout the day between all parts of the city, not just during the peak period, in the peak direction. Thus rather than simply accommodate all demand for peak travel, it is recommended that Auckland expect—and encourage—some peak spreading.
Encouraging peak spreading, rather than accommodating infinite growth comes with numerous benefits:
It reduces the differential between peak and all-day volumes; It allows for better service provision with all-day frequent service rather than a majority of service concentrated into a few hours of the day; It allows for a smaller total fleet size with by reducing the peak vehicle requirement; and It results in improved operations and happier drivers with a need for fewer split shifts.
There are several options for encouraging peak spreading:
Encourage employers to adopt staggered work schedules; Implement peak period pricing schemes, whereby higher fares are charged for passengers wishing to travel during the peak period, in the peak direction; and
Under Peer Review
D R A F T
Auckland Transport Bus Reference Case
Page 40 Bus Reference Case (Second Revision)
Simply do not accommodate the peak demand, but improve peak shoulder and all-day service so that passengers can choose to travel at other times.
5.2 Off-Board Fare Collection and All-Door Boarding Off-board fare collection is a strategy that many cities employ for speeding up bus service in busy corridors. Often a key component of Bus Rapid Transit systems, off-board fare collection speeds up service by allowing passengers to pay for their trips before boarding the vehicle, similar to how fare payments work on Auckland’s rail network. This means that in addition to simply being able to “hop on” the bus without stopping to pay a fare, passengers can also board at any door—including the rear doors—because it is unnecessary for the driver to see whether they have paid. This strategy can greatly reduce dwell times at stops with large numbers of boarding passengers, such as will be expected at Aotea Station on both the Wellesley Street and Albert Street corridors. Reducing dwell times effectively increases the capacity of the stop, allowing more buses per hour to use the same space. It is recommended that off-board fare collection and all-door boarding is implemented at the Aotea Station bus stops on Wellesley Street and Albert Street, as well as at Britomart West. If successful, this strategy may be rolled out at additional busy locations in the City Centre (e.g., Karangahape Road, Learning Quarter, Victoria Park transfer point, etc.)
The down side of off-board fare collection / rear door boarding is that fare inspectors will be required, either to ride buses or to monitor boarding passengers.
5.3 Vehicle Capacity Following analysis of the major City Centre bus corridors in the previous sections, the conclusion can be drawn that the New Network cannot be delivered without high-capacity vehicles. Projected bus volumes are simply too large to fit in the City Centre without using high-capacity vehicles wherever possible. By 2036, it would be advisable to avoid any routes into the City Centre that do not have patronage to support all day, frequent service on high-capacity vehicles.
Note that double-deckers may increase dwell times and/or additional variability in boarding times at some stops, particularly busier stops and terminals. This will need to be taken into account when considering the capacity of a corridor or stop in terms of buses per hour.
The following table summarises the double-deckers expected in use by 2018. Double deckers would be used on major Isthmus corridors (Mt Eden Road, Manukau Road, Great North Road,Dominion Road, Sandringham Road and New North Road), as well as the Northern Express (NEX 1 and 2) services, Glenfield and Birkenhead to City services, Howick to City service, and Westgate to City services. High-volume single-deckers would be in use on the City and Inner Link services.
While in 2018, double-deckers would only be used for all-day service volumes, by 2026, they would be rolled out to additional peak services as well, as older vehicles are retired and more double-deckers added to the fleet. Double-deckers would also be expanded to the NEX 3, and Remuera Road if a solution is found for the underbridge at Glen Innes, underneath which double deckers would not fit.
Under Peer Review

D R A F T
Auckland Transport Bus Reference Case
Page 41 Bus Reference Case (Second Revision)
Table 16: High Capacity Vehicles on Major Corridors in the 2018 Scenario Corridor Peak All-Day
Double-Decker
Single-Decker High
Capacity
Single-Decker
Percent High
CapacityDouble-Decker
Single-Decker High
Capacity
Single Decker
Percent High
Capacity
Albert Street 12 - 47 20% 12 - 5 71%Fanshawe Street (EB AM/WB PM)
50 8 104 35% 50 8 25 70%
Fanshawe Street (WB AM/EB PM)
50 8 71 46% 50 8 25 70%
Karangahape Road* 12 4 37 30% 12 4 15 52%
Wellesley Street (EB AM/WB PM)
38 - 72 35% 38 - 17 69%
Wellesley Street (WB AM/EB PM)
38 - 67 36% 38 - 17 69%
Symonds Street 45 - 75 38% 38 - 8 83%
*Karangahape Road between Pitt Street and Newton Road only (does not include City Link)
In contrast to the double deckers in use on major corridors, it is recommended that high-capacity vehicles are also pursued for the City and Inner Link services, which carry large volumes of passengers. However, as these two routes have much higher passenger turnover rates, and passengers typically travel shorter distances, double deckers do not necessarily make sense. Instead, the Link services could use high-capacity single decker vehicles, such as the Volvo 7900 Hybrid or MAN Lyon’s City Hybrid. These buses are characterised by the following:
Three wider doors to facilitate passenger boardings and alightings, accommodating high passenger turnover and large volumes of people. Modified interior space with fewer seats and improved passenger flow, allowing more standees and thus allowing the vehicle to carry more people overall.
An example of the MAN Lion’s City Hybrid is shown below. The standard-length Volvo 7900 Hybrid is available in two models, a 10.6 metre, two-axle, low-floor vehicle with three double doors and 27 seats (plus one folded seat) and capacity for up to 90 passengers; and a 12.0 metre, two-axle, low-floor vehicle with 32 seats (plus one folded seat) and capacity for up to 102 passengers. Both Volvo vehicles are 2.55 metres wide and 3.28 metres high.
Under Peer Review

D R A F T
Auckland Transport Bus Reference Case
Page 42 Bus Reference Case (Second Revision)
Opportunities for expansion of high-capacity vehicles include:
Rollout of high-capacity, single decker vehicles on Link services, where high passenger volumes necessitate capacity enhancements, but high turnover rates preclude use of double deckers. All Northern, Northwest and AMETI Busway services. Consolidation of peak expresses on the North Shore into additional double decker busway service. Replacing the existing fleet with more double deckers as older vehicles are retired, allowing for expansion of double deckers to peak extra services on some routes.
It should be noted that while there are benefits to utilising high-capacity vehicles on frequent services carrying large volumes of passengers, namely (in the case of this study) the reduction in total vehicles required to enter the City Centre, it is not advisable to use high-capacity vehicles on lower frequency routes, as the capacity improvements will not have the same positive impact that frequency improvements would on patronage growth and perceived customer/service levels. It is recommended that double deckers are focussed on those services operating at least as frequent as every 10 minutes for all day service.
Under Peer Review
D R A F T
Auckland Transport Bus Reference Case
Page 43 Bus Reference Case (Second Revision)
6 Conclusions and Recommendations Review of expected bus volumes in the City Centre upon implementation of the New Network as currently proposed reveals the need to consider trade-offs between services provided and required infrastructure. Anticipated large volumes of buses, particularly from the North Shore, Northwest and Isthmus will be a challenge to accommodate given space constraints in the City Centre, particularly along key bus corridors (e.g., Wellesley Street and Albert Street) and at City Centre bus termini. Key findings and recommendations include:
Staging for PM peak service is the single biggest constraint on terminal capacity. All three City Centre termini are constrained: the planned configuration of the Britomart Bus Terminal is smaller than the existing terminal, development pressures will constrain the amount of space available for a Wynyard Quarter terminal, and limited space near the University for a Learning Quarter terminal. Building infrastructure to accommodate peak volumes results in unused facilities throughout most of the day. Separating terminal functions, such as passenger loading/unloading, turnaround and recovery/layover into different locations can improve the flexibility of terminal design. Capacity constraints exist on Wellesley Street, Albert Street and Karangahape Road due to roadway width, available space for stops, and pedestrian and cyclist requirements.
In order to operate the New Network in the City Centre, the following needs to happen: A turnaround loop needs to be created for Albert Street service at Britomart West. Additionally, NEX and WEX staging areas need to be found. Removal of the Lower Hobson Street Viaduct would assist with these ends. Terminal facilities need to be constructed at Wynyard Quarter and Learning Quarter. Transfer points need to be designed at Fanshawe Street, Aotea and the University. Off-board fare collection needs to be pursued on Albert and Wellesley Streets. The use of high-capacity vehicles needs to be expanded, including to Link services.
Under Peer Review

D R A F T
Auckland Transport Bus Reference Case
Page 44 Bus Reference Case (Second Revision)
Appendix A: Bus Volume Maps
Following are maps of the major City Centre corridors, highlighting the projected bus volumes during the peak periods. These maps include:
2018; 2018 (Victoria Street); 2026 (with CRL); and2036 (with CRL).
Under Peer Review

D R A F T
Queen St
Quay St
tn St
Queen
StQQ
uQ
ueeeeen St St
Quay StQ yQ StQuuayay StSt
Karangahape Road GROUP ALLDAY PEAK CAPACITYALL 31 53 53
Fanshawe Street EastboundGROUP AM PM CAPACITYNS to Britomart 47 18 53North Shore to Uni 69 17 53Isthmus/LINK 48 92 33TOTAL 164 127
Fanshawe Street WestboundGROUP AM PM CAPACITYNEX 16 60 53North Shore 19 56 33Isthmus/LINK 92 48 53TOTAL 127 164
Wellesley Street WestboundGROUP AM PM CAPACITYNorths Shore 17 44 53Wynyard-bound 76 32 53Crosstown/NS Peak 12 34 33TOTAL 105 110
Symonds Street SouthboundGROUP AM PM CAPACITYHospital 16 46 53Upper Symonds 30 74 53TOTAL 46 120
Symonds Street NorthboundGROUP AM PM CAPACITYBritomart 44 14 53Wynyard-bound 76 32 53TOTAL 120 46
Albert Street GROUP ALLDAY PEAK CAPACITYALL 17 59 53
Wellesley Street EastboundGROUP AM PM CAPACITYNS to UNi 44 17 53Isthmus 32 76 53Crosstown/NS Peak 34 12 33TOTAL 110 105
Britomart Terminal PEAK ALL DAYTERMINATING 175 58THROUGH 16 16
2018
Peak Period Capacity Constraint Meets assumed capacity
Nearing assumed capacity
Exceeds assumed capacity
Under Peer Review

D R A F T
Queen St
Quay St
tn St
Queen
StQQ
uQ
ueeeeen St St
Quay StQ yQ StQuuayay StSt
Albert Street GROUP ALLDAY PEAK CAPACITYALL 17 59 53
Karangahape Road GROUP ALLDAY PEAK CAPACITYALL 31 53 53
Fanshawe Street EastboundGROUP AM PM CAPACITYNS to Britomart 47 18 53North Shore to Uni 69 17 53Isthmus/LINK 48 92 33TOTAL 164 127
Fanshawe Street WestboundGROUP AM PM CAPACITYNEX 16 60 53North Shore 19 56 33Isthmus/LINK 92 48 53TOTAL 127 164
Wellesley Street EastboundGROUP AM PM CAPACITYNS to UNi 44 17 53Crosstown/NS Peak 34 12 53TOTAL 78 29
Wellesley Street WestboundGROUP AM PM CAPACITYNorth Shore 17 44 53Wynyard-bound 76 32 53Crosstown/NS Peak 12 34 33TOTAL 105 110
Victoria Street EastboundGROUP AM PM CAPACITYHospital 8 22 53Upper Symonds 24 54 53TOTAL 32 76
Britomart Terminal PEAK ALL DAYTERMINATING 175 58THROUGH 16 16
Symonds Street SouthboundGROUP AM PM CAPACITYHospital 16 46 53Upper Symonds 30 74 53TOTAL 46 120
Symonds Street NorthboundGROUP AM PM CAPACITYBritomart 44 14 53Wynyard-bound 76 32 53TOTAL 120 46
2018 Victoria St
Peak Period Capacity Constraint Meets assumed capacity
Nearing assumed capacity
Exceeds assumed capacity
Under Peer Review

D R A F T
Queen St
Quay St
tn St
Queen
StQQ
uQ
ueeeeen St St
Quay StQ yQ StQuuayay StSt
Symonds Street SouthboundGROUP AM PM CAPACITYHospital 20 46 53Upper Symonds 28 66 53TOTAL 48 112
Albert Street GROUP ALLDAY PEAK CAPACITYALL 18 62 53
Karangahape Road GROUP ALLDAY PEAK CAPACITYALL 38 58 53
Wellesley Street EastboundGROUP AM PM CAPACITYNS to Uni 48 22 53Isthmus 32 67 53Crosstown/NS Peak 42 16 33TOTAL 122 105
Wellesley Street WestboundGROUP AM PM CAPACITYNorth Shore 22 48 53Wynyard-bound 67 32 53Crosstown/NS Peak 16 42 33TOTAL 105 122 Symonds Street Northbound
GROUP AM PM CAPACITYBritomart 14 45 53Wynyard-bound 32 76 53
Fanshawe Street EastboundGROUP AM PM CAPACITYNS to Britomart 50 22 53North Shore to Uni 76 22 53Isthmus/LINK 52 87 33TOTAL 178 131
Fanshawe Street WestboundGROUP AM PM CAPACITYNEX 20 60 53North Shore 24 66 33Isthmus/LINK 87 52 53TOTAL 131 178
Symonds Street NorthboundGROUP AM PM CAPACITYBritomart 45 16 53Wynyard-bound 67 32 53TOTAL 112 48
Britomart Terminal PEAK ALL DAYTERMINATING 187 69THROUGH 20 20
2026
Peak Period Capacity Constraint Meets assumed capacity
Nearing assumed capacity
Exceeds assumed capacity
Under Peer Review

D R A F T
Queen St
Quay St
tn St
Queen
StQQ
uQ
ueeeeen St St
Quay StQ yQ StQuuayay StSt
Isthmus services requires 2 stops, Hospital requires 1 stop
Karangahape Road GROUP ALLDAY PEAK CAPACITYALL 50 72 53
Albert Street GROUP ALLDAY PEAK CAPACITYALL 26 78 53
Symonds Street SouthboundGROUP AM PM CAPACITYHospital 22 51 53Upper Symonds 28 72 53TOTAL 50 123
Wellesley Street EastboundGROUP AM PM CAPACITYNS to UNi 48 22 53Isthmus 34 78 53Crosstown/NS Peak 54 20 33TOTAL 136 120
Wellesley Street WestboundGROUP AM PM CAPACITYNorth Shore 22 58 53Wynyard-bound 78 34 53Crosstown/NS Peak 20 54 33TOTAL 119 146
Fanshawe Street EastboundGROUP AM PM CAPACITYNS to Britomart 54 22 53North Shore to Uni 84 22 53Isthmus/LINK 58 102 33TOTAL 196 146
Fanshawe Street WestboundGROUP AM PM CAPACITYNEX 20 60 53North Shore 24 78 33Isthmus/LINK 102 58 53TOTAL 146 196
Symonds Street NorthboundGROUP AM PM CAPACITYBritomart 45 16 53Wynyard-bound 78 34 53TOTAL 123 50
Britomart Terminal PEAK ALL DAYTERMINATING 213 81THROUGH 24 24
2036
Peak Period Capacity Constraint Meets assumed capacity
Nearing assumed capacity
Exceeds assumed capacity
Under Peer Review

D R A F T
Auckland Transport Bus Reference Case
Page 49 Bus Reference Case (Second Revision)
Appendix B: Maximum Bus Volumes by Corridor/Terminus
The following table summarises the potential configurations at various corridors and termini throughout the City Centre. Each is broken out into the following:
Initial Concept Design, which shows the bus volumes that could be accommodated given a configuration that maximises urban amenity and minimises negative impacts to surrounding properties; and Estimated Capacity of Existing Infrastructure, which shows the maximum number of buses that could be accommodated based on existing geometries and infrastructure (not necessarily what does exist today, but what conceivably could exist today).
In the case of the termini, the configurations for Britomart East and West are assumed to be as planned (Aurecon report). As there is currently no design (or site) specified for the Wynyard Quarter and Learning Quarter termini, the figures cited reflect smaller and larger options and capacities.
Table 17: Maximum Bus Volumes by Corridor Corridor or Terminus
Major Constraint
Initial Concept Design
Estimated Capacity of Existing Infrastructure
Expected Bus Volumes
Stop Configura-tion
Bus Volume (bph)
Stop Configura-tion
Bus Volume (bph)
Current Estimated 2018
CorridorsAlbert Street / Pitt Street
Narrow street profile post-CRL
Triple stop 53 Quad stop 74 53 59
Fanshawe Street Eastbound (Victoria Park)
Driveways on north side of street; operational challenges
2 triple stops +double stop
139 9 stops 188 125 164
Fanshawe Street Westbound (Victoria Park)
Turning movements at Beaumont Street and Motorway access
2 triple stops +double stop
139 12 stops 261 110 164
Karangahape Road
Narrow street profile, particularly at Pitt Street
Triple stop 53 Triple stop + double stop
86 48 53
Symonds Street
University stops (Mount St to St Paul St) and right turn from Grafton Bridge immediately into stops
2 triple stops
106 2 quad stops
148 154 120
Wellesley Street
Aotea Station; short block lengths
2 triple stops + double stop
139 4 double stops
132 45 110
*Initial Concept Design assumes 15 metres lead-in, 15 metres per space, nine metres between individual positions and nine metres lead-out; max vehicles assumes 90 percent confidence that all vehicles can be accommodated, with congestion anticipated 10 percent of the time.
Under Peer Review

D R A F T
Auckland Transport Bus Reference Case
Page 50 Bus Reference Case (Second Revision)
In the case of the termini, the configurations for Britomart East and West are assumed to be as planned (Aurecon report). As there is currently no design (or site) specified for the Wynyard Quarter and Learning Quarter termini, the figures cited reflect smaller and larger options and capacities. The “expanded option” would provide larger termini at Wynyard Quarter and Learning Quarter. These are shown in the following table.
Table 18: Maximum Bus Volumes by Terminus Corridor or Terminus
Major Constraint
Initial Concept Design
Expanded Option Expected Bus Volumes
Stop Configura-tion
Bus Volume (bph)
Stop Configura-tion
Bus Volume (bph)
Current Estimated 2018
TerminiBritomart East
Narrow streets with short blocks
Three double stops +threelayover spaces
72 N/A N/A N/A 67
Britomart West (West/ Northwest)
Driveways on Lower Albert Street
Two set-down stops + three single stops + five recovery spaces
74 N/A N/A N/A 59
Britomart West (North Shore)
Layover/recovery spaces
Two triple stops + threerecovery spaces
77 N/A N/A N/A 49
Wynyard Quarter
Development/ limited space and high land values
Triple pickup stop + five layover spaces
53 Double the “best outcome” scenario
106 N/A 88
Learning Quarter
Lack of existing on or off-street space for a terminal
Triple pickup stop + five layover spaces
53 Double the “best outcome” scenario
106 N/A 75
*Assume 5 minutes recovery/staging time per trip, as per PTOM. In addition, two minutes per bus are assumed for drop off/pick up, or 1.5 minutes per bus for just drop-off or just pick-up.
*Current volumes are not relevant as Learning Quarter and Wynyard Quarter terminals do not exist yet, and Britomart will be significantly reconfigured due to local street changes and public space upgrades.
Note the following caveats and assumptions:
The initial concept designs were developed based on the following New Network design principles:
Customers can easily understand where to catch services from. Not just for daily commute but for other purposes. Minimising the need for customers to run long distances if bus stops are too long or parked too far away. Minimising passengers scrambling from one stop to another if they are uncertain whether a bus will pull up.
The initial concept designs were intended to develop an indication of how stop configurations impact on capacity. The designs will need to be refined, probably compromised as a result of expected bus volumes. Detailed assessments would be needed to refine / test these initial assumptions.
Under Peer Review
D R A F T
Auckland Transport Bus Reference Case
Page 51 Bus Reference Case (Second Revision)
The stop capacity assessments assumed that buses can be accommodated 90% of the time. This means that 10% of the time (2-3 times per hour, peak) there will be congestion, bus overflow. While the volumes shown for Fanshawe Street assume all buses would stop on the segment of Fanshawe Street between Halsey and Beaumont Streets, this is demonstrative—some routes (namely those which terminate at Wynyard Quarter) would likely stop on adjacent streets. Less busy stop locations would require less infrastructure if not all buses are expected to stop there. Theoretically, the Initial Concept Design for Wellesley Street would accommodate expected bus volumes; however, the bus route groupings required to provide legibility for the New Network create a challenge. Symonds Street currently functions with two very long stops in each direction. These sometimes result in a great deal of congestion, as well as passenger confusion, as large platoons of buses arrive and depart simultaneously.
The following maps summarise the initial assessment of bus stop capacity based the assumptions listed above. It is important to note that these capacities can be increased with changes to customer legibility and route allocations.
Under Peer Review
D R A F T
Auckland Transport Bus Reference Case
Page 52 Bus Reference Case (Second Revision)
Appendix C: North Shore Peak Bus Occupancy
An analysis of HOP ticketing data (electronic and paper ticketing) was conducted on a selection of existing North Shore routes that are retained or have very similar alignments under the New Network. The period reviewed was the second week of March 2014, a week selected to represent a period of high usage and utilisation.
These routes included the core busway services of the NEX and the 881 (similar to the proposed NEX2/3), and local or express routes from Mairangi Bay (863X), Belmont (802X), Bayview (955), Windy Ridge (953) and Chatswood (971).
Hop data indicates where passengers board and exit each bus, and an analysis calculated the occupancy of each run of each route from the beginning of the route to the terminus in the city. From this, the occupancy distribution of each route across the morning peak was observed, and the average peak loading of the buses on each route was calculated crossing the harbour bridge (i.e. the peak load point approaching the City Centre in the morning peak).
This analysis revealed significant variation in the occupancy of buses arriving in the City Centre from the North Shore in the morning peak.
Trunk Rapid Transit Bus Services The NEX is generally operated by conventional buses (triple axle, rigid body), except for two high capacity double deckers that operate selected peak runs. The observed average AM peak occupancy of the standard NEX crossing the harbour bridge to the City Centre was 50 passengers per bus, while the average occupancy of the double decker was 102 passengers per bus.
Similarly, the 881 (busway to university and hospital) service is operated by a mix of conventional buses and high capacity articulated buses. The average AM peak occupancy for the standard 881 services was 49 passengers per conventional bus, and 101 passengers per high capacity articulated bus.
Local Suburban and Peak-Only Services Five routes that run through to the City Centre but largely do not operate one the busway were reviewed. Three of these operate all day, while two are peak-only expresses. All five routes are targeted at specific local suburban catchments, however all can also collect passengers from trunk corridors leading to the motorway and harbour bridge.
The average AM peak inbound occupancy for these suburban buses was 37 passengers per bus crossing the harbour bridge. These are all operated with conventional buses, typically smaller twin axle vehicles.
Summary Overall, this indicates that conventional buses operating trunk service on the busway at peak times already achieve an average occupancy of 50 passengers per bus, while the variants operated using high capacity vehicles achieve slightly more than 100 passengers per bus.
By comparison, buses serving suburban catchments but providing direct service through to the City Centre only achieved an average occupancy of 37 people per bus inbound in the morning peak.
This indicates that local suburban buses operating across the harbour bridge to the City Centre achieve, on average, 74% of the observed occupancy of conventional busway services, and only 37% of the occupancy of high capacity busway services. In other words, it takes three suburban buses to move the same number of people to the City Centre as one high capacity busway bus, making busway buses three times more space efficient at city termini.
Under Peer Review

D R A F T
Auckland Transport Bus Reference Case
Page 53 Bus Reference Case (Second Revision)
This indicates that, in the context of bus capacity constraints in the City Centre, a network model that avoids routing low-utilisation suburban buses through to the City Centre would be advisable. This suggests an alternative of serving suburban areas with shorter shuttle style services linking to busway stations or major centres, in order to connect to trunk services operated by high occupancy vehicles. A test case was developed simulating the removal of 30 low-utilisation suburban buses from the City Centre across the two hour peak and reallocating these as feeder services. Holding the passenger capacity to the City Centre constant required the addition of 11 high capacity buses on the trunk corridors, resulting in a net reduction of 19 buses across the peak, as well as approximately an 18% reduction in service delivery costs.
Under Peer Review

D R A F T
Auckland Transport Bus Reference Case
Page 54 Bus Reference Case (Second Revision)
Appendix D: Victoria Street Eastbound Corridor
Upon the implementation of the New Network, the Victoria Street corridor is proposed to be used for eastbound Isthmus services. The long term plan is still for these services to use Wellesley Street, however the Wellesley Street busway will not be complete by 2018, and it is uncertain how buses will access Symonds Street from Wellesley Street.
The Victoria Street corridor referred to runs from Halsey Street in the west to Symonds Street in theeast, and also includes Bowen Avenue and Waterloo Quadrant.
Table 20: 2018 Bus Volumes on Wellesley and Victoria Street corridors Service Grouping AM PM All Day
Westbound Wellesley StreetNEX 2 30 8 8Takapuna and Hillcrest to University
14 9 9
North Shore Peak Expresses
25 0 -
Isthmus 32 76 32Crosstown 4 and Pt Chevalier
9 12 6
TOTAL 110 105 55Victoria StreetIsthmus 0 0 0
Eastbound Wellesley StreetNEX 2 30 8 8Takapuna and Hillcrest to University
14 9 9
North Shore Peak Expresses
25 0 -
Crosstown 4 and Pt Chevalier
9 12 6
TOTAL 78 29 23Victoria StreetIsthmus/Wynyard 32 76 32
The use of a Victoria Street as an alternative corridor reduces pressure on Wellesley Street by removing 76 eastbound buses in the PM peak. However this, is significantly higher than the 32 eastbound buses use that currently use Victoria Street in the peak. This volume of buses would require one triple stop (to handle buses heading to Upper Symonds Street), and one double stop (to handle buses heading to the Hospital and Newmarket). At the key stop between Albert and Queen Streets, there is sufficient on-street space to handle this volume, as there is space for a triple stop and a double stop between Queen and Albert Streets.
Under Peer Review

D R A F T
Auckland Transport Bus Reference Case
Page 55 Bus Reference Case (Second Revision)
Issues and Opportunities Issue #1: Stop capacity is severely limited at Waterloo Quadrant. The current stop is less than 25 metres long, which is shorter than the ideal infrastructure requirement for a double stop. Thecurrent stop already crosses two driveways, and driveways are present every 20 metres which make it undesirable to extend the current stop.
Issue #2: Use of the Victoria Street corridor means 120 buses per hour will be using Symonds Street southbound between Waterloo Quadrant and Wellesley Street. The bus stop along this section is located immediately to the south of Alten Road. This stop is less than 70 metres long and can accommodate two doubles stops, so could only handle up to 66 buses per hour. This stop cannot be extended to the north due to the Alten Road intersection, nor can it be extended to the south due to mature trees along the Symonds Street corridor.
Issue #3: Use of the Victoria Street corridor for eastbound service (only) creates problems regarding customer experience. For example, the use of separate corridors for inbound and outbound routes can cause confusion for customers. Bus networks are more legible when passengers know they can board the bus along the same route from which they alighted. Thesepotential issues are exacerbated because North Shore buses bound for the Learning Quarter and the Crosstown 4 would continue to use Wellesley Street in both directions.
Issue #4: Using the Victoria Street corridor adds travel time and length versus using the Wellesley Street corridor, leading to higher operating costs and passenger dissatisfaction. Buses using this corridor would have to travel 2.0km, rather than 1.3km to use Wellesley Street. The route is also significantly slower, both because of increased length, and lack of bus priority, especially on the eastern end of the route. Bowen Avenue and Alten Road lead to a significant motorway on-ramp for the north-eastern part of the CBD so this area is regularly congested at peak times. There are fewer opportunities for bus priority due to the layout of intersections and competing uses for this corridor.
Issue #5: Use of the Victoria Street corridor limits the opportunities for passengers to connect between major bus services. Legible interchanges are an important part of the New Network concept as they allow people to easily travel from one part of the region to another, and to make discretionary trips that may currently be complicated on public transport. Aotea Station at Wellesley and Albert Streets would be a key interchange where transfers could take place between rail service and two major bus corridors; however routing outbound Isthmus services along Victoria Street removes a key grouping of services from this interchange. Transfers are still possible on Fanshawe Street near Victoria Park and on Symonds Street by Wellesley Street; however, these interchanges will offer a poorer customer experience as due to bus volumes. Further, these interchanges would be spread out of a wider physical space, and may involve grade changes and/or street crossings.
Issue #6: The use of Victoria Street as a key bus corridor conflicts with the strategic vision that Auckland Council and Auckland Transport have espoused for this corridor. The City Centre Masterplan identified Victoria Street as a linear park that would connect Albert Park in the east with Victoria Park and the Wynyard Quarter in the west, providing high quality public spaces in the city. The City Centre East-West Study confirmed that the Linear Park was appropriate, and traffic could be reduced to two low-speed lanes. Victoria Street would also be the major east-west cycleway, and has been identified as one of the City Centre Priority Routes, funded as part of the government-led Urban Cycleways fund. Operating buses (particularly a large volume of buses) in this corridor is incompatible with the vision set out in each of the above plans, as the other uses identified leave no space for bus lanes or the long stops necessary to handle significant volumes of buses at peak times.
Under Peer Review