
UNCLASSIFIED AD 293 274 - apps.dtic.mil · unclassified ad 293 274 rspaoducad kf, ute armed...
51
UNCLASSIFIED AD 293 274 RspAoducad kf, Ute ARMED SERVICES TECHNICAL INFORMAHON AGENQ ARLINGTON HALL STATION ARLINGTON 12. VIRGINIA UNCLASSIFIED
Transcript of UNCLASSIFIED AD 293 274 - apps.dtic.mil · unclassified ad 293 274 rspaoducad kf, ute armed...

UNCLASSIFIED
AD 293 274 RspAoducad
kf, Ute
ARMED SERVICES TECHNICAL INFORMAHON AGENQ ARLINGTON HALL STATION ARLINGTON 12. VIRGINIA
UNCLASSIFIED

NOTICE: When govtütJfflent or other Irawlr^s, speci- fications or other data are asert for any purpoee other than Ir- •unnection with a definitely related government procurement opemtlo:., the U. S. Government thereby Incurs no reBponslbility, nor any obligation whatsoever; and the fact that the Govern- ment may have formulated, rumlshed, or In any way supplied the sail drawings, specifications, or other data Is not to be regarded by Implication or other- wise as In any rtanner licensing the holder or any other person or corporati.,.., cr conveying any rights or pemlsslor. to manufacture, use cr sell any patented Invention that may in any way be related thereto.

A-33fl - Rpt WtFlnAi) Contracti DJÜ.?-129-<jp-l^f NRC KquipMnt Corporal in
laproriac Tr—M Dr/lnc PTOMM WXlci«Dcy thrtMch I^prov«d Itpor tmonl
and Ia-Proe*»« Noittotr« D»t«r«lMtloa
O Period! 15 January I960 - 3Ü June 1962
ARMED FORCES FOOD AKD COHTAIMER INSTITUTE U. S. Angr IteMaroh and Qiginetfring CoMund
Chicago 9, Illinois

0 ■ 1 0 w /
a <• - •<
i N
■0 1 a 0 0 a ■ 0 Ö; a s t
— 4l 1 n U W » » .H Zl t a 0 U r- . 4^ r
in-o T • 0 V a • b k «* b
K ■ f 3 St f
u»ra«ib« ?
X 1 a a ti h U •■ b K 1 « M ■ a s M a
c «0 -9 ■0 0 at. £ w w, r * Ml) 9k ■O 0 "» • • a 1 » »« a a . • c «- - ^ *< *• N J • U - U kl « 1
• 1 ^ w w« ■H * b » a a *H •' b « «4 »4 I 52 87 - CO
-H ■ . •H £ W 0
W B 0 r 3 u
x -o u » «4 m 1 •1 - w x-o b0> a »i« <H - W 3 >> «-> -<
£ a i : r^ u 3
a • a a -H M 3 >» W r.
JB a 1 :? 0 &• a 4 a a
t> b w - c a ^ —
• o < QUO
• ■H«b«<l|h3 ■ rH A a D J •• b rH «rf JQ «4 1% t
232 M a,-,
or« b a ■- a b • rH .C fc b «H W A
4 » k 3 0 a ♦«
w a E , art i.
e u • «a
• • 3*0. 3 0 B 0 b «H 4
a c ^ e« 3«a MM a a. -< 0
- - O w O .C E 06 - a M a N C u a rt a o z s '« • 0 b«-. 0 0 •0 a 0 b v. 0
0» « O • <M 3 O V »H |W * JO o • v. 3 C -O -• ^ ■H w -0 0 i a w
«< • j w 4 « 'I rH W -o 0 09 C w 4 w 4 4
0 ^ * B 3f M S
H • M 0 a • • 0 0 O -H w i « M-^ A1 - b« 0 a a a c u
< rH -H a *< w >• H > n ■H v ■ a ■ OM
»aSaatt-HOi 04Mibbaa rH • • 3 3 ** 4
*
iit n r< -o B c B C -
a • ee M 0**. a • M ^ a a -H A o Ok a >• «■ pg >. « 0 a 3 >, <o b b « a Q 5 9 x
■-> -H
-H b 5 3 X
•■» M
rH «« 3 3 -H 4 s to
rn a b w M a o«a3«ü5b :ö (0
rH • b 0 • a 3
r> a E 4 4 0 h
• UM PB ►N | «naoabubo a • « • n a»« .
OH • A a a m 0 u if '.->** a *»
0 » 5 X) • 0 -H
• M M fl| ►H 1 «H • 4» « b a b 0 U «i HU w <3 KM i§ ••? U w
y a gyp 8S •(? • a a «M a A 4»
« (b C a. 2 »4 < • Cfe? M 0 y B a >. w c w
5. • OH ■H « X
> «H a • » &
«OH a • « 0 » a .0 in 0 -<
i H X a«t2 B b > MW 0 -^ a XQirtS « B •• 3 .•8Mo sss 3«52 ■ fr> > be w 0 H 0
>. 0. a a (oiwa
7 e« >n si • OQ
4 I
fcl *• rH
« A -H « -H 4 »be N u a b a M
a « -< 4 >S.4-H a 3 ■ "H«H ü M 41
• w b A 00 b W M
4 £ «4 »be N
a « -* a -H 4 y 10 b e ee 4 >, 4 -H a
B. 4 g a 1 S.Q< 90C
>,-H ■ •-) *4 rH ä ■ ■•* c>.4>-Hb4a4>» 4bbw3aOiMb
SU« Ok i g a 1 >»-»H • -H •M rH 0) B -H b 4 a4 >. 3 c a K b a
U -P, Q ä XH •
si MSISö 1 - XH
a >« 4» 'H 4 b b w
< X « <-■ 0. ►-< «a se» aiTJbe3«44a>i> (0 MftM MQ x -o be 3 « 4 4 « -o
'J *< ■ «> w a
Q «-> in n
•0 1 0 c or- 0 as
b
a s ■0
oi - c 0
M a» * « 0 U W 4> » -rH M » 1 Ä 9 b W V a -H
£5* % to "o T
« a» a 4» b b ♦» t. H a a x T 8aSSs b w h ■0 N B « 3 a« l-H ? 2 3 aa
■0 0 Ob .C w W .C tt) M -O ■0 0 • b £ W t, JC 0) C/} 0) on 0) 1 «■HwasjowM CO « 0» » 1 a-^ao.«©"-1
< *» •M N -3 «« CJ '-t
■H
$ bajBn-Hnb4 ^ w
J 4 WN z s b « £ J) ■n 09 b 4
tl <MJ3WQ0A3U w e B <a M a y^ ^5^1 O 13 3 U
U h 4 1 ■H a 1 U b 4 * ■H a 1 B 4 '<H a z "o ki a> in 0 t» <M -W SZ b0> « 4> (^ *H - W 5 >< M rH s be ObO«4'DbWrH W rH 3? • 0bea4-obwM
JQ C 1 et • a at a a» 'H rn J3 a 1 c a c a H ^ a» o < QUO
rH ftr. «■H«b4>b3 &
05 rH Q.-, « -^ « b 4 » b 3 u 0 (0 rH £ H O 4» "M
kl rH W .0 W O. B JQ a P « rH£ V g a vi
W O. B CM h ae* b M rH »J £ , , D ■* 0, 3 0 B a a
0bVlii<V(brH0 • • D* r». 3 0 B
0 b <H 4 a c
l-H cs ""HM » f». .-1 0 ► U W O J8 B 06 rH * U W O J3 B X'H
a « 0 u a) 4 a a ei a y a 4 c 0 K g 'S) a» 0 b vi 0 0 xn 0 a> 0 b <H 0 2 5 at •CO • <M 3 O "O HH w .sS o> £ y • vi 3 O -O -H k -5 •« iH w -o 0 «5 aw » rH w -o 0 to 0 w ai tl n vi 0) 4 W 4 4 . « sg^ vi y 4 w 4 4
OX X K j . M 0 a a « a u 0 X * &e 0 a n (DC U « M B <! rH a -H w B a> ta-H X •-iS< r-t a -H w E « be-H
. :». t- > n •H T3 § a B a^ »arfvvv-HQ.
• ><H> n ^ -o B a » a 4 « 0 4 K E
E C rH
a • o5 o Id ^% a • ?s§ u >** ©«•■HO.
o a o >* 2 >, (0 04K8bbIOO. 0 0. E >. -o b b 0 Q. •H fc, 1 O DB 2 •3 s rH 0> 0) 3 3 -^ 4 ■H h. 3 'Z s M ay 3 3 -H 4 no ux 09 U N W
5 C rH (0 b W 0) B S8 SS05 ^i MO) b W 09 E CO H, rH OVC3440b CO •^ rH 0 v a 3 4 4 0 h
m u I-H 02 f* 1 <MtAV9lb«bO 4) UMOS IH 1 vi « a m b « b 0 u 4J U C_) o ◦ z - X Ifl 0) 4 4> B ai<H •
<M a) -Q a» a. m Ü W Sup 0S - X a a 4
<H a A a a B avi •
u a E >-i s SO •,? 0 a pr5 so ao cy a 10 A1 ai EL* bu •-< 0 u B B >>w a w < a, Ch^ ►H 0 y B B >,w ß w
0 b. > CO H a • 0) 0 « 4) Ä M O »H &
m>OTH a • A 0 a a JQ <n 0 H A • O M GO < et OWN ai b > tew 0 -H a
>. art a U1BW3 • OH
MX Q 10 « w&l
«< 4 0 WP» 09 b > bew 0 - c ■^ as X Q H X H X UrH ■rH 4X « X O M •>. a 4 a ifl S w 3 -1 lil fH 1/1 fad O «H 4 1 d J3 -H 4> -»H ^ 4 3 5:" 4 1 4 43 -n 0» H 4 O- « > OT >■
da s n u o is 03 fcl W rH »be NucabCbe
P M H e» >, 4 --« C 5*: 4 >co>
■sss ss • W b 0) m b w M
»60 N a x »H
0 m t. c ce 4 >. 4 -H c
yj§ « 0. w a. i H
a a 1 0.0 <
>,•« M rH <M rH 0) B -H q>.a>-Hb4aia>. u ^s 0 a 1
• 0. 0 < >. H «1 rH a >, v H
«H rH a E 'H
b 4 a. 4 >. o a XH U «UQ 4bbw3aa>(b Q p:- XH b 4» O Q 4 b b W 3 c a. x t, •«: Xi su i-i IJ. »-^ M M t-i «^ » a tie 3 ^ 4 «} a> '"; < Z « M P, M MQ Q «^ X -0 be 3 IT. 4 4 a 1<

-• e«
h (4 «
i g a oJ • 0
Mln.
S-^t Is- h***>£..» ai
a o I «a • O I«*« o
JO u - vi 3 co -^
to a ■ • a u
u a < m
I
MM MM
& -a* as 'H • B Q M K
S! 5 S« M Oi M i-i
«i • I 9 9-H d
• a 9 d d 0 M
V in KV a ♦*
> IP** Q^ a d a « ■«* 9
d >.«-H k d ad ►»
a (0
r-l I
0] "O ! (0 « 9)
U k d i as -o k<n
xi d i
^32
& n w o ■ i
■o o • i
■H a
a ■o
k V
*l k
,1k ax. *4 A **
.5 a at« «4
a - o
« a -H k k «< k a 9 a« ja ** UJS 9 a a o ♦* -^ «■H a k d
3I r-* ft-* U 0 an k
n
>, to
I
a ? 0)
0 *•«
• V kOt GO k «"H
&a I
k «OQ
a -H a a^ja k^ ♦* 9 0 Ok*; o ♦* O
a a o
♦» o vi a
wo a a -H •H-O | a o d o d K
a » c a «
1% o «
o a a k >
a «* a a
>,-H a S>.a
k k a-o M
-H o
C a -H F4 k d a k 9
a a a
u « a a k vi o
vi 9 oo -H c a a *»
d «< d d a a a o v i « M-H a a O-H a « a -H ft i k k a ft a 9 9 -H a k ♦* a « 9 a d o k § k • k o a a ■ ftvi . Sft a ■ >«*• a ♦< i A a O-H
wv Ö -H a a a i *> 3
■H a ■H ' d N u a k a M •H d >» d -H d
•H iiä a ft d ►• v 3 d ftM h 3 M d d « O
^ § O
O J§ - 0 2 ? k ♦* a «i ■-
a ft a k k «< h a i a :i ft » •
? 9 a k « *■• k r «
C 2 -« aT a at«. V« - *t
32^ l5l
OMaaTJk-- da a a «< ^
k ^H wH *« al*'
a u i a a N i
: tb
«
)f
CO
«d
. of
amir
t
of
and
atl
o
H
• H M SfM
ud SM2»0 <a Sh4 M
M ♦* a ■ 3 d d o k a k a k o d a a ftv • a ft a i ■ >.♦* a»»
• .a a o -H b -H a T - _
■H e -H a a o a k a M •H d >>a -H a
•H k a o," >. V 3 d O.K k 3 a d a e-o

CONTRACT RI8KARCH PROJF.CI ROORT
g'ARTERMASTER FUOD AND CONTA1N1R INSTITUTE FOR TIIE ARMED FORCES, CHICAGO Research and Engineer lag Coiuamnd, U. S. Army, QM Research and Engin<.>er ing Center, Natick, Masaacttuaette.
SRC )k|uipaent Corporation 160 Charlemont Street Newton Highlanda 61, Haas.
utticial Iiiveatigator - Dr. B. Kan
Project No. 7-84-06-032 Contract No. DA-19-129-QM-1S46 File No. A-338 Report No. 8 (Final) Period IS January, 1960
Collaborators - R. A. Yeaton R. E. Elwinger Title of the Contract - Improving Freeae-Drylng Proceas
Efficiency Through Improved Vapor Removal and In-Process Moisture Determination.
Introduction
Freeze dehydration is a process for drying food from the frozen
state. This is generally achieved by placing frozen food in a vacuum
chamber and t^en reducing the system pressure below the triple point of
tne phase diagram for water (roughly 4.6 torr). Under these conditions,
the ice in the frozen food can be sublimed by the application of heat
and the food solids remain as a mass of porous material without under-
going the shrinkage that is characteristic of food whose water has baun
removed by evaporation from the liquid phase. This lack of shrinkage
together with the fact that the dehydration is carried out at low tem-
perature and in the absence of oxygen generally means that freeze de-
hydrated products are markedly superior to air dried foods in quality
and therefore are of considerable current interest to both the food
industry and the Armed Forces of the United States.
At the present time the process is lengthy and the cost of re-
moving water by this means is usually calculated to b° higher than for
other dehydration methods. It was the original aim cf this project to
study the processing variables in order to arrive at optimum conditions
for short drying cycles and also to find a method of moisture analysis
»■hat could be used to follow the progress of the dehydration so that
the cycle could be stopped immediately after the proper moisture con-
tent was achieved.
-a-
Initial studi*» on tb« «If«eta of radiator tanparatur« and cnaaber praaaura on tha langth of th* drying cycla appaarad to abo« tnat there «aa a dlract ralatiooahip batvaan radiator taaparatura and Jrying rate; hovavar, no claar affact of cbaabar praaaura on drying rate could ba dlacarnad. It «aa found whan drying by radiant haat transfer (with tha food aupportad out of contact with tha aurfaca of the lower radiator) that Initial radiator taaparaturea could ba hlgbar than 400*F for a brlaf period of tla« at tha beginning of tha drying cycle if thay wara aubaaquaatly lowarad for th« raat of tha cycla. Ob- taining a conparlaon of tha affact« of tha various condition« on Hoycla time" proved difficult becauaa It «a« not poaalble to detaraln« th« end of the procaaa In a praclaa aannar. Accordingly tha projact wa« directed to finding iaproved «athod« of «ad point detamlnatlon.
This final report is prinarlly concerned with the investigation of end point deteraination. Tha Appendix Includes suaaarlaa of the contents of the progress reports which include details of other project work.
Due to the independent nature of the various phasea of thi« project this report will not b« divided into "procedures, reaulta and discussion" aectlona on an overall baaia, but will take the for« of a series of independent reports on the varioua studies. An innedlate exception will be the first section covering procedures used through- out the study and a description of the freeze drying equipment. Sub- sequently the sepaxate studies will be presented roughly In chronolo- gical order but with emphasis on logical development of thoughts.
Procedures and gqulpaent
A. Freeze drying unit Figure 1 is an outline drawing of the freeze drying unit uaad in
these studies. It consisted of a cylindrical drying chamber heated by electrical strip beaters fixed around Its outside wall. Inaldo the drying charobei was a stainless steel paddle wheel that mixed 1:he contents during drying. This set-up waa used in an initial seriell of experiments. Subsequently, the paddle wheel waa removed and a atiiin- less steel mesh was placed in the chamber and food placed on thia meah was dried by thermal radiation from the hot wall. Finally a act of two shelves was built. Each shelf consisted of four Chromalox electrical

GEAR MCTO«
i. »OADtKiG »0«T
COWOtNSlNÖ SüW^AC«.- fc" i D
CAPACITY.
ICC «CCKWC*- 1»«.intt«C»ATXD n'oo ÄHELU • 16' L6.
IVD MECHANICAL VACUUM PUMP
OUTLINE
^EEZE CRViNG PILOT --_/Vv~ NRC EQJiPMEN-T CORP
16 1

-3-
strip heaters sandwiched between two 1/8" thick blackened aluminum
plates. The shelves wore supported in a rack so that the distance
üetween the plates was adjustable. Both heating systems were elec-
trically controlled and could reach 400,F in temperature.
The vapor handling system was not changed during this project. It
consisted of a NRC V-3D rotary scraped condenser and refrigerated ice
receiver, both cooled by a two stage refrigeration system with a capa-
city of condensing five pounds of ice an hour at -68*F.
A 15 CFM rotary mechanical pump «as used for initial evacuation
of the chamber and for handling non-condensable vapors during drying
runs,
A four inch ball valve was located so thct it could be used t«-
separate the chamber from the vapor handling system.
B. Moialure Analysis
Moisture was determined gravimetrically after drying overnight In
a vacuum oven at 100oC as prescribed in the Official Methods of Ana-
lysis of the Association of Official and Agricultural Chemists (Eighth
Edition, 1955, method 23.2).
In the work with the dielectric moisture analyzer the large mass
of water that often had to be removed did not permit use of the drying
oven. It was therefore necessary to dry these samples overnight In
the freeze dryer at somewhat lower temperatures.
Initial Studies
The first runs were made in the NPC rotary freeze dryer. Ap-
proximately 20 pounds of 1/2" x 1/2" x 1" beef sticks were loaded into
the unit and dried under high vacuum while being mixed by a rotating
paddle wheel and heated by the chamber wall. Chamber pressure was
controlled by ai;.' or nitrogen bleed. In order to obtain uniform par-
ticle size the beef sticks were prepared by sawing frozen beef to the
desired dimensions.
In these runs an attempt was made to follow the progress of the
dehydration oy taking periodic samples of beef from the dryer for
moisture analysis. This procedure was found not to be useful because
the drying of the individual sticks was not uniform and it was not pos-

-4-
sible to withdraw a representative sample. This procedure was not
investigated further.
(R) Alphatron - McLeod Gauge Comparison
In the above runs the differences in values of McLeod and Alpha-
tron vacuum gauges were taken and were examined for their possible use-
fulness as a control reading.+ The procedure was based on the belief
that McLeod gauges measure only the partial pressure of non-condensable (R) vapors and the Alphatron measures the sum of the partial pressures
of all vapors present.
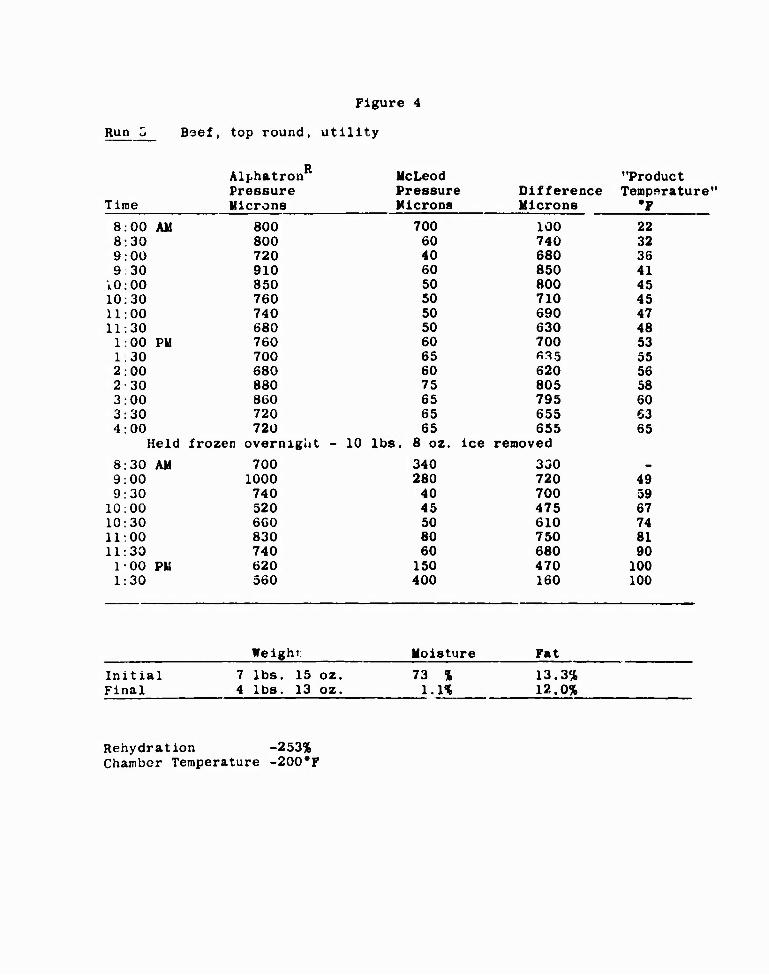
The results of four of these runs are shown in figures 2 through
5. There is no apparent relationship between the differences in gauge
readings and progress of the drying cycle. In figures 4 and 5 there
is some tendency for the McLeod pressure gauge readings to rise to-
wards the end of the drying cycle. This phenomenon is probably re-
lated to the one observed and reported below In the section on the
v'^por Sample Condensing System. At the time this work was done full
attention was devoted only to the comparison of the two gauge readings
and, since these were not fruitful, the comparative readings were a-
bandoncd.
The rise ii McLeod gauge reading was not further investigated.
In retrospect, it appears possible that controlling the pressure by
bleeding in non-condensable gas was partly responsible for the incon-
sistent results obtained.
(R) Reg. US Fat. Oil.
+ These gauges arc descriued in "Scientific Foundations of Vacuum
Technique" - S. Dushman and J. U. Lafferty, John Wiley and Sons,
New York, 1962.

Figure 2
DATA
Run 1 Beef, top round, good
Alphatron McLeod Pressure Pressure Difference
Time Microns Microns Microns
8:30 AM 1200 Off Scale Start 9:00 300 180 120 9:30 240 150 90 10:00 200 110 90 10:30 190 110 80 11:00 700 150 550 11:30 Ü60 400 260 1:00 PM 760 180 580 1:30 700 170 530 2:00 540 150 390 2:30 500 - - 3:00 500 120 380 3:30 560 120 460 4:00 580 105 475
Held in freezer overnight - 14 lbs. 5 oz. ice removed. Run continued next morning.
8:00 AM 760 Off Scale _ 8:30 760 75 68^ 9:00 620 170 450 9:30 560 190 370 10.00 760 255 506 10:30 760 280 480 11:00 760 270 490 11:30 720 85 635 1:00 570 140 430 1:30 800 150 650 2:00 820 160 660 2:30 620 240 380 3:00 640 360 280 Heat off 3: 15 3:30 760 330 430
Weight Moisture Fat
Initia 1 23 lbs. 6 oz. 72.2% 12 % Final 3 lbs. 10 oz. 1.4% 32.4%
Rehydiation -131% Chamber Wall Temperature -150oF

Figure 3
Run 2 Beef, top round, commercial
■o Alphatron McLeod Pressure Pressure Dilierence
Time Microns Microns Microns
8 00 AM 700 210 490 8:30 320 70 450 9:00 580 60 520 9:30 480 60 420 10:00 820 200 620 10:30 900 70 830 11:00 710 220 490 11:30 720 100 620 1 00 PU 660 75 585 1:30 720 100 620 2.00 700 75 625 2 30 1000 150 850 3:00 760 80 680 3:30 900 85 815 4:00 960 120 840
Weight Moisture Fat
Initial 18 lbs. 14 oz. 70.9 % 25 % Final 5 lbs. 9 oz. 1.25% 19.9%
Rehydrat ion -208% Chamber Wall Temperature -200,F
Run Z
Figure 4
Bsef, top round, utility
AlphatronR McLeod "Product Pressure Pressure Difference Temporature"
Time Microns Microns Microns •F
8:00 All 800 700 100 22 8:30 800 60 740 32 9:00 720 40 680 36 9 30 910 60 850 41 10:00 850 50 800 45 10:30 760 50 710 45 11:00 740 50 690 47 11:30 680 50 630 48 1:00 PM 760 60 700 53 1.30 700 65 fi?» 5 55 2:00 680 60 620 56 2 30 880 75 805 58 3:00 860 65 795 60 3:30 720 65 655 63 4:00 720 65 655 65
Held frozen overmglit - 10 lbs. 8 oz. ice removed
8:30 AM 700 340 330 m
9:00 1000 280 720 49 9:30 740 40 700 59 10:00 520 45 475 67 10:30 660 50 610 74 11:00 830 80 750 81 11:30 740 60 680 90 100 PU 620 150 470 100 1:30 560 400 160 100
Weighr Moisture Fat
Initial 7 lbs. 15 oz. 73 % 13.3% Final 4 lbs. 13 oz. 1.1% 12.0%
Rehydration -253% Chamber Temperature -200,F
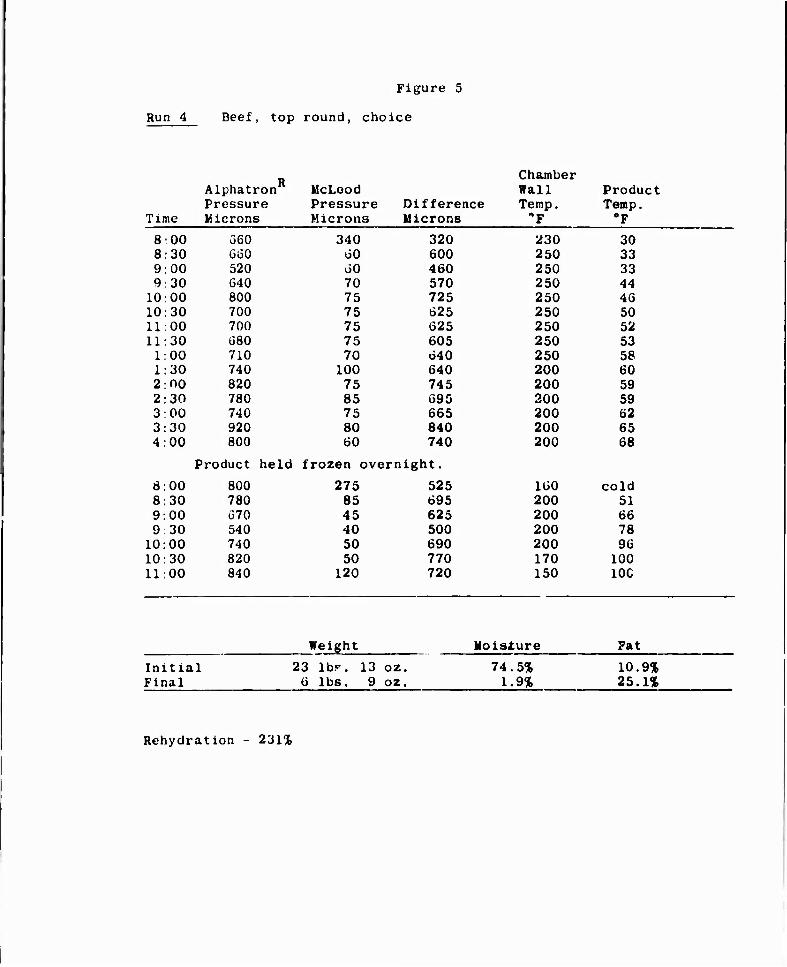
Figure 5
Run 4 Beef, top round, choice
Chamber Alphatron McLeod Wall Product Pressure Pressure Difference Temp. Temp.
Time Microns Microns Microns "F 0F
8:00 560 340 320 230 30 8:30 660 60 600 250 33 9:00 520 60 460 250 33 9:30 640 70 570 250 44 10:00 800 75 725 250 46 10:30 700 75 625 250 50 11:00 700 75 625 250 52 11:30 680 75 605 250 53 1:00 710 70 640 250 58 1:30 740 100 640 200 60 2:00 820 75 745 200 59 2:30 780 85 695 200 59 3:00 740 75 665 200 62 3:30 920 80 840 200 65 4:00 800 60 740 200 68
Pro duct held frozen overn ight.
8:00 800 275 525 160 cold 8:30 780 85 695 200 51 9:00 670 45 625 200 66 9 30 540 40 500 200 78 10:00 740 50 690 200 96 10:30 820 50 770 170 100 11:00 840 120 720 150 10C
Weight Moisture Fat
Initial 23 IbP. 13 oz . 74 5% 10.9% Final 6 lbs. 9 oz • 1 9% 25.1%
Rehydration - 231%

-5-
Moisture Distribution Within Charge During Freeze-Drying
It has been observed in earlier work that, if a freeze drying run
has been stopped short ol completion, residual xce may occur in a few
isolated pieces and that the amount of residual ice can be quite variable,
This variation can be attributed to non-uniformity of heat supply due
to uneven radiator temperatures or differing amounts of shadowing by
adjacent pieces. These variations in drying rate are of Importance
because at present the length of a drying cycle is determined by the
slowest drying piece. In addition, a non-uniform load tends to com-
plicate the task of determining cycle end points since acceptably low
overall moisture content values will not insure that all Individual
pieces are ice-free. It was therefore decided to perform some cxperl-
rents to elucidate the degree of non-uniformity that is being en-
countered in the drying of beef sticks.
A series of runs was made in the freeze dryer at each of two tem-
peratures: 150V and 200,F. Thirty beef sticks were placed in the
central zone of an aluminum mesh tray in a rectangular array and spaced
approximately one half inch apart. This was in order to minimize the
effect of non-uniform heat supply. The product was dried while sup-
ported between the electrically heated plates for varying periods of
time and was then removed and alternate pieces were analyzed for
moisture.
Fifteen randomly selected beef sticks were analyzed for initial
moisture content. The mean moisture content was 74.7% and the range
was 72.7% to 76 3%.
The results of the drying runs are shown in the following table.
They are expressed as percent moisture content and are shown in the
same relative positions they occupied during drying. There is ap-
parently no tendency for sticks in any single position to dry faster
than in any other position suggesting that variations in drying rate
due to variations in heat input were successfully minimized.

-6-
Moisture Contents of Freeze-drled Beei Sticks Arranged According to their Positions During Drying:
3 hours at 200^
33.9% 27.4% 17.3%
26.9% 30.5% 12.3%
10.9% 10.3% 14.5%
Id.7% 21.1% 2.2%
7.0% 12.2% 25.8% all had wet centers
4 nours at 200oF
•3.7% 1.4% 1.7%
•4.3% 0.9% 1.7%
1.5% 2.5% 1.7%
1.8% 1.1% 1.3%
•ö.8% 3.0% 1.2% «wet centers
5 hours at 200oF
0.0% . 0.0% 0.0%
0.6% 0.4% 0.3%
0.o% 0.ü% 0.6% 0.8% 0.4% 0.8%
13% 0.9% 0.9% all were dry
4 hours at 150*F
15.8% 28.0% 6.4%
10.0% 25.0% 19.2%
30.9% 16.2% 26.9%
21.9% 23.7% 5.7%
21.5% 27.6% 2.8% all had wet centers
-7-
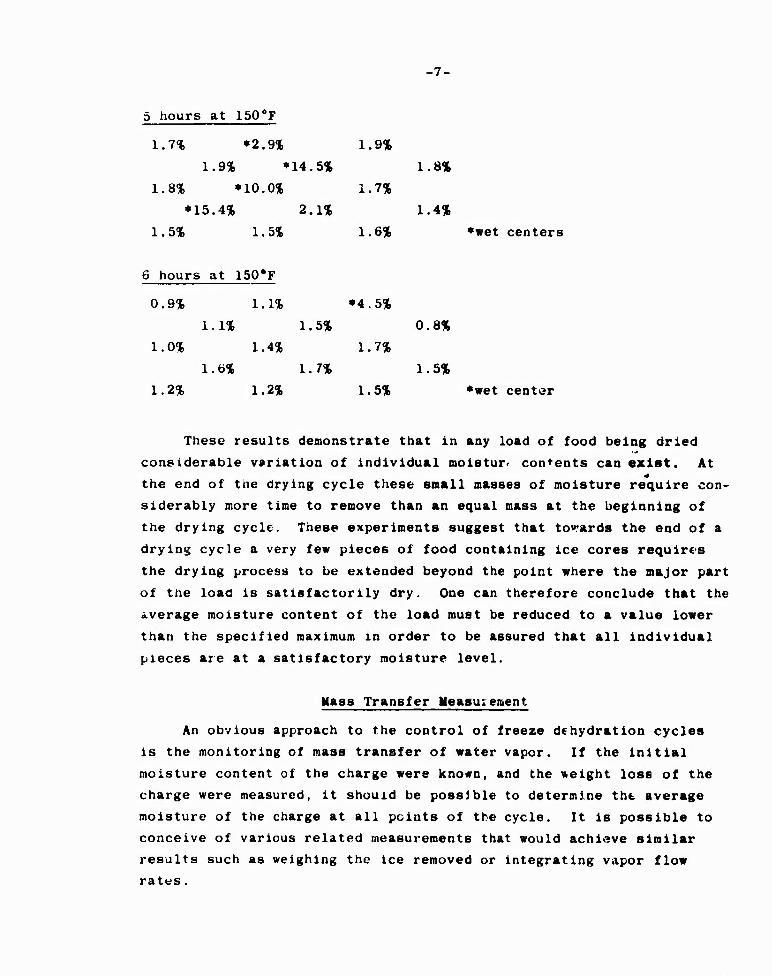
5 hours at 150oF
1.7% »2.9% 1.9%
1.9% ♦14.5% 1.8%
1.8% »10.0% 1.7%
•15.4% 2.1% 1.4%
1.5% 1.5% 1.6% »wet centers
6 hours at 150*F
0.9% 1.1% »4.5%
1.1% 1.5% 0.8%
1.0% 1.4% 1.7%
1.6% 1.7% 1.5%
1.2% 1.2% 1.5% «wet center
These results demonstrate that in any load of food being dried
considerable variation of individual moistur. contents can exist. At
the end of the drying cycle these small masses of moisture require con-
siderably more time to remove than an equal mass at the beginning of
the drying cycle. These experiments suggest that towards the end of a
drying cycle a very few pieces of food containing ice cores requires
the drying process to be extended beyond the point where the major part
of the load is satisfactorily dry. One can therefore conclude that the
average moisture content of the load must be reduced to a value lower
than the specified maximum in order to be assured that all individual
pieces are at a satisfactory moisture level.
Mass Transfer Measuiement
An obvious approach to the control of freeze dehydration cycles
is the monitoring of mass transfer of water vapor. If the initial
moisture content of the charge were known, and the weight loss of the
charge were measured, it should be possible to determine the average
moisture of the charge at all points of the cycle. It is possible to
conceive of various related measurements that would achieve similar
results such as weighing the ice removed or integrating vapor flow
ratus.

-8-
On an experimental scale the measurement cf weight loss is cer-
tainly of value in assessing the effects of processing variables. On
a commercial scale it is necessary to know the rate of vapor evolution
as a function of time in order to design equipment properly. As an end
point indicator, however, the measurement of weight loss is not an
attractive procedure. It is in the first place difficult to obtain an
accurate value of the starting moisture content and, secondly, the
asymptotic drying curve results in very small changes in mass per unit
of time at the end of the cycle.
It is not necessary at this point to completely reject all mass re-
lated methods of end point sensing, since it may be possible to make
use of an in-process moisture analysis to obtain readings in various
parts of a freeze dryer. This procedure would enable one to sense the
presence of wet spots without having to consider this localized mois-
ture as part of the moisture content of the entire load. This subject
will be covered in greater detail below.
Thermocouples as End-Foint Indicators
It is a common practice today in commercial freeze dehydration
plants to imbed thermocouples in the food being freeze-dried in order
to follow the progress of the drying cycle. Towards the end cf a
drying cycle the evaporative cooling due to sublimation of the ice is
reduced and the internal temperatute of the product rises. The process
end point is taken to be that time when product temperature reaches
some predetermined point .
Thermocouple measurements under thebe conditions axe subject to
error for a number of reasons. The manner in which the couple is im-
bedded will influence the reading. The exact location cf the couple in
the piece of food will also influence the reading. It is not only like-
ly that heat transfer down the thermocouple will affect the temperature
in the immediate vicinity of the Junction, but it may even increase
drying rate of the test piece. Bui. aside from inaccuracy the method
suffers from a sampling nroblem, and there is no assurance that the
rest pieces are representative of the slowest drying pieces in the load.

Consequently, it is usually considered prudent to dry the load for
some additional period of time beyond the indicated end-point to in-
sure that no ice remains in any other part of the load.
In spite of these limitations this technique is commonly used to
monitor freeze drying processes simply because no better method is
presently available.
Vapor Pressure Rise
A technique that has long been used in vacuum process work is the
measurement of the change in pressure that occurs when the chwfcer is
isolated from the pumping system. One such application has been in
the control of metal degassing processes.
The taking of the vapor pressure rise measurement (henceforth re-
ferred to as VPR) involves closing the four inch ball valve and ob- (R) serving the change in chamber pressure on an Alphatron vacuum gauge.
It is possible to choose any arbitrary time period over which to mea-
sure the VPR, but in these experiments it was fouwd convenient and ef-
fective to measure the VPR over a period of ten seconds.
Obviously the pressure must be allowed to rise enough to produce
a readable change in the pressure gauge, but should never go so high
as to result in thawing of the product.
An attempt was made at the outset to correlate the VPR with ice
temperature. It was confirmed that both the temperature of ice cubes
and ol ice in a beef stick could be controlled by controlling the
partial pressure of water vapor in the drying charabei, but no relation-
ship between ice temperature and VPR was found. Instead the VPR seemed
more affected by changes in radiator tem|arature than by water vapor
partial pressure in the drying chamber. Various other factors were
expected to influence VPR values such as chamber size, load size,
natur of food, and size of pieces so that it was not possible to in-
terpret VPR readings except in largely qualitative terms. An attempt
was made to correlate terminal VPR readings with residual moisture
content , but no correlation was found even though all runs were made
en beef sticks and at the end of all these runs the radiator tempera-
tures ware the same.

-10-
Pigure 6
Comparison of Terminal VPR and Moisture Contents
♦♦R.S. T. 10 T.M.
20 200 1.1
20 350 1.9
20 100 1.1
20 200 1.1
20 600 2.3
20 400 1.1
20 140 1.1
1 1 100 150 1.0 2.9-1.4
R.S. T. 10 T.M.
1 20 .35-.48
1 20» 1.1-
1 50*
.97 1.6- ■1.3
1 12 1.3-.99
1 4 1.2-, 92
1 30 1.3- •1 .3
1 0+ 1.0-.95
R.S. T. 10 T.M.
1 4
2.1-1. 2
1 4
3.4-
1 20
1.3 .96- .81
1 8 1.5-1.3
1 5
1.3-1 .1
1 5*
1.5- ■1 .4
1 0+ 1.1-1.0
♦ 20 Sec. VPR + read on xl scale, rest on x.l or x.01 scales •*R.S. - Run Size (lbs.)
T. 10 - Terminal 10 sec VPR T.M. - Terminal Moisture (%)
The VPR measurement, unlike Imbedded thermocouple measurements, does
respond to the condition of the entire charge. The measurement is sen-
sitive enough to be used in following the drying of a dingle T/2" x 1/2"
x 1" beef stick in a chamber whose volume is over 60 liters, (figure 7)
This is not surprising since calculation will show that a rise of 80
microns pressure iu this chamber represents the vaporization of Just
live milligrams o' ice.
Figure 7
VPR (micrcns) of single beef stick during a process cycle.
Time (min.) 30 60 90 140 10 sec. VPR 80 55 15 3 20 sec. VPR 160 100 30 6 40 sec. VPR 330 200 60 U
In spite of the lack of a precise mathematical understanding of the VPR
measurement it has still been possible to use it as an empirical end
point indicator on a laboratory scale.

-11-
In general, during the course of a run the VPR rises from some
initial value to either a maximum or a plateau and then decreases e-
ventually to some very low value, (see figures 9,10). On the basis of
previous experience it is possible to select some level, below which it
is safe to presume that the charge is dry. The VPR technique is es-
pecially useful when drying numbers of materials for the purpose of
producing samples.
An obvious limitation of the VPR system is that chamber leakage
will interfere. Chronic leakage should not be allowed to exist and
sporadic leakage would simply indicate drying cycles to be longer than
they actually were. The system therefore will "fail-safe". An ac-
ceptable leakage rate for a 7' x 7' x 4* chamber would be 5-10 microns/
hour. Smaller chambers would have higher values. A less obvious pro-
blem is that the sensitivity of VPR readings will be dependent on the
operating pressure range since VPR readings must inevitably be taken
against the chamber pressure as background. The chamber pressure de- (R) termines the Alphatron scale being read which, in turn, determines
the sensitivity with which a VPR value can be taken.
Vapor Sample Condensing
(R) Because the earlier comparison of Alphatron and UcLeod pres-
sure gauges could not ue correlated with the progress of the drying
process it was decided to see whether trapped and untrapped Alphatrons (R)
would give a better measure of the partial pressure of water vapor in
the chamber atmosphere. It was found that there was no correlation
between the readings of trapped and untrapped Alphatrons and the pro-
gress of the process. In some runs the trapped Alphatron read a higher
pressure than the untrapped Alphatron. A qualitative explanation of this
unexpected reversal is that the pressure at the two sensing heads
was equalized since obstructions in the line leading to the trapped
Alphatron were kept to a minimum and the trapped Alphatron was exposed
to an atmosphere of noncondensable gas mid the untrapped Alphatron was
exposed to an atmosphere of water vapor. Since water vapor gives a
lower apparent pressure reading than air, this coald account for this
observation except that the size of the reversal was too great to be
brought into line by the appropriate correction factor.

VA,\>OP SAMPLE. COMD«>«»\KJG ^VSTEM
Al.PHAsTROU^
^ 1 r—>
CHA^ABLR 1 r CONOLMStR ^.^ 1
1 I i VACUUM PVJMP
j TR^P
® ALPHATROKi
L^ L h V CHAVA^CR
_ COMDtN«R AOMO VACUUM PUKAP
r f—^—' 1 CUIkMP
1 n I ) CUT-OfT
J TRAP |
K (§)
Ol t V
ChAMALR _ COMDCKAtÄ A>4D VACUUM PVJMP |
(\
J J
X f
1 1
{ [ ' !
im
i; cuT-orr ' 1 1' 1
/ i
TRAP W\TH VJ.a\J»D N\TPOGLV4 ^KTH
PIG. a A-TS^\ |

-12-
It was decided to operate with just the trapped Alphatron and com-
pare its reading when the trap was uncooled (figure 8-1) with Its
reading when the trap and Alphatron were isolated from the chamber
(figure 8-II) and the trap was cooled with liquid nitrogen (figure
B-III). The results of two runs are shown in (figures 9, and 10).
Figure 9
Vapor Sample Condensing as an end point indicator (1000 microns operating pressure)
••T. 30 60 90 120 150 180 210 240 300 330 O.P. 900 900 1000 1200 1200 1100 1000 950 1000 1000 C.S.P. 10 10 12 12 20 10 10 11 95 240 VPR 200 500 400 600 500 500 200 100 25 0
Figure 10
)oint ind (100 to 14 microns operating pressure) Coniensing Alphatron as end point indicator
••T. 30 60 90 120 150 180 210 240 270 :oo O.P. 100 64 46 36 28 22 13 15 14 14 C.S.P. 8 5 3.8 3.2 3.6 3.6 2.8 6 4.4 5.1 VPR 300 300 360 340 360 260 100 20 £i 4
••T. - Time (minutes) O.P. - Operating Pressure C.S.P. - Cooled sample Pressure VPR - 10 Second VPR
In Figure 9 the chamber pressure was maintained at 1000 microns by
bleeding air into the refrigerated condenser. In this run the "cooled
sample pressure" or CSP remained low throughout most of the run, but
rose in the last two readings taken. In Figure 10 the chamber pres-
sure was not controlled and the decrease in total pressure made the end
point hard to detect.
The original assumption was that the entire isolated volume comes to
equilibrium at the temperature of liquid nitrogen. (-320oF).
Calculation of the gas low contraction on this basis predicted pressure
drops to values roughly 20% of the original pressures. Tests run on
the empty chamber showed that this assumption was false, (figure 11)
-13-
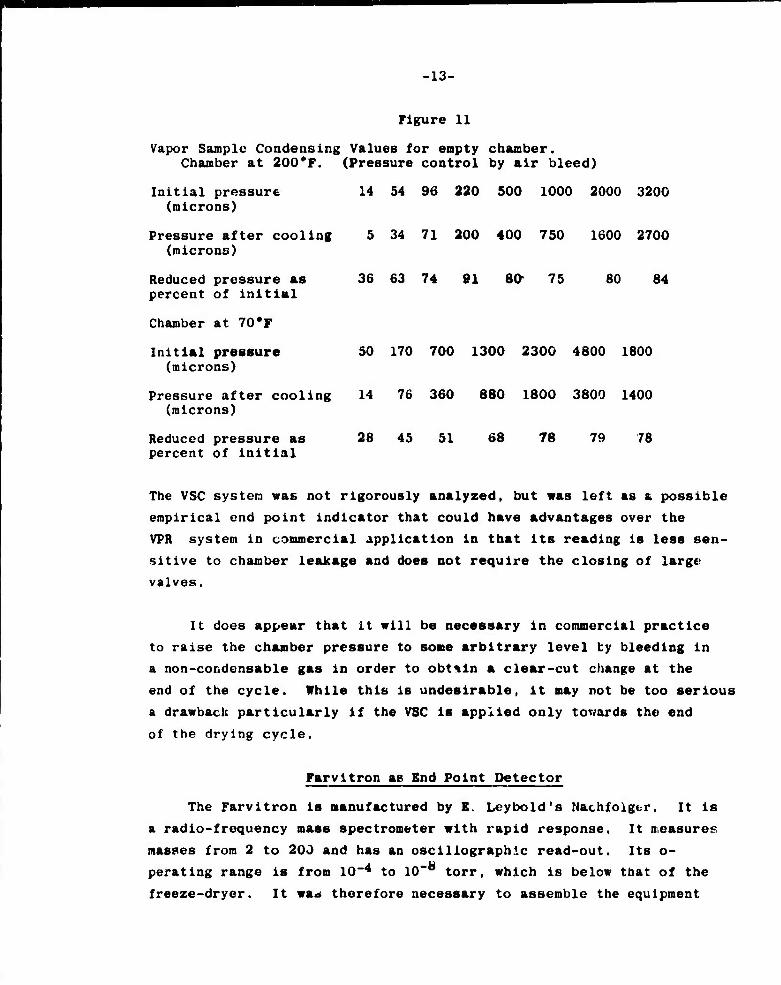
Flgure 11
Vapor Sample Condensing Values for empty chamber. Chamber at 200*F. (Pressure control by air bleed)
Initial pressure (microns)
Pressure after cooling (microns)
Reduced pressure as percent of initial
Chamber at 70'¥
Initial pressure (microns)
Pressure after cooling (microns)
Reduced pressure as percent of initial
14 54 96 220 500 1000 2000 3200
5 34 71 200 400 750 1600 2700
36 63 74 91 80- 75 80 84
50 170 700 1300 2300 4800 1800
14 76 360 880 1800 3800 1400
28 45 51 68 78 79 78
The VSC system was not rigorously analyzed, but was left as a possible
empirical end point indicator that could have advantages over the
VPR system in commercial application in that its reading is less sen-
sitive to chamber leakage and does not require the closing of large
valves.
It does appear that it will be necessary in commercial practice
to raise the chamber pressure to some arbitrary level by bleeding in
a non-condensable gas in order to obtain a clear-cut change at the
end of the cycle. While this is undesirable, it may not be too serious
a drawback particularly if the VSC is applied only towards the end
of the drying cycle.
Farvitron as End Point Detector
The Farvitron is manufactured by B. Leybold's Nachfolger. It is
a radio-frequency mass spectrometer with rapid response. It measures
masses from 2 to 200 and has an oscillographic read-out. Its o-
perating range is from 10~4 to 10 torr, which is below that of the
freeze-dryer. It wa* therefore necessary to assemble the equipment
-14-
shown in Figure 12. The oil diffusion pump holds the pressure in
the tost dome to the 10~5 to 10"^ torr rar.ge even when the chamber
is connected to the system. The Farvitron head is thereby exposed
to gas molecules flowing from the drying chamber, but at a low enough
pressure so that it can be used. This set-up may be thought of as
a "pressure transformer".
The results are shown in Figures 13 and 14. Initially (Frame 1)
a high peak at mass 28 was observed. This was attributed to nitrogen.
As the dehydration began the peak at mass 18 increased to a high value
(Frame 2) indicating water vapor and, because of peak interaction in
this instrument, the peak at mass 28 was depressed. As the process
proceeded to its end (Frames 3 through 8} the mass 18 peak once again
decreased and the mass 28 peak correspondingly increased back to its
original value. At the end of the run, when the VPR reading Indicated
adequate dryuess the wall temperature was raised to 400SF in an at-
tempt to obtain other peaks due to possible breakdown products. No
such peUts appeared. However, the water peak again rose (Frame 9)
together with the VPR. After 15 minutes at 400,F the water peak again
decreased (Frame 10) and the VPR also dropped to 4 microns. Pre-
sumably more tightly bound water was driven out by the drastic heating
at 4008F. Two other runs were made with similar results. Thus, it
is apparent that the Farvitron can be used to follow the progress of
a drying cycle although it cannot be used to detect breakdown pro-
ducts of the beef. If the appropriate end point relationship between
H2O and N2 peaks is established the Farvitron can be used as an end
point indicator. Frame 7 in Figure 10 may be taker, as the end point
in the example presented. Figure 15 shows the actual pressure vali|es
measured during the run.
The Farvitron method of end point determination is related to
the VSC system in that a relationship between water vapor partial
pressure and nitrogen partial pressure is used to indicate the end
ot the drying cycle.

uJ
2 O iV H >
ft 0 u. d n
U)
2
a 'i a u
u.


Figure 15
Frame Time hours
Chamber Pressure (microns)
Done Pressure (x 10ö)
VPR (microns)
1 0 — 2.4 _
2 1 64 5.6 220
3 2 36 3.8 220
4 3 28 3.2 240
5 4 20 2.5 200
6 5 14 2.2 55
7 5 1/2 10 2.0 12
8 6 12 2.0 4
9 6 1/2 26 2.6 80*
10 ü 3/4 52 3.8 4
•Chamber wall raised to 400*?.
The uifference between the methods is that whereas the VSC requires in-
leakage sufficient to bring the chamber pressure up to about one torr,
the Farvitron registers a background nitrogen peak that is due to in-
leakage at a much lower pressure. The Farvitron method therefore does
not require the opening of a deliberate leak in the system. It has
the other advantage of giving a continuous reading.
Inira-Red Detection of Product Surface Temperature
In earlier work with freeze drying of beef sticks it appeared
that when operating at total pressures less than one torr it was pos-
sible to scorch the meat without causing melting of the ice. High
vapor pressure rises indicative of thawing were not observed and the
product was in all cases found to have dried without the typical har-
dening that occurs when beef is dried from the thawed state. It was
concluded that product surface temperature was the limiting factor
and that it should be sensed ard controlled. In addition it was felt
that a method of measuring product temperature that wa.s more accurate
than thermocouples would be of value as an end point detection method
when used Instead of thermocouples. There were some hopes that a
scanning system couJd be developed so that temperatures In various
places inside a dryer could be read. Attainment ol this goal, while
-15-
technically feasible, would require considerable additional develop- ment. The Barnes Engineering Co., Starolord, Connecticut, manufactures infra-red sensing devices that should be suitable for reading product surface temperatures. Their model R-4D1 Industrial Radiometer was obtained so that the feasibility of this measurement could be esta- blished.
Briefly, this equipment consists of two units - a sensing head and an amplifier-power supply. The sensing head contains an optical system of mirrors that focuses target radiation on the radiation de- tector - a thermistor bolometer. In front of the detector there is a chopper that opens and closes the sensing aperture at a 150 cycle per second rate. The chopper causes the detector alternately to see the incoming radiation and a reference source near the detector. The result is an alternating signal whose peak to peak voltage is propor- tional to the difference between target and reference source radiation. The amplifier contains a vacuum tube voltmeter, a synchronous rectifier and a temperature monitoring circuit for determining the temperature of the reference black body.
The radiometer head is pointed at the target and is focused either by projecting a focusing light spot or adjusting the distance scale and sighting the target through the periscopic sight. In the experi- ments reported here readings were then taken on the vacuum tube volt- meter which indicate the output of the radiometer amplifier.
The first experiments were an attempt to follow the surface tem- perature of beef as it was being freeze dried. The radiometer was focused through an infra red transparent germanium sight port onto a piece of beef inside the drying chamber. The beef also had a thermo- couple imbedded in its surface.
It was found that a qualitative relationship between radiometer reading and thermocouple reading could be established. In other words, the radiometer did indicate tho initial temperature, a decrease in temperature as the chamber was evacuated followed thereafter by a steady temperature rise. Two difficulties were encountered: 1) the germanium window attenuates the signal and this attenuation was ap- parently different .t the beginning and end of the run, and 2) the
-Id-
equipment has a noise zone around ambient temperature wherein nu
meaningful readings can be obtained and the noise zone is effectively
enlarged by the attenuation due to the germanium window.
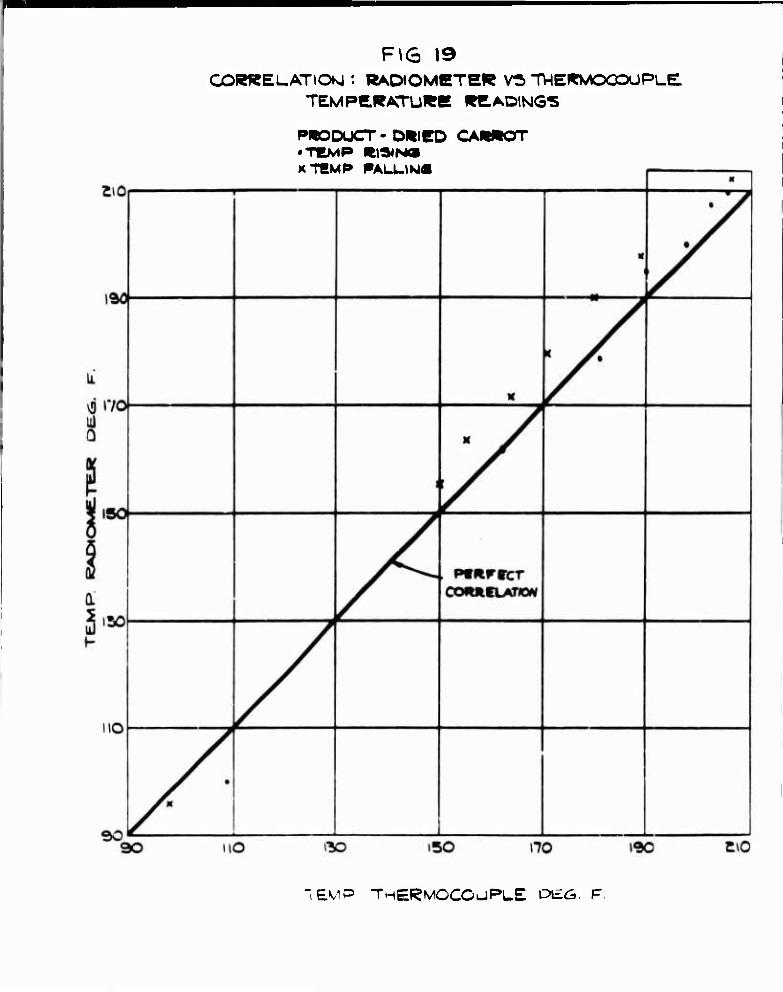
In the second group of experiments various freeze dried foods were
fitted with thermocouples on their surfaces and placed in the chamber
at atmospheric pressure. The germanium window was removed and the
surface temperature of the food was read directly through the aperture.
The temperature of the food was raised by the heated chamber walls.
The readings obtained are shown in Figures id through 20. It is ap-
parent that the emissivity of the various foods tested must be quite
similar and all of them seem to be high which is favorable, since the
likelihood of reflectance of energy from the hot radiators is reduced.
It is not possible to determine which values are absolutely correct
since the radiometer is considered the unknown and the thermocouples
themselves are subject to error.
In application, however, it would not be necessary to establish
an absolute value for the temperature at which scorching occured so
long as this value could be reproducibly measured by the radiometer.
Use of a germanium sight port appears im'.'actical bezause it is
not possible to see through it to focus. In addition, the problem
with variable signal attenuation was not solved. It may be possible
to operate the radiometer head inside the vacuum chamber. If this
were the case the radiometer could be used without modification to
monitor a belt drying process, but a system to permit scanning of
the various levels would still have to be developed to enable use
of the radiometer to monitor a cabinet shelf dryer.

FIG 16 CORRELATION ; RADIOMETER VS. THERMOCOUPLE
TEMPERATURE READIKIG5
Z)0
190
lü Ü
f* til y- uJ 5 i50 U Ü
Si
a.
i0
30 SO
PRODUCT-DRIED
X TEMP PALUW«
BE.BF STICKS
v ^
• V A -P»W«CT QOMtCLATiOKI
•
MQ 130 'SO no l<V">
TEMP THERMOCOUPLE DEG F.

FIG 17 CCR^ELATIOKJ : RADIOMETER VS THERMOCOUPLE
TEMPERATURE READINGS
EO
t90
^170
lil D
U h- !il ISO i. Ü 0 <
\™
HO
PROCX»CT - DR»eD MUSHROOM • TCMP RiSiNS X TEMP PALUM«
M* 1 X x
^r x
X
r x
\
/
-F«J«rCCT COWIULATIOJ
/ •
j
1
1
^o I50 I7C «•30 2.0
"EM^ TWERMOCCÜP..E rjcc r

FIG ia CORRELATION: PAD.OVIETE.R V5 THERMOCOUPLE.
"EMERATUl^E PELADIMGS /'
1
2 0
• TEMP »\«>IKJ<3 X TEMP FAl_i_lN»<3
Y
•
X \y »90
K /
/ 1 1
3 . / X
D I70 /
/
UJ t- ij 5 ISO 0 ■-s J
i
•
/
yC f-
• /
CO«CCL>TIOJ
• ^r
!
1 1 1
\:r\ iSC \io I9C5
■EV=» •'-E-^vccou^-E otö r
GORREL_ATlOKI : RADIOMETER V-> TWERKAOOOOPLE TEMPERATURE READIMGS
PHODUCT - DRIED «TEMP RISIN« XTCMP FALUN«
£VIP THERMOCOUPLE CKLG. F.

2£2
^lO
iL 190
y 5
3 UJ
d Ü <
d
01
170
150-
1^0
MO
9C
CORRELATIONJ: RADIOMETER VS THERMOCOUPLE
TEMPERATURE REACHMQS +- • T| XT1
/'
5DUCT-DRIED SMRIMP LMP RISING
^
•
•
* rl K
/
M
/
/ COVftCLA.TION
^
| 1/ ^^ no ISO i?0 «TO i90
TEMC= TI-E^MOCCUPL-E: or«:-» r
-17-
In-Process Moiature Analysis
A. General
As mentioned earlier, the measurement of the moisture content of the entire load of food as It dries does not have much promise as a method of process end-point detection If a sharp indication is required. It is conceivable that a method with sufficient sensitivity could be used to follow a drying process to some empirically established end point value.
A variety of possible methods of detecting moisture in food were examined Including dielectric, nuclear and ultrasonic. None of the methods first examined appeared applicable to the control of freeze dehydration processes. At this point the services of Lion Research Corporation were retained as experts in biological instrumentation and the primary recommendation of their report (reproduced in progress report number 5) was that RF conductivity or power absorption measure- ments showed promise of correlating with moisture content. Concur- rently it was learned that an Instrument of this type was available commercially for moisture measurement fron, the Boonton Polytechnic Company, Rockaway, New Jersey. Earlier work with a dielectric moisture analyser had not produced usable results because it measured the ca- pacitance of the sample which, in turn, wa« influenced by the samples fat content (quite variable in the case of beef sticks). The Boonton instrument was not expected to be affected in this way.
The Boonton Polytechnic Company developed a special electrode EF- 8 for use in this investigation. It consisted of two blackened, per- forated sheets of 3/16 inch thick aluminum that were held in aluminum frames. The entire assembly was made so that it would fit between the electrically heated radiators in the NRC freeze dehydration unit. Suitable electrical connections wore made with RF cables between the electrode and an Amphenol feed-through installed it the chamber door and from there to the instrument read-out.
The read out was the standard Boonton Polytechnic Coupany HFR-4E modified to operate at 50 volts RF output. This increase in voltage was necessary because the BF-8 electrode was designed to be non-con- tacting.

-18-
In operation, the EF-8 electrode was used as the product carrier.
After nulling the electrode to a minimuin reading of 3, one pound of
frozen food was placed in the electrode and the two parts of the elec-
trode were fastened together ncchanlcally in order to minimize vibra-
tion of the assembly. The food rested on the lower electrode and did
not touch the upper electrode. The assembly was placed between the
electrically heated platens spaced six inches apart and freeze drying
was carried out in the usual manner.
B. Drying of Beef Sticks - Calibration Curve
In the first run it was established that the electrode could be
used in a vacuum and the results of a typical run are shown in Figure
21. It is apparent that the moisture analysis could be used to follow
the loss of ice as the drying proceeded. The Boonton analyser readings
are in arbitrary units. In normal use the instrument must be calibra-
ted against standard samples of known moisture content.
The initial reading on one pound of frozen beef sticks, taken
before the chamber was evacuated, was 300 in the run recorded in Figure
21. As the chamber was evacuated to a pressure below 4 torr the ana-
lyser reading was observed to rise to a considerably higher value,
reaching a maximum in about 8 minutes. This maximum occured when o-
perating pressure had been reached and it was found possible to affect
the analyser reading by isolating the chamber and allowing the chamber
pressure to rise. An Inverse relationship appeared to exist between
chamber pressure and analyser value. Since subsequent studies showed
that the high reading after the pull-dowr. corresponded roughly to the
cxptctcd initial weight of moisture in the charge it was decided that
the low Initial reading would be disregarded und, since this starting
phenomenon appeared not to affect the utility of the instrument in
monitoring the drying process, no concerted effort was made to explain
this unexpected behavior.
A series of runs were made with one pound loads of beef sticks in
which drying was stopped at various Boonton analyser readings short of
dryness. At the termination of each run the charge was weighed and
tnen completely dried in order to obtain a measure of the weight of

Figur« 21
Typical results with Boonton analyser 1F-8 electrode using 1 pound
of beef sticks 2/21/32
Tine Total
Pressure (u) Boonton Reading
Radiator Tesperature (*F)
Vapor Pressure Rise 10 sec. (u)
8:30 Start 300 - -
9:00 62 1280 250 60
9:30 52 1160 200 70
10:00 46 980 200 90
10:30 46 850 200 120
11:00 43 740 200 150
11:30 40 625 200 180
12:00 38 520 200 190
1:00 32 310 200 240
1:30 23 220 200 260
2:00 25 154 200 240
2:30 22 95 200 210
3:00 16 49 200 140
3:30 12 30 200 50

w IV 1
u a. (k ID , ID '
< I vj
Ü tu \n o
ü >
t 2 H O
v2
s S 2 c t 2
PPEE7E DEWVD^ATIOKJ OF BEEP STICKS VAieiATIOM OF VAPOC PßESSURE Pl^F^VPI^, BOOKJTON
ANALVSEie VALUFS AS FUMCTlOKJ OF TIME
LOAD - / ROUMD SWBI_F TEMP- Z500FjWr ZCtfFöjMRS, AKJALV5EI? - HFR Ä 5^ ELECTRODE - EF Ö
A TOTAL. PRESSUCE^/ 0 VPR. IO 5)F.C>/ 0 BOOMTONJ KEADlNkS
000
^ N s ■•
T s ̂ ^1
^, 1
]
s S [
f-" H tr^ ̂ L
irv\
1 J ^
^
)^ 5 N \
N V
V IUU
^^ r r \ \
t S < \ \
f
^ ^^^^^^^< &. \ V
■> ̂ s \^
\
! L
\
3 4 TIME - HOURS
Q> 7
Flö ZIA

-19-
molsture corresponding to the final analyser reading taken in each
run. The results are shown in Figure 22 as a plot of analyser readings
against residual moisture.
The relationship of analyser values to residual moisture in beef
sticks fall on a curve that is close to a straight line. As indicated
in Figure 22 stopping runs at three different temperatures did not
affect the reliability of the instrument. Since dielectric loss is
affected by temperature (see our progress report number 6) it was
necessary to determine if radiator temperature would influence the
analyser reading.
Four runs were made using beef-sticks that had been boiled for an
hour and then refrozen. Three of these points deviate a little from
the raw beef curve. This may be attributed to geometric factors since
the cooked beef sticks were not as uniform in size and shape as the
raw beef sticks which were sawed to size while frozen.
It should also be noted that the curve does not go to the origin
since even beef sticks dried to the point where no further weight loss
can be found by vacuum oven drying to produce a Boonton reading of
about 10 units.
C. Drying of Corn
Commercially available loose frozen whole kernel corn was used
in a series of runs in order to establish calibration curves for this
product. The moisture content of the corn at various analyser readings
was again determined by vacuum drying ovsmlght at 100*F, 125*F and
150*F. The temperature at which the moisture analysis was made ap-
peared to affect the results, but this phenomenon could not be ex-
plained.
A fourth series of runs «as made in which the corn was comminuted
in a Waring blendor and then frozen as a rectangular block before being
dried in the usual manner. Ulis was done» in order to produce a more
uniform sample. This fourth series of runs produced a smooth curve
whuse slopo differed from the curve obtained whon the whole kernel corn
was re-drled at 150oF. The difference in slope can be attributed to

P\GÜ%\1 ZZ
I^ELATIOMSHIP BETWEEKJ BOONJTOM AKJALVSEl^ VALUED AMD RESIDUAL MOlSTUieE - BEEF STICKS (ILB.KJET)
600 A
A MTMDßAWKJ AT 150° P
O WlTHDeAWKi AT 200° F
□ WlTHDRAyA/KJ AT ZSCfP
• COOKED BEEF STICKS
AC 60 SO 100
R'-~Sir-JAU MOISTURE (%r^
140
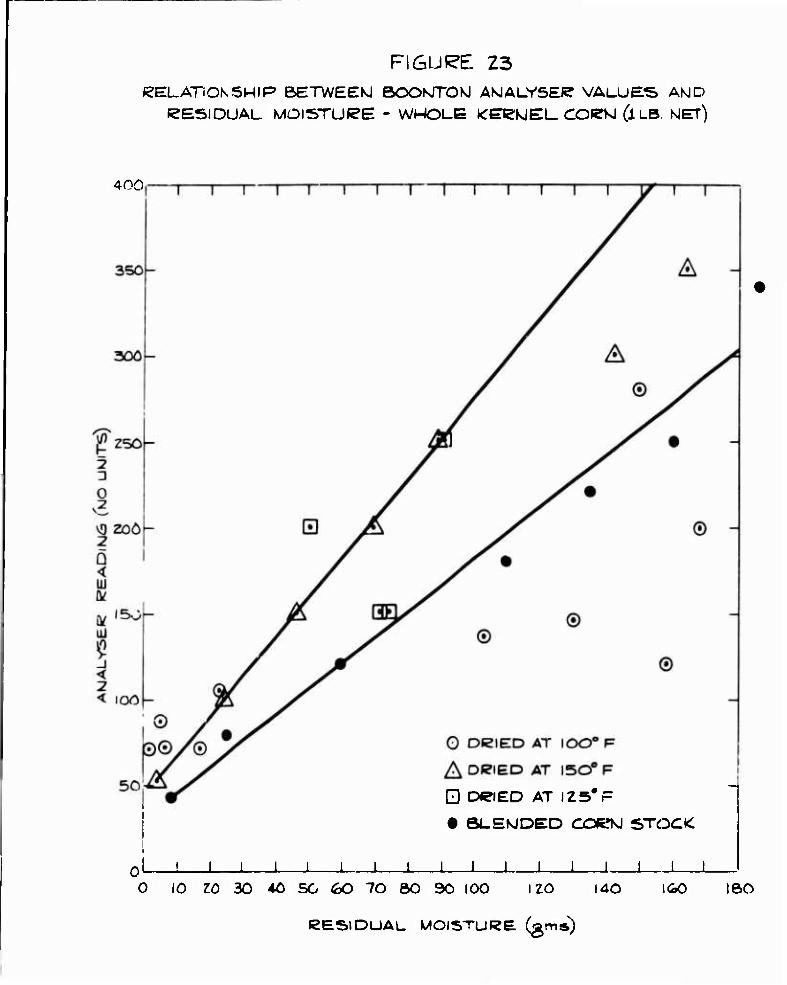
FIGURE 23 CELATiONSMIP BETWEEKJ EOOMTOK) ANJALVSEI? VALUE'S AMD
RESIDUAL MOISTURE - WHOLE KECklEL COKKI (l LB MET)
400
D • BLEMDED CORfMJ STOCK
.L J L 0 10 ZO 30 40 5C 60 TO ÖO 90 100 120 I40
CESIDUAL MOISTURE (gms)
I GO ISO

-20-
the difference in product geometry, but the smoothness of the curve
suggested that no significant variations in product composition ex-
isted between runs in the set.
D. Other Calibration Curves
In order to evaluate the Boonton analyser over a wider range of
products calibration curves were made for loose frozen cut green
beans, pineapple chunks and chopped onion. All were procured in the
market and none was especially selected. All runs on each product was
made with the same brand of material. The results are presented in
Figures 24,25, and 26. The curves for all thxee products appear to
be smooth and no single point deviates far from the general trend.
The slopes of the three curves are different, as expected. The curve
for the pineapple chunks is the first one to appear concave with
response to mass of water Increasing at the high end. All the pine-
apple runs were made with radiators at 100*F because at higher tem-
peratures there was excessive product shrinkage during drying.
E. Comments
It is apparent from these experiments that it is possible to
follow the progress of freeze dehydration of several foods using the
Boonton moisture analyser and that its sensitivity at low moist ire
contents is sufficiently high to permit its use as an empirical end-
point indicator for the entire load. As was known before, the in-
strument reading is affected by sample geometry and composition so
that in practice it will be necessary to assess the magnitude of these
effects in any yiven application.
One method of applying this procedure to the monitoring of com-
mercial batch drying would be to equip each product level with elec-
trodes, preferably by modifying existing hardware electrically to
serve as the electrodes. This would permit monitoring of every pieC*
of food in the entire chamber, but would read only the total moisture
content of each product level. A refinement of this procedure would
result from seguenting the large electrodes to permit the taking of
readings over smaller areas of food or devising an electrode that
could be moved aL-out to take readings in different places.

eELATIOKJSWIP BETWEEN BOOKJTOM AKJALVSEt^ VALUES AKJD RESIDUAL MOISTURE - CUT 6REEKJ BEAMS ^l LB, WET)
0 CO 40 60 ÖO IOO IZO 140 löO 160 ZOO 220 240 ZfeO 280 30Ö 320 340
RESICXJAL MOlSTUftre. (gms)

FI6U^EZ5 CELATIOMSM-IP BETWEEKJ DOOKTnONJ ANALVSER VALUES AMD eesiDLiAi-MO«srnj«e - PIMBAPPL* CHUKIK» (I LB. WKT)
3000
i 0 2
vQ 2 Q < til
UJ
ZSOO -
2000 -
IBOO -
IOOO -
SOO -
RESIDUAL MOISTUKE ^gm»")

FI6URE Z£> REUATIOKISHIP BETW/EesJ BOOKJTOKJ AKJALVSCR AKJD
(eESIDUAL MOISTURE - DICED ONJIOMS (l LB. NET)
2
2
UJ
< 2 <
ICOO
1400 -
ZOO -
IOOO -
©oo -
©oo -
AOO -
zoo -
300
RESIDUAL. MOiSTUre (dm«)
-21-
Overall Coacluslop»
During the course of this project a number of approaches have
been examined as possible moans of monitoring the course of freeze
dehydration processes. The VPR,, VSC, Farvitron, infra-red radiometer
and RF moisture analyser have been examined in depth and all with the
exception of the radiometer have been applied successfully on a labo-
ratory scale as monitors of the drying process. It is likely that the
radiometer could also have been applied hsJ the necessary equipmont
modifications been made. All of the fiv« most promising techniques
appear applicable on a commercial sea)a and all of them merit further
development effort in tbat direction Throughout this project an
attempt has been made to seek an end-point indicator that would give
a sharp signal of some sort that would indicate the process was at an
end and this signal was to be obtained by some measurement over the
entire chamber load. No such end point sensor has been found; per-
haps because no sharp end point exists. Towards the end of the project
it has become apparent that one way of obtaining more accurate control
of the process is to make multiple measurements over various small
areas of the load. This could be achieved, after the exercise of
considerable mechanical and electrical ingenuity, in present systems;
or, with relative ease, after the exercise of comparable diligence in
the development of a continuous conveyorised system.
For the control of present day units it would seem wise to spend
at least some effort in trying to apply the three integrating systems
of VPR, VSC or Farvitron before fully developing the inl'ra-red radio-
meter or RF moisture analyser methods. Only infra-red radionetry and
RF moisture analysis appear practical for monitoring u conveyorised
continuous system.

Appendix
Suppliers of instrumentation contacted during the course of this project.
Moisture Analysers
Forte Engineering Co., Norwood, Massachusetts Boonton Polytechnic Co.,Rockaway, New Jersey Moisture Register Co., Alhambra, California Consolidated Electrodynamics Corp., Pasadena, California
Radiometer«
Barnes Engineering Co., Stamford, Connecticut Servo Corporation of America, Hlcksville, New York Williamson Development Co., Nest Concord, Massachusetts Block Associates, Inc., Cambridge, Massachusetts Epic Inc., New York, New York
Nuclear Measurements
Nuclear-Chicago, Des Piaines, Illinois Industrial Nucleonics Corp., Columbus, Ohio Nuclear Enterprises Ltd., Edinburgh, Scotland
Miscellaneous
R. I. G. , Schlumberger./Inc, Ridgefield, Connecticut General Mills, Mechanical Division, Framingham, Massachusetts Mlnneapolis-Honneywell Co., Minneapolis, Minnesota Cambridge Systems, Inc., Waltharo, Massachusetts Beckman Instruments, Fullerton, California Foxboro Co., Foxboro, Massachusetts
-22-
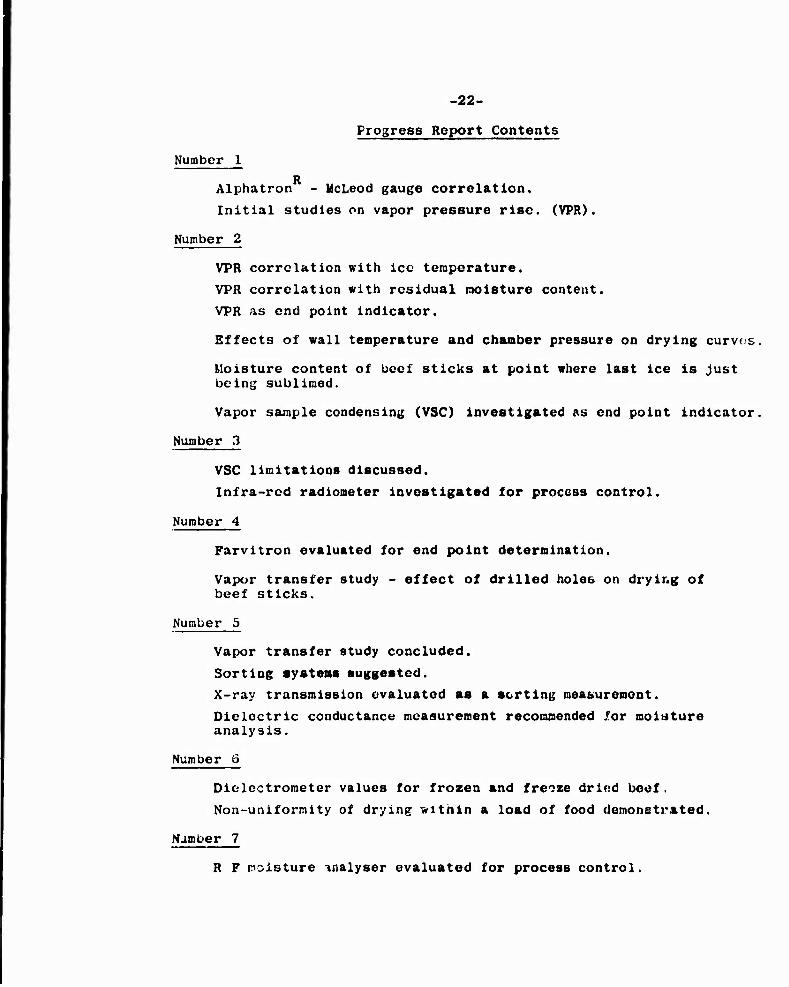
Progress Report Contents
Number 1 n
Alphatron - UcLeod gauge correlation.
Initial studies on vapor pressure rise. (VPR).
Number 2
VPR correlation with ice temperature.
VPR correlation with residual moisture content.
VPR as end point indicator.
Effects of wall temperature and chamber pressure on drying curvos,
Moisture content of beef sticks at point where last ice is Just being sublimed.
Vapor sample condensing (VSC) Investigated as end point indicator.
Number 3
VSC limitations discussed.
Infra-red radiometer investigated for process control.
Number 4
Farvitron evaluated for end point determination.
Vapor transfer study - effect of drilled holes on drying of beef sticks.
Number 5
Vapor transfer study concluded.
Sorting systems suggested. X-ray transmission evaluated as a sorting measurement.
Dielectric conductance measurement recommended for moisture analysis.
Number 6
Diolcctrometer values for frozen and freoze driod beef.
Non-uniformity of drying within a load of food demonstrated.
Number 7
R F moisture analyser evaluated for process control.

UNCLASSIFIED
UNCLASSIFIED